
Submitted:
05 November 2026
Posted:
05 November 2026
You are already at the latest version
Abstract
Becoming a scam victim requires two events: an offender must reach a person, and that person must pay. Using Global Findex 2025 microdata on 61,467 mobile-phone owners in 72 economies, we separate exposure (an unsolicited request for money from a stranger by call or text) from conversion (sending the money). Of these respondents, 21.7% were exposed and 8.4% of those exposed paid. Within economies, internet use, education, workforce participation and account ownership raise exposure, whereas only account ownership raises conversion; formal tests reject equality of the coefficients across stages for internet use, education and income. Across countries, a 0.10-point higher IMF AI Preparedness Index score is associated with conversion odds about half as large (odds ratio 0.53), robust to controls for income, institutions, digital penetration and cybersecurity. The association disappears within world regions (odds ratio 0.83, 95% CI 0.53–1.29), does not replicate with the Oxford Insights Government AI Readiness Index, and extends to a falsification outcome that involves no payment. National AI preparedness shows no robust association with scam outcomes. For fraud-risk management, the results point to network-level controls against contact and account-level safeguards against payment, and caution against reading AI-readiness indices as measures of consumer protection.
Keywords:
financial scams
; fraud risk
; fraud victimization
; routine activity theory
; digital financial inclusion
; artificial intelligence
; AI preparedness
; Global Findex
1. Introduction
Scams that persuade people to transfer money are among the most common crimes adults experience. Population surveys in high-income countries have long found that a substantial share of adults are targeted by fraud each year (Titus et al. 1995; Burnes et al. 2017), and the Global Findex 2025 shows that unsolicited requests for money by phone are widespread across low- and middle-income economies as well (Klapper et al. 2025). Digital payments have raised the stakes. Mobile money and instant transfers have expanded financial access and welfare (Jack and Suri 2014; Suri and Jack 2016), but the same speed makes a fraudulent transfer quick to complete and hard to reverse.
Artificial intelligence enters this problem from two directions. In one view AI is a guardian. Statistical and machine-learning methods have long been used to detect fraudulent transactions (Bolton and Hand 2002; Ngai et al. 2011; West and Bhattacharya 2016), and countries better prepared to adopt AI may be better able to screen scam traffic, monitor payments and regulate digital finance. In the other view AI is an accelerant. The same capabilities lower the cost of personalized deception (Brundage et al. 2018), and experimental evidence shows that large language models can produce convincing phishing messages at a fraction of the cost of manual design (Heiding et al. 2024). If the guardian view holds, people living in economies better prepared for AI should be better protected; if the accelerant view holds, they may be more exposed. National AI readiness indices are now widely used to benchmark countries (Cazzaniga et al. 2024; Oxford Insights 2024), yet neither implication has been tested against comparable individual-level victimization data.
A second gap concerns the outcome itself. Becoming a victim requires two events: an offender must reach a person, and that person must comply. Criminological theory treats these as distinct, since reaching someone depends on routine activities and visibility, while compliance depends on the means and willingness to pay (Cohen and Felson 1979; Holtfreter et al. 2008; Pratt et al. 2010). Most victimization surveys record only one of the two events. Studies that separate them have mostly used single-country samples (Holtfreter et al. 2008; Huang et al. 2026), and the first multi-economy evidence from the Global Findex 2025 has examined whether account ownership operates at both stages (Sarna et al. 2026). Whether the wider set of individual traits acts differently at the two stages has not been tested formally, and whether national conditions such as AI preparedness shape either stage has not been examined.
This paper addresses both gaps with the Global Findex 2025 microdata, which ask nationally representative samples of mobile-phone owners whether, in the past 12 months, a stranger called or texted them asking them to send money and, if so, whether they sent it. We estimate the resulting funnel for 61,467 respondents in 72 economies and link it to the IMF AI Preparedness Index (AIPI; Cazzaniga et al. 2024). Two research questions concern individuals: who is targeted (RQ1), and whether those who pay differ from those who are targeted (RQ2). One hypothesis concerns individuals: that digital financial exposure raises exposure to scam solicitations (H3a). The remaining hypotheses concern national AI preparedness: that it lowers (H1a) or raises (H1b) exposure, that it lowers conversion (H2), and that it conditions the association between digital financial exposure and victimization (H3b).
Three findings emerge. First, the two stages are associated with different individual traits. Within economies, internet use raises the probability of exposure by 6.3 percentage points but leaves conversion unchanged, while account ownership raises both exposure and conversion and a digitally enabled account raises exposure, as H3a predicts; cross-stage tests reject equality of the logit coefficients for internet use, education and income, while the corresponding marginal effects show substantively different stage-specific patterns. Second, across countries, higher AI preparedness is associated with much lower conversion, and the association survives controls for income, institutions, digital penetration and cybersecurity commitment. Third, this association is not robust. It shrinks and loses significance within world regions, does not replicate with the Oxford Insights Government AI Readiness Index, and extends to an outcome that involves no request for money. The pattern appears largely attributable to regional differences, chiefly between Sub-Saharan Africa and other regions, and is more consistent with regional confounding than with an AI-specific protective effect, and none of the hypotheses on national AI preparedness (H1a, H1b, H2, H3b) is supported.
The paper extends emerging cross-national research on the scam funnel in three ways. First, it tests formally, covariate by covariate, whether the determinants of exposure and conversion differ, rather than describing each stage separately. Klapper et al. (2025) report the national rates descriptively, and Sarna et al. (2026) examine account ownership at the two stages in the same survey; we extend the comparison to connectivity, education, income, work and gender. Second, it introduces national AI preparedness as a macro-level factor and tests the guardian and accelerant views against both stages. Third, it subjects the apparent AI association to region fixed effects, a second AI-readiness index and a falsification outcome, and shows that an estimate that looks robust under conventional country controls does not survive them. Because the index correlates strongly with income, this result is also a measurement lesson. It agrees with recent construct-validation evidence that major national AI-readiness indices, including the IMF AIPI and the Oxford Insights index, are strongly income-saturated and show limited discriminant validity from economic development (Ben Brik 2026). Correlations between such indices and social outcomes should therefore not be read as AI effects without within-region comparisons, alternative indices and falsification tests (Moulton 1990; Bryan and Jenkins 2016).
The funnel also offers a risk-management reading of household fraud. The probability that a person loses money equals the probability of being approached multiplied by the probability of paying once approached, and the two components respond to different lines of defence: telecommunication operators and regulators act on contact, whereas payment providers and their supervisors act on payment. Separating the components shows which groups each line of defence must reach, and the national analysis tests whether country-level AI capacity is associated with either component.
2. Literature Review and Hypotheses
2.1. Routine Activities and Being Targeted
Routine activity theory holds that crime occurs when a motivated offender meets a suitable target in the absence of a capable guardian (Cohen and Felson 1979). Lifestyle-exposure theory adds that daily activities determine how often people come into contact with offenders (Hindelang et al. 1978). Whether these theories transfer to crimes without physical contact was initially debated, because offenders and targets need not share time or place (Yar 2005). Subsequent work adapted the framework to online settings: cyber-lifestyle measures predict online harassment (Reyns et al. 2011) and identity theft (Reyns 2013), although the evidence across types of cybercrime is mixed (Leukfeldt and Yar 2016).
For fraud, the relevant contact is a call, message or offer. Pratt et al. (2010) show that routine online activity predicts being targeted for internet fraud, and van Wilsem (2013) finds that online purchasing and other online activities raise the risk of online consumer fraud. Traits that increase visibility and reachability, such as internet use, employment, education or holding an account, should therefore raise exposure. Offenders also select targets they expect to be solvent, which links exposure to markers of economic activity rather than only to connectivity.
2.2. Compliance and Who Pays
Paying once approached is a different event. Scam compliance depends on persuasion techniques that exploit trust, authority, urgency and the promise of gain (Whitty 2013), and interviews with victims show that fraud succeeds by fitting offers to the circumstances and motives of the person approached (Button et al. 2014). Individual explanations emphasize low self-control (Gottfredson and Hirschi 1990; Holtfreter et al. 2008), financial literacy (Lusardi and Mitchell 2014) and particular mindsets and risk-taking behaviours (DeLiema et al. 2020). Reviews conclude, however, that no single victim profile exists. A recent systematic review of adult fraud and scam victims finds that sociodemographic, non-cognitive and cognitive correlates vary with the type of fraud and the age group studied (Dadà et al. 2025; see also Schoepfer and Piquero 2009; Hanoch and Wood 2021), and field evidence shows that scam-identification ability varies across consumers and can be measured and improved (Kubilay et al. 2023).
The means to pay also matters. A request for money can only succeed if the person can transfer funds quickly. Accounts, and mobile-money accounts in particular, make such transfers fast and often irreversible (Jack and Suri 2014). Research on consumer protection in low- and middle-income countries identifies fraud as one of the main risks that accompany digital financial inclusion (Garz et al. 2021). Account ownership could therefore raise conversion by lowering the cost of compliance, or lower it if account holders have more experience with financial fraud. Education and income could lower conversion through financial literacy and the ability to recognize deception, but higher income also raises the stakes offenders can extract.
Several studies distinguish the two stages. Holtfreter et al. (2008) separate being targeted for fraud from being victimized in a sample from one US state, and Huang et al. (2026) show in Chinese data that financially vulnerable people can be targeted less but victimized more. Using the Global Findex 2025, Sarna et al. (2026) find across 75 economies that account holders are targeted more often and, once targeted, pay more often. What remains untested is whether the broader set of individual traits, including connectivity, education and income, acts differently at the two stages. Because theory gives clearer predictions for exposure than for conversion, and for some traits predicts opposite effects at the payment stage, we pose research questions rather than directional hypotheses for the full set of individual characteristics; the one individual-level trait for which routine activity theory gives a specific prediction, digital financial exposure, is stated as hypothesis H3a in Section 2.3:
- RQ1: Which individual characteristics predict exposure to scam solicitations?
- RQ2: Do the characteristics that predict conversion differ from those that predict exposure?
2.3. National AI Preparedness: Guardian or Accelerant?
In the economic approach to crime, offenders respond to expected returns and costs (Becker 1968), and AI can shift both. The guardian channel works through capable guardianship. Economies better prepared for AI may have the digital infrastructure, skills and regulatory capacity to deploy fraud analytics in payment systems, filter scam traffic, enforce faster and warn users (Bolton and Hand 2002; West and Bhattacharya 2016). This channel predicts lower conversion, and lower exposure if scam traffic is blocked before it reaches people.
The accelerant channel works through offenders’ costs. AI lowers the cost of contact and can raise persuasiveness through automated and personalized messages, voice cloning and synthetic identities (Brundage et al. 2018). Heiding et al. (2024) show that language models reduce the cost of producing effective phishing messages, which raises the expected return to mass and targeted campaigns. More connected, AI-ready economies may also offer more reachable targets and attract more capable offenders, raising exposure and possibly conversion. A recent quantitative systematic review of 94 studies documents a fast-growing literature on generative AI and financial crime, with increasing attention to automated schemes that differ from human-led social engineering (Tiwari et al. 2026).
The two channels need not cancel. An AI-ready economy could see more scam contact but less payment, a pattern that only a funnel design can detect. Because the channels predict opposite signs for exposure, we state the exposure hypothesis as two competing alternatives.
We measure preparedness with the IMF AI Preparedness Index, which scores digital infrastructure, human capital and labour-market policies, innovation and economic integration, and regulation and ethics (Cazzaniga et al. 2024). The index measures a country’s capacity to adopt AI, not whether that capacity is deployed against fraud or how capable offenders are. Its producers describe it as an indicative measure that includes perception-based indicators and caution against using it to rank countries (International Monetary Fund 2024). We therefore also use the Oxford Insights Government AI Readiness Index, which places more weight on government capacity. The hypotheses were formulated at the design stage, before estimation, and were not preregistered. Where theory predicts opposing signs, we state them as competing alternatives; this refines their wording without changing the tests reported.
Digital financial exposure links the individual and national levels. Holding a digitally enabled account makes a person reachable through digital channels and signals the ability to transfer money quickly, so routine activity theory predicts higher exposure for account holders (Section 2.1); we state this as H3a and test it within economies. If national AI preparedness strengthens guardianship in digital channels, it should weaken the association between digital financial exposure and victimization; if it mainly lowers offenders’ costs, it could strengthen it. Because the two channels predict opposite moderation, H3b is stated without a sign.
- H1a (guardian): Higher national AI preparedness is associated with lower exposure to scam solicitations.
- H1b (accelerant): Higher national AI preparedness is associated with higher exposure to scam solicitations.
- H2: Among individuals exposed to scam solicitations, higher national AI preparedness is associated with a lower probability of sending money.
- H3a: Digital financial exposure is associated with higher exposure to scam solicitations.
- H3b: The association between digital financial exposure and victimization (conversion and overall victimization) varies with national AI preparedness.
2.4. Comparative Measurement and Inference
Cross-national victimization research faces two problems. The first is measurement. The International Crime Victims Survey showed that consumer fraud can be measured comparably across countries (van Dijk et al. 2007), but willingness to recognize and report fraud differs across people and settings (van de Weijer et al. 2019), and victims often feel shame or blame for having been deceived (Cross 2015). Differences in reporting can therefore masquerade as differences in victimization, especially in comparisons across countries.
The second problem is inference about country-level variables. Regressions of individual outcomes on a country-level variable overstate precision unless errors are clustered by country (Moulton 1990), cluster-robust inference is unreliable with few clusters unless corrected (Cameron et al. 2008; Cameron and Miller 2015), and multilevel models with few countries give unreliable country-level estimates (Bryan and Jenkins 2016). National development indices are also strongly correlated with income, institutions and region, so a cross-national association can reflect any of these. For AI-readiness indices specifically, recent construct-validation evidence shows that the IMF AIPI, the Oxford Insights Government AI Readiness Index and the Tortoise Global AI Index are strongly correlated with economic development and rank countries substantially by development level, with limited discriminant validity from broader national capacity (Ben Brik 2026). A regression of individual outcomes on such an index therefore risks attributing to AI preparedness what belongs to the wider development profile. Section 3 explains how the design addresses both problems.
The Middle East and North Africa illustrates the data constraint. The region combines rapid growth in digital finance with national AI strategies in several states, which makes it a natural setting for the guardian–accelerant question. Yet in Findex 2025 only seven MENA economies fielded the scam module, six of which have an AIPI score, and none is a Gulf state. We therefore study the question globally and report MENA as a descriptive and exploratory subgroup.
3. Data and Methodology
We link individual microdata on 61,467 adults in 72 economies to country-level measures of AI preparedness, income, institutions, digital penetration and cybersecurity commitment. The first part of the analysis answers RQ1 and RQ2 on who is targeted and who pays and tests H3a; the second tests the hypotheses on national AI preparedness (H1a, H1b, H2 and H3b).
3.1. Data
Individual data come from the World Bank Global Findex 2025 microdata, nationally representative surveys of about 1,000 adults per economy fielded in 2024 (144,090 respondents in 140 economies; Klapper et al. 2025; World Bank Development Research Group 2025). A module on digital harms was fielded in 75 economies and was administered to respondents who own a mobile phone; within those economies it was put to 84.1% of respondents. The module therefore covers mobile-phone owners, not all adults.
Country-level data come from five sources:
- AI preparedness: the IMF AI Preparedness Index (AIPI) for 2023, which scores 174 economies from 0 to 1 on digital infrastructure, human capital and labour-market policies, innovation and economic integration, and regulation and ethics (Cazzaniga et al. 2024).
- Alternative AI measure: the Oxford Insights Government AI Readiness Index 2024 (0 to 100; 188 countries), which emphasizes government capacity (Oxford Insights 2024).
- Income and digital penetration: World Development Indicators for 2023: GDP per capita at purchasing power parity in constant 2021 international dollars, internet users as a share of the population, and mobile subscriptions per 100 people (World Bank 2026).
- Institutions: the Worldwide Governance Indicators, 2024 update, for 2023: rule of law and control of corruption (Kaufmann et al. 2011; Kaufmann and Kraay 2024).
- Cybersecurity commitment: the ITU Global Cybersecurity Index 2024, rescaled from 0 to 100 (International Telecommunication Union 2024).
3.2. Sample
The main sample keeps respondents who were asked the module, live in an economy with complete country data and have no missing individual covariates (Table 1).
Complete-case deletion on individual covariates retains 98.0% of eligible respondents. Pakistan has no internet-use figure for 2021–2023 in the World Development Indicators, so its 2024 value is used.
3.3. Variables
The three outcomes follow the funnel and are taken from the questionnaire items as worded:
- Exposure equals 1 if the respondent answered yes to item con21, “In the past 12 months, did you receive a phone call or SMS or text message on your mobile phone from someone you didn’t know asking you to send money?”, and 0 if no.
- Conversion equals 1 if an exposed respondent answered yes to item con22, “Did you send the money to this person?”, and 0 if no. It is defined only for the exposed.
- Overall victimization equals 1 if the respondent was exposed and sent money, and 0 otherwise. It is defined for all respondents and is therefore not conditioned on exposure.
The exposure item asks about a concrete event, an unsolicited request for money from a stranger, rather than asking respondents to classify an approach as a scam. This reduces, although it does not remove, dependence on the respondent’s ability to recognize fraud; Section 5.2 discusses the remaining measurement concerns. Some requests captured by the item may be non-fraudulent, so exposure is best read as solicitation by an unknown requester, which Klapper et al. (2025) treat as a scam attempt.
Two further outcomes serve as checks. Item con23 asks whether, in the past 12 months, the respondent received “unwanted and offensive messages, photos or videos” on their mobile phone. It is a digital harm that involves no request for money and serves as a falsification outcome (Section 3.5). Misuse of a foundational ID for illegal purposes (fin47) is a related fraud outcome.
Individual covariates are gender, age and age squared (centred at 43), education (primary or less, secondary, tertiary), within-economy household income quintile, workforce participation, urban residence, account ownership, a digitally enabled account, and internet use in the past three months. Responses of “don’t know” or “refused” are treated as missing.
AIPI enters per 0.10 points, about 1.1 standard deviations across the analysis economies, centred at their mean of 0.389. The Oxford Insights index enters per standard deviation. GDP per capita enters in logs, internet use and mobile subscriptions per 10 units, and the ITU index per 10 points.
3.4. Estimation
The first part, addressing RQ1, RQ2 and H3a, estimates the individual determinants of each stage with economy fixed effects:
where Y is exposure, conversion or overall victimization for respondent i in economy c, Λ is the logistic function, μ is an economy fixed effect and X holds the individual covariates. The fixed effects absorb all national differences, so γ compares people within the same economy. Economies with no variation in an outcome drop from that model; Honduras, with no respondents who sent money, leaves the conversion and overall victimization models.
To test whether a covariate matters differently at the two stages, we estimate the exposure and conversion equations jointly and test the equality of each coefficient, using a covariance matrix across the two equations clustered by economy, analogous to seemingly unrelated estimation. A formal test is needed because a significant effect at one stage and a non-significant effect at the other does not by itself show that the two effects differ (Gelman and Stern 2006). Logit coefficients from different outcomes also reflect different residual variance (Mood 2010), so we report average marginal effects in percentage points alongside odds ratios. Appendix A sets out the estimator.
The second part, testing H1a, H1b and H2, estimates the association between national AI preparedness and each outcome:
where Z holds country-level controls, added as a ladder fixed before estimation: none (L0); log GDP per capita (L1); log GDP per capita and rule of law (L2, the main specification); L2 plus internet and mobile penetration (L3); L2 plus the ITU Cybersecurity Index (L4); L2 plus World Bank region fixed effects (L5); and L2 with control of corruption in place of rule of law (L2b). Because AIPI is partly built from digital infrastructure and human capital, L3 conditions on components of AIPI itself and is read as a check rather than the main estimate.
H3a is assessed with the digital-account coefficients, and H3b is tested by adding to the main model an interaction between AIPI and digital financial exposure, measured by a digitally enabled account, with internet use as an alternative measure.
3.5. Inference and Robustness
All models use the Findex survey weights. Within each economy these weights sum to the number of respondents, so pooled estimates weight economies by their sample sizes rather than by their populations, and no single large economy dominates the country-level estimates. Standard errors are clustered by economy, and tests use the t distribution with G − 1 degrees of freedom, where G is the number of economies. Clustering matters because AIPI varies only across economies; individual-level standard errors would overstate the information about it (Moulton 1990).
With 72 clusters, we add five checks on the AIPI estimate:
- a wild cluster restricted bootstrap with Webb six-point weights and 9,999 replications, applied to the linear probability version of the main model (Cameron et al. 2008; MacKinnon and Webb 2017; Webb 2023);
- leave-one-country-out re-estimation;
- region fixed effects, and separate estimates within and outside Sub-Saharan Africa;
- the Oxford Insights index in place of AIPI;
- the falsification and secondary outcomes.
The falsification outcome has a specific logic. If AIPI reduces conversion through money-specific guardianship, such as fraud analytics in payment systems or account-level safeguards, it should not reduce exposure to offensive content that involves no payment. If instead AIPI proxies for regional differences in survey response, digital environments or reporting norms, it should move both outcomes, and both associations should vanish within regions. General network filtering could, in principle, reduce both outcomes, so the test cannot by itself rule out a broad digital-guardianship channel; it is interpreted jointly with the within-region and second-index checks.
Random-intercept models are not used as the main estimator because their country-level variance and standard errors are unreliable with few countries (Bryan and Jenkins 2016); clustered fixed-effects and pooled models with the checks above address the same nesting. With seven ladder specifications, six interaction tests and several robustness checks, we interpret isolated results near the 5% threshold cautiously and label tests not specified in advance as exploratory. Estimation was carried out in Python; the replication package listed in the Data Availability Statement reproduces every table and figure.
4. Results
4.1. The Scam Funnel
Across the main sample, 21.7% of respondents were exposed, 8.4% of the exposed sent money, and 1.8% of all respondents sent money (survey-weighted; Figure 1). The overall rate is the product of the two stage rates (0.217 × 0.084 ≈ 0.018), so the funnel decomposes victimization risk into a contact component and a payment component. Exposure ranges from 2.5% in Tajikistan to 70.9% in Tanzania; conversion ranges from zero in Honduras to 36.0% in Comoros. National exposure and conversion rates are only weakly related (r = −0.21), so the two stages are distinct phenomena rather than one measure of scam intensity.

Table 2.
Sample sizes and survey-weighted rates by group.
| Group | Econ. | Resp. | Exposed | Victims | Exposure % | Conversion % | Overall % |
| Main sample | 72 | 61,467 | 13,846 | 1,190 | 21.7 | 8.4 | 1.8 |
| Sub-Saharan Africa | 33 | 26,598 | 7,678 | 845 | 27.3 | 11.2 | 3.1 |
| Outside Sub-Saharan Africa | 39 | 34,869 | 6,168 | 345 | 17.7 | 5.3 | 0.9 |
| MENA (World Bank region) | 6 | 5,521 | 599 | 41 | 10.4 | 6.9 | 0.7 |
Note: Econ. = economies; Resp. = respondents. Exposure is the share of respondents who received a request; conversion is the share of exposed respondents who sent money; overall is the share of all respondents who sent money. MENA covers Egypt, Iraq, Jordan, Lebanon, Morocco and Tunisia. Counts are unweighted.
Sub-Saharan Africa stands out at every stage. Its exposure rate is 1.5 times that of other regions, and its conversion rate is 2.1 times higher. The six MENA economies have one of the lowest exposure rates, at 10.4%; only Europe and Central Asia (9.3%) and South Asia (9.8%) are lower. Their conversion rate, 6.9%, is below the sample average.
4.2. Who Is Targeted and Who Pays (RQ1, RQ2)
Within economies, exposure follows digital and economic visibility, while conversion rises with account ownership and not with digital connectivity. Table 3 reports the fixed-effects estimates: the exposure column answers RQ1 and provides the test of H3a, and the conversion column together with the cross-stage tests answers RQ2.
Internet use is the strongest predictor of exposure. It raises the probability of a request for money by 6.3 percentage points (SE 0.7), against a base rate of 21.7%. Tertiary education adds 4.4 points (SE 1.0), workforce participation 3.5 points (SE 0.5), a digitally enabled account 3.5 points (SE 0.9) and account ownership 3.4 points (SE 0.8). Urban residents face modestly higher odds of exposure (odds ratio 1.08), women are 1.5 points (SE 0.5) less likely to be exposed, and exposure peaks in middle age. In answer to RQ1, exposure is concentrated among people who are digitally connected, educated, working and banked.
Conversion follows a different pattern. Account ownership is the only covariate that significantly raises it, by 3.0 percentage points (SE 1.1) against a base rate of 8.4%. Internet use has no detectable effect on conversion (odds ratio 1.04; 0.3 points, SE 0.9). Education and income point the other way: the odds of conversion are 21% lower for the tertiary-educated and 24% lower for the richest quintile, although neither estimate is individually significant at the 5% level.
The cross-stage tests, which compare logit coefficients and answer RQ2, show that several of these differences are statistically distinguishable. Internet use (p = 0.002), secondary education (p = 0.010), tertiary education (p = 0.012) and the second and richest income quintiles (p = 0.029 and p = 0.040) raise the odds of being targeted significantly more than the odds of paying. The average marginal effects show the same stage-specific pattern in substantive terms: internet use adds 6.3 percentage points to exposure but 0.3 points to conversion, and tertiary education adds 4.4 points to exposure while its conversion odds ratio points below one. Gender, workforce participation and account ownership show no detectable difference across stages. The absence of a cross-stage difference for account ownership agrees with Sarna et al. (2026), who find account premiums at both stages in the same survey.
Combining the stages, overall victimization is higher among account owners (odds ratio 1.68), internet users (1.47) and workforce participants (1.30), and lower among women (0.81). Victimization is therefore more prevalent among people who are both financially active and digitally connected, even though connectivity itself does not make those approached more likely to pay.
4.3. National AI Preparedness (H1a, H1b, H2)
Across countries, AI preparedness is unrelated to exposure but strongly associated with lower conversion, and the association barely moves as country controls are added. Table 4 reports the model ladder.
In the main specification, a 0.10-point higher AIPI is associated with conversion odds about half as large (odds ratio 0.53, 95% CI 0.39–0.73). On the probability scale, this is 4.8 percentage points lower conversion (95% CI −7.3 to −2.3) against a base rate of 8.4%. Overall victimization is 0.9 points lower (95% CI −1.5 to −0.3) against a base of 1.8%. Exposure shows no association (odds ratio 1.12; 1.8 points, 95% CI −3.9 to 7.4).
The conversion estimate stays between 0.52 and 0.62 when log GDP, rule of law, control of corruption, internet and mobile penetration, or the ITU index enter the model. In the main conversion model, neither log GDP (odds ratio 1.12, p = 0.32) nor rule of law (1.42, p = 0.19) is significant. AIPI is correlated with these measures (r = 0.74 with log GDP, 0.68 with rule of law, 0.69 with internet use), but its variance inflation factor of 3.4 leaves it estimable.
Adding region fixed effects changes the picture. The conversion odds ratio moves to 0.83 (95% CI 0.53–1.29) and the overall victimization odds ratio to 1.09, while the exposure odds ratio rises to 1.50 (95% CI 1.10–2.05). Within regions, then, more AI-prepared economies show no detectably lower conversion and somewhat higher exposure. The within-region conversion interval excludes associations as strong as the pooled estimate but cannot exclude moderate protective associations (for example, odds ratios of 0.6 to 0.8). The next subsection examines whether the cross-country gradient should be read as an AI effect.
4.4. Robustness of the AI Association
The conversion gradient is statistically robust in the pooled model, but three checks indicate that it is unlikely to reflect an AI-specific effect: it is a contrast between regions, it does not replicate with a second AI index, and it extends to the falsification outcome.
Statistical robustness. In the linear probability version of the main model, a 0.10-point higher AIPI is associated with 4.6 percentage points lower conversion (clustered SE 1.4), with a wild cluster bootstrap p-value of 0.004. The bootstrap p-value is 0.070 for overall victimization and 0.54 for exposure. Dropping one economy at a time keeps the conversion odds ratio between 0.51 and 0.61, and the largest p-value is 0.002 (when Eswatini is dropped).
Table 5.
Robustness of the AI association.
| Check | Exposure | Conversion | Overall victimization |
| Main model (L2) | 1.12 (0.79–1.58) | 0.53 (0.39–0.73)*** | 0.60 (0.43–0.85)** |
| Main model + region fixed effects | 1.50 (1.10–2.05)* | 0.83 (0.53–1.29) | 1.09 (0.78–1.53) |
| Sub-Saharan Africa only (33 economies) | 1.33 (0.73–2.43) | 0.70 (0.41–1.21) | 0.91 (0.62–1.33) |
| Outside Sub-Saharan Africa (39 economies) | 1.23 (0.81–1.87) | 0.96 (0.54–1.72) | 1.16 (0.71–1.89) |
| AIPI, per standard deviation | 1.10 (0.81–1.49) | 0.57 (0.43–0.76)*** | 0.64 (0.47–0.86)** |
| Oxford Insights index, per standard deviation | 0.96 (0.73–1.26) | 0.87 (0.65–1.15) | 0.85 (0.65–1.12) |
Note: Odds ratios with 95% confidence intervals; main-model controls throughout. Rows 1–4 are per 0.10 AIPI; rows 5–6 compare the two AI indices per standard deviation across the analysis economies. * p < 0.05, ** p < 0.01, *** p < 0.001.
Regional contrast. Region fixed effects remove the conversion association (wild cluster bootstrap p = 0.42). Within Sub-Saharan Africa the odds ratio is 0.70 (95% CI 0.41–1.21), and outside it 0.96 (95% CI 0.54–1.72). The pooled gradient appears to arise because Sub-Saharan Africa combines the lowest average AIPI of any region (0.33, against 0.44 elsewhere) with the highest conversion rate (11.2%, against 5.3%). The Sub-Saharan point estimate is protective but imprecise, so a modest association within that region cannot be excluded.
Alternative AI index. The Oxford Insights index correlates at 0.83 with AIPI across the analysis economies. Yet its association with conversion is small and not significant (odds ratio 0.87 per standard deviation, 95% CI 0.65–1.15), compared with 0.57 for AIPI on the same scale. A genuine effect of AI capacity would be expected to appear under both closely correlated measures.
Falsification and secondary outcomes. Higher AIPI is also associated with fewer reports of unwanted and offensive messages, a harm that involves no request for money (Table 6). With region fixed effects, both this association and the ID-misuse association disappear, mirroring the conversion result. This is the pattern expected if AIPI proxies for regional differences that affect several self-reported digital harms, rather than for a money-specific protective mechanism. As noted in Section 3.5, broad network filtering could also reduce both outcomes; the falsification result is therefore supporting rather than decisive evidence, and the main weight rests on the within-region and second-index checks.
Within-region exposure. With region fixed effects, a 0.10-point higher AIPI is associated with 6.4 percentage points more exposure in the linear probability model (SE 2.4; wild cluster bootstrap p = 0.016). This test was not specified in advance and is reported as exploratory.
4.5. Digital Financial Exposure, Moderation and MENA (H3a, H3b)
H3a is supported and H3b is not: national AI preparedness does not change how digital financial exposure relates to conversion or overall victimization, and MENA shows no distinct pattern under the World Bank definition. Table 7 reports the interaction terms, each added to the main model.
H3a holds: digital financial exposure is associated with higher scam exposure (a digitally enabled account has an odds ratio of 1.27 within economies, Table 3, and 2.03 in the main pooled model, not tabulated). H3b does not. The AIPI interaction with a digital account is null for conversion (p = 0.51) and overall victimization (p = 0.68), and the internet-use interactions are null at every stage (all p ≥ 0.45). The exposure interaction with a digital account is borderline (odds ratio 0.85, p = 0.048); as one of six interaction tests, it is not interpreted.
The MENA results depend on how the region is defined. With the six World Bank MENA economies, the interaction is close to 1 at every stage. Defining MENA as the eight Arab League members in the sample adds Comoros and Mauritania, two economies with very low AIPI and high conversion, and the conversion interaction becomes significant (odds ratio 0.59, p = 0.028). Because this result rests on two added economies and 104 victims, it is reported as exploratory.
4.6. Summary of Research Questions and Hypotheses
Table 8.
Summary of research questions and hypothesis tests.
| Statement | Evidence | Verdict | |
| RQ1 | Which characteristics predict exposure? | Internet use, education, workforce participation, account ownership and urban residence raise exposure; women are less exposed (Table 3) | Answered |
| RQ2 | Do the predictors of conversion differ from those of exposure? | Account ownership raises conversion, internet use does not; tests reject equality of the logit coefficients for internet use, education and income; marginal effects show distinct stage-specific patterns (Table 3) | Yes |
| H1a / H1b | AIPI is associated with lower (H1a) or higher (H1b) exposure | No association without region fixed effects (odds ratio 1.12, p = 0.53); positive within regions (1.50), not specified in advance (Table 4 and Table 5) | Neither supported; exploratory within-region pattern in the direction of H1b |
| H2 | AIPI reduces conversion among the exposed | Odds ratio 0.53 across countries, but 0.83 (p = 0.40) within regions, null with the Oxford index, and the falsification outcome moves too (Table 4, Table 5 and Table 6) | Not supported as an AI effect |
| H3a | Digital financial exposure is associated with higher exposure | Digitally enabled account: odds ratio 1.27 within economies (Table 3) | Supported |
| H3b | The association between digital financial exposure and victimization varies with AIPI | Interactions null for conversion and overall victimization (Table 7) | Not supported |
5. Discussion
Being targeted and paying are associated with different traits, and national AI preparedness, once regional context is held fixed, has no robust association with either. This section interprets both findings, considers alternative explanations, and sets out limitations and implications.
5.1. Interpreting the Funnel
The answers to RQ1 and RQ2 are that exposure is associated with visibility and conversion with the means to pay. Internet users, the tertiary-educated, workforce participants and account holders are all more likely to receive a request for money from a stranger. This fits routine activity and lifestyle-exposure theories, in which offenders reach the people whose daily activities make them contactable and plausibly solvent (Cohen and Felson 1979; Hindelang et al. 1978), and it extends to a global sample the finding that routine online activity predicts fraud targeting (Pratt et al. 2010; van Wilsem 2013).
Conversion follows the means to pay rather than connectivity. Account ownership is the one trait that raises the chance of sending money once asked, consistent with the role of accounts in making fast transfers possible (Jack and Suri 2014). Education and income point toward lower conversion, in line with work linking financial literacy and resources to lower fraud susceptibility (Lusardi and Mitchell 2014), and the cross-stage tests show that their coefficients differ significantly between the two stages.
Internet use gives the clearest contrast. It is the strongest predictor of exposure yet unrelated to conversion, so digital inclusion widens contact with scammers without making the people contacted more willing to pay. Victimization is most prevalent where financial access and connectivity meet: account owners and internet users have the highest rates of sending money.
5.2. Alternative Explanations for the Individual Results
Three alternative explanations deserve attention. The first is measurement. Although the exposure item asks about a concrete event rather than a self-classified scam, recall and willingness to report a request for money may differ across groups. If educated or connected respondents recall such requests more readily, part of their higher exposure would reflect reporting rather than targeting, and the same tendency could lower their reported conversion. This mechanism cannot be excluded with the available items. It is, however, harder to reconcile with the pattern for account ownership, which raises both exposure and conversion, and with the absence of any conversion effect of internet use despite its large exposure effect.
The second is selection. Conversion is observed only among the exposed. If offenders select targets on traits we do not observe, conversion estimates describe the targeted population rather than general susceptibility (Heckman 1979). The data offer no credible exclusion restriction, so we do not estimate a selection model. Two features limit the concern. The overall victimization model is defined for all respondents and is not conditioned on exposure, and its results agree with the funnel reading: account ownership and internet use raise unconditional victimization. In addition, the cross-stage tests compare coefficients estimated on samples that differ by design, which is the comparison of substantive interest.
The third is a mechanical link between accounts and payment. If sending money to a stranger requires an account, the account-ownership effect on conversion would be partly definitional. Requests can also be met through cash agents, airtime transfers or third parties, so account ownership is not a precondition, but it lowers the cost of compliance. We therefore interpret the estimate as reflecting ease of transfer, which is itself the policy-relevant channel, rather than as evidence that account holders are more credulous.
5.3. What National AI Preparedness Explains
Measured against the hypotheses, the AI results are negative. Neither H1a nor H1b is supported in the main model, H2 holds only in comparisons across regions, and H3b is not supported. Taken at face value, the pooled estimates suggest a strong guardian effect, with conversion odds roughly halving per 0.10 AIPI. Three diagnostics argue against that reading: the association does not survive within regions, does not replicate with the Oxford Insights index, and extends to unwanted offensive messages, where a money-specific protective mechanism should not operate.
The more plausible interpretation is regional confounding. Sub-Saharan Africa combines the lowest AIPI with the highest conversion, and many features differ between it and other regions, including the structure of mobile-money markets, the speed and reversibility of transfers, local scam typologies and reporting norms. AIPI ranks economies along a broad development profile, so a pooled regression may attribute to it what belongs to that profile. We do not test which regional features are responsible; doing so requires country-level measures of payment-system design and consumer-protection rules that are not yet available for this sample.
This interpretation is consistent with how the index is built. AIPI averages digital infrastructure, human capital, innovation and regulation, partly through perception-based indicators, and its producers present it as indicative rather than as a ranking device (International Monetary Fund 2024). Construct-validation work finds that the AIPI and the Oxford Insights index are strongly income-saturated and have limited discriminant validity from economic development (Ben Brik 2026). In our sample the AIPI correlates at 0.74 with log GDP per capita and at 0.83 with the Oxford Insights index, yet the two indices give different answers for conversion. An index that largely orders countries by development absorbs whatever else varies along that gradient. The finding is therefore also a measurement result: an AI-readiness index can appear strongly protective under conventional country controls and lose that interpretation once regional structure, an alternative index and a falsification outcome are considered.
The negative result should not be overstated. The within-region interval excludes associations as strong as the pooled estimate but is compatible with moderate protective associations, and with 72 economies the power to detect such effects is limited. The appropriate conclusion is that the data provide no robust evidence that national AI preparedness protects consumers, not that it has no effect (Lakens 2017).
Within regions, more AI-prepared economies show somewhat higher exposure and no lower conversion. This exploratory result is consistent with the accelerant view that capability and connectivity draw more scam contact (Brundage et al. 2018; Heiding et al. 2024), but our data cannot show whether offenders use AI. It is a hypothesis for future work, not a finding.
The broader methodological point applies to any study that relates a national index to individual crime outcomes. Such indices correlate strongly with development (here 0.74 with log GDP per capita), the number of countries is small, and country-level effects are easily overstated (Moulton 1990; Bryan and Jenkins 2016). Within-region comparisons, a second index and a falsification outcome are inexpensive checks that, in this case, change the conclusion.
5.4. The MENA Position
The six World Bank MENA economies in the data have one of the lowest exposure rates in the sample (10.4%) and a conversion rate below the sample average (6.9%), and they show no AI-related pattern. A significant conversion interaction appears only when Comoros and Mauritania are added under an Arab League definition, which makes it fragile. Because the evidence rests on six economies and 41 victims, and because no Gulf state fielded the module, these results describe the participating economies and do not support conclusions for the region as a whole.
5.5. Limitations
The analysis is cross-sectional, so all estimates are associations. Victimization is self-reported, and willingness to report requests for money and losses may differ across people and countries (van de Weijer et al. 2019); the falsification result suggests that such differences matter for cross-national comparisons. The module reached only mobile-phone owners in 75 economies and excludes most high-income economies and the Gulf states, so the findings do not generalize to them or to people without phones.
The survey does not record scam type, channel beyond calls and text messages, amount lost or whether AI was used, so AI-enabled scams cannot be identified directly, and sending money is recorded as a yes or no response, so the analysis speaks to the prevalence of victimization, not to the size of losses. AIPI is a single 2023 measure of readiness to adopt AI, not of offenders’ AI capability or of anti-fraud deployment, and with 72 economies the power to detect modest national effects is limited.
5.6. Implications
For policy, the stage-specific associations suggest two different levers. At the exposure stage, network-level measures such as call authentication, filtering of scam messages and enforcement of SIM registration are natural intervention points for the digitally active groups who are approached most often. At the conversion stage, account-level safeguards are the natural intervention points: confirmation of payee, holding periods for first-time or unusual transfers, in-app warnings, and simple reversal procedures in mobile money. Because the estimates are observational, these are candidates for evaluation rather than demonstrated remedies.
For financial institutions and supervisors, the decomposition also suggests how household fraud risk can be monitored. Exposure rates measure the pressure of contact attempts on a customer base, and conversion rates measure how well payment-stage controls work once contact has occurred. Tracking the two separately, rather than a single victimization rate, would show which line of defence is failing and for which customers, which is the information needed to price, prioritize and evaluate fraud controls.
The AI results caution against treating national AI readiness as a proxy for consumer protection. Readiness indices measure capacity to adopt AI, not whether that capacity is deployed against fraud, and here they show no robust association with scam outcomes once regional context is held fixed. More generally, correlations between AI-readiness indices and social outcomes should be checked within regions, against alternative indices and with falsification outcomes before they are interpreted as AI effects.
For research, the priority is better data. A repeated Findex scam module would allow panel designs; items on scam type, channel and loss would allow AI-enabled scams to be studied directly; country-level measures of payment-system safeguards would allow the regional differences documented here to be explained; and fielding the module in the Gulf states would make a full MENA analysis possible.
6. Conclusions
Scam victimization is two problems, not one. Who gets targeted and who pays are associated with different traits, and national AI preparedness shows no robust association with either once regional context is held fixed. Across 61,467 mobile-phone owners in 72 economies, 21.7% received a request for money from a stranger, 8.4% of them sent money, and 1.8% of all respondents sent money.
Exposure follows visibility. Internet use raises the probability of being approached by 6.3 percentage points, and education, work and account ownership raise it further. Conversion follows the means to pay: account ownership raises it by 3.0 points, internet use leaves it unchanged, and point estimates suggest that the better educated and better off are less likely to pay. Formal tests reject equality of the logit coefficients across stages for internet use, education and income, and the marginal effects show substantively different stage-specific patterns.
Across countries, a 0.10-point higher AI Preparedness Index score goes with conversion odds about half as large, and the estimate survives controls for income, institutions, digital penetration and cybersecurity commitment. It is not robust to comparisons within regions, does not replicate with a second AI index and extends to a falsification outcome, so it is more consistent with regional confounding than with an AI-specific protective effect; none of the AI hypotheses is supported, although moderate effects cannot be ruled out. Within regions, more AI-prepared economies show somewhat higher exposure, a pattern that deserves direct testing.
Three implications follow. The stage-specific associations point to protection at both stages, with network-level filtering against exposure and account-level safeguards against conversion as natural intervention points. National AI readiness should not be read as a proxy for consumer protection, correlations between AI-readiness indices and social outcomes should not be read as AI effects without further checks, and studies relating national indices to individual crime outcomes should routinely compare countries within regions, test a second index and include a falsification outcome. Finally, a repeated scam module with detail on scam type and losses, fielded in more economies including the Gulf states, would allow AI-enabled fraud to be studied directly.
Author Contributions
The author confirms sole responsibility for the conceptualization, methodology, analysis, writing, review, and editing of the manuscript.
Funding
This research received no external funding.
Institutional Review Board Statement
Not Applicable.
Informed Consent Statement
Not Applicable.
Data Availability Statement
The Global Findex 2025 microdata (World Bank Development Research Group, 2025; WLD_2024_FINDEX_v02_M) are publicly available through the World Bank Microdata Library at https://doi.org/10.48529/bk9n-8r43. The Findex license does not permit redistribution of the microdata. Country-level data used in this study are publicly available from their respective providers: the IMF AI Preparedness Index (International Monetary Fund, 2024; https://www.imf.org/external/datamapper/datasets/AIPI); the Oxford Insights Government AI Readiness Index 2024 (Oxford Insights, 2024; https://oxfordinsights.com/ai-readiness/; CC BY-SA 4.0); the World Development Indicators (World Bank, 2026; https://databank.worldbank.org/source/world-development-indicators); the Worldwide Governance Indicators, 2024 update (Kaufmann and Kraay, 2024; https://www.worldbank.org/en/publication/worldwide-governance-indicators); and the ITU Global Cybersecurity Index 2024 (International Telecommunication Union, 2024; https://www.itu.int/epublications/publication/global-cybersecurity-index-2024).
Conflicts of Interest
The author declare no conflicts of interest.
Abbreviations
The following abbreviations are used in this manuscript:
| AIPI | IMF AI Preparedness Index |
| AME | average marginal effect |
| CI | confidence interval |
| ITU | International Telecommunication Union |
| MENA | Middle East and North Africa |
| SE | standard error |
| WDI | World Development Indicators |
| WGI | Worldwide Governance Indicators |
Appendix A. Cross-Stage Equality Tests
Let θE and θC denote the coefficient vectors of the exposure and conversion logits in Equation (1), each including economy fixed effects. The exposure model is estimated on all respondents in the main sample and the conversion model on exposed respondents with a valid conversion answer, a subset of the same respondents. Each estimator solves a weighted score equation, Σi wi sE,i(θE) = 0 and Σi wi Di sC,i(θC) = 0, where wi is the survey weight, s is the logit score and Di equals 1 for respondents in the conversion sample and 0 otherwise.
Stacking the two equations gives θ = (θE′, θC′)′ with sandwich covariance V = A⁻¹BA⁻¹. A is block diagonal and contains the two weighted Hessians. B = Σc ucuc′, where uc = Σi∈c wi(sE,i′, DisC,i′)′ is the sum of the stacked scores within economy c. The off-diagonal blocks of B capture dependence between the two equations that arises because the same respondents and the same economies contribute to both. This is the estimator implemented by Stata’s suest command and is equivalent to estimating the two equations as a stacked system of estimating equations with economy-clustered variance.
For covariate k, the test statistic is t = (γE,k − γC,k) / √(VEE,kk + VCC,kk − 2VEC,kk), evaluated against the t distribution with G − 1 degrees of freedom. Economy fixed effects are specific to each equation and are not compared. Honduras, which has no respondents who sent money, contributes to the exposure equation only. The test compares coefficients on the logit scale; because residual variance can differ across the two outcomes (Mood 2010), Table 3 is read together with the average marginal effects reported in Section 4.2.
References
- Ai, C., and E. C. Norton. 2003. Interaction terms in logit and probit models. Economics Letters 80: 123–29. [CrossRef]
- Becker, G. S. 1968. Crime and punishment: An economic approach. Journal of Political Economy 76: 169–217. [CrossRef]
- Ben Brik, A. 2026. Measuring governance or wealth? Construct validation of AI readiness indices. Policy & Internet 18: e70050. [CrossRef]
- Bolton, R. J., and D. J. Hand. 2002. Statistical fraud detection: A review. Statistical Science 17: 235–55. [CrossRef]
- Brundage, M., S. Avin, J. Clark, H. Toner, P. Eckersley, B. Garfinkel, A. Dafoe, et al. 2018. The malicious use of artificial intelligence: Forecasting, prevention, and mitigation. arXiv:1802.07228. [CrossRef]
- Bryan, M. L., and S. P. Jenkins. 2016. Multilevel modelling of country effects: A cautionary tale. European Sociological Review 32: 3–22. [CrossRef]
- Burnes, D., C. R. Henderson, C. Sheppard, R. Zhao, K. Pillemer, and M. S. Lachs. 2017. Prevalence of financial fraud and scams among older adults in the United States: A systematic review and meta-analysis. American Journal of Public Health 107: e13–e21. [CrossRef]
- Button, M., C. McNaughton Nicholls, J. Kerr, and R. Owen. 2014. Online frauds: Learning from victims why they fall for these scams. Australian & New Zealand Journal of Criminology 47: 391–408. [CrossRef]
- Cameron, A. C., J. B. Gelbach, and D. L. Miller. 2008. Bootstrap-based improvements for inference with clustered errors. Review of Economics and Statistics 90: 414–27. [CrossRef]
- Cameron, A. C., and D. L. Miller. 2015. A practitioner’s guide to cluster-robust inference. Journal of Human Resources 50: 317–72. [CrossRef]
- Cazzaniga, M., F. Jaumotte, L. Li, G. Melina, A. J. Panton, C. Pizzinelli, E. J. Rockall, and M. M. Tavares. 2024. Gen-AI: Artificial Intelligence and the Future of Work. IMF Staff Discussion Note SDN/2024/001. Washington, DC: International Monetary Fund.
- Cohen, L. E., and M. Felson. 1979. Social change and crime rate trends: A routine activity approach. American Sociological Review 44: 588–608. [CrossRef]
- Cross, C. 2015. No laughing matter: Blaming the victim of online fraud. International Review of Victimology 21: 187–204.
- Dadà, C. B., L. Colautti, A. Rosi, E. Cavallini, A. Antonietti, and P. Iannello. 2025. Uncovering vulnerability to fraud and scams among adult victims in online and offline contexts: A systematic review. Computers in Human Behavior 172: 108734. [CrossRef]
- DeLiema, M., D. Shadel, and K. Pak. 2020. Profiling victims of investment fraud: Mindsets and risky behaviors. Journal of Consumer Research 46: 904–14. [CrossRef]
- Garz, S., X. Giné, D. Karlan, R. Mazer, C. Sanford, and J. Zinman. 2021. Consumer protection for financial inclusion in low- and middle-income countries: Bridging regulator and academic perspectives. Annual Review of Financial Economics 13: 219–46. [CrossRef]
- Gelman, A., and H. Stern. 2006. The difference between “significant” and “not significant” is not itself statistically significant. The American Statistician 60: 328–31. [CrossRef]
- Gottfredson, M. R., and T. Hirschi. 1990. A General Theory of Crime. Stanford: Stanford University Press.
- Hanoch, Y., and S. Wood. 2021. The scams among us: Who falls prey and why. Current Directions in Psychological Science 30: 260–66. [CrossRef]
- Heckman, J. J. 1979. Sample selection bias as a specification error. Econometrica 47: 153–61. [CrossRef]
- Heiding, F., B. Schneier, A. Vishwanath, J. Bernstein, and P. S. Park. 2024. Devising and detecting phishing emails using large language models. IEEE Access 12: 42131–46. [CrossRef]
- Hindelang, M. J., M. R. Gottfredson, and J. Garofalo. 1978. Victims of Personal Crime: An Empirical Foundation for a Theory of Personal Victimization. Cambridge, MA: Ballinger.
- Holtfreter, K., M. D. Reisig, and T. C. Pratt. 2008. Low self-control, routine activities, and fraud victimization. Criminology 46: 189–220. [CrossRef]
- Huang, W., B. A. M. Hafizuddin-Syah, M. H. Yaacob, and C. Yao. 2026. The offender’s selection paradox: Why the financially vulnerable are targeted less but victimized more in China’s telecom fraud. Crime, Law and Social Change 84: 8. [CrossRef]
- International Monetary Fund. 2024. AI Preparedness Index (AIPI). IMF DataMapper. Available online: https://www.imf.org/external/datamapper/datasets/AIPI (accessed on [day month year]).
- International Telecommunication Union. 2024. Global Cybersecurity Index 2024, 5th ed. Geneva: International Telecommunication Union. Available online: https://www.itu.int/epublications/publication/global-cybersecurity-index-2024 (accessed on [day month year]).
- Jack, W., and T. Suri. 2014. Risk sharing and transactions costs: Evidence from Kenya’s mobile money revolution. American Economic Review 104: 183–223. [CrossRef]
- Kaufmann, D., and A. Kraay. 2024. Worldwide Governance Indicators, 2024 Update. Washington, DC: World Bank. Available online: https://www.worldbank.org/en/publication/worldwide-governance-indicators (accessed on [day month year]).
- Kaufmann, D., A. Kraay, and M. Mastruzzi. 2011. The Worldwide Governance Indicators: Methodology and analytical issues. Hague Journal on the Rule of Law 3: 220–46. [CrossRef]
- Klapper, L., D. Singer, L. Starita, and A. Norris. 2025. The Global Findex Database 2025: Connectivity and Financial Inclusion in the Digital Economy. Washington, DC: World Bank. [CrossRef]
- Kubilay, E., E. Raiber, L. Spantig, J. Cahlíková, and L. Kaaria. 2023. Can you spot a scam? Measuring and improving scam identification ability. Journal of Development Economics 165: 103147. [CrossRef]
- Lakens, D. 2017. Equivalence tests: A practical primer for t tests, correlations, and meta-analyses. Social Psychological and Personality Science 8: 355–62.
- Leukfeldt, E. R., and M. Yar. 2016. Applying routine activity theory to cybercrime: A theoretical and empirical analysis. Deviant Behavior 37: 263–80. [CrossRef]
- Lusardi, A., and O. S. Mitchell. 2014. The economic importance of financial literacy: Theory and evidence. Journal of Economic Literature 52: 5–44. [CrossRef]
- MacKinnon, J. G., and M. D. Webb. 2017. Wild bootstrap inference for wildly different cluster sizes. Journal of Applied Econometrics 32: 233–54. [CrossRef]
- Mood, C. 2010. Logistic regression: Why we cannot do what we think we can do, and what we can do about it. European Sociological Review 26: 67–82. [CrossRef]
- Moulton, B. R. 1990. An illustration of a pitfall in estimating the effects of aggregate variables on micro units. Review of Economics and Statistics 72: 334–38. [CrossRef]
- Ngai, E. W. T., Y. Hu, Y. H. Wong, Y. Chen, and X. Sun. 2011. The application of data mining techniques in financial fraud detection: A classification framework and an academic review of literature. Decision Support Systems 50: 559–69. [CrossRef]
- Oxford Insights. 2024. Government AI Readiness Index 2024. Oxford Insights. Available online: https://oxfordinsights.com/ai-readiness/ (accessed on [day month year]).
- Pratt, T. C., K. Holtfreter, and M. D. Reisig. 2010. Routine online activity and internet fraud targeting: Extending the generality of routine activity theory. Journal of Research in Crime and Delinquency 47: 267–96. [CrossRef]
- Reyns, B. W. 2013. Online routines and identity theft victimization: Further expanding routine activity theory beyond direct-contact offenses. Journal of Research in Crime and Delinquency 50: 216–38.
- Reyns, B. W., B. Henson, and B. S. Fisher. 2011. Being pursued online: Applying cyberlifestyle–routine activities theory to cyberstalking victimization. Criminal Justice and Behavior 38: 1149–69.
- Sarna, F. Z., N. H. I. Chowdhury, and A. A. Himel. 2026. Digitally enabled accounts and unsolicited requests for money: Exposure and payment response among phone owners in 75 economies. Research Square, preprint. [CrossRef]
- Schoepfer, A., and N. L. Piquero. 2009. Studying the correlates of fraud victimization and reporting. Journal of Criminal Justice 37: 209–15. [CrossRef]
- Suri, T., and W. Jack. 2016. The long-run poverty and gender impacts of mobile money. Science 354: 1288–92. [CrossRef]
- Tiwari, M., Y. Zhou, J. R. Lee, K. N. Naraspuram, M. Bewong, and V. Rathore. 2026. Generative AI and financial crimes: A quantitative systematic literature review. Crime Science 15: 5. [CrossRef]
- Titus, R. M., F. Heinzelmann, and J. M. Boyle. 1995. Victimization of persons by fraud. Crime & Delinquency 41: 54–72. [CrossRef]
- van de Weijer, S. G. A., R. Leukfeldt, and W. Bernasco. 2019. Determinants of reporting cybercrime: A comparison between identity theft, consumer fraud, and hacking. European Journal of Criminology 16: 486–508. [CrossRef]
- van Dijk, J., J. van Kesteren, and P. Smit. 2007. Criminal Victimisation in International Perspective: Key Findings from the 2004–2005 ICVS and EU ICS. The Hague: Boom Juridische uitgevers.
- van Wilsem, J. 2013. ‘Bought it, but never got it’: Assessing risk factors for online consumer fraud victimization. European Sociological Review 29: 168–78. [CrossRef]
- Webb, M. D. 2023. Reworking wild bootstrap-based inference for clustered errors. Canadian Journal of Economics 56: 839–58. [CrossRef]
- West, J., and M. Bhattacharya. 2016. Intelligent financial fraud detection: A comprehensive review. Computers & Security 57: 47–66. [CrossRef]
- Whitty, M. T. 2013. The scammers persuasive techniques model: Development of a stage model to explain the online dating romance scam. British Journal of Criminology 53: 665–84. [CrossRef]
- World Bank. 2026. World Development Indicators. Washington, DC: World Bank. Available online: https://databank.worldbank.org/source/world-development-indicators (accessed on [day] October 2026).
- World Bank Development Research Group. 2025. Global Findex Database 2025 (WLD_2024_FINDEX_v02_M). World Bank Microdata Library. [CrossRef]
- Yar, M. 2005. The novelty of ‘cybercrime’: An assessment in light of routine activity theory. European Journal of Criminology 2: 407–27.
Figure 1.
The scam funnel. Of every 100 mobile-phone owners, about 22 received a request for money from a stranger and fewer than 2 sent money. Global Findex 2025 microdata, main sample of 72 economies; shares survey-weighted, counts unweighted.
Figure 1.
The scam funnel. Of every 100 mobile-phone owners, about 22 received a request for money from a stranger and fewer than 2 sent money. Global Findex 2025 microdata, main sample of 72 economies; shares survey-weighted, counts unweighted.
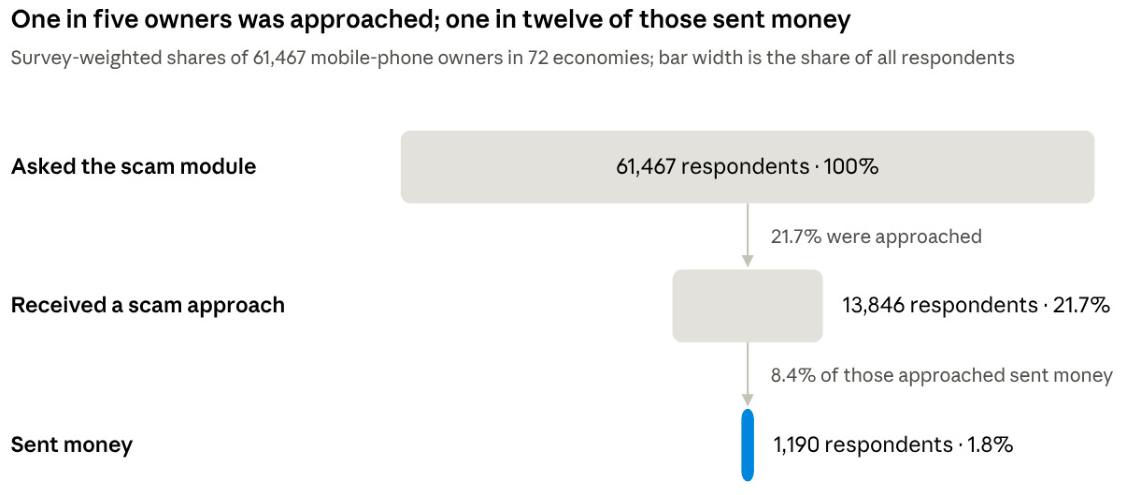
Table 1.
Sample construction.
| Step | Respondents | Economies |
| Global Findex 2025 | 144,090 | 140 |
| Economies that fielded the scam module | 76,898 | 75 |
| Asked the scam module (mobile-phone owners) | 64,663 | 75 |
| Valid yes/no answer on exposure | 64,509 | 75 |
| Economy has an AIPI score (drops West Bank and Gaza) | 63,553 | 74 |
| Complete individual covariates (drops Lesotho: no income data) | 62,254 | 73 |
| Economy has PPP GDP data (drops Venezuela): main sample | 61,467 | 72 |
| Exposed respondents with a valid answer on conversion | 13,835 | 72 |
Note: Of the 13,846 exposed respondents in the main sample, 11 gave no valid answer on conversion.
Table 3.
Economy fixed-effects logits: individual determinants of each stage.
| Covariate | Exposure | Conversion | Overall victimization | Exposure vs conversion, p |
| Female | 0.90 (0.84–0.97)** | 0.89 (0.74–1.07) | 0.81 (0.68–0.96)* | 0.898 |
| Age (per 10 years) | 1.01 (0.98–1.04) | 0.97 (0.91–1.03) | 0.98 (0.92–1.04) | 0.205 |
| Age squared | 0.97 (0.96–0.98)*** | 0.99 (0.96–1.02) | 0.98 (0.95–1.01) | 0.261 |
| Secondary education | 1.11 (1.01–1.22)* | 0.85 (0.71–1.02) | 0.87 (0.71–1.07) | 0.010 |
| Tertiary education | 1.33 (1.18–1.50)*** | 0.79 (0.55–1.15) | 0.94 (0.66–1.36) | 0.012 |
| Income quintile 2 | 1.07 (0.98–1.18) | 0.77 (0.56–1.06) | 0.81 (0.57–1.15) | 0.029 |
| Income quintile 3 | 1.01 (0.90–1.12) | 0.76 (0.55–1.06) | 0.77 (0.55–1.07) | 0.106 |
| Income quintile 4 | 0.98 (0.89–1.07) | 0.83 (0.61–1.14) | 0.79 (0.58–1.08) | 0.316 |
| Income quintile 5 (richest) | 1.02 (0.92–1.13) | 0.76 (0.56–1.01) | 0.77 (0.56–1.05) | 0.040 |
| In the workforce | 1.28 (1.19–1.37)*** | 1.10 (0.91–1.34) | 1.30 (1.06–1.60)* | 0.139 |
| Urban | 1.08 (1.00–1.16)* | 0.93 (0.72–1.19) | 0.96 (0.77–1.20) | 0.263 |
| Has an account | 1.27 (1.13–1.42)*** | 1.55 (1.10–2.19)* | 1.68 (1.15–2.45)** | 0.243 |
| Digitally enabled account | 1.27 (1.12–1.43)*** | 1.11 (0.80–1.55) | 1.53 (0.99–2.36) | 0.395 |
| Used the internet (past 3 months) | 1.56 (1.41–1.74)*** | 1.04 (0.81–1.35) | 1.47 (1.13–1.93)** | 0.002 |
| Respondents (economies) | 61,467 (72) | 13,691 (71) | 60,639 (71) |
Note: Odds ratios with 95% confidence intervals. Survey-weighted; standard errors clustered by economy; * p < 0.05, ** p < 0.01, *** p < 0.001. Reference categories: primary education or less, poorest income quintile. Honduras (no victims) drops from the conversion and overall victimization models. The last column tests equality of the exposure and conversion coefficients.
Table 4.
National AI preparedness and the three outcomes: model ladder.
| Specification | Exposure | Conversion | Overall victimization |
| L0: individual controls only | 0.94 (0.78–1.14) | 0.67 (0.52–0.85)** | 0.64 (0.54–0.77)*** |
| L1: + log GDP per capita | 1.14 (0.82–1.57) | 0.62 (0.46–0.84)** | 0.71 (0.51–0.98)* |
| L2: + rule of law (main) | 1.12 (0.79–1.58) | 0.53 (0.39–0.73)*** | 0.60 (0.43–0.85)** |
| L3: L2 + internet and mobile penetration | 1.28 (0.90–1.82) | 0.53 (0.38–0.73)*** | 0.65 (0.45–0.94)* |
| L4: L2 + ITU Cybersecurity Index | 1.03 (0.71–1.48) | 0.52 (0.37–0.74)*** | 0.56 (0.39–0.82)** |
| L5: L2 + region fixed effects | 1.50 (1.10–2.05)* | 0.83 (0.53–1.29) | 1.09 (0.78–1.53) |
| L2b: control of corruption instead of rule of law | 1.12 (0.78–1.59) | 0.55 (0.41–0.76)*** | 0.64 (0.46–0.88)** |
Note: Odds ratio for a 0.10-point increase in AIPI, with 95% confidence intervals. Survey-weighted logits with individual controls; standard errors clustered by economy; t(71) tests; * p < 0.05, ** p < 0.01, *** p < 0.001. N = 61,467 (exposure), 13,835 (conversion) and 61,456 (overall victimization) in 72 economies.
Table 6.
Falsification and secondary outcomes.
| Outcome | Weighted mean | Main model | p | Main model + region fixed effects | p |
| Unwanted or offensive messages (falsification) | 11.8% | 0.77 (0.60–1.00) | 0.049 | 1.10 (0.83–1.45) | 0.50 |
| Foundational ID misused (secondary) | 3.5% | 0.76 (0.55–1.04) | 0.082 | 1.06 (0.75–1.50) | 0.74 |
Note: Odds ratio per 0.10 AIPI with 95% confidence intervals. N = 61,335 in 72 economies (falsification outcome) and 53,353 in 69 economies (ID misuse).
Table 7.
Interactions with national AI preparedness.
| Interaction | Exposure | Conversion | Overall victimization |
| AIPI × digitally enabled account (H3b) | 0.85 (0.72–1.00)* | 1.09 (0.84–1.41) | 0.94 (0.68–1.28) |
| AIPI × internet use (H3b, alternative measure) | 1.10 (0.85–1.42) | 0.93 (0.70–1.23) | 0.96 (0.70–1.33) |
| AIPI × MENA, World Bank region (6 economies, 41 victims) | 1.09 (0.58–2.05) | 1.06 (0.63–1.78) | 1.20 (0.65–2.20) |
| AIPI × MENA, Arab League members (8 economies, 104 victims) | 1.01 (0.66–1.55) | 0.59 (0.37–0.94)* | 0.65 (0.39–1.08) |
Note: Interaction odds ratios with 95% confidence intervals, main-model controls; * p < 0.05. In logit models an interaction odds ratio is a multiplicative difference in odds, not a difference in probabilities (Ai and Norton 2003).
Disclaimer/Publisher’s Note: The statements, opinions and data contained in all publications are solely those of the individual author(s) and contributor(s) and not of MDPI and/or the editor(s). MDPI and/or the editor(s) disclaim responsibility for any injury to people or property resulting from any ideas, methods, instructions or products referred to in the content. |
© 2026 by the authors. Licensee MDPI, Basel, Switzerland. This article is an open access article distributed under the terms and conditions of the Creative Commons Attribution (CC BY) license (http://creativecommons.org/licenses/by/4.0/).
Copyright: This open access article is published under a Creative Commons CC BY 4.0 license, which permit the free download, distribution, and reuse, provided that the author and preprint are cited in any reuse.