

Submitted:
02 November 2026
Posted:
03 November 2026
You are already at the latest version
Abstract
Background/Objectives: Antimicrobial resistance (AMR) poses a great threat to human health, and combination therapy is effective for its control. Previous work has performed for the antimicrobial quantitative structure–activity relationship (QSAR) models and synergistic antibacterial effects with clinical antibiotics of plant flavonoids. This study investigated whether antimicrobial QSAR models can be constructed for natural quinones and whether these compounds also exert extensive synergism when combined with clinical antibiotics. Methods: The antibacterial activities of 18 designed quinones and 11 clinical antibiotics with various antimicrobial mechanisms were determined using microbroth dilution method. Subsequently, the correlation and regression analyses between the minimum inhibitory concentration (MIC) and physicochemical parameter of quinones were performed for the establishment of antimicrobial QSAR models. Simultaneously, induction and deduction were applied to summarize the SARs based on the antimicrobial activity changes induced by structural variations. Finally, the combined effects of 11 quinones with 11 antibiotics against Staphylococcus aureus, together with those of 10 quinones with these antibiotics against Escherichia coli, were determined using checkerboard test. Results: Quinones exhibit potent, broad‑spectrum antimicrobial activity, particularly 5,8-dihydroxyl-1,4‑naphthoquinones with the MICs against S. aureus, E. coli, and Candida albicans of 8, 4, and 0.25 μg/mL, respectively. There are significant correlations between lipophilicity parameters and the MICs of quinones against E. coli or C. albicans, especially the former, but not for S. aureus. Interestingly, significant correlations exist between reduction potentials and the MICs of quinones against S. aureus and C. albicans, also especially the former. Subsequently, four optimal QSAR models were established for quinones against these three strains, respectively. simultaneously, several antimicrobial SARs were summarized, indicating the 5-hydroxy or 5,8-dihydroxynaphthoquinone scaffold is crucial for the inhibitory activities of naphthoquinones to C. albicans and E. coli. These QSAR and SARs further suggest that the primary target of quinones against E. coli resides in the cytoplasm or nuclear region, and while those against S. aureus is on the electron transfer process from type II NADH:quinone oxidoreductase to quinone pool in the respiratory chain. Another, quinones present moderate synergistic effects with antibiotics, while their synergistic probabilities against E. coli would remarkably increase when combined with antibiotics targeting the cell membrane. Furthermore, emodin presents extensive synergy with antibiotics whether against S. aureus or E. coli. Conclusions: Natural quinones is encouraged to be developed as novel antimicrobial agents or adjuvants. Furthermore, effective utilization of quinone‑containing biological resources especially plant to reduce the enrichment and dissemination of ARGs in ecosystems is helpful for addressing AMR according to the OE-OH.
Keywords:
quinone
; QSAR
; combination
; mechanism
; Escherichia coli
; Candida albicans
; Staphylococcus aureus
; one health
; model
; plant
1. Introduction
Antimicrobial resistance (AMR) represents a severe global public health crisis and a persistent decline in the discovery of novel antibiotics [1,2,3]. The COVID-19 pandemic has further exacerbated this global challenge [3]. To combat and delay the development of antimicrobial resistance, numerous therapeutic strategies have been developed [4,5,6]. Accumulating evidence demonstrates that rational combination therapies can not only improve the clinical efficacy of antibacterial agents [5,6,7], but also optimize the utilization of clinical antibacterial resources. Such approaches reduce treatment costs and buy valuable time for AMR prevention, thereby slowing AMR evolution [7,8,9]. Meanwhile, a growing body of studies has confirmed that a wide range of natural products exhibit prominent antimicrobial activity [10,11]. Accordingly, combination therapy incorporating natural products emerges as a promising strategy to restore antibiotic potency and retard the progression of AMR [12].
As reported in previous works [12,13], many plant flavonoids exhibit varying degrees of inhibitory effects on pathogenic bacteria. Another, their antimicrobial structure-activity relationships (SARs) or quantitative SARs (QSARs) models, and underlying action mechanisms respectively against Gram-positive and Gram-negative bacteria have been explored [13,14]. More importantly, most flavonoids can exert extensive synergistic antibacterial effects with clinical antibiotics against pathogenic bacteria [12]. Given that diverse natural products derived from microorganisms, plants and animals can modulate AMR evolution to a certain extent, the “One Earth-One Health (OE-OH)” concept and strategy is proposed and elaborated, especially emphasizing the key role of simulating and utilizing the self-regulation of ecosystems in addressing AMR [12,15,16].
To further enrich the underpinnings for the OE-OH, quinones, another category of natural products widely distributed in nature and variety of ecosystems including plants and microorganisms, and with potent antimicrobial activity [16,17,18,19], has aroused our interest. This naturally leads us to wonder whether natural quinones also have definite antibacterial structure–activity relationships, and whether their combination with clinical antibiotics can also produce extensive synergistic effects comparable to plant flavonoids. Therefore, their antimicrobial QSARs models or/and SARs, and synergistic effects with clinical antibiotics of diverse action mechanisms are further investigated, which will also provide comprehensive evidence to support the feasibility of the OE-OH concept and strategy. Here, the research is presented as follows:
2. Results
2.1. Minimum Inhibitory Concentration (MIC)
A set of eigthteeen quinones (Figure 1), including two hydroquinones as 1,2,4-benzenetriol and 2,3,5-Trimethylhydroquinone, from natural or synthetic products, were rationally selected for establishing the antibacterial QSAR models or clarifying the SARs of quinones against pathogenic microorganisms. These quinones includes 3 structural subtypes as benzoquinones, naphthoquinones, and anthraquinones. Their antimicrobial activities against Staphylococcus aureus ATCC 25923, Escherichia coli ATCC 25922, and Candida albicans CMCC 98001 were determined, respectively, and their MICs (μg/mL) were listed in Table 1.
From Table 1, twelve quinones present obviously antibacterial activities against S. aureus with the MICs ranged from 2 to 32 μg/mL, and eight compounds have remarkable inhibitory activities to C. albicans with the MICs ranged from 0.25 to 32 μg/mL. However, only six compounds have the MIC values of 4 to 32 μg/mL, and most compounds showed the MICs more than or equal to 256 μg/mL. These show that the tested quinones were generally most active against S. aureus, followed by C. albicans, whereas activity against E. coli was relatively limited. Notably, 5,8-dihydroxyl-1,4-naphthoquinone is the most promising broad-spectrum antimicrobial agent in this series, with MIC values of 8, 4, and 0.25 μg/mL against S. aureus, E. coli, and C. albicans, respectively. Quinone 3 also shows strong balanced activity against all three microorganisms, while Quinone 2 was highly active against S. aureus and C. albicans and moderately active against E. coli. These three compounds share a common meta-hydroxynaphthoquinone scaffold (Figure 1), and so it is essential for quinone 5 as a lead compound to perform possible structural optimization and antimicrobial mechanism investigation.
To evaluate the combined effects of quinones with clinic antibiotics against pathogenic bacteria, the MICs of eleven antibiotics against S. aureus ATCC 25923 and E. coli ATCC 25922, together with their known antimicrobial mechanism, are listed in Table 2. These antibiotics involve various antibacterial mechanisms, including the inhibition to the synthesis of cell wall, protein and DNA, and the damage to cell membrane along with the alteration in membrane permeability. They have different activities against S. aureus and E. coli, respectively with MICs ranged from 0.125 to 32 μg/mL and 0.0078125 to 1,024 μg/mL. Besides fosfomycin sodium, levofloxacin, and ciprofloxacin, the MIC values of the other 8 antibiotics reported in previous work [12], here were reexamined since many factors involving the details and operators of the MIC test may have an influence on the experimental MIC value [13].
2.2. Correlation and Regression Analyses, and Antimicrobial QSAR Models of Quinones
2.2.1. Based on the Dataset Consisting of the LogP and the MIC
To obtain the antimicrobial QSAR models of quinones, the correlation and regression analyses between the lipophilicity parameter LogP or LogD7.40 (x) and the MICs (y) of quinones respectively against three test microorganisms were performed. The results are shown in Table 3, together with their correlation coefficients (r) and coefficient of determination (R2).
From Table 3, the r-test indicated that there are significant correlations between the LogP and the MIC of quinones against E. coli and C. albicans. When the significant level α was set as 0.05, a significant correlation (r, 0.574) between the LogD7.40 and the MIC of quinones against C. albicans is also presented. However, the regression analyses show that only regression equations (5) and (6) have a good fit, with a coefficient of determination (R2) of 0.95 and 0.94, respectively. Namely, the MIC of quinones against E. coli can only be predicted from their LogP values. In detail, the MIC, whether its unit is μM or μg/mL, of quinones against E. coli can only be predicted from their LogP values with an accuracy of 95% and 94%, respectively.
Among the 17 datasets available for correlation regression analysis in Table 1, 1,4-dihydroxy-2-naphthoic acid (17) and 1,2,4-benzenetriol (18) are hydroquinone, and quinone 9 is a sodium bisulfite derivative of menaquinone. After sequentially removing these compounds from the datasets, two datasets containing 15 and 14 quinones were obtained, respectively. As lapachol (16) presented an undefined MIC value against E. coli, it need be excluded from these three datasets in accordance with the inclusion criteria. In-depth correlation and regression analyses for these three datasets were performed following the same procedure, respectively. The results showed that the correlation coefficients derived from these datasets fluctuate, yet the conclusions on foregoing correlations remained unchanged. Furthermore, a reliable prediction model could be established only from the dataset comprising the LogP and MIC of quinones against E. coli. Here, the results of the correlation and regressions for 16, 14, and 13 valid datasets of quinones against E. coli are shown in Table 4, indicating that these six equations fitted by the three datasets all yielded large R2 ranging from 0.85 to 0.96.
From Table 4, except for Equations (5) which predicted minimum MIC (MICmin) inconsistent with experimental observations and (16) with a negative value of leave-one-out cross-validated coefficient of determination (Q2, −0.7343), all other equations yielded approximate predicted MICmin values of 20.54 to 32.95 μM although their corresponding LogP values are different. Simultaneously, the measured MICmin values (Table 1) are also close to the predicted one. From the values of adjusted R2 (Radj2) and Q2, the sample size, and the closeness between the predicted MICmin and the measured one of the corresponding datasets for the QSAR model, Equation (13), y = 0.9715x5 + 21.2196x4 - 100.8301x3 + 793.5234, can be considered as the QSAR model for quinones against E. coli, with a predicted accuracy of 92.9%. The predicted range of LogP value is [−0.64, 5.29], and the predicted MICmin of quinones against E. coli is 25.30 μM.
2.2.2. Based on the Dataset Consisting of the E(Q/Q•‾)7 vs NHE/mV and the MIC
As above results, only QSAR models can be reliably established from the LogP and MIC of quinones against E. coli although there is also significant correlation between the LogP and MIC of quinones against C. albicans. Considering that quinones are prone to reduction, the reduction potential, another key physicochemical parameter of quinones, was considered, and so the correlation and regression analyses between the MIC (y, μM) and reduction potential E(Q/Q•‾)7 vs NHE (x, mV) were also performed according to similar procedure, respectively. The results are shown in Table 5.
From Table 5, there is a significant correlation between the antibacterial MICs and reduction potentials of quinones (r > r(n-2)). In terms of Radj2, Q2, and the closeness between the predicted MICmin and the measured one, QSAR models (20) and (21) for quinones against E. coli constructed using reduction potential fails to meet the requirements for robustness and predictability. In contrast, both Equations (18) and (19) demonstrate that the MICs of quinones against S. aureus exhibit an extremely significant correlation with the reduction potential, and the corresponding models possess good robustness and predictability (Q2 > 0.90). Considering the prediction range, the size of training datasets, and the magnitudes of Q2, Equation (19) is a more reliable QSAR model for quinones against S. aureus although the R2 and Radj2 of Equation (18) are higher.
Both Equations (22) and (23) indicate that the MICs of quinones against C. albicans have a significant correlation with reduction potential, and all parameters of the fitted equations satisfy the basic requirements for QSAR models. Nevertheless, the training datasets are relatively small. Meanwhile, regression analysis on a larger dataset (Table 3) reveals that the inhibitory activity of quinones against C. albicans also has an obvious correlation with the LogP. Therefore, to develop better predictive models, multiple regression analyses were further performed on the antibacterial MICs of quinones using both the LogP and reduction potential of quinones as two independent variables, with particular focus on constructing QSAR models of quinones against C. albicans. The results are presented in Table 6.
Judging from the magnitudes of Q², model (24) is inferior to (18), and models (25) and (19) each has its own advantages. For instance, all terms in model (19) show statistically significant P values (Table S1), whereas model (25) yields slightly better evaluation parameters R2, Radj2, and Q2, and its predicted MICmin against S. aureus is closer to the measured one in the dataset. Therefore, model (19) is preferable based on the principle of parsimony, while model (25) performs better in terms of prediction accuracy. Both can serve as QSAR models for quinones against S. aureus, and can be selected according to requirements. Meanwhile, the P value more than 0.05 for the x₁x₂ and x₂4 terms and the extremely small P value (1.2×10⁻⁶) for the x24 term in model (25) also indicate that the antimicrobial contribution of quinones against S. aureus mainly stems from their reduction potentials.
In addition, Table 6 shows that multiple regression analyses using the reduction potential and LogP as two independent variables failed to produce more reliable models for quinones against E. coli. However, in terms of various evaluation metrics such as Q² and the agreement between predicted MICmin and experimental ones, multiple regression equations (28) and (29) are more suitable as QASR models for quinones against C. albicans, while among which model (29) is optimal. Thus, the QASR model for quinones against C. albicans is y = − 2.3498×10−5x13 + 0.5391x1x2 + 136.9267.
2.3. Antibacterial Structure–Activity Relationships (SARs) of Quinones
In addition to above QSAR models, detailed SAR analyses were further summarized as follows. These analyses would focus on the details of changes in the antibacterial activity derived from the chemical structural variations of quinones.
(1) In general, the antibacterial activities of naphthoquinones are more than and equal to those of benzoquinones, and considerably greater than those of anthraquinones. Moreover, the antibacterial activity of quinones exhibits obvious specificity with respect to substituent positions.
(2) For benzoquinones and naphthoquinones, hydroxyl substitution ortho to the carbonyl (such as 2-hydroxyl-1,4-naphthoquinone) would markedly weaken activity against S. aureus, E. coli, and C. albicans, whereas carboxyl substitution at the ortho position of naphthoquinones would significantly enhance the inhibitory activity to E. coli. For anthraquinones, carboxyl substitution at the beta-position is beneficial for enhancing inhibitory activity to S. aureus and C. albicans, while hydroxyl substitution at the beta-position is more helpful for enhancing inhibitory activity to C. albicans.
(3) As the major antimicrobial quinones, naphthoquinones show the following SARs. A) Hydroxy substitution at C-2 would markedly reduce the antimicrobial activities. However, methyl substitution at C-2 could enhance the inhibitory activities to C. albicans, had little effect on those to S. aureus, and slightly reduced those to E. coli. B) Hydroxy substitution at C-5 would remarkably increase the antimicrobial activities, especially to C. albicans, followed by E. coli, with little effect on those to S. aureus. C) 5,8-Dihydroxy substitution would further remarkably enhance activity against C. albicans and also increased activity against E. coli, again with little effect on S. aureus. These findings indicate that the 5-hydroxy or 5,8-dihydroxynaphthoquinone scaffold (Figure 2) is crucial for the inhibitory activities of naphthoquinones to C. albicans and E. coli. D) Notably, when the C-2 side chain of a 5,8-dihydroxynaphthoquinone bears a bulky lipophilic hydrocarbon group (e.g., quinone 15), the inhibitory activities against C. albicans and E. coli would decrease significantly, whereas those against S. aureus remain unaffected. In contrast, hydroxylation of the lipophilic C-2 substituent, especially α-hydroxylation (e.g., quinone 1), could markedly enhanced activity against C. albicans, with some increase against E. coli as well.
(4) The hydroquinones 2,3,5-trimethyl-1,4-benzenediol and 1,2,4- benzenetriol were only marginally more active than their oxidized counterpart 2-methyl-1,4-benzoquinone and 2-hydroxyl-1,4-naphthoquinone against three test pathogenic strains, suggesting that redox state can modulates, but has little effect on its antimicrobial activity.
2.4. Antibacterial Effects of Quinones in Combination with Clinical Antibiotics to S. aureus
From Table 1, quinones 1 to 11 were used for the evaluation of antibacterial effects of quinones in combination with eleven clinical antibiotics (Table 2) to S. aureus, respectively. The results are shown in Figure 3. Among these 121 combinations against S. aureus, 13 ones presented synergistic effect, and which is equal to 10.7% of all combinations. For 9 natural quinones 1 to 8, and 11 in combination with 11 antibiotics, 9 ones present synergistic effect, and which is equal to 9.1% of all combinations. These findings indicate that the combination of antibiotics with quinones exhibits a higher probability of synergistic antibacterial effects than combinations between different antibiotics [8].
From Figure 3, when respectively combined with fosfomycin targeting cytoplasmic MurA, doxycycline acting on the 30S ribosomal subunit, and ciprofloxacin inhibiting topoisomerase IV, emodin, a natural product which exhibits weak inhibitory activity to S. aureus, displays significant synergistic effects, demonstrating the favorable synergistic activity of emodin in combination with antibiotics to S. aureus. Meanwhile, doxycycline also showed good synergistic antimicrobial effects with quinones.
2.5. Antibacterial Effects of Plant Quinones in Combination with Clinical Antibiotics to E. coli
Quinones 1 to 10 were used for the evaluation of antibacterial effects of quinones in combination with eleven antibiotics (Table 2) to S. aureus, respectively. The results are shown in Figure 4. Among these 110 combinations against E. coli, 9 ones present synergistic effect, and which is equal to 8.2% of all combinations. For 8 natural quinones 1 to 8 in combination with eleven antibiotics, 9 ones present synergistic effect, and which is equal to 10.2% of all combinations. These findings also indicate that the combination of antibiotics with quinones exhibits a higher probability of synergistic antibacterial effects than combinations between different antibiotics [8].
From Figure 4, when respectively combined with fosfomycin targeting cytoplasmic MurA, and levofloxacin and ciprofloxacin inhibiting DNA gyrase, emodin which exhibits weak inhibitory activity to E. coli also displays significant synergistic effects, again demonstrating the favorable synergistic activity of emodin in combination with antibiotics to E. coli. Different from those against S. aureus, colistin and fosfomycin show good synergistic antimicrobial effects with quinones.
3. Discussion
Along with the increasing severity of AMR, the advantages of natural products, particularly plant flavonoids, in resisting AMR have attracted much attention. Quinones are widely distributed in nature including microorganisms, plants, and animals, such as Polygonaceae, Boraginaceae, Streptomyces, and fungi. According to the perspective of the OE-OH concept and strategy [5], it should be encouraged that antibiotics are used in combination with plant-derived antimicrobial ingredients, and a sufficient reserve of new antibiotics should be ensured. Here, Natural quinones especially from plant were investigated for their antimicrobial QSARs and SARs, and combined effects with clinical antibiotics of diverse mechanisms. Based on above results, the antibacterial properties, QSARs and SARs of quinones, and their prospects of combination therapy were discussed as follows, together with possible antimicrobial mechanisms.
3.1. Plant Quinones Possess Potent Broad-Spectrum Antimicrobial Activities
Many plant quinones (Table 1) present strong inhibitory activities against S. aureus (MICs ≤ 32 μg/mL) like plant flavonoids. However, no plant quinone has been reported to reach the currently optimal anti–S. aureus activity of plant flavonoid, such as α-mangostin with the MICs of 0.5 to 1 μg/mL. In contrast to plant flavonoids, which usually show weak activity against Gram-negative bacteria and fungi, this study showed that some plant quinones possess strong activity against E. coli and C. albicans. Particularly, several 5-hydroxy- or 5,8-dihydroxyl-1,4-naphthoquinones showed very strong anti–E. coli and anti–C. albicans activities, with the MICs of 4 to 16 μg/mL and 0.25 to 2 μg/mL, respectively.
Since these quinones are produced by plants and microorganisms, and the quinone-producing plants and microbes may well have shared the same ecosystem with soil- or human-associated pathogens during Earth’s evolution, many pathogenic microbes may have long been exposed to these quinones and developed corresponding resistance genes. Therefore, once certain antibiotics are launched into the market, resistant pathogens against them may be rapidly selected from the perspective of the OE-OH concept. However, plant quinones with weak activities against these pathogenic microorganisms would be hard to develop resistance, being helpful to combat AMR [9]. This is also supported by the higher probability of synergistic antibacterial activity between emodin and antibiotics (Figure 3 and Figure 4).
As many factors involving the methods and details of the MIC test may have an influence on the experimental MIC value, the antibacterial activities of a given compound to different pathogens, even the same one, are usually varied [13]. Therefore, the MIC data obtained in the present work may show moderate or even considerable discrepancies compared with literature results. Nevertheless, all data were acquired under the same standardized experimental protocol in this study. In this case, the comparisons of antibacterial activity across compounds are more robust than those of literature reports. This is the reason why the antibacterial activities of several compounds with known antimicrobial profiles were re-evaluated in this work.
3.2. Antimicrobial QSARs for Plant Quinones, and Which Indicating Multi-Mechanistic Action
Different from plant flavonoids, there is no significant correlation observed between the lipophilicity parameters and the MICs for quinones against S. aureus. The weak intrinsic correlation is likely attributed to diverse mechanisms of action or other major mechanisms, which was proved by the following results. In contrast, there are significant correlations between the lipophilicity parameters and MICs of quinones against E. coli or C. albicans. However, only QSAR models of quinones against E. coli can be reliably established from the datasets consisting of their LogP and MIC values.
Considering that the reduction potential is another important physicochemical parameter of quinones [32,33], the correlation and regression analyses between the MIC and reduction potential were further performed. Surprisingly, there are significant correlation between the MIC and reduction potential of quinones against S. aureus and C. albicans, especially against the former, and their QSAR models were established, but against E. coli. To obtain more reliable models, the LogP and reduction potential as two variables were selected for further multiple regression analyses of quinones against these three strains. After this, the comparison of these QSAR models in Table 4 to Table 6, and four optimal antimicrobial QSAR models were made sure as follows: (1) Equations (19) and (25), respectively with a predicted accuracy of 99.3% and 99.5%, are considered as two QSAR models of quinones against S. aureus, especially for the former; (2) Equations (13), with a predicted accuracy of 92.9%, regards as the QSAR model of quinones against E. coli; and (3) Equation (29), with a predicted accuracy of 97.8%, can work as the QSAR model of quinones against C. albicans. Among these models, y is the MIC (μM) values of quinones against a certain pathogenic strain; x1 is the E(Q/Q•‾)7 vs NHE (mV) of quinones, and x2 or x represents the LogP values of quinones. Notably, the application of these models should be strictly limited the predicted ranges shown in Table 4 to Table 6 since all the size of the datasets for model development is limited.
The above correlation analyses and QSAR models demonstrate that the antimicrobial MICs of quinones have an indisputable significant correlation with their logP values or/and reduction potential. However, due to the limited sample size, all optimal models can only serve as preliminary models and are restricted for use within the prediction intervals. Superior models require external validation or further analyses with more samples. In addition, the measured MICs might have a 1/4 to 4-fold fluctuation due to the variety of experimental detail, especially determined method [13]. Thus, the actual minimum MIC value may may reach 1/4× of the predicted one, such as 3.10 μM for S. aureus, 6.32 μM for E. coli, and 4.10 μM for C. albicans, and sometimes even 1/8× of the predicted one.
Recently, based on the data of 1,4-naphthoquinone derivatives, collected from night published papers, a QSAR model, with R2 of 0.8955 and Q2 of 0.8564, for them against S. aureus was established using multiple linear regression consisting of five descriptors ALogP, MATS5e, VR2_DzZ, VE2_Dzs, and MIC1 [39]. here two QSAR models, with R2 more than 0.9945 and Q2 of 0.9863 were also established for natural quinones including benzoquinones and naphthoquinones, against S. aureus, using one- or two-variable regression analyses for the datasets consisting of only reduction potential or combined with LogP. This indicates a more reliable QSAR model might be established if Srivastava S. et al. performed multiple linear regression containing the descriptor of reduction potential [39]. Furthermore, some antimicrobial SARs were summarized from the designed derivatives of isoquinolinequinone, quinolinequinones, and 1,4-quinone scaffold [40,41,42,43,44], and some antimicrobial SARs of anthraquinones were also provided from natural and synthesized ones [45]. In this study, a QSAR model was also established for quinones including variety of subtypes as natural benzoquinones and naphthoquinones, and synthesized hydroquinones, against E. coli. Simultaneously, another QSAR model of quinones including natural quinones including benzoquinones and naphthoquinones against C. albicans was well established. In addition, several antimicrobial SARs of natural quinones including benzoquinones, naphthoquinones, and anthraquinones were further summarized.
From these QASR models in this study, it further shows that the lipophilicity is mainly responsible for the inhibitory activity of quinones against E. coli, the reduction potential primarily for those against S. aureus, and while the combination of lipophilicity and reduction potential for those against C. albicans. These are also supported from the P values for each term of these models in Table S1 of supplementary files, and also suggests that the same quinone may exert distinct mechanisms of action toward Gram-positive and Gram-negative bacteria as well as fungi.
Furthermore, from the antimicrobial mechanisms, the successful construction of the QSAR model for quinones against E. coli indicates that the lipophilicity is a determinant for their anti-E. coli effects. From the curve graph of model (13) (Figure S1), the antibacterial activity rises sharply along with the increase of their LogP values in range about from 0.5 to 3.1, which corresponds to the lipophilicity window favorable for membrane penetration, but declines rapidly with further increases in LogP values beyond about 3.1. This demonstrates that the lipophilicity is a key factor enabling quinones to cross the cell membrane of E. coli and exert bioactivity. It also suggests that the primary target of quinones against E. coli resides in the cytoplasm or nuclear region, which was proposed from the moderate Q2 (0.8252) and Radj2 (0.9290). Moreover, this is also supported by subsequent results from combination therapy, which reveal that quinones exhibit a high probability of synergistic activity against E. coli when combined with colistin, an agent that acts on cell membranes and increases membrane permeability [24].
As reported [13,14], the cell membrane is the major action site of plant flavonoids against S. aureus, presenting nonspecific action characteristic, including a primary mechanism of membrane disruption and involving the inhibition on the electron transfer of respiratory chain at quinone pool [46]. In contrast, extreme significant correlation of the MIC with reduction potential (Table 5), together with a reliable QASR model established, indicates a major mechanism of benzoquinones and naphthoquinones acting on the electron transfer process in the respiratory chain of S. aureus, which is also supported by previous reports [47]. From the curve graph of model (19) (Figure S2), quinones with the lowest predicted MIC (42.83 μM) against S. aureus exhibits a reduction potential of −160.3928 mV, which falls exactly within that range from type II NADH:quinone oxidoreductase (NDH-2) (−320 mV) to menaquinone (−74 mV) in the respiratory chain of S. aureus [48]. Simultaneously, quinones within reduction potentials from −207 to −70 mV (Figure S1) present stronger inhibitory activity against S. aureus. Although E. coli and C. albicans also have quinone pools with the reduction potential close this range, they have different membrane architectures and quinone pools containing ubiquinone with higher reduction potential of about +100 mV [48,49], presenting different correlations for their MICs with both reduction potential and LogP. This also shows difference in the main antimicrobial mechanisms for Gram-positive and Gram-negative bacteria as well as fungi although quinones kill microorganisms through many mechanisms including redox-cycling oxidative stress, electrophilic covalent modification of thiol enzymes, and membrane damage, extended by interactions with nucleic acids, the respiratory chain, etc. [45,50].
3.3. A Moderate Synergistic Probability for Plant Quinones Combined with Antibiotics
Here 9.1% and 8.2% probabilities for quinones combined with antibiotics respectively against S. aureus and E. coli indicated that a moderate probability of synergism when plant quinones combined with antibiotics, yet both probabilities are considerably lower than those of plant flavonoids [12]. This proposes that synergistic combinations with clinical antibiotics are more readily identified among plant flavonoids than plant quinones. Considered that it is hard to find synergistic combinations among clinic antibiotics [8], it should be still encouraged to develop new antibacterial combinations especially which against Gram-negative bacteria and fungi from plant quinones. From Table 1, many quinones present potent and broad-spectrum antimicrobial activities. Therefore, new antibacterial agents especially against Gram-negative bacteria and fungi from plant quinones are also encouraged to develop, since more severe resistance of Gram-negative bacteria than Gram-positive species to clinical antibiotics has been determined [51].
From Figure 3 and Figure 4, emodin exhibits higher probability of synergy when combined with clinic antibiotics such as fosfomycin and ciprofloxacin, against whether S. aureus or E. coli. This is different from the results described by Lee et al. [52]. In addition, 2,3,5-trimethylhydroquinone combined with antibiotics such as linezolid, ciprofloxacin, and doxycycline, also presents extensive synergistic inhibitory activities against S. aureus. Therefore, these findings encourage researches on the combined use of non-cell-wall-targeting clinical antibiotics with emodin and analogues, or 2,3,5-trimethylhydroquinone. Together with this, all combinations present indifferent antimicrobial effects on both pathogenic strains tested when quinones combined with cell wall-targeting antibiotics, indicating that the antimicrobial mechanisms of quinones is unlikely to target the site of cell wall according to the reported principle for the agent selection of synergistic combinations [53]. When combined with quinones (Figure 3), both fosfomycin and doxycycline present higher probability of synergistic effects against Gram-positive bacteria such as S. aureus, and which is the same for both fosfomycin and colistin against Gram-negative species (Figure 4). These indicate fosfomycin possess higher probability of synergistic effects against whether S. aureus or E. coli, indicating it is encouraged to research on the combined use of fosfomycin with quinones.
It is worth noting that some quinone-antibiotic combinations with the fractional inhibitory concentration index (FICI) values falling in the range of (0.5, 0.625] (Figure 3 and Figure 4) are classified as indifferent effects according to the judgement criteria. However, when the checkerboard assays determined by broth microdilution method with an 80% linear concentration decrease [54], some of them will likely exhibit synergistic effects, especially for combinations with the FICI values falling in the range of (0.5, 0.5625]. Accordingly, the probability of synergy for quinones combined with antibiotics possibly can reach up to 14.9% for S. aureus and 15.5% for E. coli. Both these and actual results from Figure 3 and Figure 4 indicated there is no obvious difference between the synergistic probability of quinones with antibiotics against S. aureus and E. coli.
3.4. Future of Quinones in Addressing AMR
Based on above, quinones have strong and broad-spectrum inhibitory activities against bacteria and fungi, and present moderate probability of antimicrobial synergy with clinical antibiotics. However, it should be noted that some quinones, especially from microorganisms, are toxic to humans and animals since these compounds together with their structural analogues also exist in humans and animals and play an important physiological function [32,48]. These drawbacks would hinder their development as new antimicrobial agents and their applications in vivo. Generally, benzoquinones and naphthoquinones tend to display stronger cytotoxicity than anthraquinones [32], and natural quinones usually have lower toxicity than many microbial quinones [37]. Another, as the resistance to Gram-negative bacteria and fungi are more severe, it is encouraged to discovery plant quinones or obtain derivatives of known quinones, with strong inhibitory activities against E. coli or fungi and good safety, underlying the antimicrobial QSAR model of quinones.
According to the principles of drug combination [9], agents with a lower mutant prevention concentration (MPC) in combinations exhibit a greater potential to prevent resistance, and the linear correlation between MPC and MIC is obvious observed. Thereby, when two agents with markedly different antibacterial activities are combined, in general, the one with weaker antibacterial activity possesses stronger resistance-preventing potential [9]. This scenario is well suited for the combination of plant anthraquinones many with weak antibacterial activity and clinical antibiotics most with potent antibacterial activity. Meanwhile, quinones with weak biological activity from plants are likely to have lower toxicity to humans from a mechanistic perspective. Therefore, plant quinones with weak activity are suitable to be developed as antibacterial adjuvants or potentiators according to the concept and strategy of OE-OH [5]. In contrast, plant quinones with strong antibacterial activity can be appropriately considered for development as standalone antibacterial preparations, especially formulations for cutaneous or local infections.
As above mentioned, quinones widely exist in nature and variety of ecosystems including plants, microorganisms, and animals [16]. From the perspective of OE-OH [5], these naturally occurring quinones in ecological environments can, on the one hand, curb the spread of resistant bacteria either alone or together with antibiotics released into the environment. On the other hand, they can reverse and resensitize resistance in certain clinical antibiotic-resistant strains discharged into the environment. Consequently, the enrichment and dissemination of antibiotic resistance genes (ARGs) in the ecological environment can be diluted and mitigated to a certain extent. Thereby, rational development of these compounds, and effective utilization of quinone-containing biological resources to eliminate the enrichment of ARGs in ecosystems will certainly contribute to global efforts against bacterial resistance.
4. Materials and Methods
4.1. Antimicrobial Agents and Plant Flavonoids
Eighteen quinones including two hydroquinones were design-wise selected for the tests of antimicrobial activities, and then some of them were further used for the evaluation of combinational effect. R-(+)-shikonin (≥98%) was purchased from Chengdu Must Bio-Technology Co., Ltd. (Chengdu, China); deoxyshikonin (≥98%) was purchased from Shenzhen Xirui Biotechnology Co., Ltd. (Shenzhen, China); 2-hydroxyl-1,4-naphthoquinone (98%), menadione sodium bisulfite hydrate (≥98%), chrysophanol (≥97%), and 1,2,4-benzenetriol (≥98%) were purchased from Shanghai Dibo Biotechnology Co., Ltd. (Shanghai, China); plumbagin (98%) was purchased from Beijing Innochem Science & Technology Co., Ltd. (Beijing, China); lapachol (98%) and sennoside B (≥98%) were purchased from Chengdu Push Bio-technology Co., Ltd. (Chengdu, China); juglone (98%) and 2-methyl-1,4-benzoquinone (97%) were purchased from Shanghai Haohong Scientific Co., Ltd. (Shanghai, China); 1,4-naphthoquinone (98%), menadione (96%), rhein (98%), and emodin (≥90%) were purchased from Shanghai Macklin Biochemical Co., Ltd. (Shanghai, China); 1,4-dihydroxy-2-naphthoic acid (98%) was purchased from Shanghai Yuanye Bio-Technology Co., Ltd. (Shanghai, China); 5,8-dihydroxyl-1,4-naphthoquinone (97%) was purchased from Shanghai Perfemiker Chemical Technology Co., Ltd. (Shanghai, China); 2,3,5-trimethylhydroquinone (97%) was purchased from J&K Scientific Ltd. (Beijing, China).
Eleven antibacterial agents were selected for the evaluation of combinational effect. Gentamicin sulfate (98%) was were purchased from Shanghai Yingxin Laboratory Equipment Co., Ltd. (Shanghai, China); ampicillin (96%) was purchased from Shanghai Acmec Biochemical Co.,Ltd. (Shanghai, China); linezolid (99%), colistin sulfate (≥19,000 U/mg), fosfomycin sodium (99%), and levofloxacin (98%) were purchased from Shanghai Macklin Biochemical Co., Ltd. (Shanghai, China); vancomycin hydrochloride (900 ug/mg) was purchased from Meryer (Shanghai) Biochemical Technology Co., Ltd. (Shanghai, China) ; bacteriocin (USP grade, 60 U/mg) was purchased from Shanghai Yuanye Bio-Technology Co., Ltd., Shanghai Yuanye Bio-Technology Co., Ltd; roxithromycin (≥94%), ciprofloxacin (97.5%), doxycycline (analytical standard), analytical pure for 3-(4,5-Dimethyl-2-thiazolyl)-2,5-diphenyl-2H-tetrazolium bromide (MTT) and dimethyl sulfoxide (DMSO) were purchased from Sangon Biotech (Shanghai) Co., Ltd. (Shanghai, China).
All the aforementioned compounds were stored at −20 °C. Prior to use, they were dissolved in a specific volume of dimethyl sulfoxide (DMSO), and then diluted with fresh sterilized Mueller Hinton broth (MHB) or Sabouraud Dextrose Broth (SDB) to achieve stock solutions with a concentration of 4,096 μg/mL. Following this, the stock solution was thoroughly mixed and further diluted to the desired concentrations with sterile MHB immediately. Additionally, the concentrations of DMSO in all test systems was maintained at less than 5.0%, while the blank controls contained 5.0% DMSO.
4.2. Media, Bacterial Strains and Growth Condition
Casein acid hydrolysate, starch soluble, beef extract, tryptone, and agar powder were sourced from Sangon Biotech (Shanghai) Co., Ltd. (Shanghai, China), and anhydrous glucose was purchased from Xilong Scientific Co., Ltd. (Shantou, China). These reagents were employed in the preparation of the culture media. Mueller Hinton agar (MHA) was formulated with 17.5 g/L of casein acid hydrolysate, 1.5 g/L of starch soluble, 3.0 g/L of beef extract, and 17.0 g/L of agar powder, all dissolved in purified water, with a pH value adjusted to 7.40 ± 0.20. Mueller Hinton broth (MHB) was prepared without agar powder, following the same composition and protocol as MHA. Sabouraud Dextrose agar (SDA) was formulated with 10 g/L of tryptone, 40 g/L of anhydrous glucose, and 15.0 g/L of agar powder, all dissolved in purified water, with a pH value adjusted to 5.60 ± 0.20. SDB was prepared without agar powder, following the same composition and protocol as SDA.
S. aureus ATCC 25923 and E. coli ATCC 25922 were obtained from the American Type Culture Collection in Manassas, VA, USA, and C. albicans CMCC(F) 98001 was obtained from China Medical Culture Collection in Beijing, China. These bacterial strains were preserved in MicrobankTM microbial storage systems, supplied by PRO-LAB diagnostics in Toronto, Canada, at a temperature of −20 °C. Prior to use, both S. aureus and E. coli were cultured onto MHA plate at 35.5 °C, and C. albicans was cultured onto SDA plate at 28.5 °C. Subsequently, isolated pure colonies from these plates were transferred into MHB or SDB, and incubated at 35.5 °C for 4 to 6 h or 28.5 °C for 8 to 12 h, to obtain cell suspension in logarithmic growth phase. Finally, an aliquot of the culture was diluted with corresponding broth to obtain the cell concentrations of 1×10⁶ CFU/mL for E. coli and S. aureus, and 5×10³ CFU/mL for C. albicans, ready for subsequent experimental procedures. MHB and SDB was used for the antimicrobial susceptibility tests. All TopPette Pipettors, the 2~20 μL, 20~200 μL, and 1000 μL models, were purchased from DLAB Scientific Co., Ltd. (Beijing, China).
4.3. Susceptibility Test
All the MICs of quinones and antimicrobial agents against both S. aureus and E. coli were respectively determined according to the standard procedure described by the Clinical and Laboratory Standards Institute (CLSI) [55]. Briefly, the exponential phase culture was diluted with MHB to achieve a bacterial concentration approximately 1.0×10⁶ CFU/mL, and then the MICs against S. aureus ATCC 25923 and E. coli ATCC 25922 were determined using the broth microdilution method on the 96-well plates (Shanghai Excell Biological Technology Co., Ltd., Shanghai, China) in triplicate [12]. Based on the preliminary MIC values of the compounds, the initial concentration of 1,024, 2,048 or 4,096 μg/mL was respectively established for corresponding compound. Following a 18 h incubation of the 96-well plate at 35.5 °C, 20 μL of MTT solution (4.0 mg/mL) was added into each well, the plate was thoroughly shaken, and then allowed to stand for 30 min at room temperature. The MIC, defined as the lowest concentration of the compound that completely inhibits bacterial growth in the micro-wells, was determined by the absence of color change, indicating no bacterial growth, in contrast to the sufficient bacterial growth observed in the blank wells, as described in reference [12]. Similarly, the same procedure for the MICs of those against C. albicans CMCC(F) 98001 was performed except the cell concentration approximately 5.0×10³ CFU/mL and a 48 to 72 h incubation.
4.4. Exploration of Antimicrobial Qsar Models for Quinones
As no definite MIC value was presented for some quinones in Table 1, such as the MIC value of quinone 7 or 13 expressed as 4 to 8 μg/mL or more than 1024 μg/mL, these data were processed according to the following rules: (1) discard all the ambiguous data which the MICs expressed as more than a certain value; (2) for the MICs expressed as a range, the smaller boundary value is considered as the MIC, such as the MIC value for quinone 7 as 4 μg/mL. All the rest of the data in Table 1 were used as the data of this article for the subsequent analyses. Subsequently, the lipophilicity parameters LogP and LogD7.40 (the log10 of oil/water distribution coefficient at pH 7.40) of quinones were calculated using software ACD/Labs 6.0 (Advanced Chemistry Development, Inc., Toronto, ON, Canada).
Similar to previous work [13,14], for establishing the antimicrobial QSAR models of quinones respectively to S. aureus and E. coli, and C. albicans, the correlation and regression analyses between their MIC values (y, μM or μg/mL) and their lipophilicity parameter LogP or LogD7.40 values (x) were respectively performed using Microsoft Excel software (Microsoft Corporation, Redmond, WA, USA), and the correlation coefficient (r) was automatically calculated. Finally, their correlations were validated using the r-test, and the coefficient of determination (R2) was also calculated to determine the fitting precisions according to Equation (5) in previous work [13]. After this, the correlation and regression analyses between the MIC (y, μM) and reduction potential E(Q/Q•‾)7 vs NHE (x, mV), which were retrieved from literature reports, were performed according to the same procedure, respectively. Besides of the analyses for the datasets only from our experiment, larger datasets consisting of additional 1 to 3 data of antimicrobial MICs retrieved from literature and our experimental data were also analyzed to obtain more reliable models. Depending on above results, multiple regression analysis for the antimicrobial MIC (y, μM) against the reduction potential E(Q/Q•‾)7 vs NHE/mV (x1) and LogP (x2) values of quinones were further achieved with the help of artificial intelligence KIMI (https://www.kimi.com/), and with this the Radj2 and Q2 calculation of model evaluation, and the predicted MICmin of models together with their P values for each term were also performed. The curve graphs (Figures S1 and S2) of two QSAR models (13) and (19) were drown using OriginPro version 2026b (OriginLab Corporation, Northampton, MA, USA).
4.5. Antimicrobial Structure-Activity Relationship of Quinones
According to the designed logic of structural change as shown in Figure 1, structural variations of the compared quinones, including redox state, substitution positions, and functional groups, are minimized. The corresponding activity changes induced by compound structural variations are compared, and thereout the antibacterial SARs of quinones are summarized.
4.6. Checkerboard Assay
Depended on the MICs of 11 quinones and 11 antibacterial agents, checkerboard assay was designed to determine their FICIs in combinations against two pathogenic bacteria, according to previous method [12], and the tests were performed on 96-well plates. Briefly, the dilutions from 8 to 1/16 MIC for plant flavonoids and antibacterial agents in the horizontal or vertical direction were prepared in a separate 96-well plate by twofold dilution method. Next, a 100 μL of dilution with different concentrations for two compounds in a combination were correspondingly added into the designed wells on another plate to obtain different proportions with the concentrations from 4 to 1/32 MIC of each compound. Another, columns 11 and 12 only contained MHB with 5 × 10⁵ cfu/mL bacterial strains were used as blank controls. When the microbial growth in blank wells was good at 35.5 °C for 24 h, the MIC was defined as the lowest concentration of bacterial growth visibly inhibited in the micro-wells. If necessary, MTT stain was used to clearly observe the results like section 4.3. The MICs of two compounds in alone were respectively observed from row A and column 1, and the MICs of two compounds in combinations were obtained from wells B2 to H8.
The FICs were calculated as following formula:
Here, A and B were two compounds in a drug combination, and are respectively the MICs of A in a combination and in alone, and and are respectively the MICs of B in a combination and in alone.
The combining effect interpreted as follows: synergy, FICI ≤ 0.5; indifference, 0.5 < FICI ≤ 4.0; and antagonism, FICI > 4.0 [12].
5. Conclusions
Based on the above results, analyses and discussion, the main conclusions are summarized as follows. Quinones exhibit potent, broad-spectrum inhibitory activity against bacteria and fungi, particularly 1,4-naphthoquinones. Four optimal QSAR models containing variables LogP and reduction potential in alone or joint both are successfully constructed for quinones against E. coli, S. aureus, and C. albicans. these QASR models show that the lipophilicity, reduction potential, and joint both are mainly responsible for the inhibitory activity of quinones against E. coli, S. aureus, and C. albicans, respectively. Another several antimicrobial SARs of quinones were further summarized. Quinones in combination with antibiotics present moderate synergistic effects, and the synergistic probability against E. coli would remarkably increase when combined with antibiotics targeting the cell membrane. Considering the safety, plant quinones is encouraged to be developed as novel antimicrobial agents or adjuvants especially the former. According to the concept and strategy of OE-OH, effective utilization of quinone-containing biological resources especially plant to reduce the enrichment and dissemination of ARGs in ecosystems can help to address AMR.
Supplementary Materials
The following supporting information can be downloaded at the website of this paper posted on Preprints.org.
Author Contributions
Conceptualization, G.Y.; methodology, G.Y., Y.Q. and Y.W.; software, G.Y., M.Z. and J.H.; validation, G.Y., Y.Q. and Y.W.; formal analysis, G.Y., Y.Q., Y.W. and Y.L.; investigation, Y.Q., Y.W., Y.L., G.Y., M.Z. and J.H.; resources, G.Y.; data curation, G.Y., Y.Q. and Y.W.; writing—original draft preparation, G.Y., Y.Q. and Y.W.; writing—review and editing, G.Y.; visualization, G.Y., Y.L., M.Z. and J.H.; supervision, G.Y.; project administration, G.Y.; funding acquisition, G.Y. All authors have read and agreed to the published version of the manuscript.
Funding
This research was funded by National Natural Science Foundation of China (Grant No. 82360691 and 82073745) and Natural Science Foundation of Jiangxi Province, China (Grant No. 20202BABL206156).
Institutional Review Board Statement
Not applicable.
Informed Consent Statement
Not applicable.
Data Availability Statement
The datasets generated during and/or analyzed during the current study are available from the corresponding author on reasonable request.
Acknowledgments
During the preparation of this manuscript, we used the AI-assistant of KIMI (https://www.kimi.com/) for the purposes of translating some text of this manuscript in Chinese into them in English. All the translation output were carefully reviewed by us, and most expressions were revised again to be consistent with the meaning we want to express. All authors take full responsibility for the content of this publication.
Conflicts of Interest
The authors declare no conflict of interest.
References
- GBD 2021 Antimicrobial Resistance Collaborators. Global burden of bacterial antimicrobial resistance 1990-2021: a systematic analysis with forecasts to 2050. Lancet 2024, 404:1199−1226. [CrossRef]
- Antimicrobial Resistance Collaborators. Global burden of bacterial antimicrobial resistance in 2019: a systematic analysis. Lancet 2022, 399: 629–655. Erratum in: Lancet 2022, 400: 1102. doi: 10.1016/S0140-6736(21)02653-2. [CrossRef]
- Cameron, A.; Esiovwa, R.; Connolly, J.; Hursthouse, A.; Henriquez, F. Antimicrobial resistance as a global health threat: The need to learn lessons from the COVID-19 pandemic. Glob. Policy 2022, 13: 179–192. [CrossRef]
- Rahman, M.U.; Shah, J.A.; Khan, M.N.; Bilal, H.; Zhu, D.; Du, Z.; Mu, D.S. Innovative approaches to combat antimicrobial resistance: a review of emerging therapies and technologies. Probiotics Antimicrob. Proteins 2026, 18: 3597–3614. [CrossRef]
- Yuan, G.; Hu, J.; Zhang, M.; Chen, X.; Luo, Y. One Earth-one health to combat antimicrobial resistance having a dual mutation pattern, based on the robust self-regulation and perpetual reconstruction of ecosystems. Antibiotics 2025, 14: 920. [CrossRef]
- Kuchay, R.A.H. Novel and emerging therapeutics for antimicrobial resistance: A brief review. Drug Discov. Ther. 2024, 18: 269-276. [CrossRef]
- Ejim, L.; Farha, M.A.; Falconer, S.B.; Wildenhain, J.; Coombes, B.K.; Tyers, M.; Brown, E.D.; Wright, G.D. Combinations of antibiotics and nonantibiotic drugs enhance antimicrobial efficacy. Nat. Chem. Biol. 2011, 7: 348–350.
- Brochado A.R.; Telzerow A.; Bobonis J.; Banzhaf M.; Mateus A.; Selkrig J.; Huth E.; Bassler S.; Beas, J.Z.; Zietek, M. Species-specific activity of antibacterial drug combinations. Nature 2018, 559: 259–263. [CrossRef]
- Yi, H.; Yuan, G.; Li, S.; Xu, X.; Guan, Y.; Zhang, L.; Yan, Y. Drug combinations to prevent antimicrobial resistance: various correlations and laws, and their verifications, thus proposing some principles and a preliminary scheme. Antibiotics 2022, 11: 1279. [CrossRef]
- Wright, G.D. Opportunities for natural products in 21st century antibiotic discovery. Nat. Prod. Rep. 2017, 34: 694–701.
- Abdallah, E.M.; Alhatlani, B.Y.; de Paula Menezes, R.; Martins, C.H.G. Back to nature: Medicinal plants as promising sources for antibacterial drugs in the post-antibiotic era. Plants 2023, 12: 3077.
- Yuan, G.; Lian, F.; Yan, Y.; Wang, Y.; Zhang, L.; Zhu, J.; Fatima, A.; Qian, Y. One Earth-one health (OE-OH): antibacterial effects of plant flavonoids in combination with clinical antibiotics with various mechanisms. Antibiotics, 2025, 14: 8. [CrossRef]
- Yuan, G.; Xia, X.; Guan, Y.; Yi, H.; Lai, S.; Sun, Y.; Cao, S. Antimicrobial quantitative relationship and mechanism of plant flavonoids to gram-positive bacteria. Pharmaceuticals 2022, 15: 1190.
- Yan, Y.; Xia, X.; Fatima, A.; Zhang, L.; Yuan, G.; Lian, F.; Wang, Y. Antibacterial activity and mechanisms of plant flavonoids against gram-negative bacteria based on the antibacterial statistical model. Pharmaceuticals 2024, 17: 292.
- Yuan G.; Yi H.; Zhang L.; Guan Y.; Li S.; Lian F.; Fatima A.; Wang Y. Drug combinations to prevent antimicrobial resistance: theory, scheme and practice. Book of abstracts, 6th International Caparica Conference on Antibiotic Resistance. Caparica, Portugal, 8th – 12th September 2024; Capelo-Martinez J.L.; Santos H.M.; Oliveira E.; Fernández J.; Lodeiro C.; Publisher: PROTEOMASS Scientific Society, Caparica, Portugal, Keynote Presentations 8, pp. 93.
- Samarina, L.S.; Terletskaya, N.V.; Mussayeva, A.S. Environmental control of anthraquinone-flavonoid accumulation in wild plant species: biosynthetic pathways, ecological drivers, and adaptive significance. Front. Plant Sci. 2026, 17: 1782805. [CrossRef]
- Ahmadi, E.S.; Tajbakhsh, A.; Iranshahy, M.; Asili, J.; Kretschmer, N.; Shakeri, A.; Sahebkar, A. Naphthoquinone derivatives isolated from plants: recent advances in biological activity. Mini. Rev. Med. Chem. 2020, 20: 2019–2035. [CrossRef]
- Ju, J.H.; Li, X.T.; Shen, Q.K.; Guo, H.Y.; Quan, Z.S.; Yin, X.M. Advances in structural modification of natural products with antimicrobial activity. Fitoterapia 2025, 186: 106815. [CrossRef]
- Wang, L.; Qiu, M.; Li, X.; Liu, M.; Li, L.; Chen, Y. Antimicrobial activity and possible mechanisms of juglone against Escherichia coli, Staphylococcus aureus, and Salmonella pullorum. BMC Microbiol. 2025, 25: 668. [CrossRef]
- Yuan, G.; Zhu, X.; Li, P.; Zhang, Q.; Cao, J. New activity for old drug: in vitro activities of vitamin K3 and menadione sodium bisulfite against methicillin-resistant Staphylococcus aureus. Afr. J. Pharm. Pharmacol. 2014, 8: 451–454. [CrossRef]
- Türkyılmaz, O.; Darcan, C. Molecular basis of ampicillin resistance: combinatorial mechanisms and future strategies. World J. Microbiol. Biotechnol. 2026, 42: 79. [CrossRef]
- Puls, J.S.; Brajtenbach, D.; Schneider, T.; Kubitscheck, U.; Grein, F. Inhibition of peptidoglycan synthesis is sufficient for total arrest of staphylococcal cell division. Sci. Adv. 2023, 9: eade9023. [CrossRef]
- Buijs, N.P.; Vlaming, H.C.; Kotsogianni, I.; Arts, M.; Willemse, J.; Duan, Y.; Alexander, F.M.; Cochrane, S.A.; Schneider, T.; Martin, N.I. A classic antibiotic reimagined: Rationally designed bacitracin variants exhibit potent activity against vancomycin-resistant pathogens. Proc. Natl. Acad. Sci. U.S.A. 2024, 121: e2315310121. [CrossRef]
- Sabnis, A.; Hagart, K.L.; Klöckner, A.; Becce, M.; Evans, L.E.; Furniss, R.C.D.; Mavridou, D.A.; Murphy, R.; Stevens, M.M.; Davies, J.C.; Larrouy-Maumus, G.J.; Clarke, T.B.; Edwards, A.M. Colistin kills bacteria by targeting lipopolysaccharide in the cytoplasmic membrane. Elife 2021, 10: e65836. [CrossRef]
- de Oliveira, M.V.D.; Furtado, R.M.; da Costa, K.S.; Vakal, S.; Lima, A.H. Advances in UDP-N-acetylglucosamine enolpyruvyl transferase (MurA) covalent inhibition. Front. Mol. Biosci. 2022, 9: 889825. [CrossRef]
- Zheng, Y.; Chai, R.; Wang, T.; Xu, Z.; He, Y.; Shen, P.; Liu, J. RNA polymerase stalling-derived genome instability underlies ribosomal antibiotic efficacy and resistance evolution. Nat Commun. 2024, 15: 6579. [CrossRef]
- Borovinskaya, M.A.; Pai, R.D.; Zhang, W.; Schuwirth, B.S.; Holton, J.M.; Hirokawa, G.; Kaji, H.; Kaji, A.; Cate, J.H. Structural basis for aminoglycoside inhibition of bacterial ribosome recycling. Nat. Struct. Mol. Biol. 2007, 14: 727–732.
- Devarkar, S.C.; Lomakin, I.B.; Wang, J.; Grada, A.; Bunick, C.G. Dual site targeting of the bacterial 70S ribosome by tetracyclines. Nat. Commun. 2026, 17: 4452. [CrossRef]
- Krawczyk, S.J.; Leśniczak-Staszak, M.; Gowin, E.; Szaflarski, W. Mechanistic insights into clinically relevant ribosome-targeting antibiotics. Biomolecules 2024, 14: 1263. [CrossRef]
- Roger, C.; Roberts, J.A.; Muller, L. Clinical pharmacokinetics and pharmacodynamics of oxazolidinones. Clin. Pharmacokinet. 2018, 57: 559–575.
- Aldred, K.J.; Kerns, R.J.; Osheroff, N. Mechanism of quinolone action and resistance. Biochemistry 2014, 53: 1565–74. [CrossRef]
- O’Brien, P.J. Molecular mechanisms of quinone cytotoxicity. Chem. Biol. Interact. 1991, 80: 1–41. Erratum in: Chem. Biol. Interact. 1992, 81: 219. [CrossRef]
- Kishi, S.; Saito, K.; Kato, Y.; Ishikita, H. Redox potentials of ubiquinone, menaquinone, phylloquinone, and plastoquinone in aqueous solution. Photosynth Res. 2017, 134: 193-200. [CrossRef]
- Kim, M.H.; Jo, S.H.; Ha, K.S.; Song, J.H.; Jang, H.D.; Kwon, Y.I. Antimicrobial activities of 1,4-benzoquinones and wheat germ extract. J. Microbiol. Biotechnol. 2010, 20: 1204–1209. [CrossRef]
- Chaieb, K.; Kouidhi, B.; Jrah, H.; Mahdouani, K.; Bakhrouf, A. Antibacterial activity of thymoquinone, an active principle of Nigella sativa and its potency to prevent bacterial biofilm formation. BMC Complement Altern. Med. 2011, 11: 29. [CrossRef]
- Fareid, M.A.; El-Sherbiny, G.M.; Elafandy, N.M.; Eltoum, N.E.; Othman, M.S.; Shawky, M.; El-Hawary, A.S.; Hamada, F.A.; Youssef, A.S.E. Exploring the multifaceted phytochemical profile of Nigella sativa and the therapeutic potential of thymoquinone. Pharmaceuticals 2026, 19: 503. [CrossRef]
- Özdal Zincir, Ö.; Özdal, U.; Ünlü, Ö.; Demirci, M.; Katiboğlu, A.B.; Egil, E.; Altan Şallı, G. Synergistic effect of thymoquinone and nystatin in the treatment of oral candidiasis; an in vitro study. Odontology 2022, 110: 330–337. Erratum in: Odontology 2022, 110: 338. doi: 10.1007/s10266-021-00673-6. [CrossRef]
- Eady, E.A.; Cove, J.H.; Fitzgerald, D.J.; Seville, S. Antimicrobial Agents. U.S. Patent Application US 20090030086A1, 29 January 2009.
- Srivastava, S.; Upadhyay, H.C.; Yadav, D.K. In silico investigations of natural-product tethered 1,4-naphthoquinones as inhibitors of Staphylococcus aureus. Biochem. Biophys. Res. Commun. 2025, 778: 152333. [CrossRef]
- Yıldız, M.; Bayrak, N.; Mataracı-Kara, E.; Jannuzzi, A.T.; İstanbullu Tosun, A.; Jayaprakash, V.; Tuyun, A.F. Exploring isoquinolinequinones as promising antibacterial agents against methicillin-resistant Staphylococcus strains: synergistic effects with clinical antibiotics and antibiofilm activity. RSC Med. Chem. 2026, 17: 4502–4518. [CrossRef]
- Tuyun, A.F.; Yıldız, M.; Bayrak, N.; Yıldırım, H.; Mataracı Kara, E.; Jannuzzi, A.T.; Ozbek Celik, B. Discovery of a new family of heterocyclic amine linked plastoquinone analogs for antimicrobial evaluation. Drug Dev. Res. 2019, 80: 1098–1109. [CrossRef]
- Yıldırım, H.; Yıldız, M.; Bayrak, N.; Mataracı-Kara, E.; Özbek-Çelik, B.; Otsuka, M.; Fujita, M.; Radwan, M.O.; TuYuN, A.F. Natural-product-inspired design and synthesis of thiolated coenzyme Q analogs as promising agents against Gram-positive bacterial strains: insights into structure-activity relationship, activity profile, mode of action, and molecular docking. RSC Adv. 2022, 12: 20507–20518. [CrossRef]
- Andrades-Lagos, J.; Campanini-Salinas, J.; Pedreros-Riquelme, A.; Mella, J.; Choquesillo-Lazarte, D.; Zamora, P.P.; Pessoa-Mahana, H.; Burbulis, I.; Vásquez-Velásquez, D. Design, synthesis, and structure-activity relationship studies of new quinone derivatives as antibacterial agents. Antibiotics 2023, 12: 1065. [CrossRef]
- Mataracı-Kara, E.; Bayrak, N.; Yıldız, M.; Yıldırım, H.; TuYuN, A.F. Exploring the relationships between structure and antimicrobial potency of quinolinequinones. Antibiotics 2022, 11: 1397. [CrossRef]
- Qun, T.; Zhou, T.; Hao, J.; Wang, C.; Zhang, K.; Xu, J.; Wang, X.; Zhou, W. Antibacterial activities of anthraquinones: structure-activity relationships and action mechanisms. RSC Med. Chem. 2023, 14: 1446–1471. [CrossRef]
- Zhang, M.; Hu, J.; Wang, Y.; Luo, L.; Yuan, G. α-Mangostin competing the menaquinone-binding sites of NDH-2 to block the electron transfer at the quinone pool of Staphylococcus aureus. Antibiotics 2026, 15: 509. [CrossRef]
- Lencina, A.M.; Franza, T.; Sullivan, M.J.; Ulett, G.C.; Ipe, D.S.; Gaudu, P.; Gennis, R.B.; Schurig-Briccio, L.A. Type 2 NADH dehydrogenase is the only point of entry for electrons into the streptococcus agalactiae respiratory chain and is a potential drug target. mBio 2018, 9: e01034–18. [CrossRef]
- Kawamukai, M. Biosynthesis and applications of prenylquinones. Biosci Biotechnol Biochem. 2018, 82: 963–977. [CrossRef]
- Schoepp-Cothenet, B.; Lieutaud, C.; Baymann, F.; Verméglio, A.; Friedrich, T.; Kramer, D.M.; Nitschke, W. Menaquinone as pool quinone in a purple bacterium. Proc. Natl. Acad. Sci. U.S.A. 2009, 106: 8549–8554. [CrossRef]
- Dahlem Junior, M.A.; Nguema, Edzang, R.W.; Catto, A.L.; Raimundo, J.M. Quinones as an efficient molecular scaffold in the antibacterial/antifungal or antitumoral arsenal. Int. J. Mol. Sci. 2022, 23: 14108. [CrossRef]
- Yu, B.; Roy Choudhury, M.; Yang, X.; Benoit, S.L.; Womack, E.; Van Mouwerik Lyles, K.; Acharya, A.; Kumar, A.; Yang, C.; Pavlova, A.; et al. Restoring and enhancing the potency of existing antibiotics against drug-resistant gram-negative bacteria through the development of potent small-molecule adjuvants. ACS Infect. Dis. 2022, 8: 1491–1508.
- Stompor-Gorący, M. The health benefits of emodin, a natural anthraquinone derived from rhubarb-a summary update. Int. J. Mol. Sci. 2021, 22: 9522. [CrossRef]
- Xu, X.; Xu, L.; Yuan, G.; Wang, Y.; Qu, Y.; Zhou, M. Synergistic combination of two antimicrobial agents closing each other’s mutant selection windows to prevent antimicrobial resistance. Sci Rep. 2018, 8: 7237. [CrossRef]
- Toyokawa, M.; Asari, S.i, Horikawa, M.; Tsukamoto, H.; Tahara, K.; Sunada, A.; Amino, N. Problems in the checkerboard method using serial twofold dilutions. Chemotherapy 1994, 42: 841–848.
- CLSI. Methods for Dilution Antimicrobial Susceptibility Tests for Bacteria That Grow Aerobically, 10th ed.; CLSI Document M07-A10; Clinical and Laboratory and Standards Institute: Wayne, PA, USA, 2015.
Figure 1.
18 quinones rationally selected for establishing the antibacterial QSARs of quinones.
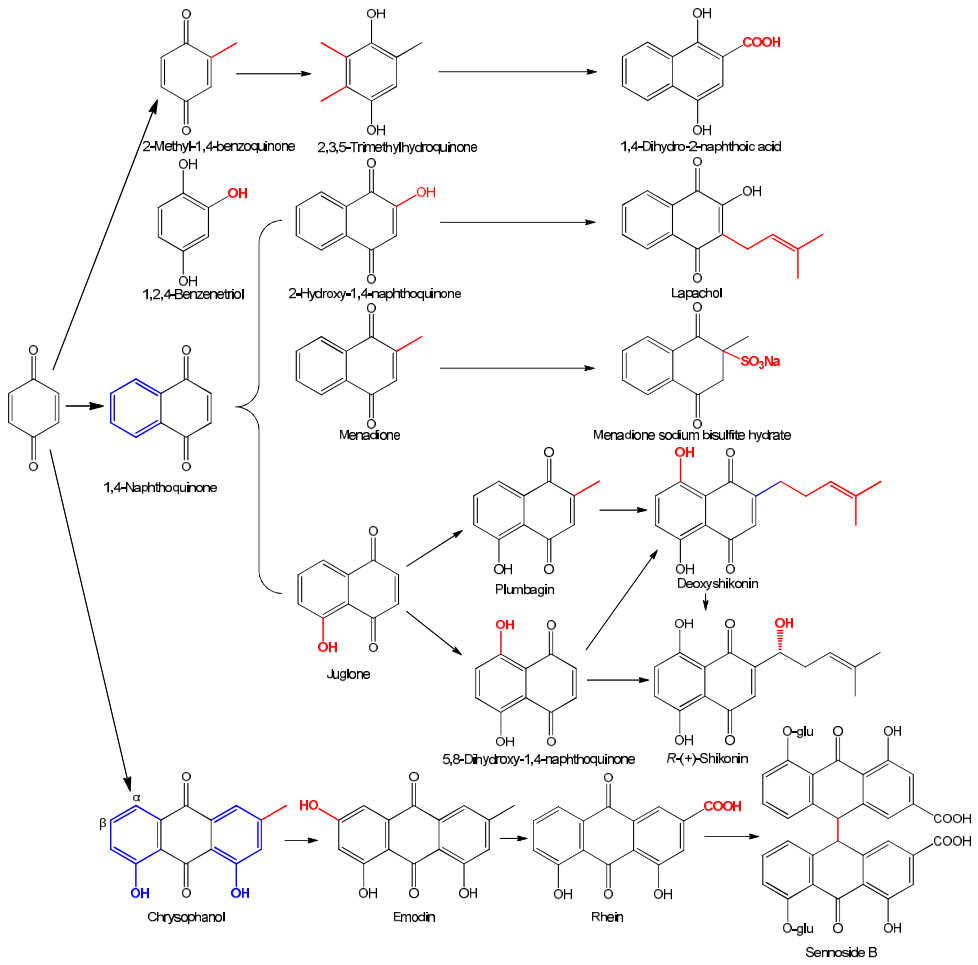
Figure 2.
key scaffold of naphthoquinones against C. albicans and E. coli.
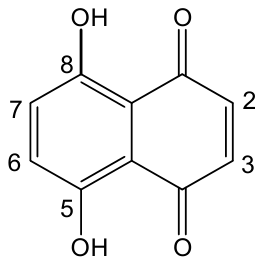
Figure 3.
Radar chart showing the FICI (fractional inhibitory concentration index) values of eleven quinones in combination with eleven antibiotics against S. aureus. FICI ≤ 0.5 indicates synergy.
Figure 3.
Radar chart showing the FICI (fractional inhibitory concentration index) values of eleven quinones in combination with eleven antibiotics against S. aureus. FICI ≤ 0.5 indicates synergy.
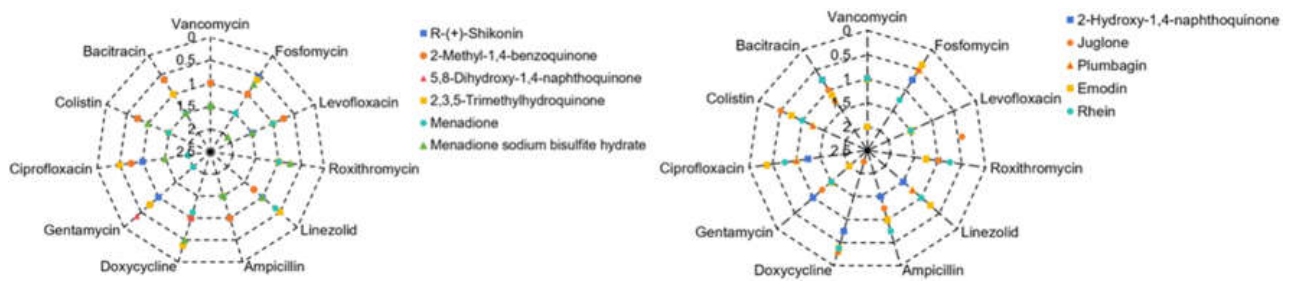
Figure 4.
Radar chart showing the FICI values of ten quinones in combination with eleven antibiotics against E. coli. FICI ≤ 0.5 indicates synergy.
Figure 4.
Radar chart showing the FICI values of ten quinones in combination with eleven antibiotics against E. coli. FICI ≤ 0.5 indicates synergy.
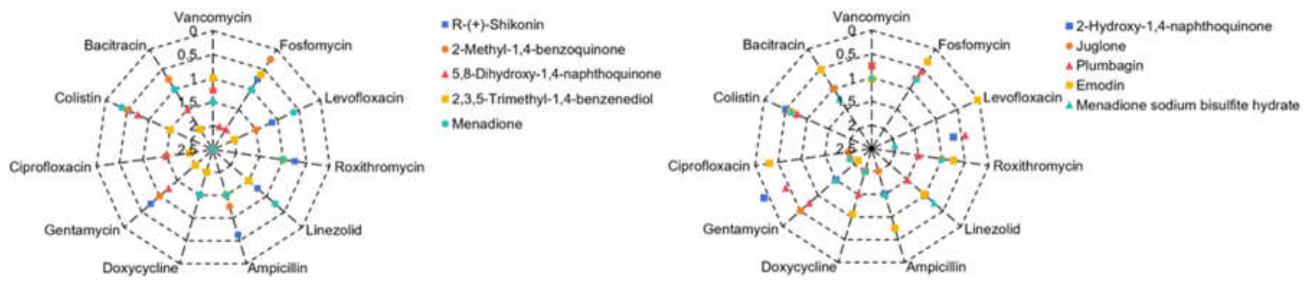

Table 1.
The MICs of 18 quinones against S. aureus, E. coli and C. albicans, respectively.a.
| Quinones b | Name | MICs(μg/mL) | ||
|---|---|---|---|---|
| S. aureus ATCC 25923 | E. coli ATCC 25922 | C. albicans CMCC 98001 | ||
| 1 | R-(+)-Shikonin | 16 | 512~1024 | 1~2 |
| 2 | Plumbagin | 8 | 32~64 | 0.50~1 |
| 3 | Juglone | 8 | 8~16 | 2~4 |
| 4 | 2-Hydroxyl-1,4-naphthoquinone | 512 | 256 | 256 |
| 5 | 5,8-Dihydroxyl-1,4-naphthoquinone | 8 | 4 | 0.25 |
| 6 | Emodin | 256 | 1,024~2,048 | 64 |
| 7 | Menadione | 4~8 | 32~64 | 8 |
| 8 | 2-Methyl-1,4-benzoquinone | 32 | 64 | 16 |
| 9 | Menadione sodium bisulfite hydrate | 8~16 | 256~512 | 128 |
| 10 | 2,3,5-Trimethylhydroquinone | 16~32 | 64 | 16 |
| 11 | Rhein | 8 | 2,048~4096 | 256 |
| 12 | Chrysophanol | 4096 | 1024 | >1024 |
| 13 | Sennoside B | >1024 | >1024 | >1024 |
| 14 | 1,4-Naphthoquinone | 4~8 | 32 | 32~64 |
| 15 | Deoxyshikonin | 8 | 1024 | 512 |
| 16 | Lapachol | 1024 | >1024 | >1024 |
| 17 | 1,4-Dihydroxy-2-naphthoic acid | 32 | 8 | 64 |
| 18 | 1,2,4-benzenetriol | 128 | 128 | 256~512 |
a : The MICs of quinones 7, 8 and 10 against S. aureus were reported in our previous work [20]. b : Quininones 1 to 8, and 11 to 17 existed in some plants, and 9 and 10 are synthetic products.
Table 2.
The MICs of eleven clinical antibiotics with various antimicrobial mechanisms against S. aureus and E. coli, respectively.
Table 2.
The MICs of eleven clinical antibiotics with various antimicrobial mechanisms against S. aureus and E. coli, respectively.
| Antibacterial agents | S. aureus ATCC 25923 | E. coli ATCC 25922 | ||
|---|---|---|---|---|
| The subcellular structure and macromolecular biosynthesis pathway of action | MIC (μg/mL) |
The subcellular structure and macromolecular biosynthesis pathway of action | MIC (μg/mL) |
|
| Ampicillin | Binding to penicillin-binding proteins, and inhibiting peptidoglycan biosynthesis of the bacterial cell wall [21] | 0.125 | Same to S. aureus | 2~4 |
| Vancomycin | Targeting cell wall; inhibiting peptidoglycan synthesis [22] | 1 | Difficult to reach the target site of action | 256 |
| Bacitracin | Targeting cell membrane and inhibiting the biosynthesis of peptidoglycan in cell wall [23] | 16 | Difficult to reach the target site of action | 1,024 |
| Colistin | Targeting cell membrane, and increasing membrane permeability [24] | 256 | Targeting cytoplasmic membrane, increasing permeability and destabilizing the cell membrane [24] | 2 |
| Fosfomycin | Targeting cytoplasmic MurA; inhibiting cell-wall peptidoglycan synthesis [25] | 64~256 | Same to S. aureus | 128 |
| Gentamicin | Targeting 30S ribosomal subunit; inhibiting protein synthesis; altering membrane permeability and membrane protein function [26,27] | 1 | Same to S. aureus | 8 |
| Doxycycline | Targeting 30S ribosomal subunit and inhibiting protein synthesis [28] | 0.5 | Same to S. aureus | 0.5 |
| Roxithromycin | Targeting 50S ribosomal subunit and inhibiting protein synthesis [29] | 1 | unclear | 128 |
| Linezolid | Targeting 50S ribosomal subunit and inhibiting protein synthesis [30] | 4 | Difficult to reach the target site of action | 256 |
| Levofloxacin | Targeting on topoisomerase IV in nuclear region [31] | 0.25 | Targeting on DNA gyrase in nuclear region [31] | 0.125 |
| Ciprofloxacin | Targeting on topoisomerase IV in nuclear region [31] | 1~2 | Targeting on DNA gyrase in nuclear region [31] | 0.0078125 |
Table 3.
Correlation and regression analyses for the lipophilicity parameter LogP or LogD7.40 (x) and the antimicrobial MICs (y) of quinones against three test microorganisms a.
Table 3.
Correlation and regression analyses for the lipophilicity parameter LogP or LogD7.40 (x) and the antimicrobial MICs (y) of quinones against three test microorganisms a.
| Equation Number b | Dataset size (n) | Parameters c (x) |
Regression Equation (r) d | Critical values of r (n-2) e | Coefficient of determination (R2) |
|---|---|---|---|---|---|
| (1) | 17 | LogP | y = −60.056x4 + 644.06x3 − 1800.7x2 + 959.26x + 1313 (0.419) | 0.482 (0.606) | 0.18 |
| (2) | y = 13.885x3 − 32.859x2 + 4.6274x + 82.693 (0.426) | 0.482 (0.606) | 0.18 | ||
| (3) | 17 | LogD7.40 | y = 2.2843x3 + 81.888x2 + 278.78x + 596.12 (0.248) | 0.482 (0.606) | 0.06 |
| (4) | y = 23.684x2 + 89.716x + 86.946 (0.280) | 0.482 (0.606) | 0.08 | ||
| (5) | 16 | LogP | y = 10.228x5 − 92.609x4 + 351.86x3 − 576.17x2 − 55.643x + 1058.3 (0.972) | 0.497(0.623) | 0.95 |
| (6) | y = 12.269x4 − 76.682x3 + 141.62x2 − 102.48x + 117.87 (0.972) | 0.497(0.623) | 0.94 | ||
| (7) | 16 | LogD7.40 | y = −3.4185x4 + 23.266x3 + 116.68x2 − 108.37x + 973.53 (0.410) | 0.497(0.623) | 0.168 |
| (8) | y = 23.129x2 + 62.52x + 169.87 (0.405) | 0.497(0.623) | 0.16 | ||
| (9) | 15 | LogP | y = 11.09x5 − 168.64x4 + 881.68x3 − 1659.3x2 + 244.23x + 1582.9 (0.613) | 0.514 (0.641) | 0.38 |
| (10) | y = −4.7256x4 + 48.072x3 − 121.55x2 + 2.1398x + 203.21 (0.574) | 0.514 (0.641) | 0.33 | ||
| (11) | 15 | LogD7.40 | y = 34.487x3 − 20.722x2 − 533.69x + 936.82 (0.708) | 0.514 (0.641) | 0.50 |
| (12) | y = 6.4235x3 + 1.2603x2 − 96.466x + 151.5 (0.701) | 0.514 (0.641) | 0.49 |
a: The antimicrobial activity (y) is the MICs of a certain quinone against test microorganisms, and the investigated range of LogP and LogD7.40 are −0.64 to 5.29 and −4.14 to 4.52, respectively. b: Equations (1) to (4) for S. aureus, (5) to (8) for E. coli, and (9) to (12) for C. albicans. c: The lipophilicity parameter (x) was calculated using software ACD/Labs 6.0. d: Equations with white background shading, MIC (μM); those with light green one, MIC (μg/mL); r, correlation coefficient. e: The significant level α was set as 0.05 (0.01).
Table 4.
Correlation and regression analyses for the LogP (x) and MIC (y) of quinones against E. coli a.
Table 4.
Correlation and regression analyses for the LogP (x) and MIC (y) of quinones against E. coli a.
| Equation Number b | Dataset size (n) | Regression Equation c | R2 | Radj2 | Q2 | Predicted ranges x |
Predicted MICmin (LogP) d |
|---|---|---|---|---|---|---|---|
| (5) | 16 | y = 10.228x5 − 92.609x4 + 351.86x3 − 576.17x2 − 55.643x + 1058.3 | 0.9453 | 0.9179 | 0.7287 | [−0.64, 5.29] | 117.34(2.7905) |
| (13)c | 16 | y = 0.9715x5 + 21.2196x4 – 100.8301x3 + 793.5234 | 0.9432 | 0.9290 | 0.8252 | [−0.64, 5.29] | 25.30 (3.0362) |
| (14) | 14 | y = 33.83x4 − 159.22x3 + 105.14x2 − 11.056x + 678.89 | 0.9411 | 0.9149 | 0.8253 | [−0.64, 5.29] | 32.95 (3.0251) |
| (15) | 14 | y = 33.5086x4 – 155.5667x3+ 92.5367x2 +683.1582 | 0.9411 | 0.9234 | 0.8374 | [−0.64, 5.29] | 29.55 (3.0256) |
| (16) | 13 | y = 184.1x5 − 2736.3x4 + 15273x3 − 39056x2 + 44709x − 17302 | 0.9627 | 0.9343 | −0.7343 | [0.86, 5.29] | 25.40 (2.2939) |
| (17) | 13 | y = 31.7978x4 − 134.0341x3 + 155.8403x + 596.7171 | 0.9401 | 0.9201 | 0.8278 | [0.86, 5.29] | 20.54 (3.0277) |
a: The antimicrobial activity (y) is the MIC (μM) of a certain quinone against E. coli; the LogP (x) is calculated using software ACD/Labs 6.0; R2, coefficient of determination; Radj2, adjusted R2; Q2, leave-one-out cross-validated coefficient of determination. b: Equations (5) and (13) from the sixteen datasets consisting of thirteen quinones, two hydroquinones 17 and 18, and a sodium bisulfite derivative quinone 9, and; Equations (14) and (15) from those of thirteen quinones and quinone 9, while (16) and (17) only from the dataset of thirteen quinones. c: P-values for each model term were provided in Table S1 of supplementary files. d: MICmin, the minimum MIC value predicted by the corresponding equation, and numbers in parentheses are the corresponding Log P value.
Table 5.
Correlation and regression analyses for the reduction potential E(Q/Q•‾)7 vs NHE/mV (x) and the MIC (y) of quinones against three test microorganisms a.
Table 5.
Correlation and regression analyses for the reduction potential E(Q/Q•‾)7 vs NHE/mV (x) and the MIC (y) of quinones against three test microorganisms a.
| Equation Number | Pathogenic strains | Dataset size (n) b | Regression Equation c (r) d | R2 | Radj2 | Q2 | Predicted ranges x |
Predicted MICmin e |
|---|---|---|---|---|---|---|---|---|
| (18) | S. aureus | 7 | y = 1.1696×10−7x4 + 1.8139x + 222.4834 (0.9998) | 0.9997 | 0.9995 | 0.9079 | [−415, 23] | 8.76 (−157.0979) |
| (19) c | 10 | y = 1.9849×10–7x4 + 4.2449×10–5x3 + 86.6217 (0.9972) | 0.9945 | 0.9929 | 0.9863 | [−415, 99] | 42.83 (−160.3928) | |
| (20) | E. coli | 7 | y = 0.0168x2 + 4.3607x + 385.0734 (0.9911) | 0.9823 | 0.9735 | 0.7628 | [−415, 23] | 102.89 (−129.4227) |
| (21) | 9 | y = −7.3067×10–5x3 − 0.0247x2 + 499.4552 (0.9027) | 0.8148 | 0.7531 | 0.6063 | [−415, 99] | 82.40 (−225.1660) | |
| (22) | C. albicans | 7 | y = − 1.2558×10−10x5 + 0.4347x + 104.3342 (0.9908) | 0.9816 | 0.9724 | 0.8347 | [−415, 23] | 47.93(−162.2051) |
| (23) | 8 | y = −1.4241×10−10x5 − 0.0022x2 + 93.8507 (0.9904) | 0.9808 | 0.9731 | 0.8158 | [−415, 23] | 49.78 (−183.1927) |
a: The antimicrobial activity (y) is the MIC (μM) of a certain quinone against test microorganisms, and the reduction potentials E(Q/Q•‾)7 vs NHE (x) are obtained from previous reports [32,33]; R2, coefficient of determination; Radj2, adjusted R2; Q2, leave-one-out cross-validated coefficient of determination. b: The MICs of additional 3, 2 and 1 data for Equations (19), (21) and (23), respectively compared to Equations (18), (20) and (22), were retrieved from literature reports [34,35,36,37,38]. c: P-values for each model term were provided in Table S1 of supplementary files. d: r, correlation coefficient; the critical values of r (5), r (6), r (7) and r (8) are respectively 0.754 (0.875), 0.707 (0.834), 0.666(0.798), 0.632 (0.765) when the significant level α was set as 0.05 (0.01).e: MICmin, the minimum MIC predicted by the corresponding equation, and numbers in parentheses are the corresponding E(Q/Q•‾)7 vs NHE (mV).
Table 6.
Regression analyses for the antimicrobial MIC (y) to the reduction potential E(Q/Q•‾)7 vs NHE/mV (x1) and LogP (x2) values of quinones a.
Table 6.
Regression analyses for the antimicrobial MIC (y) to the reduction potential E(Q/Q•‾)7 vs NHE/mV (x1) and LogP (x2) values of quinones a.
| Equation Number | Pathogenic strains | Dataset size (n) b | Regression Equation c | R2 | Radj2 | Q2 | Predicted ranges x1, x2 |
Predicted MICmin (E, LogP) d |
|---|---|---|---|---|---|---|---|---|
| (24) | S. aureus | 7 | y = 0.0322x12 + 4.7238x1x2 + 171.1270x22 + 20.7506 | 0.9998 | 0.9996 | 0.8641 | [–415, 23], [0.86, 2.45] | 8.18 (−179.6836, 2.4500) |
| (25)c | 10 | y = 1.0816×10−7x14 + 0.6390x1x2 + 1.6273x24 + 134.0748 | 0.9967 | 0.9950 | 0.9876 | [–415, 99], [0.27, 2.63] | 12.40 (−154.0031, 2.4727) | |
| (26) | E. coli | 7 | y = 7.4989x24 + 3.3083x1x2 + 0.0118x12x2 + 420.6904 | 0.9801 | 0.9603 | −11.033 | [–415, 23], [0.86, 2.45] | 74.97 (−140.7481, 1.9799) |
| (27) | 9 | y = 5.1143×10−8x14 + 0.6860x1x2 + 394.1830 | 0.7818 | 0.7090 | 0.6863 | [–415, 99], [0.27, 2.63] | 139.82 (−201.7838, 2.4500) | |
| (28) | C. albicans | 7 | y = − 2.3495×10−5x13 + 0.5224x1x2 + 127.0796 | 0.9851 | 0.9777 | 0.9615 | [–415, 23], [0.86, 2.45] | 12.09 (−134.7573, 2.4500) |
| (29)c | 8 | y = − 2.3498×10−5x13 + 0.5391x1x2 + 136.9267 | 0.9846 | 0.9784 | 0.9660 | [–415, 23], [0.86, 2.63] | 16.39 (−136.8831, 2.4500) |
a: The antimicrobial activity (y) is the MIC (μM) of a certain quinone against test microorganisms; the reduction potential E(Q/Q•‾)7 vs NHE (x1) was obtained from previous reports [32,33], and the LogP (x2) was calculated using software ACD/Labs 6.0; R2, coefficient of determination; Radj2, adjusted R2; Q2, leave-one-out cross-validated coefficient of determination. b: The MICs of additional 3, 2 and 1 data for Equations (25), (27) and (29), respectively compared to Equations (24), (26) and (28), were retrieved from literature reports [34,35,36,37,38]. c: P-values for each model term were provided in Table S1 of supplementary files. d: MICmin, the MICmin value predicted by the corresponding equation, and numbers in parentheses are the corresponding E(Q/Q•‾)7 vs NHE/mV (x1) and LogP (x2) values.
Disclaimer/Publisher’s Note: The statements, opinions and data contained in all publications are solely those of the individual author(s) and contributor(s) and not of MDPI and/or the editor(s). MDPI and/or the editor(s) disclaim responsibility for any injury to people or property resulting from any ideas, methods, instructions or products referred to in the content. |
© 2026 by the authors. Licensee MDPI, Basel, Switzerland. This article is an open access article distributed under the terms and conditions of the Creative Commons Attribution (CC BY) license (http://creativecommons.org/licenses/by/4.0/).
Copyright: This open access article is published under a Creative Commons CC BY 4.0 license, which permit the free download, distribution, and reuse, provided that the author and preprint are cited in any reuse.