

Submitted:
29 October 2026
Posted:
30 October 2026
You are already at the latest version
Abstract
Background: A dual-axis organization of non-alveolar macrophages—scar-associated SPP1+ and tissue-resident-like FOLR2+ populations—was recently delineated in idiopathic pulmonary fibrosis (IPF), but their functions and niches remain unresolved. Methods: We integrated full-transcriptome re-clustering of the GSE135893 myeloid compartment, independent replication (GSE136831), and GeoMx spatial profiling of bronchiolitis obliterans and fibrosing ILD lesions (GSE316672, GSE255174). Results: Two IPF-emergent entities were confirmed and first systematically quantified: SPP1+/TREM2+ scar-associated macrophages (97% IPF-derived; 4.0% to 30.7% of macrophages) and the FOLR2+/CD163+/SLC40A1+ iron-handling population (95% IPF; 11.9% to 19.0%). Both axes replicated in the Adams cohort (donor-level p = 1.2 × 10⁻⁵ and 8.2 × 10⁻¹¹). Spatial profiling revealed a core-and-ring architecture in BO lesions (SPP1+/TREM2+ luminal core; MCL1-high scavenger ring). Monocyte flux correlated with fibroblast apoptotic priming (rho = +0.54; nominal p = 0.045). No canonical M1/M2a enrichment was detected; the FOLR2+ efferocytosis arm was MERTK/GAS6-dominant across cohorts. Conclusion: The fibrotic lung’s dual-axis macrophage architecture is functionally attributed and spatially resolved, with implications for combination targeting.
Keywords:
idiopathic pulmonary fibrosis
; macrophages
; SPP1
; FOLR2
; single-cell RNA sequencing
1. Introduction
1.1. Background
Idiopathic pulmonary fibrosis (IPF), the most severe and common idiopathic form of pulmonary fibrosis, is a progressive interstitial lung disease characterized by extracellular matrix accumulation, destruction of alveolar architecture, and death from respiratory failure. Current antifibrotic therapies slow decline in forced vital capacity but neither halt nor reverse established fibrosis [5,6]. Macrophages and monocytes are abundant in the fibrotic lung and are increasingly recognized as central orchestrators of fibrotic remodeling rather than passive bystanders [7]. In murine models, monocyte-derived alveolar macrophages drive fibrosis and persist within the injured lung, whereas tissue-resident alveolar macrophages are relatively dispensable [8], positioning discrete monocyte/macrophage states as plausible determinants of disease severity in human fibrosis.
Single-cell RNA sequencing (scRNA-seq) of explanted human lungs has refined this picture: a proliferating SPP1/MERTK-co-expressing macrophage population expands specifically in IPF [9], with related SPP1-expressing states identified in fibrotic lung [2,10,11]; TREM2+/CD9+ scar-associated macrophages accumulate within the fibrotic niche of cirrhosis [12]; and a broadly fibrogenic SPP1+ subset is induced by type 3 inflammation across organs [13], together suggesting a convergent SPP1+ scar-associated program in organ fibrosis. These insights sit within a broader single-cell cartography of the human lung and fibrotic interstitial lung disease [14,15]. Most recently, Mannes et al. identified CMKLR1 as a marker of monocyte-derived macrophages enriched in IPF [1], within a broader emergence of non-alveolar SPP1+ and FOLR2+ macrophage programs in fibrotic lung whose functional roles and spatial organization remain uncharacterized.
1.2. Research Gaps
Building on the monocyte-fed emergence of SPP1+ and FOLR2+ macrophage programs reported in fibrotic lung [1], we here propose and test a dual-axis functional model. What remains unresolved is functional attribution: whether the FOLR2+ axis executes a discrete iron-handling/efferocytosis program distinct from the scar-associated logic of the SPP1+ axis, how abundant each entity is within the whole macrophage compartment, and how each relates to the survival phenotype of fibrotic stromal cells, gaps perpetuated by coarse clustering strategies that obscure rare populations.
FOLR2+ tissue-resident macrophages are conserved across organs and species [16] and have been characterized in breast cancer [17] and in tertiary lymphoid structures across several cancer types [18]. Their scavenger, iron-handling phenotype (CD163, MERTK, SLC40A1) suggests roles in efferocytosis and tissue homeostasis. Folate-receptor-based imaging of macrophages has been explored in interstitial lung disease [19], and the FOLR2+ axis is overabundant in IPF [1]; yet this lineage has not been systematically quantified or functionally annotated in pulmonary fibrosis.
The spatial arrangement of macrophage states within fibrotic lesions remains unresolved: whether SPP1+ and scavenger-phenotype macrophages intermingle or occupy distinct microanatomical niches, and which niches carry survival signals relevant to myofibroblast persistence [20,21], has not been directly addressed in human disease.
The M1/M2 framework has been formally criticized as inadequate for tissue macrophages [22], and single-cell analyses of fibrotic lung have not recovered canonical M1/M2 states, resolving instead a transitional profibrotic macrophage spectrum [23]. In IPF, an IL-4-driven M2a program is frequently assumed from murine and allergic-disease data [24], yet whether IL-4 and canonical M1 or M2a effectors are actually expressed in the human IPF lung has rarely been tested directly.
1.3. Contributions
To address these gaps, we integrated single-cell RNA-seq of IPF and control lungs (GSE135893 [2]), GeoMx spatial transcriptomics of obliterative bronchiolitis lesions (GSE316672 [3]), and regional GeoMx profiling of fibrosing interstitial lung disease (GSE255174 [4]), combining full-transcriptome re-clustering with spatial profiling and donor-level correlation analyses. Our contributions are fourfold. First, re-clustering a 20,000-cell subsample of 49,388 lung myeloid cells resolves 12 clusters, including two discrete, low-abundance IPF-emergent entities missed by conventional abundance-driven annotation: SPP1+/TREM2+ scar-associated macrophages (97% of cells from IPF donors) and a FOLR2+/CD163+/SLC40A1+ iron-handling, efferocytosis-oriented population (95% IPF) functionally annotated here. Second, spatial transcriptomics of obliterative bronchiolitis reveals a stereotyped core-and-ring architecture: an SPP1+/TREM2+ luminal core surrounded by a CD163+/MERTK+ scavenger ring expressing the highest MCL1 signal of any Middle-stage region [21,25]. Third, across IPF donors, the monocyte fraction (but not the macrophage or SPP1+ fractions) correlates with the apoptosis-primed fibroblast fraction (Spearman rho=+0.54, p=0.045, n=14; nominal, not surviving Bonferroni correction across four pre-specified coupling scores, and therefore hypothesis-generating). Fourth, canonical M1 effectors NOS2 and IL12B are not detected (0.0% expressing), IL4 is detected in only 0.01% of all cells, and the M2a marker CCL17 is lower, not higher, in IPF than in control macrophages, corroborating single-cell consensus [23]. This study analyzes the myeloid compartment of the GSE135893 atlas [2] and two spatial cohorts (GSE316672, GSE255174). Cohort definitions follow the source atlas; all results reported here are specific to the myeloid compartment and the spatial analyses performed with the same pipeline. Adams (GSE136831) replication is restricted to the myeloid compartment.
2. Methods
2.1. Single-Cell RNA-Sequencing Data Acquisition and Quality Control
Single-cell RNA-sequencing (scRNA-seq) data were obtained from the atlas of Habermann et al. [2] (GEO accession GSE135893), accessed through the UCSC Cell Browser mirror “lung-pf-control” (import and quality-control details in Supplementary Methods). The full atlas comprises 114,396 cells, of which 57,682 derive from 19 donors with idiopathic pulmonary fibrosis (IPF) and 31,644 from 12 control donors. Cells annotated as nonspecific interstitial pneumonia, chronic hypersensitivity pneumonitis, sarcoidosis, or unclassifiable interstitial lung disease were excluded from all primary disease contrasts. The myeloid compartment, defined by the curated labels Macrophages (n=38,928), Monocytes (n=6,765), Proliferating Macrophages (n=1,563) and conventional dendritic cells (cDCs; n=2,132), comprised 49,388 cells. All samples were collected before the COVID-19 pandemic.
2.2. Normalization and Scaling
UMI counts were normalized to counts per 10,000 (CP10K) per cell and log-transformed as log1p(CP10K); for cross-compartment comparisons and module scoring, values were z-scored per gene across all 114,396 atlas cells.
2.3. Fine Clustering
Clustering was performed with a custom Python pipeline implementing spectral community detection on a nearest-neighbor graph, analogous to Seurat [26] or Scanpy [27] workflows (implementation details in Supplementary Methods). Highly variable genes (HVGs) were selected by dispersion (top 2,500); dimensionality was reduced by principal component analysis (PCA; 25–30 components); a symmetric 15-nearest-neighbor graph was constructed in PCA space; and spectral clustering with k-means assignment yielded 12 clusters. Myeloid clustering used a random 20,000-cell subsample; cluster labels were characterized post hoc with curated marker panels and cross-tabulated against original cell-type annotations. Fibroblast-lineage cells (n=3,605) were clustered separately, yielding 8 clusters (FC0–FC7; Figure 1e–h).
2.4. Module Scores and Pathway-Specificity Testing
Module scores were computed as the mean of z-scored, log-normalized expression across a predefined gene set. Three macrophage program arms were defined a priori, an iron-handling arm, an M2 arm, and a pro-inflammatory arm (full gene lists in Supplementary Methods); CD163 was assigned to the iron-handling arm rather than the M2 arm, reflecting its function as a haemoglobin–haptoglobin scavenger receptor.
Hypoxia signaling was assessed using the Hallmark hypoxia gene set and a curated set of 29 canonical hypoxia response element (HRE)-bound direct HIF-1 targets. Pathway specificity was tested with an expression-matched permutation test (200 random gene sets; details in Supplementary Methods).
Fibroblast primed state: cells scoring above the fibroblast-compartment population median for both pro-apoptotic and anti-apoptotic BCL-2 family module scores (double-high; gene lists in Supplementary Methods), following the mitochondrial-priming concept [25]. The primed-fibroblast construct was computed with the same pre-specified module definition (donor-level values 27.0% ± 9.2% versus 17.0% ± 11.6%, p = 0.023) and is used here solely as a donor-level coupling variable.
2.5. Donor-Level Pseudobulk Analysis
To avoid treating cells as independent observations, donor-level pseudobulk fractions were computed for all analyses of cell-type abundance. Fibroblast-lineage fractions were computed for donors with ≥5 fibroblast-lineage cells, and myeloid fractions for donors with ≥50 myeloid cells. Associations between donor-level fractions were assessed with Spearman rank correlations; between-group comparisons used two-sided Mann–Whitney U tests.
2.6. Ligand–Receptor Analysis
Candidate myeloid-to-fibroblast signaling was evaluated by computing mean z-scored expression of curated ligand–receptor pairs (SPP1–CD44, IL1B–IL1R1, TNF–TNFRSF1A, OSM–OSMR, CCL2–CCR2, CSF1–CSF1R, TGFB1–TGFBR, MIF–CD74) separately in myeloid cells (ligands) and fibroblast-lineage cells (receptors), stratified by diagnosis. Pairs in which the receptor was undetectable in fibroblasts were interpreted as non-signaling or autocrine and are reported as such.
2.7. Spatial Transcriptomic Validation
Two GeoMx whole-transcriptome atlas (WTA) datasets [28] were analyzed (parsing details in Supplementary Methods): GSE316672 (bronchiolitis obliterans (BO) after hematopoietic stem-cell transplantation [3]), a quantile-normalized expression matrix (92 regions of interest (ROIs) from 3 BO and 2 control patients, 10,651 genes) with sample metadata, and GSE255174 (fibrosing interstitial lung diseases [4]; 179 ROIs). GSE316672 ROIs carry region, stage (1.Normal, 2.Early, 3.Middle, 4.Late) and anatomical place (inside/outside/proximal/distal) annotations; the foam-cell region was defined as the union of inside (n=20) and outside (n=13) ROIs. Region-level means were compared by Mann–Whitney U tests.
2.8. Independent-Cohort Replication and Bootstrap Cluster Stability
For independent-cohort replication, the Adams et al. IPF/control scRNA-seq cohort (GSE136831) was accessed through the Human Lung Cell Atlas (HLCA) [41], comprising 307,650 cells from Adams et al.; log-normalized expression values were used as distributed, and a gene was considered detected in a cell when its value exceeded 0. The myeloid compartment (macrophages, monocytes, proliferating macrophages and dendritic cells by HLCA annotation) comprised 99,744 IPF and 73,209 control myeloid cells; donor-level analyses were restricted to donors with ≥50 myeloid cells (32 IPF and 27 control donors), and donors with chronic obstructive pulmonary disease (COPD) were excluded. Detection fractions were compared between diagnoses with Fisher’s exact test at the cell level; donor-level fractions were compared with Welch’s t-test, with Cohen’s d as effect size. The FOLR2+/CD163+/SLC40A1+ triple-positive population was enumerated by joint detection of the three markers. Cluster stability of the discovery-cohort myeloid clustering was assessed with 20 bootstrap replicates (resampling cells with replacement and re-running kNN-graph construction and spectral clustering on the fixed 25-component PCA embedding; highly-variable-gene selection and PCA were not re-run); recovery of the disease clusters MC9 and MC6 was quantified by the Jaccard index between each bootstrap cluster and its reference cluster, and global partition agreement by the adjusted Rand index (ARI). Because bootstrap resampling draws cells, not donors, this assesses within-cohort clustering robustness and cannot test donor generality; for the donor-concentrated clusters (MC9, MC6), Jaccard values quantify stability on the contributing donors’ cells, not prevalence across IPF patients. A stricter sensitivity analysis — subsampling 80% of cells without replacement and re-running the full spectral pipeline (20 replicates) — recovered the global partition well (median ARI 0.931) but did not recover MC9 or MC6 as discrete clusters (median Jaccard 0.000 for both; Supplementary Table S6), so cluster discreteness is not supported by honest subsampling; the two axes are therefore presented as marker-defined extreme populations rather than discrete clusters.
2.9. Statistical Analysis
Unless otherwise stated, group comparisons used two-sided Mann–Whitney U tests, and correlations are Spearman rank coefficients. Multiple testing was controlled by Bonferroni correction within predefined analysis families. Contingency tables were analyzed with Yates-corrected chi-square tests, or Fisher’s exact test for small cell counts. Analyses were conducted in Python 3.12 using scipy.stats; a two-sided p<0.05 (after correction where applicable) was considered statistically significant. Effect-size and p-value reporting conventions are given in Supplementary Methods.
2.10. Data and Code Availability
All data analyzed here are publicly available under GEO accessions GSE135893, GSE136831, GSE316672 and GSE255174 and the Human Lung Cell Atlas [41]. Analysis code is available from the corresponding author upon request.
3. Results
3.1. Fine-Resolution Re-Clustering of the Lung Myeloid Compartment (Figure 1, Table 1)
To resolve myeloid heterogeneity beyond the four curated populations of the original atlas annotation (macrophages, monocytes, proliferating macrophages, cDCs; Section 2.1), we re-clustered a 20,000-cell subsample of the 49,388-cell myeloid compartment from GSE135893 (19 idiopathic pulmonary fibrosis (IPF) and 12 control donors) [2] using spectral clustering on the full transcriptome, yielding 12 clusters (MC0–MC11; Figure 1, Table 1) ranging from 57 (MC6) to 6,703 (MC4) cells. Diagnosis composition was strongly asymmetric: MC9 and MC6 were almost exclusively IPF-derived (97% and 95% IPF cells; MC9 concentrated in two high-contribution donors), MC0 and MC2 moderately IPF-enriched (64% and 69%), MC10 markedly control-enriched (96.6% non-IPF cells; 90.8% from control donors), and MC7 and MC3 control-enriched (83.8% and 78.0% non-IPF; 51.2% and 52.1% from control donors).
Figure 1.
Fine-resolution re-clustering of the lung myeloid and fibroblast compartments in IPF and control lungs. Spectral clustering of a 20,000-cell subsample of 49,388 myeloid cells from GSE135893 [2] resolved 12 clusters (MC0–MC11); fibroblast-lineage cells (n=3,605), clustered separately, resolved 8 clusters (FC0–FC7). (a) Cluster composition by curated cell type (macrophages, monocytes, proliferating macrophages, cDCs). (b) Fraction of IPF-derived cells within each cluster; the dashed line marks the overall IPF fraction of the subsample. MC9 (SPP1+ scar-associated) and MC6 (FOLR2+ iron-handling) are the most IPF-enriched clusters (97% and 95% IPF cells); MC10 is the most control-enriched (3.4% IPF cells). (c) Cluster sizes in the clustering subsample (57 to 6,703 cells). (d) Per-donor MC9 (SPP1+ scar-associated) fraction of sampled myeloid cells, shown as jittered donor-level points (one point per donor, colored by diagnosis); two IPF donors (F01302, 89.0%; F01303, 78.3%) carry the large majority of MC9 cells, whereas other IPF donors with ≥200 sampled myeloid cells show 0–0.5% and control donors are at or near zero. (e) Heatmap of z-scored percentages of expressing cells for 20 curated markers across the fibroblast clusters FC0–FC7. (f) Fraction of IPF-derived cells within the disease-relevant fibroblast clusters FC0, FC3, FC6 and FC7 (dashed line, 50%). (g) Sensitivity of the apoptotically primed fibroblast fraction to the primed-state threshold (percentile), shown separately for IPF and control fibroblasts. (h) Percentage of FC0 (PLIN2+ hypoxia–MCL1 hub) versus the mean of all other fibroblast clusters expressing MCL1, HIF1A and VEGFA. Panels (e)–(h) present the fibroblast re-clustering and primed-threshold analyses performed with the same pipeline, for context.
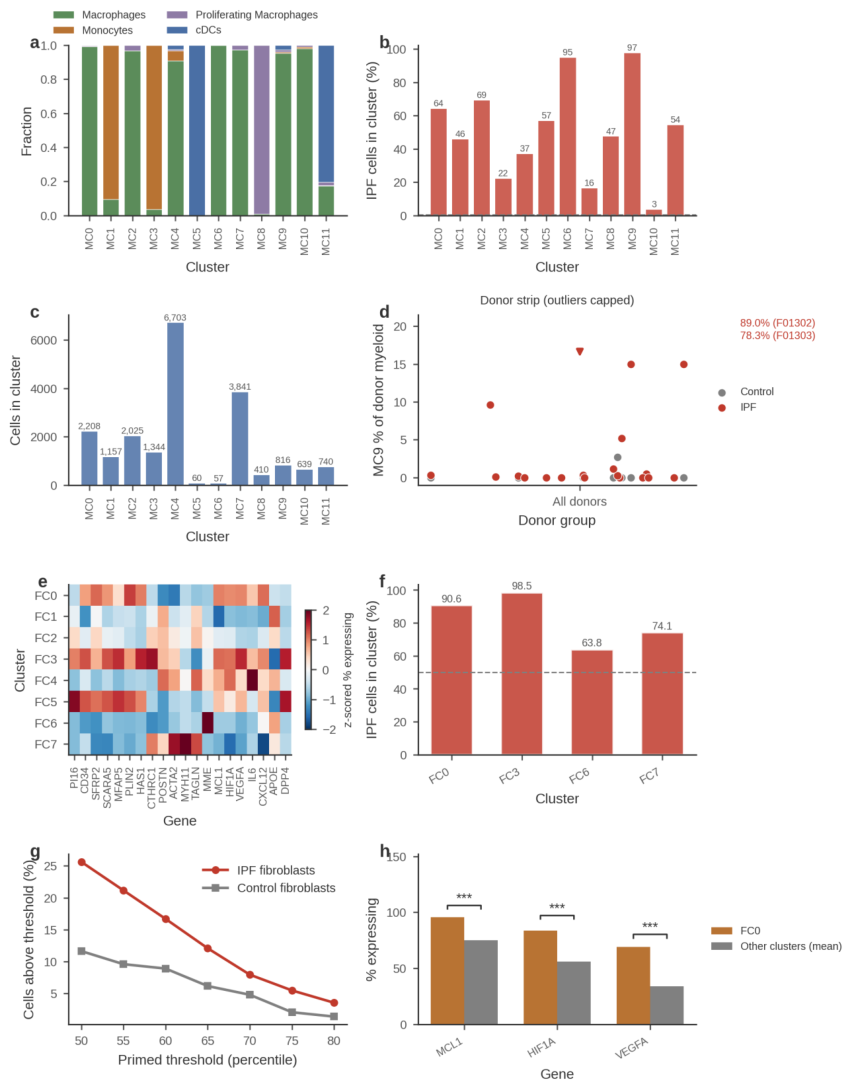

Table 1.
Identity, size, marker profile and diagnosis enrichment of the 12 myeloid clusters (MC0–MC11).
Table 1.
Identity, size, marker profile and diagnosis enrichment of the 12 myeloid clusters (MC0–MC11).
| Cluster | Curated type | n | Top markers (% expressing) | % IPF cells | Proposed identity |
|---|---|---|---|---|---|
| MC0 | Macrophage | 2,208 | SPP1 71%, TREM2 78%, GPNMB 96%, APOE 92%, MARCO 72% | 64% | SPP1/TREM2-high IPF-shifted alveolar macrophage |
| MC1 | Monocyte | 1,157 | FCN1 95%, IL1B 63%, TNF 22% | — | Classical inflammatory monocyte |
| MC2 | Macrophage | 2,025 | — | 69% | Macrophage, IPF-enriched |
| MC3 | Monocyte | 1,344 | FCN1 97%, S100A8/9 ~98%, CD14 89% | 22.0% | Resting monocyte |
| MC4 | Macrophage | 6,703 | — | — | Resident alveolar macrophage |
| MC5 | cDC | 60 | CCL17 62%, CCL22 80%, IL10 1.7% | 57% | M2a-like dendritic cell (rare) |
| MC6 | Macrophage | 57 | FOLR2 97%, CD163 97%, C1QA 100%, SLC40A1 65% | 95% | FOLR2+ iron-handling macrophage |
| MC7 | Macrophage | 3,841 | — | 16.2% | Homeostatic alveolar macrophage |
| MC8 | Prolif. macrophage | 410 | MKI67 90%, TOP2A 83% | — | Proliferating macrophage |
| MC9 | Macrophage | 816 | SPP1 31%, TREM2 65%, APOE 78%, GPNMB 58% | 97% | SPP1+ scar-associated macrophage |
| MC10 | Macrophage | 639 | — | 3.4% | Control-enriched homeostatic macrophage |
| MC11 | cDC | 740 | — | — | Conventional dendritic cell |
Note: counts are from the 20,000-cell clustering subsample (cluster sizes sum to 20,000). % IPF cells = fraction of cluster cells derived from IPF donors. Marker percentages denote the fraction of cluster cells with detectable expression.
The landscape recapitulates and extends the architecture of previous IPF atlases [2,9,10,11]. Macrophage-lineage clusters (MC0, MC2, MC4, MC6, MC7, MC9, MC10) dominate numerically, while monocyte (MC1, MC3) and cDC (MC5, MC11) clusters form separable entities rather than a continuum. IPF enrichment is not diffuse but concentrated in two small, discrete clusters (MC9, MC6), indicating the emergence of specific disease states rather than a uniform shift of all macrophages, whereas the stable control-enriched cluster (MC10) provides an internal reference population. Cluster identities, sizes and marker profiles are summarized in Table 1 (full marker panels for the myeloid and fibroblast clusters in Supplementary Tables S1 and S2).
The two IPF-emergent entities differ profoundly in size and marker logic: MC9 (n=816) is a comparatively populous state defined by the SPP1/TREM2/APOE/GPNMB module characteristic of scar-associated macrophages in fibrotic liver and lung [9,12], whereas MC6 (n=57) is a rare state defined by near-ubiquitous FOLR2, CD163 and C1QA together with the iron exporter SLC40A1, resembling tissue-resident FOLR2+ macrophages [17,18]. The remaining cluster assignments are described in Supplementary Results and provide the reference framework for all subsequent analyses. MC0 also expresses the SPP1/TREM2/GPNMB module at high detection rates (SPP1 71%), but is only moderately IPF-enriched (64%) and retains the resident MARCO+ identity; MC9’s distinctiveness lies in its near-exclusively IPF derivation (97%), donor concentration, and residual monocytic signature (FCN1 30%), i.e., a recently recruited scar-associated state rather than the sole SPP1-expressing cluster.
3.2. Two Discrete IPF-Emergent Macrophage Entities: SPP1+ Scar-Associated (MC9) and FOLR2+ Iron-Handling (MC6) (Figure 2, Table 1)
We compared cluster transcriptional programs using z-scored percentages of expressing cells across a curated marker panel (Figure 2). MC9 expressed the scar-associated module (SPP1 31%, TREM2 65%, GPNMB 58%, APOE 78%, MARCO 68%, MRC1 64%) with residual monocytic FCN1 (30%), consistent with a monocyte-derived scar-associated macrophage [8,12]. MC6 displayed a sharply distinct profile: FOLR2 97%, CD163 97%, MRC1 96%, SLC40A1 65%, C1QA 100%, MERTK 35%, CD14 98%, with high HIF1A (91%) and MCL1 (95%) transcripts. At full-data level, SPP1+ macrophages comprised 30.7% of IPF versus 4.0% of control macrophages, and SPP1 tracked the TREM2/scar program (Spearman rho=+0.41) but not hypoxia targets (rho≈0; SERPINE1 was a partial exception at rho=+0.236). FOLR2+ macrophages comprised 19.0% of IPF versus 11.9% of control macrophages, extending the overabundance reported by Mannes et al. [1] with the first systematic quantification and functional annotation of this compartment, and showed exaggerated iron-handling (SLC40A1 18.0% vs 4.3%) and scavenger features (MERTK 22.2% vs 10.4%; IL10 14.9% vs 7.7%; C1QA 82.3%) with reduced S100A8 (56.3% vs 64.5%). A FOLR2+ monocyte population (11.6% of monocytes; FCN1 92%) acquiring MARCO, MRC1, CD163 and SLC40A1 while losing S100A8 supported a monocyte-to-resident transition state feeding this lineage. Importantly, MC9 was donor-concentrated rather than uniform (Figure 1d; cluster fractions derive from the 20,000-cell clustering subsample): two IPF donors (F01302, 89.0% of n=500 sampled myeloid cells; F01303, 78.3% of n=405) carried the large majority of MC9 cells, other IPF donors with ≥200 sampled myeloid cells showed 0–0.5%, and control donors were at or near zero (IPF versus control median 0.2% vs 0.0%; one control donor carried 2.7%), a donor-concentrated extreme of the broader, donor-distributed SPP1+ expansion (30.7% of IPF macrophages).
Figure 2.
Dual-axis marker programs of the two IPF-emergent myeloid entities. (a) Heatmap of z-scored percentages of expressing cells for 20 curated markers across clusters MC0–MC11. MC9 segregates with the SPP1/TREM2/GPNMB/APOE scar-associated module; MC6 segregates with the FOLR2/CD163/C1QA/SLC40A1 iron-handling module; MC1 and MC3 carry monocytic markers (FCN1, S100A8/9); MC8 carries proliferation markers (MKI67, TOP2A). (b) Percentage of expressing cells in MC9 versus MC6 for eight discriminating markers (SPP1, TREM2, GPNMB, FOLR2, SLC40A1, CD163, MERTK, MCL1). (c) SPP1+ and FOLR2+ macrophage fractions at full-data level in IPF versus control (SPP1+ 30.7% vs 4.0%, p = 0.002; FOLR2+ 19.0% vs 11.9%, *p = 1.2 × 10⁻⁵; donor-level statistics). (d) Cluster-level scatter of SPP1 versus TREM2 percentages of expressing cells; MC9 (red) combines high TREM2 with moderate SPP1 and separates from all other clusters. (e) Fibroblast-directed signaling atlas: detection dot plot of fibroblast attractant/activator, repulsive-guidance, and attack/unlock/degradation genes across the IPF myeloid clusters (bubble size and colour = detection %; MC10 excluded, n_IPF = 22). (f) The same signals in the Adams cohort (SPP1-gated alveolar versus FOLR2-gated interstitial macrophages; extraction covered the first 41.8% of matrix columns, so negative-pool detection is conservative).
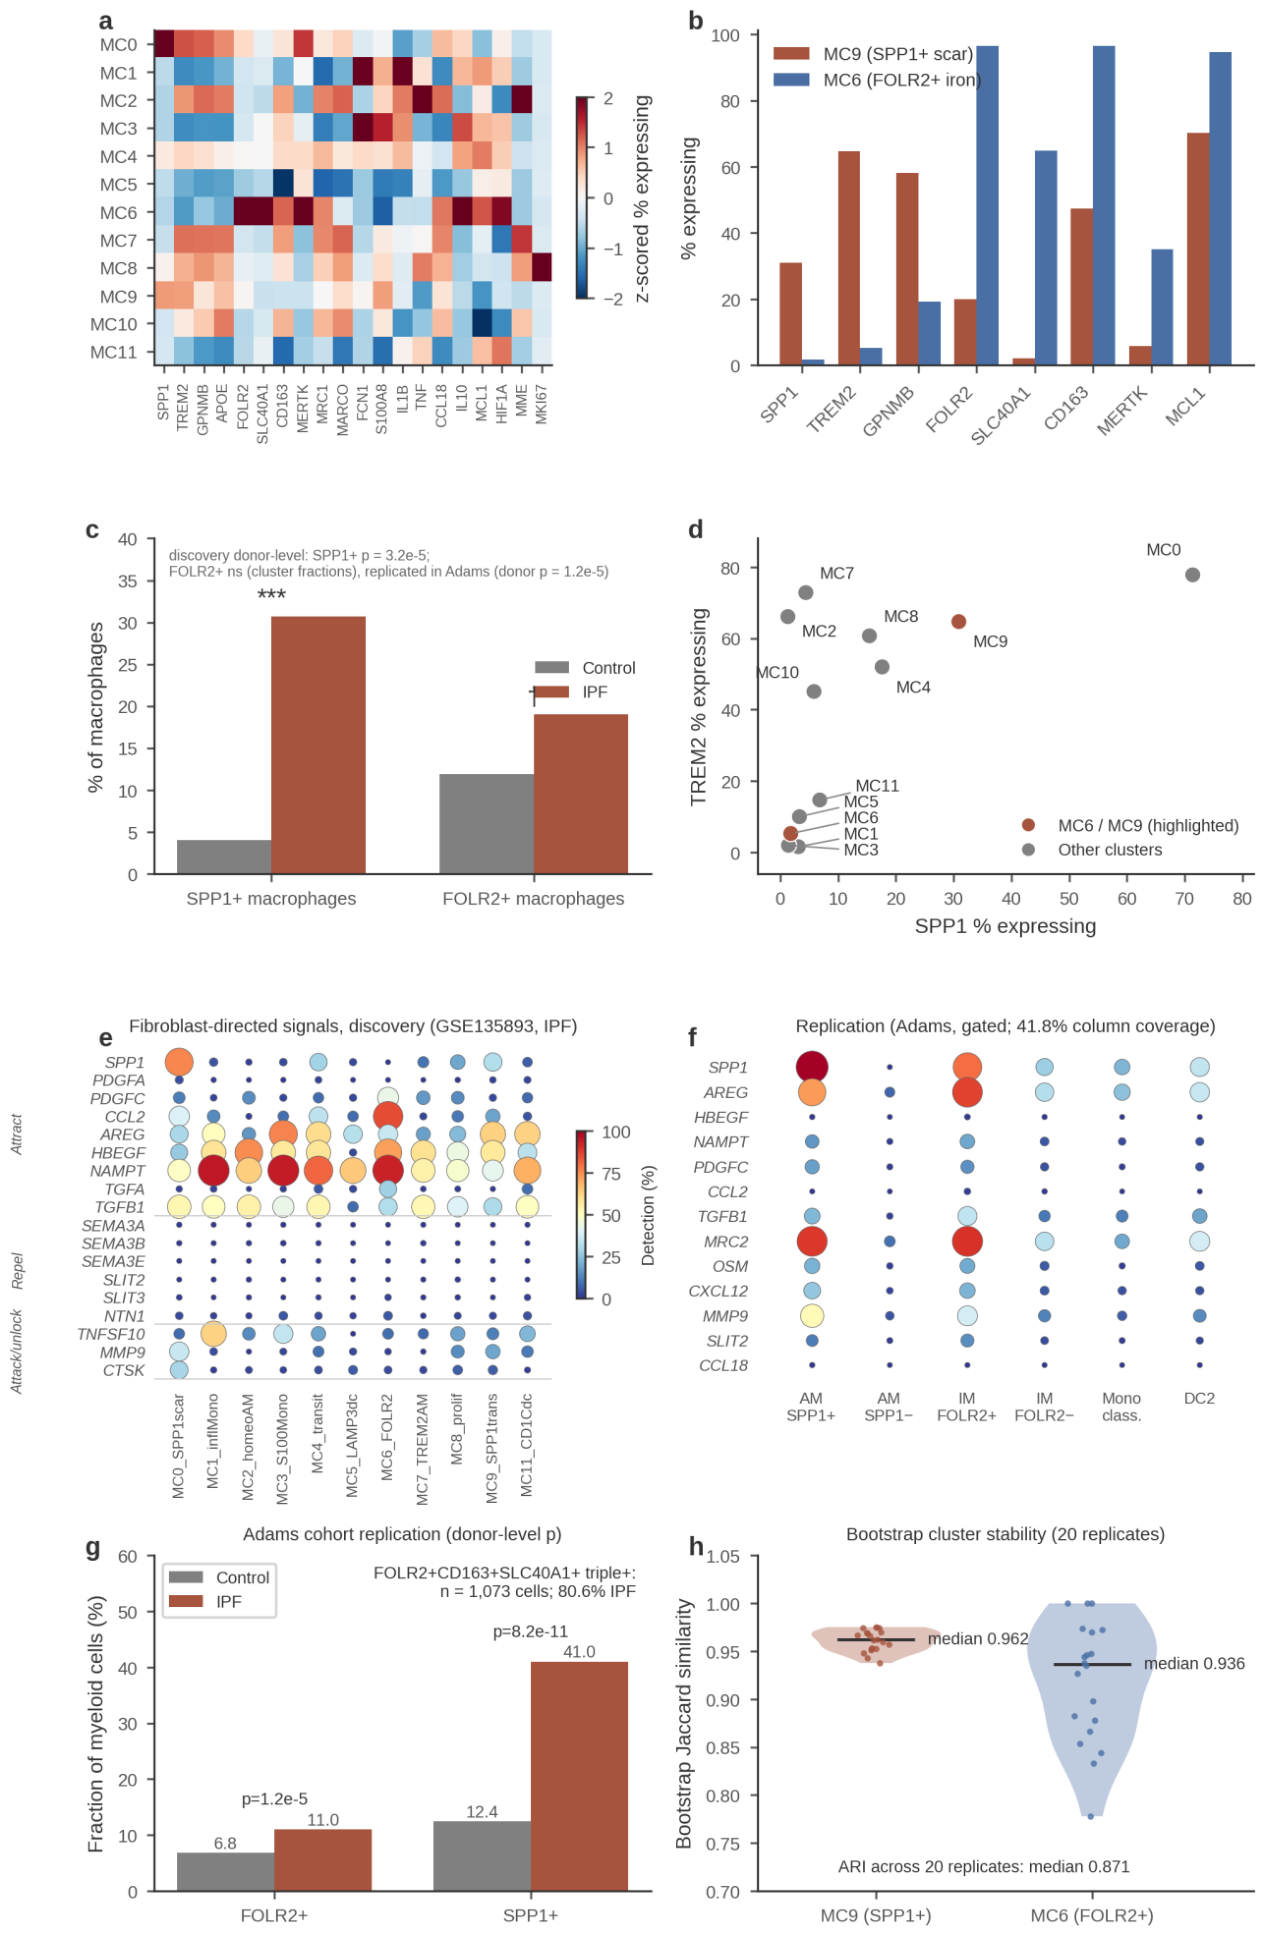
Two conclusions follow. First, extending the dual-axis framework of Mannes et al. [1], the IPF lung harbors not a single “fibrotic macrophage” but two discrete emergent entities with opposing functional logic: a lipid-loaded, scar-associated SPP1+ state analogous to cirrhotic scar-associated macrophages [12] and IPF SPP1/MERTK macrophages [9], and an iron-recycling, haem-scavenging FOLR2+ state related to tissue-resident FOLR2+ macrophages of tumor stroma [17,18], functionally annotated here in lung fibrosis. Second, both states appear replenished from recruited monocytes (MC9 retains FCN1, and a FOLR2+ transitional monocyte exists), supporting models in which monocyte-derived cells seed disease-specific macrophage niches [8]. Hypoxia-target co-expression was non-specific in macrophages (empirical p=0.139 versus expression-matched random gene sets); we therefore do not interpret the HIF1A prevalence in MC6 as hypoxia-driven and restrict hypoxia-related claims to fibroblasts.
3.3. Spatially Segregated Core-and-Ring Organization in Obliterative Bronchiolitis (Figure 3)
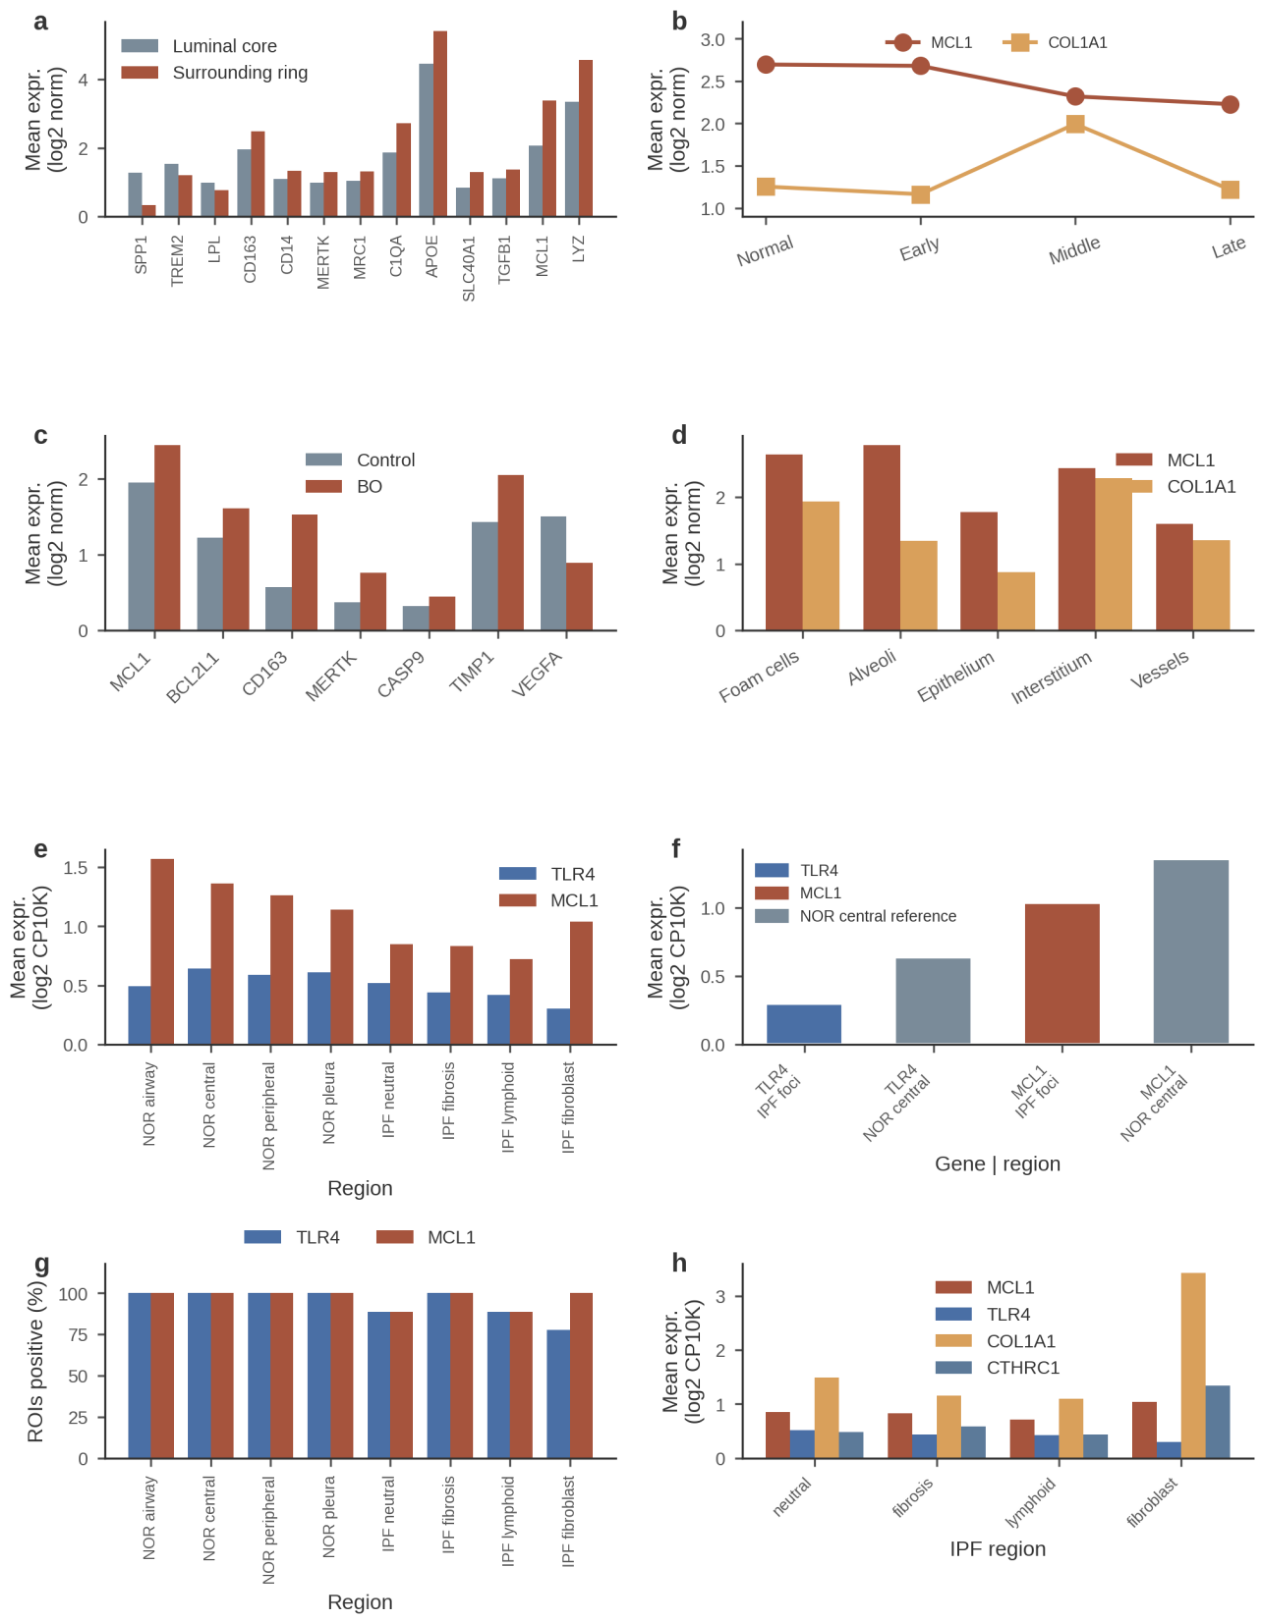
To test whether the two emergent entities occupy distinct microanatomical niches, we analyzed GeoMx whole-transcriptome profiles of obliterative bronchiolitis (BO) lesions (GSE316672 [3]; 92 regions of interest (ROIs) from 3 BO and 2 control patients). BO lesions are intraluminal fibrous plugs with an inherent two-layer anatomy — a plug core and an interface ring against the airway wall — so this dataset can test lesion-internal layering directly. At the Middle disease stage (n=11 inside and n=10 outside ROIs; Figure 3), the luminal core was enriched for scar-associated transcripts (SPP1 1.27, TREM2 1.54, LPL 0.99, IL10 0.69), whereas the ring was dominated by scavenger, efferocytosis and iron-handling transcripts (CD163 2.48, MERTK 1.29, MRC1 1.32, C1QA 2.73, SLC40A1 1.29, APOE 5.40, LYZ 4.56, CD14 1.34) together with TGFB1 (1.38) and MCL1 (3.37, the highest of any Middle-stage region). Importantly, FOLR2 itself was not differential between ring and core (medians 0.78 versus 0.77, p = 0.65), so the ring is best described as a CD163+/MERTK+ scavenger ring rather than a strictly FOLR2+-defined zone, and the spatial co-localisation of the two axes at single-cell resolution remains untested. Across BO versus control airways, MCL1 (2.45 vs 1.95, p=0.012), BCL2L1 (1.62 vs 1.22, p=0.0015), CD163 (1.53 vs 0.57, p=1.2×10⁻⁶) and MERTK (0.76 vs 0.37, p=5.6×10⁻⁴) were upregulated, whereas VEGFA was downregulated (p=3.7×10⁻⁶) (all ROI-level, exploratory). Because regions are nested within only 3 BO and 2 control patients, all bronchiolitis-obliterans spatial contrasts are descriptive; p-values are region-level and exploratory, and no patient-level inference is drawn. Along BO stages, MCL1 declined monotonically (2.70 → 2.68 → 2.32 → 2.23) while COL1A1 and CTHRC1 peaked at the Middle stage.
Figure 3.
Core-and-ring macrophage organization in obliterative bronchiolitis and the IPF fibroblastic-focus survival niche. (a–d) GeoMx whole-transcriptome profiling of BO lesions (GSE316672 [3]). (a) Middle-stage lesions: normalized expression in the luminal core (inside, n=11 ROIs) versus the surrounding ring (outside, n=10 ROIs) for scar-associated core markers (SPP1, TREM2, LPL) and ring markers (CD163, CD14, MERTK, MRC1, C1QA, APOE, SLC40A1, TGFB1, MCL1, LYZ). (b) MCL1 and COL1A1 expression across BO stages (Normal, Early, Middle, Late); MCL1 declines monotonically while COL1A1 peaks at the Middle stage. (c) BO versus control airways for MCL1, BCL2L1, CD163, MERTK, CASP9, TIMP1 and VEGFA. (d) MCL1 and COL1A1 across BO region annotations (foam cells, alveoli, epithelium, interstitium, vessels). (e–h) Region-level GeoMx profiling of fibrosing interstitial lung disease (GSE255174 [4]; 179 ROIs). (e) Mean TLR4 and MCL1 expression across four normal (NOR) and four IPF region annotations. (f) The fibroblastic-focus values of TLR4 and MCL1 against the normal-central reference. (g) Percentage of ROIs positive for TLR4 and MCL1 across the same regions (near-ceiling detection; most regions ≥89% positive). (h) MCL1, TLR4, COL1A1 and CTHRC1 across the four IPF regions; MCL1 is highest in fibroblastic foci (1.04, the highest of any IPF region) and TLR4 lowest within foci (0.30 versus 0.58 in normal regions), consistent with an apoptosis-resistant, inflammation-quiet niche (normal airway MCL1 exceeds the foci value dataset-wide). (i) Anatomical schematic of the three relevant structures: the BO intraluminal plug (with core and ring layers), the IPF parenchymal fibroblastic focus (epithelial-to-scar polarity, no layers), and the IPF airway/honeycomb-cyst lumen where the SPP1+ macrophage niche resides [35] but which was not sampled by the regional GeoMx cohort. (j) IPF regional GeoMx profiling of the dual-axis markers: no segregation across region types (all within 0.87–1.10×, p > 0.14), demonstrating that the core-and-ring motif is specific to occluding-lesion anatomy and that IPF luminal contents require spot/single-cell-resolution spatial data.
Two complementary reasons explain why an equivalent test is not possible in the IPF regional cohort (GSE255174). Anatomically, the IPF fibroblastic focus is a septal lesion with epithelial-to-scar polarity, not an intraluminal plug, so no core-and-ring counterpart exists in parenchyma; the IPF compartment that most closely corresponds to the BO luminal core is the airway- and honeycomb-cyst luminal content, where Mayr et al. reported the SPP1+ macrophage niche [35]. Methodologically, that cohort’s IPF ROIs covered only parenchymal region types (fibroblastic foci, established fibrosis, lymphoid aggregates, neutral parenchyma) — no airway- or cyst-lumen ROIs were sampled — and its whole-region ROIs (~600 µm) average over many cell types. Consistent with this, none of the dual-axis markers segregated across IPF region types (SPP1 1.01×, TREM2 0.87×, CD163 0.88×, FOLR2 0.87×, MERTK 1.10×; foci versus neutral; all p > 0.14; n = 9 ROIs per region, descriptive). We therefore conclude that the SPP1+ axis occupies a luminal niche in both diseases — the plug core in BO and the airway-luminal content in IPF [35] — while the core-and-ring configuration as such is specific to occluding lesions; resolving whether IPF luminal contents show internal layering requires spatial data that sample those regions at spot- or single-cell resolution.
This spatial segregation mirrors the single-cell taxonomy and suggests that the two entities of Figure 2 are niche-anchored populations rather than interchangeable activation states. The co-localisation of MCL1 with the ring compartment, as the highest signal among Middle-stage regions, is notable given the parallel BCL2L1 upregulation and the documented dependence of fibrotic-niche cells on anti-apoptotic BCL-2 family proteins [20,25]. The monotonic decline of MCL1 across BO stages, inversely tracking the Middle-stage peak of COL1A1 and CTHRC1, is compatible with survival support being maximal while the lesion is actively built. Because GeoMx measures region-level rather than single-cell RNA, these assignments are associative and require protein-level confirmation.
3.4. Monocyte Recruitment Couples to Fibroblast Apoptotic Priming at Donor Level (Figure 4, Table 2)
We asked whether myeloid composition tracks the fibroblast survival program at donor level. Across the 14 IPF donors with ≥5 fibroblast-lineage cells (per-donor values in Supplementary Table S4, all 14 visible in Figure 4a after overlap-dodging), the monocyte fraction of all cells correlated positively with the fraction of apoptotically primed fibroblasts (Spearman rho=+0.54, p=0.045; Figure 4), whereas the macrophage fraction (rho=−0.25, not significant), the SPP1+ macrophage fraction (rho=−0.12, not significant) and the TGFβ1+ macrophage fraction (not significant) did not. Four pre-specified coupling scores were examined; this correlation is nominal and does not survive Bonferroni correction across the four (adjusted α = 0.0125), and is therefore hypothesis-generating. Donor means confirmed disease-level shifts (Mann–Whitney U, as pre-specified in Methods): SPP1+ macrophage fraction 12.9%±10.8 in IPF versus 1.3%±1.1 in control (p=0.002); primed fibroblast fraction 27.0%±9.2 versus 17.0%±11.6 (U p=0.023; pre-specified module definition, Supplementary Methods); fibroblast MCL1 expression 1.54±0.63 versus 0.94±0.40 (U p=0.047). Notably, the monocyte fraction of all cells was lower in IPF than control (5.2% vs 10.4%, p=0.047), so the coupling is not a simple consequence of global monocyte accumulation. Candidate myeloid→fibroblast ligand–receptor axes are summarized in Table 2 and Supplementary Table S3.
Table 2.
Myeloid→fibroblast ligand–receptor pairs: mean expression in IPF versus control (GSE135893).
Table 2.
Myeloid→fibroblast ligand–receptor pairs: mean expression in IPF versus control (GSE135893).
| Ligand (myeloid) | Ligand IPF | Ligand control | Receptor (fibroblast) | Receptor IPF | Receptor control | Comment |
|---|---|---|---|---|---|---|
| SPP1 | 0.75 | 0.08 | CD44 | 0.99 | 0.75 | Ligand z-score higher in IPF (0.75 vs 0.08) |
| IL1B | 0.64 | 0.41 | IL1R1 | 0.97 | 0.39 | Receptor up in IPF |
| TNF | 0.25 | 0.15 | TNFRSF1A | 1.01 | 0.67 | Receptor up in IPF |
| OSM | 0.18 | 0.18 | OSMR | 0.55 | 0.22 | Receptor-driven |
| CCL2 | 0.56 | 0.06 | CCR2 | absent | absent | Receptor not on fibroblasts |
| CSF1 | 0.14 | 0.03 | CSF1R | absent | absent | Likely myeloid autocrine |
| TGFB1 | flat | flat | TGFBR | flat | flat | Not differential |
| MIF | constitutive | constitutive | CD74 | constitutive | constitutive | Housekeeping axis |
Note: values are mean normalized expression in the indicated lineage and diagnosis. “Absent” denotes no detectable receptor expression in fibroblasts.
Figure 4.
Donor-level coupling of monocyte recruitment to fibroblast apoptotic priming and myeloid→fibroblast ligand–receptor axes. (a) Per-donor scatter of the monocyte fraction of all cells against the primed fibroblast fraction (overlapping points are dodged horizontally so all donors are visible; y-positions are exact). Grey control-donor points are shown for display only; the Spearman correlation was computed across the 14 IPF donors only (rho=+0.54, p=0.045; per-donor values in Supplementary Table S4). (b) Mean expression in IPF versus control of the four representative ligand–receptor pairs from Table 2 (SPP1–CD44, IL1B–IL1R1, TNF–TNFRSF1A, OSM–OSMR): ligand in myeloid cells, receptor in fibroblasts. (c) Per-donor MC9 (SPP1+ scar-associated) fraction of sampled myeloid cells as a jittered strip of all donors, colored by diagnosis, with median and interquartile-range markers per group. (d) Donor-level fibroblast MCL1 expression (mean per donor; Control n=9, IPF n=14; 0.94±0.40 vs 1.54±0.63, Mann–Whitney p=0.047). (e) Per-donor MC6 (FOLR2+ iron-handling) fraction of sampled myeloid cells in control versus IPF donors (stripbox: box-and-whisker with jittered donor points); the cluster is donor-concentrated (donor F00431, 17.7% of n=277 sampled myeloid cells; all other donors ≤0.5%) and the donor-level difference is not significant (bracket: Mann–Whitney p = 0.28, ns). (f) The same MC9 donor-level fractions as in (c), shown as a stripbox split explicitly by diagnosis (box-and-whisker with jittered donor points), complementing the median/IQR strip view in (c); the donor-level difference is significant (bracket: Mann–Whitney p = 0.017, *). (g) Per-donor MC6 fractions as ranked bars, donors ordered by decreasing MC6 fraction and colored by diagnosis (F00431 highest at 17.7%). (h) Per-donor MC9 fractions as ranked bars, donors ordered by decreasing MC9 fraction and colored by diagnosis, naming the two dominant IPF donors (F01302, 89.0%; F01303, 78.3%); this ranked view complements the strip (c) and stripbox (f) views of the same donor-level quantity.
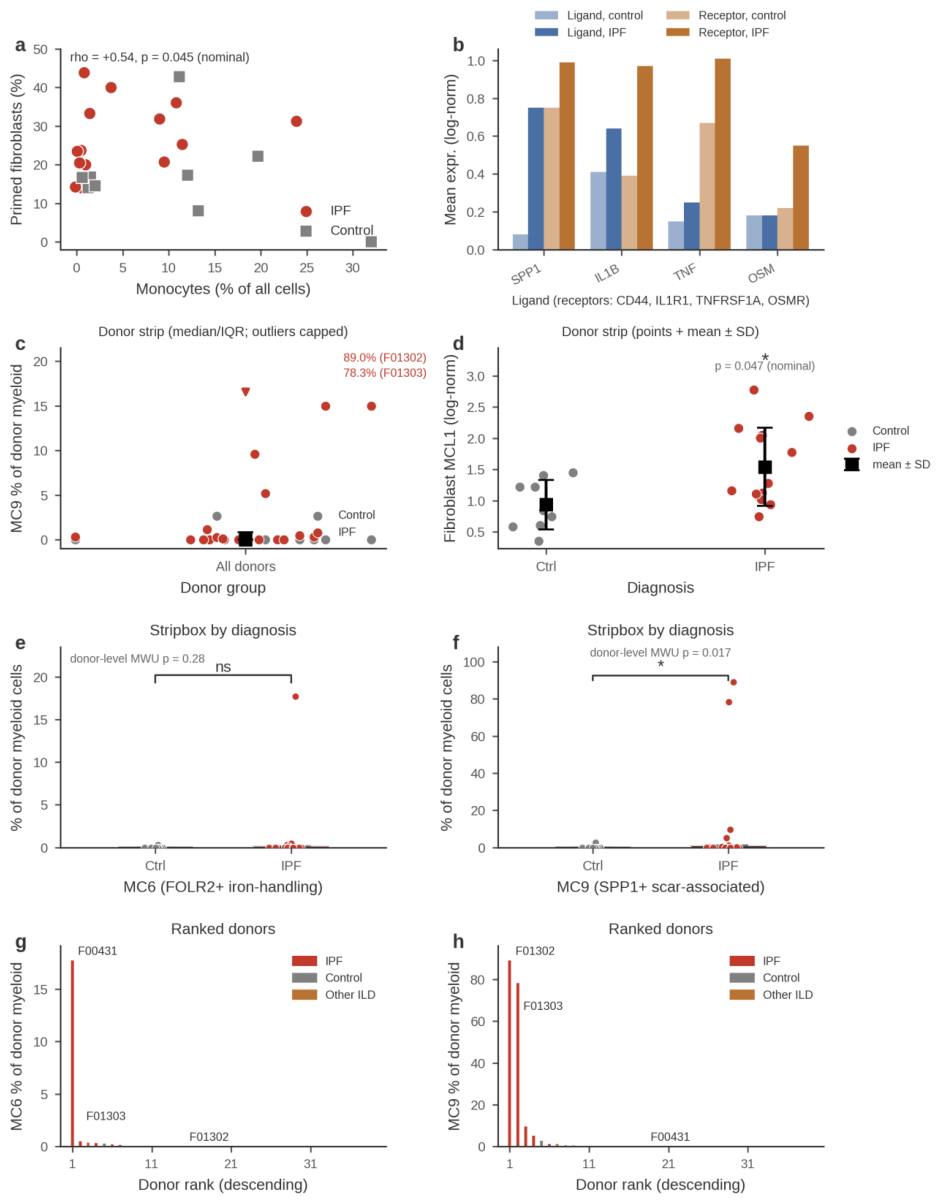
The selective coupling of monocyte recruitment, but not macrophage or SPP1+ macrophage abundance, to fibroblast priming argues that the relevant signal is the flux of incoming monocytes rather than the steady-state size of any differentiated pool, consistent with the transitional FOLR2+ monocyte state (Section 3.2) and the role of monocyte-derived cells in fibrotic remodeling [8]. Among candidate mediators, SPP1–CD44 and IL1B–IL1R1 combine ligand induction with fibroblast receptor upregulation and are the most plausible paracrine axes; OSM–OSMR appears receptor-driven; CCL2–CCR2 and CSF1–CSF1R are excluded as myeloid→fibroblast routes because their receptors are undetectable in fibroblasts, CSF1–CSF1R instead likely acting as a myeloid autocrine survival loop [29]. TGFB1 and MIF–CD74 were not differential. These expression-level inferences nominate, but do not functionally prove, the relevant signaling routes.
3.5. No Canonical M1 or M2a Enrichment at the Transcript Level (Figure 5, Table 3)
Canonical M1 effectors were not detected in macrophages across the full atlas (all diagnoses) (Figure 5, Table 3): NOS2 0.0% and IL12B 0.0% of expressing cells, with low CXCL9 (1.7%) and CXCL10 (2.5%) and only modest IL6 (3.6%); by contrast, TNF (19.2%), IL1B (32.3%) and CD86 (47.5%) remained detectable, indicating inflammatory tone without a coordinated M1 program. The M2a axis showed no transcript-level enrichment: IL4 was detected in only 0.01% of all cells, a dropout-limited lower bound that does not exclude low-level IL-4 protein secretion (species-difference and protein-level caveats in Section 4.4 and Supplementary Results). Within the limits of transcript detection, the M2a markers CCL17 (IPF 3.2% vs control 7.2%) and MRC1 (80.4% vs 92.9%) were lower in IPF, with STAT6 (~25%) and CCL18 (~54–58%) unchanged, providing no evidence for M2a expansion. Instead, IPF macrophages showed erosion of the homeostatic iron-scavenging arm (mean arm score +0.457 in control versus +0.373 in IPF, with CD163+ macrophages falling from 91.5% to 67.7%), accompanied by a rise in the pro-inflammatory arm (+0.050 to +0.293).
Table 3.
Negative and absent macrophage programs in IPF (GSE135893).
| program | Marker | IPF | Control | Interpretation |
|---|---|---|---|---|
| M1 | NOS2 | 0.0% | 0.0% | Not detected (transcript level) |
| M1 | IL12B | 0.0% | 0.0% | Not detected (transcript level) |
| M1 | CXCL9 / CXCL10 | 1.7% / 2.5% | — | Minimal |
| M1 | IL6 | 3.6% | — | Minimal |
| M2a | IL4 (all cells) | 0.01% | 0.01% | Dropout-limited lower bound |
| M2a | CCL17 | 3.2% | 7.2% | Lower in IPF |
| M2a | MRC1 | 80.4% | 92.9% | Lower in IPF |
| M2a | STAT6 / CCL18 | ~25% / ~54–58% | ~25% / ~54–58% | Unchanged |
| Homeostatic | CD163+ macrophages | 67.7% | 91.5% | Eroded in IPF |
| Homeostatic | Iron-scavenging arm score | +0.373 | +0.457 | Eroded in IPF |
| Pro-inflammatory | Arm score | +0.293 | +0.050 | Increased in IPF |
Note: percentages denote the fraction of macrophages (or, where indicated, all cells) with detectable expression. Arm scores are mean module scores.
Figure 5.
Absent canonical polarization programs and efferocytosis receptor rearrangement in human lung macrophages. (a) Percentage of macrophages across the full atlas (all diagnoses) expressing canonical M1 effectors: NOS2 and IL12B are undetectable, and IL6 (3.6%), CXCL9 (1.7%) and CXCL10 (2.5%) remain minimal (the detectable inflammatory transcripts TNF 19.2%, IL1B 32.3% and CD86 47.5% are not shown, as the panel focuses on the M1-defining markers). (b) M2a markers CCL17, MRC1, STAT6 and CCL18 in IPF versus control macrophages; CCL17 (3.2% vs 7.2%) and MRC1 (80.4% vs 92.9%) are lower in IPF, whereas STAT6 (~25%) and CCL18 (~54–58%) are unchanged. (c) Mean module scores of the iron-handling, M2 and pro-inflammatory program arms in control versus IPF macrophages; the homeostatic iron-scavenging arm erodes (+0.457 to +0.373) while the pro-inflammatory arm rises (+0.050 to +0.293). (d) CD163+ macrophage fraction in control versus IPF (91.5% vs 67.7%). (e) TAM-family efferocytosis receptors in CD10+ versus CD10− macrophages: MERTK (1.3% vs 12.5%) and AXL (35.6% vs 16.4%). (f) Ligand and bridging molecules: GAS6 (1.2% vs 11.9%), PROS1 (22.2% vs 8.2%) and MFGE8 (21.3% vs 12.3%). (g) CD10+ fraction of macrophages in control versus IPF (26.8% vs 20.8%; p < 0.001, Fisher’s exact test). (h) The rare CD10+MERTK+ double-positive population versus CD10+MERTK− cells for FOLR2 (34% vs 8%), SPP1 (45% vs 4%), IL10 (11.7% vs 1%) and MCL1 (88% vs 81%). Asterisks in panels b, d, e, g and h denote significance (p < 0.05, p < 0.01, ***p < 0.001; Fisher’s exact test on cell-level counts, descriptive). Brackets mark the compared groups.
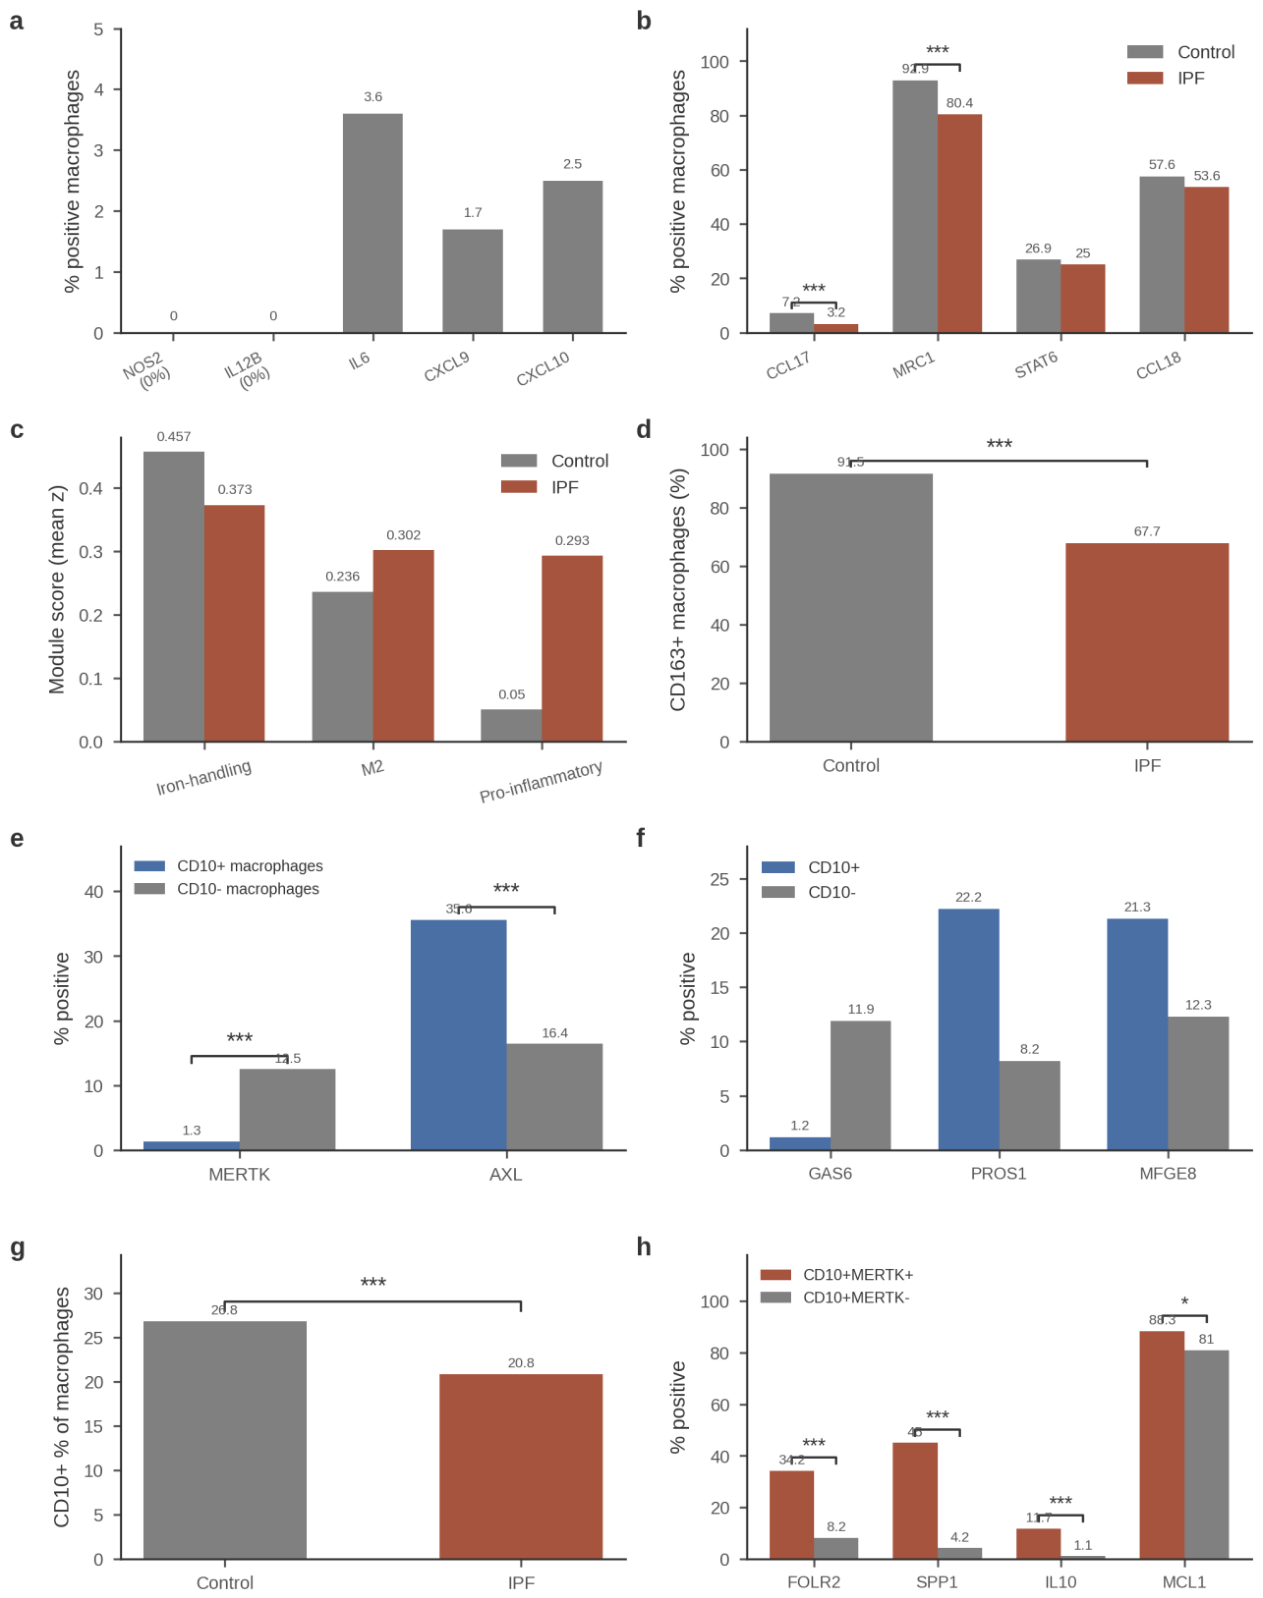
These negative results are informative for two reasons (extended interpretation in Supplementary Results). First, at the transcript level we find no enrichment of canonical M1/M2a features, consistent with the single-cell consensus that human lung macrophages do not conform to the M1/M2 dichotomy [22,23]: the disease state is defined neither by classical M1 effectors nor by an IL-4-driven M2a expansion, the latter being characteristic of type-2/allergic settings rather than fibrosis [7,22,24]. What IPF macrophages display instead is loss of the homeostatic scavenger identity (CD163, iron-handling module) with a concomitant, non-canonical rise in inflammatory transcripts, a pattern better described as homeostatic erosion plus disease-specific state emergence (Section 3.1 and Section 3.2) than as M1–M2 polarization [22,30]. Second, the non-detection of NOS2/IL12B in both diagnoses indicates a compartment-general rather than IPF-specific feature (Section 4.4).
3.6. Efferocytosis Receptor–Bridging-Molecule Rearrangement in Mature Alveolar Macrophages (Figure 5, Panels e–h)
Finally, we examined efferocytosis machinery in mature alveolar resident macrophages marked by CD10 (MME) (TAM-family background in Supplementary Results). MME+ macrophages constituted 23.4% of all macrophages and carried a resident signature (MARCO 97%, MRC1 96%, CD163 86%, GPNMB 92%; SPP1−, FCN1−); their frequency declined in IPF (20.8% vs 26.8% of macrophages). Relative to MME− macrophages, MME+ macrophages selectively expressed the AXL receptor together with the bridging molecule MFGE8 (AXL 35.6% versus 16.4%, MFGE8 21.3% versus 12.3%, PROS1 22.2% versus 8.2%) while nearly abandoning MERTK and GAS6 (MERTK 1.3% vs 12.5%; GAS6 1.2% vs 11.9%) (Figure 5, panels e–h). This pattern is a receptor–bridging-molecule rearrangement (high AXL and MFGE8, low GAS6) rather than a swap of intact ligand–receptor pairs. A rare MME+MERTK+ double-positive population (n=120 cells) showed an intermediate phenotype (FOLR2 34%, SPP1 45%, IL10 11.7%).
The reciprocal deployment of efferocytosis receptors and bridging molecules defines an unexpected division of labor: mature resident alveolar macrophages favor the AXL receptor with MFGE8 bridging (and low GAS6), whereas MERTK is confined to other states, including IPF-emergent populations (MERTK 35% in MC6). Receptor choice matters because AXL and MERTK signaling are not equivalent: MERTK supports homeostatic clearance whereas AXL is induced by inflammatory cues [7,30,31], so the decline of the MME+ compartment in IPF (26.8% to 20.8%) implies both quantitative and qualitative rewiring of efferocytosis capacity. Together with the MERTK/CD163-rich ring in BO (Figure 3), these data position efferocytosis-receptor choice as an organizing principle of macrophage state in fibrotic lung disease. Independent-cohort replication qualified this rearrangement: in Adams FOLR2+ macrophages the MERTK/GAS6 arm (with TIMD4 and PROS1) replicated, but AXL and MFGE8 did not (Section 3.7), indicating that the AXL/MFGE8 arm is specific to the discovery cohort’s resident compartment, whereas MERTK/GAS6 dominance is the generalizable feature.
3.7. Independent-Cohort Replication in the Adams Cohort and Bootstrap Cluster Stability (Table 4)
Both disease axes replicated in the independent Adams cohort (GSE136831, accessed via the Human Lung Cell Atlas [41]; 99,744 IPF and 73,209 control myeloid cells; Methods, Section 2.8). FOLR2+ macrophages comprised 11.0% of IPF versus 6.8% of control myeloid cells (Fisher’s exact p=6.2×10⁻¹⁹⁸; 12.3% versus 7.7% of macrophages specifically), directionally consistent with the discovery cohort (19.0% versus 11.9% of macrophages); given platform and processing differences between cohorts, the direction and ratio of enrichment, rather than the absolute percentages, are the comparable quantities. At the donor level, the FOLR2+ fraction was 11.6% in IPF versus 6.2% in control (32 IPF versus 27 control donors with ≥50 myeloid cells; Welch’s t-test p=1.2×10⁻⁵, Cohen’s d=1.23). The FOLR2+/CD163+/SLC40A1+ triple-positive population was recovered at n=1,073 cells (~19× the discovery-cohort MC6 cluster of 57 cells), 5.4× the marginal expectation under independent marker detection, 3.1× enriched in IPF (0.87% versus 0.28% of myeloid cells, Fisher p=1.9×10⁻⁵⁷), and 80.6% IPF-derived (versus a 57.7% IPF baseline; donor-level p=8.3×10⁻⁵). The triple-positive population showed an enriched iron-handling module (z=+1.54, versus −0.01 in all other myeloid cells), 74% MERTK detection, and was concentrated among macrophages (0.94% of IPF versus 0.30% of control macrophages; 3.2×). The SPP1+ axis likewise replicated: SPP1+ cells comprised 41.0% of IPF versus 12.4% of control myeloid cells (donor-level 41.5% versus 9.5%, Welch p=8.2×10⁻¹¹, Cohen’s d=2.04).
Table 4.
Independent-cohort replication of the dual macrophage axes (Adams cohort, GSE136831 via HLCA).
Table 4.
Independent-cohort replication of the dual macrophage axes (Adams cohort, GSE136831 via HLCA).
| Finding | Discovery (GSE135893) | Adams (GSE136831) | Verdict |
|---|---|---|---|
| FOLR2+ fraction | 19.0% vs 11.9% of macrophages | 11.0% vs 6.8% of myeloid; donor-level p=1.2×10⁻⁵, d=1.23 | Replicated (direction and ratio) |
| Triple-positive FOLR2+/CD163+/SLC40A1+ population | MC6 cluster, n=57 | n=1,073 cells; 3.1× IPF-enriched; 80.6% IPF-derived | Replicated and enlarged |
| Efferocytosis arm | AXL/MFGE8 rearrangement in resident macrophages | MERTK/GAS6-dominant in FOLR2+ (MERTK 2.09×, GAS6 2.29×, TIMD4 2.03×, PROS1 1.28×); AXL 0.92×, MFGE8 flat | Partially replicated; AXL/MFGE8 arm discovery-specific |
| SPP1+ fraction | 30.7% vs 4.0% of macrophages | 41.0% vs 12.4% of myeloid; donor-level p=8.2×10⁻¹¹, d=2.04 | Replicated |
| Iron-handling module | Compartment-wide erosion with MC6 enrichment | Not robust compartment-wide (d=0.39, p=0.14); enriched within FOLR2+/triple+ cells (z=+0.61/+1.54) | Qualified: a FOLR2+ cell-state marker, not a global shift |
Note: discovery values are full-data macrophage fractions; Adams values are myeloid-compartment fractions from the HLCA (platform differences preclude direct comparison of absolute percentages); Adams macrophage-fraction equivalents are 12.3% (IPF) versus 7.7% (control) for FOLR2+ cells. Bootstrap stability (20 replicates with replacement): MC9 median Jaccard 0.962 (min 0.938); MC6 median 0.936 (min 0.778; recovered in all runs); median overall ARI 0.871 (range 0.647–0.906) (Supplementary Figure S1). Without-replacement sensitivity (80% subsamples, 20 replicates): neither MC9 nor MC6 recovered as discrete clusters (median Jaccard 0.000; median ARI 0.931); the axes are therefore presented as marker-defined extreme populations.
Two discovery-cohort findings were refined by the replication. First, the efferocytosis arm of FOLR2+ macrophages in Adams was MERTK/GAS6-dominant (MERTK 2.09×, GAS6 2.29× enriched versus other myeloid cells; full ratios in Table 4), whereas AXL was not enriched (0.92×) and MFGE8 was flat; the AXL/MFGE8 rearrangement of resident alveolar macrophages described in Section 3.6 is therefore discovery-cohort-specific (see Section 4.3). Second, the compartment-wide iron-handling module was not robust in Adams (donor-level Cohen’s d=0.39, p=0.14, not significant; HMOX1 detection was lower in IPF myeloid, 42.4% versus 50.6%), but the module was enriched within FOLR2+ and triple-positive cells (z=+0.61 and z=+1.54, respectively); iron handling therefore marks a discrete FOLR2+ cell state rather than a compartment-wide shift.
Bootstrap resampling with replacement (20 replicates) recovered both disease clusters (MC9 median Jaccard 0.962; MC6 median 0.936; median ARI 0.871), but a stricter without-replacement subsampling sensitivity (80% of cells, 20 replicates, full pipeline re-run) did not recover either cluster as a discrete entity (median Jaccard 0.000 for both) despite a stable global partition (median ARI 0.931) — we therefore present MC9 and MC6 as marker-defined extreme populations, and the Adams replication (marker-gated, not clustering-dependent) carries the cross-cohort evidence.
3.8. Hypoxia and Region-Level Markers in the Fibroblast Compartment (Figure 1e–h, Figure 3e–h)
Fibroblast-compartment analyses are reported in full in Supplementary Results. In brief, within the fibroblast compartment (eight clusters, FC0–FC7 [32]; Figure 1e–h), hypoxia signaling was fibroblast-lineage-specific: PLIN2+ fibroblasts carried the highest Hallmark hypoxia score of all 31 lung cell types (+0.476), and HIF-1 target co-expression was specific to fibroblasts (empirical p=0.005) but non-specific in macrophages (p=0.139); hypoxia-related claims are therefore restricted to fibroblasts. Region-level GeoMx profiling (GSE255174 [4]; Figure 3e–h) placed MCL1 highest in fibroblast foci (1.04, the highest of any IPF region) and TLR4 lowest within foci (0.30 versus 0.58 in normal regions, p<0.001) [33], supporting a fibrotic focus combining anti-apoptotic reinforcement (high MCL1) with attenuated innate immune sensing (low TLR4).
4. Discussion
4.1. Principal Findings
This study integrates three independent datasets (GSE135893, GSE316672, GSE255174) to functionally attribute and spatially resolve, rather than to claim, the dual-axis macrophage organization of the fibrotic lung, a model motivated by the monocyte-derived SPP1+ and FOLR2+ programs reported by Mannes et al. [1]. Full-transcriptome re-clustering resolved two discrete, strongly IPF-enriched entities (an SPP1+/TREM2+ scar-associated state, MC9, 97% IPF; and a rare FOLR2+/CD163+/SLC40A1+ iron-handling state, MC6, 95% IPF) and delivered, for the FOLR2+ axis, the first systematic quantification and functional annotation (exaggerated iron-handling and efferocytosis features) together with spatial resolution: the two programs occupy distinct microanatomical niches (luminal core versus scavenger ring) in fibrotic airway lesions. At the donor level, the flux of recruited monocytes, rather than the size of any mature macrophage pool, tracked fibroblast apoptotic priming. In addition, no transcript-level enrichment of canonical M1 or M2a programs was detected, and mature resident alveolar macrophages displayed a qualitative receptor–bridging-molecule rearrangement of efferocytosis machinery.
4.2. The Dual-Axis Model in the Context of Prior Work
The SPP1+ axis confirms and extends the proliferating SPP1/MERTK macrophage of IPF [9] and the cross-organ scar-associated TREM2+/CD9+ program defined in cirrhosis [12] and type-3-inflammation-driven fibrosis [13]. For the SPP1+ axis, our data add three increments. First, SPP1+ macrophages form a marker-defined extreme population; cluster discreteness was not supported under without-replacement subsampling (Section 3.7), so we treat the axis as the extreme of a continuum rather than a discrete state. Second, cluster-level enrichment is donor-concentrated: two IPF donors carried the large majority of MC9 cells, whereas the broader SPP1+ expansion (30.7% versus 4.0% of macrophages) is donor-distributed, suggesting an extreme, possibly lesion- or stage-linked phenotype superimposed on a common shift. Third, the SPP1–CD44 pair combines ligand induction with receptor upregulation on fibroblasts, nominating a bidirectional amplification loop alongside IL1B–IL1R1 [12].
For the FOLR2+ axis, our increment is the first systematic quantification (19.0% versus 11.9% of all macrophages in IPF versus control) and functional annotation: an exaggerated iron-handling signature (SLC40A1 18.0% versus 4.3% in control FOLR2+ macrophages), scavenger and efferocytosis features, and a niche-anchored, monocyte-replenished organization. FOLR2+ tissue-resident macrophages are conserved across organs and species [16] and were previously characterized in tumor stroma [17,18] and pancreatic fibrosis [34]. Their emergence in IPF is therefore not automatically protective: a scavenger, iron-recycling, efferocytosis-oriented cell could restrain fibrosis by clearing apoptotic debris and free haem, or sustain it through trophic support and MERTK-dependent engulfment within the lesion ring (extended discussion in Supplementary Results). The coexistence of FOLR2+ transitional monocytes and the ring localisation of CD163/MERTK/SLC40A1 signals argue that this axis is niche-anchored and dynamically replenished [8]. One further observation qualifies any simply protective reading: MC6 itself carried a fibroblast/monocyte recruitment arm (CCL2 85.2%, PDGFC 42.6%, TGFA 27.8%; Supplementary Results), so the scavenger axis may also call in further monocyte supply—a duality that must be resolved functionally. We note, however, that this recruitment arm did not replicate in the Adams cohort (CCL2 1.9%, PDGFC 15.0%, TGFA 1.9% in FOLR2-gated interstitial macrophages), so it remains a discovery-cohort observation of uncertain generality (Supplementary Results). Resolving its net contribution will require functional perturbation, not transcriptional inference.
Mayr et al. identified an SPP1+ macrophage niche within the airway lumen of IPF tissue [35]; our analysis confirms a luminal SPP1+/TREM2+ core in BO lesions and adds an element that study did not identify, an outer CD163+/MERTK+ scavenger ring expressing the highest MCL1 signal of any Middle-stage region. Fabre et al. conversely reported SPP1+TREM2+ macrophages at the outer edge of scars in multi-organ fibrosis [13], opposite to the core position we observe in BO. This tension is plausibly explained by lesion anatomy: Fabre et al. profiled parenchymal scars across organs, whereas our spatial data derive from intraluminal bronchiolar lesions of post-transplant BO, in which the core is the obstructing plug and the ring is the interface with the airway wall. The two observations are complementary rather than contradictory, but they caution against assuming a universal inside/outside orientation of the SPP1+ program across fibrotic lesion types. This spatial motif appears to be cross-organ: fistula-associated stromal fibroblasts in Crohn’s disease likewise form concentric zones — a proliferative luminal layer, an MMP9/FAP/PRRX1 remodeling core and a quiescent collagen-dense outer shell — driven by reactivated developmental programs (TWIST1, PRRX1, OSR2) [36], supporting the view that self-organizing spatial niches, rather than inflammation alone, sustain chronic fibrosis across organs. Read together, the luminal positioning of the SPP1+ axis is conserved between diseases (the BO plug core here and the IPF airway lumen in [35]), whereas the surrounding scavenger ring is specific to occluding-lesion anatomy and is not detectable in parenchymal IPF at ROI resolution (Section 3.3).
The dual-axis organization we quantify is consonant with the regulatory framework recently articulated by Alexanian and Srivastava, who proposed that immune cells and fibroblasts act as dynamic interpreters of intercellular cues whose integrated circuitry decides between repair and chronic scarring [42]. Our data supply a myeloid-side instance of that logic at single-cell resolution: an SPP1+ axis that supplies and activates fibrogenic cues alongside a FOLR2+ axis devoted to iron handling and efferocytic clearance — two macrophage programs whose imbalance helps set the recovery-versus-fibrosis choice in the IPF lung.
4.3. The Efferocytosis Receptor Rearrangement
Mature CD10 (MME)+ resident alveolar macrophages expressed AXL and the bridging molecule MFGE8 while nearly abandoning MERTK and GAS6, inverting the pattern of other macrophage states, including IPF-emergent MC6 (MERTK 35%). The concept that TAM receptors serve different modes of efferocytosis, MERTK supporting homeostatic clearance and AXL induced under inflammatory conditions, was established by Zagórska et al. [31]; our increment is subset-specific: a defined resident population rearranges its receptor and bridging-molecule repertoire (high AXL and MFGE8, low GAS6) rather than modulating overall TAM abundance, and this rearrangement erodes as the compartment declines in IPF. Cross-cohort replication further indicates that MERTK/GAS6 dominance of the disease-emergent FOLR2+ axis is the generalizable feature, whereas the AXL/MFGE8 arm is specific to the discovery cohort’s resident compartment (Section 3.7). This division of labor complicates interpretation of efferocytosis studies that treat TAM receptors as interchangeable [7,30]. Because the MME+ compartment declines in IPF, residual efferocytosis capacity is qualitatively rewired toward states that use MERTK, precisely the receptor enriched in the scavenger ring of obliterative bronchiolitis.
These subset-resolved data must be reconciled with bulk-level data: She et al. reported elevated MERTK (and CD36) in bulk IPF lung macrophages, with no significant change in Axl mRNA [37]. Three considerations explain the apparent discrepancy (expanded in Supplementary Results): our comparison is subset-specific whereas bulk measurements average across compartments; the gain of MERTK-dominant disease-associated states (e.g., MC6 and the BO scavenger ring) raises bulk MERTK even as resident AXL-dominant clearance contracts; and mRNA abundance need not track surface-receptor protein or signaling activity. The rare MME+MERTK+ double-positive cells (n=120), enriched for FOLR2 and SPP1, are plausibly transition intermediates between resident and disease-emergent states. Whether failed AXL-dependent clearance in the declining MME+ compartment contributes to apoptotic-cell persistence (and thereby to sustained pro-fibrotic signaling) is a testable hypothesis with direct therapeutic relevance.
4.4. No M1/M2a Enrichment at the Transcript Level
At the transcript level we find no enrichment of canonical M1/M2a features, consistent with the single-cell consensus that tissue macrophages do not conform to the M1/M2 dichotomy [22,23]. The non-detection of NOS2 reflects in part the known human-versus-mouse species difference and is not IPF-specific, and the rarity of IL4 transcript (0.01% of cells) is a dropout-limited lower bound that does not exclude low-level IL-4 protein; older BAL-fluid/ELISA studies reported elevated IL-4 in IPF, a protein-level observation our data cannot adjudicate. What the transcript data do show is an absence of M2a-associated enrichment: CCL17 and MRC1 are lower, not higher, in IPF. The M2a/IL-4 axis is well supported in allergic and helminth-driven fibrosis [24]; the lack of transcript-level support here cautions against extrapolating mechanisms from type-2 settings to IPF. What replaces polarization is erosion of the homeostatic iron-scavenging identity plus emergence of disease-specific states (Section 3.5). SPP1 expression likewise tracked the TREM2/scar program (rho=+0.41) but not hypoxia targets: the SPP1+ state is a scar program, not a hypoxia response.
4.5. Therapeutic Implications
A dual-axis architecture helps explain why single-ligand blockade has underperformed: inhibiting SPP1 alone leaves the FOLR2+ scavenger ring and its MCL1-rich survival milieu intact, and vice versa. FOLR2 offers a tractable handle, folate-receptor-β-based imaging has been demonstrated in interstitial lung disease macrophages [19] and folate-conjugated payloads selectively deplete FOLR2+ macrophages in preclinical tumor models [17], but the bidirectional role of this axis (Section 4.2) mandates caution until its net effect in lung fibrosis is defined. The coupling of monocyte flux to fibroblast priming suggests that targeting recruitment may be more effective than targeting mature states. MCL1 emerged as the strongest ring signal, but systemic MCL-1 inhibition carries a documented cardiotoxicity liability, so exploitation of myofibroblast BCL-2-family dependence [20,21,25,38,39,40] should favor fibroblast-directed or macrophage-sparing delivery rather than global MCL-1 blockade. Selective depletion of the SPP1+ core while sparing the scavenger ring is a testable strategy, conditional on the ring’s net effect in fibrosis being beneficial—which our data do not establish, since the ring/MC6 also carries a monocyte- and fibroblast-recruitment arm (CCL2, PDGFC; Section 4.2) and MERTK elevation has been reported as profibrotic in bulk IPF analyses [37].
4.6. Limitations
Several limitations bound interpretation. First, all analyses are cross-sectional; donor-level correlations (rho=+0.54, p=0.045, n=14) are associative and cannot establish direction. Second, re-clustering used curated cell-type annotations and a custom spectral pipeline on a 20,000-cell subsample of 49,388 myeloid cells; the cluster number was not selected by formal criteria; bootstrap resampling (20 replicates) recovered both disease clusters (MC9 median Jaccard 0.962; MC6 median 0.936, re-emerging in all 20 runs; median ARI 0.871, range 0.647–0.906; Section 3.7), but the clustering was still performed on a 20,000-cell subsample with a custom pipeline, and the discovery-cohort MC6 (n=57, dominated by one donor) remains small in this cohort—although the corresponding FOLR2+/CD163+/SLC40A1+ population was recovered at n=1,073 cells in the independent Adams cohort (Section 3.7). Third, the donor concentration of MC9 (two donors carrying most cells) makes cluster-level statistics vulnerable to individual-donor effects. Fourth, GeoMx profiling is ROI-level and multicellular; the core-and-ring assignment is spatial but not single-cell, and the BO cohort models post-transplant bronchiolitis rather than IPF itself. Fifth, mRNA need not reflect protein abundance or activity. Sixth, enzymatic dissociation may alter macrophage state and deplete fragile populations. Finally, no functional validation (efferocytosis assays, perturbation) was performed; mechanistic claims are inferential. Four further limitations deserve emphasis. Fraction-based expansions (e.g., SPP1+ from 4.0% to 30.7%) are relative compartment shares without absolute density anchors and cannot distinguish true expansion from dilution or differential recovery of other compartments. No ambient-RNA correction or computational doublet removal was applied (unavailable in the released matrices); detection rates of highly secreted transcripts may be modestly inflated by ambient contamination, and rare double-positive populations could in part reflect doublets. Control lungs were transplant-declined donor organs (brain death, intensive care, ventilation), not steady-state healthy tissue, so absolute IPF–control differences may partly reflect this control-state pathology. Independent-cohort replication also qualified two discovery-cohort claims: the AXL/MFGE8 efferocytosis rearrangement did not generalize to Adams (where the FOLR2+ efferocytosis arm was MERTK/GAS6-dominant), and HMOX1 detection was lower in IPF myeloid overall in Adams, so the iron-handling signature should be read as a FOLR2+ cell-state marker rather than a compartment-wide shift (Section 3.7). Lastly, the myeloid, fibroblast, coupling and spatial analyses presented here share the same 31 donors, pipeline and partly the same validation cohorts, so they are not statistically independent of one another.
4.7. Future Directions
Priorities include (i) spot- and single-cell-resolution spatial transcriptomics of IPF lesions to test the core-and-ring model directly; (ii) functional efferocytosis assays comparing AXL-arm and MERTK-arm macrophages; (iii) folate-targeted depletion of FOLR2+ macrophages in fibrosis models; and (iv) longitudinal cohorts to test whether monocyte flux and dual-axis expansion predict progression and treatment response.
5. Conclusions
By integrating three independent datasets, full-transcriptome re-clustering of a 20,000-cell subsample of the 49,388-cell myeloid compartment into 12 clusters (GSE135893), GeoMx spatial profiling of obliterative bronchiolitis lesions (GSE316672), and regional GeoMx profiling of fibrosing interstitial lung disease (GSE255174), this study functionally attributes and spatially resolves the dual-axis macrophage organization of pulmonary fibrosis delineated by Mannes et al. [1]: an SPP1+/TREM2+ scar-associated population (MC9; 97% of cells from IPF donors), convergent with scar-associated macrophages across organs [9,12], and a FOLR2+/CD163+/SLC40A1+ iron-handling population (MC6; 95% IPF) related to tissue-resident FOLR2+ macrophages conserved across tissues [16,17,18], for which we provide the first systematic quantification (19.0% versus 11.9% of all macrophages) and functional annotation. Spatial transcriptomics of obliterative bronchiolitis provided evidence consistent with microanatomical segregation of these programs into an SPP1+ luminal core and an outer CD163+/MERTK+ scavenger ring, an element not identified in prior IPF niche mapping [35], bearing the highest MCL1 signal (3.37) of any Middle-stage region, linking macrophage geography to anti-apoptotic survival support [20,25]; we treat these spatial data as consistency evidence rather than direct proof in IPF (Section 4.6). At the donor level, monocyte recruitment (but not any differentiated macrophage pool) tracked fibroblast apoptotic priming (rho=+0.54, p=0.045), implicating myeloid influx in the fibroblast survival phenotype. Negative results proved equally informative: canonical M1 and IL-4-driven M2a programs show no transcript-level enrichment [22,23], and mature CD10+ resident alveolar macrophages display a receptor–bridging-molecule rearrangement of efferocytosis machinery (AXL 35.6% versus MERTK 1.3%) that extends established TAM-receptor diversification concepts [31] and reconciles with bulk-level reports [37].
Our central conclusion is that pulmonary fibrosis harbors two functionally distinct, spatially segregated pathological macrophage programs whose joint targeting may be required to resolve the fibrotic niche. Spot-level spatial validation and functional depletion of each population are required to test this prediction.
Supplementary Materials
The following supporting information can be downloaded at the website of this paper posted on Preprints.org.
Author Contributions
CS: Conceptualization, Data curation, Formal analysis, Writing – original draft, Writing – review & editing. DL: Data curation, Software, Validation, Visualization. HC: Methodology, Investigation, Formal analysis. All authors read and approved the final manuscript.
Funding
This work was supported by the Beijing Science and Technology Nova Program Interdisciplinary Project (20230484439) and the Beijing High-Level Public Health Technical Talents Project (2023-02-33). The funders had no role in study design, data collection, data analysis, data interpretation, or writing of the manuscript.
Ethical Statement
This study is a secondary analysis of publicly available, de-identified datasets (GSE135893, GSE316672, GSE255174); no new data from human participants or animals were collected, and institutional review board approval was therefore not required.
Ethics Approval
Not applicable. This is a secondary analysis of publicly available, de-identified datasets; no new data from human participants or animals were collected.
Data Availability
All datasets analyzed are publicly available: GSE135893, GSE136831, GSE316672 and GSE255174 from the NCBI Gene Expression Omnibus, and the Human Lung Cell Atlas. Processed data tables are provided as Supplementary Material.
Acknowledgments
Not applicable.
Competing Interests
The authors declare that they have no competing interests.
Use of AI Tools
During the preparation of this work, the authors used AI-based tools for data-analysis assistance and manuscript-preparation support. The authors reviewed and edited the content and take full responsibility for the integrity of this work.
References
- Mannes, P.Z.; Adams, T.S.; Farsijani, S.; et al. Noninvasive assessment of the lung inflammation-fibrosis axis by targeted imaging of CMKLR1. Sci. Adv. 2024, 10(25), eadm9817. [Google Scholar] [CrossRef] [PubMed]
- Habermann, A.C.; Gutierrez, A.J.; Bui, L.T.; et al. Single-cell RNA sequencing reveals profibrotic roles of distinct epithelial and mesenchymal lineages in pulmonary fibrosis. Sci. Adv. 2020, 6(28), eaba1972. [Google Scholar] [CrossRef] [PubMed]
- Yamamoto, A.; Fujii, N.; Seike, K.; et al. Spatial transcriptomics analysis of macrophage-to-myofibroblast transition in bronchiolitis obliterans following hematopoietic stem cell transplantation. Transpl. Cell Ther. 2026, 32(4), 454–465. [Google Scholar] [CrossRef] [PubMed]
- Kim, S.J.; Cecchini, M.J.; Woo, E.; et al. Spatially resolved gene expression profiles of fibrosing interstitial lung diseases. Sci. Rep. 2024, 14, 26470. [Google Scholar] [CrossRef] [PubMed]
- Richeldi, L.; du Bois, R.M.; Raghu, G.; et al. Efficacy and safety of nintedanib in idiopathic pulmonary fibrosis. N Engl. J. Med. 2014, 370(22), 2071–2082. [Google Scholar] [CrossRef] [PubMed]
- King, T.E., Jr.; Bradford, W.Z.; Castro-Bernardini, S.; et al. A phase 3 trial of pirfenidone in patients with idiopathic pulmonary fibrosis. N Engl. J. Med. 2014, 370(22), 2083–2092. [Google Scholar] [CrossRef] [PubMed]
- Wynn, T.A.; Vannella, K.M. Macrophages in tissue repair, regeneration, and fibrosis. Immunity 2016, 44(3), 450–462. [Google Scholar] [CrossRef] [PubMed]
- Misharin, A.V.; Morales-Nebreda, L.; Reyfman, P.A.; et al. Monocyte-derived alveolar macrophages drive lung fibrosis and persist in the lung over the life span. J. Exp. Med. 2017, 214(8), 2387–2404. [Google Scholar] [CrossRef] [PubMed]
- Morse, C.; Tabib, T.; Sembrat, J.; et al. Proliferating SPP1/MERTK-expressing macrophages in idiopathic pulmonary fibrosis. Eur. Respir. J. 2019, 54(2), 1802441. [Google Scholar] [CrossRef] [PubMed]
- Adams, T.S.; Schupp, J.C.; Poli, S.; et al. Single-cell RNA-seq reveals ectopic and aberrant lung-resident cell populations in idiopathic pulmonary fibrosis. Sci. Adv. 2020, 6(28), eaba1983. [Google Scholar] [CrossRef] [PubMed]
- Reyfman, P.A.; Walter, J.M.; Joshi, N.; et al. Single-cell transcriptomic analysis of human lung provides insights into the pathobiology of pulmonary fibrosis. Am. J. Respir. Crit. Care Med. 2019, 199(12), 1517–1536. [Google Scholar] [CrossRef] [PubMed]
- Ramachandran, P.; Dobie, R.; Wilson-Kanamori, J.R.; et al. Resolving the fibrotic niche of human liver cirrhosis at single-cell level. Nature 2019, 575(7783), 512–518. [Google Scholar] [CrossRef] [PubMed]
- Fabre, T.; Barron, A.M.S.; Christensen, S.M.; et al. Identification of a broadly fibrogenic macrophage subset induced by type 3 inflammation. Sci. Immunol. 2023, 8(85), eadd8945. [Google Scholar] [CrossRef] [PubMed]
- Valenzi, E.; et al. Single-cell analysis reveals fibroblast heterogeneity and myofibroblasts in systemic sclerosis-associated interstitial lung disease. Ann. Rheum. Dis. 2019, 78(10), 1379–1387. [Google Scholar] [CrossRef] [PubMed]
- Travaglini, K.J.; et al. A molecular cell atlas of the human lung from single-cell RNA sequencing. Nature 2020, 587, 619–625. [Google Scholar] [CrossRef] [PubMed]
- Chakarov, S.; Lim, H.Y.; Tan, L.; et al. Two distinct interstitial macrophage populations coexist across tissues in specific subtissular niches. Science 2019, 363(6432), eaau0964. [Google Scholar] [CrossRef] [PubMed]
- Nalio Ramos, R.; Missolo-Koussou, Y.; Gerber-Ferder, Y.; et al. Tissue-resident FOLR2+ macrophages associate with CD8+ T cell infiltration in human breast cancer. Cell 2022, 185(7), 1189–1207.e25. [Google Scholar] [CrossRef] [PubMed]
- Bugatti, M.; Bergamini, M.; Missale, F.; et al. A population of TIM4+FOLR2+ macrophages localized in tertiary lymphoid structures correlates to an active immune infiltrate across several cancer types. Cancer Immunol. Res. 2022, 10(11), 1340–1353. [Google Scholar] [CrossRef] [PubMed]
- Schniering, J.; Benešová, M.; Brunner, M.; et al. 18F-AzaFol for detection of folate receptor-β positive macrophages in experimental interstitial lung disease—a proof-of-concept study. Front Immunol. 2019, 10, 2724. [Google Scholar] [CrossRef] [PubMed]
- Hinz, B.; Lagares, D. Evasion of apoptosis by myofibroblasts: a hallmark of fibrotic diseases. Nat. Rev. Rheumatol. 2020, 16(1), 11–31. [Google Scholar] [CrossRef] [PubMed]
- Lagares, D.; Santos, A.; Grasberger, P.E.; et al. Targeted apoptosis of myofibroblasts with the BH3 mimetic ABT-263 reverses established fibrosis. Sci. Transl. Med. 2017, 9(420), eaal3765. [Google Scholar] [CrossRef] [PubMed]
- Martinez, F.O.; Gordon, S. The M1 and M2 paradigm of macrophage activation: time for reassessment. F1000Prime Rep. 2014, 6, 13. [Google Scholar] [CrossRef] [PubMed]
- Aran, D.; Looney, A.P.; Liu, L.; et al. Reference-based analysis of lung single-cell sequencing reveals a transitional profibrotic macrophage. Nat. Immunol. 2019, 20(2), 163–172. [Google Scholar] [CrossRef] [PubMed]
- Aegerter, H.; Lambrecht, B.N. The pathology of asthma: what is obstructing our view? Annu Rev. Pathol. 2023, 18, 387–409. [Google Scholar] [CrossRef] [PubMed]
- Certo, M.; Del Gaizo Moore, V.; Nishino, M.; et al. Mitochondria primed by death signals determine cellular addiction to antiapoptotic BCL-2 family members. Cancer Cell 2006, 9(5), 351–365. [Google Scholar] [CrossRef] [PubMed]
- Hao, Y.; Hao, S.; Andersen-Nissen, E.; et al. Integrated analysis of multimodal single-cell data. Cell 2021, 184(13), 3573–3587.e29. [Google Scholar] [CrossRef] [PubMed]
- Wolf, F.A.; Angerer, P.; Theis, F.J. SCANPY: large-scale single-cell gene expression data analysis. Genome Biol. 2018, 19, 15. [Google Scholar] [CrossRef] [PubMed]
- Merritt, C.R.; Ong, G.T.; Church, S.E.; et al. Multiplex digital spatial profiling of proteins and RNA in fixed tissue. Nat. Biotechnol. 2020, 38(5), 586–599. [Google Scholar] [CrossRef] [PubMed]
- Joshi, N.; Watanabe, S.; Verma, R.; et al. A spatially restricted fibrotic niche in pulmonary fibrosis is sustained by M-CSF/M-CSFR signalling in monocyte-derived alveolar macrophages. Eur. Respir. J. 2020, 55(1), 1900646. [Google Scholar] [CrossRef] [PubMed]
- Guilliams, M.; Svedberg, F.R. Does tissue imprinting restrict macrophage plasticity? Nat. Immunol. 2021, 22(2), 118–127. [Google Scholar] [CrossRef] [PubMed]
- Zagórska, A.; Través, P.G.; Lew, E.D.; Dransfield, I.; Lemke, G. Diversification of TAM receptor tyrosine kinase function. Nat. Immunol. 2014, 15(10), 920–928. [Google Scholar] [CrossRef] [PubMed]
- Tsukui, T.; Sun, K.H.; Wetter, J.B.; et al. Collagen-producing lung cell atlas identifies multiple subsets with distinct localization and relevance to fibrosis. Nat. Commun. 2020, 11(1), 1920. [Google Scholar] [CrossRef] [PubMed]
- Ebener, S.; Barnowski, S.; Wotzkow, C.; et al. Toll-like receptor 4 activation attenuates profibrotic response in control lung fibroblasts but not in fibroblasts from patients with idiopathic pulmonary fibrosis. Am. J. Physiol. Lung Cell Mol. Physiol. 2017, 312(1), L42–L55. [Google Scholar] [CrossRef] [PubMed]
- Baer, J.M.; Zuo, C.; Kang, L.I.; et al. Fibrosis induced by resident macrophages has divergent roles in pancreas inflammatory injury and PDAC. Nat. Immunol. 2023, 24(9), 1443–1457. [Google Scholar] [CrossRef] [PubMed]
- Mayr, C.H.; Santacruz, D.; Jarosch, S.; et al. Spatial transcriptomic characterization of pathologic niches in IPF. Sci. Adv. 2024, 10(32), eadl5473. [Google Scholar] [CrossRef] [PubMed]
- McGregor, C.; Qin, X.; Jagielowicz, M.; et al. Spatial fibroblast niches define Crohn’s fistulae. Nature 2026, 649(8097), 703–712. [Google Scholar] [CrossRef] [PubMed]
- She, Y.; Xu, X.; Yu, Q.; Yang, X.; He, J.; Tang, X.X. Elevated expression of macrophage MERTK exhibits profibrotic effects and results in defective regulation of efferocytosis function in pulmonary fibrosis. Respir. Res. 2023, 24(1), 118. [Google Scholar] [CrossRef] [PubMed]
- Redente, E.F.; Keith, R.C.; Janssen, W.; et al. Loss of Fas signaling in fibroblasts impairs homeostatic fibrosis resolution and promotes persistent pulmonary fibrosis. JCI Insight 2021, 6(1), e141618. [Google Scholar] [CrossRef] [PubMed]
- Redente, E.F.; et al. Conditional BCL-2 expression in fibroblasts promotes persistent pulmonary fibrosis which is reversible by therapeutic BCL-2 inhibition. Nat. Commun. 2026, 17(1), 3317. [Google Scholar] [CrossRef] [PubMed]
- Cooley, J.C.; Javkhlan, N.; Wilson, J.A.; et al. Inhibition of antiapoptotic BCL-2 proteins with ABT-263 induces fibroblast apoptosis, reversing persistent pulmonary fibrosis. JCI Insight 2023, 8(3), e163762. [Google Scholar] [CrossRef] [PubMed]
- Sikkema, L.; Ramírez-Suástegui, C.; Strobl, D.C.; et al. An integrated cell atlas of the lung in health and disease. Nat. Med. 2023, 29(6), 1563–1577. [Google Scholar] [CrossRef] [PubMed]
- Alexanian, M.; Srivastava, D. The regulatory logic linking inflammation and fibrosis. Cell 2026, 189(18), 5488–5503. [Google Scholar] [CrossRef] [PubMed]
Disclaimer/Publisher’s Note: The statements, opinions and data contained in all publications are solely those of the individual author(s) and contributor(s) and not of MDPI and/or the editor(s). MDPI and/or the editor(s) disclaim responsibility for any injury to people or property resulting from any ideas, methods, instructions or products referred to in the content. |
© 2026 by the authors. Licensee MDPI, Basel, Switzerland. This article is an open access article distributed under the terms and conditions of the Creative Commons Attribution (CC BY) license.
Copyright: This open access article is published under a Creative Commons CC BY 4.0 license, which permit the free download, distribution, and reuse, provided that the author and preprint are cited in any reuse.