

Submitted:
29 October 2026
Posted:
30 October 2026
You are already at the latest version
Abstract
Background: Controversy remains about the optimal age at which screening mammography should be started. Methods: Cost-effectiveness analysis was based on a British Columbia birth cohort of 40,000 individuals, including 19,661 women alive at age 40. Ten screening scenarios were modeled: no screening versus best-in-the-world screening rates for ages 40-44, 45-49, 50-54, 55-59, 60-64, 65-69, 70-74, 75-79, 50-74, 40-74. The main outcomes included breast cancers treated by stage at diagnosis, deaths attributable to breast cancer averted, and quality-adjusted life years (QALY) gained or lost associated with ruling out false-positive results, receiving treatment, the metastatic phase, and living in remission. Results: Screening in women aged 50-74 would result in 92.9 deaths avoided and 889 QALYs gained, at a cost of $ 38,242 per QALY. Screening in women aged 40-74 would result in 99.6 deaths avoided and 744 QALYs gained, at a cost of $ 71,155 per QALY gained. Excluding patient time costs reduced the cost per QALY to $ 2,086 and $ 13,622, respectively. The only scenario in which benefits outweighed harms in women aged 40–49 was when harms attributable to false-positive results were excluded in the model, resulting in a cost per QALY of $ 138,594 and $ 83,210 in women aged 40-44 and 45-49, respectively. Conclusion(s): Our model results are highly sensitive to assumptions regarding utility losses associated with false-positive screening results and inclusion/exclusion of patient time costs, especially in younger women. Subsequent modeling investigations and policymakers who may utilize these investigations should be aware of the impact of these assumptions on model results.
Keywords:
breast cancer
; screening mammography
; cost-effectiveness
; younger women
1. Introduction
In the United States, the age-standardized breast cancer mortality rate decreased by 58% between 1975 and 2019, with an estimated 25% attributable to screening mammography, and the remainder due to improvements in treatment.[1] A similar 47% reduction was observed in Canada between 1986 and 2020.[2]
Despite the benefits of mammography screening, controversy remains regarding the optimal age to begin screening. In April 2024, the United States Preventive Services Task Force (USPSTF) recommended biennial screening mammography for women aged 40-74.[3] In May 2024, the Canadian Task Force on Preventive Health Care (CTFPHC) suggested systematic screening for women aged 50-74 every two to three years, but recommended against screening women aged 40-49, concluding that harms may outweigh benefits.[4] Recent observational and economic studies in Canada suggest that women in their 40s may benefit from systematic screening,[5] and that such screening may be cost-effective,[6] although analyses assessing cost-effectiveness remain limited. This study assessed the cost-effectiveness, by five-year age group, of population-based mammography screening in asymptomatic women aged 40-79 with an average risk of breast cancer.
2. Methods
2.1. Study Setting
British Columbia (BC) is Canada’s westernmost province with a population of 5.7 million.[7] BC initiated the first organized mammography screening program in North America in 1988.[8] By 1997, 90% of BC women had access to the BC Cancer Breast Screening Program (BSP) within a 30-minute commute.[9] In 1997, the BSP shifted its recruitment towards women aged 50-74.[10] Current BSP recommendations advise women aged 40-49 without a family history of breast cancer to discuss screening with their healthcare providers. Screening mammography, if chosen, is available every two years.[11]
BC Cancer provides comprehensive cancer control for the people of BC, including prevention, screening, diagnosis, treatment, and supportive care. The BC Cancer Registry records all cancer diagnoses in the province and supports surveillance, research, and health care planning.
2.2. Model Overview
In 2007, the BC Ministry of Health (MoH)established the Clinical Prevention Policy Review Committee to recommend a mechanism for reviewing evidence and policy related to clinical prevention interventions.[12] Subsequently, the Lifetime Prevention Schedule Expert Committee (LPSEC) was established, and a modeling approach was developed to estimate the clinically preventable burden (CPB) and cost-effectiveness (CE) of preventive services in BC. CPB represents the QALYs gained if a service was delivered to a BC birth cohort of 40,000 individuals over the recommended age range. CE was defined as the net cost per QALY gained. Additional details regarding the modeling approach are provided elsewhere.[13,14,15]
Since 2009, the LPSEC has reviewed and modeled 31 preventive services, including screening mammography, estimating a cost per QALY of $19,720 (in 2017 Canadian dollars) in women aged 50-74.[13] To support policy decisions regarding the age ranges for BC’s screening mammography program, in 2024, the BC MoH requested that the LPSEC collaborate with BC Cancer to conduct this analysis.
2.3. Data Sources
Data were obtained from the BSP information system, which integrates screening clinic data, pathology records, demographics, and vital status from the BC MoH, fee-for-service billed diagnostic procedures with cancer diagnosis information from the BC Cancer Registry.
Up-to-date screening rates (proportion of eligible women completing a BSP mammogram within 30 months) were compiled by the Data and Analytics group at BC Cancer.[16] To estimate achievable screening participation, we examined results from the state of Massachusetts, which are among the highest screening rates globally [17] (Table 1; eTable1 in Supplement).
Screening results were based on 988,149 mammograms completed between January 1, 2015, and December 31, 2019, in women aged 40-79 at average risk (Table 1; eTable2 in the Supplement).[18]
The stage at diagnosis by age and screening status was based on 22,141 incident cases of breast cancer diagnosed between January 1, 2010, and December 31, 2017, aligning with the timeline for use of the 7th edition of the American Joint Committee on Cancer Staging Manual by BC Cancer (7th ed. AJCC CSM) (Table 1; eTable3 in the Supplement).[19]
Breast cancer-specific survival by stage was based on 14,693 incident breast cancer cases diagnosed between January 1, 2010, and December 31, 2014, allowing up to 10 years of follow-up using the 7th edition of the AJCC CSM (Table 1; eTable4 in the Supplement).[19]
Estimates of overdiagnosis of invasive breast cancer and ductal carcinoma in situ (DCIS) after initiation of the BSP in BC were obtained from Coldman and Phillips using the excess incidence approach. They defined overdiagnosis as “incidence rates after the introduction of mammography screening (that) are higher than would be expected from the early detection of clinically significant disease alone.” [20] (Table 1; e Tables 5–7 in the Supplement).
Data on changes in quality of life (QoL) attributable to diagnosis and treatment, metastatic and remission phases for breast cancer are derived from the Global Burden of Disease study.[21,22] Changes in QoL attributable to false-positive mammography results are from Matza et al.[23] Utility losses were adjusted for age based on data from Sullivan et al. (Table 1; Supplement).[15,24,25]
Mammography screening program costs are taken from the 2023 BSP annual report.[26] Costs associated with the investigation of positive screening results were obtained from Mittmann et al.[27] Costs associated with treating breast cancer were obtained from Wilkinson et al.[28] Patient time costs associated with screening and follow-up after false-positive screening are based on the average hourly wage rate in BC.[29] All costs are expressed in 2025 Canadian dollars (Supplement).
2.4. Model Inputs
Model inputs are summarized on Table 1.
2.5. Statistical Analysis
2.5.1. Economic Analysis
The perspective of this analysis is that of the healthcare system and the patient. Healthcare system costs included screening, follow-up testing, and treatment. Patient time costs included screening mammography and follow-up testing after a false-positive result (Supplement). QALYs gained/lost included false-positive results, breast cancer treatment and survivorship, and life years lost due to premature death attributable to breast cancer.
The comparison of costs and QALYs gained/lost is based on age-specific screening rates observed in Massachusetts.[17]
Costs, QALYs gained/lost, and cost per QALY are presented without discounting (Table 2).
2.5.2. Sensitivity Analysis
To test model sensitivity regarding the one-time utility loss associated with a false-positive mammography result, we used upper and lower 95% confidence intervals (CI) and excluded any utility loss. A false-positive mammography result not requiring biopsy was associated with a one-time utility loss of 3.1% (95% CI 2.1% to 4.1%). If a biopsy was required, the utility loss was 5.8% (95% CI 4.2% to 7.3%).[23]
Currently screened women aged 40-49 may not be representative of the BC population aged 40-49, potentially resulting in selection or volunteer bias. This could have resulted in abnormal call rates and follow-up procedures differing from those observed in screened women aged 40-49 between 2015 and 2019. To test this possibility, we reduced the abnormal call rate and number of follow-up procedures by 10/20/30%.
Utility loss associated with diagnosis and treatment (28.8% [95% CI 19.3% to 39.9%][22] for 3 months [21]), the metastatic phase (45.1% [95% CI 30.7% to 60.0%][22] for 17.7 months [21]) and remission (4.9% [95% CI 3.1% to 7.2%[21]] were also modified using upper and lower 95% CIs.
While the perspective of this analysis included the patient, we also excluded patient time costs and utility losses attributable to false-positive screening results.
All healthcare costs were modified by ± 25% to assess the sensitivity to treatment cost estimates reported in other Canadian studies. While the base case did not include discounting, discount rates of 1.5% and 3.0% were tested in the sensitivity analysis.[30]
3. Results
In BC, between 2015 and 2019, 92,260 of 988,149 (9.3%) mammograms returned abnormal results. After follow-up testing, 5,539 (6.0%) were malignancies, suggesting 86,721 false-positive results in women aged 40–79 years, representing 94.0% of the abnormal findings. The proportion of false-positive results declined with age, from 98.1% in aged 40-44 to 87.4% in aged 75-79 (Figure 1; eTable2 in Supplement).
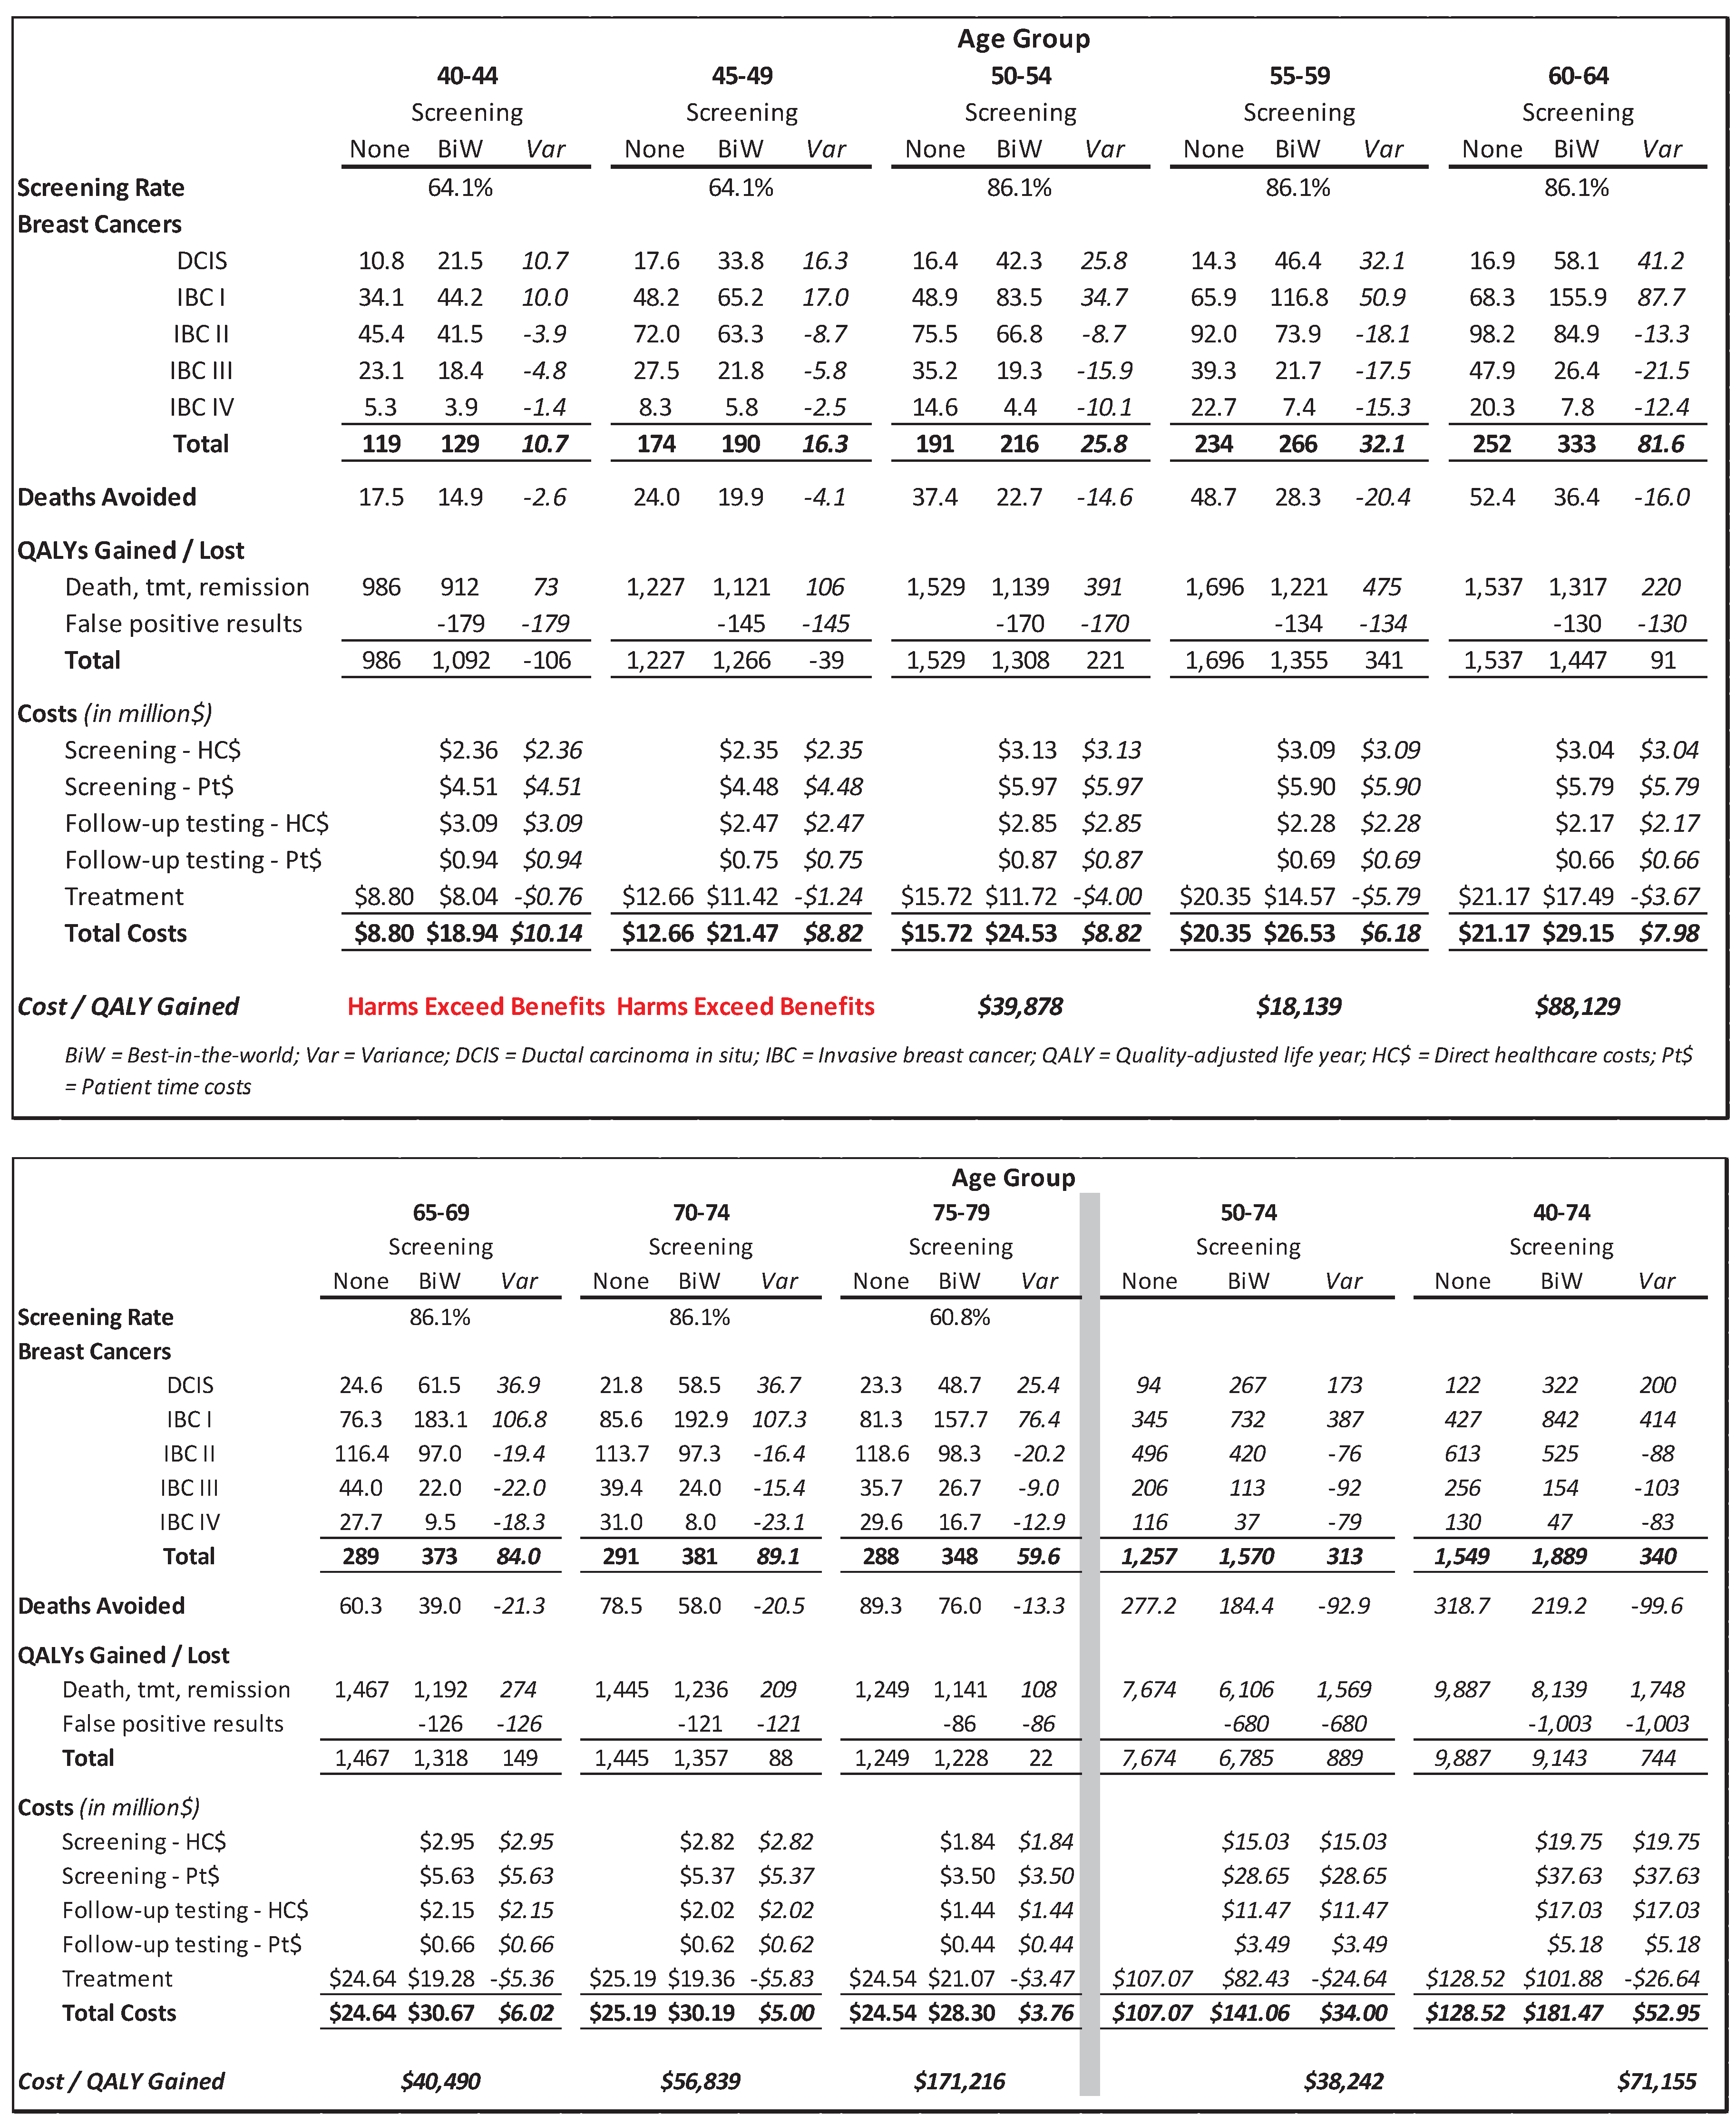
A BC birth cohort of 40,000 included 19,661 women who were alive at 40 years of age. Applying age-specific screening rates observed in Massachusetts in women aged 40-74 would result in 99.6 premature deaths attributable to breast cancer avoided and 744 QALYs gained, at a cost of $71,155 per QALY. Screening women aged 50-74 would result in 92.9 deaths avoided and 889 QALYs gained, at a cost of $38,242 per QALY (Table 2).
In our base model, screening between 40-44 resulted in 2.6 deaths avoided with an overdiagnosis of 10.7 DCIS. Seventy-three QALYs gained from breast cancers and deaths avoided were offset by 179 QALYs lost due to harms associated with false-positive screening results, yielding a net loss of 106 QALYs. Screening between 45-49 resulted in 4.1 deaths avoided with an overdiagnosis of 16.3 DCIS. The 106 QALYs gained from breast cancers and deaths avoided were offset by 145 QALYs lost due to harms associated with false-positive screening results, yielding a net loss of 39 QALYs. Screening for all other age groups yielded a net gain in QALYs, ranging from 22 QALYs gained for ages 75-79 to 341 QALYs gained for ages 55-59 (Table 2).
Our model included rates of overdiagnosis of DCIS at all ages, ranging from 144% for ages 45-49 to 283% for ages 60-64 (Table 1). Overdiagnosis of invasive cancers was included for ages 60-79, averaging 21% (Table 1). In a BC birth cohort of 40,000 screened between the ages of 40-74, this corresponded to 200 DCIS and 140 invasive cancers. Screening between the ages of 50-74 resulted in the overdiagnosis of 173 DCIS and 140 invasive cancers (Table 2).
The average cost per QALY for screening ages 50-74 was $38,242, ranging from $18,139 for ages 50-54 to $88,129 for ages 60-64. Screening between ages 75-79 was associated with a modest net gain of 22 QALYs at a cost of $171,216 per QALY (Table 2).
Sensitivity Analysis
The model results are highly sensitive to assumptions regarding the utility loss from false-positive mammography. Assuming no utility loss yielded the highest estimated number of QALYs gained in each age group (Figure 2). For ages 40–44, this was the only assumption under which benefits exceeded harms (73 QALYs). For ages 45–49, this assumption yielded a net gain of 106 QALYs. In this group, two other scenarios resulted in a small net gain of six QALYs, including decreasing the false-positive utility loss to the lower end of the 95% CI and reducing abnormal call rates and follow-up procedures by 30%.
For ages 40-59, the lowest QALY estimates occurred when the false-positive utility loss was increased to the upper 95% CI, resulting in a net loss of 161 QALYs for ages 40-44, a net loss of 83 QALYs for ages 45-49, a net gain of 169 QALYs for ages 50-54 and a net gain of 300 QALYs for ages 55-59.
For ages 60-79, assumptions about utility losses associated with diagnosis and treatment, metastatic phase, and remission (using the upper end of the 95% CI) produced the lowest QALY estimates. This likely reflects lower false-positive rates with increasing age (Figure 1) and estimated overdiagnosis of invasive cancers beginning at the age of 60 years. This assumption resulted in a net gain/loss of 19, 86, 32 and -7 QALYs for ages 60-64, 65-69, 70-74 and 75-79, respectively.
The only scenario in which screening benefits exceeded harms across all age groups was when harms associated with false-positive results were excluded. The cost per QALY would be $136,594 and $83,210 in women aged 40-44 and 45-49, respectively. For all the other age groups, the cost per QALY ranged from $13,022 to $36,239 (Figure 3).
If we exclude the false-positive utility loss, screening women aged 50-74 would result in 1,569 QALYs gained at a cost of $21,673 per QALY (eTable8 in Supplement).
The model was also sensitive to the inclusion/exclusion of patient time costs. If we exclude patient time costs, the cost per QALY gained in women aged 50-74 would be reduced to $2,086 (eTable8 in Supplement).
Excluding both false-positive utility loss and patient time costs would further reduce the cost per QALY to $1,182. In this scenario, screening in women aged 40-74 would result in 1,748 QALYs gained, at a cost of $5,800 per QALY (eTable8 in Supplement).
4. Discussion
Our modeling suggested that, in a BC birth cohort of 40,000, progressing from no mammography screening to age-specific screening rates observed in Massachusetts in women aged 40-74 would result in 99.6 premature deaths attributable to breast cancer avoided and 744 QALYs gained, at a cost of $71,155 per QALY gained. Screening ages 50-74 would result in 92.9 premature deaths avoided and 889 QALYs gained, at a cost of $38,242 per QALY.
The model is highly sensitive to assumptions regarding utility losses associated with false-positive screening results, particularly in younger women. Benefits exceed harms in the 40-44 and 45-49 age groups only if these utility losses are excluded. This underscores the importance of informed decision making for women considering screening in their 40s.
Wilkinson et al. estimated that biennial screening of 1000 women aged 50-74 would yield $1.55 million (in 2023 Canadian dollars) in cost savings and 108 QALYs gained, with $1.63 million savings and 149 QALYs for women aged 40-74.[6] These results differ substantially from our base model results, likely due to modeling assumptions. No disutility from false-positive results appears to have been included in the Wilkinson model. The estimated cost per false-positive workup ($81.56) appears to include only physician fees.[31] Our cost of follow-up tests per false-positive result is $840 based on information from Mittmann et al.[27] There also appears to be a difference in the distribution of tumors by stage. For biennial screening between ages 50-74, the Wilkinson model estimated 10.7% DCIS, 44.0% Stage I, 31.9% Stage II, 9.5% Stage III, and 3.9% Stage IV. Our equivalent results are 17.0/46.7/26.8/7.2/2.4%. No patient time costs were included in the Wilkinson model.
The cost per QALY in our model is reduced from $38,242 to $21,673 in women aged 50-74 if utility losses associated with false-positive screening are excluded. Excluding patient time costs decreases the cost per QALY to $2,086. Excluding both reduces the cost per QALY to $1,182, highlighting the importance of including/excluding a patient perspective when modeling cost-effectiveness of mammography screening. These assumptions are particularly important in the 40–49 age group.
To estimate utility losses, we used data from Matza et al.[23] They note that the period between a false-positive result and confirmation that breast cancer is absent may involve emotional distress and invasive follow-up investigations. Matza et al. estimated a one-time average utility loss, with and without biopsy, of 3.1% (95% CI, 2.1%–4.1%) and 5.8% (95% CI, 4.2%–7.3%), respectively. Individual reactions to false-positive mammography results can vary, ranging from “one of many minor stressful experiences creating a temporary decrease in quality of life” to “the worst thing they have ever experienced.”[32] Other researchers found long-term psychosocial consequences associated with false-positive mammography screening results,[33] including reduced screening retention.[26,34,35]
Another potential harm associated with mammography screening is overdiagnosis and overtreatment, particularly for DCIS. Our analysis suggested that detected and treated DCIS would increase from 94 to 267 (+184%) with screening ages of 50-74 and 122 to 322 (+163%) with screening ages of 40-74.
The COMET randomized clinical trial evaluated active monitoring versus surgery for low-risk DCIS. Monitoring involved diagnostic mammograms every six months in the affected breast and annually in the contralateral breast. At two years, invasive cancer rates did not differ between active monitoring and guideline-concordant care. A longer follow-up period is ongoing.[36]
Others have suggested removing the word ‘cancer’ from tumors that are unlikely to become clinically significant, because “the word cancer generates fear and anxiety, which leads to overtreatment of tumors that are almost never associated with invasion and disease progression.”[37]
Regardless of whether screening is systematically offered to women aged 40-49, it is important to distinguish between universal screening offered to asymptomatic women at average risk and case-finding. Case-finding is typically a targeted activity in individuals who seek care for their current symptoms or identified risk factors. Screening is a proactive population-based approach for the early detection of diseases in asymptomatic individuals.
Systematic screening of women aged 50-74 for breast cancer is both effective and cost-effective. Efforts should focus on increasing screening participation in this group to maximize benefits. Achieving higher screening participation may also depend on addressing geographic and socioeconomic barriers to access.
Limitations
Key model assumptions were derived from large population-based screening datasets, allowing cost-effectiveness estimates by five-year age groups in women aged 40-79. These assumptions included abnormal call rates and follow-up testing to rule out false-positive results, stage at diagnosis and screening status, and survival by age and stage at diagnosis for 10 years following diagnosis. Limitations remain.
First, our model did not incorporate breast density data. Dense breast tissue, which is radio-opaque, is more common in premenopausal women and may impede the detection of cancer while increasing the risk.[38,39,40]
Second, the underlying BC data for women aged 40-49 may not be representative, as systematic screening in this population is not currently recommended. This may have introduced selection bias.
Third, we did not differentiate between the first and the subsequent screens. In BC in 2023, the abnormal call rate on first screens in average-risk women aged 40+ was 18.0% compared to 6.4% for subsequent screens.[26] Abnormal call rates drop substantially during subsequent screening rounds due to the availability of prior images for comparison.[41,42]
Fourth, the underlying risks of breast cancer in women aged 40-49 years in BC may differ from those observed in the U.S. A key reason cited by the USPSTF in recommending systematic screening for women 40-49 was a noticeable increase in breast cancer incidence in this cohort between 2015 and 2019. A similar trend does not appear in BC, as incidence rates in women aged 40-49 remain constant from 1971 to 2019 (eTable 9 in Supplement).
5. Conclusions
Models assessing the cost-effectiveness of population-based screening mammography in asymptomatic women are highly sensitive to assumptions regarding potential utility losses associated with false-positive screening results and the inclusion/exclusion of patient time costs. This is particularly important when assessing cost-effectiveness in younger women. Modeling investigations and policymakers should be aware of the impact of these assumptions on model results.
Supplementary Materials
The following supporting information can be downloaded at the website of this paper posted on Preprints.org.
Funding
This work was funded by the British Columbia Ministry of Health. The funder did not play a role in the design of the study; the collection, analysis, and interpretation of the data; the writing of the manuscript; and the decision to submit the manuscript for publication.
Data Availability Statement
The data underlying this article are available in the article and in its online supplementary material.
Acknowledgments
We would like to acknowledge and thank Hugo Britto, Kimberly DeVries, Meghan O’Neill, and Ryan Woods of the Data and Analytics Team at BC Cancer. This detailed analysis would not have been possible without their dedicated effort to compile data supporting our cost-effectiveness modeling.:
Conflicts of Interest
The authors declare that they have no affiliations with or involvement in any organization or entity with any financial interest in the subject matter or materials discussed in this manuscript.
References
- Caswell-Jin, J.L.; Sun, L.P.; Munoz, D.; et al. Analysis of breast cancer mortality in the US – 1975 to 2019. JAMA 2024, 331(3), 233–241. [Google Scholar] [CrossRef]
- Canadian Cancer Statistics Advisory Committee in collaboration with the Canadian Cancer Society; Statistics Canada and the Public Health Agency of Canada. Canadian Cancer Statistics 2023; Canadian Cancer Society: Toronto, ON, 2023; Available online: https://cdn.cancer.ca/-/media/files/research/cancer-statistics/2023-statistics/2023_PDF_EN.pdf (accessed on 7 January 2026).
- Nicholson, W.K.; Silverstein, M.; Wong, J.B.; et al. US Preventive Services Task Force. Screening for breast cancer. US Preventive Services Task Force Recommendation Statement. JAMA 2024, 331(22), 1918–1930. [Google Scholar] [CrossRef]
- Canadian Task Force on Preventive Health Care. Breast Cancer (Update) – Draft Recommendations. December 2024. Available online: https://canadiantaskforce.ca/guidelines/published-guidelines/breast-cancer-update-2024/ (accessed on 7 January 2026).
- Ngo, N.N.; Brooks, J.D. Earlier screening, better outcomes? Revisiting breast cancer screening guidelines for women in their 40s. Can. J. Public Health 2025. [Google Scholar] [CrossRef]
- Wilkinson, A.N.; Mainprize, J.G.; Yaffe, M.; et al. Cost-effectiveness of breast cancer screening using digital mammography in Canada. JAMA Netw. Open 2025, 8(1), e2452821. [Google Scholar] [CrossRef]
- BCStats. 2025 Population Estimates and Projections. December 2025. Available online: https://www2.gov.bc.ca/assets/gov/data/statistics/people-population-community/population/people_2025_population_projections.pdf (accessed on 16 February 2026).
- Gordon, P.B. Breast cancer screening in BC: What we should be proud of and how to make it even better. BC Med. J. 2023, 65(4), 133–138. [Google Scholar]
- Olivotto, I.A.; Kan, L.; d’Yachkova, Y.; et al. Ten years of breast cancer screening in the Screening Mammography Program of British Columbia, 1988 – 97. J. Med. Screen. 2000, 7, 152–159. [Google Scholar]
- Coldman, A.J.; Phillips, N.; Olivotto, I.A.; et al. Impact of changing the annual to biennial mammographic screening on breast cancer outcomes in women aged 50-79 in British Columbia. J. Med. Screen. 2008, 15(4), 182–187. [Google Scholar] [CrossRef]
- Cancer, B.C. BC Cancer Screening: Who Should Screen? Available online: http://www.bccancer.bc.ca/screening/breast/who-should-screen (accessed on 15 April 2024).
- The Report of the Clinical Prevention Policy Review Committee. A Lifetime of Prevention. December 2009. Available online: https://www2.gov.bc.ca/assets/gov/health/about-bc-s-health-care-system/health-priorites/lifetime-prevention-schedule/cppr-lifetime-prevention-report-2009.pdf (accessed on 16 February 2026).
- Krueger, H.; Robinson, S.; Hancock, T.; et al. Priorities among effective clinical preventive services in British Columbia, Canada. BMC Health Serv. Res. 2022, 22, 564. [Google Scholar] [CrossRef]
- BC Ministry of Health. Lifetime Prevention Schedule. Reference Document and Key Assumptions . May 2024. Available online: https://www2.gov.bc.ca/assets/gov/health/about-bc-s-health-care-system/health-priorites/lifetime-prevention-schedule/images/reference-document-2024.pdf (accessed on 13 January 2026).
- BC Ministry of Health. Lifetime Prevention Schedule. Establishing Priorities among Effective Clinical Prevention Services in British Columbia; Summary and Technical Report. May 2024. Available online: https://www2.gov.bc.ca/assets/gov/health/about-bc-s-health-care-system/health-priorites/lifetime-prevention-schedule/images/lps-update-report-2024.pdf (accessed on 13 January 2026).
- Bykov, Dmitriy. Manager, Data and Analytics, Prevention, Screening and HCP at BC Cancer. Personal communication, 13 January 2025. [Google Scholar]
- Howard, D.H.; Tangka, F.K.; Miller, J.; Sabatino, S.A. Variation in state-level mammography use, 2012 and 2020. Public Health Rep. 2024, 139(1), 59–65. [Google Scholar] [CrossRef]
- Britto, Hugo. Senior Business Analyst, Cancer Informatics and Analytics at BC Cancer. Personal communication, 20 January 2025. [Google Scholar]
- DeVries, Kimberly. Biostatistical Analyst | Interim Manager, Data and Analytics at BC Cancer. Personal communication, 27 December 2024. [Google Scholar]
- Coldman, A.; Phillips, N. Incidence of breast cancer and estimates of overdiagnosis after the initiation of a population-based mammography screening program. Can. Med. Assoc. J. 2013, 185(10), E492-498. [Google Scholar] [CrossRef]
- Fitzmaurice, C.; Allen, C.; Barber, R.; et al. Global, regional, and national cancer incidence, mortality, years of life lost, years lived with disability, and disability-adjusted life-years for 32 cancer groups, 1990 to 2015: a systematic analysis for the global burden of disease study. JAMA Oncol. 2017, 3(4), 524–548. [Google Scholar] [CrossRef]
- Institute for Health Metrics and Evaluation. GBD 2016 Sequelae, Health States, Health State Lay Descriptions, and Disability Weights. Available online: http://ghdx.healthdata.org/record/global-burden-disease-study-2016-gbd-2016-disability-weights (accessed on 9 January 2026).
- Matza, L.S.; Howell, T.A.; Fung, E.T.; et al. Health state utilities associated with false-positive cancer screening results. PharmacoEconomics-Open 2024, 8, 263–276. [Google Scholar] [CrossRef]
- Sullivan, P.W.; Ghushchyan, V. Preference-based EQ-5D index scores for chronic conditions in the United States. Med. Decis. Mak. 2006, 26(4), 410–420. [Google Scholar] [CrossRef]
- Sullivan, P.W.; Slejko, J.F.; Sculpher, M.J.; et al. Catalogue of EQ-5D scores for the United Kingdom. Med. Decis. Mak. 2011, 31(6), 800–804. [Google Scholar] [CrossRef]
- Cancer, B.C. Breast Screening: 2023 Program Results. September 2025. Available online: https://www.bccancer.bc.ca/screening/Documents/Breast-Screening-Program-Report-2023.pdf (accessed on 12 January 2026).
- Mittman, N.; Stout, N.K.; Tosteson, A.N.; et al. Cost-effectiveness of mammography from a publicly funded health system perspective. CMAJ Open 2018, 6(1), E77-86. [Google Scholar] [CrossRef]
- Wilkinson, A.N.; Seely, J.M.; Rushton, M.; et al. Capturing the true cost of breast cancer treatment: Molecular subtype and stage-specific per-case activity-based costing. Curr. Oncol. 2023, 30, 7860–7873. [Google Scholar] [CrossRef]
- Stats, B.C. Earning & Employment Trends – December 2025. Available online: https://catalogue.data.gov.bc.ca/dataset/466ddecd-2701-4e97-84fb-df60bd5aca95/resource/8a8f349e-0350-4168-91a4-22bca3b428e8/download/earnings_and_employment_trends_data_tables.pdf (accessed on 12 January 2026).
- Canadian Agency for Drugs and Technologies in Health Methods and Guidelines. Guidelines for the Economic Evaluation of Health Technologies: Canada. 2017. Available online: https://www.cda-amc.ca/sites/default/files/pdf/guidelines_for_the_economic_evaluation_of_health_technologies_canada_4th_ed.pdf (accessed on 3 February 2026).
- Yong, J.H.; Nadeau, C.; Flanagan, W.M.; et al. The OncoSim-Breast Cancer microsimulation model. Curr. Oncol. 2022, 29, 1619–1633. [Google Scholar] [CrossRef]
- Gram, I.T.; Lund, E.; Slenker, S.E. Quality of life following a false positive mammogram. Br. J. Cancer 1990, 62, 1018–22. [Google Scholar] [CrossRef]
- Gram, E.G.; Siersma, V.; Brodersen, J.B. Long-term psychosocial consequences of false-positive screening mammography: A cohort study with follow-up of 12-14 years in Denmark. BMJ Open 2023, 13, e072188. [Google Scholar] [CrossRef]
- Shen, Y.; Winget, M.; Yuan, Y. The impact of false-positive breast cancer screening mammograms on screening retention: A retrospective population cohort study in Alberta, Canada. Can. J. Public Health 2017, 108, e539–e545. [Google Scholar] [CrossRef]
- Miglioretti, D.L.; Abraham, L.; Sprague, B.L.; et al. Association between false-positive results and return to screening mammography in the Breast Cancer Surveillance Consortium Cohort. Ann. Intern. Med. 2024, 177(10). [Google Scholar] [CrossRef]
- Hwang, E.S.; Hyslop, T.; Lynch, T.; et al. Active monitoring with and without endocrine therapy for low-risk ductal carcinoma in situ: The COMET randomized clinical trial. JAMA 2025, 333(11), 972–980. [Google Scholar]
- Rubin, R. Experts are debating whether some cancers shouldn’t be called that. JAMA 2025. [Google Scholar] [CrossRef]
- Checka, C.M.; Chun, J.E.; Schnabel, F.R.; et al. The relationship of mammographic density and age: Implications for breast cancer screening. Am. J. Roentgenol. 2012, 198(3), W292–W295. [Google Scholar] [CrossRef]
- Boyd, N.F.; Guo, H.; Martin, L.J.; et al. Mammographic density and the risk and detection of breast cancer. NEJM 2007, 356(3), 227–236. [Google Scholar] [CrossRef]
- Lynge, E.; Vejborg, I.; Lillholm, M.; et al. Breast density and risk of breast cancer. Int. J. Cancer 2023, 152, 1150–1158. [Google Scholar] [CrossRef]
- Coldman, A.J.; Phillips, N. False-positive screening mammograms and biopsies among women participating in a Canadian provincial breast screening program. Can. J. Public Health 2012, 103(6), e420–e424. [Google Scholar] [CrossRef]
- Le, M.T.; Mothersill, C.E.; Seymour, C.B.; McNeill, F.E. Is the false-positive rate in mammography in North America too high? Br. J. Radiol. 2016, 89(1065). [Google Scholar] [CrossRef]
Figure 1.
Proportion of screens with an abnormal result and proportion of abnormal results leading to a malignant finding, average risk women in British Columbia aged 40 to 79, 2015 to 2019.
Figure 1.
Proportion of screens with an abnormal result and proportion of abnormal results leading to a malignant finding, average risk women in British Columbia aged 40 to 79, 2015 to 2019.
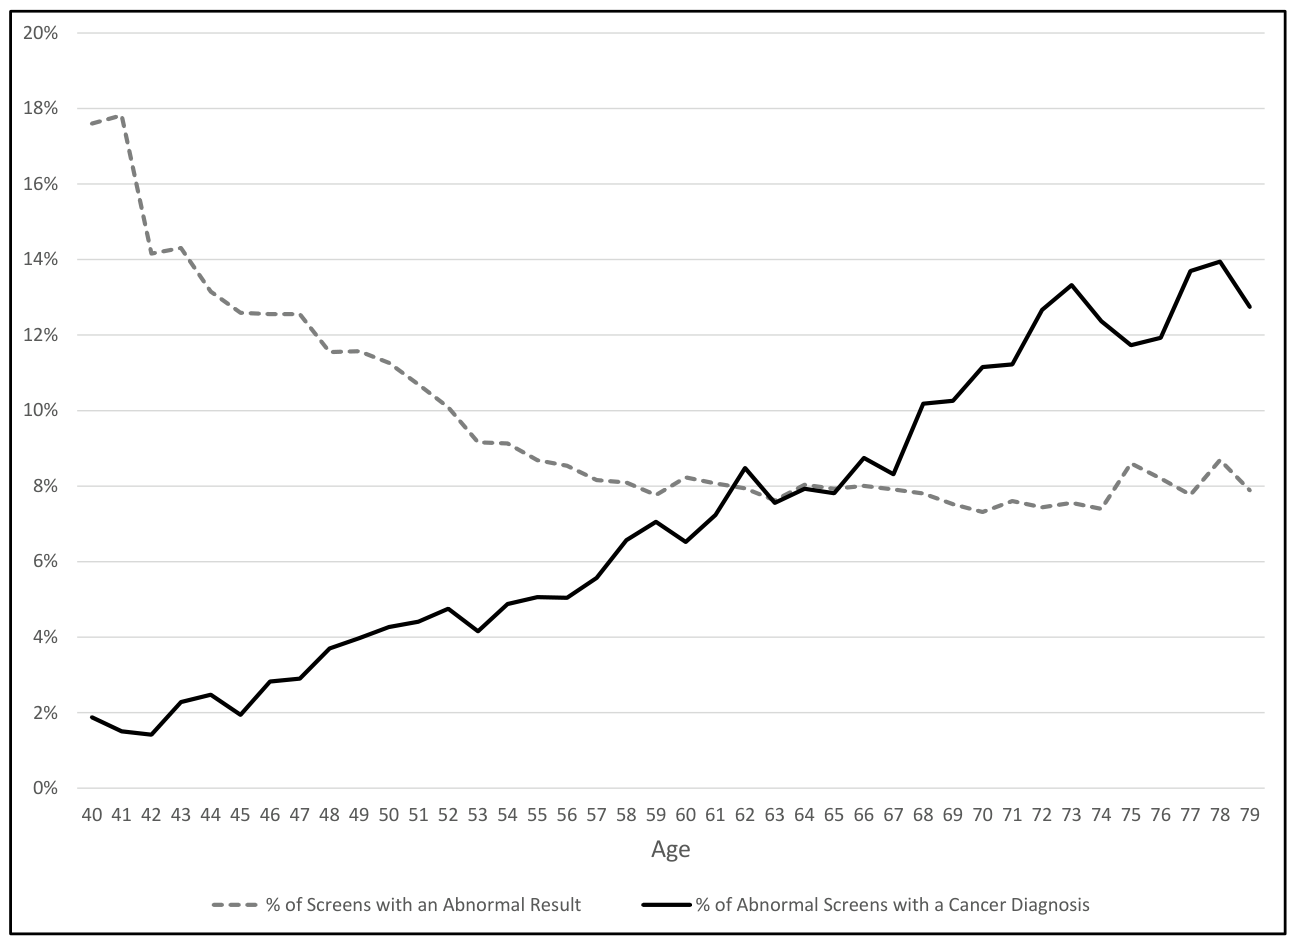
Figure 2.
QALYs gained or lost with mammography screening, sensitivity analysis by age group.
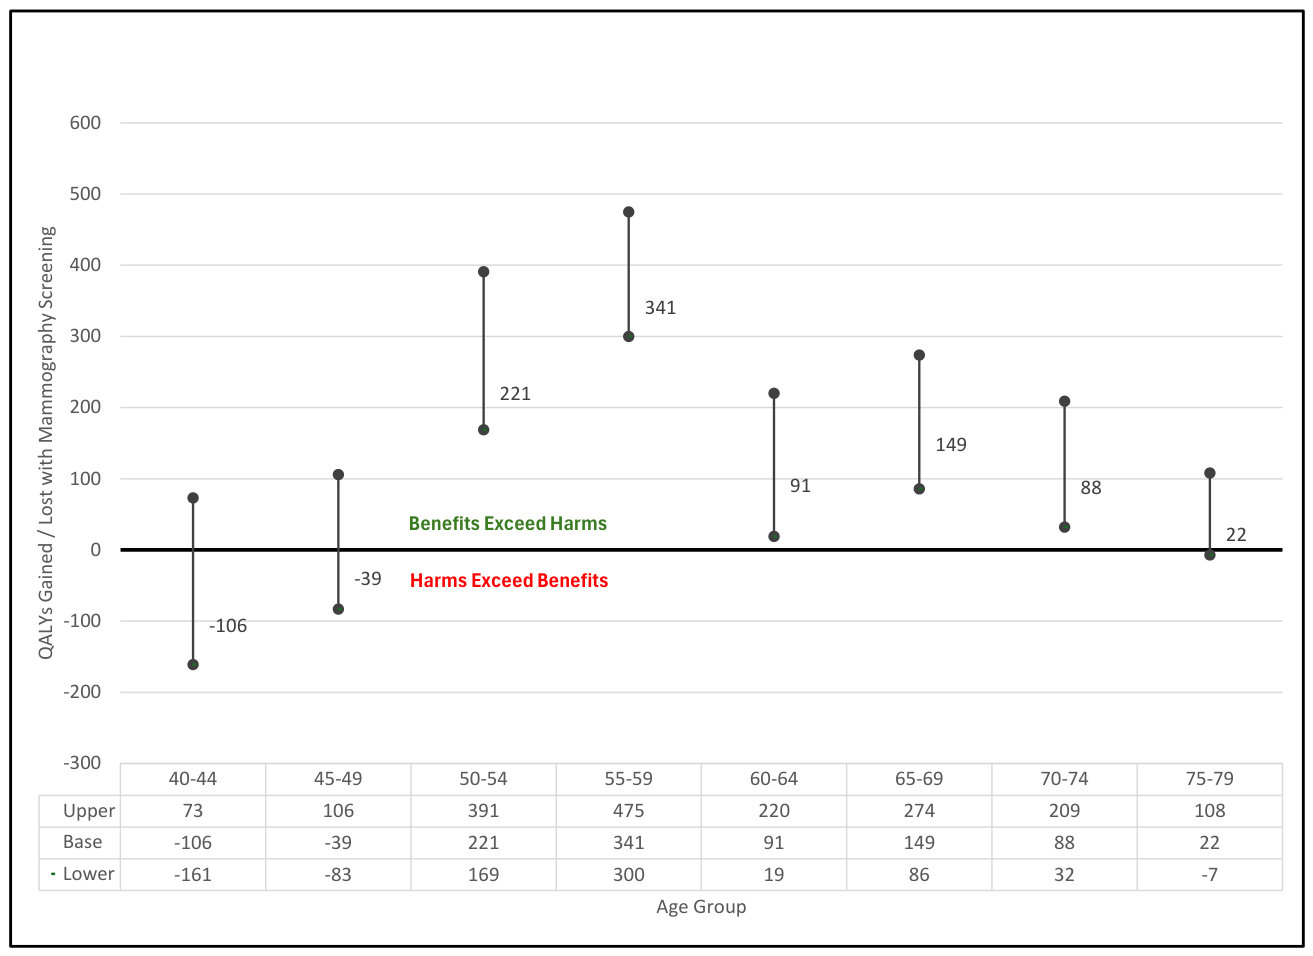
Figure 3.
Cost per QALY gained with mammography screening, assuming no harms attributable to false-positive screening results.
Figure 3.
Cost per QALY gained with mammography screening, assuming no harms attributable to false-positive screening results.
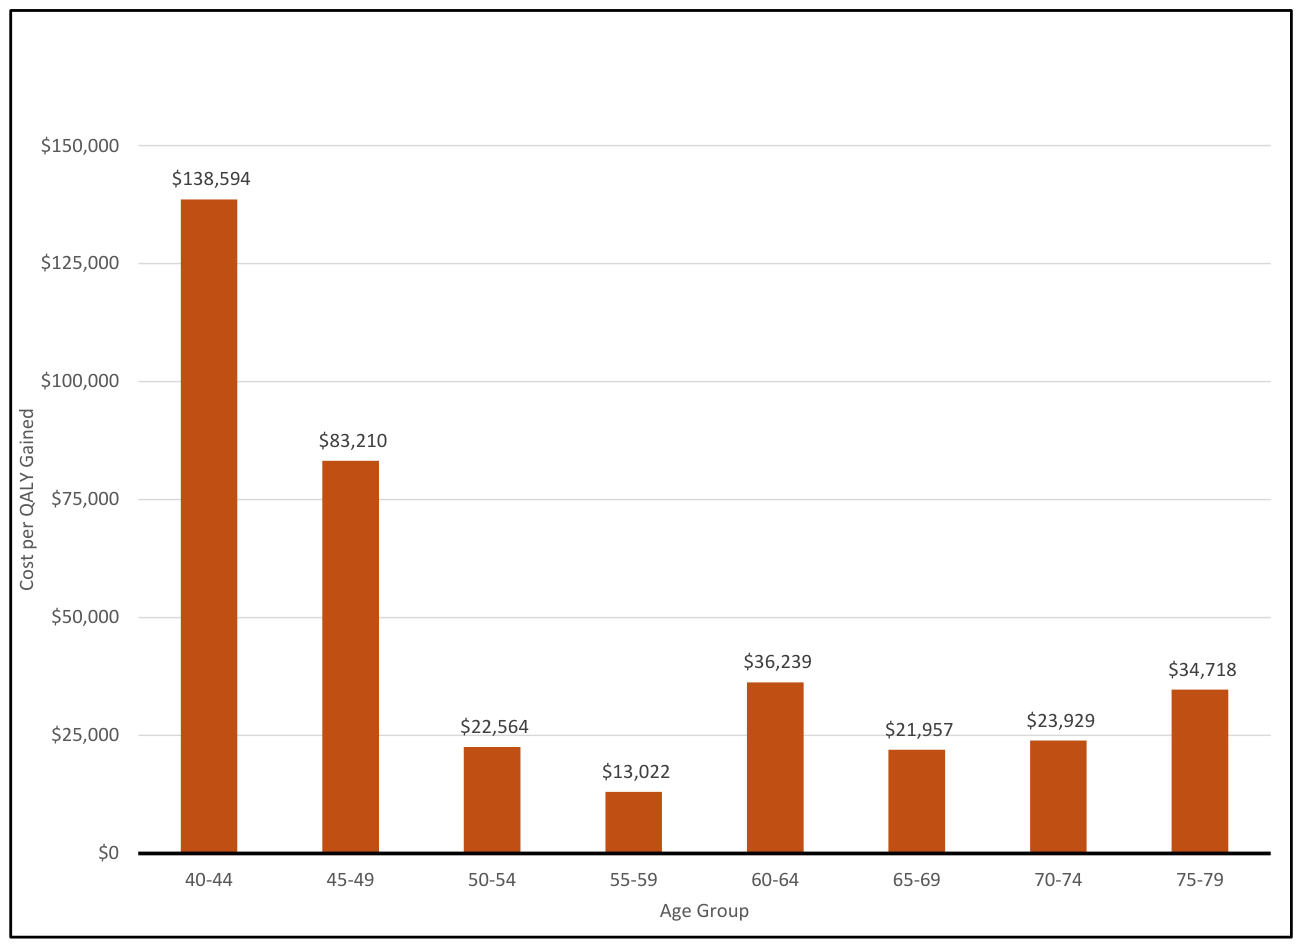

Table 1.
Model Inputs.
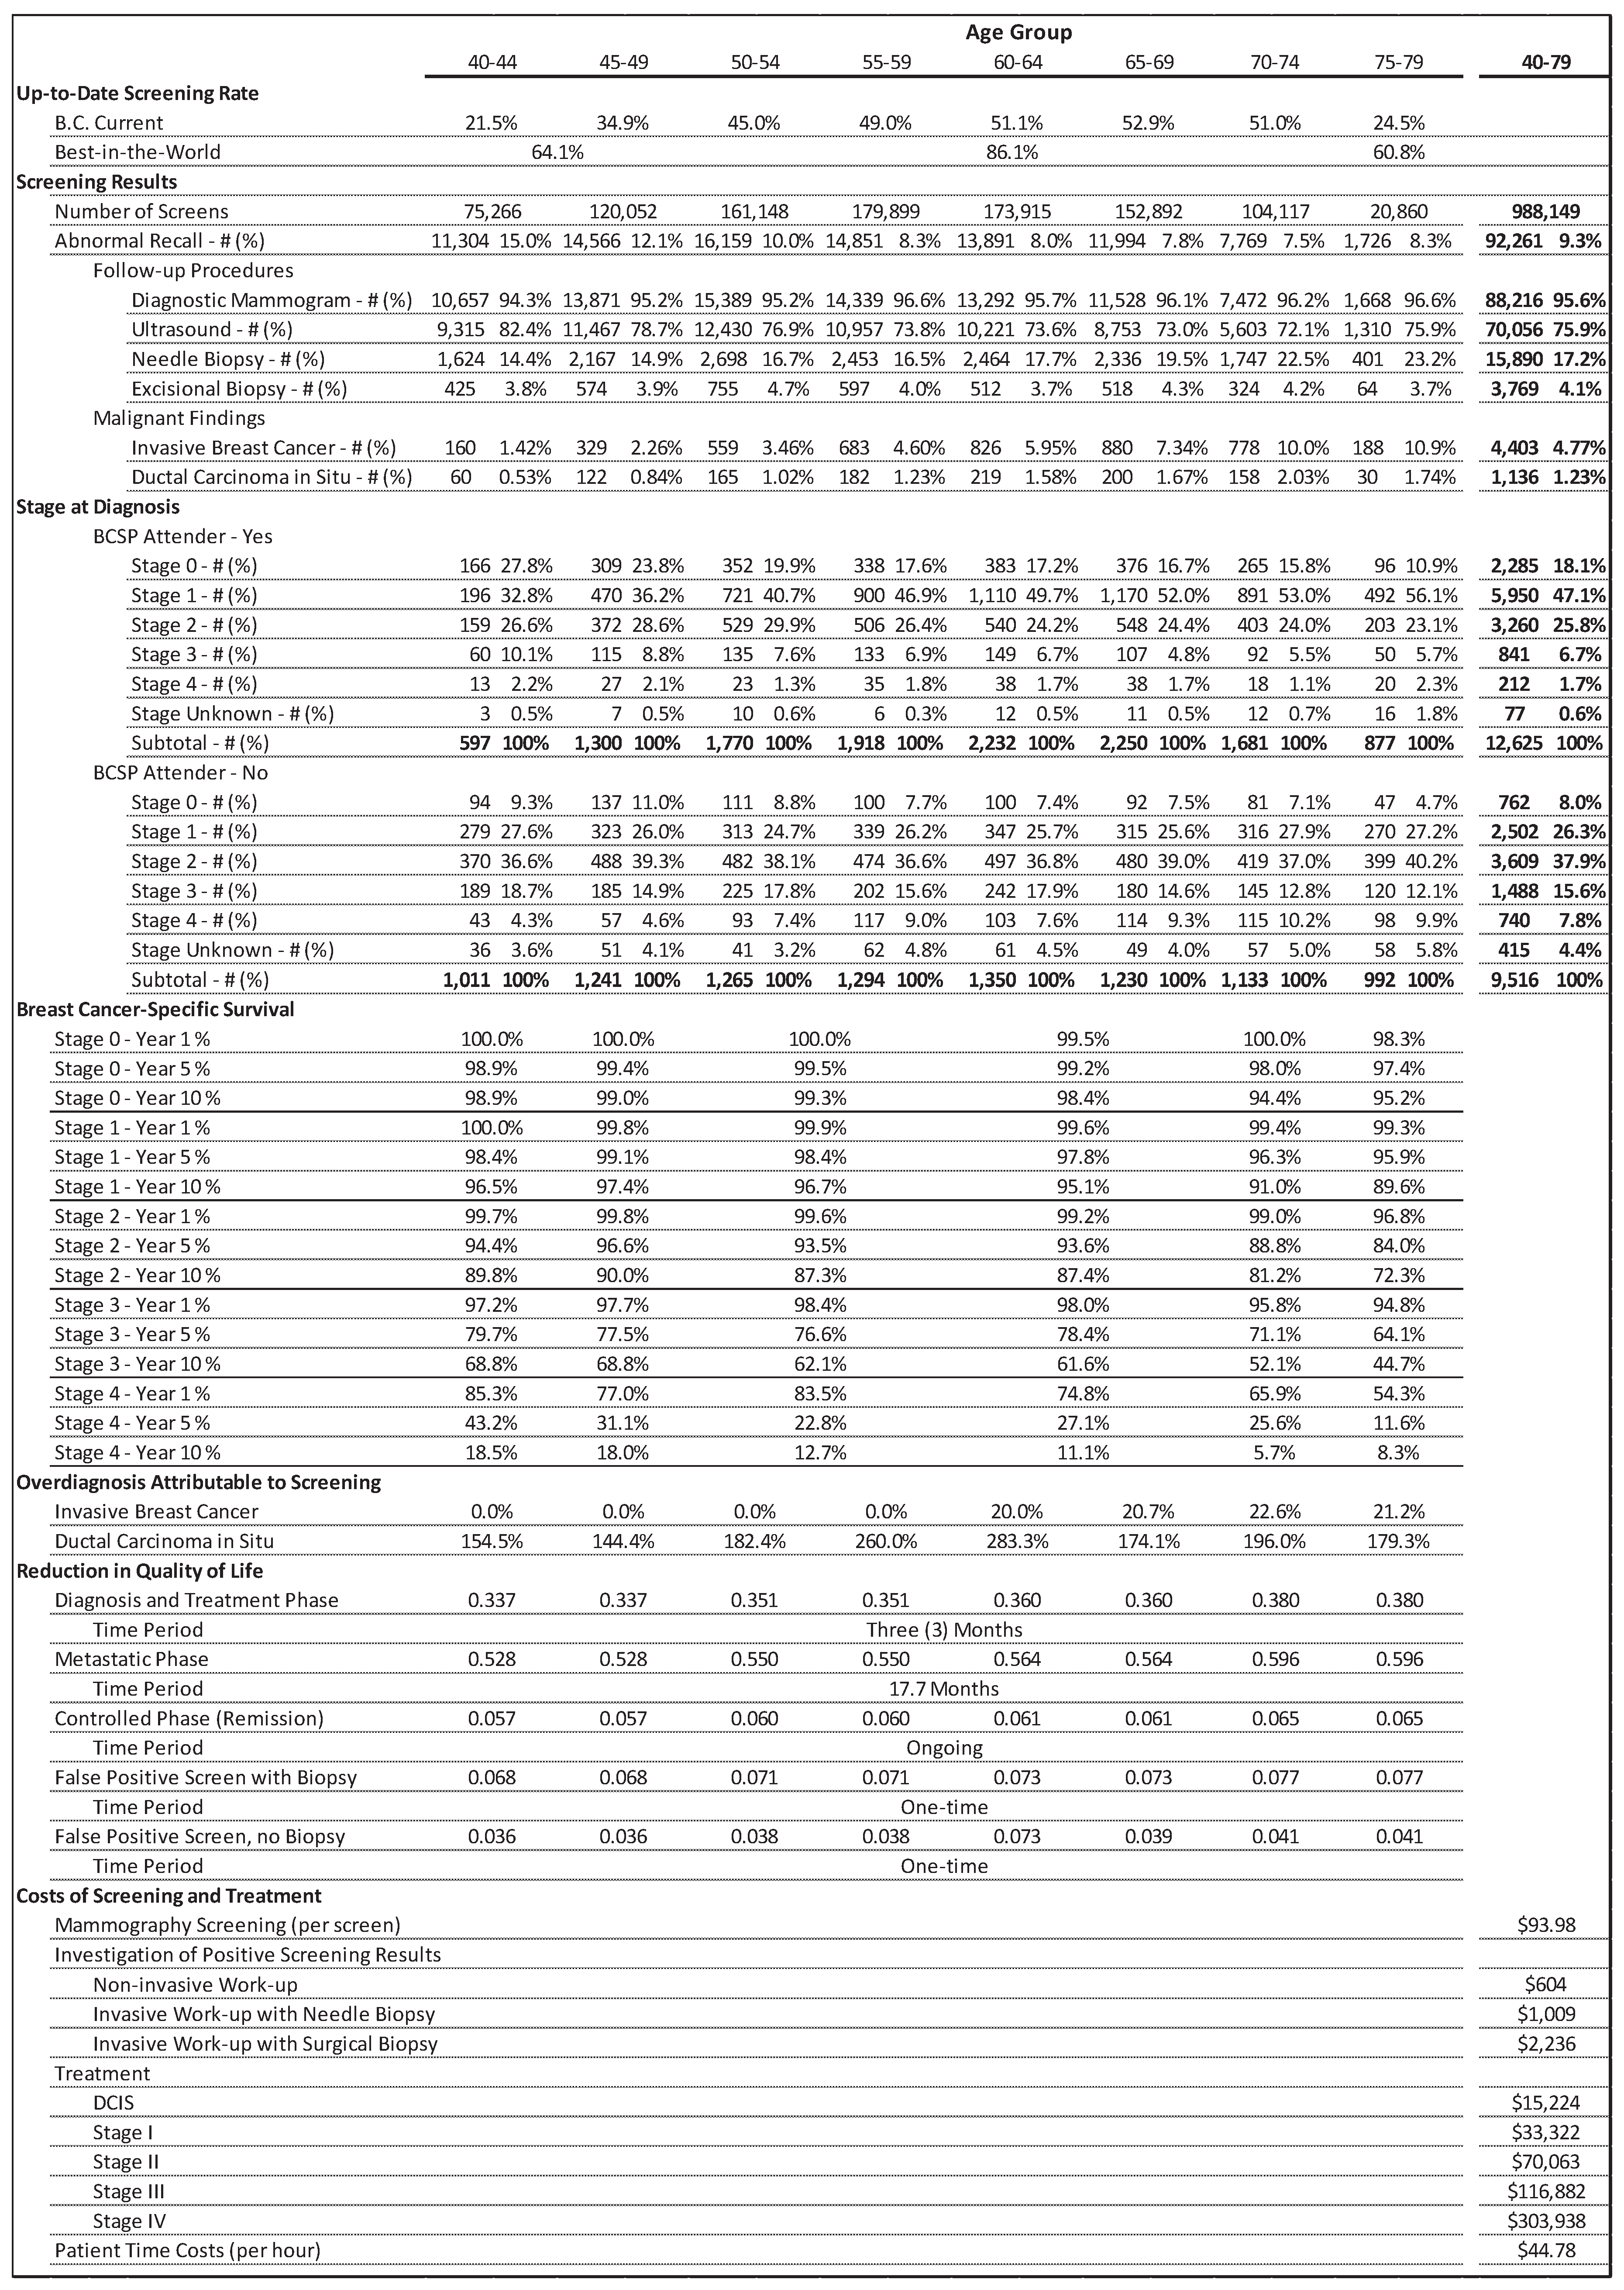
Table 2.
Summary comparison with no versus best-in-the-world mammography screening, by age group in women with an average risk of breast cancer.
Table 2.
Summary comparison with no versus best-in-the-world mammography screening, by age group in women with an average risk of breast cancer.
Disclaimer/Publisher’s Note: The statements, opinions and data contained in all publications are solely those of the individual author(s) and contributor(s) and not of MDPI and/or the editor(s). MDPI and/or the editor(s) disclaim responsibility for any injury to people or property resulting from any ideas, methods, instructions or products referred to in the content. |
© 2026 by the authors. Licensee MDPI, Basel, Switzerland. This article is an open access article distributed under the terms and conditions of the Creative Commons Attribution (CC BY) license.
Copyright: This open access article is published under a Creative Commons CC BY 4.0 license, which permit the free download, distribution, and reuse, provided that the author and preprint are cited in any reuse.