

Submitted:
29 October 2026
Posted:
30 October 2026
You are already at the latest version
Abstract
Background: Idiopathic pulmonary fibrosis (IPF) is a lethal interstitial lung disease in which apoptosis-resistant fibroblasts drive progressive scarring. Fibrotic mesenchymal cells are functionally “primed for death”, but the transcriptional architecture of apoptotic priming in the human IPF fibroblast lineage—and its dominant anti-apoptotic dependency—remains undefined. Methods: We reanalyzed the 114,396-cell GSE135893 atlas [1], scoring 2,653 fibroblast-lineage cells for pre-specified pro- and anti-apoptotic BCL-2-family modules and a composite Apoptosis Index, with donor-level replication in GSE136831 [2] and cell-level confirmation in two further cohorts. Results: In IPF fibroblasts, the anti-apoptotic (cell-level p = 3.0 × 10⁻²¹; d = 0.66) and caspase modules were elevated and the Apoptosis Index shifted toward survival, with MCL1 the dominant anti-apoptotic transcript (log2FC = +1.84; 91.3% versus 63.0% of cells)—an elevation driven substantially by disease-emergent subtype composition (93.5–100% detection, near-absent in control); depth-matched within-state difference attenuates (65.6% versus 62.1%, ns). Cell-level p-values are descriptive; donor-level analyses are the primary inference. The double-high “primed” fraction was elevated in IPF (25.6% versus 11.6%; cell-level p = 2.6 × 10⁻⁴; nominal at donor level, p = 0.023), concentrated in disease-emergent subsets; threshold-sensitivity and module-arm decoupling showed it is driven by the anti-apoptotic arm alone: the fibroblast pool is survival-protected, not genuinely primed, while pro-apoptotic loading emerged only upon myofibroblast differentiation (p = 1.1 × 10⁻⁸)—a two-stage architecture: protected fibroblasts give rise to primed, death-leaning myofibroblasts. Module-level elevations were donor-level null (p = 0.30–0.43); the supported findings are the donor-level primed-pool expansion (Habermann nominal p = 0.023; GSE136831 nominal p = 0.0068) and the compositional MCL1 elevation, with cell-level confirmation in two further cohorts. Conclusions: Apoptotic priming along the IPF fibroblast–myofibroblast lineage is a two-stage program dissected at single-cell resolution, nominating MCL-1 as an antifibrotic target warranting protein-level and pharmacological validation.
Keywords:
idiopathic pulmonary fibrosis
; fibroblast
; myofibroblast
; apoptosis
; MCL1
1. Introduction
1.1. Background and Motivation
1.1.1. The Clinical Burden of IPF and the Limits of Current Therapy
Idiopathic pulmonary fibrosis (IPF) is a chronic, progressive interstitial lung disease of unknown cause with a median survival of approximately three to five years after diagnosis, making it one of the most lethal non-malignant respiratory conditions. The two approved antifibrotic agents, nintedanib and pirfenidone, slow the rate of forced vital capacity decline by roughly half in phase 3 trials, yet neither halts nor reverses established fibrosis, and both act primarily by attenuating fibroblast proliferation and activation rather than by eliminating the pathogenic cell pool [3,4]. Nintedanib, a triple tyrosine kinase inhibitor targeting PDGFR, FGFR, and VEGFR, exemplifies this cytostatic mode of action: it interferes with pro-fibrotic signaling but leaves the accumulated fibroblast and myofibroblast compartment intact [5]. Consequently, lung transplantation remains the only intervention that modifies the terminal disease course, and there is a pressing need for therapies that selectively deplete the cells that drive fibrosis.
1.1.2. Myofibroblast Persistence Through Apoptosis Evasion as a Hallmark of Fibrosis
A central feature distinguishing progressive fibrosis from physiological wound healing is the fate of the myofibroblast. In resolving wounds, myofibroblasts are eliminated by apoptosis once the matrix is repaired; in IPF, they persist, sustaining extracellular matrix deposition and tissue stiffening [6]. IPF-derived fibroblasts exhibit intrinsic differences in apoptotic susceptibility compared with fibroblasts from normal lungs, and evasion of apoptosis by myofibroblasts has been recognized as a hallmark of fibrotic disease across organs [7,8]. Mechanistically, persistence has been linked to defective death-receptor signaling, cellular senescence, and survival signaling downstream of matrix stiffness; however, the molecular basis of the survival program—specifically, which anti-apoptotic dependencies keep the IPF fibroblast lineage alive—remains incompletely defined.
1.2. Research Gap and Problem Statement
1.2.1. Existing BCL-2 Family Evidence Is Bulk-Level or Non-Pulmonary
Functional work using BH3 profiling has shown that matrix stiffness-driven myofibroblast differentiation renders cells “primed for death,” with concurrent activation of pro-apoptotic BH3-only proteins and an acquired dependence on the anti-apoptotic protein BCL-XL; accordingly, the BH3 mimetic ABT-263 (navitoclax) induces selective myofibroblast apoptosis and reverses established fibrosis in skin and systemic sclerosis models [9]. In the lung, ABT-263 induces fibroblast apoptosis and reverses persistent pulmonary fibrosis in mice, providing in vivo pulmonary validation [10]. These studies, however, are bulk-level or pharmacological in design: they neither resolve which fibroblast subpopulations carry the primed state in human disease nor quantify the pro- versus anti-apoptotic balance at single-cell resolution in the IPF lung.
1.2.2. Single-Cell Atlases Have Resolved Taxonomy, Not Apoptosis Programs
Single-cell RNA-sequencing atlases of the human lung have transformed the cellular taxonomy of pulmonary fibrosis, identifying pathological CTHRC1-expressing myofibroblasts, aberrant epithelial states, and profibrotic macrophage populations [1,2,11,12]. Yet these efforts were designed to characterize cell identity and lineage composition; none has systematically dissected the transcriptional architecture of mitochondrial apoptosis regulation—the balance of pro-apoptotic effectors and BH3-only proteins against anti-apoptotic BCL-2 family members—across the fibroblast lineage. Apoptotic priming, operationally defined in oncology as the degree to which mitochondria are loaded with death signals and buffered by anti-apoptotic proteins, thus remains unquantified in human IPF at single-cell resolution [13,14].
1.2.3. Which Anti-Apoptotic Dependency Dominates in IPF Fibroblasts?
This gap has become concrete with recent genetic evidence. Redente and colleagues demonstrated that conditional BCL-2 overexpression in fibroblasts is sufficient to drive persistent pulmonary fibrosis, but notably reported that BCL2 transcripts are low in end-stage IPF fibroblasts, raising the open question of which anti-apoptotic family member—BCL-2, BCL-XL, or MCL-1—actually sustains the diseased fibroblast compartment in humans [15]. Resolving this dependency spectrum is not merely academic: the clinical BH3 mimetic toolbox is member-selective, with agents targeting BCL-2, BCL-2/BCL-XL, or MCL-1, so the identity of the dominant dependency directly determines the rational therapeutic choice [9,16].
1.3. Contribution Statement
Here we present, to our knowledge, the first single-cell transcriptomic quantification of apoptotic priming in the human IPF fibroblast lineage. Analyzing the 114,396-cell GSE135893 atlas of Habermann et al. [1] (89,326 cells from 19 IPF and 12 control donors in the analytic cohort), we focused on 2,653 fibroblast-lineage cells and scored each cell for pro- and anti-apoptotic BCL-2 family modules, caspase machinery, and a composite Apoptosis Index. Our principal contributions are:
- Single-cell resolution of apoptotic priming in IPF. We quantify the balance of pro- versus anti-apoptotic BCL-2 family expression in individual human IPF fibroblast-lineage cells, demonstrating coordinated upregulation of both the anti-apoptotic module (p=3.0e-21) and the caspase machinery (p=3.9e-7) relative to control fibroblasts.
- Identification of MCL1 as the dominant, compartment-wide anti-apoptotic adaptation. MCL1 is the dominant anti-apoptotic transcript, with an elevation that is substantially compositional (disease-emergent subsets) in IPF fibroblasts (log2FC +1.84; expressed in 91.3% of IPF versus 63.0% of control fibroblasts), directly answering the open dependency question raised by Redente et al. [15] in favor of MCL-1 rather than BCL-2.
- A two-stage model of apoptotic priming with differentiation-stage resolution. Under the median-based definition, the fraction of fibroblasts scoring above the population median for both pro- and anti-apoptotic programs is expanded in IPF (25.6% versus 11.6%; chi-square=13.4, p=2.6e-4), but threshold-sensitivity analysis (significant at 50th–65th percentile cutoffs, not beyond) and decoupling of the two module arms show that this fibroblast-state expansion is driven by the anti-apoptotic (MCL1) arm alone (pro- × anti-apoptotic score product lower in IPF, p=1.9e-6)—a protected, survival-shifted state. Pro-apoptotic loading instead emerges upon myofibroblast differentiation (pro-apoptotic module p=1.1e-8, d=0.342; independently supported in GSE136831 by BAX up-regulation in IPF myofibroblasts, log2FC +0.41, adjusted p=0.025, and by the strongest primed enrichment in that state, 29.7% versus 11.8%, p=6.3e-8), even as MCL1 (log2FC −0.40, p=2.4e-27) and the initiator and executioner caspases CASP9/CASP3 (CASP9 −2.08; CASP3 −0.54) fall and the Apoptosis Index rises (p=4.5e-16). Fibroblasts are thus protected while myofibroblasts are primed—a transcriptomic staging that mirrors the functional demonstration by Lagares et al. [9] that priming arises with myofibroblast differentiation.
- Independent cross-cohort replication. Applying the identical targeted panel, normalization, and primed definition to the 312,928-cell GSE136831 atlas of Adams et al. [2] (5,380 fibroblast-lineage cells), we show that the core signature—MCL1 dominance, donor-level primed-pool expansion (27.1% versus 17.6%; p=0.0068), and differentiation-stage dynamics—replicates across cohorts, whereas the caspase-module and WWTR1 components are cohort-specific.
1.4. Paper Organization
The remainder of this paper is organized as follows. Section 2 reviews related work on IPF single-cell atlases, BCL-2 family biology, and pro-apoptotic antifibrotic strategies. Section 3 describes the dataset, gene-panel design, module scoring, and statistical framework. Section 4 presents the results on anti-apoptotic remodeling, primed-pool expansion, differentiation-stage dynamics, and independent replication in GSE136831. Section 5 discusses mechanistic and translational implications, including the case for MCL-1-directed therapy, together with limitations. Section 6 concludes.
This study analyzes the fibroblast lineage of the GSE135893 atlas [1] with a pre-specified apoptotic-priming gene panel. Cohort definitions follow the source atlas; all results reported here are specific to the fibroblast apoptotic program. The Adams cohort (GSE136831) is used as an independent replication set for the same fibroblast-lineage questions.
2. Related Work
2.1. Single-Cell Atlases of Pulmonary Fibrosis
Single-cell RNA sequencing (scRNA-seq) has transformed the cellular taxonomy of the fibrotic lung. Early studies established that idiopathic pulmonary fibrosis (IPF) epithelia are profoundly remodeled, with expanded basaloid and aberrant transitional states [2,17]. Two contemporaneous atlases, generated from independent cohorts (GSE136831 and GSE135893), resolved the full IPF cellular landscape and identified pathological mesenchymal and epithelial populations that are largely absent from control lung, including KRT5−/KRT17+ aberrant basaloid cells and fibroblast subsets with distinct profibrotic programs [1,2]. Complementary work defined the immune compartment, characterizing profibrotic macrophage states and a proliferating SPP1+/MERTK+ macrophage population enriched in IPF [11,12]. For the mesenchymal lineage specifically, the collagen-producing cell atlas of Tsukui and colleagues delineated alveolar, adventitial, and pathological CTHRC1+ fibroblast subsets with distinct spatial localization and disease relevance [18], a taxonomy corroborated in systemic sclerosis–associated interstitial lung disease [19] and anchored against healthy reference atlases [20].
Collectively, these atlases answered which cells populate the fibrotic lung and what they express at steady state. However, none systematically analyzed the apoptotic machinery itself: the balance of pro- and anti-apoptotic BCL-2 family transcripts, the activation state of caspase programs, or the distribution of death-primed states across fibroblast subsets remains uncharted in these resources [1,2,18]. The present study repurposes these public atlases to fill precisely this gap.
2.2. Myofibroblast Apoptosis Resistance and the Primed-for-Death Concept
Persistence of apoptosis-resistant myofibroblasts is a recognized hallmark of fibrotic disease [6,7]. Early ex vivo work demonstrated that IPF lung fibroblasts differ intrinsically from normal fibroblasts in growth and apoptosis susceptibility [8], and genetic ablation of Fas signaling in fibroblasts was shown to impair fibrosis resolution and promote persistent pulmonary fibrosis in mice [21]. Mitochondrial pathology in IPF is compartment-specific: alveolar epithelial cells exhibit defective mitophagy and mitochondrial homeostasis [22], whereas fibroblast-lineage cells—and senescent cells more broadly—accumulate despite a hostile, pro-death microenvironment [23,24].
The conceptual framework reconciling this paradox comes from oncology. The mitochondrial pathway of apoptosis is governed by the opposing activities of BCL-2 family proteins [14,25], and cells whose mitochondria are “primed” by death signals such as BIM become addicted to specific anti-apoptotic guardians for survival [13]. The degree of pretreatment priming predicts clinical responses to cytotoxic chemotherapy [26], and the relative priming of malignant versus normal cells defines therapeutic windows [27]. BH3 profiling operationalized this concept as a functional assay that classifies apoptotic blocks and predicts drug sensitivity [28], later scaled to high-throughput dynamic formats for solid tumors [29]. Hinz and Lagares extended this framework to fibrosis, proposing that (senescent) myofibroblasts are not intrinsically apoptosis-proof but are simultaneously primed by death signals and protected by survival-signal addiction [7]. Whether—and in which fibroblast states—this primed-for-death configuration exists in human IPF lung has not been examined at single-cell resolution.
2.3. BH3 Mimetics as Antifibrotics
Approved IPF therapies slow, but do not reverse, disease progression: nintedanib attenuates the decline in forced vital capacity by inhibiting PDGFR/FGFR/VEGFR tyrosine kinases [3,5], and pirfenidone reduces disease progression through incompletely defined antifibrotic mechanisms [4]. Neither agent directly engages the apoptotic survival machinery of myofibroblasts, motivating pro-apoptotic strategies.
BH3 mimetics, developed as anticancer agents, provide the pharmacological tools [16]. Lagares and colleagues demonstrated that stiffness-driven myofibroblast differentiation induces BIM-mediated priming and BCL-XL dependence, such that the BCL-2/BCL-XL inhibitor ABT-263 (navitoclax) selectively kills myofibroblasts and reverses established fibrosis [9]. In lung, ABT-263 induced fibroblast apoptosis and reversed persistent pulmonary fibrosis in mice [10], eliminated senescent type II pneumocytes in radiation-induced fibrosis [30], and BCL-2 inhibition ameliorated bleomycin-induced fibrosis [31]. Mechanistically, disrupting the Cpt1a–BCL-2 interaction likewise released apoptosis resistance and improved fibrotic remodeling [32], and conditional BCL-2 overexpression in fibroblasts was sufficient to drive persistent, senescence-associated fibrosis reversible by BCL-2 inhibition [15]. Despite this convergent in vivo evidence, which anti-apoptotic dependency—BCL-2, BCL-XL, or MCL-1—dominates in human IPF fibroblast populations remains unresolved, and prior functional data are divided between BCL-XL [9] and BCL-2 [15].
2.4. Positioning Against Prior Work
Table 1 positions the present study against the five closest prior works across five dimensions: species/system, analytical resolution, quantification of apoptotic priming, use of human IPF lung tissue, and mapping of anti-apoptotic dependencies.
Table 1 makes the differentiation explicit. Functional priming has been quantified only in non-pulmonary fibrosis [9] or in tumors [29], both at bulk resolution; lung studies established efficacy of BH3 mimetics in vivo but without measuring priming or resolving cell states [10,32]; and the most recent human IPF evidence is spatial rather than single-cell and points to BCL-2 rather than BCL-XL or MCL-1 [15]. The present study quantifies apoptotic priming transcriptionally at single-cell resolution in human IPF lung, mapping the pro-/anti-apoptotic balance onto curated fibroblast and myofibroblast states. This design complements rather than duplicates prior work: it tests, in the human disease tissue, the primed-for-death model established functionally in skin [9], while our identification of MCL-1 as the dominant anti-apoptotic adaptation—expressed in 91.3% of IPF fibroblasts—extends the dependency spectrum beyond the BCL-2/BCL-XL focus of earlier studies [9,15]. Transcript-level co-expression, however, approximates—but does not substitute for—functional BH3 profiling; this and other limitations are addressed in Section 5.3.
3. Materials and Methods
3.1. Data Source and Cohort
This study performed a secondary analysis of a publicly available single-cell RNA sequencing (scRNA-seq) dataset of human lung tissue from patients with pulmonary fibrosis and control donors, originally reported by Habermann et al. [1]. The data were obtained through the UCSC Cell Browser mirror “lung-pf-control” (https://cells.ucsc.edu/lung-pf-control), which hosts the dataset deposited under Gene Expression Omnibus (GEO) accession GSE135893. Two files were downloaded: exprMatrix.tsv.gz (246.8 MB), containing integer unique molecular identifier (UMI) counts in a genes × cells orientation, and meta.tsv, containing the curated cell annotations from the original study.
The full dataset comprised 114,396 cells. Diagnoses represented in the cohort were idiopathic pulmonary fibrosis (IPF; 57,682 cells from 19 donors), control (31,644 cells from 12 donors), and smaller numbers of cells from donors with nonspecific interstitial pneumonia (NSIP), chronic hypersensitivity pneumonitis (cHP), sarcoidosis, and unclassifiable interstitial lung disease (ILD). Because the present analysis focused specifically on IPF, cells from the NSIP, cHP, sarcoidosis, and unclassifiable ILD diagnoses were excluded from the main analysis; however, the NSIP (8,638 cells from 4 donors) and cHP (7,535 cells from 3 donors) cells were retained for an extended pan-fibrosis comparison reported in Section 4.6, using identical normalization, module definitions, and primed reference medians.
Cell identities were taken directly from the curated celltype labels of the original study [1]; no de novo clustering or re-annotation was performed. The fibroblast-lineage compartment was defined as the union of four curated labels: “Fibroblasts”, “PLIN2+ Fibroblasts”, “HAS1 High Fibroblasts”, and “Myofibroblasts”. Restricting to IPF and control diagnoses yielded 2,653 fibroblast-lineage cells: control fibroblasts n = 146, control myofibroblasts n = 196, IPF fibroblasts n = 1,498, and IPF myofibroblasts n = 813. For downstream contrasts, the four curated labels were collapsed into two lineage states (“Fibroblast” comprising Fibroblasts, PLIN2+ Fibroblasts, and HAS1 High Fibroblasts; “Myofibroblast” as annotated). Myofibroblast identity was additionally validated by a canonical marker score computed as the mean z-scored expression of ACTA2, POSTN, TGFBI, TAGLN, and MYH11; within IPF, myofibroblasts scored markedly higher than fibroblasts (Cohen’s d = 1.423, p = 3.9 × 10−145), supporting the validity of the curated labels.
An independent validation cohort was obtained from the GSE136831 atlas of Adams et al. [2], downloaded directly from GEO as the raw-count sparse matrix (GSE136831_RawCounts_Sparse; 45,947 genes × 312,928 cells), spanning IPF, control, and chronic obstructive pulmonary disease (COPD) donors. Fibroblast-lineage cells were defined by the curated Manuscript_Identity labels of the original study (“Fibroblast” and “Myofibroblast”), and the validation analysis was restricted to IPF and control donors, yielding 5,380 fibroblast-lineage cells (control fibroblasts n = 847, control myofibroblasts n = 204, IPF fibroblasts n = 1,443, IPF myofibroblasts n = 2,886); the COPD group was not analyzed for the priming claims. The identical pre-specified analysis panel was applied: 44 of the 45 module/panel genes queried were present in the GSE136831 gene list (PDGFRA was absent from this dataset and was therefore omitted from the validation analysis). Normalization (counts per 10,000 using per-cell nUMI, log1p), module definitions, z-scoring against all 312,928 atlas cells, the double-high primed definition relative to fibroblast-compartment medians, and the statistical framework (Mann–Whitney U, Cohen’s d, chi-square and donor-level summaries) were identical to the primary analysis, as reported in Section 3.3 and Section 3.4.
3.2. Targeted Apoptosis-Focused Gene Panel
Analyses were restricted to a pre-specified panel of 319 genes, of which 13 were mitochondrial genes retained for quality-control (QC) purposes. The panel was designed, prior to analysis, to cover the major molecular nodes of the apoptotic program and its regulatory context in fibrotic fibroblasts: (i) BCL-2 family members, including pro-apoptotic effectors and BH3-only proteins as well as anti-apoptotic guardians [14,25]; (ii) initiator and executioner caspases; (iii) the death-receptor (FAS) pathway; (iv) inhibitor of apoptosis proteins (IAPs); (v) p53 and autophagy regulators; (vi) fibroblast and myofibroblast identity markers; (vii) TGF-β, YAP/TAZ, and focal adhesion kinase (FAK) mechanosignaling components; (viii) metabolic enzymes; and (ix) epigenetic regulators. This hypothesis-driven, targeted design was a deliberate analytical choice: it focuses statistical power on the apoptosis program that motivates the study, at the cost of genome-wide discovery, and it is acknowledged here as a design decision rather than an unbiased survey.
The final panel consisted of the 306 target genes (of 316 designed) actually present in the downloaded matrix, plus the 13 mitochondrial QC genes; ten designed genes (GSDME, EPAS1, DCN, PRKN, CCN2, KLF5, CCN1, ADIPOQ, LUM, TIMP2) did not appear in the matrix and were therefore not analyzed. During file ingestion, 319 of 26,377 rows failed a column-count integrity check and were excluded as a QC step; every panel gene was verified intact and complete before downstream analysis.
3.3. Expression Normalization, Module Scoring, Apoptosis Index, and Primed-State Definition
Raw UMI counts were normalized to counts per 10,000 (CP10K) using the per-cell library size (nCount_RNA) reported by the source study, and log1p-transformed. Module scores were computed for pre-specified gene sets as the mean of z-scored log-normalized expression across the genes in each set, an approach in the spirit of Seurat’s AddModuleScore [33], but without control-gene adjustment, and conceptually related to scanpy’s score_genes and AUCell [34,35]. Five apoptosis-related module scores were defined: Pro-apoptotic (BAX, BAK1, BID, BCL2L11, BBC3, PMAIP1, BAD, BMF), Anti-apoptotic (BCL2, BCL2L1, BCL2L2, MCL1, BCL2A1), Caspase (CASP3, CASP7, CASP8, CASP9), FAS pathway (FAS, FASLG, CFLAR), and IAP (BIRC5, XIAP, BIRC2, BIRC3). Z-scoring was performed across all 114,396 cells of the full atlas (the reference population), so that module values are expressed relative to the atlas-wide mean rather than to the fibroblast compartment alone. A composite Apoptosis Index was defined as the Pro-apoptotic score minus the Anti-apoptotic score, such that positive values indicate a death-leaning transcriptional balance and negative values a survival-leaning balance. For individual genes, differential expression was quantified as log2FC = log2((mean(expm1(x)) + 0.01) / (mean(expm1(y)) + 0.01)), i.e., the log2 ratio of group means computed on the linear CP10K scale with a 0.01 pseudocount added to both numerator and denominator, where x and y are the log1p-transformed CP10K values of the two groups.
The apoptotically “primed” state was defined operationally by adapting the mitochondrial-priming concept, originally developed through functional BH3 profiling, to transcript-level data [13,26]: a cell was classified as primed (“double-high”) when both its Pro-apoptotic and Anti-apoptotic module scores exceeded the population median computed across the entire fibroblast-lineage compartment (IPF and control cells pooled). This definition captures cells in which pro-death machinery is expressed but held in check by concurrent anti-apoptotic buffering—the transcriptional correlate of a primed mitochondrion. Primed fractions were compared between diagnoses and lineage states, and a donor-level sensitivity analysis was performed by computing the primed fraction per donor (fibroblast state only, restricted to donors with ≥5 fibroblast-lineage cells (14 IPF and 9 control donors)) to assess robustness to inter-individual variability.
As an auxiliary measure, the BAX/BCL2 expression ratio was computed from linear-scale normalized values with a pseudocount of 0.01 added to both the numerator and the denominator. Because BCL2 transcripts were detected in only 6.5% of cells, this ratio is sparse and noisy and was therefore treated as exploratory rather than as a primary endpoint.
3.4. Statistical Analysis
Group comparisons of module scores and individual gene expression were performed using two-sided Mann–Whitney U tests, chosen because expression distributions are non-normal and zero-inflated in scRNA-seq data. Within each pre-specified analysis family, p-values were adjusted using the Bonferroni correction, with family sizes declared a priori: the module-score family comprised 32 tests (4 comparisons × 8 metrics) and the per-gene family comprised 108 tests (4 comparisons × 27 genes). Effect sizes were quantified as Cohen’s d with pooled variance. Primed-state fractions were compared between groups using chi-square tests with Yates continuity correction. The donor-level sensitivity analysis summarized per-donor primed fractions as mean ± standard deviation. All analyses were conducted in Python 3.12 using numpy, pandas, and scipy. Statistical significance was defined as an adjusted p < 0.05 unless otherwise stated, and exact p-values and effect sizes are reported throughout; results significant only at the nominal level are explicitly flagged as not surviving Bonferroni correction. The three pre-specified donor-level endpoints (primed fraction, MCL1 and WWTR1 donor means) are reported with nominal two-sided Mann–Whitney p-values without multiplicity adjustment and are interpreted as supportive evidence.
3.5. Data and Code Availability
The primary data are publicly available from GEO under accession GSE135893 [1] and were accessed here through the UCSC Cell Browser mirror “lung-pf-control” (https://cells.ucsc.edu/lung-pf-control); the validation data are publicly available from GEO under accession GSE136831 [2]. Analysis code is available from the corresponding author upon request.
4. Results
4.1. Fibroblast-Lineage Compartment Composition in IPF and Control Lung (Table 2)
We reanalyzed the single-cell RNA-sequencing (scRNA-seq) atlas of explanted human lung from Habermann et al. (GSE135893) [1], which comprises 114,396 cells in total. After excluding donors with non-IPF interstitial lung diseases (nonspecific interstitial pneumonia [NSIP], chronic hypersensitivity pneumonitis [cHP], sarcoidosis, and unclassifiable ILD), the analytic cohort comprised 89,326 cells, of which 57,682 derived from 19 IPF donors and 31,644 from 12 control donors. Using the curated cell-type labels of the original study (Fibroblasts, PLIN2+ Fibroblasts, HAS1 High Fibroblasts, and Myofibroblasts), we isolated 2,653 fibroblast-lineage cells (Table 2). The compartment was dominated by IPF-derived cells (2,311 of 2,653; 87.1%), consistent with the expansion of pathological collagen-producing populations reported in independent single-cell studies of fibrotic lung [2,11,18].

Table 2.
Cohort and fibroblast-lineage compartment composition (GSE135893 [1]).
Table 2.
Cohort and fibroblast-lineage compartment composition (GSE135893 [1]).
| Group | Donors | Total cells | Fibroblasts | Myofibroblasts | Fibroblast-lineage total |
| Control | 12 | 31,644 | 146 | 196 | 342 |
| IPF | 19 | 57,682 | 1,498 | 813 | 2,311 |
| Combined | 31 | 89,326a | 1,644 | 1,009 | 2,653 |
a IPF + Control cells only; the full atlas (114,396 cells) additionally contains donors with NSIP, cHP, sarcoidosis, and unclassifiable ILD, which were excluded from the main analysis.
Table 2 makes explicit both the strength and the principal limitation of the dataset. The IPF fibroblast pool is large enough (n = 1,498) to support robust module-level and single-gene inference, whereas the control fibroblast pool is comparatively small (n = 146), inflating sampling variance of control estimates and limiting resolution of rare states. We therefore report Cohen’s d for every contrast, interpret small-control comparisons conservatively, and validate cell-state assignments against canonical markers. The myofibroblast pools (196 control, 813 IPF) are more balanced, lending greater confidence to within-myofibroblast contrasts. This compositional asymmetry also motivated the donor-level summaries reported alongside cell-level statistics in Section 4.3.
4.2. Coordinated Pro- and Anti-Apoptotic Remodeling in IPF Fibroblasts (Figure 1, Figure 2, Table 3)
We computed five pre-specified module scores (pro-apoptotic BCL-2 family, anti-apoptotic BCL-2 family, caspases, FAS pathway, and inhibitor-of-apoptosis proteins [IAPs]) plus a composite Apoptosis Index (pro- minus anti-apoptotic score; Figure 1; all module-score contrasts in Table S1). IPF fibroblasts showed remodeling on both sides of the survival balance relative to control fibroblasts: the anti-apoptotic module was higher (−0.108 vs −0.301; p = 3.0 × 10⁻²¹; d = 0.662), as was the caspase module (0.046 vs −0.171; p = 3.9 × 10⁻⁷; d = 0.454), while the pro-apoptotic module was unchanged (p = 0.47). Despite this dual activation, the net Apoptosis Index shifted toward survival in IPF fibroblasts (−0.068 vs 0.140; p = 5.3 × 10⁻¹⁴; d = −0.551; Figure 2). Key per-gene statistics are summarized in Table 3 (full per-gene results in Table S2).
Figure 1.
Apoptosis module scores across the fibroblast-lineage compartment. Asterisks above the IPF-fibroblast group denote Mann–Whitney significance versus control fibroblasts (***p < 0.001, Bonferroni-adjusted; ns, not significant; exact values in Table S1). Violin plots of five z-scored module scores—(a) pro-apoptotic BCL-2 family, (b) anti-apoptotic BCL-2 family, (c) caspases, (d) FAS pathway, and (e) IAPs—in four groups: control fibroblasts (C-Fib, n = 146), IPF fibroblasts (IPF-Fib, n = 1,498), control myofibroblasts (C-Myo, n = 196), and IPF myofibroblasts (IPF-Myo, n = 813). Module scores are the mean of z-scored log-normalized expression across each gene set. Comparisons used two-sided Mann–Whitney U tests with Bonferroni correction.
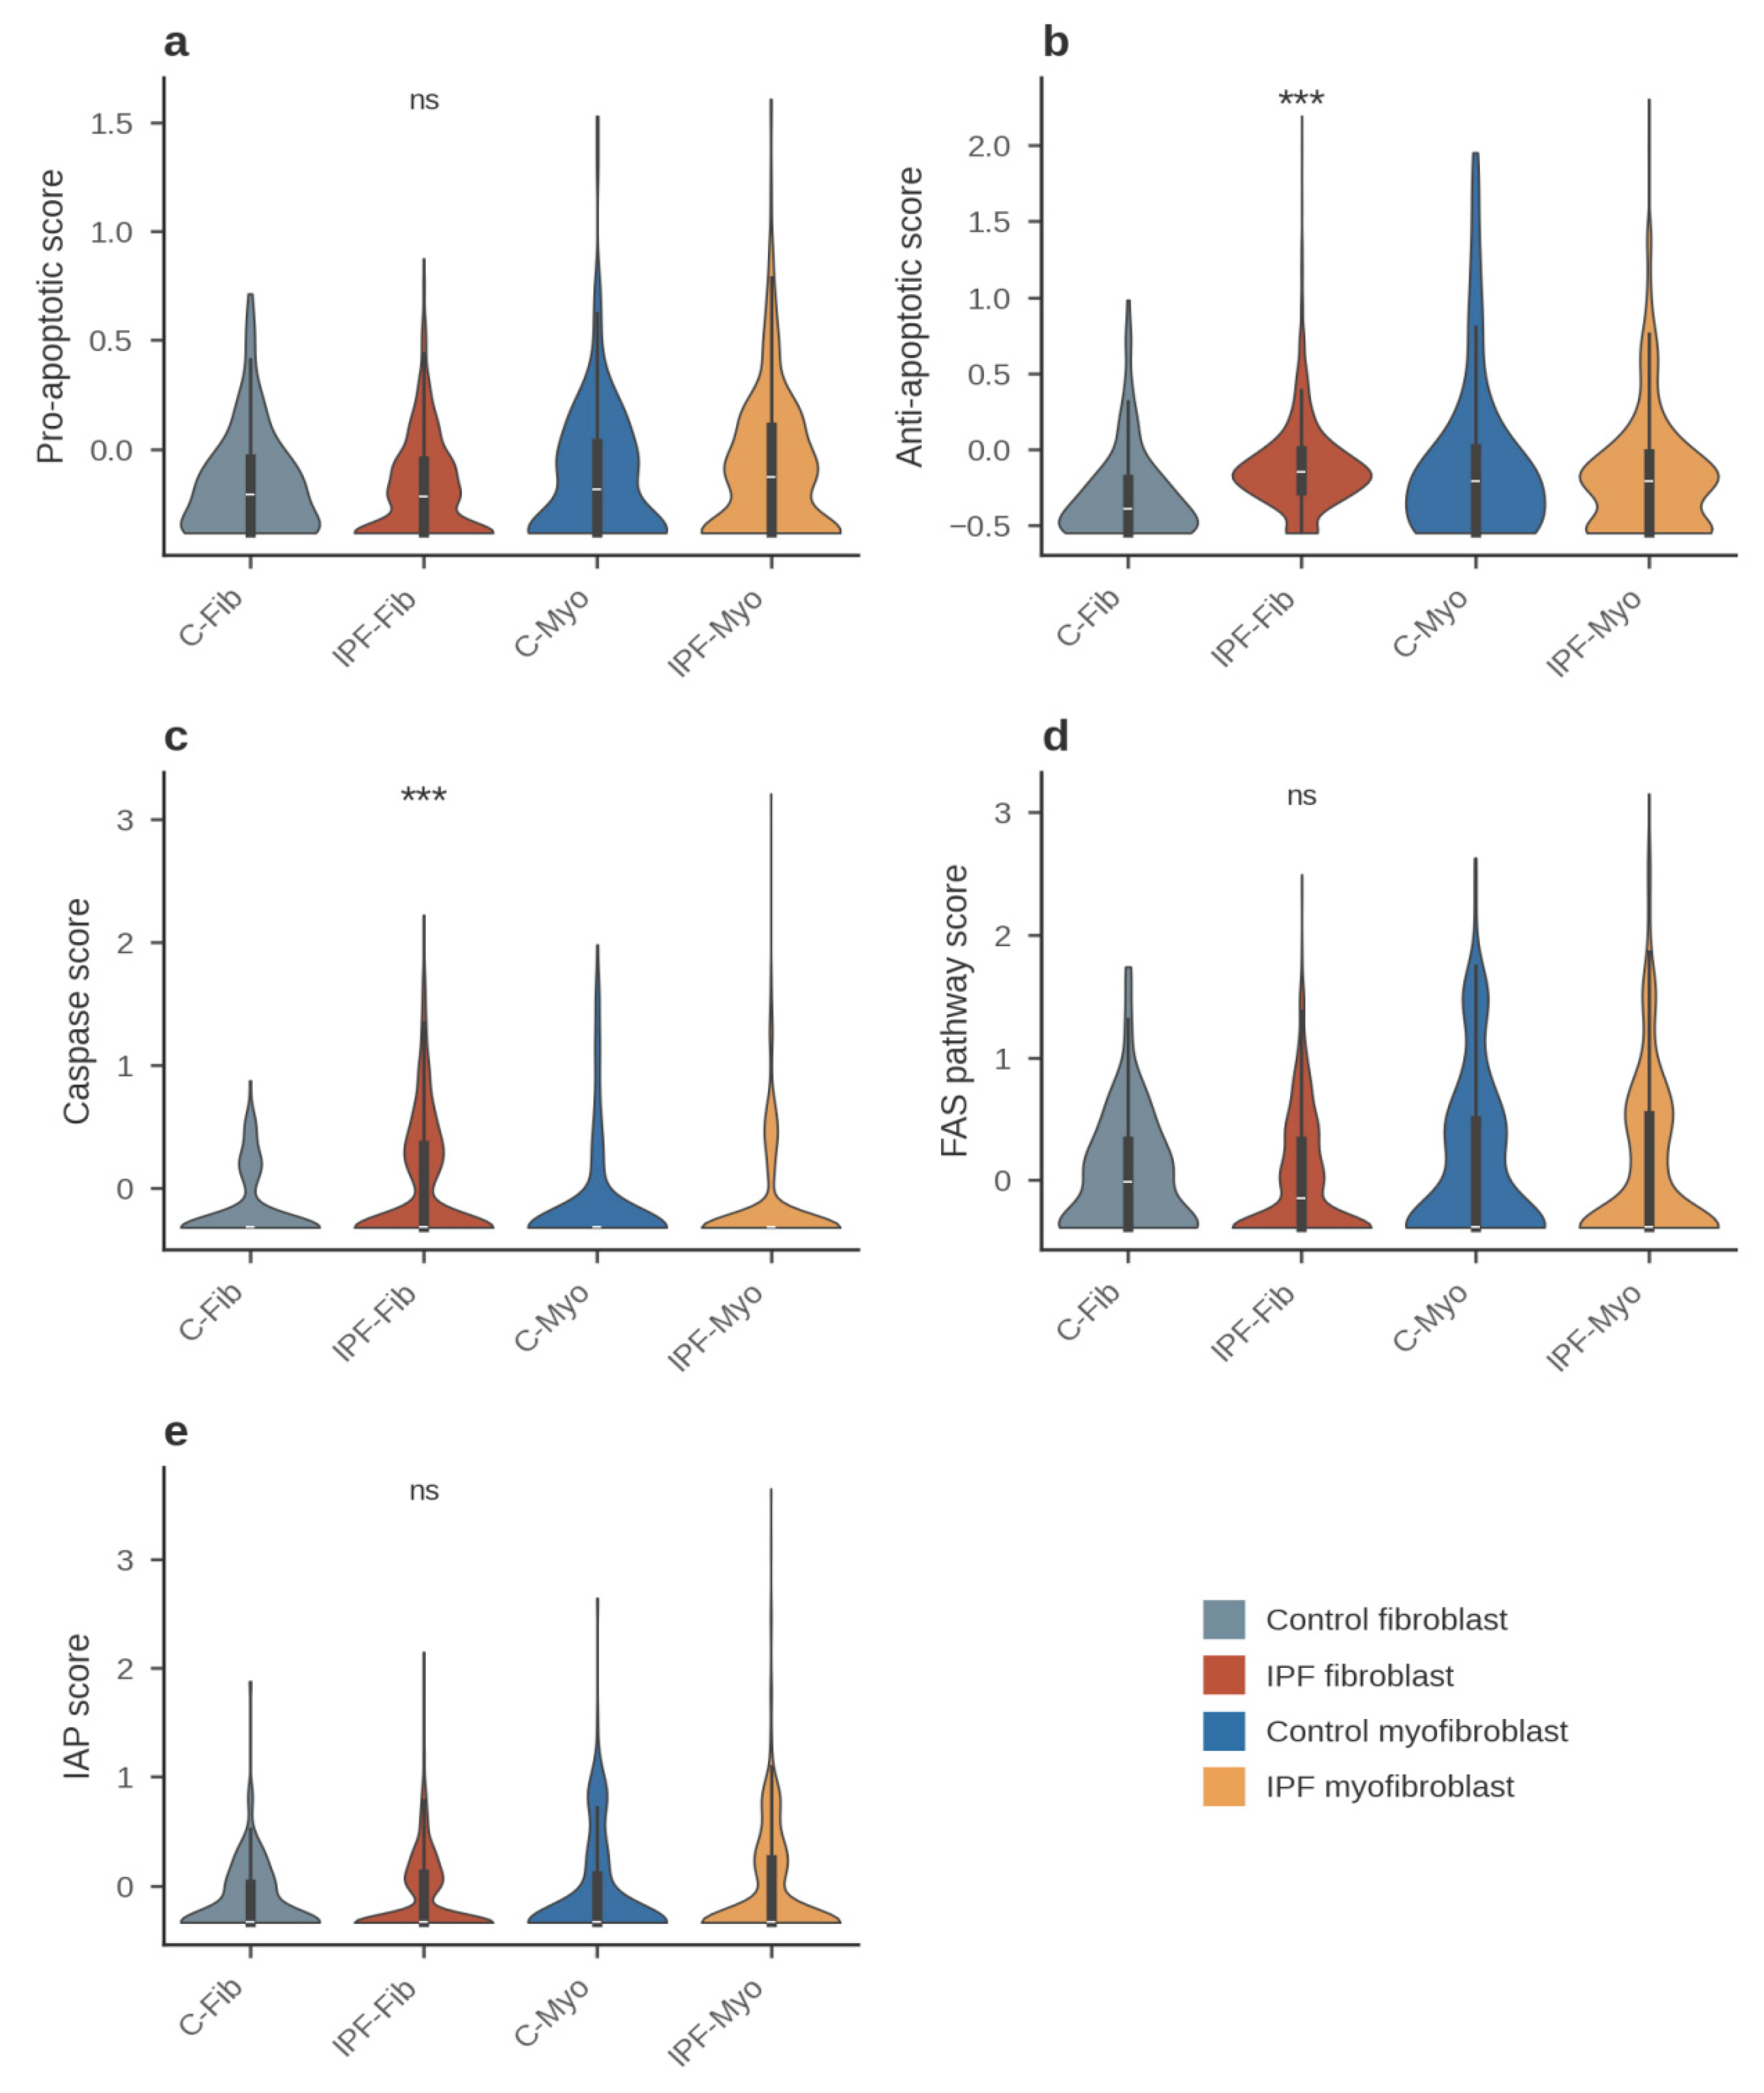
Figure 1 shows that the IPF fibroblast is simultaneously enriched for anti-apoptotic and caspase machinery while its pro-apoptotic sensitizer/effector module is unchanged. Up-regulation of survival and death programs in the same population resembles the transcriptional signature expected of apoptotically “primed” cells, in which increased death signaling is buffered by compensatory anti-apoptotic reserves [13,26]; the two-dimensional analysis of Section 4.3, however, shows that this fibroblast-state pattern is dominated by the anti-apoptotic arm and is more accurately described as protected than genuinely dual-arm primed. The decline in the Apoptosis Index (Figure 2) indicates that the anti-apoptotic shift dominates the net balance, consistent with the apoptosis-resistant phenotype of fibroblast-lineage cells in fibrotic lung [7]. The unchanged FAS and IAP modules argue against a global stress response and for selective remodeling of the mitochondrial (intrinsic) pathway.
Table 3.
Key per-gene differential-expression statistics in the fibroblast lineage.
| Contrast | Gene | log2FC | % expressing (A vs B) | p value | Cohen’s d | Bonferroni p_adj |
|---|---|---|---|---|---|---|
| IPF-Fib vs C-Fib | MCL1 | +1.84 | 91.3% vs 63.0% | 1.2 × 10⁻³⁵ | 1.20 | 1.3 × 10⁻³³ |
| IPF-Fib vs C-Fib | CASP9 | +2.69 | 16.3% vs 3.4% | 2.6 × 10⁻⁵ | 0.36 | 2.9 × 10⁻³ |
| IPF-Fib vs C-Fib | CASP3 | +1.08 | 17.3% vs 10.3% | 0.027 | 0.20 | NS |
| IPF-Fib vs C-Fib | BBC3 (PUMA) | −1.60 | 3.1% vs 9.6% | 1.0 × 10⁻⁴ | −0.30 | 0.011 |
| IPF-Fib vs C-Fib | WWTR1 (TAZ) | +1.56 | 50.1% vs 26.7% | 3.0 × 10⁻⁹ | 0.51 | 3.2 × 10⁻⁷ |
| IPF-Fib vs C-Fib | YAP1 | +0.38 | 25.2% vs 15.8% | 0.015 | 0.16 | NS |
| IPF-Myo vs IPF-Fib | MCL1 | −0.40 | 66.3% vs 91.3% | 2.4 × 10⁻²⁷ | −0.53 | 2.6 × 10⁻²⁵ |
| IPF-Myo vs IPF-Fib | CASP9 | −2.08 | 2.2% vs 16.3% | 6.5 × 10⁻²⁴ | −0.40 | 7.0 × 10⁻²² |
| IPF-Myo vs IPF-Fib | CASP3 | −0.54 | 8.1% vs 17.3% | 4.8 × 10⁻⁹ | −0.19 | 5.2 × 10⁻⁷ |
| IPF-Myo vs IPF-Fib | BAX | +1.27 | 32.8% vs 30.5% | 6.4 × 10⁻⁴ | 0.30 | 0.069 (NS) |
| IPF-Myo vs IPF-Fib | BCL2 | +1.29 | 7.7% vs 4.6% | 1.2 × 10⁻³ | 0.19 | 0.13 (NS) |
| IPF-Myo vs IPF-Fib | BIRC3 | +1.63 | 8.9% vs 5.8% | 3.0 × 10⁻³ | 0.21 | 0.33 (NS) |
| IPF-Myo vs IPF-Fib | BIRC5 | +1.91 | 0.9% vs 0.1% | 7.3 × 10⁻³ | 0.13 | 0.79 (NS) |
| IPF-Myo vs C-Myo | BAX | +0.91 | 32.8% vs 21.4% | 5.4 × 10⁻⁴ | 0.29 | 0.058 (NS) |
| IPF-Myo vs C-Myo | POSTN | +2.31 | 40.5% vs 18.9% | 3.3 × 10⁻⁹ | 0.47 | 3.6 × 10⁻⁷ |
Expression is log-normalized (log1p of CP10K); log2FC is the log2 ratio of group means on the linear CP10K scale with a 0.01 pseudocount on both sides (Methods 3.3); p values are from two-sided Mann–Whitney U tests; p_adj values are Bonferroni-adjusted within the 108-test per-gene family (4 comparisons × 27 genes), with “NS” denoting results that are nominal only and do not survive correction.
Table 3 distills the module-level findings to single genes. MCL1 was the dominant anti-apoptotic adaptation in IPF fibroblasts: mean normalized expression 1.73 vs 0.72 log-units (linear-scale fold change ≈ 3.6; log2FC = +1.84) and the expressing fraction rose from 63.0% to 91.3% (p = 1.2 × 10⁻³⁵; d = 1.20). In parallel, the initiator caspase CASP9 increased (log2FC = +2.69; 16.3% vs 3.4% of cells), while the pro-apoptotic sensitizer BBC3 (PUMA) was suppressed (log2FC = −1.60; 3.1% vs 9.6%; adj p = 0.011). This combination—MCL1-dominated survival signaling, elevated caspase machinery, and PUMA repression—quantitatively accounts for the module-level pattern in Figure 1 and identifies MCL1, rather than BCL2 or BCL2L1 (BCL-xL), as the principal anti-apoptotic transcript of the IPF fibroblast pool [14,25].
Figure 2.
Composite Apoptosis Index and exploratory BAX/BCL2 ratio. Asterisks denote significance versus control (***p < 0.001; ns, not significant). (a) Apoptosis Index (pro- minus anti-apoptotic module score) across the four groups. (b) log10(BAX/BCL2) ratio computed with a +0.01 pseudocount on both numerator and denominator (linear scale). The BAX/BCL2 panel is exploratory: BCL2 was detected in only 6.5% of all cells, so the ratio is dominated by sparse-detection noise and no group difference survived Bonferroni correction (e.g., IPF-Myo vs IPF-Fib, nominal p = 0.037, adjusted NS); it is shown for completeness and should not be over-interpreted.
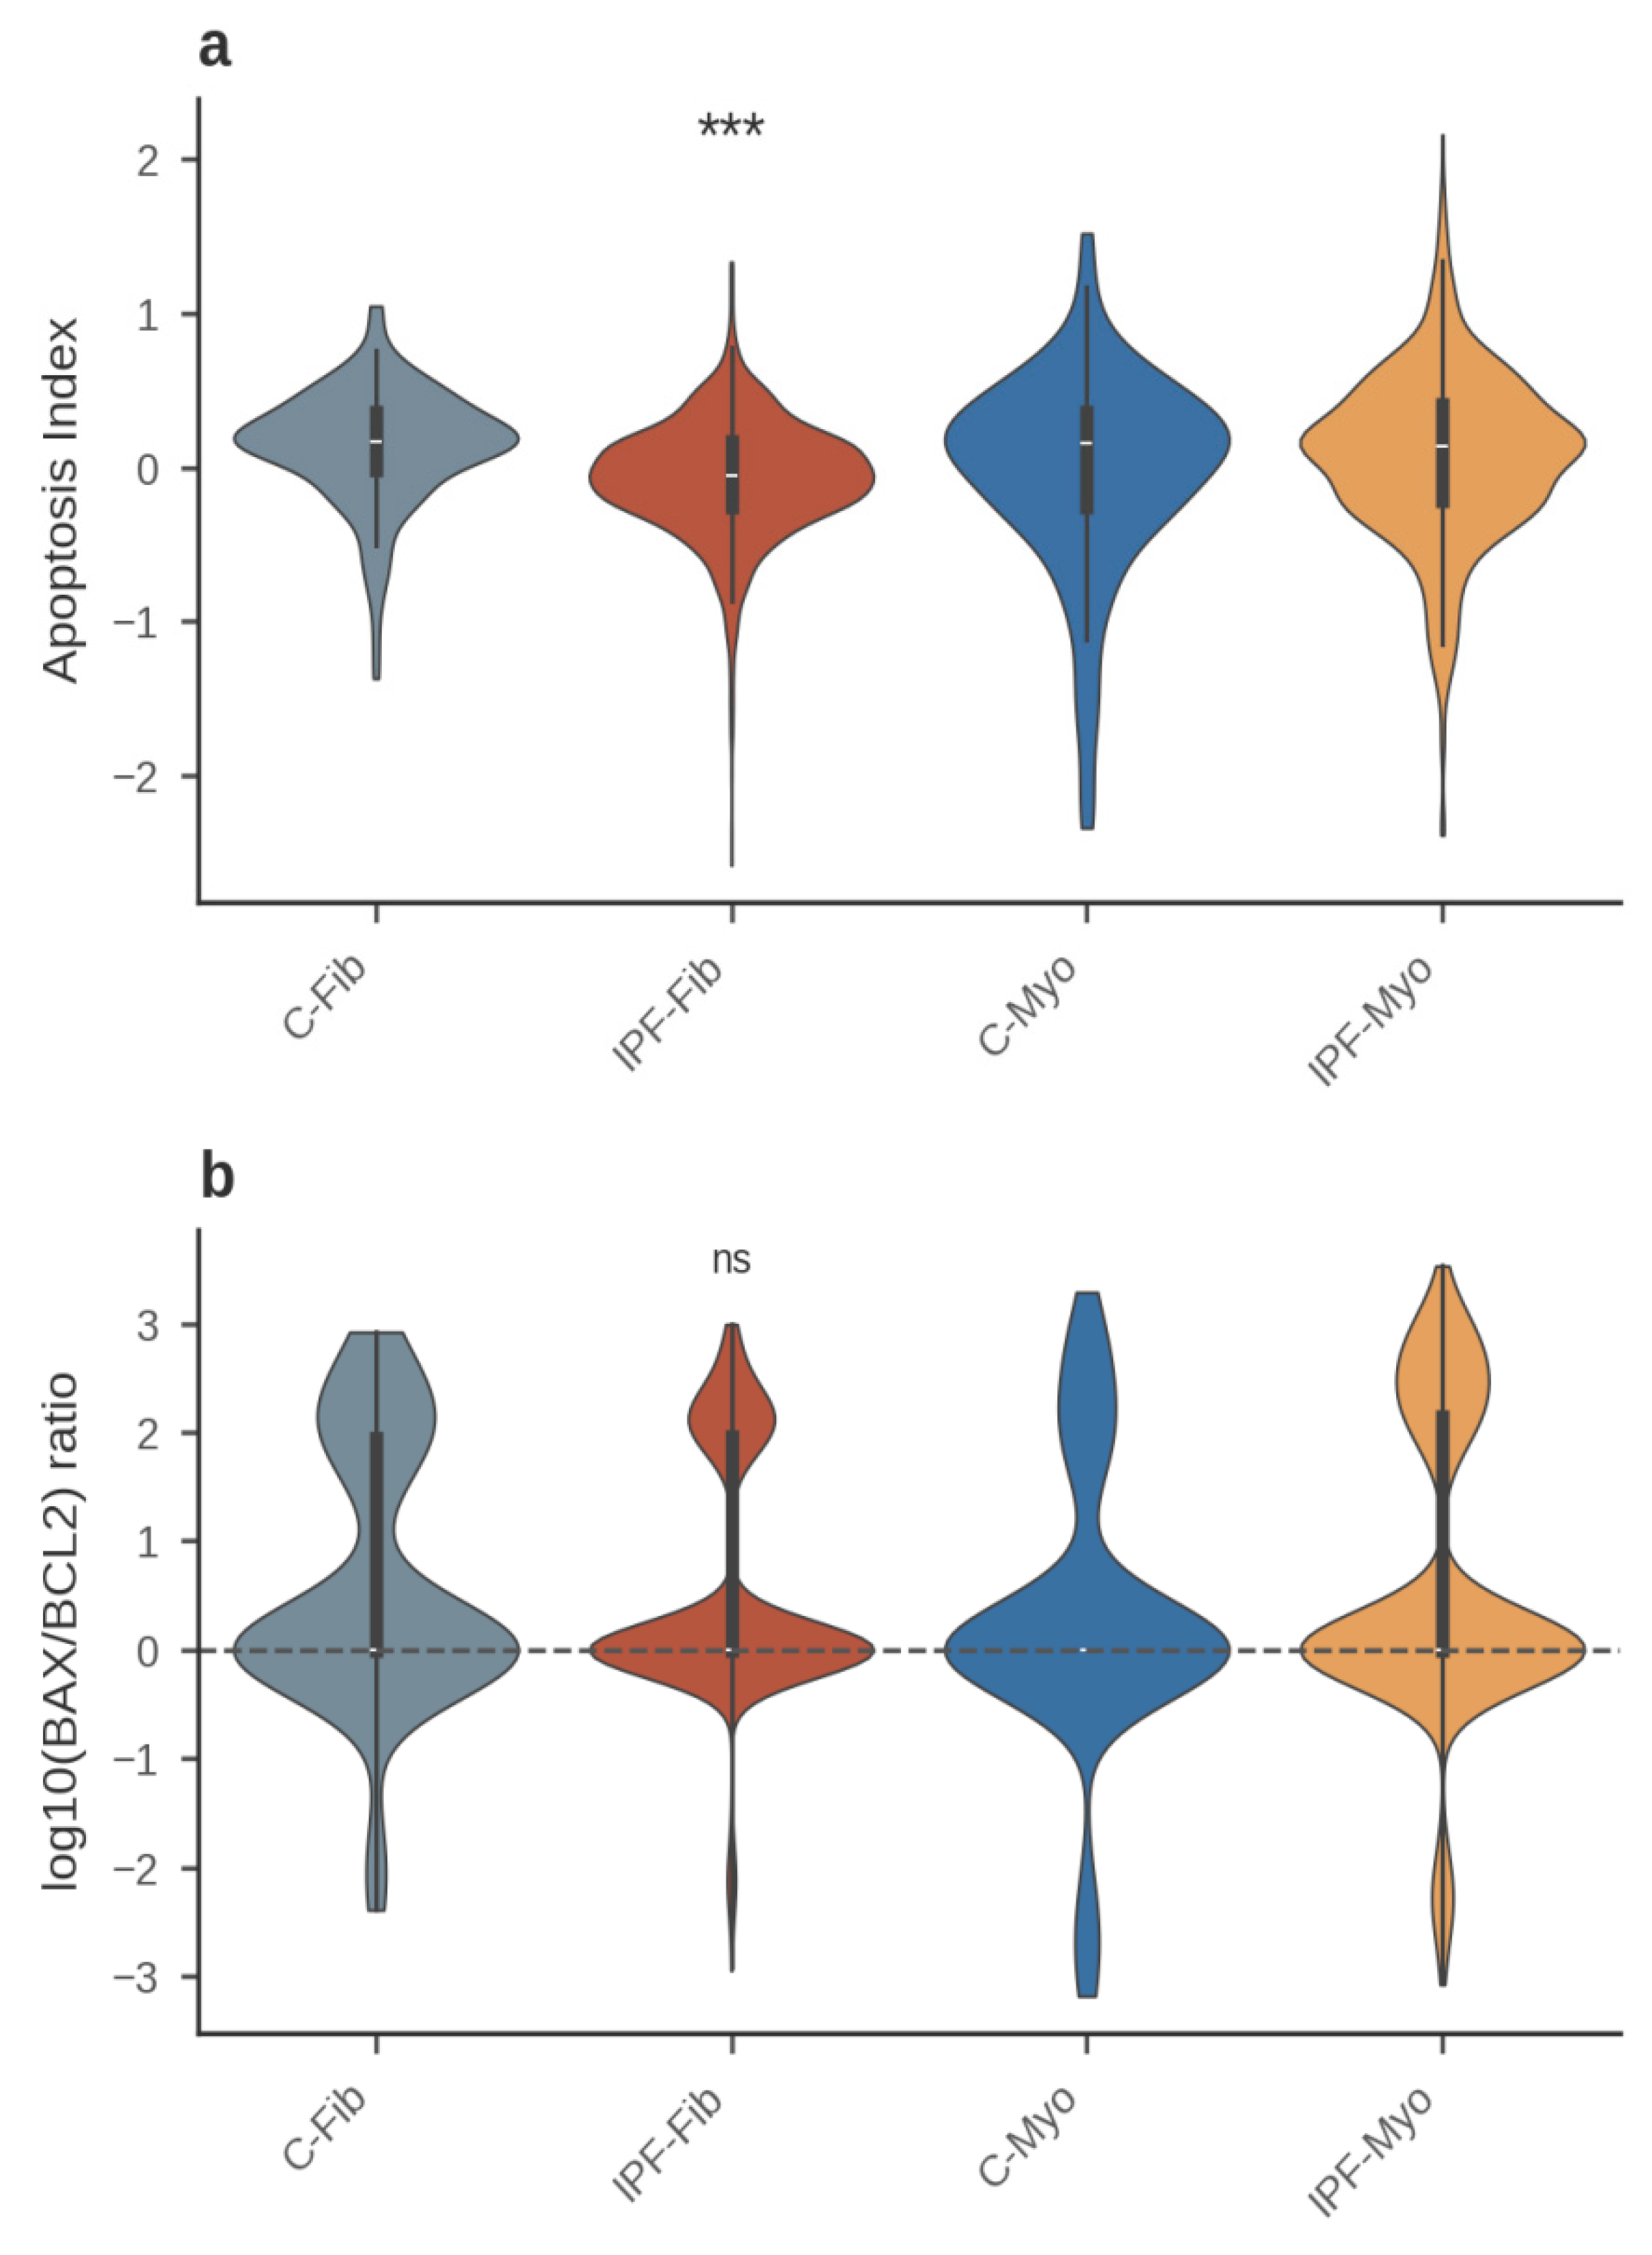
Figure 2 condenses the four-group comparison into a single balance metric. The Apoptosis Index was lower in IPF than in control fibroblasts (d = −0.551; p = 5.3 × 10⁻¹⁴) and then rose upon myofibroblast differentiation within IPF (d = 0.310; p = 4.5 × 10⁻¹⁶), yielding a non-monotonic pattern across lineage states: survival-shifted fibroblasts but a death-leaning balance in the derived myofibroblast state. The BAX/BCL2 ratio, a widely used bulk-tissue proxy, failed to recapitulate this pattern, most likely because BCL2 lies near the detection floor of the assay (6.5% of cells). We therefore treat the module-based Apoptosis Index as the primary balance measure and report the ratio only as an exploratory adjunct.
4.3. The Fibroblast Pool Is Protected and the Myofibroblast Pool Is Primed (Figure 3)
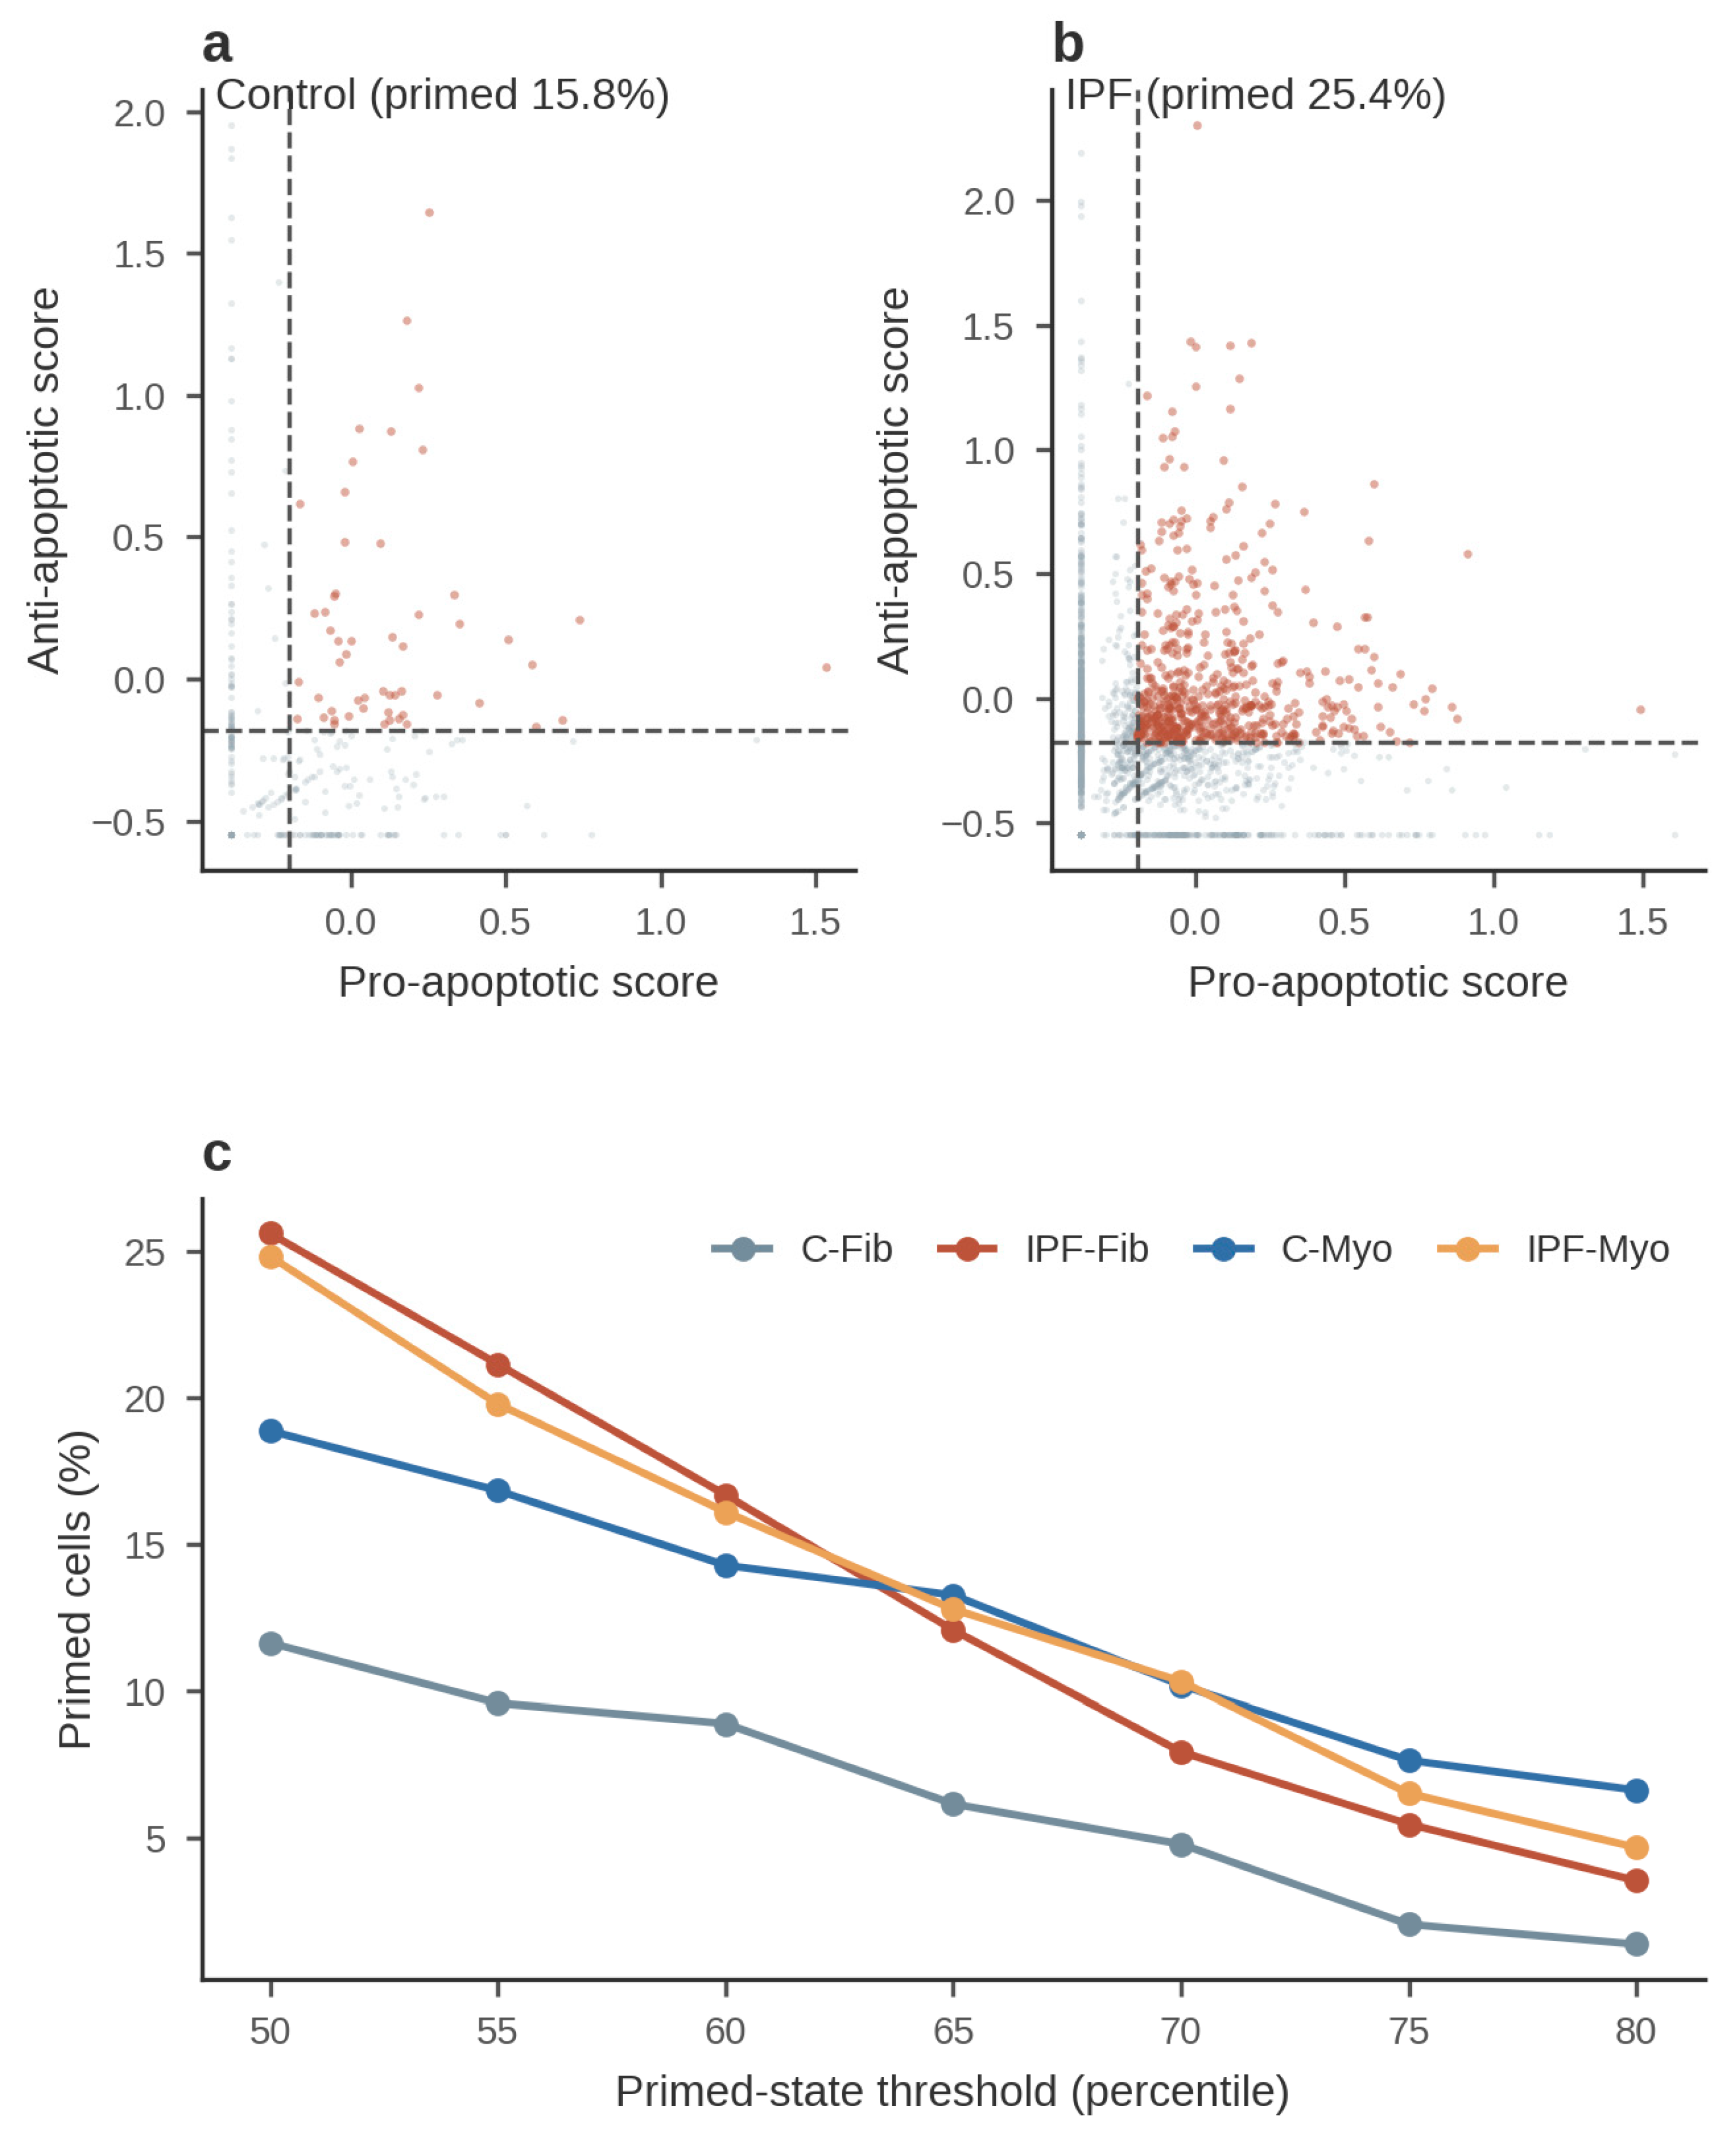
Because module averages can mask subpopulation structure, we scored each cell in two dimensions—pro- versus anti-apoptotic module score—and defined a “primed” state as cells exceeding the population median on both (double-high quadrant; Figure 3), an operational definition mirroring the concept of mitochondrial apoptotic priming [9,13,26]. Under this median-based definition, the primed fraction was expanded in IPF fibroblasts: 25.6% (384/1,498) versus 11.6% (17/146) in control fibroblasts (χ2 = 13.4; p = 2.6 × 10⁻⁴), a 2.2-fold enrichment (Table S3). The complete primed-fraction tabulations—by diagnosis, per donor, by fibroblast subtype, and across the pan-fibrosis diagnoses—together with the contingency chi-square tests and the threshold-sensitivity analysis, are provided in Table S3–S8. Within IPF, the elevated primed fraction was maintained upon differentiation (25.6% of fibroblasts vs 24.8% [202/813] of myofibroblasts; p = 0.72). IPF myofibroblasts showed a trend toward expansion relative to control myofibroblasts (24.8% vs 18.9% [37/196]; p = 0.095), and primed fractions did not differ significantly between the two control states (18.9% vs 11.6%; p = 0.096).
Two sensitivity analyses, however, substantially refined this picture (Figure 3c). First, the fibroblast-state expansion was sensitive to the percentile threshold used to define the double-high quadrant: the IPF-versus-control fibroblast comparison remained significant at the 50th (p = 2.6 × 10⁻⁴), 55th (p = 1.3 × 10⁻³), 60th (p = 0.020), and 65th (p = 0.046) percentile cutoffs, but not at the 70th (p = 0.23), 75th (p = 0.11), or 80th (p = 0.25) percentiles, indicating that the expansion is concentrated in cells moderately—rather than extremely—elevated on both axes. Second, the product of the pro- and anti-apoptotic scores, a continuous measure of coordinated dual-arm elevation, was in fact lower in IPF than in control fibroblasts (0.016 vs 0.052; p = 1.9 × 10⁻⁶), demonstrating that the fibroblast-state double-high expansion is driven by the anti-apoptotic arm alone—the MCL1-dominated, survival-shifted program of Section 4.2—rather than by coordinated pro-apoptotic loading. Genuine pro-apoptotic loading instead emerged at the myofibroblast stage: within IPF, the pro-apoptotic module rose upon differentiation (p = 1.1 × 10⁻⁸; d = 0.342; Section 4.4), and in the independent Adams cohort BAX was significantly up-regulated in IPF versus control myofibroblasts (log2FC = +0.41; adjusted p = 0.025), precisely the state in which the disease-associated primed enrichment was strongest (29.7% vs 11.8%; p = 6.3 × 10⁻⁸; Section 4.7). The fibroblast lineage therefore follows a two-stage architecture: the fibroblast pool is protected—survival-shifted by single-arm anti-apoptotic up-regulation—whereas the myofibroblast pool is primed, acquiring the pro-apoptotic loading that defines dual-arm apoptotic priming [9].
Figure 3 therefore reframes, rather than simply confirms, the primed-pool hypothesis. Donor-level analysis tempered the cell-level result: mean per-donor primed fractions among fibroblasts were 27.0% ± 9.2% in IPF (14 donors) versus 17.0% ± 11.6% in control (9 donors; Mann–Whitney p = 0.023; d = 0.99), with substantial inter-donor variability, so the cell-level comparison should be read as evidence of a shifted distribution rather than a precise population-level effect size. More importantly, the threshold sensitivity and the pro- × anti-apoptotic decoupling above argue against interpreting the fibroblast-state expansion as bona fide dual-arm priming. The data instead support a two-stage model: at the fibroblast stage, IPF expands a protected, anti-apoptotic-dominated pool whose net balance is survival-shifted (Section 4.2); pro-apoptotic loading—the defining feature of priming—is acquired upon myofibroblast differentiation (Section 4.4), where the pro-apoptotic module and BAX rise even as MCL1 falls, and where the independent Adams cohort shows the strongest disease-associated primed enrichment (Section 4.7). This staging precisely mirrors the functional demonstration by Lagares et al. [9] that mitochondrial priming arises with stiffness-driven myofibroblast differentiation rather than in the undifferentiated fibroblast.
Figure 3.
Two-dimensional map of apoptotic priming and its threshold sensitivity in the fibroblast lineage. (a, b) Scatter plots of per-cell pro-apoptotic (x-axis) versus anti-apoptotic (y-axis) module scores, shown separately for control and IPF fibroblast-lineage cells with double-high “primed” cells highlighted in red; dashed lines mark the population medians. The primed percentages annotated in panels (a) and (b) are lineage-level fractions (15.8% control, 25.4% IPF), whereas the state-level fractions (11.6% control fibroblasts, 25.6% IPF fibroblasts) are reported in the main text. (c) Threshold sensitivity of the state-level double-high primed fractions for the four groups (C-Fib, C-Myo, IPF-Fib, IPF-Myo) as the percentile threshold defining the primed state is raised from the 50th to the 80th percentile. Fractions were compared by chi-square test with Yates continuity correction.
4.4. Myofibroblast Differentiation Shifts the Apoptotic Balance Toward a Death-Leaning, Lower-MCL1 State (Figure 4, Figure 5)
We next asked how the apoptotic program changes as IPF fibroblasts differentiate into myofibroblasts. The myofibroblast identity of the labeled cells was validated by the myofibroblast marker module (1.342 vs 0.055 in IPF-Myo vs IPF-Fib; p = 3.9 × 10−145; d = 1.423) and by induction of ACTA2 (log2FC = +3.52; p = 4.9 × 10−47), POSTN (log2FC = +4.31; 40.5% vs 8.0% of cells; p = 1.7 × 10−86), CTHRC1 (log2FC = +2.03; p = 4.5 × 10⁻¹³), and TGFB1 (log2FC = +1.63; p = 1.1 × 10⁻⁸). Figure 4 presents z-scored expression of 27 apoptosis and lineage-marker genes across the four groups; Figure 5 quantifies log2 fold changes for the IPF-Myo versus IPF-Fib contrast.
Figure 4.
Heatmap of apoptosis and lineage-marker gene expression across fibroblast-lineage groups. Columns are the four groups (C-Fib, IPF-Fib, C-Myo, IPF-Myo); rows are 27 pre-specified genes spanning pro- and anti-apoptotic BCL-2 family members, caspases, death-receptor and IAP components, mechanosensing and TGF-β signaling effectors (YAP1, WWTR1, TGFB1), and fibroblast/myofibroblast markers (COL1A1, ACTA2, POSTN, CTHRC1). Color scale: group-mean z-scored log-normalized expression per gene.
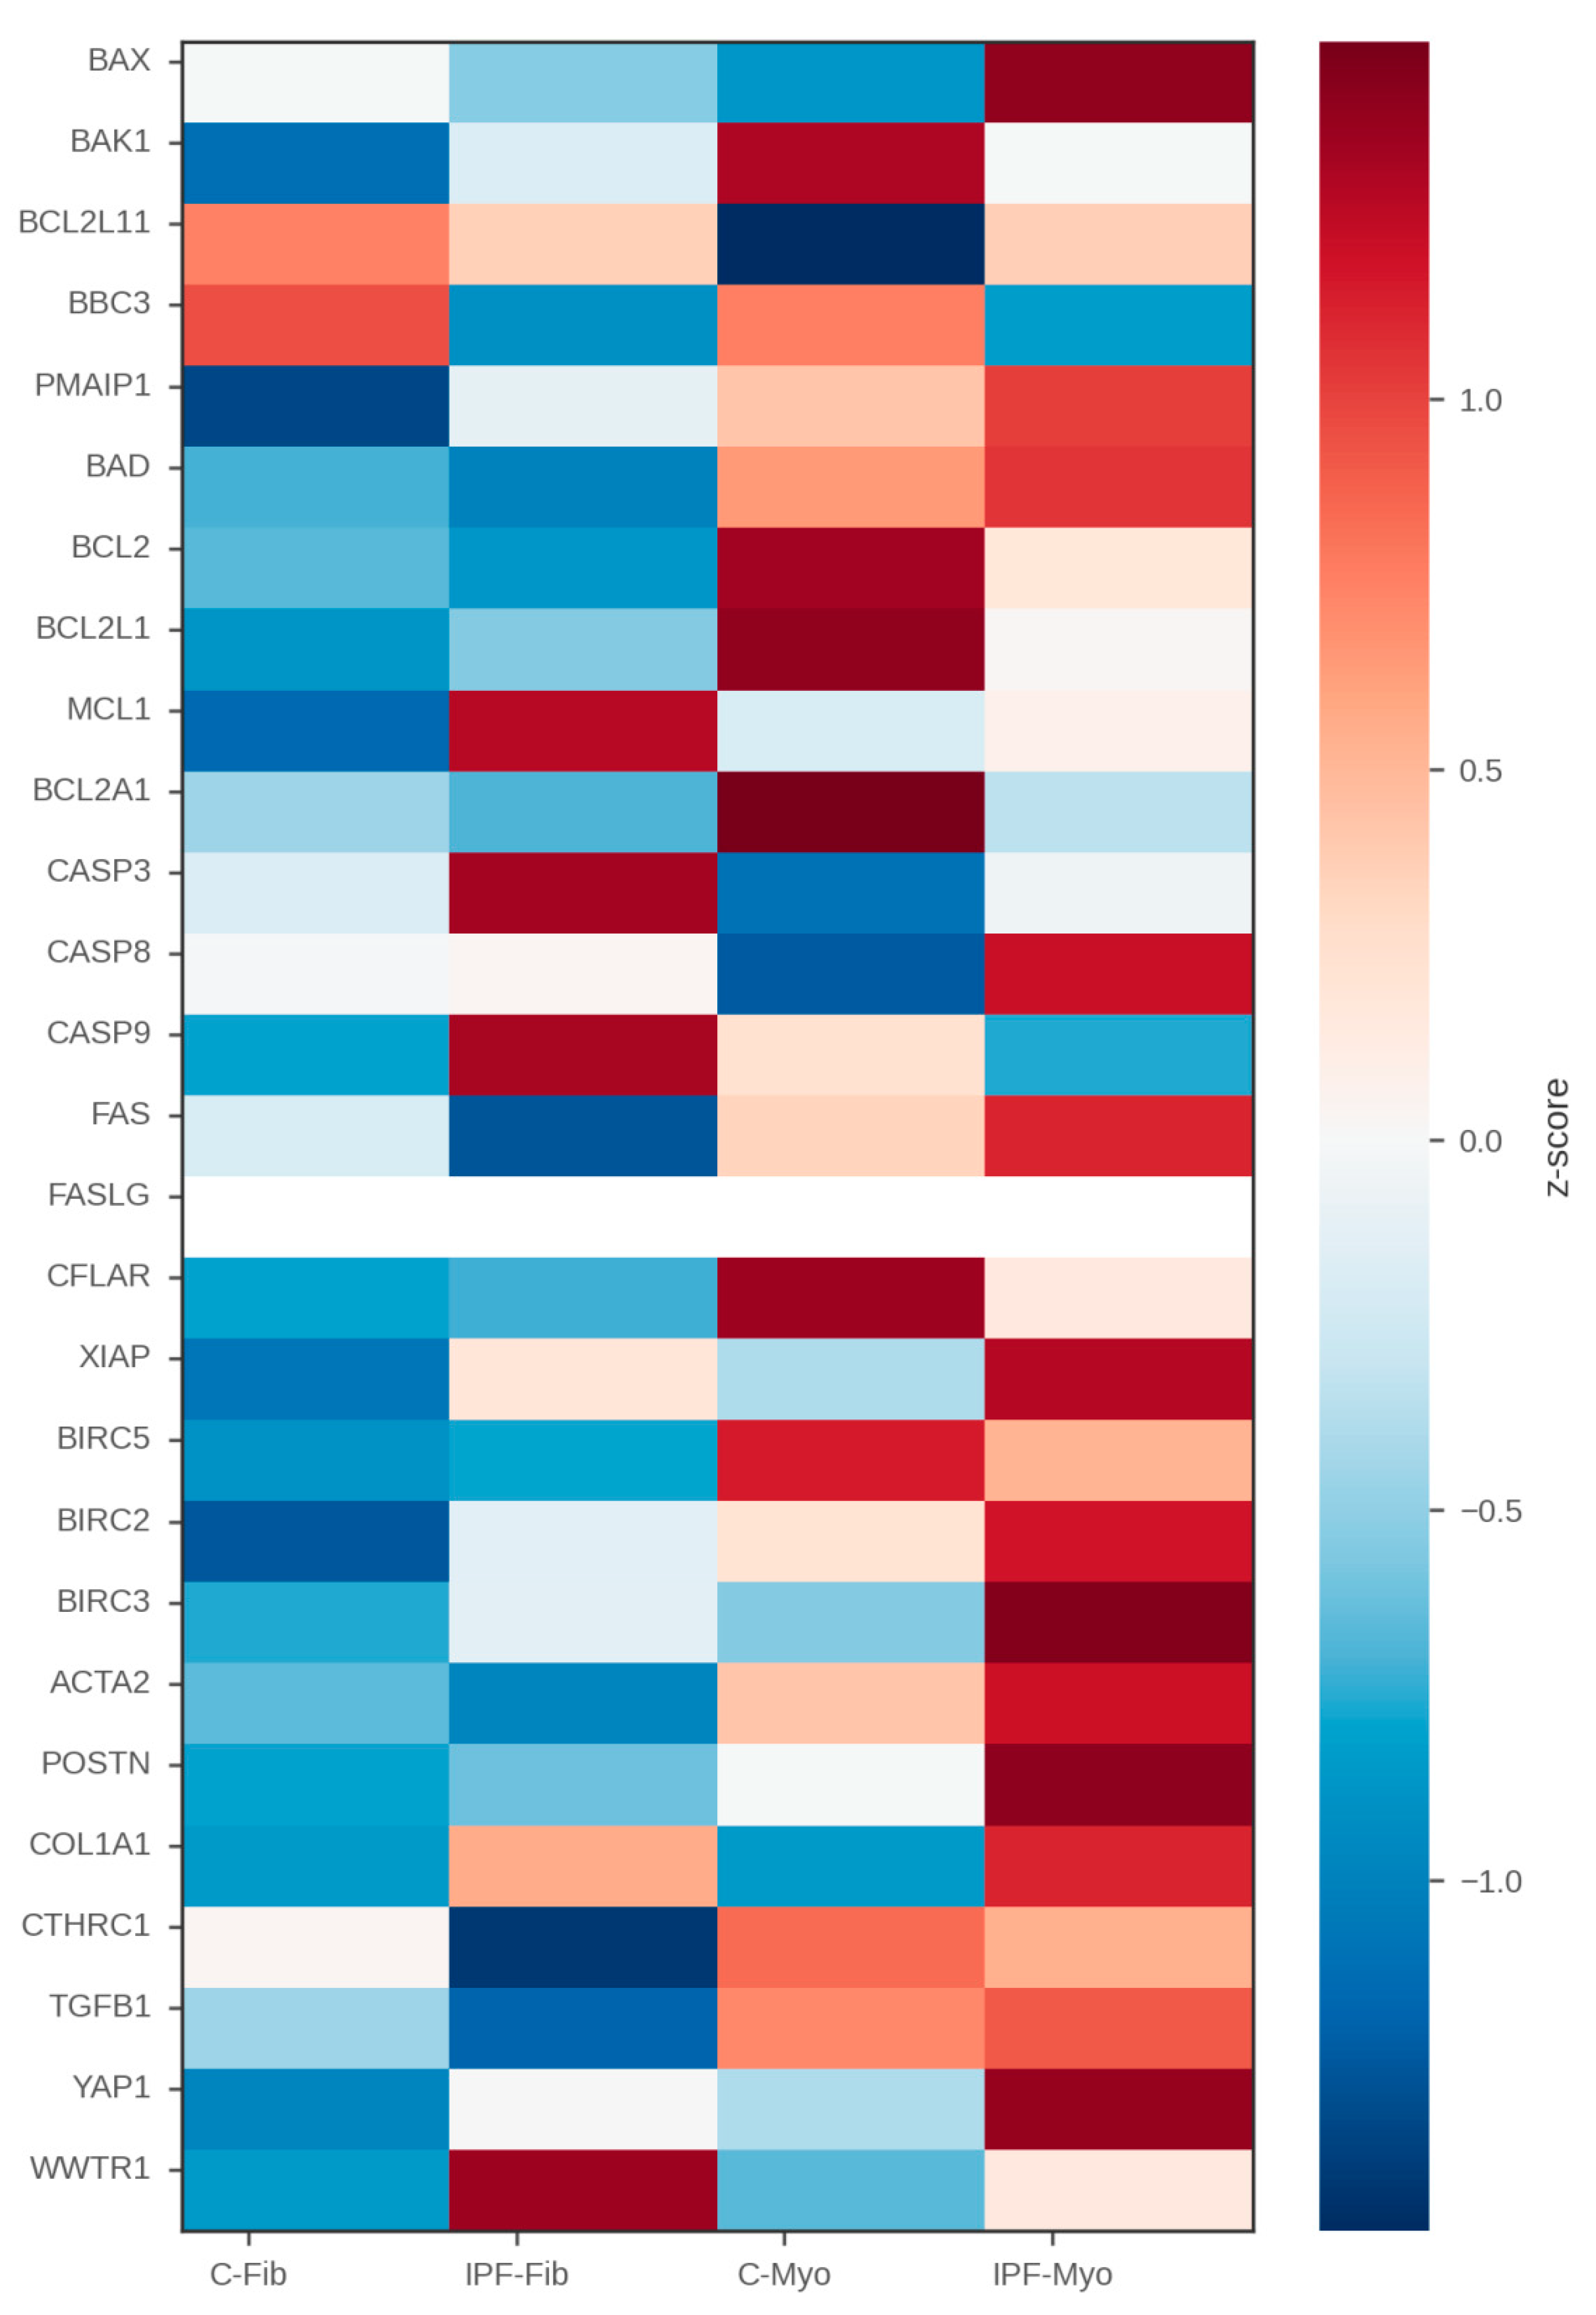
Figure 4 reveals a coherent inversion of the apoptotic program along the fibroblast-to-myofibroblast axis in IPF. The features defining the IPF fibroblast state—high MCL1, elevated CASP9/CASP3, and high WWTR1—attenuate together in myofibroblasts, while BCL2, BIRC5, and BIRC3 rise modestly. Differentiation therefore does not simply amplify the IPF fibroblast program; it reconfigures it, collapsing the MCL1-dominated anti-apoptotic shield and the executioner-caspase machinery simultaneously. Lineage markers behave as expected—ACTA2, POSTN, and CTHRC1 increasing sharply—confirming that the apoptosis-related changes occur along a correctly ordered differentiation axis [18].
Figure 5.
Differential expression of apoptosis genes between IPF myofibroblasts and IPF fibroblasts. Bar plot of log2 fold changes (IPF-Myo vs IPF-Fib) for the apoptosis-focused gene panel. Negative bars indicate down-regulation in myofibroblasts. Asterisks mark nominal p < 10−6 (two-sided Mann–Whitney U, versus IPF fibroblasts); MCL1, CASP9, and CASP3 remain significant after Bonferroni correction.
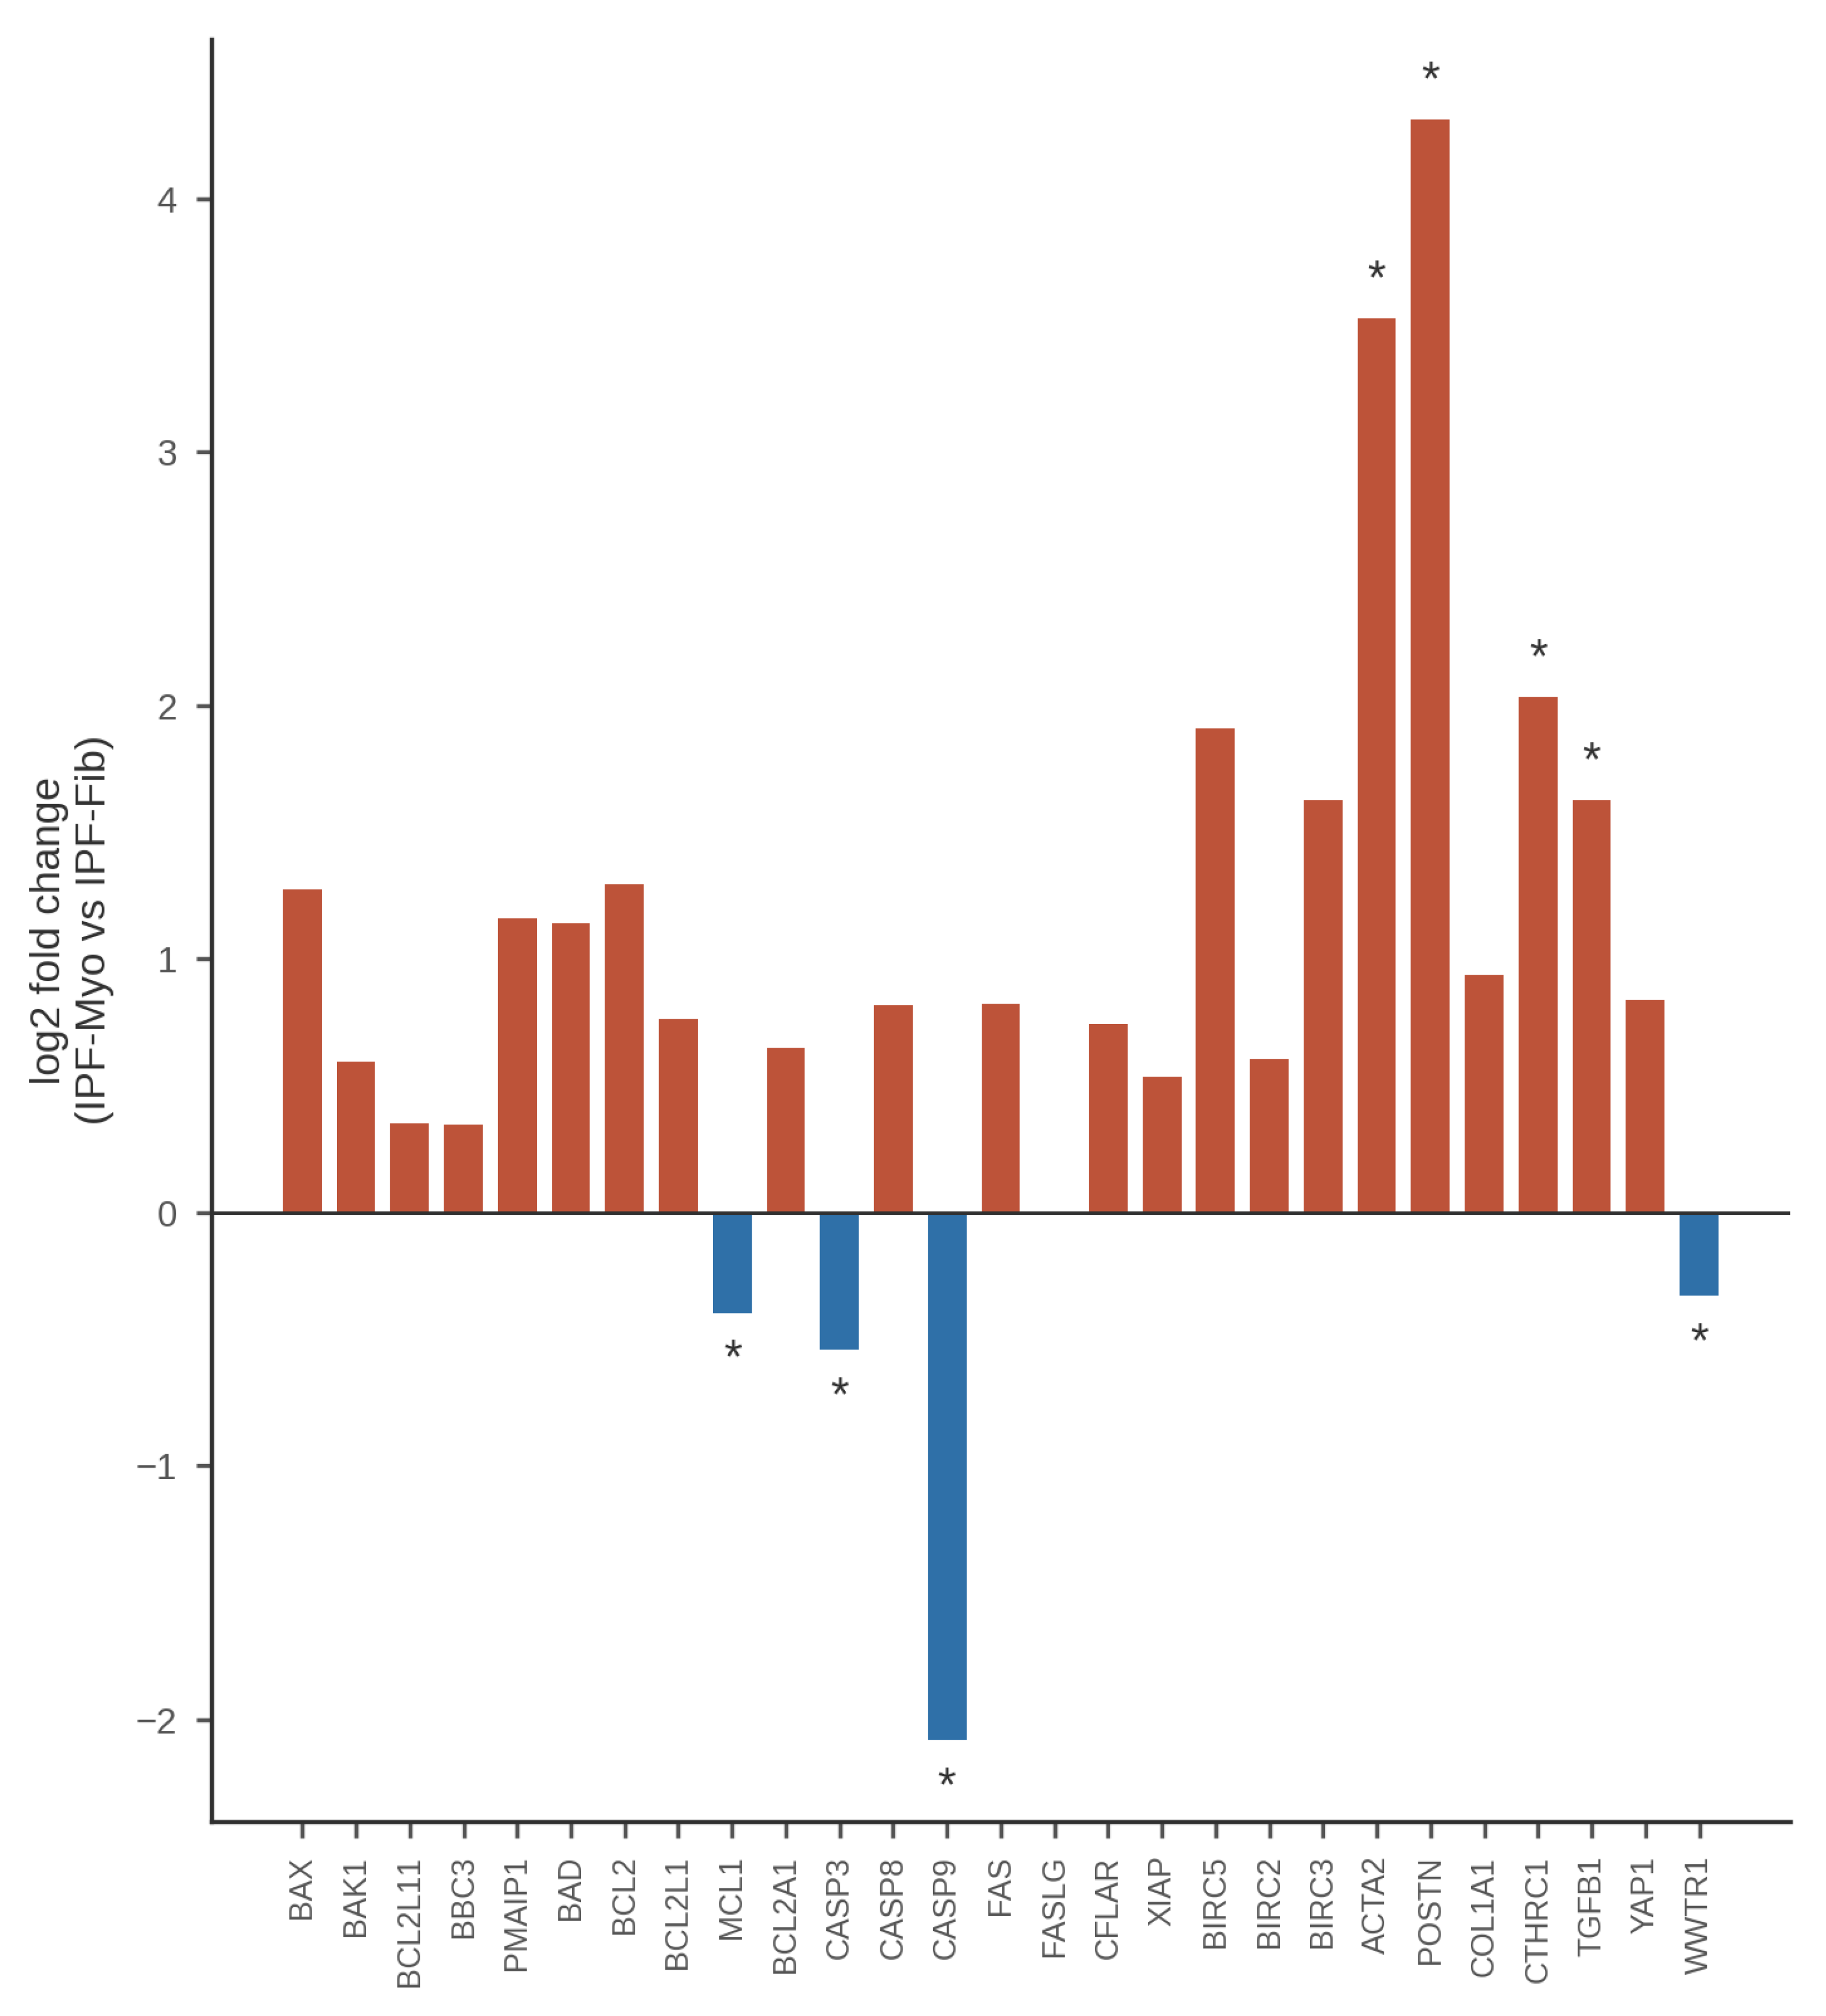
Figure 5 quantifies this reconfiguration. MCL1 declined upon differentiation (log2FC = −0.40; 66.3% vs 91.3% expressing cells; p = 2.4 × 10⁻²⁷; d = −0.53), the anti-apoptotic module fell (−0.155 vs −0.108; p = 2.6 × 10⁻¹¹; d = −0.139), and the caspase module contracted sharply (−0.133 vs 0.046; p = 1.3 × 10⁻²⁴; d = −0.383), driven by the initiator and executioner caspases CASP9/CASP3 (CASP9 log2FC = −2.08, 2.2% vs 16.3% of cells, p = 6.5 × 10⁻²⁴; CASP3 log2FC = −0.54, p = 4.8 × 10⁻⁹). In contrast, the pro-apoptotic module rose (−0.085 vs −0.176; p = 1.1 × 10⁻⁸; d = 0.342). Several compensatory single-gene increases were nominal only and did not survive Bonferroni correction—BCL2 (+1.29; p = 1.2 × 10⁻³; adj NS), BIRC3 (+1.63; p = 3.0 × 10⁻³; adj NS), and BIRC5 (+1.91, albeit in <1% of cells; adj NS)—as was the increase in BAX (+1.27; 32.8% vs 30.5%; p = 6.4 × 10⁻⁴; adj p = 0.069), while BCL2L11 (BIM) was unchanged (p = 0.06). Consequently, the Apoptosis Index rose in IPF myofibroblasts relative to IPF fibroblasts (0.070 vs −0.068; p = 4.5 × 10⁻¹⁶; d = 0.310), indicating that differentiation converts the protected fibroblast population into a primed, death-leaning balance with lower MCL1 (Section 4.3). Against control myofibroblasts, IPF myofibroblasts additionally showed a nominally elevated BAX (log2FC = +0.91; 32.8% vs 21.4% of cells; p = 5.4 × 10⁻⁴; adj p = 0.058, nominal only) and robustly elevated POSTN (+2.31; p = 3.3 × 10⁻⁹; adj p = 3.6 × 10⁻⁷) with nominally persistent BBC3 suppression (−1.20; p = 8.5 × 10⁻⁴; adj p = 0.092, nominal only), suggesting that the IPF myofibroblast retains disease-associated apoptotic features rather than representing a generic myofibroblast state [7,9].
4.5. YAP/TAZ Mechanosensing Activation in the IPF Fibroblast Lineage
Finally, we examined the YAP/TAZ mechanotransduction axis, which couples extracellular matrix stiffening to fibroblast survival and activation [36,37]—a stiff, contractile microenvironment in which myofibroblast contraction itself activates latent TGF-β1 from the extracellular matrix, sustaining the mechanosignaling feedback loop [38]. WWTR1 (TAZ) was robustly up-regulated in IPF fibroblasts relative to control fibroblasts, nearly doubling in expressing fraction (50.1% vs 26.7%; log2FC = +1.56; p = 3.0 × 10⁻⁹; d = 0.51), whereas YAP1 showed a smaller increase that was nominal only and did not survive Bonferroni correction (log2FC = +0.38; 25.2% vs 15.8%; p = 0.015; adj NS). Upon differentiation, WWTR1 fell within IPF (log2FC = −0.33; 29.0% vs 50.1%; p = 1.1 × 10⁻¹⁵; d = −0.27), paralleling the decline in MCL1, whereas YAP1 showed a nominal increase between IPF states that likewise did not survive correction (p = 0.026; adj NS). Between IPF and control myofibroblasts, YAP1 and WWTR1 differences were also nominal only (YAP1 p = 0.009, adj NS; WWTR1 p = 0.012, adj NS). Robust TAZ (WWTR1) activation is thus a feature of the IPF fibroblast stage—coincident with maximal MCL1 expression and the expanded primed pool—rather than of the terminally differentiated myofibroblast, positioning YAP/TAZ signaling as a candidate upstream correlate of the survival-shifted, protected fibroblast phenotype [36,39].
4.6. The Expanded Primed Pool Is Strongest in IPF and Resides in Disease-Emergent Fibroblast Subsets (Figure 6, Figure 7, Figure 8)
To test whether the apoptotic remodeling described above is specific to IPF or a generic feature of fibrotic interstitial lung disease (ILD), we extended the comparison to the two additional fibrotic diagnoses represented in the atlas: nonspecific interstitial pneumonia (NSIP; 117 fibroblast-state cells) and chronic hypersensitivity pneumonitis (cHP; 108 fibroblast-state cells), scored with identical normalization and reference medians (Table S6). In the fibroblast state, the double-high primed fraction was markedly expanded in IPF relative to control (25.6% vs 11.6%; p = 2.6 × 10⁻⁴) but not in NSIP (14.5%; p = 0.61 vs control) or cHP (16.7%; p = 0.34 vs control; Figure 7a). Module-level contrasts told a more graded story (Figure 6): NSIP fibroblasts showed a significantly elevated anti-apoptotic module (adjusted p = 0.032) and a significant MCL1 increase (mean 1.16 vs 0.72; adjusted p = 1.5 × 10⁻³; d = 0.53), and the NSIP Apoptosis Index was likewise significantly shifted (adjusted p = 0.033), while in cHP only MCL1 trended upward (adjusted p = 0.651, NS) and all other contrasts were non-significant. Because the NSIP and cHP fibroblast samples are small (n = 117 and n = 108 cells), these negative results may reflect limited statistical power rather than absolute disease specificity. MCL1 up-regulation therefore behaves as a pan-fibrosis gradient signal—present, but progressively weaker, in NSIP and cHP—whereas the effect is by far strongest in IPF (d = 1.20), and the coordinated double-high primed-pool expansion is likewise predominant in IPF.
Figure 6.
Pan-fibrosis comparison of apoptosis modules across four diagnoses. Anti-apoptotic module, caspase module, Apoptosis Index, and MCL1 expression in fibroblast-state cells from control (n = 146), IPF (n = 1,498), NSIP (n = 117), and cHP (n = 108) donors, using identical normalization, with module scores z-scored against all 114,396 atlas cells and primed medians taken from the pooled IPF + Control fibroblast-lineage compartment. Comparisons are versus Control; two-sided Mann–Whitney U tests with Bonferroni correction within each analysis family. Brackets connect each disease group to Control, staggered top-to-bottom in the order IPF, NSIP, cHP. Significance versus Control, Bonferroni-adjusted: p < 0.05, p < 0.01, p < 0.001; ns, not significant.
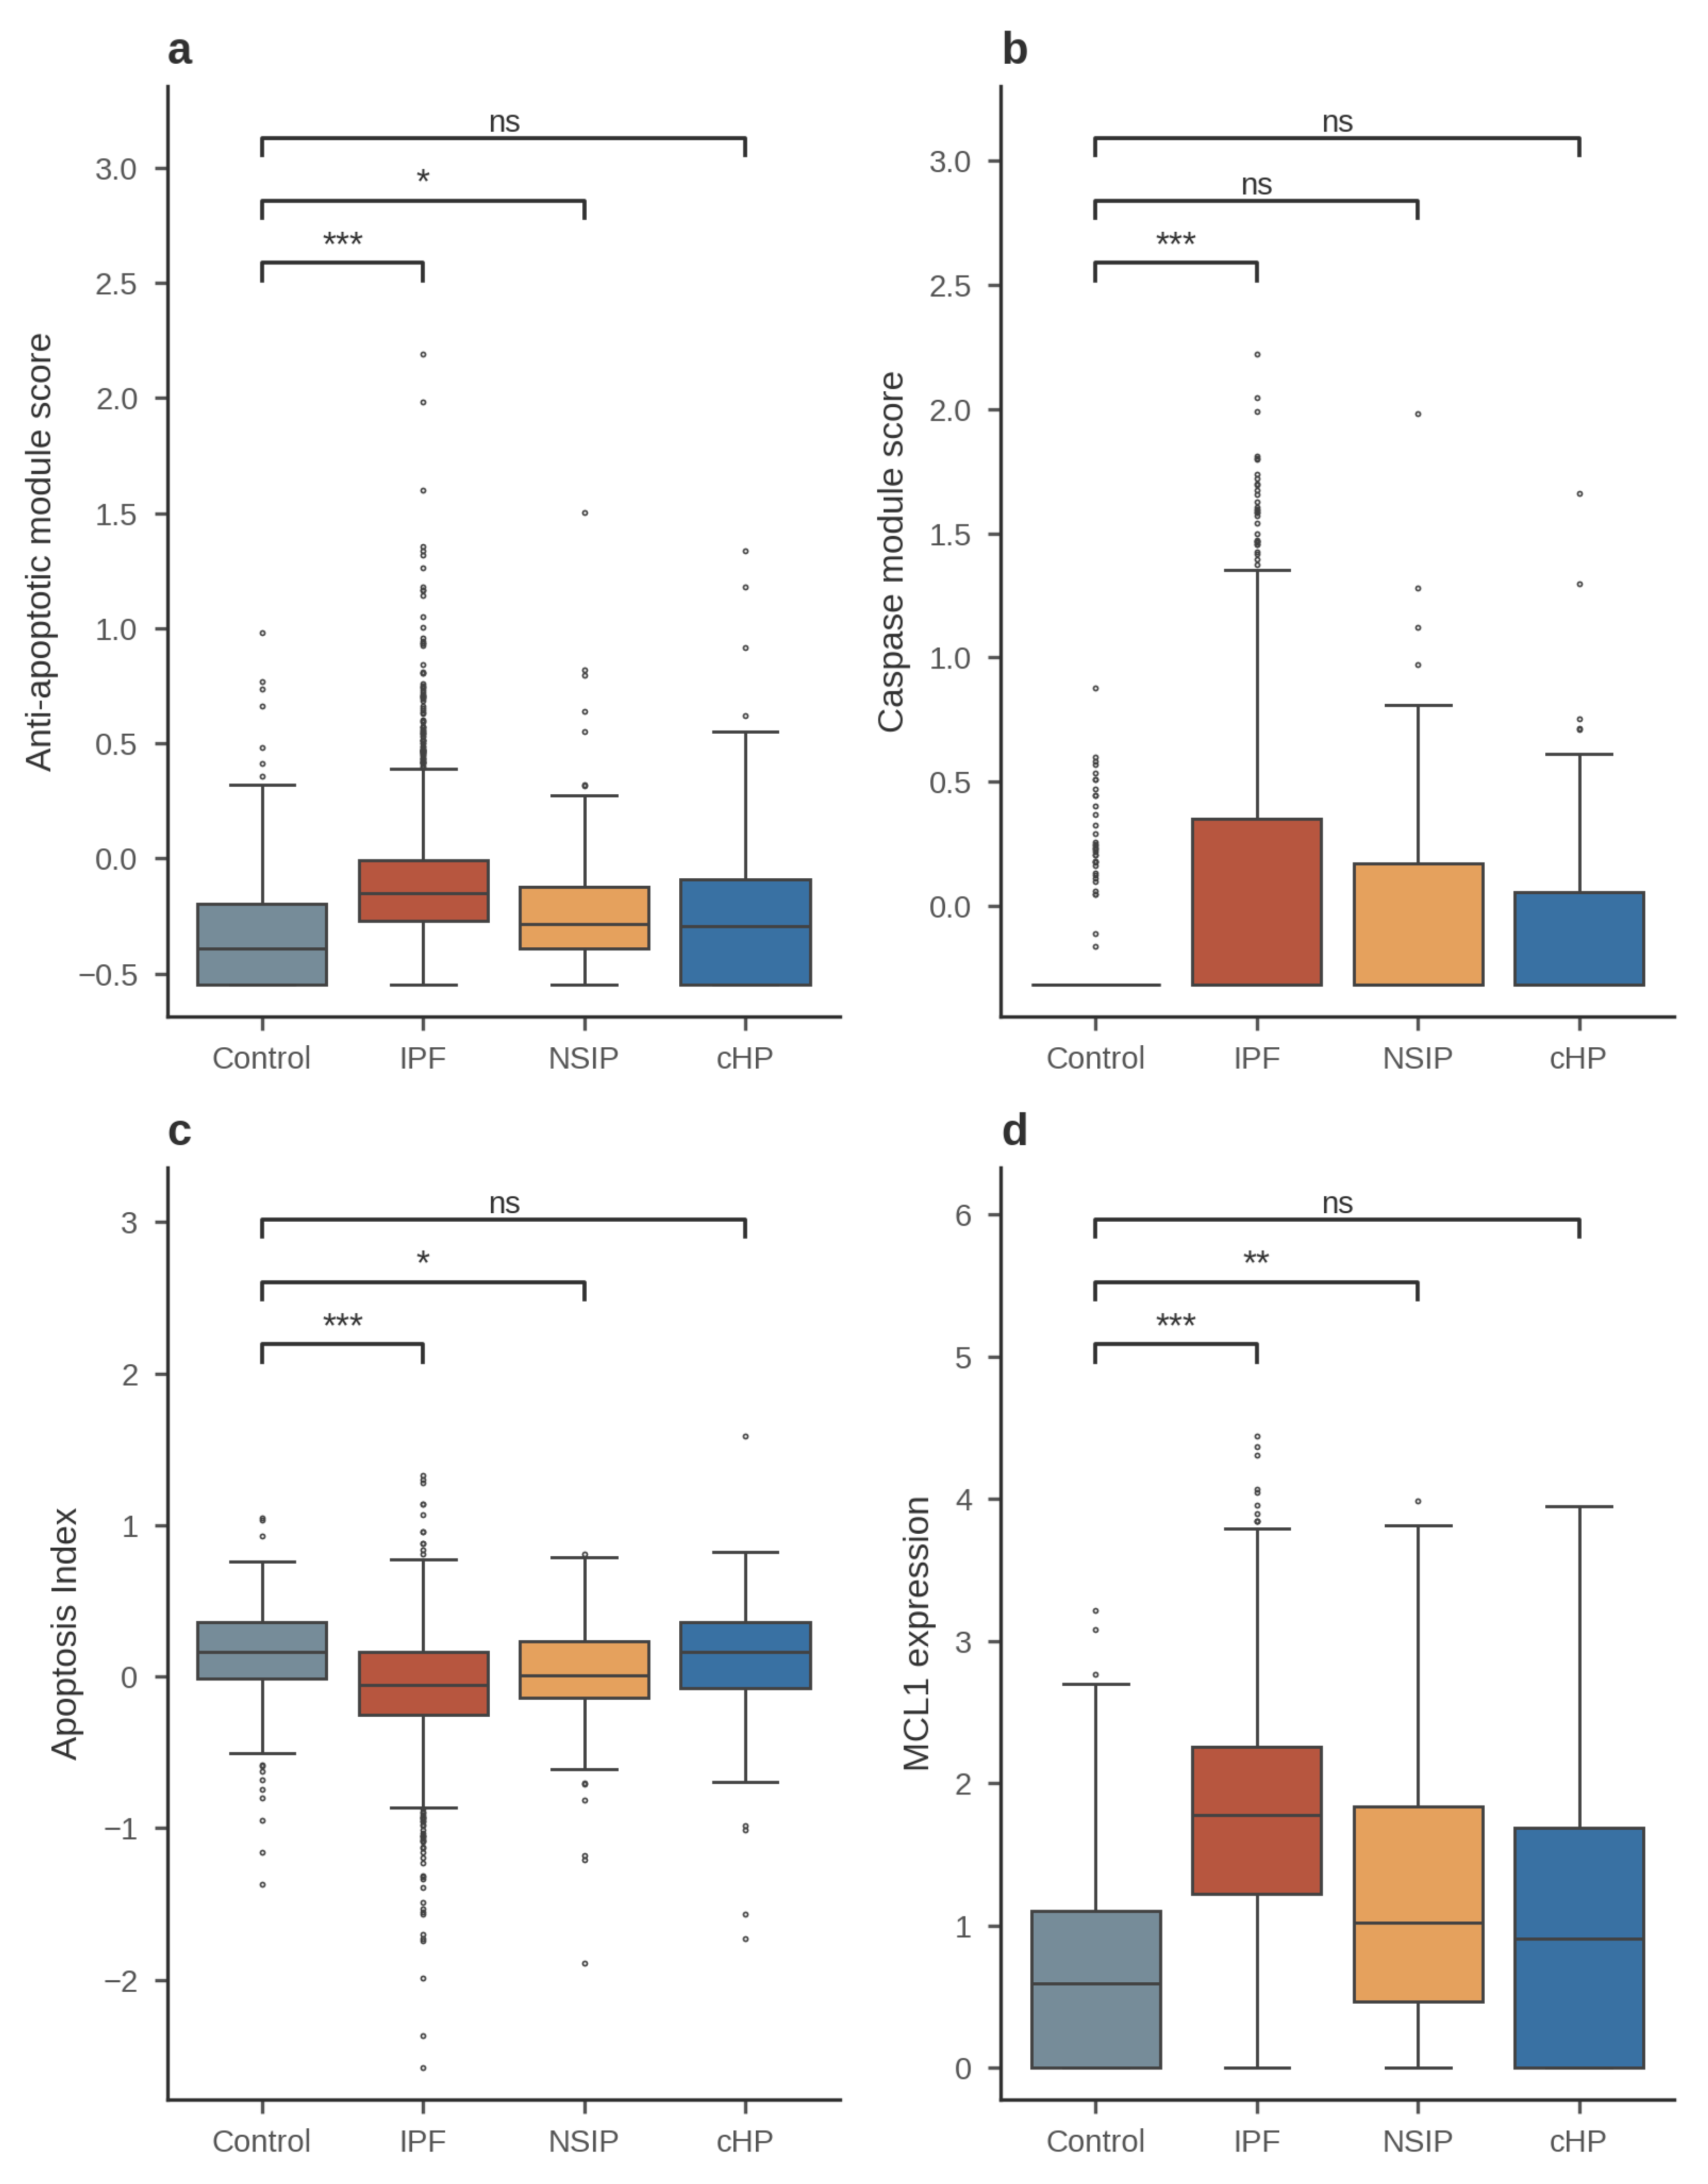
Figure 6 dissociates two components of the IPF apoptotic phenotype. The anti-apoptotic module, caspase module, and composite Apoptosis Index deviate strongly from control only in IPF (anti-apoptotic p = 3.0 × 10⁻²¹, d = 0.66; caspase p = 3.9 × 10⁻⁷, d = 0.45; Apoptosis Index p = 5.3 × 10⁻¹⁴, d = −0.55; all Bonferroni-significant), with NSIP showing a smaller but significant anti-apoptotic shift (adjusted p = 0.032) and cHP showing none. By contrast, MCL1 is elevated across the fibrotic spectrum but on a steep gradient: large in IPF (d = 1.20), moderate in NSIP (d = 0.53; adjusted p = 1.5 × 10⁻³), and nominal only in cHP. This pattern suggests that MCL1 induction may be a shared, quantitatively graded response of fibroblasts to fibrotic lung injury, whereas the full primed configuration—coordinated caspase elevation buffered by anti-apoptotic reserves—is a distinguishing feature of IPF. We caution that the NSIP and cHP fibroblast pools are small (n = 117 and n = 108), so absence of significance there may reflect limited power and is weaker evidence than the positive IPF signal.
Figure 7.
Primed fractions across diagnoses and donor-level replication. (a) Per-cell double-high primed fractions by diagnosis and lineage state; only the IPF fibroblast state differs significantly from control (p = 2.6 × 10⁻⁴). Brackets mark Control-versus-disease chi-square contrasts per lineage state, Bonferroni-adjusted across the six contrasts (**p < 0.01; ns, not significant). (b) Donor-level pseudobulk analysis of the per-donor primed fraction in fibroblast-lineage cells (donors with ≥5 fibroblast-lineage cells; IPF n = 14, control n = 9): IPF 27.0% ± 9.2% versus control 17.0% ± 11.6% (bracket: Mann–Whitney p = 0.023, *; d = 0.99).
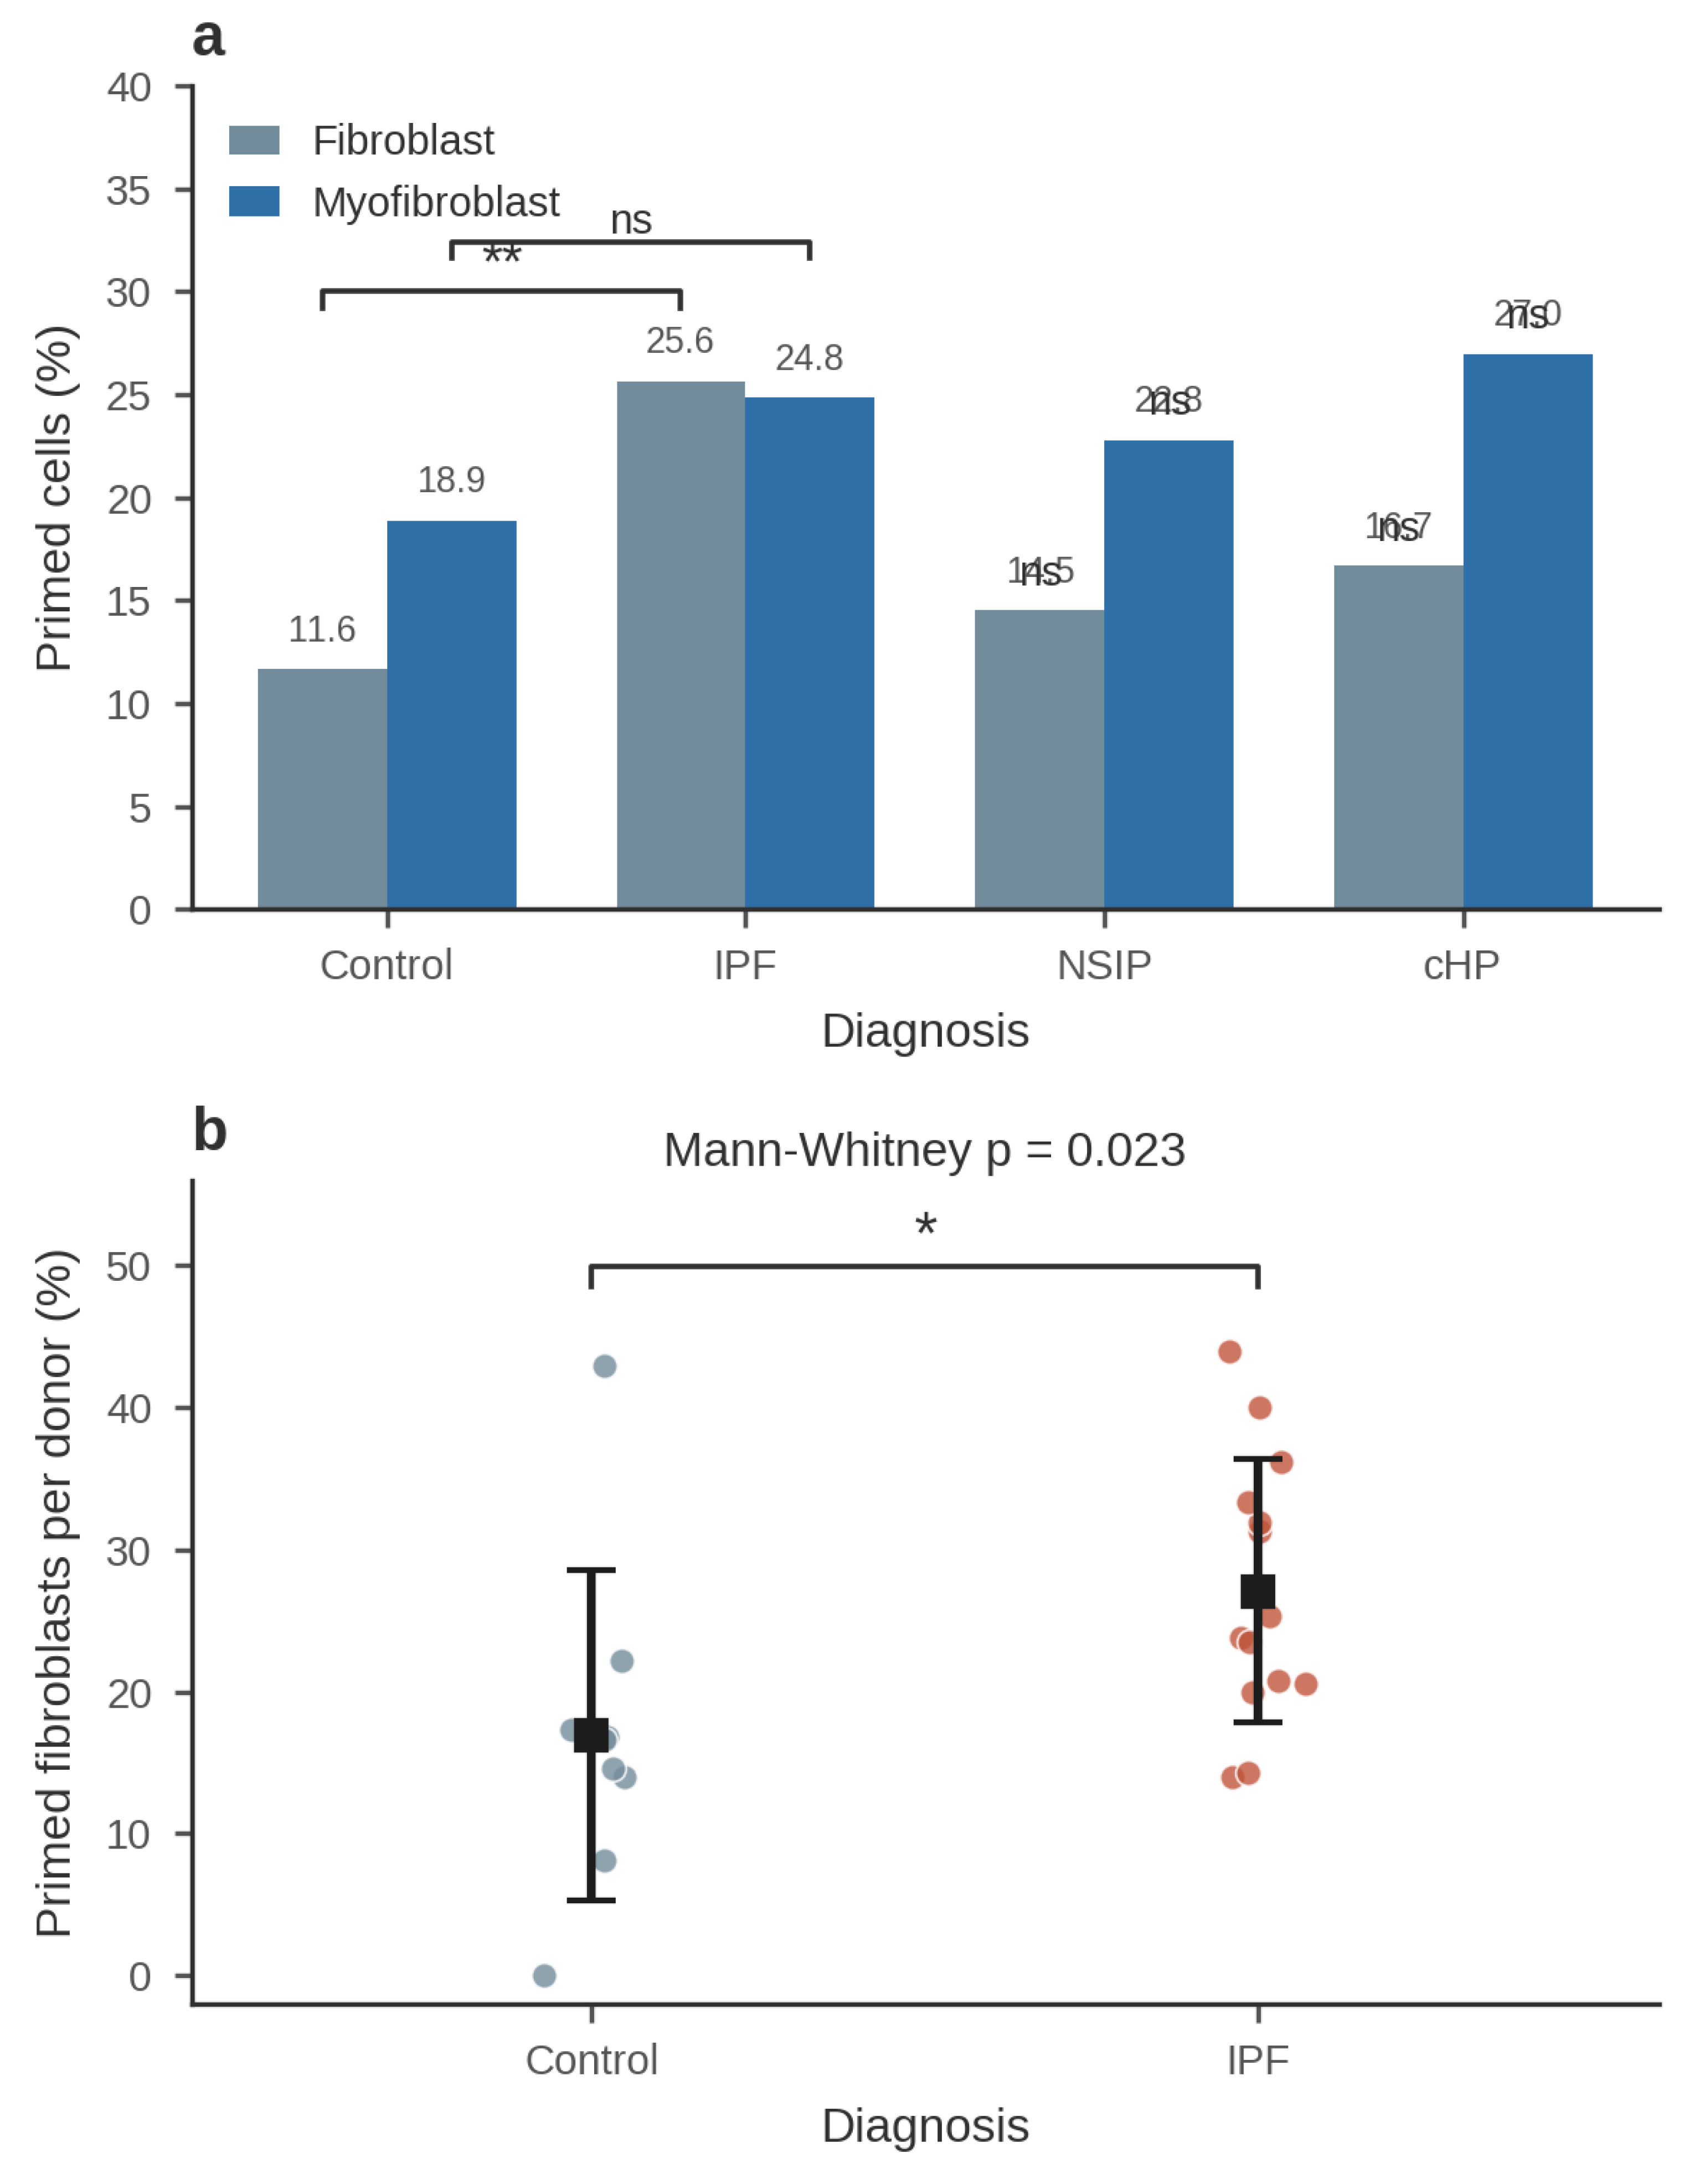
Figure 7 addresses both disease specificity and the pseudoreplication concern raised by cell-level testing. Panel (a) confirms that primed-pool expansion in the fibroblast state is detected only in IPF, whereas myofibroblast-state primed fractions were statistically indistinguishable across diagnoses (control 18.9%; IPF 24.8%; NSIP 22.8%; cHP 27.0%; all inter-disease comparisons NS). Panel (b) replicates the key cell-level finding at donor level: the per-donor primed fraction was higher in IPF than in control (p = 0.023; d = 0.99), as were donor-pseudobulk MCL1 expression (IPF 1.54 ± 0.63 vs control 0.94 ± 0.40; p = 0.047; d = 1.10) and WWTR1 expression (0.39 ± 0.15 vs 0.26 ± 0.11; p = 0.030; d = 0.95). These donor-level p values are nominal—unsurprising given 14 IPF and 9 control donors—but the effect sizes are large and directionally concordant with the cell-level estimates, supporting the conclusion that the primed expansion reflects a donor-level disease property rather than an artifact of treating cells as independent observations [1,2]. At donor level, the module-level elevations did not reach significance (anti-apoptotic: IPF −0.090 versus control −0.187, p = 0.299; caspase: −0.100 versus −0.158, p = 0.395; Apoptosis Index: −0.050 versus 0.008, p = 0.431; pro-apoptotic: p = 0.395; Table S14) — we therefore treat all cell-level module p-values as descriptive and the donor-level pseudobulk analysis as the primary inference; on that basis the module-level contrasts are hypothesis-generating, and the supported findings are the donor-level primed-fraction expansion and the compositional MCL1 elevation.
Figure 8.
Subtype resolution of the primed pool. (a) Heatmap of the double-high primed fraction by curated fibroblast subtype (rows) and diagnosis (columns). Disease-emergent subsets essentially absent from control and cHP lung (PLIN2+ Fibroblasts, 6 cells in each diagnosis; HAS1 High Fibroblasts) are shown for IPF and NSIP where present. (b) Label-independent, flow-style gating tree of the same compartment (purity gate → mandatory CD90+ → ACTA2 dichotomy → PLIN2 reservoir/transitional split), with cell numbers, IPF fractions, and key marker detection per gate; the protected-reservoir versus death-primed contrast is reproduced without curated labels. (c) Marker detection dot plot across the gate × diagnosis populations (bubble size and colour = detection %; full statistics in Table S13). (d) Forest plot of primed-fraction odds ratios across the four cohorts (log scale, 95% CI). (e) GeoMx region profiles (GSE255174) of THY1, proliferation markers (MKI67/PCNA/TOP2A) and matrix genes (COL1A1/POSTN) across IPF fibroblastic foci, established fibrosis, and normal parenchyma (median CPM, relative to maximum; descriptive, n = 9 ROIs per region).
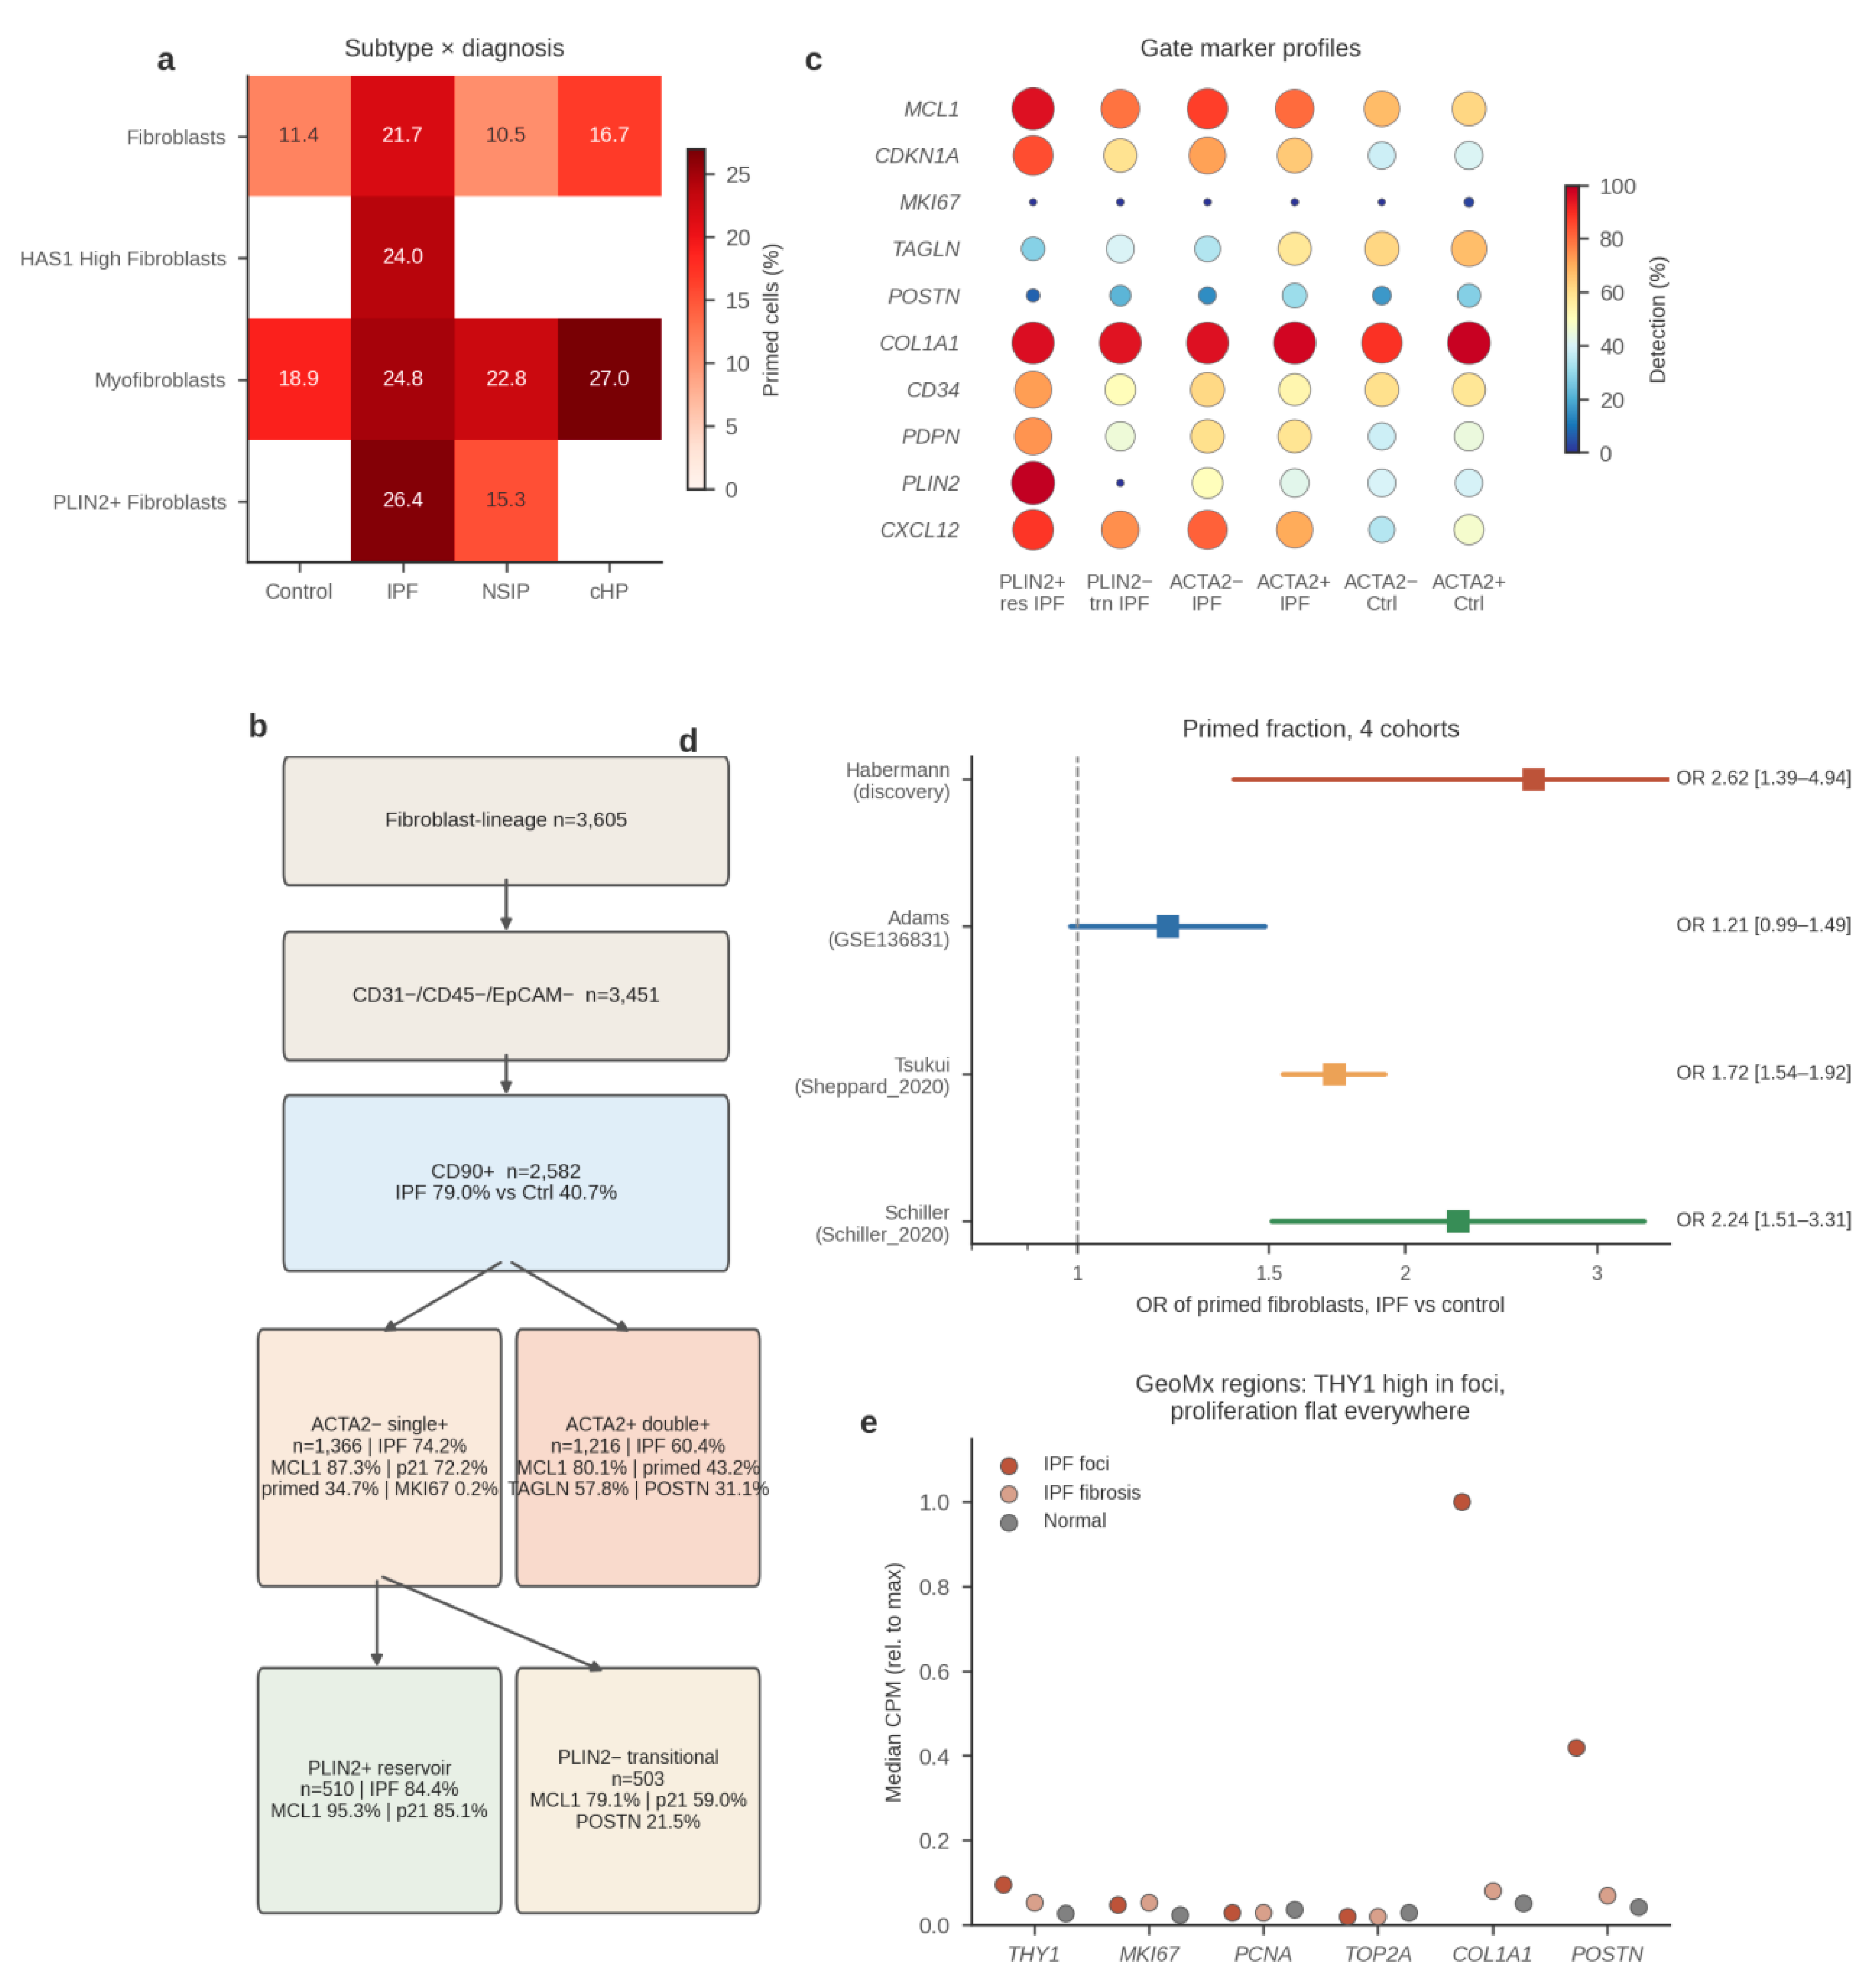
Figure 8 localizes the expanded IPF primed pool to specific disease-emergent subsets (Table S5). Within control lung, ordinary Fibroblasts carried a low primed fraction (11.4%); in IPF, the primed fraction was elevated not only in ordinary Fibroblasts (21.7%) but concentrated in the disease-emergent PLIN2+ Fibroblasts (26.4%; n = 1,167) and HAS1 High Fibroblasts (24.0%; n = 179), as well as Myofibroblasts (24.8%). PLIN2+ Fibroblasts—a lipofibroblast-like population that emerges in fibrotic lung [1,18,20]—are essentially absent from control and cHP lung (6 cells each) and, where present in NSIP, showed a lower primed fraction (15.3%; n = 98) than their IPF counterparts. Thus, the IPF-predominant primed expansion maps preferentially onto the very subsets that arise de novo in fibrotic lung, suggesting that apoptotic priming is a property of the disease-emergent mesenchymal ecosystem rather than of resident fibroblasts generically. A complementary diffusion-map pseudotime analysis on the 319-gene targeted panel failed to recover the fibroblast-to-myofibroblast differentiation axis (pseudotime versus myofibroblast state, Spearman ρ = 0.03); because the panel is dominated by apoptosis genes rather than differentiation-informative genes, this negative control analysis is reported here explicitly and carried to the limitations (Section 5.3).
4.7. Multi-Cohort Replication of the Core Signature (Figure 9, Table 4)
To test the generalizability of the priming signature, we first replicated the full analysis in the independent GSE136831 atlas of Adams et al. [2], which comprises 312,928 cells from IPF, control, and chronic obstructive pulmonary disease (COPD) donors (Methods 3.1). Restricting to the curated fibroblast-lineage compartment (Fibroblast and Myofibroblast labels) from IPF and control donors yielded 5,380 cells—control fibroblasts n = 847, control myofibroblasts n = 204, IPF fibroblasts n = 1,443, and IPF myofibroblasts n = 2,886—analyzed with the identical targeted panel (44 of 45 module/panel genes were present in this dataset; PDGFRA was absent), identical normalization, module scoring, primed definition, and statistical framework (full replication statistics in Table S9–S12).
Seven pre-specified findings replicated with concordant direction, six reaching statistical significance (Figure 9). First, MCL1 was up-regulated in IPF fibroblasts relative to control fibroblasts (p = 1 × 10⁻⁶). Second, MCL1 was strongly elevated in IPF myofibroblasts versus control myofibroblasts (log2FC = +1.65; expressed in 44.9% versus 12.3% of cells; nominal p = 2 × 10⁻¹⁸; Bonferroni-adjusted p = 5.3 × 10⁻¹⁷; d = 0.59)—a contrast that did not reach significance in the Habermann cohort, where the myofibroblast pools were smaller. Third, the anti-apoptotic module was elevated in IPF fibroblasts (p = 7 × 10⁻⁵), and fourth, the Apoptosis Index shifted in the same (survival) direction, though this shift was not significant after multiple-testing correction (nominal p = 2 × 10⁻³; adjusted p = 0.066). Fifth and sixth, the differentiation-stage dynamics replicated: MCL1 declined upon myofibroblast differentiation within IPF (p = 2 × 10⁻¹⁸), while the Apoptosis Index rose (p = 3 × 10⁻²⁷; d = 0.33). Seventh, the donor-level expansion of the primed pool also replicated with nearly identical effect (nominal, not multiplicity-adjusted): per-donor primed fractions were 27.1% ± 10.6% in IPF (31 donors) versus 17.6% ± 11.7% in control (21 donors; p = 0.0068; d = 0.86), essentially matching the Habermann donor-level means (27.0% versus 17.0%). The primed enrichment was strongest in IPF myofibroblasts (29.7% versus 11.8% in control myofibroblasts; p = 6.3 × 10⁻⁸), where the Habermann cohort had shown only a trend (24.8% versus 18.9%; p = 0.095). BAX was also up-regulated in IPF fibroblasts (log2FC = +0.59; adjusted p = 3.8 × 10⁻³), further supporting death-signal loading.
Three findings did not replicate and are reported as cohort-specific: the caspase-module up-regulation seen in Habermann (p = 3.9 × 10⁻⁷; d = 0.45) showed no elevation in Adams (p = 0.01; d = −0.10); the WWTR1 (TAZ) up-regulation was not significant (cell level p = 0.9; donor level p = 0.16); and the cell-level primed comparison of IPF versus control fibroblasts was only marginally significant (24.0% versus 20.7%; p = 0.070), although the donor-level primed analysis replicated strongly (p = 0.0068). Detection-rate differences for lowly expressed caspases (e.g., CASP9) between the two atlases likely reflect platform and annotation differences.
Figure 9.
Independent replication in the GSE136831 cohort (Adams et al. [2]). Violin plots of (a) the anti-apoptotic module score, (b) the caspase module score, (c) the composite Apoptosis Index, and (d) MCL1 log-normalized expression across the four fibroblast-lineage groups of the Adams atlas: control fibroblasts (C-Fib, n = 847), control myofibroblasts (C-Myo, n = 204), IPF fibroblasts (IPF-Fib, n = 1,443), and IPF myofibroblasts (IPF-Myo, n = 2,886). Panels (a)–(c) show module scores z-scored across all 312,928 atlas cells, whereas panel (d) shows log-normalized MCL1 expression (IPF myofibroblasts versus control myofibroblasts: adjusted p = 5.3 × 10⁻¹⁷, d = 0.59). Normalization (counts per 10,000, log1p), module definitions, atlas-wide z-scoring across all 312,928 cells, the double-high primed definition relative to compartment medians, and statistical testing (two-sided Mann–Whitney U) were identical to the primary analysis; the targeted panel comprised 44 of 45 genes (PDGFRA absent from this dataset). Replication statistics for two further cohorts (Tsukui and Schiller atlases) are summarized in Table 4. (e) MCL1 detection and (f) primed fibroblast fractions across all four cohorts (Habermann discovery; Adams; Tsukui; Schiller), with odds ratios and donor-level significance marks where donor numbers suffice. Panels (a)–(d) carry asterisk annotations for IPF- versus control-myofibroblast comparisons in the Adams cohort (**p < 0.001; p < 0.05; ns, not significant after multiple-testing correction).
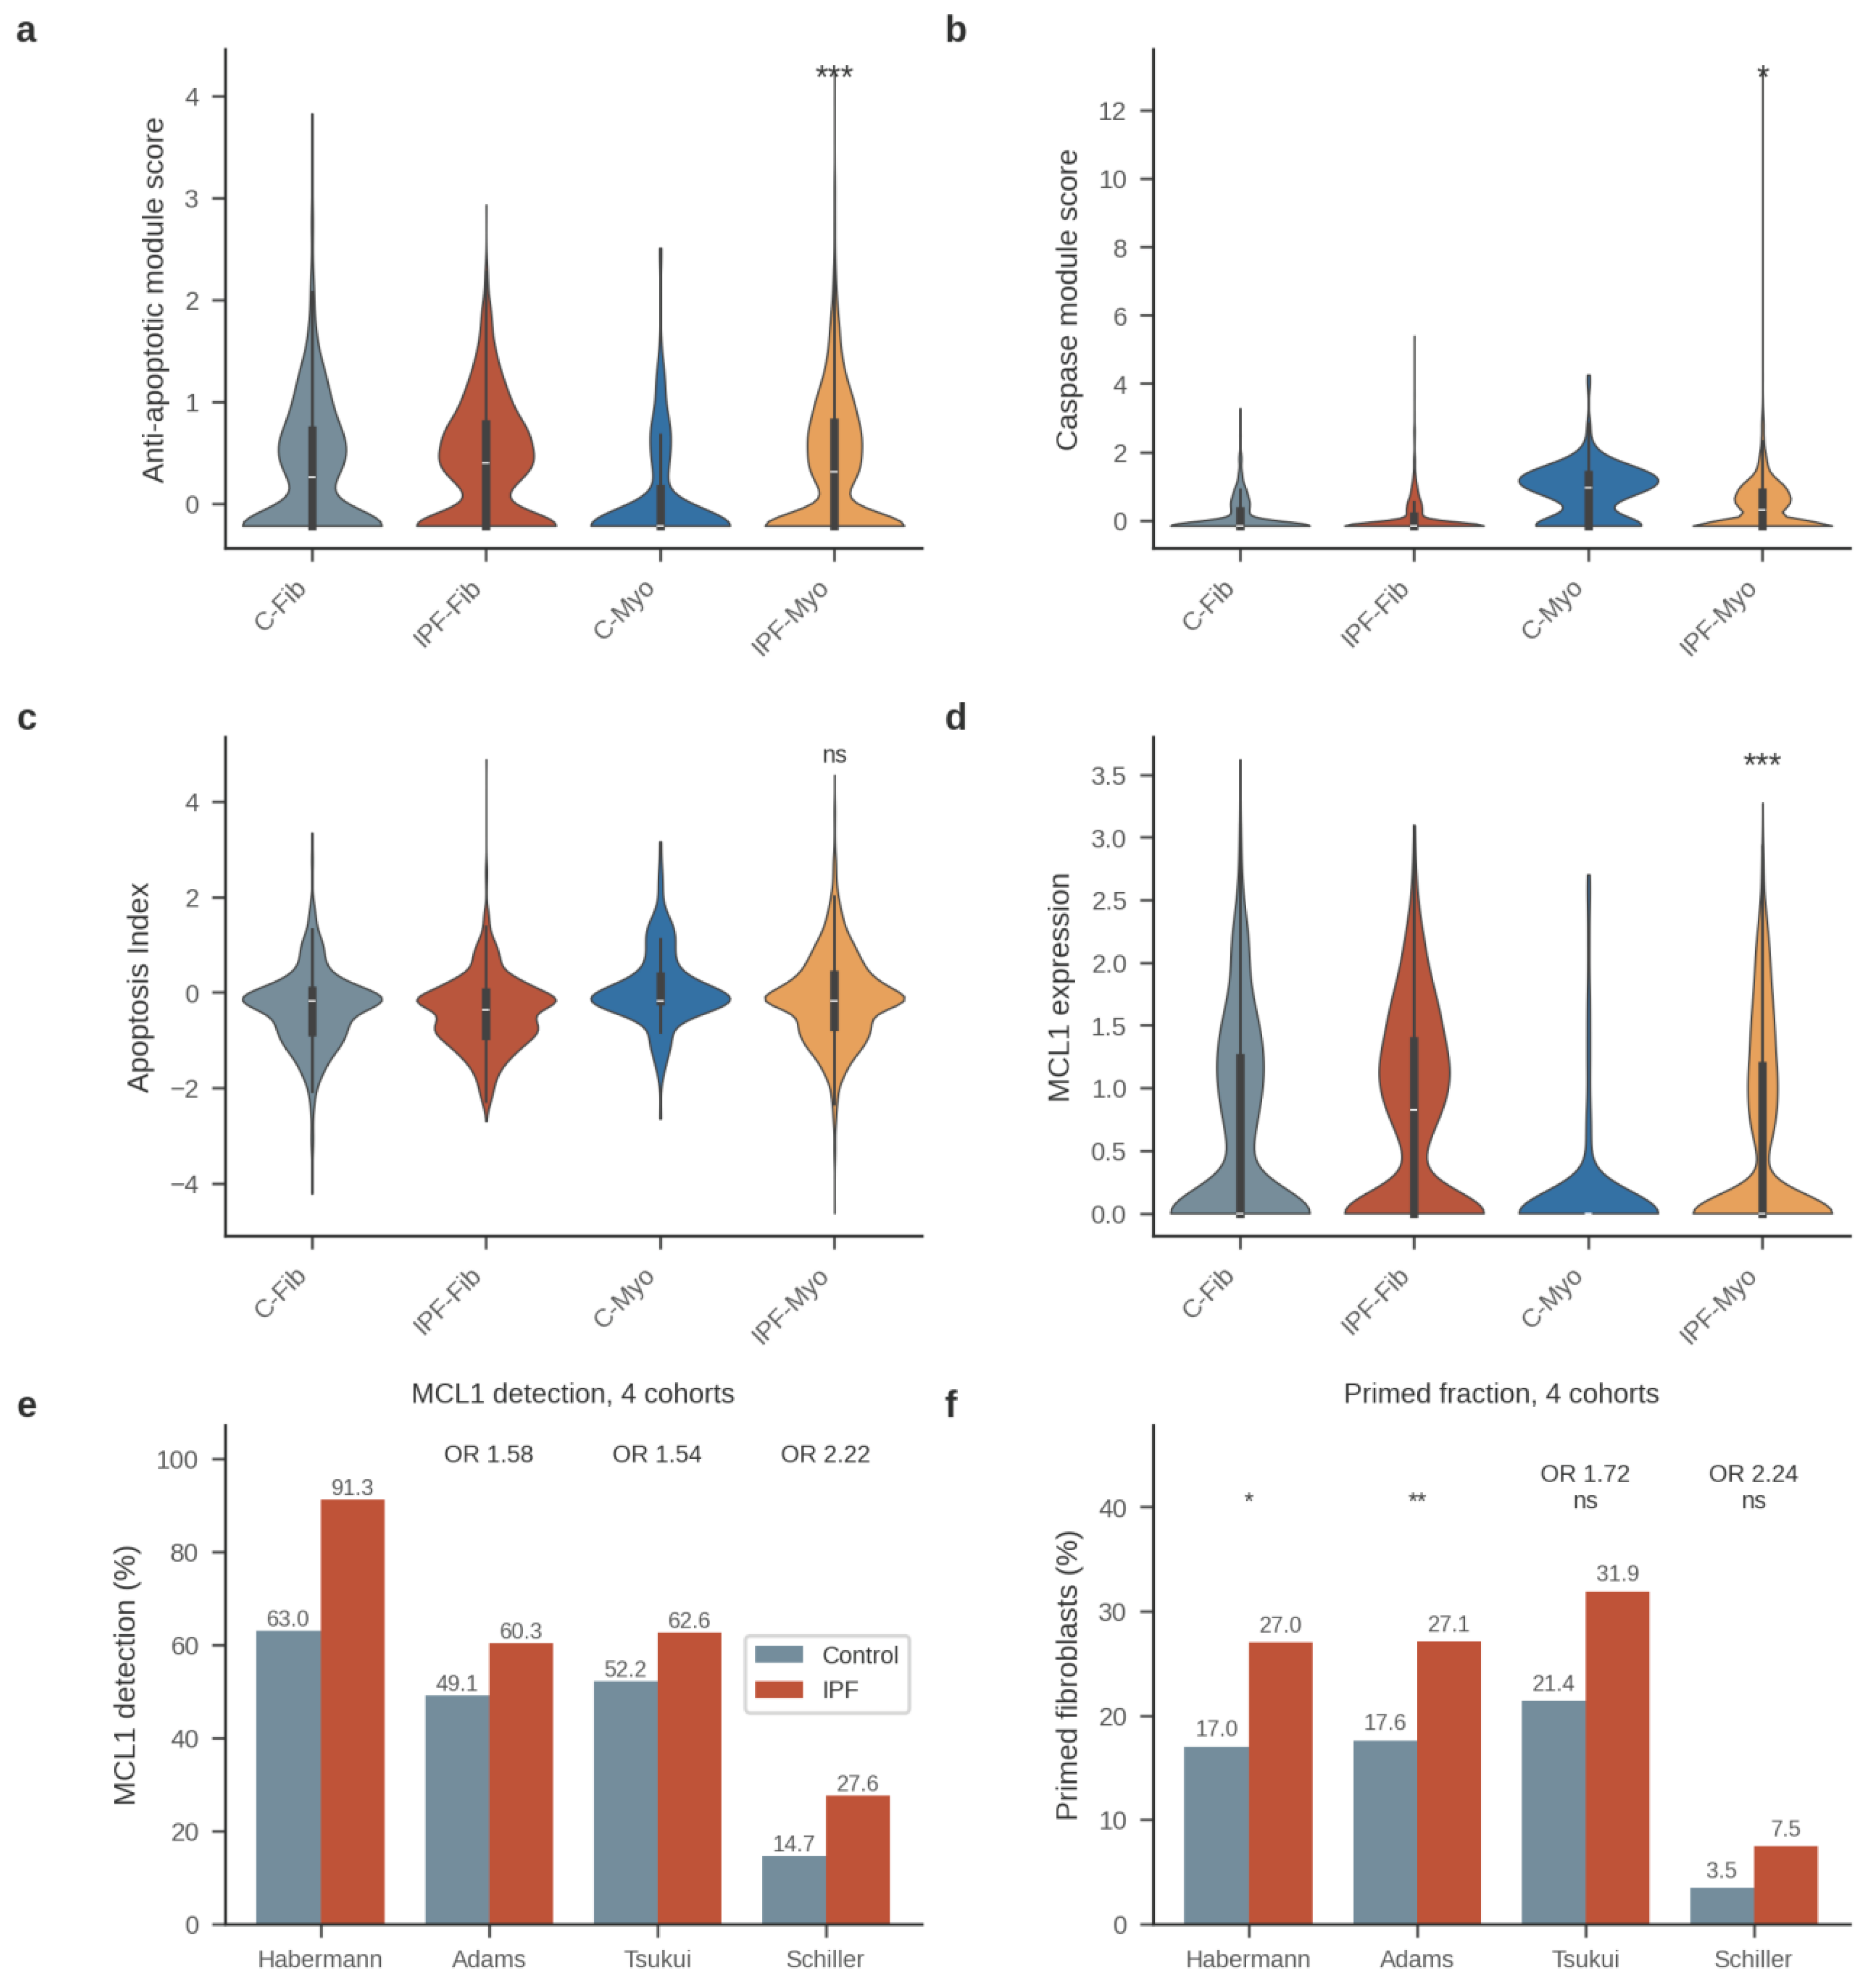
Figure 9 shows that the direction of the survival-shifted remodeling is preserved in an independent, more than two-fold larger fibroblast compartment, albeit with attenuated effect sizes (e.g., anti-apoptotic module d = 0.14 and Apoptosis Index d = −0.11 in Adams, versus d = 0.66 and d = −0.55 in Habermann). The attenuation is consistent with differences in cohort composition, sampling, and platform between the two atlases, and with the larger, more heterogeneous control pool in Adams reducing sampling variance of control estimates. Notably, the donor-level primed-pool expansion—the finding least susceptible to pseudoreplication—replicated with near-identical group means in both cohorts (IPF ≈ 27% versus control ≈ 18%), indicating that the primed expansion is a reproducible, donor-level property of IPF rather than a dataset-specific artifact. The stronger primed enrichment of IPF myofibroblasts in Adams (29.7% versus 11.8%; p = 6.3 × 10⁻⁸) suggests that the myofibroblast association, underpowered in Habermann (n = 196 control myofibroblasts), is a genuine feature of the disease. Together, these results define a robust core signature—MCL1 dominance, donor-level primed-pool expansion, and differentiation-stage dynamics—that now replicates across four cohorts spanning three independent atlases, alongside peripheral components (caspase-module and WWTR1 up-regulation) that are cohort-specific.
Two further independent cohorts replicated the core signature at the cell level (Table 4; Figure S1). In the Tsukui et al. collagen-disease atlas (Sheppard_2020; 6,971 fibroblast-lineage cells from 3 IPF and 3 control donors) [18], MCL1 was detected in 62.6% of IPF versus 52.2% of control cells (odds ratio [OR] 1.54; p = 1.1 × 10⁻¹⁸), and the primed fraction was 31.9% versus 21.4% (OR 1.72; p = 3.0 × 10⁻²³), with MCL1 dominant among all anti-apoptotic genes in both diagnoses. In the Schiller et al. dataset (the “Schiller_2020” dataset within the Human Lung Cell Atlas [45], which corresponds to the Munich Drop-seq lung-fibrosis cohort published by Mayr et al. [44]) (2,428 fibroblast-lineage cells from 3 IPF and 8 control donors), MCL1 detection was 27.6% versus 14.7% (OR 2.22; p = 2.4 × 10⁻¹⁴) and the primed fraction 7.5% versus 3.5% (OR 2.24; p = 3.0 × 10⁻⁵). In both cohorts the donor-level comparisons did not reach significance, reflecting the small number of IPF donors (n = 3 each); these datasets therefore provide cell-level directional confirmation rather than independent donor-level replication.
Table 4.
Multi-cohort replication of the core apoptotic-priming signature.
| Cohort | Fibroblast-lineage cells | IPF/control donors | MCL1 detection, IPF vs control | Primed fraction, IPF vs control | Donor-level verdict |
| Habermann (GSE135893) | 2,653 | 19/12 | 91.3% vs 63.0% | 27.0% vs 17.0% | Significant (p = 0.023) |
| Adams (GSE136831) | 5,380 | 31/21 | 60.3% vs 49.1% (OR 1.58; p = 1 × 10⁻⁶) | 27.1% vs 17.6% | Significant (p = 0.0068) |
| Tsukui (Sheppard_2020) | 6,971 | 3/3 | 62.6% vs 52.2% (OR 1.54) | 31.9% vs 21.4% (OR 1.72) | NS (n = 3) |
| Schiller_2020 (HLCA) | 2,428 | 3/8 | 27.6% vs 14.7% (OR 2.22) | 7.5% vs 3.5% (OR 2.24) | NS (n = 3) |
Cell-level comparisons by chi-square test (OR = odds ratio); donor-level verdicts by Mann–Whitney U on per-donor primed fractions. NS = not significant.
As a sensitivity analysis for demographic confounding, we regressed the per-donor primed fraction on donor age and sex, using demographics recovered from the source study’s Table S2 [1]. Within IPF donors, the primed fraction declined with age (β = −0.0094 per year; p = 0.020), while sex was not associated (p = 0.67). Critically, IPF donors were substantially older than controls (65 versus 35 years); because the age trend is negative, age differences bias the IPF–control contrast toward the null, not away from it. Accordingly, in a model including diagnosis, age, and sex, the IPF coefficient remained positive (β = +0.147) and, although only borderline significant at donor level (p = 0.128; n = 17 donors), adjustment for age is conservative with respect to the primed expansion: the unadjusted IPF–control difference (+9.7 percentage points; p = 0.018) is, if anything, an underestimate of the age-adjusted effect (though the donor-level model is borderline, p = 0.128, n = 17, and is hypothesis-supporting rather than confirmatory).
5. Discussion
5.1. Interpretation of Results in the Context of Prior Work
This study quantifies mitochondrial apoptotic priming at single-cell resolution across the human IPF fibroblast lineage. The principal finding is a two-stage architecture of apoptotic remodeling along the fibroblast-to-myofibroblast axis. At the fibroblast stage, the double-high “primed” fraction was expanded in IPF under the median-based definition (25.6% versus 11.6%; p = 2.6 × 10⁻⁴), yet threshold-sensitivity analysis (significant at the 50th–65th percentile cutoffs, p = 2.6 × 10⁻⁴ to 0.046; non-significant from the 70th percentile upward) and decoupling of the two module arms (pro- × anti-apoptotic score product lower in IPF than in control fibroblasts, 0.016 versus 0.052; p = 1.9 × 10⁻⁶; the product is reference-population-dependent and is used descriptively) showed that this expansion reflects single-arm, MCL1-dominated anti-apoptotic up-regulation—a protected, survival-shifted pool rather than a genuinely dual-arm primed one. Pro-apoptotic loading emerged only upon myofibroblast differentiation: within IPF the pro-apoptotic module rose (p = 1.1 × 10⁻⁸; d = 0.342), and in the independent Adams cohort BAX was up-regulated in IPF myofibroblasts (log2FC = +0.41; adjusted p = 0.025) and the primed enrichment was strongest in that state (29.7% versus 11.8%; p = 6.3 × 10⁻⁸). This two-stage reading aligns the transcriptomic data precisely with the “primed for death” concept originally established by functional BH3 profiling in oncology [13,26] and extended to fibrotic mesenchymal cells by Lagares et al. [9], who demonstrated at the bulk protein level in skin and systemic sclerosis models that stiffness-driven myofibroblast differentiation—not the undifferentiated fibroblast state—loads mitochondria with pro-apoptotic BH3-only signals buffered by an acquired anti-apoptotic dependence. That the fibroblast-stage expansion is driven by the anti-apoptotic arm, with priming proper appearing only as differentiation proceeds, positions our single-cell data as a more exact transcriptomic counterpart of that functional staging than a uniform compartment-wide priming model would be. Our results also extend the framework in two respects: they localize the protected and primed stages to definable cell states in human lung rather than cultured or murine cells, and they resolve priming dynamics along the fibroblast-to-myofibroblast axis at single-cell resolution, which bulk BH3 profiling cannot achieve.
A second, and in our view more consequential, observation is the dominance of MCL1 in the IPF fibroblast anti-apoptotic program (91.3% of cells; d = 1.20 at compartment level)—driven substantially by disease-emergent subtype composition, with the within-state difference attenuating after depth matching—which reframes the prevailing dependency map. Prior functional work emphasized BCL-XL as the critical survival dependency of primed myofibroblasts, based largely on the efficacy of ABT-263, a combined BCL-2/BCL-XL inhibitor [9]. More recently, Redente et al. showed that conditional BCL-2 overexpression in fibroblasts drives persistent fibrosis, yet reported low BCL2 transcript abundance in end-stage IPF fibroblasts [15]. Our data reconcile these findings: BCL2 was sparsely detected (6.5% of cells) and only modestly induced upon differentiation, whereas MCL1 was the dominant anti-apoptotic transcript across the compartment. Taken together, the evidence supports a shift in emphasis away from BCL-2—and, at the transcript level, away from a simple BCL-XL-centric model—toward MCL-1 as a candidate principal buffer of the expanded primed pool. Because mRNA abundance does not equate to functional protein dependence, this conclusion should be regarded as hypothesis-generating rather than definitive [28,29]. Two prior observations bound this interpretation. First, MCL1 (with BCL2A1) has already surfaced as an apoptosis-pathway key gene in a bulk-tissue IPF prognostic model [48]; our analysis extends that bulk association to single-cell, lineage-resolved resolution with a priming framework. Second, functional BH3 profiling in murine fibrotic lung fibroblasts reported decreased Mcl-1 protein alongside increased Bcl-2/Bcl-xL [10]—apparently opposite to our transcript-level finding, and plausibly attributable to species, disease-stage, or the mRNA-to-protein gap we document below (Section 5.3); reconciling the two will require targeted protein measurements in human IPF fibroblast subsets.
Third, myofibroblast differentiation within IPF converted the protected fibroblast state into a genuinely primed one, in the direction the two-stage model predicts: the pro-apoptotic module rose and BAX trended upward (BAX versus control myofibroblasts nominal only) while MCL1 and the initiator and executioner caspases CASP9/CASP3 fell, yielding a death-leaning Apoptosis Index in cells that nonetheless persist and dominate the fibrotic compartment under sustained TGF-β signaling [40]. This “primed but protected” persistence—formally anticipated in reviews of myofibroblast apoptosis evasion [7]—implies that survival of IPF myofibroblasts is maintained by post-transcriptional or microenvironmental mechanisms rather than by transcript-level anti-apoptotic dominance. Our observation that the YAP/TAZ mechanosensing axis is activated in IPF fibroblasts (WWTR1 log2FC = +1.56) is compatible with this interpretation, given that stiffness-dependent YAP/TAZ and focal adhesion kinase signaling provide potent survival cues in fibrotic tissue [36,37,39]. Finally, the mesenchymal survival remodeling we describe stands in contrast to the mitochondrial pathology reported in other compartments of the IPF lung—PINK1 deficiency and defective mitophagy in alveolar epithelia [22] and Akt1-mediated mitophagy dysregulation in macrophages [41]; apoptotic dysregulation in IPF is thus compartment-specific, with impaired mitochondrial quality control in epithelia and macrophages coexisting with buffered death signaling in fibroblasts.
Fourth, the extended pan-fibrosis comparison qualifies the generality of the primed phenotype. The double-high primed-pool expansion was strongest in IPF among the fibrotic ILDs examined: NSIP (14.5%; p = 0.61 vs control) and cHP (16.7%; p = 0.34) fibroblasts did not recapitulate the IPF expansion, and the finding replicated at donor level (p = 0.023; d = 0.99), mitigating the pseudoreplication concern inherent in cell-level testing [1,2]. By contrast, MCL1 up-regulation formed a disease gradient—largest in IPF (d = 1.20), moderate and still significant in NSIP (adjusted p = 1.5 × 10⁻³; d = 0.53), and nominal only in cHP—suggesting that MCL1 induction is a shared, quantitatively graded fibroblast response to fibrotic injury, whereas the coordinated primed configuration is predominant in IPF. The primed pool was further concentrated in the disease-emergent PLIN2+ and HAS1-high fibroblast subsets that arise essentially only in fibrotic lung (PLIN2+ Fibroblasts: 6 cells each in control and cHP) [1,18,20], linking apoptotic priming to the aberrant mesenchymal states that characterize IPF rather than to fibroblasts generically. We note the compartment-level contrast is compositional: restricting to the one fibroblast subtype present in both arms (ordinary Fibroblasts), the expansion is 21.7% versus 11.4% (OR 2.15; nominal p = 0.028), and in myofibroblasts it is not significant (24.8% versus 18.9%, p = 0.095) — the honest reading is that priming maps preferentially onto disease-emergent subsets, rather than a state-intrinsic IPF effect within a shared subtype. Because the NSIP and cHP fibroblast pools were small (n = 117 and n = 108 cells), these negative comparisons may reflect limited statistical power rather than absolute disease specificity, and should be interpreted as absence of detectable signal rather than proof of absence.
Fifth, replication in the independent GSE136831 cohort [2] strengthens confidence in the core signature while delineating its boundaries. The central findings—MCL1 dominance, the survival-shifted Apoptosis Index in IPF fibroblasts, the differentiation-stage dynamics (falling MCL1, rising Apoptosis Index upon myofibroblast differentiation), and the donor-level expansion of the primed pool—replicated with concordant direction (the Apoptosis Index component not significant after multiple-testing correction), and the donor-level primed fractions were nearly identical across cohorts (Adams: IPF 27.1% ± 10.6% versus control 17.6% ± 11.7%, p = 0.0068; Habermann: 27.0% versus 17.0%, p = 0.023). We note that MCL1 is present in the source atlas’s subtype differential-expression tables as an uninterpreted marker of HAS1-high fibroblasts (Habermann et al., Table S5) [1]; the present analysis supplies its functional interpretation through the apoptotic-priming framework. That the core signature now replicates across four cohorts spanning three independent atlases, differing in platform, donor composition, and compartment size, argues that the primed-pool expansion is a robust, reproducible property of IPF rather than a feature of a single atlas; in the two cohorts where donor numbers suffice (Habermann and Adams), the donor-level estimates are essentially identical (IPF ≈ 27% versus control ≈ 18%). Notably, the primed enrichment in the Adams cohort was strongest in IPF myofibroblasts (29.7% versus 11.8% in control myofibroblasts; p = 6.3 × 10⁻⁸)—a contrast only trend-level in Habermann—which, together with the anti-apoptotic-arm-driven, threshold-sensitive nature of the fibroblast-state expansion (Section 4.3), aligns the transcriptomic signature precisely with the original Lagares et al. hypothesis, in which stiffness-driven myofibroblast differentiation itself generates the primed, anti-apoptotic-dependent state [9]. Conversely, the caspase-module and WWTR1 up-regulations did not replicate (Adams: caspase d = −0.10; WWTR1 cell level p = 0.9), and the cell-level primed comparison in fibroblasts was marginal (p = 0.070); we interpret these peripheral components as cohort- or platform-specific—detection-rate differences for lowly expressed caspases support this view—rather than as core features of the IPF priming phenotype. The resulting picture is one of a robust core (MCL1-dominated buffering, donor-level primed-pool expansion, differentiation-stage dynamics) surrounded by a variable periphery, a pattern typical of cross-cohort single-cell replication [1,2].
The protected-to-primed architecture we report also speaks to the broader regulatory framing of fibrosis. A recent synthesis proposed that immune and stromal cells act as dynamic interpreters of intercellular cues, integrating them through gene-regulatory circuits that choose between recovery and chronic scarring [46]. Our single-cell data provide a quantitative, human multi-cohort instantiation of this logic at the level of apoptotic priming: a survival-shifted fibroblast reservoir feeding a death-primed myofibroblast state is precisely the kind of circuit-level state choice that framework anticipates, here resolved to specific BCL-2-family dependencies.
5.2. Therapeutic Implications
If confirmed at the protein level, MCL-1 dominance nominates MCL-1 inhibitors as candidate antifibrotics directed at the expanded primed fibroblast pool. This proposal complements, rather than replaces, the existing BH3 mimetic evidence base: ABT-263 reverses established fibrosis in skin and lung models [9,10], the selective BCL-2 inhibitor ABT-199 (venetoclax) spares platelets but has narrower antifibrotic support [16,31], and BCL-2-pathway targeting through Cpt1a–Bcl-2 disruption or senescent-cell clearance has shown efficacy in preclinical pulmonary fibrosis models [30,32]. A rational next step is member-selective testing against IPF fibroblast subsets, since our transcript data predict differential sensitivity across the BCL-2/BCL-XL/MCL-1 spectrum.
The therapeutic-window argument follows the logic established in acute myeloid leukemia, where the relative priming of malignant versus normal hematopoietic cells determines chemotherapeutic success [26,27]. By analogy, control lung fibroblasts show a low primed fraction (11.6% at the median threshold) whereas IPF fibroblasts are enriched for double-high cells (25.6%)—a difference that is threshold-sensitive and driven by the anti-apoptotic arm at the fibroblast stage, with dual-arm priming proper emerging in myofibroblasts (Section 4.3). We therefore advance the differential-dependence window strictly as a candidate hypothesis requiring functional validation, for example by BH3 profiling of sorted fibroblast and myofibroblast subsets, rather than as a conclusion from transcriptomics. An important practical consideration is that BCL-XL inhibition causes dose-limiting thrombocytopenia, because platelets depend on BCL-XL for survival; this toxicity motivated the development of BCL-2-selective agents [16]. An MCL-1-directed strategy might, in principle, circumvent platelet toxicity while engaging the dominant dependency we observe, although the on-target cardiac and hematologic toxicities reported for MCL-1 inhibitors in oncology (with hepatic liabilities also described) temper this optimism and warrant particular caution, and no conclusions about tolerability in IPF can be drawn from transcriptomics alone. Three further considerations bound any MCL-1 translation: the same fibroblast compartment supplies epithelial-trophic factors (FGF7, HGF, IGF1), so non-selective depletion could dismantle the niche supporting AT2 regeneration; extensively cross-linked matrix in longstanding human IPF may persist even after successful myofibroblast killing; and MCL-1 dependence is shared by neutrophils and by MCL1-high scavenger macrophage populations identified in spatial transcriptomic analyses of fibrotic airway lesions, so the therapeutic window depends on cell-state-selective delivery rather than systemic blockade. Finally, because senescent fibroblasts accumulate in IPF lung and are preferentially primed for apoptosis [23], and because senolytic combinations have shown early, preliminary clinical signals in IPF [24], the primed compartment we define may overlap with the senescent compartment—a convergence that future work should test directly.
5.3. Limitations
Several limitations qualify these conclusions. First, the analysis used a targeted panel of 306 apoptosis- and signaling-related genes (plus 13 mitochondrial QC genes) rather than genome-wide differential expression; pathway activity outside this panel was not assessed. Second, mRNA co-expression is not functional priming: the pro- versus anti-apoptotic balance at the mitochondrial membrane is set by protein abundance, subcellular localization, and post-translational modification, which can only be measured by BH3 profiling or related functional assays [28,29]. Our “primed” fraction is therefore an operational transcriptomic proxy, anchored to—but not equivalent to—the wet-lab definition [9,13]. We additionally interrogated public protein-level evidence for MCL-1 and found a universal detection blind spot rather than contradictory evidence: MCL-1—and indeed all anti-apoptotic BCL-2-family members—was undetectable in every checkable shotgun-proteomics dataset of IPF lung (PXD011116, PXD032352, laser-capture microdissection MS of fibroblastic foci, and an iTRAQ study; BCL-XL, where detectable, was unchanged). Low-abundance, trypsin-recalcitrant BCL-2-family proteins fall below the dynamic range of untargeted proteomics, so the absence of public protein evidence reflects assay sensitivity, not absence of the protein. The mRNA-to-protein gap for MCL-1 therefore remains genuinely open and can only be closed by targeted assays—selected/parallel reaction monitoring (SRM/PRM) mass spectrometry, immunohistochemistry, or functional BH3 profiling—rather than by re-mining existing proteomic data. Third, detection-rate confounding by sequencing depth was assessed directly: IPF fibroblasts had lower, not higher, median UMI counts than control (5,135 versus 7,614), so detection bias would, if anything, mask the IPF MCL1 elevation; UMI-matched subsampling preserved its direction (65.6% ± 2.4% versus 62.1%), and the compartment-level dominance is driven substantially by the disease-emergent PLIN2+/HAS1-high states (93.5–100% detection, nearly absent in control) together with within-state elevation. MCL1 dominance is therefore compositional plus state-intrinsic and cannot be explained by detection depth. Fourth, BCL2 was detected in only 6.5% of cells, rendering BAX/BCL2 ratio estimates unreliable; we accordingly treated the ratio as exploratory. Fifth, the cross-sectional design cannot order causality: whether MCL1 induction precedes, accompanies, or compensates for caspase activation cannot be resolved from a single time point, and end-stage explant tissue may not represent earlier disease. Moreover, control lungs were transplant-declined donor organs exposed to brain death, intensive-care management and mechanical ventilation, not steady-state healthy tissue, and explanted IPF patients typically differ from donor controls in antifibrotic treatment, smoking history, age and sex; part of every IPF–control contrast may reflect these exposures or survivorship selection rather than disease-initiating mechanisms—although for age, the dominant demographic imbalance (IPF donors older by ≈30 years), the sensitivity analysis of Section 4.7 showed the expansion is conservative with respect to age adjustment—and the transcriptionally primed fraction is likely a lower bound because the most death-committed cells are preferentially lost during dissociation. Sixth, cell-state labels were curated annotations from the source study [1]; although myofibroblast identity was validated by marker scores (d = 1.423), residual misclassification is possible. Seventh, module scores were z-scored against all 114,396 atlas cells rather than the fibroblast compartment alone; this broad reference population shifts absolute module values relative to a fibroblast-only reference and should be considered when comparing module scores across studies, although within-compartment group ordering is unaffected. Eighth, cell-level statistical tests treat cells as independent observations, which risks pseudoreplication and can exaggerate significance; we therefore complemented the cell-level primed-fraction comparison with a donor-level sensitivity analysis, and donor-level confirmation of the other findings is warranted. Ninth, the targeted panel—dominated by apoptosis and signaling genes—does not support robust differentiation-trajectory inference: a diffusion-map pseudotime analysis failed to recover the fibroblast-to-myofibroblast axis (pseudotime versus myofibroblast state, Spearman ρ = 0.03), so ordering of priming dynamics along differentiation will require whole-transcriptome trajectory analysis [42,43]. Tenth, enzymatic dissociation of lung tissue into single-cell suspensions can itself induce stress- and apoptosis-related transcripts, a recognized dissociation-induced artifact; because both cohorts were generated with broadly similar dissociation workflows, between-disease comparisons should remain interpretable, but the absolute levels of the primed signal we report may be influenced by this artifact. Relatedly, the double-high primed definition is operational and threshold-sensitive—the fibroblast-state expansion is significant at median-centered cutoffs but not at more stringent ones—so the median threshold should not be read as biologically privileged; we report this sensitivity explicitly in Section 4.3. Finally, although the core signature replicated in GSE136831 (Section 4.7), donor-level replication rests on only two datasets with adequate donor numbers (Habermann and Adams); the two additional replicating cohorts contribute only 3 IPF donors each, so they provide cell-level rather than donor-level confirmation, and the control fibroblast pool of the primary cohort is small (n = 146); the cohort-specific components (caspase module, WWTR1) caution that not all features generalize, and replication in larger prospectively ascertained cohorts remains warranted [2,20]. Lastly, this is a secondary, exploratory re-analysis of public data and was not pre-registered; ‘pre-specified’ denotes analytic choices fixed before the specific inferential test was run, and the two-stage model itself was constructed post hoc in response to the threshold-sensitivity and arm-decoupling results that rejected the initial double-high priming hypothesis.
5.4. Future Directions
Four directions follow naturally. First, protein-level validation: BH3 profiling of sorted IPF fibroblast and myofibroblast subsets would test whether the transcriptomic primed fraction corresponds to functional mitochondrial priming and would directly measure MCL-1 versus BCL-XL dependence [28,29]. Until such functional data exist, targeted protein measurement—PRM mass spectrometry or immunohistochemistry for MCL-1 in fibroblastic foci—is the minimal decisive experiment, because untargeted proteomics systematically fails to detect BCL-2-family proteins (Section 5.3). Second, spatial mapping of primed cells relative to fibrotic foci would determine whether priming is enriched at the advancing edge of fibroblastic foci, where mechanosensing cues are strongest [36,39]. Third, extending the cross-dataset replication now established across four lung cohorts [1,2,18,44] to additional cohorts and organs—systemic sclerosis-associated interstitial lung disease [19] and kidney or cardiac fibrosis models—would establish whether MCL-1-dominated priming is specific to IPF lung or a general feature of fibrotic mesenchyme. Fourth, trajectory analysis along the fibroblast-to-myofibroblast axis [42,43] could resolve when priming is acquired and resolved during differentiation, informing the optimal cellular target state. Ultimately, functional MCL-1 inhibition studies in human precision-cut lung slices or fibroblast-epithelial organoids, benchmarked against ABT-263 and ABT-199, will be required to translate the transcriptomic dependency map reported here into a testable therapeutic hypothesis.
6. Conclusions
This study provides, to our knowledge, the first single-cell transcriptomic quantification of apoptotic priming in the human IPF fibroblast lineage. Reanalyzing the 114,396-cell GSE135893 atlas [1] (89,326 cells from 19 IPF and 12 control donors in the analytic cohort), we dissected 2,653 fibroblast-lineage cells and made three principal findings. First, we resolved the pro- versus anti-apoptotic BCL-2 family balance at single-cell resolution, revealing coordinated upregulation of anti-apoptotic and caspase programs in IPF fibroblasts. Second, we identified MCL1 as the dominant anti-apoptotic transcript of the compartment (log2FC = +1.84; expressed in 91.3% of IPF versus 63.0% of control fibroblasts)—a compartment-level elevation that is substantially compositional (disease-emergent PLIN2+/HAS1-high states carry 93.5–100% detection and are near-absent in control lung), with the within-state difference attenuating after UMI-depth matching (65.6% versus 62.1%, not significant). Third, we resolved a two-stage apoptotic architecture: the IPF fibroblast pool is protected, its expanded double-high fraction (25.6% versus 11.6% under the median definition; p = 2.6 × 10⁻⁴) being threshold-sensitive and driven by the anti-apoptotic arm alone (pro- × anti-apoptotic product p = 1.9 × 10⁻⁶), whereas pro-apoptotic loading emerges upon myofibroblast differentiation (pro-apoptotic module p = 1.1 × 10⁻⁸), yielding a genuinely primed, lower-MCL1, death-leaning myofibroblast state (MCL1 log2FC = −0.40; p = 2.4 × 10⁻²⁷). Extension analyses further showed that this expansion is strongest in IPF among the fibrotic ILDs examined (non-significant in NSIP and cHP, whose small fibroblast samples—n = 117 and n = 108—limit the power of these negative contrasts), replicates at donor level (p = 0.023), and concentrates in the disease-emergent PLIN2+ and HAS1-high fibroblast subsets. Critically, the core signature—MCL1 dominance, donor-level primed-pool expansion (27.1% versus 17.6%; p = 0.0068), and differentiation-stage dynamics—replicated in the independent GSE136831 cohort [2], while the caspase-module and WWTR1 components proved cohort-specific, defining a robust core with a variable periphery. Together, these results establish a protected-to-primed apoptotic state contrast (whose temporal ordering requires whole-transcriptome trajectory or serial-sampling confirmation) as an expanded, MCL-1-anchored feature that is predominant in IPF within the disease-emergent fibroblast compartment, nominating MCL-1 blockade for antifibrotic evaluation. Future work should validate these transcriptomic dependencies by protein-level BH3 profiling and extend replication to additional independent and spatially resolved datasets [2,19].
Ethical Statement
This study is a secondary analysis of publicly available, de-identified datasets (GSE135893, GSE136831); no new data from human participants or animals were collected, and institutional review board approval was therefore not required.
Supplementary Materials
The following supporting information can be downloaded at the website of this paper posted on Preprints.org.
Author Contributions
CS: Conceptualization, Data curation, Formal analysis, Writing—original draft, Writing—review & editing. DL: Data curation, Software, Validation, Visualization. HC: Methodology, Investigation, Formal analysis. All authors read and approved the final manuscript.
Funding
This work was supported by the Beijing Science and Technology Nova Program Interdisciplinary Project (20230484439) and the Beijing High-Level Public Health Technical Talents Project (2023-02-33). The funders had no role in study design, data collection, data analysis, data interpretation, or writing of the manuscript.
Availability of data and materials
All datasets analyzed are publicly available: GSE135893, GSE136831 and GSE255174 from the NCBI Gene Expression Omnibus, and the Tsukui (Sheppard_2020) and Schiller (Schiller_2020) cohorts hosted in the Human Lung Cell Atlas. Processed data tables are provided as Supplementary Material.
Use of artificial intelligence
During the preparation of this work, the authors used AI-based tools for data-analysis assistance and manuscript-preparation support. The authors reviewed and edited the content and take full responsibility for the integrity of this work.
Conflicts of Interest
The authors declare no competing interests.
Authors’ information
Chen Shen, MD, is the corresponding author at Beijing Children’s Hospital, Capital Medical University, Beijing, China.
Ethics approval and consent to participate
Not applicable. This is a secondary analysis of publicly available, de-identified datasets (GSE135893, GSE136831, GSE255174, and HLCA-hosted cohorts); no new data from human participants or animals were collected.
References
- Habermann, A.C.; Gutierrez, A.J.; Bui, L.T.; et al. Single-cell RNA sequencing reveals profibrotic roles of distinct epithelial and mesenchymal lineages in pulmonary fibrosis. Sci. Adv. 2020, 6(28), eaba1972. [Google Scholar] [CrossRef] [PubMed]
- Adams, T.S.; Schupp, J.C.; Poli, S.; et al. Single-cell RNA-seq reveals ectopic and aberrant lung-resident cell populations in idiopathic pulmonary fibrosis. Sci. Adv. 2020, 6(28), eaba1983. [Google Scholar] [CrossRef] [PubMed]
- Richeldi, L.; du Bois, R.M.; Raghu, G.; et al. Efficacy and safety of nintedanib in idiopathic pulmonary fibrosis. N Engl. J. Med. 2014, 370(22), 2071–2082. [Google Scholar] [CrossRef] [PubMed]
- King, T.E., Jr.; Bradford, W.Z.; Castro-Bernardini, S.; et al. A phase 3 trial of pirfenidone in patients with idiopathic pulmonary fibrosis. N Engl. J. Med. 2014, 370(22), 2083–2092. [Google Scholar] [CrossRef] [PubMed]
- Wollin, L.; Wex, E.; Pautsch, A.; et al. Mode of action of nintedanib in the treatment of idiopathic pulmonary fibrosis. Eur. Respir. J. 2015, 45(5), 1434–1445. [Google Scholar] [CrossRef] [PubMed]
- Hinz, B.; Phan, S.H.; Thannickal, V.J.; et al. The myofibroblast: one function, multiple origins. Am. J. Pathol. 2007, 170(6), 1807–1816. [Google Scholar] [CrossRef] [PubMed]
- Hinz, B.; Lagares, D. Evasion of apoptosis by myofibroblasts: a hallmark of fibrotic diseases. Nat. Rev. Rheumatol. 2020, 16(1), 11–31. [Google Scholar] [CrossRef] [PubMed]
- Ramos, C.; Montaño, M.; García-Alvarez, J.; et al. Fibroblasts from idiopathic pulmonary fibrosis and normal lungs differ in growth rate, apoptosis, and tissue inhibitor of metalloproteinases expression. Am. J. Respir. Cell Mol. Biol. 2001, 24(5), 591–598. [Google Scholar] [CrossRef] [PubMed]
- Lagares, D.; Santos, A.; Grasberger, P.E.; et al. Targeted apoptosis of myofibroblasts with the BH3 mimetic ABT-263 reverses established fibrosis. Sci. Transl. Med. 2017, 9(420), eaal3765. [Google Scholar] [CrossRef] [PubMed]
- Cooley, J.C.; Javkhlan, N.; Wilson, J.A.; et al. Inhibition of antiapoptotic BCL-2 proteins with ABT-263 induces fibroblast apoptosis, reversing persistent pulmonary fibrosis. JCI Insight 2023, 8(3), e163762. [Google Scholar] [CrossRef] [PubMed]
- Reyfman, P.A.; Walter, J.M.; Joshi, N.; et al. Single-cell transcriptomic analysis of human lung provides insights into the pathobiology of pulmonary fibrosis. Am. J. Respir. Crit. Care Med. 2019, 199(12), 1517–1536. [Google Scholar] [CrossRef] [PubMed]
- Morse, C.; Tabib, T.; Sembrat, J.; et al. Proliferating SPP1/MERTK-expressing macrophages in idiopathic pulmonary fibrosis. Eur. Respir. J. 2019, 54(2), 1802441. [Google Scholar] [CrossRef] [PubMed]
- Certo, M.; Del Gaizo Moore, V.; Nishino, M.; et al. Mitochondria primed by death signals determine cellular addiction to antiapoptotic BCL-2 family members. Cancer Cell 2006, 9(5), 351–365. [Google Scholar] [CrossRef] [PubMed]
- Singh, R.; Letai, A.; Sarosiek, K.A. Regulation of apoptosis in health and disease: the balancing act of BCL-2 family proteins. Nat. Rev. Mol. Cell Biol. 2019, 20(3), 175–193. [Google Scholar] [CrossRef] [PubMed]
- Redente, E.F.; et al. Conditional BCL-2 expression in fibroblasts promotes persistent pulmonary fibrosis which is reversible by therapeutic BCL-2 inhibition. Nat. Commun. 2026, 17(1), 3317. [Google Scholar] [CrossRef] [PubMed]
- Souers, A.J.; Leverson, J.D.; Boghaert, E.R.; et al. ABT-199, a potent and selective BCL-2 inhibitor, achieves antitumor activity while sparing platelets. Nat. Med. 2013, 19(2), 202–208. [Google Scholar] [CrossRef] [PubMed]
- Xu, Y.; Mizuno, T.; Sridharan, A.; et al. Single-cell RNA sequencing identifies diverse roles of epithelial cells in idiopathic pulmonary fibrosis. JCI Insight 2016, 1(20), e90558. [Google Scholar] [CrossRef] [PubMed]
- Tsukui, T.; Sun, K.H.; Wetter, J.B.; et al. Collagen-producing lung cell atlas identifies multiple subsets with distinct localization and relevance to fibrosis. Nat. Commun. 2020, 11(1), 1920. [Google Scholar] [CrossRef] [PubMed]
- Valenzi, E.; et al. Single-cell analysis reveals fibroblast heterogeneity and myofibroblasts in systemic sclerosis-associated interstitial lung disease. Ann. Rheum. Dis. 2019, 78(10), 1379–1387. [Google Scholar] [CrossRef] [PubMed]
- Travaglini, K.J.; et al. A molecular cell atlas of the human lung from single-cell RNA sequencing. Nature 2020, 587, 619–625. [Google Scholar] [CrossRef] [PubMed]
- Redente, E.F.; Keith, R.C.; Janssen, W.; et al. Loss of Fas signaling in fibroblasts impairs homeostatic fibrosis resolution and promotes persistent pulmonary fibrosis. JCI Insight 2021, 6(1), e141618. [Google Scholar] [CrossRef] [PubMed]
- Bueno, M.; Lai, Y.C.; Romero, Y.; et al. PINK1 deficiency impairs mitochondrial homeostasis and promotes lung fibrosis. J. Clin. Invest. 2015, 125(2), 521–538. [Google Scholar] [CrossRef] [PubMed]
- Schafer, M.J.; White, T.A.; Iijima, K.; et al. Cellular senescence mediates fibrotic pulmonary disease. Nat. Commun. 2017, 8, 14532. [Google Scholar] [CrossRef] [PubMed]
- Justice, J.N.; et al. Senolytics in idiopathic pulmonary fibrosis: results from a first-in-human, open-label, pilot study. EBioMedicine 2019, 40, 554–563. [Google Scholar] [CrossRef] [PubMed]
- Youle, R.J.; Strasser, A. The BCL-2 protein family: opposing activities that mediate cell death. Nat. Rev. Mol. Cell Biol. 2008, 9, 47–59. [Google Scholar] [CrossRef] [PubMed]
- Ni Chonghaile, T.; Sarosiek, K.A.; Vo, T.T.; et al. Pretreatment mitochondrial priming correlates with clinical response to cytotoxic chemotherapy. Science 2011, 334(6059), 1129–1133. [Google Scholar] [CrossRef] [PubMed]
- Vo, T.T.; Ryan, J.; Carrasco, R.; et al. Relative mitochondrial priming of myeloblasts and normal HSCs determines chemotherapeutic success in AML. Cell 2012, 151(2), 344–355. [Google Scholar] [CrossRef] [PubMed]
- Deng, J.; Carlson, N.; Takeyama, K.; et al. BH3 profiling identifies three distinct classes of apoptotic blocks to predict response to ABT-737 and conventional chemotherapeutic agents. Cancer Cell 2007, 12(2), 171–185. [Google Scholar] [CrossRef] [PubMed]
- Bhola, P.D.; Ahmed, E.; Guerriero, J.L.; et al. High-throughput dynamic BH3 profiling may quickly and accurately predict effective therapies in solid tumors. Sci. Signal. 2020, 13(625), eaay1451. [Google Scholar] [CrossRef] [PubMed]
- Pan, J.; Li, D.; Xu, Y.; et al. Inhibition of Bcl-2/xl with ABT-263 selectively kills senescent type II pneumocytes and reverses persistent pulmonary fibrosis induced by ionizing radiation in mice. Int. J. Radiat. Oncol. Biol. Phys. 2017, 99(2), 353–361. [Google Scholar] [CrossRef] [PubMed]
- He, Y.; et al. Therapeutic effects of the Bcl-2 inhibitor on bleomycin-induced pulmonary fibrosis in mice. Front Mol. Biosci. 2021, 8, 645846. [Google Scholar] [CrossRef] [PubMed]
- Gu, L.; Surolia, R.; Larson-Casey, J.L.; et al. Targeting Cpt1a-Bcl-2 interaction modulates apoptosis resistance and fibrotic remodeling. Cell Death Differ. 2022, 29(1), 118–132. [Google Scholar] [CrossRef] [PubMed]
- Hao, Y.; Hao, S.; Andersen-Nissen, E.; et al. Integrated analysis of multimodal single-cell data. Cell 2021, 184(13), 3573–3587.e29. [Google Scholar] [CrossRef] [PubMed]
- Wolf, F.A.; Angerer, P.; Theis, F.J. SCANPY: large-scale single-cell gene expression data analysis. Genome Biol. 2018, 19, 15. [Google Scholar] [CrossRef] [PubMed]
- Aibar, S.; González-Blas, C.B.; Moerman, T.; et al. SCENIC: single-cell regulatory network inference and clustering. Nat. Methods 2017, 14(11), 1083–1086. [Google Scholar] [CrossRef] [PubMed]
- Liu, F.; Lagares, D.; Choi, K.M.; et al. Mechanosignaling through YAP and TAZ drives fibroblast activation and fibrosis. Am. J. Physiol. Lung Cell Mol. Physiol. 2015, 308(4), L344–L357. [Google Scholar] [CrossRef] [PubMed]
- Dupont, S.; Morsut, L.; Aragona, M.; et al. Role of YAP/TAZ in mechanotransduction. Nature 2011, 474(7350), 179–183. [Google Scholar] [CrossRef] [PubMed]
- Wipff, P.J.; Rifkin, D.B.; Meister, J.J.; Hinz, B. Myofibroblast contraction activates latent TGF-β1 from the extracellular matrix. J. Cell Biol. 2007, 179, 1311–1323. [Google Scholar] [CrossRef] [PubMed]
- Zhou, Y.; Huang, X.; Hecker, L.; et al. Inhibition of mechanosensitive signaling in myofibroblasts ameliorates experimental pulmonary fibrosis. J. Clin. Invest. 2013, 123(3), 1096–1108. [Google Scholar] [CrossRef] [PubMed]
- Meng, X.M.; Nikolic-Paterson, D.J.; Lan, H.Y. TGF-β: the master regulator of fibrosis. Nat. Rev. Nephrol. 2016, 12, 325–338. [Google Scholar] [CrossRef] [PubMed]
- Larson-Casey, J.L.; Deshane, J.S.; Ryan, A.J.; Thannickal, V.J.; Carter, A.B. Macrophage Akt1 kinase-mediated mitophagy modulates apoptosis resistance and pulmonary fibrosis. Immunity 2016, 44, 582–596. [Google Scholar] [CrossRef] [PubMed]
- Cao, J.; Spielmann, M.; Qiu, X.; et al. The single-cell transcriptional landscape of mammalian organogenesis. Nature 2019, 566(7745), 496–502. [Google Scholar] [CrossRef] [PubMed]
- Trapnell, C.; Cacchiarelli, D.; Grimsby, J.; et al. The dynamics and regulators of cell fate decisions are revealed by pseudotemporal ordering of single cells. Nat. Biotechnol. 2014, 32(4), 381–386. [Google Scholar] [CrossRef] [PubMed]
- Mayr, C.H.; Simon, L.M.; Leuschner, G.; et al. Integrative analysis of cell state changes in lung fibrosis with peripheral protein biomarkers. EMBO Mol. Med. 2021, 13(4), e12871. [Google Scholar] [CrossRef] [PubMed]
- Sikkema, L.; Ramírez-Suástegui, C.; Strobl, D.C.; et al. An integrated cell atlas of the lung in health and disease. Nat. Med. 2023, 29(6), 1563–1577. [Google Scholar] [CrossRef] [PubMed]
- Alexanian, M.; Srivastava, D. The regulatory logic linking inflammation and fibrosis. Cell 2026, 189(18), 5488–5503. [Google Scholar] [CrossRef] [PubMed]
- Kim, S.J.; Cecchini, M.J.; Woo, E.; et al. Spatially resolved gene expression profiles of fibrosing interstitial lung diseases. Sci. Rep. 2024, 14, 26470. [Google Scholar] [CrossRef] [PubMed]
- Bao, Y.; Yang, S.; Zhao, H. A prognostic model of idiopathic pulmonary fibrosis constructed based on macrophage and mitochondria-related genes. BMC Pulm. Med. 2024, 24(1), 132. [Google Scholar] [CrossRef] [PubMed]
Table 1.
Comparison of the present study with the five closest prior works on apoptotic priming in fibrosis.
Table 1.
Comparison of the present study with the five closest prior works on apoptotic priming in fibrosis.
| Work | Species / system | Resolution | Priming quantified | Human IPF lung | Dependency mapped |
|---|---|---|---|---|---|
| Lagares 2017 [9] | Human scleroderma skin; mouse | Bulk (BH3 profiling) | Yes (functional) | No | BCL-XL |
| Cooley 2023 [10] | Mouse lung, persistent fibrosis | Bulk (pharmacology/histology) | No | No | BCL-2/BCL-XL (inferred) |
| Redente 2026 [15] | Mouse lung; human IPF spatial transcriptomics | Spatial transcriptomics | No | Yes (spatial) | BCL-2 |
| Gu 2022 [32] | Mouse lung, bleomycin | Bulk / cell culture | No | No | BCL-2 (Cpt1a axis) |
| Bhola 2020 [29] | Human/mouse solid tumors | High-throughput dynamic BH3 profiling | Yes (functional) | No | Pan-anti-apoptotic |
| This work | Human IPF lung (GSE135893) | Single-cell transcriptomics | Yes (transcriptional, BCL-2-family co-expression) | Yes | MCL-1 (dominant), BCL-2/BCL-XL profiled |
Disclaimer/Publisher’s Note: The statements, opinions and data contained in all publications are solely those of the individual author(s) and contributor(s) and not of MDPI and/or the editor(s). MDPI and/or the editor(s) disclaim responsibility for any injury to people or property resulting from any ideas, methods, instructions or products referred to in the content. |
© 2026 by the authors. Licensee MDPI, Basel, Switzerland. This article is an open access article distributed under the terms and conditions of the Creative Commons Attribution (CC BY) license (http://creativecommons.org/licenses/by/4.0/).
Copyright: This open access article is published under a Creative Commons CC BY 4.0 license, which permit the free download, distribution, and reuse, provided that the author and preprint are cited in any reuse.