

Submitted:
28 October 2026
Posted:
29 October 2026
You are already at the latest version
Abstract
Magnetocardiography (MCG) can reconstruct the ventricular action potential waveform (VAPw) without contact, potentially bridging cellular and clinical electrophysiology. We assessed the reproducibility and physiological consistency of VAPw reconstruction from 36-channel unshielded SQUID MCG, using new proprietary custom software for automatic reconstruction and artifact editing. Fifteen healthy subjects were recorded twice at rest; ten healthy subjects and ten cardiac patients were recorded at rest and after bicycle exercise. The reconstructed duration at 80% repolarization (rVAPw80) was about three times more reproducible than the manually measured QT (standard error of measurement 3.4 vs 10.1 ms; intraclass correlation 0.97 vs 0.78), and its small test–retest differences reflected the signal rather than the placement of fiducial points. rVAPw80 shortened consistently with heart rate (within-subject slope 0.145 ms/ms in healthy subjects and 0.299 in patients; within-subject r 0.89 and 0.91), the shortening occurring before the T-wave peak, whereas reconstructed phase 0 was rate-independent in healthy subjects. In two noisy recordings, strong 50-Hz interference barely affected the reconstruction. Finally, we discuss how room-temperature quantum sensors, particularly nitrogen-vacancy (NV) diamond magnetometers, and artificial intelligence for fiducial-point detection, single-beat denoising and model-based reconstruction could bring non-invasive electrophysiology closer to the cellular scale.
Keywords:
magnetocardiography
; non-invasive MCG imaging of ventricular action potential waveform
; ventricular repolarization
; SQUID
; non-cryogenic quantum sensors technology
; OPM sensors
; NV-diamond magnetometers
; AI-assisted MCG denoising and modelling
; multimodal imaging of cardiac electrophysiology
1. Introduction
Over the past 50 years, age-adjusted mortality from acute myocardial infarction and ischemic heart diseases has declined substantially. However, this trend has been accompanied by an almost equivalent increase in mortality from other heart diseases, particularly heart failure, hypertensive heart disease, and arrhythmia, which accounted for 12%, 13%, and 4%, respectively, of total heart disease mortality in 2022 [1].
Cardiac arrhythmias are among the leading causes of sudden cardiac death (SCD) and contribute significantly to cardiovascular mortality. Consequently, the preventive, non-invasive identification of arrhythmogenic mechanisms remains a major clinical challenge. Invasive electrophysiology (EP) assessment has advanced considerably since the late 1960s, achieving high accuracy in identifying and localizing arrhythmogenic mechanisms and substrates. The advances have been driven by dedicated medical devices for real-time, invasive three-dimensional (3D) electroanatomical mapping (EAM), increasingly integrated with magnetic resonance imaging (MRI) to guide catheter ablation [2,3]. Among catheter-based EP techniques, monophasic action potential (MAP) recording represented an early attempt to bridge experimental cellular electrophysiology and clinical EP assessment [4,5,6].
Because invasive diagnostic procedures can cause substantial discomfort and entail safety risks [7], non-invasive alternatives have been investigated for preventive arrhythmia-risk screening and long-term clinical follow-up of patients with complex arrhythmias. Radionuclide imaging, cardiac MRI, and computed tomography (CT) have enabled more detailed characterization of the structural and functional substrates underlying life-threatening ventricular arrhythmias. Nevertheless, radiation exposure, technological complexity, limited availability, and costs constrain their widespread use [7,8,9].
Since the 1980s, magnetocardiographic (MCG) mapping has demonstrated its ability to localize cardiac sources [10,11], and has been proposed as a promising tool for non-invasive pre-interventional localization and 3D electroanatomical imaging (EAI) of arrhythmogenic substrates [12,13,14,15]. Electrocardiographic imaging (ECGi), based primarily on multielectrode body-surface potential mapping (BSPM), has likewise enabled individualized, non-invasive, pre-interventional 3D imaging of the electrophysiological mechanisms underlying cardiac arrhythmias [16,17,18,19,20]. This approach solves the inverse problem of electrocardiography [21], by integrating body-surface measurements with patient-specific anatomical information derived from cardiac CT or MRI and applying mathematical algorithms to reconstruct epicardial and endocardial electrograms, isopotential distributions, and activation sequences (isochrones) [22,23,24].
As a contactless technique, MCG offers potential advantages for cardiac mapping in terms of acquisition efficiency, practicality, and cost. However, the complexity and expense of cryogenic superconducting quantum interference device (SQUID)-based multichannel systems, which have traditionally required costly magnetically shielded rooms (MSR), have substantially limited clinical adoption, confining MCG to a relatively small number of research and clinical institutions [25].
More recently, advances in non-cryogenic and portable quantum sensor technologies [26,27,28] have enabled the development of more accessible MCG mapping systems, simplifying in-hospital installation, facilitating multicenter clinical trials, and supporting the investigation of large patient populations worldwide [29]. Industrial development and clinical validation of novel optically pumped magnetometer (OPM)-based systems have focused predominantly on ischemic heart disease (IHD). This work has contributed to several regulatory recognitions supporting the use of resting MCG as a clinically applicable diagnostic tool for the early identification or exclusion of IHD, particularly in patients presenting to emergency departments with acute chest pain [30,31,32,33,34,35].
Alongside these developments, recent studies have renewed interest in MCG’s distinctive potential to bridge experimental cellular electrophysiology and non-invasive clinical assessment of human cardiac electrophysiology. MCG may therefore become a transformative non-invasive tool for characterizing cardiac electrophysiology in clinical settings and potentially improving the prediction of major adverse cardiovascular events (MACE) and sudden cardiac death [36,37,38,39,40].
This perspective [37] has been strengthened by earlier [41] and more recent computational modelling studies of cardiac action potentials and their associated magnetic fields under physiological and pathological conditions. These investigations have employed refined mathematical models validated against experimental optical mapping of isolated, perfused hearts [42,43,44,45]. Further support has come from the recent concept of Magnetoionography [46,47,48], and by the preliminary clinical demonstration that ventricular action potential waveforms can be reconstructed from contactless MCG mapping data [49]. These findings have subsequently been supported by comparisons with simultaneous, contact-based recordings of right ventricular monophasic action potentials (RVMAPs) in patients undergoing interventional EP studies and in experimental animal models [50,51,52].
Despite these advances, preliminary studies have identified misalignment between reconstructed ventricular action potential waveform (rVAPw) and reference RVMAP mapping at certain MCG recording positions, raising concerns about spatial accuracy of the reliable assessment of local ventricular repolarization (VR) dynamics. Specifically, rVAPw aligned well with RVMAP waveforms at approximately 50% of the 36 MCG recording sites, whereas unexplained misalignments were occasionally observed at the onset of phase 0 and/or the termination of phase 3. In addition, previous unsuccessful attempts to reconstruct VAPw during cardiac pacing [51] have hindered the characterization of rVAPw restitution curve. Accordingly, this pilot study aimed to:
- Assess rVAPw reproducibility across all MCG recording positions using newly developed custom software for automated reconstruction, editing and quantification.
- Characterize rate-dependent ventricular repolarization by evaluating changes in rVAPw duration induced by physical exercise and comparing these changes with MCG-derived QT measurements.
- Investigate potential sources of reconstruction error by assessing the extent to which previously reported rVAPw misalignments and waveform alterations may be attributable to environmental or patient-intrinsic noise.
The findings are interpreted in the context of theoretical and experimental evidence concerning the relationship among intracellular currents, cardiac magnetic fields, and transmembrane action potentials [53,54]. We also discuss current limitations of the VAPw reconstruction method and of the spatial resolution and sensitivity of the 36-channel unshielded MCG (UMCG) system [55], together with potential improvements enabled by advances in quantum sensor technology [28,56,57,58,59], AI-assisted MCG denoising [60,61,62,63]. and AI-enhanced computational models of cardiac electrophysiology, from reduced-order surrogates to patient-specific digital twins [64,65,66,67].
2. Materials and Methods
2.1. Study Population
This pilot study was designed to assess the reproducibility of the reconstruction of ventricular action potential waveform (VAPw) from MCG data and to determine whether the reconstructed waveform (rVAPw) exhibits physiologically expected responses to change in heart rate. Accordingly, it was not designed or powered for comparison between homogeneous patient groups. Cases were randomly selected from individuals who underwent MCG mapping between 2004 and 2005, and the quantitative findings are reported as exploratory.
UMCG data were also selected from 20 healthy volunteers from the MCG database. Of these, 15 (11 men and 4 women) underwent two consecutive resting MCG recordings during the same session and were included in the reproducibility analysis of MCG measurements and VAPw reconstruction (Table 1). This analysis aimed to estimate the smallest difference between two recordings that could be considered a true change rather than measurement variability.
UMCG data were also randomly selected from 10 healthy volunteers (50% women) (Table 2) and 10 cardiac patients with various types of cardiac abnormalities (70% women) (Table 3), to evaluate rate-dependent adaptation after effort. All underwent MCG mapping at rest, immediately after exercise (R1) and at seven minutes of recovery (R7). Exercise was performed using a bicycle ergometer according to the standard clinical protocol for fitness or diagnostic evaluation.
Additionally, MCG data from two patients, excluded from the reproducibility and rate-dependent adaptation analyses, were examined to evaluate the effect of substantial environmental noise on magnetic VAPw reconstruction. Their recordings were characterized by exceptionally high noise levels. The inclusion criteria for MCG data were: (1) availability of at least two sequential 90-second UMCG recordings at rest to assess reproducibility; (2) an adequate UMCG signal-to-noise ratio (SNR); and (3) documented informed consent for the examination and the retrospective use of clinical and UMCG data for research purposes. The exclusion criteria were the presence of ferromagnetic artifacts and lack of compliance with the test requirements.
2.2. Exercise Clinical Protocol
Following a 5-minute warm-up, exercise was performed using a clinically approved bicycle ergometer, starting at 25 W and increasing by 25 W every 2 minutes until 80% of the age-predicted maximal heart rate was reached or muscle exhaustion occurred. Immediately after exercise, participants were transferred rapidly to the MCG recording bed. Ninety-second MCG recordings were obtained immediately after exercise (R1) and after 7 minutes of recovery (R7). A 12-lead electrocardiogram (ECG) was recorded continuously from baseline through completion of the procedure.
2.3. Experimental Setup and Measurement Techniques
2.3.1. Unshielded MCG Recording Protocol and Postprocessing
UMCG mapping was performed on an outpatient basis using a 36-channel system (CardioMag Imaging, Inc., Schenectady, NY, USA) at the Catholic University’s unshielded Biomagnetism Center, which is fully equipped for interventional electrophysiology. The z-component of the cardiac magnetic field (Bz) was recorded with 36 direct-current superconducting quantum interference device (DC-SQUID) sensors, each coupled to second-order axial gradiometers (50-mm baseline and 20-mm pick-up coil diameter). The sensors were housed in a cylindrical cryostat and arranged in a square array with a 4 cm center-to-center spacing. Average effective sensitivity ranged from 30 to 50 fT/√Hz across the clinically relevant frequency range (DC–250 Hz), depending on sensor tuning accuracy and environmental noise [68].
Signals were digitally recorded at a sampling frequency of 1kHz with 24-bit analog-to-digital conversion, with subjects in the supine position. Measurement covered a 20×20 cm area of the anterior chest wall. Two consecutive UMCG recordings, typically lasting 90 seconds each, were obtained to assess the effect of recording duration on signal quality and reproducibility [69].
Post-processing of the UMCG signals included digital filtering (using a selective COMB filter to remove 50 Hz power line noise), time averaging (over 90 seconds) to optimize the SNR and reconstruction of time-variant magnetic field dynamics during sinus rhythm at rest and after effort. The reference baseline was automatically defined before the P wave (in sinus rhythm).
The MCG inverse solution was calculated with a temporal resolution of 1 ms using the effective magnetic dipole (EMD) method in a semi-infinite-space model. The current arrow map (CAM), which provides a representation of cardiac current patterns without requiring the solution of a nonlinear inverse problem, was calculated according to Hosaka and Cohen [70]. The resulting maps were automatically displayed on a 3D heart model adapted to the individual patient anatomy. Model fitting incorporated heart and chest measurements derived from two orthogonal fluoroscopic images, cardiac computed tomography (CT), or magnetic resonance imaging (MRI). These images included markers identifying the UMCG sensor’s position (Figure 1).
2.3.2. Method for Reconstruction of the Ventricular action Potential from UMCG Signals
Ventricular action potential waveform were reconstructed from averaged UMCG data using the method described by Kandori et al. [49]. This method is based on the relationship between the ionic currents (inward and outward) of the cell membrane, which occur during the depolarization and repolarization phases, respectively, and generate the waveforms of both the action potential and the ECG.
The computation of the components Ix and Iy of the CAM, which is central to Kandori’s method, represents a particular application of Ampère–Maxwell’s law, which describes the relationship between electric current density and the surrounding magnetic field. In essence, this law establishes a relationship between the current density within an object and the magnetic field generated around it.
Electrical propagation across the cell membrane was modelled using the cardiac conduction model developed by Beeler and Reuter [71], assuming that the MCG waveform reflects the spatial electrical activation of the heart.
At each recording position, the CAM components Ix and Iy were derived by approximating the partial derivatives of the normal magnetic field component (Bz) using the following expressions:
During phase 0 (depolarization), currents were summed from the onset to the end of the QRS complex (ventricular depolarization), starting from zero and reaching the action potential (AP) maximum. This summation reflects the rapid influx of Na+ ions that initiates and propagates the action potential.
During phases 1-3 (repolarization), currents were subtracted from the AP maximum, beginning at the depolarization end (QRSend) and continuing until T-wave termination (Tend), thereby representing the outward flow of K+ ions during ventricular repolarization, and the progressive return toward the resting membrane potential.
The updated software automatically reconstructs and edits the VAPw (rVAPw) and performs quantitative calculations at each MCG recording position, while retaining the option for manual editing when necessary.
2.3.3. Measures
Following reconstruction of the ventricular action potential waveform and correction for any alignment artifacts, the reconstructed waveform (rVAPw) was quantified at each of the 36 MCG recording positions using spatial gradient of the magnetic field. Consistent with experimental APD80, APD50 and APD20 measurements and modelling studies [43,72,73,74], rVAPw durations were measured at three repolarization levels. Specifically, rVAPwX represents the time for which the reconstructed waveform remains above the (100 − X)% level of its height, consistent with the definition of APDX (e.g., rVAPw80 represents the time spent above 20% of the waveform height).
Two variants were analyzed: standard, with amplitude measured from QRS onset, and _pct, with amplitude measured from the baseline preceding QRS onset.
For each recording, the median value of the 36 channels was calculated. Phase 0 duration was quantified using the same three thresholds. Specifically, ph0X denotes the interval from first crossing of the (100 − X)% amplitude threshold during the upstroke to QRS termination (Figure 2).
Kandori’s method [49] relies on the relationship between current density and the surrounding magnetic field, as described by the Ampère- Maxwell law, and between current and voltage, as defined by Ohm’s law. However, reconstructing transmembrane action potential waveform from MCG data presents inherent challenges. The action potential is a localized event at the cardiomyocyte level, whereas MCG reflects spatially integrated current-density distributions generated by an indeterminate volume of underlying myocardium and influenced by the three-dimensional orientation of myocardial fibers.
Consequently, reconstructed waveforms may provide only an indirect approximation of the transmembrane action potential [51]. More realistic models of myocardial structure and function are therefore needed, incorporating, at a minimum, the physiological anisotropy of myocardial fiber architecture and electrical conduction.
2.3.4. Statistical Methods
The subject was the unit of inference, and the 36-channel signals of each recording were summarized by their median. Durations are reported as median [interquartile range].
Changes from rest were assessed using the exact Wilcoxon signed-rank test. For tied differences, p-values were calculated from the exact distribution without ties; using the exact permutation distribution of the tied ranks did not alter the significance classification. Cohorts were compared using the Mann–Whitney test. Effect sizes are reported as Hodges–Lehmann estimates with exact 95% confidence intervals [75]. P-values were adjusted using the Holm procedure within each variable [76].
Rate adaptation was assessed using the within-subject slope of duration versus RR interval, estimated by least squares after removing subject-specific means. For reconstructed durations, slopes were calculated separately for each channel and then summarized by the median across channels. The corresponding 95% confidence intervals were obtained using the leave-one-subject-out jackknife [77]. Per-subject slopes and repeated-measures correlations [78,79] are also reported.
Global time scaling was assessed by comparing the elasticity of phase 0 duration with that of rVAPw80, defined as the slope multiplied by the mean RR interval and divided by the mean duration.
Post-exercise hysteresis was defined as the difference between R1 and R7 after correction for the residual difference in RR interval using the cohort-specific slope. This difference was evaluated across all subjects using the exact sign test.
Test–retest reproducibility was assessed using the standard error of measurement (SEM), the 95% minimal detectable change (MDC95) [80] and the intraclass correlation coefficient, ICC(A,1) [81] together with Bland–Altman analysis [82]. The corresponding definitions are provided in Table 4.
Measurement error was decomposed into a component common to all channels and specific to individual channels. Border and inner channels were compared using the sign test. Dependence on fiducial points was assessed using within-subject regression of the test–retest differences of the channel values on those of QRS onset, QRS end, and T-wave end, with bootstrap confidence intervals calculated across subjects. When both variables were subject to measurement error, the slopes were bounded using the direct and inverse regressions (Frisch bounds). Correlations were assessed using Pearson’s correlation coefficient, with permutation-based p-values. A two-sided p-value of less than 0.05 was considered statistically significant. All analyses were performed in Python using NumPy and SciPy; the analysis code was written with the assistance of Claude Opus 5.5 (Anthropic), as declared in the Acknowledgments.
3. Results
3.1. Study Population and Data Processing
Overall, 90 MCG recordings were retrospectively analyzed: 30 to assess reproducibility of VAPw reconstruction and 60 to evaluate rate-dependent changes in ventricular repolarization induced by physical exercise.
Demographic characteristics are summarized in Table 1, Table 2 and Table 3. The randomly selected sample covered a broad age range. Fifteen healthy volunteers (11 men, 4 women; median age, 50 years; ; 95% CI, 30–60; range, 14–74 years) were included in the reproducibility analysis (Table 1). Each underwent two resting MCG recordings separated by a few minutes, without intervening intervention. Heart rate during the first recording was 65 bpm (range, 58–87 bpm). The median absolute difference in RR interval between recordings was 32 ms (range, 0–118 ms). Six of them were also studied during an exercise test in a different session.
Baseline misalignment artifacts occurring before or after the rVAPw, indicated by dotted circles in Figure 2A and Figure 3A, were effectively corrected using a detrending function. This enabled reproducible quantification of rVAPw duration at the 20%, 50%, and 80% repolarization levels across all MCG recording positions (Figure 2 and Figure 3).
Conventional intervals (QT, QRS, T wave, QRS on–Tpeak and Tpeak-Tend; QRSon–Tpeak was computed from the absolute times) were manually measured using a separate program displaying superimposed waveforms from all 36 averaged MCG channels and one ECG lead (lead II) in a butterfly plot.
3.2. Objective 1: Assess the rVAPw Reproducibility Across All MCG Recording Positions, Using a Novel Software for Automatic Reconstruction, and Editing
The standard rVAPw80 showed high test-retest reproducibility, with a SEM of 3.4 ms (95% CI, 2.5–5.3), a minimal detectable change at the 95% confidence level (MDC95) of 9.3 ms, and an ICC of 0.97 (Table 4). The mean difference between recordings was −0.9 ms, with limits of agreement from −10.2 to 8.5 ms (Figure 4). The _pct variant yielded comparable results (SEM 3.3 ms, MDC95 9.2 ms, ICC 0.98).
The rVAPw50 was similarly reproducible (SEM 3.3 ms, ICC 0.97), whereas rVAPw20 showed somewhat lower reproducibility (SEM 5.2 ms, ICC 0.93). Thus, a change in standard rVAPw80, exceeding approximately 9 ms between two recordings from the same subject is unlikely to reflect measurement variability alone at the 95% confidence level.
The reconstructed phase 0 was also reproducible: ph020, ph050 and ph080 had SEM 1.0, 2.1 and 2.4 ms, respectively, and ICC 0.95, 0.88 and 0.91, respectively.
Manual QT measurement yielded an SEM of 10.1 ms, an MDC95 of 27.9 ms, and an ICC of 0.78. Accordingly, rVAPw80 was approximately three times more reproducible than manually measured QT in the same subjects.
Among the manually measured intervals, QRSon–Tpeak was the most reproducible (SEM, 5.6 ms; MDC95, 15.4 ms; ICC, 0.94), followed by QRS duration (ICC, 0.88) and QT (ICC, 0.78). Tpeak-Tend had a low ICC of 0.23 (95% CI, −0.29 to 0.65) despite a relatively small SEM (3.6 ms). The corresponding between-subject standard deviation was approximately 2 ms, smaller than the measurement error itself (SEM, 3.6 ms), indicating limited ability to discriminate between individuals in this sample.
Regarding potential sources of error, for standard rVAPw80, the estimated measurement-error component common to all channels was 3.2 ms (95% CI, 1.8–4.0), whereas the channel-specific component was 1.4 ms (95% CI, 1.0–1.8). Corresponding values for _pct variant were 3.3 and 1.0 ms, respectively. The channel-specific component was consistent with the value of 1.42 ms estimated indirectly in Objective 2. This value characterizes differences between channels within the same recording, rather than the error associated with repeated recordings. Border channels were less reproducible than inner channels (1.49 vs. 1.07 ms, p = 0.007).
The standard rVAPw80 was significantly dependent on QRS onset, with a slope of −0.71 ms per millisecond and a negative association in 14 of 15 subjects. The _pct variant showed substantially less dependence on QRS onset (slope, −0.12; 95% CI, −0.20 to 0.04), but moderate dependence on T-wave end definition (slope, 0.24; 95% CI, 0.10–0.35).
Changes in rVAPw80 between recordings was strongly correlated with the change in per-channel QT, defined as the interval between the QRS onset and the T-wave end at the fiducial points used for reconstruction and summarized by the median across the 36 channels (r = 0.85). The Frisch bounds for the true slope ranged from 0.78 to 1.08. The _pct variant showed similar results (r = 0.84; Frisch bounds, 0.76–1.08) (Figure 5).
Because both changes contain measurement error, the regression of y on x is biased toward zero and the inverse regression of x on y away from zero; the true slope lies between the two (Frisch bounds, 0.78–1.08).
Figure 5 illustrates the expected change attributable solely to shift in QRS onset and T-wave end, with the underlying signal unchanged. This range is represented by the grey band. The observed slopes lay above this band and close to the identity line, suggesting that test–retest differences in rVAPw80 predominantly reflected changes in the recorded signal rather than displacement of the fiducial markers.
3.3. Objective 2: Quantification of the Accuracy of the VAPw Reconstruction in Estimating the Ventricular Repolarization Dynamics
MCG data of twenty subjects were used for VAPw reconstruction at baseline rest and at R1 and R7 after exercise: 10 healthy volunteers (5 men and 5 women; median age, 50 years; 95% CI, 37–60; range, 14–69 years) and 10 patients (3 men and 7 women; median age, 51.5 years; 95% CI, 49–68; range, 43–72 years).
Because MCG recordings were obtained in an electromagnetically noisy, unshielded laboratory used for interventional electrophysiology, 90-second signal averaging was required to achieve an adequate signal-to-noise ratio. This precluded beat-to-beat VAPw reconstruction and assessment of the magnetic action potential restitution curve using conventional pacing protocols, which were incompatible with the non-invasive study design.
Rate-dependent adaptation was therefore evaluated by comparing rVAPw duration at rest, immediately after exercise (R1) and after seven minutes of recovery (R7), at the 20%, 50%, and 80% repolarization levels.
Figure 6 illustrates automatic VAPw reconstruction at rest, R1, and R7. Individual rate-dependent changes at all three repolarization levels are shown in the enlarged MCG recording and in the reconstructed waveform at position D4.
The rate-dependent adaptation of ventricular repolarization takes place entirely before the T-wave peak.
Two intervals were measured from the superimposed 36-channel MCG waveforms, independently of the reconstruction: the QRS onset- Tpeak, and the Tpeak-Tend.
QRSonset–Tpeak shortened with decreasing RR interval (0.16 ms/ms in healthy subjects, and 0.19 in cardiac patients; within-subject r 0.88 and 0.84), whereas the Tpeak–Tend showed no significant rate dependence, with slopes of 0.00 and −0.01 ms/ms, and correlations r = 0.11 and r = −0.14, respectively. Neither interval differed between cohorts.
These findings indicate that rate-dependent shortening of the measured repolarization intervals occurred predominantly before the T-wave peak, whereas the second half of the T-wave (Tpeak-Tend) remained comparatively rate-invariant. This pattern is consistent with shortening of the action-potential plateau (Table 5).
Reconstructed VAPw duration also showed a consistent relationship with heart rate (Table 5). In both cohorts, rVAPw50 and rVAPw80 shortened from rest to early recovery (10/10 per cohort; unadjusted p = 0.002, the smallest attainable two-sided p-value with 10 paired observations; Figure 6).
At rest, median rVAPw80, manually measured QT, and QRS duration did not differ significantly between healthy subjects and patients. Immediately after exercise, both rVAPw80 and QT shortened significantly in both cohorts, and shortening persisted at R7. At matched heart rate, both intervals were shorter at R1 than at R7, indicating hysteresis in rate-dependent adaptation.
In healthy subjects, reconstructed phase 0 duration showed little dependence on cycle length, consistent with its distinct electrophysiological basis (sodium-channel kinetics). The elasticities of ph020, ph050 and ph080, were 0.10, −0.17 and −0.13, respectively, with 95% CI excluding the elasticity of 0.42 observed for rVAPw80. These findings support a predominantly repolarization-specific origin of the rate dependence observed in rVAPw80. In patients, the results were less conclusive, consistent with the heterogeneity of cohort, which included individuals with and without conduction abnormalities.
The within-subject slope of rVAPw duration against RR interval quantifies rate adaptation as the change in duration per millisecond change in cycle length. The within-subject correlation indicated the consistency of this relationship. For rVAPw80, the slope was 0.145 ms/ms (95% CI, 0.113, 0.177) in healthy subjects, with a median individual slope of 0.166 ms/ms. This corresponds to approximately 15 ms of shortening for every 100 ms reduction in RR interval, or approximately 50 ms for an increase in heart rate from 60 to 90 bpm. The slope was 0.299 ms/ms in patients. Within-subject correlations were 0.89 and 0.91 in healthy subjects and patients, respectively (Table 6 and Figure 7).
Each reconstructed repolarization level represents the time required to reach a specified fraction of the cumulative repolarization pseudocurrent between QRS termination and T-wave end. In healthy subjects, the median individual slopes were similar across rVAPw20, rVAPw50, and rVAPw80: 0.16, 0.15, and 0.17 ms/ms, respectively. This nearly uniform shortening suggests that the reconstructed repolarization waveform shifted earlier as a whole, consistent with shortening of the plateau (phase 2) and relatively little change in the shape of phase 3 repolarization (Figure 6).
The manually measured intervals showed the same pattern: QRSon-Tpeak shortened with a slope of 0.16 ms/ms, whereas Tpeak–Tend remained unchanged (0.00 ms/ms). The rVAPw80 slope of 0.145 ms/ms of the same order as the slope for manually measured QT (0.19 ms/ms), supporting the physiological relevance of the reconstructed waveform’s rate-dependent adaptation.
3.4. Objective 3: Evaluation of Environmental and Patient-Intrinsic Noise as Potential Source of rVAPw Misalignments and Distortion
In one patient, who was not included in the patient cohort, MCG mapping was performed under conditions of high environmental noise, primarily due to 50-Hz power-line interference and its harmonics. The interference may have been induced by a radiological instrument switched on in another room near the biomagnetism laboratory and was too strong to be effectively cancelled by the adaptive COMB filter. In this case, a 50-Hz low-pass (LP) filter was required to restore the effectiveness of the COMB filter and improve the signal-to-noise ratio (SNR) before VAPw reconstruction.
To assess the extent to which such high levels of environmental noise could affect VAPw reconstruction, we compared the rVAPw reconstructed from the unfiltered MCG signals with that reconstructed after effective 50-Hz LP and COMB filtering. Despite the high noise level, the reconstructed waveforms and their duration estimates were nearly identical (Figure 8).
Specifically, the rVAPw reconstructed from the low-SNR signals (green in Figure 8A) was almost identical to that obtained after 50-Hz LP and COMB filtering. However, an apparent prolongation of rVAPw duration between the 80% and 100% repolarization levels was observed in the reconstruction from the unfiltered MCG data (green star in Figure 8C). This discrepancy resulted from incorrect automatic detection of the T-wave offset in the unfiltered MCG signal (green vertical dashed line). After manual correction of this error (green arrows), the rVAPw waveforms reconstructed from the filtered (red in Figure 8B) and noisy MCG data were perfectly aligned. Importantly, this error did not significantly affect the quantitative estimates of rVAPw duration at the 20%, 50%, and 80% repolarization levels.
Based on this observation, reconstruction was also attempted using averaged, unfiltered MCG signals from a second patient who was not included in the main cohort (Figure 9A). Despite substantial residual 50-Hz interference, the reconstructed waveforms at rest, R1, and R7 were visually free of appreciable noise. Their durations could be quantified at all three repolarization levels, revealing a pattern consistent with rate-dependent adaptation (Figure 9B). Differences in rVAPw20 estimates were minimal compared with reconstruction using signals averaged after adaptive COMB filtering (Figure 9C).
Taken together, these two illustrative cases suggest that VAPw reconstruction from MCG signals recorded over a DC-250-Hz bandwidth may be relatively robust to substantial environmental 50-Hz interference. Conversely, low-frequency, patient-intrinsic noise, including respiratory fluctuations or signals arising from ingested ferromagnetic contaminants, may introduce greater distortion (Figure 2), particularly when the patient’s chest has not been demagnetized before recording. These observations remain preliminary and require systematic validation in larger datasets.
4. Discussion
Catheter-based invasive electrophysiological assessment and 3D electroanatomical mapping have significantly improved the clinical ability to investigate arrhythmogenic mechanisms and localize arrhythmogenic substrates amenable to interventional treatment [2,3]. However, reliable non-invasive electroanatomical imaging is also essential for identifying these mechanisms and substrates, potentially avoiding unnecessary invasive diagnostic procedures, reducing the risk of interventional failure, and monitoring the efficacy of antiarrhythmic drugs and the cardiotoxic effects of other pharmacological treatments, including oncology therapies.
Given the greater computational simplicity of the magnetocardiographic inverse solution for 3D localization of intracardiac sources compared with approaches based on BSPM [14,83], the integration of MCG with MRI was proposed as early as the 1990s for non-invasive, radiation-free 3D electroanatomical imaging and localization of cardiac sources and arrhythmogenic substrates [10,84,85]. Although non-invasive 3D electroanatomical imaging is now also possible using electrocardiographic imaging (ECGi) [20], theoretical and experimental evidence that biomagnetic measurements can detect electrically-silent electrophysiological events [86,87,88,89,90,91,92,93], the emerging concept of Magnetoionography [46,47,48], and the clinical demonstration that ventricular action potential waveforms can be reconstructed from contactless MCG mapping data [49], have renewed interest in MCG mapping as a potentially distinctive method for the non-invasive clinical investigation of cardiac electrophysiology [94,95,96].
The findings of this pilot study support the feasibility of magnetic reconstruction of the VAPw and contribute to the broader vision of MCG as a potentially valuable tool for multipurpose clinical assessment of cardiac electrophysiology [37], including the diagnostic evaluation of ischemic and non-ischemic cardiomyopathies.
First (Objective 1), we demonstrated the reliability of the proprietary, custom-developed software for rapid, automated VAPw reconstruction. The software also facilitates the correction of baseline misalignment artifacts and distortions in the rVAPw, improving the reliability of automated quantitative assessment of repolarization dynamics (Figure 2 and Figure 3).
Second (Objective 1), test–retest assessment at rest demonstrated high reproducibility of the standard rVAPw80 measurement (SEM, 3.4 ms; MDC95, 9.3 ms; ICC, 0.97). Based on the minimal detectable change, rVAPw80 was approximately three times more reproducible than conventional QT interval measurements obtained from averaged MCG signals. The rVAPw80 and rVAPw50 measurements showed comparable reproducibility, whereas rVAPw20, although usable in the dataset examined, was the least reproducible, potentially because it was more sensitive to the placement of the QRS offset.
Third (Objective 2), building on a previous preliminary experimental finding [52], we used a fully non-invasive exercise protocol to investigate heart-rate-dependent adaptation of the magnetically reconstructed VAPw. Comparison of rVAPw measurements obtained before and after exercise demonstrated the feasibility of assessing rate-dependent repolarization adaptation without cardiac pacing (Figure 6). This finding supports the potential of MCG for repeated, non-invasive monitoring of the electrophysiological effects of cardioactive drugs, including potential cardiotoxic effects and drug-induced QT prolongation.
Fourth, in both study cohorts, exercise-associated shortening of the reconstructed rVAPw appeared to occur predominantly during the plateau phase of repolarization. In healthy subjects, the median within-subject slopes were similar across rVAPw20, rVAPw50, and rVAPw80 (0.16, 0.15, and 0.17 ms/ms, respectively). Because each rVAPw level represents a quantile of the pseudocurrent accumulated between the end of the QRS complex and the end of the T wave, similar slopes across these levels suggest that the overall distribution of T-wave pseudocurrent shifts earlier in time as the RR interval shortens. This pattern is consistent with shortening of the plateau preceding terminal repolarization, while the duration of phase 3 remains comparatively stable.
MCG does not directly measure transmembrane currents; therefore, the observed rate-dependent shortening of the magnetic rVAPw cannot be attributed to specific ionic current dynamics on the basis of these data alone. Nevertheless, the findings are compatible with established mechanism of rate-dependent action potential adaptation. Experimental electrophysiology has shown that plateau duration depends on the balance between the inward L-type calcium current (ICaL) and the outward delayed-rectifier currents (IKr, IKs). At short diastolic intervals, ICaL recovers incompletely from voltage- and calcium-dependent inactivation, reducing the inward current that sustains the plateau. Meanwhile, incomplete deactivation of IKs between beats increases its contribution at higher rates [97]. On a longer time scale, rate-related increases in intracellular sodium can enhance the outward current generated by the Na+/K+pump during the plateau [98]. These mechanisms primarily affect the plateau, whereas phase 3 repolarization, shaped mainly by IKr and IK1, is comparatively less rate-sensitive [99]. Clinical recordings of monophasic action potentials have likewise demonstrated rate-dependent adaptation of action potential duration, including both fast and slow components [100]. Thus, magnetic reconstruction may provide a non-invasive means of characterizing repolarization patterns compatible with these established mechanisms, although direct mechanistic inference requires further validation.
Fifth (Objective 3), the incidental observation that environmental 50-Hz power-line interference did not substantially compromise the reconstructed rVAPw in two cases provides preliminary insight into noise sources that might affect this analytical procedure and how they might be managed (Figure 8 and Figure 9). This observation is exploratory and requires confirmation in a targeted study involving a larger number of recordings and systematic characterization of noise conditions.
Importantly, phase 0 of the magnetically reconstructed rVAPw does not represent the upstroke of a single cardiomyocyte action potential. Rather, it reflects the progression of 3D electrical activation throughout the myocardium during the QRS complex, as detected by each sensor. The phase 0 measurements ph020, ph050, and ph080, quantify the time for which the reconstructed upstroke remains above the 80%, 50%, and 20% amplitude thresholds, respectively, before QRS offset. These durations are influenced by the cardiac activation sequence and the conduction velocities of different myocardial fibers. Accordingly, as with monophasic action potential (MAP) recording, phase 0 of the rVAPw should be interpreted as an index of activation timing rather than as a duration of a local cellular action potential upstroke [6]. In this study, phase 0 duration was quantified to determine whether it varied with heart rate. In healthy subjects, phase 0 duration showed little dependence on cycle length, with median within-subject slopes from −0.008 to 0.004 ms/ms. This finding was consistent with the near-zero rate dependence of manually measured QRS duration (slopes of 0.000 and 0.003 ms/ms). Together, these results support the interpretation that the observed rate-dependent shortening of rVAPw duration primarily reflects repolarization-related changes rather than changes in the duration of ventricular activation.
This finding is also consistent with the kinetics of the fast sodium current. Recovery of INa from inactivation at resting membrane potential is rapid relative to the diastolic intervals encountered in this study. Sodium-channel availability, and therefore conduction velocity, would consequently be expected to recover substantially at the heart rates observed. Rate-dependent conduction slowing generally becomes more apparent at much shorter coupling intervals, during sodium-channel blockade, or in diseased myocardium with altered anisotropic conduction [101]. The different slopes observed in patients (0.006–0.009 ms/ms; pooled ph020 slope, 0.015 ms/ms [95% CI, 0.001–0.029]) may represent incidental findings associated with the small, heterogeneous sample, which also included patients with conduction and structural heart disease.
Regarding the rate dependence of ventricular repolarization, as expected, repolarization was shorter at R1 (early recovery) than at R7 (later recovery) when heart rates were matched. This effect was observed in manually measured QT intervals (−7 ms in 9 of 10 patients and −10 ms in healthy subjects, shorter in 7 of 10 and unchanged in 1) and was even more consistent in rVAPw80 measurements, which showed the effect in 9 of 10 patients and all 10 healthy subjects. Based on the MDC95, rVAPw80 was approximately three times more reproducible than the QT measurements (Table 4).
We also observed post-exercise hysteresis in the rate-dependent recovery of ventricular repolarization. In healthy subjects, the estimated hysteresis was −10 ms for the global QT interval and −19 to −22 ms for the local measures (per-channel QT and rVAPw80). Exercise-induced QT/RR hysteresis is well established and includes a slow component of adaptation that may persist for several minutes [100,102,103,104]. During early recovery, persistent β-adrenergic stimulation may enhance IKs [105], while vagal reactivation reduces heart rate, resulting in shorter repolarization than would be predicted from the instantaneous heart rate alone. The direction of the observed post-exercise hysteresis is physiologically plausible and was consistent across measures and cohorts in this study. However, its magnitude remains uncertain because the R1 measurement was delayed relative to peak exercise and averaged signals over 90 seconds.
4.1. Limitations
Although the primary objectives of this pilot study were fulfilled, at this stage several limitations remain and warrant further technological and methodological improvements before prospective experimental and clinical applications can be pursued.
First, the need for signal averaging to improve the SNR of UMCG recordings precluded beat-to-beat VAPw reconstruction and evaluation of the restitution curve in the presence of spontaneous or pacing-induced transient changes in cycle length. Developing a method for reconstructing the VAPw on a beat-to-beat basis is therefore an essential next step.
Second, deriving phase 0 of the rVAPw from the QRS duration and using the pseudo-current maps calculated according to Hosaka [49,70,106] entails spatial integration signals from geometrically separated sources associated with different types of myocardial fibers orientation. This limits the ability to characterize the true depolarization phase of localized, tissue-specific action potentials. Improving spatial accuracy and approaching quasi-cellular resolution will require more realistic whole-heart models incorporating myocardial anatomy and fiber-specific electrophysiology. Although such models have been developed for ECG-based reconstruction, their substantial computational requirements, including the use of high-performance computing resources, remain a barrier to routine clinical MCG applications [63,107].
An alternative approach based on depth-weighted minimum-norm estimation (MNE) was implemented to reconstruct the 3D primary current density (PCD) and evaluate its potential to improve the spatial accuracy of VAPw reconstruction. This approach used a high-fidelity computational model of left ventricular (LV) tissue incorporating fiber-orientation-dependent anisotropic myocardial conductivity. A 3D multidomain mesh comprising an ellipsoidal left ventricle, an intraventricular blood pool, and the surrounding torso was generated and scaled to the proprietary CardioMag three-dimensional elastic model of the torso and heart, which can be adjusted to individual body size. Reconstruction from the MNE-derived PCD of unshielded MCG provides discrete, node-specific localization at an approximately 2 mm tetrahedral resolution. However, a single planar magnetometer arrays has a geometric blind spot for currents oriented orthogonally to the sensors, whose magnetic fields remain parallel to the detection plane [108]. A recent study combining numerical simulations, phantom measurements, and in vivo experiments compared a cylindrical sensor array with a conventional planar array [109]. MNE-based distributed-source analysis revealed geometry-dependent reconstruction patterns, with the cylindrical array providing complementary spatial information relative to anterior planar mapping, particularly for deeper or posterior cardiac sources. These findings highlight that MCG spatial resolution depends not only on the inverse solution method but also on sensor type, number, geometry, arrangement, sensitivity, and noise level..
Third, the sample was small (31 participants), and the cohorts were heterogeneous and not age matched. The study nevertheless provided preliminary evidence of the feasibility and reproducibility of improved VAPw reconstruction from MCG data in both healthy subjects and patients with different cardiac presentations. Larger, prospectively designed studies are needed to establish specific clinical indications and determine whether the method may add value to existing diagnostic approaches. The quantitative difference in rate-dependent rVAPw adaptation between healthy subjects and patients (rVAPw80 slope, patients − healthy: +0.093 ms/ms [0.020–0.198]; nominal p = 0.01, p = 0.13 after Holm correction), should be regarded as evidence supporting the accuracy of VAPw reconstruction and as a basis for further investigation, rather than evidence of established clinical significance.
Fourth, the MCG measurement at R1 did not capture the maximum heart rate achieved at peak exercise. Instead, it quantified effort-induced rate adaptation over a 90-second averaging window starting about 1 minute after exercise cessation (from about 1 to 2.5 minutes. Therefore, the R1 measurement captures only part of the time course of effort-related repolarization adaptation. Consequently, although the direction of post-exercise hysteresis was consistent across measures and cohorts [(in healthy subjects, the hysteresis was −10 ms for global QT and −19 to −22 ms for the local measures (per-channel QT and rVAPw80)], its magnitude remains indicative and has not been established. Technological improvements enabling beat-to-beat analysis of MCG dynamics are needed to improve the physiological understanding of this finding.
Fifth, VAPw reconstruction was based exclusively on unshielded MCG recordings. Channel-specific SNR differences may therefore have affected reconstruction accuracy, particularly at the periphery of the sensor grid, where SNR is lower. Comparison with recordings from the same subjects obtained in a high-performance magnetically shielded room (MSR) would have provided a useful reference, but such a facility was unavailable at our institution. Nevertheless, two illustrative high-noise cases suggested that reconstruction was not substantially affected by environmental 50-Hz interference, although one case required correction of the automatically identified T-wave offset (Figure 8 and Figure 9). These observations should be interpreted cautiously because two cases were examined. The present study primarily assessed the physiological consistency of the non-invasively reconstructed magnetic rVAPw, following previous validation based on alignment with simultaneously recorded right ventricular monophasic action potentials [51].
Sixth, magnetocardiography does not directly measure transmembrane currents. The ionic mechanisms discussed above are compatible with the observed patterns but cannot be established from the present measurements alone.
Finally, rVAPw20 is measured near the relatively flat plateau of the reconstructed waveform, where a small amplitude error can produce a substantial shift in the threshold-crossing. Its channel-specific error was about 10 ms in the main cohorts (6.0 ms in the test–retest recordings), against 1.4 ms for rVAPw80; the test–retest SEM of the recording value (median of the 36 channels) is 5.2 ms, against 3.4 ms (Table 4). Accordingly, rVAPw20 was the least precise parameter, and the pooled and per-subject slope estimates were inconsistent in a few healthy subjects.
5. Prospects for the Clinical Translation of MCG
5.1. Progress in Sensor Technology
Advances in sensor technology and data-driven diagnostic methods may help bring MCG closer to broader clinical adoption as a non-contact, radiation-free, and contrast-agent-free cardiac diagnostic modality. Current development efforts focus on cost-effective, intelligent MCG systems suitable for bedside use and unshielded point-of-care applications [110,111]. Integrating sensor advances with AI-assisted signal denoising and detailed cardiac electrophysiological modelling will be important for developing next generation MCG systems that support multipurpose cardiac imaging and suitable clinical deployment at sustainable cost [29,37].
Although SQUID-based MCG remains a benchmark for sensitivity in both shielded and unshielded environments, spin-exchange relaxation-free (SERF) magnetometers have achieved sensitivities in the few-femtotesla range, with potential for bandwidths exceeding 100 Hz [58,112,113]. Recent publications have further supported the diagnostic performance of clinical systems evaluated for regulatory approval [32,114,115]. In addition, AI-assisted denoising has improved the diagnostic accuracy of OPM-based MCG [33].
Regarding spatial resolution, high-density sensor-array measurements have been reconstructed from low-density OPM-MCG configurations using spatiotemporal overlapping block-sparse Bayesian learning and ultrasensitive cardiac source imaging [114,115]. OPM sensors have also enabled vector magnetocardiography [116,117]. Furthermore, OPM sensors have facilitated vector magnetocardiography [118,119,120] and 3D visualization of MCG signals using CW_FastICA and transfer-function mapping, providing approaches to electroanatomical imaging and the localization of arrhythmogenic substrates [116,121,122]. Promising results have also been reported for novel unshielded MCG mapping systems based on non-cryogenic magnetoresistive sensors [28] and miniature induction coils [38].
Nevertheless, achieving millimetre-scale spatial accuracy for high-resolution VAPw reconstruction to be used in clinical practice remains an important objective. Progress will require miniaturized, room-temperature technologies capable of providing full vector information in unshielded environments. Solid-state NV- centre in diamond represent one potential route toward this goal.
Although the first reported human NV-diamond MCG measurements [56] remains well below current clinical standards [29,123], NV magnetometers offer several potential advantages over OPM-MCG. Their smaller sensing volume facilitates gradiometric [124] and single-sensor vector MCG measurements [125,126], while their wider recording bandwidth and comparatively high-volume sensitivity may offer additional benefits [127]. Their lower sensitivity could potentially be offset by reducing the sensor-to-sample distance [128] and combining multiple SNR-enhancement techniques, with the aim of enabling measurements in electromagnetically noisy environments [124,129,130,131,132,133].
Machine learning-assisted MCG processing was explored for the automatic identification of ischemic heart disease approximately two decades ago [134,135,136]. More recently, specialized machine learning methods have been developed for MCG signal denoising [137,138,139,140]. These advances motivate the hypothesis that AI-assisted denoising of vector-gradiometric NV-diamond sensor arrays could improve their SNR and facilitate the development of cardiac mapping technologies with millimetre-scale spatial resolution and sufficient depth sensitivity for 3D imaging of electrophysiological events throughout the heart, including in unshielded clinical environments [117,141,142,143,144]. However, these capabilities remain prospective and require experimental demonstration.
In the longer term, miniaturized solid-state NV-diamond sensors may also support the development of contactless shock-resistant, wearable devices for multiparametric, real-time cardiac and stress monitoring in demanding operational environments, including military, law-enforcement, space missions, and sport applications.
5.2. Potential Applications of Artificial Intelligence
In addition to advances in sensor technology, artificial intelligence (AI) may facilitate the clinical translation of the reconstructed VAPw method at three levels: automatic detection of fiducial points, denoising of single-beat recordings, and integration of the reconstruction with computational models of cardiac electrophysiology.
As discussed previously, fiducial-point detection plays a key role in reconstructing electrophysiological information from MCG, since rVAPw durations depend directly on the placement of the QRS offset and T-wave end [49,51,52]. Accordingly, all fiducial points in the present study were verified manually. Conventional rule-based algorithms, often based on wavelet transforms [145], are interpretable and do not require training data, but depend on manually tuned thresholds. Although they can perform well on clean, typical waveforms, their reliability decreases in precisely those regions where reconstruction is most sensitive, including the terminal portion of low-amplitude T waves and fragmented QRS complexes. Manual corrections in the cases is time-consuming, operator-dependent, and difficult to scale for routine clinical use. In electrocardiography, deep-learning-based delineation methods have achieved F1 scores above 99% for QRS-complex and T-wave detection relative to expert annotations, including in recordings encompassing a wide range of arrhythmias [146].
Although annotated MCG databases are not yet available, networks pretrained on ECG data could potentially be adapted to MCG using a comparatively small set of expert-annotated recordings. Such methods could also provide a confidence estimate for each detected fiducial point, as demonstrated in seismic signal analysis [147]. Manual review could then be focused on recordings with uncertain detections, potentially supporting future ambulatory applications.
Currently, rVAPw reconstruction relies on signals averaged over 90 seconds. This approach assumes that successive beats are sufficiently similar to be combined. During post-exercise recovery, however, heart rate can change within the averaging window, meaning that the resulting waveform combines beats recorded at different cycle lengths. Averaging also obscures beat-to-beat variability, ectopic beats, and the dynamics of rate adaptation. Reconstruction from individual beats will therefore require effective noise suppression without reliance on long-duration averaging.
AI-assisted denoising is one promising candidate, having already been applied to MCG [148] and ECG [149]. Training a denoising network usually requires noise-free reference signals, which are unavailable for MCG. However, under stationary recording conditions, a network can be trained to predict the average of one subset of beats from the average of another subset, since both contain the same underlying cardiac signal but different noise realizations [150]. Validation must establish that denoising preserves low-amplitude components, particularly the terminal T wave, without introducing artificial morphological features. If successful, this approach could also reduce the acquisition time required by room-temperature sensors, which currently rely on averaging across multiple beats [151,152].
Finally, the magnetic rVAPw is a phenomenological reconstruction that is not constrained by the laws of cardiac electrophysiology [49]. A complementary approach would be to fit a computational model of the patient’s heart [64] to the recorded signals and derive regional action potentials, conduction velocities, and activation sequences from the fitted model, as part of the emerging concept of the cardiac “digital twin” [65,66].
Computational cost remains a major obstacle: a single full simulation may require hours on a high-performance computer, and model fitting requires many simulations. Reduced-order models and machine-learning surrogates trained on a limited set of full simulations, can reproduce model outputs at substantially lower computational cost [151 and have already made whole-heart simulations feasible on a single processor [67]. Applied to MCG, these methods could provide a cost-effective means of reconstructing regional action potentials and investigating repolarization, its dispersion, and its rate adaptation. However, the reliability of model-based reconstruction depends on the validity of the underlying model. Validation against invasively recorded action potentials, as in previous studies [49,51,52], would therefore remain indispensable.
Across all three applications, AI tools should be validated in patient cohorts independent of those used for training and should report the uncertainty of their outputs. This would allow their reliability to be assessed in relation to the specific clinical parameters they are intended to support.
6. Conclusions
This study provides further evidence of the feasibility and reproducibility of reconstructing ventricular action potential waveform from unshielded magnetocardiographic recordings to assess rate-dependent adaptation of human ventricular repolarization non-invasively. To the best of our knowledge, our approach offers for the first time a potential means of characterizing ventricular electrophysiology beyond conventional ECG and MCG waveform measurements, with the prospect of approximating information obtained from invasive monophasic action potential recordings.
The UMCG data analyzed were acquired using multichannel SQUID-based instrumentation in clinical catheterization laboratory, enabling MCG mapping alongside catheter-based electrophysiological investigation and intervention. This setting has supported validation of the accuracy of 3D MCG localization and imaging of cardiac sources and arrhythmogenic substrates [11,153,154].
The present findings demonstrate reproducible VAPw reconstruction across the MCG recording surface and support the application to assessing exercise-induced, rate-dependent changes in ventricular repolarization.
However, the current method requires averaging at least 90 seconds of MCG signals, limiting its ability to capture transient beat-to-beat phenomena. Further development is therefore needed to enable beat-to-beat detection of VAPw alternans and improve the spatial specificity of reconstruction through magnetic inverse modelling of impressed current density in anatomically localized myocardial fiber populations, accounting for physiological structural and electrical anisotropy.
Although these goals remain challenging, interdisciplinary advances integrating quantum-sensor technology and computational intelligence may help overcome current limitations. AI-assisted real-time signal denoising and pattern recognition, combined with more detailed modelling of cardiac magnetic fields generated by cellular electrophysiological processes, could improve reconstruction accuracy and temporal and spatial resolution.
Among emerging quantum-sensing technologies, millimetre-scale sensing capability of NV-diamond sensors offer a promising avenue for developing portable vector MCG systems with high 3D spatial sensitivity. Such systems could ultimately advance bedside, non-invasive cardiac electrophysiology toward quasi-cellular finer spatial resolution and more detailed characterization of arrhythmogenic mechanisms at the patient’s bedside [155]. Moreover, miniaturized solid-state NV-diamond sensors may be also candidates for the development of novel contactless wearable devices for multiparametric, real-time cardiac and stress monitoring in demanding operational environments, including military, law-enforcement, space missions, and sport applications.
Author Contributions
Contributions: Conceptualization, R.F. and D.B.; methodology, all authors; software, M.P.; validation, R.F., D.B., and M.P.; formal analysis, R.F.; statistical analysis M.P.; investigation (literature evaluation), all authors; resources, R.F.; data curation, R.F.; writing—original draft preparation, RF.; writing—review and editing, all authors.; visualization, n.a.; supervision, RF.; project administration, n.a.; funding acquisition, n.a. All authors have read and agreed to the published version of the manuscript.
Funding
This research received no external funding.
Institutional Review Board Statement
Retrospective analysis of MCG signals available in the MCG database. The original data used were acquired in previous studies conducted in accordance with the Declaration of Helsinki, and approved by the Institutional Ethics Committee (prot.23430/16 ID.1234; 07/12/2016).
Informed Consent Statement
Informed consent was obtained from all subjects involved in the study for magnetocardiographic mapping and the use of their anonymized data for scientific publication.
Data Availability Statement
n.a.
Acknowledgments
We thank all patients for their time, commitment, and valuable contribution to the MCG experiments conducted in our laboratory. The statistical analysis code was written with the assistance of Claude Opus 5.5 (Anthropic.
Conflicts of Interest
The authors declare no conflicts of interest.
Abbreviations
The following abbreviations are used in this manuscript:
| AI | artificial intelligence |
| APD | action potential duration (APD80, APD50, APD20: at 80%, 50%, 20% repolarization) |
| bpm | beats per minute |
| BSPM | body-surface potential mapping |
| CAM | current arrow map |
| CI | confidence interval (95% unless stated) |
| CT | computed tomography |
| DC-SQUID | direct-current superconducting quantum interference device |
| EAI | electroanatomical imaging |
| EAM | electroanatomical mapping |
| ECG | electrocardiogram |
| ECGi | electrocardiographic imaging |
| EMD | effective magnetic dipole |
| EP | electrophysiology |
| HR | heart rate |
| ICC(A,1) | Intraclass correlation coefficient, absolute agreement, single measurement |
| IHD | ischemic heart disease |
| IQR | Inter Quartile Range |
| LoA | limits of agreement (Bland–Altman) |
| LOO | leave-one-out (analysis repeated removing one subject at a time) |
| LV | left ventricular |
| MACE | major adverse cardiovascular events |
| MAP | Monophasic Action Potential |
| MCG | magnetocardiography |
| MDC95 | minimal detectable change at the 95% level |
| MNE | minimum-norm estimation |
| MRI | magnetic resonance imaging |
| MSR | magnetically shielded room |
| NV | nitrogen-vacancy |
| OLS | ordinary least squares regression |
| OPM | optically pumped magnetometer |
| ph0 | time from QRS onset to a given level of the rVAPw upstroke (ph0_80, ph0_50, ph0_20) |
| PCD | primary current density |
| QRSend | the end of QRS wave |
| QTc | QT corrected for heart rate |
| _pct | variant of the rVAPw durations with height measured from the baseline before QRS onset |
| r | Pearson correlation coefficient |
| RR | R–R interval (ms), computed as 60000/HR |
| rVAPw | reconstructed ventricular action potential waveform |
| rVAPw 80,50,20 | time during which the rVAPw stays above 20%, 50%, 80% of its height (≈ APD80, APD50, APD20) |
| RVMAPs | right ventricular monophasic action potentials |
| SCD | sudden cardiac death |
| SD | standard deviation |
| SERF | spin-exchange relaxation-free |
| SEM | standard error of measurement |
| SNR | signal to noise ratio |
| Tend | the end of T wave |
| Tpeak-Tend | interval from T-wave peak to T-wave end |
| 3D | three-dimensional |
| UMCG | Unshielded MCG |
| VAPw | ventricular action potential waveform |
| VR | ventricular repolarization7 |
References
- King, S.J.; Yuthok, T.Y.W.; Bacong, A.M.; Khandelwal, A.; Kazi, D.S.; Mussolino, M.E.; Wong, S.S.; Martin, S.S.; Lewis, E.F.; Rodriguez, F.; Palaniappan, L.P. Heart Disease Mortality in the United. J. Am. Heart Assoc. 2025, vol. 14(no. e038644), 1–8. [Google Scholar] [CrossRef]
- Sanjiv, R. M. J.; Narayan, M. Advanced Electroanatomic Mapping: Current and Emerging Approaches. Curr. Treat. Options Cardiovasc. Med. 2024, vol. 26(no. 4), 69–91. [Google Scholar] [CrossRef]
- Chuanchai, W.; et al. Combination of cardiac MRI with conventional 3D-EAM to guide catheter ablation of ventricular arrhythmias in structural heart disease: A. Indian Pacing Electrophysiol. J. 2026, vol. 26(no. 2), 123–132. [Google Scholar] [CrossRef]
- Olsson, B.; Varnauskas, E.; Korsgren, M. Further improved method for measuring monophasic action potentials of the intact human heart. J. Electrocardiol. 1971, vol. 4(no. 1), 19–23. [Google Scholar] [CrossRef]
- Fenici, R.; Marchei, M.; Bellocci, F.; Zecchi, P. Effect of Bunaphtine on right atrial repolarisation in man. Br. Heart J. 1977, vol. 39, 787–794. [Google Scholar] [CrossRef]
- Franz, M. R. (Ed.) Monophasic Action Potentials: Bridging Cell and Bedside, 1st edition; Futura Publishing Company Inc.: Armonk, New York 10504, 2000. [Google Scholar]
- Travin, M. I.; Feng, D.; Taub, C. C. Novel Imaging Approaches for Predicting Arrhythmic Risk. Circ. Cardiovasc. Imaging 2015, vol. 8(no. 11), 1–11. [Google Scholar] [CrossRef]
- Rijnierse, M. T.; Allaart, C. P.; Knaapen, P. Principles and techniques of imaging in identifying the substrate of ventricular arrhythmia. J. Nucl. Cardiol. 2016, vol. 23(no. 2), 218–234. [Google Scholar] [CrossRef]
- van der Bijl, P.; Delgado, V.; Bax, J. J. Noninvasive imaging markers associated with sudden cardiac death. Trends Cardiovasc. Med. 2016, vol. 26(no. 4), 348–360. [Google Scholar] [CrossRef]
- Fenici, R.; et al. Nonfluoroscopic localization of an amagnetic stimulation catheter by multichannel magnetocardiography. Pacing Clin. Electrophysiol. 1999, vol. 22(no. 8), 1210–1220. [Google Scholar] [CrossRef]
- Pesola, K.; et al. Bioelectromagnetic localization of a pacing catheter in the heart. Phys. Med. Biol. 1999, vol. 44(no. 10), 2565–2578. [Google Scholar] [CrossRef]
- Hämäläinen, M.; Hari, R.; Ilmoniemi, R. J.; Knuutila, J.; Lounasmaa, O. V. Magnetoencephalography---theory, instrumentation, and applications to noninvasive studies of the working human brain. Rev. Mod. Phys. 1993, vol. 65(no. 2), 413–497. [Google Scholar] [CrossRef]
- Nenonen, J.; et al. “Current-density estimation of exercise-induced ischemia in patients with multivessel coronary artery disease.,” J. Electrocardiol. Suppl vol. 34, 37–42. Available online: http://www.ncbi.nlm.nih.gov/pubmed/11781934 (accessed on Feb. 20 2017).
- Fenici, R. R. Biomagnetic Imaging for ablation of cardiac arrhythmias (Editorial). Int. J. Card. Imaging 1991, vol. 7(no. 3–4), 141–248. [Google Scholar] [CrossRef]
- Fenici, R. R.; Melillo, G. Biomagnetic study of cardiac arrhythmias. Clin. Phys. Physiol. Meas. 1991, vol. 12, 5–10. [Google Scholar] [CrossRef]
- Shah, J.; et al. Body Surface Electrocardiographic Mapping for Non-invasive Identification of Arrhythmic Sources. Arrhythmia Electrophysiol. Rev. 2013, vol. 2(no. 1), 16. [Google Scholar] [CrossRef]
- Rudy, Y. Noninvasive Ecg Imaging (ECGi): Mapping The Arrhythmic Substrate Of The Human Heart. In Int J Cardiol.; NONINVASIVE, 2017; vol. 237, pp. 13–14. [Google Scholar] [CrossRef]
- Yang, H. B.; Pogwizd, T.; Walcott, S.M.; Yu, G.P.L. Noninvasive Activation Imaging of Ventricular Arrhythmias by Spatial Gradient Sparse in Frequency Domain—Application to Mapping Reentrant Ventricular Tachycardia. In IEEE Trans Med Imaging; Noninvasive, 2020; vol. 38, no. 2, pp. 525–539. [Google Scholar] [CrossRef]
- Chang, Y.; et al. Research on noninvasive electrophysiologic imaging based on cardiac electrophysiology simulation and deep learning methods for the inverse problem. BMC Cardiovasc. Disord. 2025, vol. 25(no. 1). [Google Scholar] [CrossRef]
- Ballatore; Saglietto, A.; Cavallone, E.; De Ferrari, G. M.; Anselmino, M.; Dusi, V. Noninvasive Cardiac Electrical Activity Mapping Systems: Current Available Options. 2025, vol. 26(no. 11). [Google Scholar]
- Rudy, Y.; Messinger-Rapport, B. J. The inverse problem in electrocardiography: solutions in terms of epicardial potentials. Crit. Rev. Biomed. Eng. 1988, vol. 16(no. 3), 215–268. [Google Scholar]
- Wissner, E.; et al. Noninvasive epicardial and endocardial mapping of premature ventricular contractions. Europace 2017, vol. 19(no. 5), 843–849. [Google Scholar] [CrossRef]
- Tsyganov, et al. Mapping of ventricular arrhythmias using a novel noninvasive epicardial and endocardial electrophysiology system. J. Electrocardiol. 2018, vol. 51(no. 1), 92–98. [Google Scholar] [CrossRef]
- Yadan, Z.; Xin, L.; Jian, W. Solving the inverse problem in electrocardiography imaging for atrial fi brillation using various time-frequency decomposition techniques based on empirical mode decomposition: A comparative study. Front. Physiol. vol. 13:999900., 1–13. [CrossRef]
- Brisinda, D.; Fenici, P.; Fenici, R. Clinical magnetocardiography: the unshielded bet—past, present, and future. Front. Cardiovasc. Med. 2023, vol. 10, no. August, 1–24. [Google Scholar] [CrossRef]
- Mooney, J. W.; Ghasemi-Roudsari, S.; Banham, E. Reade; Symonds, C.; Pawlowski, N.; Varcoe, B. T. H. A portable diagnostic device for cardiac magnetic field mapping. Biomed. Phys. Eng. Express 2017, vol. 3(no. 1). [Google Scholar] [CrossRef]
- Pena, M. E.; et al. A 90-second magnetocardiogram using a novel analysis system to assess for coronary artery stenosis in Emergency department observation unit chest pain patients. IJC Hear. Vasc. 2020, vol. 26(no. 100466), 1–7. [Google Scholar] [CrossRef]
- Yaga, L.; Amemiya, M.; Natsume, Y.; Shibuya, T.; Sasano, T. Recording of Cardiac Excitation Using a Novel Magnetocardiography System with Magnetoresistive Sensors Outside a Magnetic Shielded Room. Sensors vol. 25(no. 15), 4642, 2025. [CrossRef]
- Fenici, R.; Picerni, M.; Fenici, P.; Brisinda, D. Progress in Clinical Magnetocardiography: The Contactless Breakthrough for Non-Invasive Clinical Detection of Cardiac Ischemia Now Needs Worldwide Standardization Progress in Clinical Magnetocardiography: The Contactless Breakthrough for Non-Invasive Cl. 2025, 0–28. [Google Scholar] [CrossRef]
- Han, X.; et al. Coronary artery disease severity and location detection using deep-mining-based magnetocardiography pattern features. Comput. Methods Programs Biomed. 2025, vol. 266, 108764. [Google Scholar] [CrossRef]
- Tolstrup, K.; Akhtari, M.; Brisinda, D.; Meloni, A. M.; Siegel, R. J.; Fenici, R. Accurate diagnosis of ischemic heart disease without exposure to radiation using non-stress unshielded magnetocardiography. Am. Hear. J. Plus Cardiol. Res. Pract. 2025, vol. 49, 100483. [Google Scholar] [CrossRef]
- Li, J.; Yan, M.; Xiang, M.; Ning, X. Meta-Analysis of Magnetocardiography in Diagnosing Coronary Artery Disease and Myocardial Ischemia. Next Res. 2026, 101496. [Google Scholar] [CrossRef]
- Li, K.; et al. Chaotic Dynamics Analysis of Magnetocardiography Signals for Early Detection of Myocardial Ischemia; 2026; Volume no. Mi, pp. 1–21. [Google Scholar]
- Mace, S. E.; Baugh, C.; Pena, M. E.; Takla, R. A comparison of magnetocardiography with noninvasive cardiac testing in the evaluation of patients with chest pain. Am. Hear. J. Plus Cardiol. Res. Pract. 2025, vol. 54, 100541. [Google Scholar] [CrossRef]
- Pena, M. E.; et al. Can magnetocardiography decrease ED overcrowding, increase hospital bed capacity, and save hospitals money ? ☆. Am. Hear. J. Plus Cardiol. Res. Pract. 2025, vol. 62, 100705, 2026. [Google Scholar] [CrossRef]
- Lachlan, T.; et al. Magnetocardiography in the Evaluation of Sudden Cardiac Death Risk: A Systematic Review. Ann. Noninvasive Electrocardiol. Off. J. Int. Soc. Holter Noninvasive Electrocardiol. Inc. 2024, vol. 29(no. 6), e70028. [Google Scholar] [CrossRef]
- Fenici, R.; Picerni, M.; Fenici, P.; Brisinda, D. American Heart Journal Plus: Cardiology Research and Practice An advanced vision of magnetocardiography as an unrivalled method for a more comprehensive non-invasive clinical electrophysiological assessment ☆. Am. Hear. J. Plus Cardiol. Res. Pract. 2024, vol. 52, 100514, 2025. [Google Scholar] [CrossRef]
- Lachlan, T.; et al. MAGNETOcardiography Parameters to Predict Sudden Cardiac Death (MAGNETO-SCD) or Ventricular Events From Implantable Cardioverter Defibrillators. JACC. Clin. Electrophysiol. 2026. [Google Scholar] [CrossRef]
- Lachlan, T.; et al. Discovery of Novel Magnetocardiography Parameters Predicting Future ICD Therapies: Insights From the Magneto-SCD Study. Circ. Arrhythmia Electrophysiol. 2026, vol. 19(no. 7. United States), e014998. [Google Scholar] [CrossRef]
- Lachlan, T.; et al. Magnetocardiographic Rotation Score and Arrhythmic Endpoints in Primary-Prevention ICD Recipients: An Exploratory Substudy of the Magneto-SCD Trial 2026, 1–15.
- Bin Im, U.; et al. Theoretical analysis of the magnetocardiographic pattern for reentry wave propagation in a three-dimensional human heart model. Prog. Biophys. Mol. Biol. 2008, vol. 96(no. 1–3), 339–356. [Google Scholar] [CrossRef]
- Crispino, et al. A cross species thermoelectric and spatiotemporal analysis of alternans in live explanted hearts using dual voltage-calcium fluorescence optical mapping. Physiol. Meas. 2024, vol. 45(no. 6). [Google Scholar] [CrossRef]
- Crispino, et al. Magnetic signature of thermoelectric cardiac dynamics. Phys. Rev. E 2025, vol. 111(no. 1), L012401. [Google Scholar] [CrossRef]
- Nicoletti, M.; et al. Impact of Electric Spatially Discordant Alternans on Cardiac Magnetic Field. Phys. Rev. E 2025, vol. 112, 24405. [Google Scholar] [CrossRef]
- Nicoletti, M.; et al. Magnetic field based investigation of Brugada syndrome. Eur. Biophys. J. 2026. [Google Scholar] [CrossRef]
- Park, D.; Dischl, J.W.; et al. Editorial: Current proceedings in magnetocardiology — past, present, future. 2024, vol. Frontiers, no. August, 1–5. [Google Scholar] [CrossRef]
- Park, J. EP 4 316 374 A1; MAGNETOGRAPHY FOR THE DETECTION AND CHARACTERIZATION OF INDIVIDUAL CELLULAR ION CURRENTS. 2024.
- Dischl, D.; et al. Magnetoionography enhances diagnostic accuracy of magnetocardiography in coronary artery disease. Sci. Rep. 2025, vol. 15(no. 1), 1–11. [Google Scholar] [CrossRef]
- Kandori, et al. Reconstruction of action potential of repolarization in patients with congenital long-QT syndrome. Phys. Med. Biol. 2004, vol. 49(no. 10), 2103–2115. [Google Scholar] [CrossRef]
- Brisinda, D.; Sorbo, A. R.; Venuti, A.; Fenici, R. Percutaneous method for single-catheter multiple monophasic action potential recordings during magnetocardiographic mapping in spontaneously breathing rodents. Physiol. Meas. 2012, vol. 33(no. 3), 521–534. [Google Scholar] [CrossRef]
- Fenici, R.; Picerni, M.; Fenici, P.; Brisinda, D. Non-invasive mapping of ventricular action potential waveforms reconstructed from clinical unshielded magnetocardiography. Potential diagnostic application and current limitations. Am. Hear. J. Plus Cardiol. Res. Pract. vol. 55, no. June, 100561, 2025. [CrossRef]
- Fenici, R.; Picerni, M.; Fenici, P.; Brisinda, D. Non-Invasive Mapping of Ventricular Action Potential Reconstructed from Contactless Magnetocardiographic Recordings in Intact and Conscious Guinea Pigs. J. Cardiovasc. Dev. Dis. 2025, vol. 12(no. 343), 1–16. [Google Scholar] [CrossRef]
- Roth, J. Biomagnetism: The First Sixty Years. sensors 2023, vol. 23(no. 9), 4218. [Google Scholar] [CrossRef]
- Roth, J. The magnetocardiogram. Biophys. Rev. 2024, vol. 5(no. 2), 21305. [Google Scholar] [CrossRef]
- Fenici, R.; Brisinda, D.; Nenonen, J.; Morana, G.; Fenici, P. First MCG multichannel instrumentation operating in an unshielded hospital laboratory for multi-modal cardiac electrophysiology: Preliminary experience. Biomed. Eng. Biomed. Tech. 2001, vol. 46(no. s2), 219–222. [Google Scholar] [CrossRef]
- Omar, M.; et al. Human Cardiac Measurements with Diamond Magnetometers; 2026; pp. 1–21. [Google Scholar]
- Limes, W. M. E.; Smoot, ∗. J.; Perez, J.; Freeman, J.; Amano-Dolan, C.; Peters, D.; Lee. Probe-assisted Depopulation Pumping in Low-pressure Alkali-metal Vapor Cells for Magnetometry. Phys. Rev. 2026, no. A113, 033102. [Google Scholar]
- Jiang, W.; Li, J. Fiber-Coupled Fully Integrated Spin-Exchange Relaxation-Free Atomic Magnetometer for Functional Biomagnetic Measurements. Sensors 2026, vol. 26. 2593, no. Mi, 1–12. [Google Scholar] [CrossRef]
- Thooppanom, N. S. N.; Yodsungnoen, R.; Sangtawesin, S. Real Time Vector Magnetometry with Quantum Diamond Sensor. J. Phys. Conf. Ser. 2025, vol. 2934.01202. [Google Scholar] [CrossRef]
- Ramanathan; Trayanova, N. A. Understanding Artificial Intelligence ( AI ) for the Electrophysiologist. Indian Pacing Electrophysiol. J. 2026, vol. 26(no. 1), 79–88. [Google Scholar] [CrossRef]
- Canino, G.; et al. Artif. Intell. Card. Electrophysiol. A Clin. Oriented Rev. With Eng. Primers 2025, no. Ml, 1–31.
- Cipollone, P.; et al. Artificial Intelligence in Cardiac Electrophysiology: A Comprehensive Review. J. Pers. Med. Pers. Med. 2025, vol. 15(no. 532), 1–18. [Google Scholar]
- Fresca, S.; Manzoni, A.; Dedè, L.; Quarteroni, A.; Sebastian, R. POD-Enhanced Deep Learning-Based Reduced Order Models for the Real-Time Simulation of Cardiac Electrophysiology in the Left Atrium. 2021, vol. 12, no. September, 1–17. [Google Scholar] [CrossRef]
- Quarteroni, L. Dede’, A. Manzoni, and C. Vergara, Mathematical Modelling of the Human Cardiovascular System: Data, Numerical Approximation, Clinical Applications; Cambridge University Press, 2019. [Google Scholar]
- Corral-Acero, J.; et al. The ‘Digital Twin’ to enable the vision of precision cardiology. Eur. Heart J. 2020, vol. 41(no. 48), 4556–4564. [Google Scholar] [CrossRef]
- Gillette, K.; et al. A Framework for the generation of digital twins of cardiac electrophysiology from clinical 12-leads ECGs. Med. Image Anal. 2021, vol. 71, 102080. [Google Scholar] [CrossRef]
- Salvador, M.; Strocchi, M.; Regazzoni, F.; Dede, L.; Niederer, S. A.; Augustin, C. M. Whole-heart electromechanical simulations using Latent Neural Ordinary Differential Equations; 2024; pp. 1–8. [Google Scholar] [CrossRef]
- Fenici, R.; Brisinda, D. First 36-channel System for Clinical Magnetocardiography in Unshielded Hospital Laboratory for Cardiac Electrophysiology. Int. J. Bioelectromagn. 2003, vol. 5(no. 1), 80–83. [Google Scholar]
- Sorbo, R.; Lombardi, G.; La Brocca, L.; Guida, G.; Fenici, R.; Brisinda, D. Unshielded magnetocardiography: Repeatability and reproducibility of automatically estimated ventricular repolarization parameters in 204 healthy subjects. Ann. Noninvasive Electrocardiol. 2018, vol. 23(no. 3), 1–12. [Google Scholar] [CrossRef]
- Hosaka, H.; Cohen, D. Part IV Visual determination of generators of the magnetocardiogram. J. Electrocardiol. 1976, vol. 9(no. 4), 426–432. [Google Scholar] [CrossRef]
- Beeler, G. W.; Reuter, H. Reconstruction of the action potential of ventricular myocardial fibres. J. Physiol. 1977, vol. 268(no. 1), 177–210. [Google Scholar] [CrossRef]
- Uzelac; Ji, Y. C.; Hornung, D.; Schröder-scheteling, J. Simultaneous Quantification of Spatially Discordant Alternans in Voltage and Intracellular Calcium in Langendorff-Perfused Rabbit Hearts and Inconsistencies with Models of Cardiac Action Potentials and Ca Transients. 2017, vol. 8, no. October, 1–14. [Google Scholar] [CrossRef]
- Crispino; Loppini, A.; Uzelac, I.; Filippi, S.; Fenton, F. H.; Gizzi, A. Spatiotemporal Correlation Analysis of Cardiac Activation Patterns in Langen-Dorff-Perfused Human Hearts: Insights for Arrhythmia Prediction. Comput. Cardiol. (2010) . no. June 2024, 2023. [CrossRef]
- Bueno-orovio; Cherry, E. M.; Fenton, F. H. Minimal model for human ventricular action potentials in tissue. J. Theor. Biol. J. 2008, vol. 253, 544–560. [Google Scholar] [CrossRef]
- L. E. Hodges, J.L. Estimates of location based on rank tests. Ann. Math. Stat.;Ann. Math. Stat. 1963, 34 vol. 34, 598–611. pp. 598–611. [Google Scholar]
- Holm, S. A Simple Sequentially Rejective Multiple Test Procedure. Scand. J. Stat. 1979, vol. 6(no. 2), 65–70. [Google Scholar]
- EFRON. Nonparametric estimates of standard error: The jackknife, the bootstrap and other methods. Biometrika 1981, vol. 68(no. 3), 589–599. [Google Scholar] [CrossRef]
- Bland, J. M.; Altman, D. G. Statistics Notes Calculating correlation coefficients with repeated observations: Part 1-correlation within subjects. BMJ 1995, vol. 310, no. February, 446. [Google Scholar] [CrossRef]
- Bakdash, J. Z.; Marusich, L. R.; Bolin, J. H. Repeated Measures Correlation. 2017, vol. 8, no. April, 1–13. [Google Scholar] [CrossRef]
- Weir, J. P. Quantifying test-retest reliability using the intraclass correlation coefficient and the SEM. J. Strength Cond. Res. 2005, vol. 19(no. 1), 231–240. [Google Scholar] [CrossRef]
- McGraw, K. O.; Wong, S. P. Forming inferences about some intraclass correlation coefficients. Psychol. Methods 1996, vol. 1, 30–46. [Google Scholar] [CrossRef]
- Bland, J. M.; Altman, D. G. Statistical methods for assessing agreement between two methods of clinical measurement. Lancet 1986, vol. 1(no. 8476), 307–310. [Google Scholar] [CrossRef]
- Fenici, R. R.; Covino, M.; Cellerino, C.; Di Lillo, M.; De Filippo, M. C.; Melillo, G. Magnetocardiographically-guided catheter ablation. J. Interv. Cardiol. 1995, vol. 8(no. 6) Suppl, 825–836. [Google Scholar] [CrossRef]
- Fenici, R.; et al. Magnetocardiographic pacemapping for nonfluoroscopic localization of intracardiac electrophysiology catheters. Pacing Clin. Electrophysiol. 1998, vol. 21 no. 11 Pt 2, 2492–2499. [Google Scholar] [CrossRef]
- Nenonen, J.; et al. Cardiomagnetic Source Imaging Studies with Focal and Distributed Source Models. Biomed. Tech. 1999, vol. 44(no. s2). [Google Scholar] [CrossRef]
- Sepulveda, N. G.; Wikswo, J. P. Electric And Magnetic Fields From Two-Dimensional Anisotropic Bisyncytia. BIOPHYS. J. 1987, vol. 51, no. April, 557–568. [Google Scholar] [CrossRef]
- Roth, J.; Guo, W.-Q.; Wikswo, J. P. The effects of spiral anisotropy on the electric potential and the magnetic field at the apex of the heart. Math. Biosci. 1988, vol. 88(no. 2), 191–221. [Google Scholar] [CrossRef]
- Roth, B. J.; Sepulveda, N. G.; Wikswo, J. P., Jr. Using a magnetometer to image a two-dimensional current distribution. J. Appl. Phys. 1989, vol. 65(no. 1), 361–372. [Google Scholar] [CrossRef]
- Roth, B. J.; Woods, M. C. The magnetic field associated with a plane wave front propagating through cardiac tissue. IEEE Trans. Biomed. Eng. 1999, vol. 46(no. 11), 1288–1292. [Google Scholar] [CrossRef]
- Baudenbacher; Peters, N. T.; Baudenbacher, P.; Wikswo, J. P. High resolution imaging of biomagnetic fields generated by action currents in cardiac tissue using a LTS-SQUID microscope. Phys. C Supercond. 2002, vol. 368(no. 1), 24–31. [Google Scholar] [CrossRef]
- Holzer, J. R.; Fong, L. E.; Sidorov, V. Y.; Wikswo, J. P.; Baudenbacher, F. High resolution magnetic images of planar wave fronts reveal bidomain properties of cardiac tissue. Biophys. J. 2004, vol. 87(no. 6), 4326–4332. [Google Scholar] [CrossRef]
- McBride, K. K.; Roth, B. J.; Sidorov, V. Y.; Wikswo, J. P.; Baudenbacher, F. J. Measurements of transmembrane potential and magnetic field at the apex of the heart. Biophys. J. 2010, vol. 99(no. 10), 3113–3118. [Google Scholar] [CrossRef]
- Dallas, W. J. Fourier space solution to the magnetostatic imaging problem. Appl. Opt. 1985, vol. 24(no. 24), 4543–4546. [Google Scholar] [CrossRef]
- Schmidt, et al. A Concept for Myocardial Current Density Estimation with Magnetoelectric Sensors. Curr. Dir. Biomed. Eng. 2023, vol. 9(no. 1), 89–92. [Google Scholar] [CrossRef]
- Engelhardt; Elzenheimer, E.; Hoffmann, J.; Meledeth, C.; Frey, N.; Schmidt, G. Non-Invasive Electroanatomical Mapping: A State-Space Approach for Myocardial Current Density Estimation. Bioengineering 2023, vol. 10(no. 12), 1–15. [Google Scholar] [CrossRef]
- Engelhardt; Hoffmann, J.; Boueke, M.; Frey, N.; Schmidt, G. Enhancing Non-Invasive Electroanatomical Mapping with Dynamic Sensor Arrays. 2024. [Google Scholar] [CrossRef]
- Viswanathan, P. C.; Shaw, R. M.; Rudy, Y. Effects of IKr and IKs heterogeneity on action potential duration and its rate dependence: a simulation study. Circulation 1999, vol. 99(no. 18), 2466–2474. [Google Scholar] [CrossRef]
- Faber, M.; Rudy, Y. Action Potential and Contractility Changes in [ Na ؉ ] i Overloaded Cardiac Myocytes: A Simulation Study. 2000, vol. 78, no. May, 2392–2404. [Google Scholar]
- O’Hara, T.; Virág, L.; Varró, A.; Rudy, Y. Simulation of the undiseased human cardiac ventricular action potential: Model formulation and experimental validation. PLoS Comput. Biol. 2011, vol. 7(no. 5). [Google Scholar] [CrossRef]
- Franz, M. R.; Swerdlow, C. D.; Liem, L. B.; Schaefer, J. Cycle Length Dependence of Human Action Potential Duration In Vivo and Different Steady-State Frequencies. J. Clin. Investig. 1988, vol. 82, no. September, 972–979. [Google Scholar] [CrossRef]
- Kléber, G.; Rudy, Y. Basic mechanisms of cardiac impulse propagation and associated arrhythmias. Physiol. Rev. 2004, vol. 84(no. 2), 431–488. [Google Scholar] [CrossRef]
- Lau, P.; Freedman, A. R.; Fleming, S.; Malik, M.; Camm, A. J.; Ward, D. E. Hysteresis of the ventricular paced QT interval in response to abrupt changes in pacing rate. Cardiovasc. Res. 1988, vol. 22(no. 1), 67–72. [Google Scholar] [CrossRef]
- Pueyo, E.; Smetana, P.; Caminal, P.; de Luna, A. B.; Malik, M.; Laguna, P. Characterization of QT interval adaptation to RR interval changes and its use as a risk-stratifier of arrhythmic mortality in amiodarone-treated survivors of acute myocardial infarction. IEEE Trans. Biomed. Eng. 2004, vol. 51(no. 9), 1511–1520. [Google Scholar] [CrossRef]
- Krahn, D.; Klein, G. J.; Yee, R. Hysteresis of the RT interval with exercise: a new marker for the long-QT syndrome? Circulation 1997, vol. 96(no. 5), 1551–1556. [Google Scholar] [CrossRef]
- Volders, P. G. A.; et al. Probing the contribution of IKs to canine ventricular repolarization: key role for beta-adrenergic receptor stimulation. Circulation 2003, vol. 107(no. 21), 2753–2760. [Google Scholar] [CrossRef]
- Haberkorn, W.; Steinhoff, U.; Burghoff, M.; Kosch, O.; Morguet, A.; Koch, H. Pseudo current density maps of electrophysiological heart, nerve or brain function and their physical basis. Biomagn. Res. Technol. 2006, vol. 4. [Google Scholar] [CrossRef]
- Bucelli, M.; Zingaro, A.; Africa, P. C.; Fumagalli, I.; Dede’, L.; Quarteroni, A. A mathematical model that integrates cardiac electrophysiology, mechanics, and fluid dynamics: Application to the human left heart. Int. j. numer. method. biomed. eng. 2023, vol. 39(no. 3), 1–37. [Google Scholar] [CrossRef]
- Fenici, R.; Picerni, M.; Fenici, P.; Brisinda, D. Inverse reconstruction of left ventricular action potentials from contactless magnetocardiography enables non invasive high-resolution mapping of repolarization heterogeneity. Eur. Heart J. 2026, vol. 47. [Google Scholar] [CrossRef]
- Shang, W.; Fushimi, M.; Chikaki, S.; Sekino, M. Enhancing Current—Source Imaging in Magnetocardiography: The Impact of Sensor Array Configuration. Ann. Biomed. Eng. 2026, no. 0123456789. [Google Scholar] [CrossRef]
- Kong, X.; Yang, K.; Zhang, Z.; Pan, D.; Guo, C. Chapter 20—Recent advances in magnetocardiography. In Advances in Bioelectromagnetism, T. A. B. T.-A.; Nguyen, B., Ed.; Academic Press, 2026; pp. 295–314. [Google Scholar]
- He, Y.; Zhang, X.; Han, X.; Zhang, Z.; Roth, B. J. Global trends and knowledge structure of cardiovascular magnetocardiography research: a bibliometric analysis. 2026, no. October, 1–21. [Google Scholar] [CrossRef]
- Dong; Ye, H.; Hu, M.; Ma, Z. Recent Developments in Fabrication Methods and Measurement Schemes for Optically Pumped Magnetic Gradiometers: A Comprehensive Review. 2024. [Google Scholar] [CrossRef]
- Xing, W.; Jia, L.; Long, T.; Zhang, J.; Sun, H. Measurement bandwidth enhancement of SERF atomic magnetometers using frequency response regulation. Measurement 2026, vol. 287(no. 37), 122508. [Google Scholar] [CrossRef]
- Xue, X.; Zhang, J.; Zhou, Y. Magnetocardiography in the diagnosis of suspected ANOCA: a case series. Front. Cardiovasc. Med. 2026, vol. 13, no. 1787320. [Google Scholar] [CrossRef]
- Xue, X.; Zhang, J.; Zhou, Y. Magnetocardiography in diagnosis of MINOCA: a case series. Front. Cardiovasc. Med. 2026, vol. 13(no. 1759132). [Google Scholar] [CrossRef]
- Tian, K.; Hu, Y.; Zhang, X.; Yang, J.; Zhang, A.; Shi, Z. Ultra-sensitive cardiac source imaging with SERF-MCG and advanced signal decoupling. Measurement 2026, vol. 259, no. PB, 119762. [Google Scholar] [CrossRef]
- Jia, Y.; et al. Deep learning with explainability: Improving diagnostic accuracy and interpretability in ECG and MCG analysis. Biomed. Signal Process. Control 2026, vol. 113, 108875. [Google Scholar] [CrossRef]
- Su, S.; et al. Vector magnetocardiography using compact optically-pumped magnetometers. Heliyon 2024, vol. 10(no. 7), e29092. [Google Scholar] [CrossRef]
- Wang, T.; Lee, W.; Limes, M.; Kornack, T.; Foley, E.; Romalis, M. Pulsed vector atomic magnetometer using an alternating fast-rotating fi eld. Nat. Commun. 2024, 1–10, 2025. [Google Scholar] [CrossRef]
- Schönau, T.; et al. Optically pumped vector magnetometer using a strong bias magnetic field. Phys. Rev. Appl. vol. 10(no. 1), 1, 2025. [CrossRef]
- Zhang, J.; Song, X.; Jia, L.; Long, T.; Sun, H.; Zheng, C. Three-dimensional visualization of MCG signals using CW _ FastICA and transfer function mapping. Measurement vol. 273, no. March, 121175, 2026. [CrossRef]
- He, J.; et al. Optical co-registration method of OPM-MCG and MRI based on skin markers. Measurement 2025, vol. 256, 118319. [Google Scholar] [CrossRef]
- Guo, Y.; et al. Establishment of magnetocardiogromics platform with reference range for normal magnetocardiogram. 2025. [Google Scholar] [CrossRef]
- Masuyama, Y.; et al. Gradiometer Using Separated Diamond Quantum Magnetometers. Sensors 2021, vol. 21(no. 3), 977. [Google Scholar] [CrossRef]
- Ngonsamrong, S.; Thooppanom, N.; Sudjit, P.; Sangtawesin, S. Optically assigned vector magnetometry with nitrogen-vacancy center ensembles in diamond via polarization anisotropy. Sci. Rep. vol. 16(no. 1), 23410, 2026. [CrossRef]
- Lönard, D.; Barbosa, I. C.; Johansson, S.; Gutsche, J.; Widera, A. Limits of absolute vector magnetometry with nitrogen-vacancy centers in diamond. Phys. Rev. Res. 2026, vol. 013054(no. 8), 1–13. [Google Scholar] [CrossRef]
- Soshenko, V. V.; et al. Nuclear Spin Gyroscope based on the Nitrogen Vacancy Center in Diamond. Phys. Rev. Lett. 2021, vol. 126(no. 19), 197702. [Google Scholar] [CrossRef]
- Araki, Y.; et al. A highly sensitive diamond NV magnetometer using Ramsey interferometry with a short sensor-to-sample distance. Appl. Phys. Lett. vol. 129(no. 3), 34003, 2026. [CrossRef]
- Barry, J. F.; et al. Sensitivity optimization for NV-diamond magnetometry. Rev. Mod. Phys. 2020, vol. 92(no. 1), 15004. [Google Scholar] [CrossRef]
- Wolf, T.; et al. Subpicotesla Diamond Magnetometry. Phys. Rev. X 2014, vol. 5, 41001. [Google Scholar] [CrossRef]
- Graham, S. M.; et al. Fiber-coupled Diamond Magnetometry with an Unshielded 15 pT/$\sqrt{\textrm{Hz}}$ Sensitivity. 2022, no. 1, pp. 1–20. Available online: http://arxiv.org/abs/2211.09170.
- Zadeh-Haghighi; Golami, O.; Kavatamane, V. K.; Barclay, P. E.; Simon, C. Master equation-based model for infrared-based magnetometry with nitrogen-vacancy centers in diamond cavities: a path to sub-picotesla sensitivity at sub-millimeter scales. 2024. [Google Scholar] [CrossRef]
- Barry, F.; et al. Sensitive ac and dc magnetometry with nitrogen-vacancy-center ensembles in diamond. Phys. Rev. Appl. 2024, vol. 22(no. 4), 44069. [Google Scholar] [CrossRef]
- Embrechts, M.; Szymanski, B.; Sternickel, K.; Naenna, T.; Bragaspathi, R. Use of machine learning for classification of magnetocardiograms. Proc. IEEE Int. Conf. Syst. Man. Cybern. 2003, vol. 2, 1400–1405. [Google Scholar] [CrossRef]
- Tantimongcolwat, T.; Naenna, T.; Isarankura-Na-Ayudhya, C.; Embrechts, M. J.; Prachayasittikul, V. Identification of ischemic heart disease via machine learning analysis on magnetocardiograms. Comput. Biol. Med. 2008, vol. 38(no. 7), 817–25. [Google Scholar] [CrossRef]
- Fenici, R.; Brisinda, D.; Meloni, A. M.; Sternickel, K.; Fenici, P. “Clinical Validation of Machine Learning for Automatic Analysis of Multichannel Magnetocardiography,” in Functional Imaging and Modeling of the Heart; Springer Science $\mathplus$ Business Media, 2005; pp. 143–152. [Google Scholar]
- Jia, Y.; et al. Temporal Decomposition and Attention-Based Deep Learning for Magnetocardiography Signal Denoising. IEEE Trans. Instrum. Meas. 2025, vol. 74, 1–12. [Google Scholar] [CrossRef]
- Pion-tonachini, L.; Kreutz-delgado, K.; Makeig, S.; Drive, G.; Jolla, L. HHS Public Access; ICLabel, 2020; pp. 181–197. [Google Scholar] [CrossRef]
- Geng, X.; Zhou, X.; Zhu, C.; Tian, K.; Zhang, X. A physics-driven deep unrolling framework with multiscale attention for multichannel Magnetocardiography denoising. Measurement vol. 289, no. July, 122671, 2026. [CrossRef]
- Xing, B.; Feng, X.; Zhang, B. Research on Denoising Methods for Magnetocardiography Signals in a Non-Magnetic Shielding Environment; 2025; pp. 1–22. [Google Scholar]
- Mohsen; Al-Mahdawi, M.; Fouda, M.; Oogane, M.; Ando, Y.; Fadlullah, Z. AI Aided Noise Processing of Spintronic Based IoT Sensor for Magnetocardiography Application. 2019. [Google Scholar] [CrossRef]
- Sakib, S.; Al-mahdawi, M. Deep Learning Models for Magnetic Cardiography Edge Sensors Implementing Noise Processing and Diagnostics. IEEE Access 2022, vol. 10, 2656–2668. [Google Scholar] [CrossRef]
- Jia, Y.; Pei, H.; Liang, J.; Zhou, Y.; Yang, Y.; Cui, Y. Preprocessing Denoising Tech. Electrocardiogr. Magnetocardiography A Rev. 2024, 1–38.
- Zhang; Yu, W.; Gao, Y.; Wang, F.; Zhang, Q.; Lin, Q. Dual-resonance single-beam triaxial spin-exchange relaxation-free magnetometer. Opt. Express 2025, vol. 33(no. 18), 37343–37351. [Google Scholar] [CrossRef]
- Martínez, P.; Almeida, R.; Olmos, S.; Rocha, A. P.; Laguna, P. A wavelet-based ECG delineator: evaluation on standard databases. IEEE Trans. Biomed. Eng. 2004, vol. 51(no. 4), 570–581. [Google Scholar] [CrossRef]
- Joung, C.; et al. Deep learning based ECG segmentation for delineation of diverse arrhythmias. PLoS ONE 2024, vol. 19(no. 6), e0303178. [Google Scholar] [CrossRef]
- Zhu, W.; Beroza, G. C. PhaseNet: a deep-neural-network-based seismic arrival-time picking method. Geophys. J. Int. 2019, vol. 216(no. 1), 261–273. [Google Scholar] [CrossRef]
- Xing, Z.; et al. Multi-level Gated U-Net for Denoising TMR Sensor-Based MCG Signals. Medical Image Computing and Computer Assisted Intervention—MICCAI 2025: 28th International Conference Proceedings, Part III, Daejeon, South Korea, September 23–27, 2025; 2025, pp. 428–437. [Google Scholar] [CrossRef]
- Li; Ditzler, G.; Roveda, J.; Li, A. DeScoD-ECG: Deep Score-Based Diffusion Model for ECG Baseline Wander and Noise Removal. IEEE J. Biomed. Heal. Inform. 2024, vol. 28(no. 9), 5081–5091. [Google Scholar] [CrossRef]
- Lehtinen, et al. {N}oise2{N}oise: Learning Image Restoration without Clean Data. Proc. 35th Int. Conf. Mach. Learn. 2018, vol. 80, 2965–2974. [Google Scholar]
- Omar, M.; et al. Human Cardiac Measurements with Diamond Magnetometers. arXiv. 226, 2026.
- Patel; Kesavaraja, C.; Dutta, P.; orak Biswas, K. A Signal Analysis Framework for Unshielded Room-Temperature Magnetocardiography. arXiv 2026, arXiv:2606.29285. [Google Scholar] [CrossRef]
- Fenici, R.; et al. Nonfluoroscopic localization of an amagnetic catheter in a realistic torso phantom by magnetocardiographic and body surface potential mapping. Pacing Clin. Electrophysiol. 1998, vol. 21 no. 11 Pt 2, 2485–2491. Available online: http://www.ncbi.nlm.nih.gov/pubmed/9825372. [CrossRef]
- Fenici, R.; Brisinda, D. Bridging noninvasive and interventional electroanatomical imaging: role of magnetocardiography. J. Electrocardiol. 2007, vol. 40(no. 1) SUPPL., 47–52. [Google Scholar] [CrossRef]
- Arai, et al. Millimetre-scale magnetocardiography of living rats with thoracotomy. Commun. Phys. 2022, vol. 5(no. 1), 1–10. [Google Scholar] [CrossRef]
Figure 1.
(a) 3D model of the patient thorax and heart adapted to its real size, and post-processing of the MCG signals to sequentially calculate and image the dynamic distribution of the magnetic field (b), and of the pseudo-current density (c), used to reconstruct the VAPw (d) over the 36-channel MCG array.
Figure 1.
(a) 3D model of the patient thorax and heart adapted to its real size, and post-processing of the MCG signals to sequentially calculate and image the dynamic distribution of the magnetic field (b), and of the pseudo-current density (c), used to reconstruct the VAPw (d) over the 36-channel MCG array.
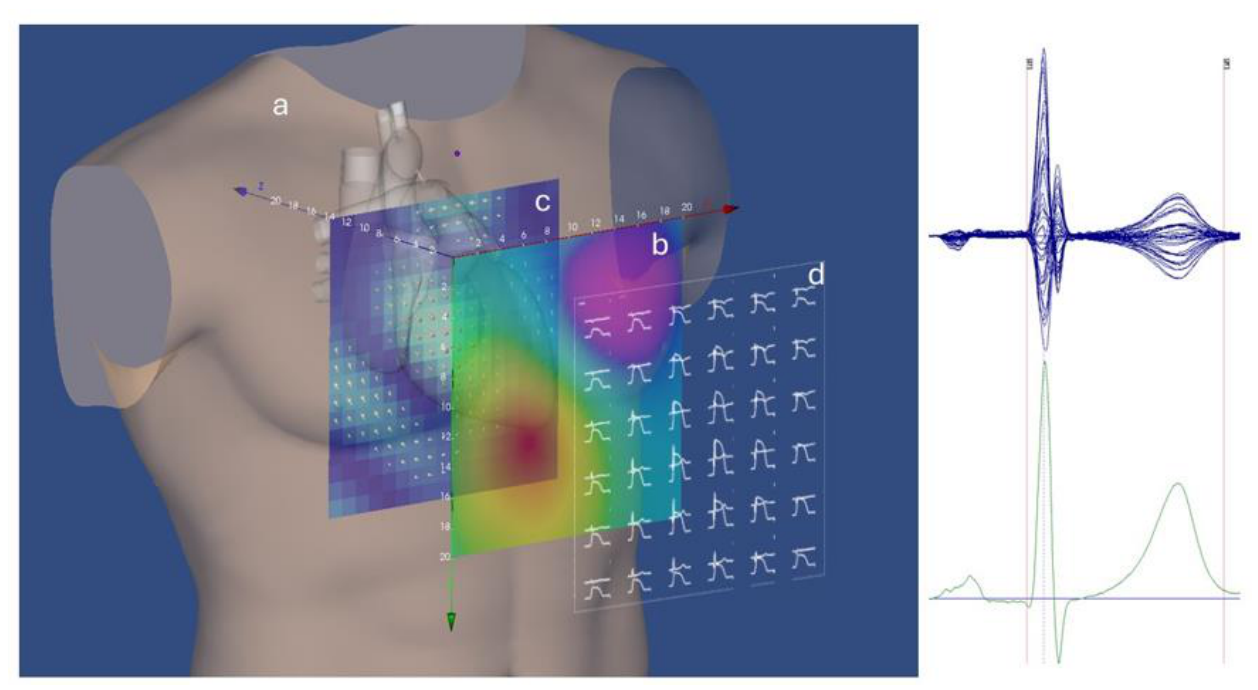
Figure 2.
A) example of rVAPw distortion (red) due to baseline misalignment at the end of repolarization (highlighted by the dotted circle); B) automatic rVAPw correction (black); C) the superposition of the two waveforms (A and B) evidences the difference in quantitative estimation of ventricular repolarization. The synchronous local magnetocardiogram (MCG) is also shown (blue).
Figure 2.
A) example of rVAPw distortion (red) due to baseline misalignment at the end of repolarization (highlighted by the dotted circle); B) automatic rVAPw correction (black); C) the superposition of the two waveforms (A and B) evidences the difference in quantitative estimation of ventricular repolarization. The synchronous local magnetocardiogram (MCG) is also shown (blue).
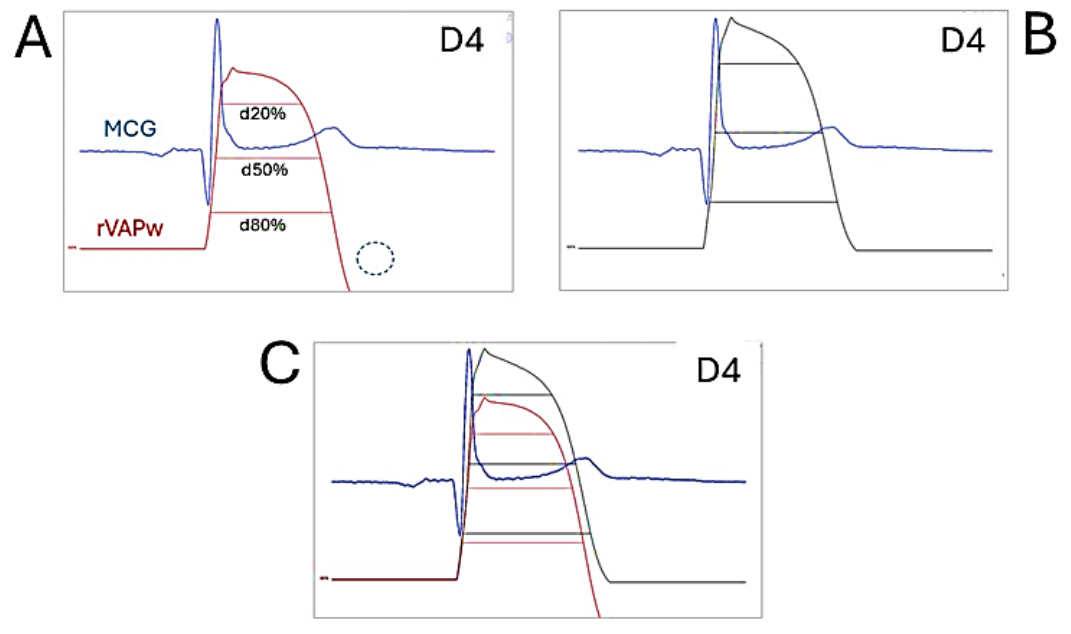
Figure 3.
A) example of rVAPw distortion due to baseline misalignment randomly occurring at several recording sites (highlighted by the dotted circle in the magnification of positions B4-E4 (bottom); B) automatic correction over all recording positions.
Figure 3.
A) example of rVAPw distortion due to baseline misalignment randomly occurring at several recording sites (highlighted by the dotted circle in the magnification of positions B4-E4 (bottom); B) automatic correction over all recording positions.
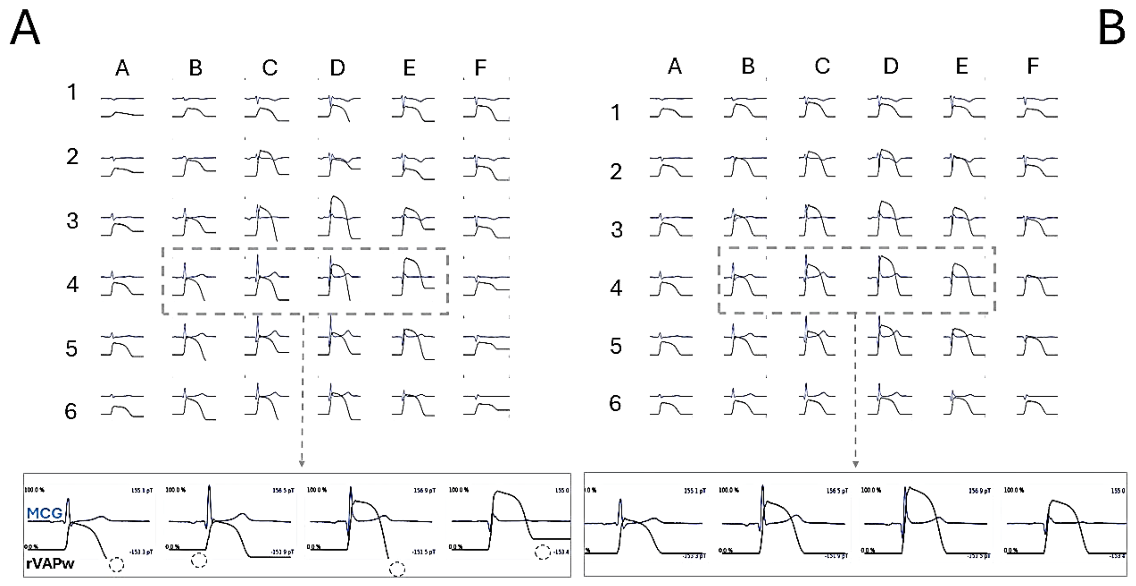
Figure 4.
Bland–Altman plots of rVAPw80 (median of 36 channels), standard and _pct variant. Solid line: mean difference; dashed lines: 95% limits of agreement; shaded: their 95% CI. Each point is one subject (n = 15); no heart-rate correction.
Figure 4.
Bland–Altman plots of rVAPw80 (median of 36 channels), standard and _pct variant. Solid line: mean difference; dashed lines: 95% limits of agreement; shaded: their 95% CI. Each point is one subject (n = 15); no heart-rate correction.
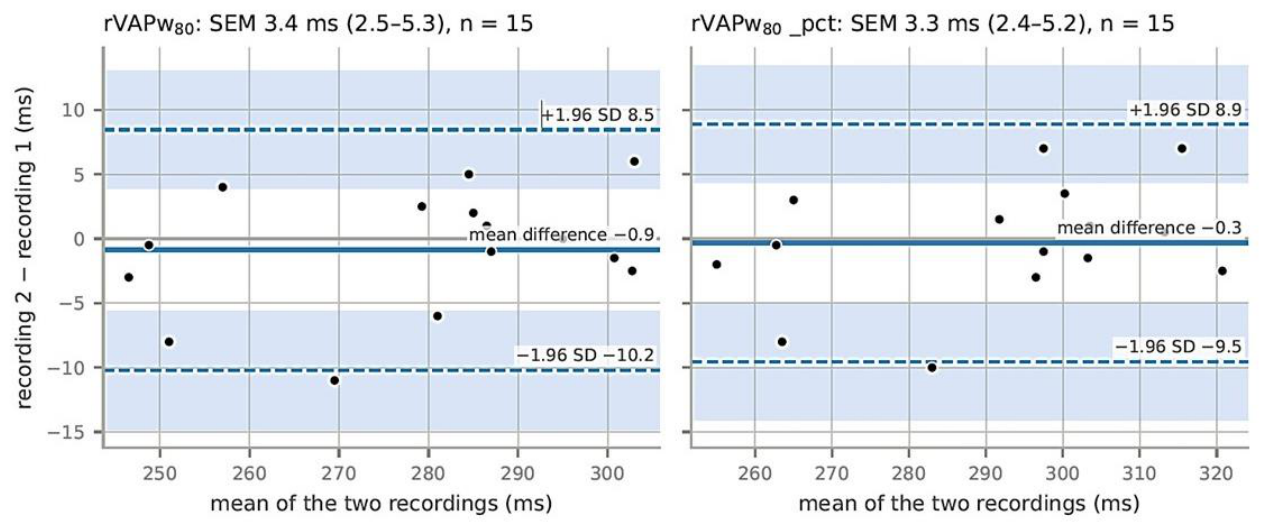
Figure 5.
Each point is one subject (n = 15). Change between the two resting recordings (second minus first) of rVAPw80 (y) and of the per-channel QT, at the fiducial points used by the reconstruction, median of the 36 channels (x). Grey band: the slopes that would be observed if only the fiducial points had moved while the reconstructed waveform stayed the same. Dotted line: identity, rVAPw80 changing by as much as the per-channel QT. Solid and dashed blue lines: regression of y on x and inverse regression of x on y.
Figure 5.
Each point is one subject (n = 15). Change between the two resting recordings (second minus first) of rVAPw80 (y) and of the per-channel QT, at the fiducial points used by the reconstruction, median of the 36 channels (x). Grey band: the slopes that would be observed if only the fiducial points had moved while the reconstructed waveform stayed the same. Dotted line: identity, rVAPw80 changing by as much as the per-channel QT. Solid and dashed blue lines: regression of y on x and inverse regression of x on y.
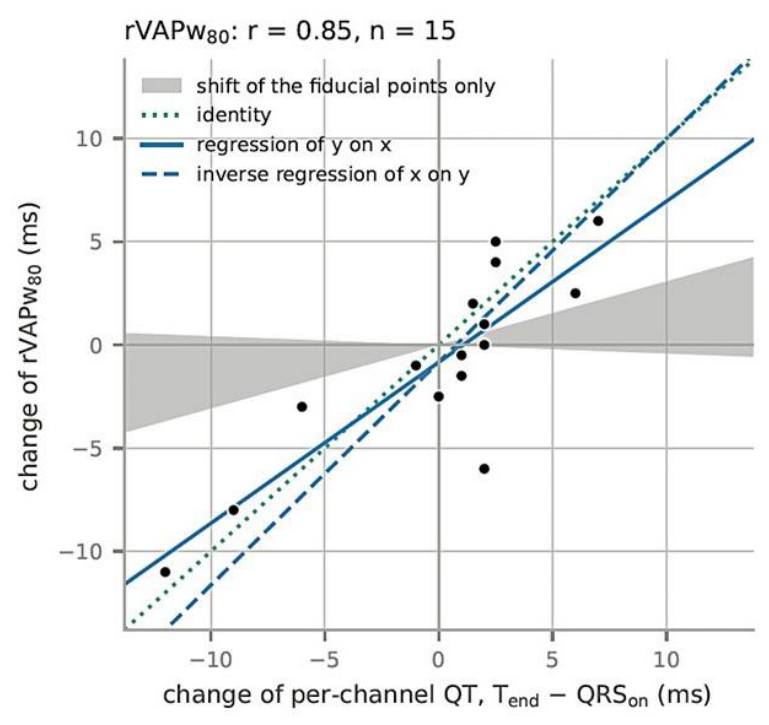
Figure 6.
A) Example of magnetic VAPw reconstruction at the 36 MCG recording points. B) Magnification of position D4 highlighting the rate-dependent change of the rVAPw measure at the three levels of ventricular repolarization, at baseline rest (blue), R1 (red), and R7 (green). The rate-dependent adaptation takes place during the plateau (phase 2) of the rVAPw (i.e., before the T-wave peak). The whole downstroke (Phase 3) moves in time with little change in shape.
Figure 6.
A) Example of magnetic VAPw reconstruction at the 36 MCG recording points. B) Magnification of position D4 highlighting the rate-dependent change of the rVAPw measure at the three levels of ventricular repolarization, at baseline rest (blue), R1 (red), and R7 (green). The rate-dependent adaptation takes place during the plateau (phase 2) of the rVAPw (i.e., before the T-wave peak). The whole downstroke (Phase 3) moves in time with little change in shape.
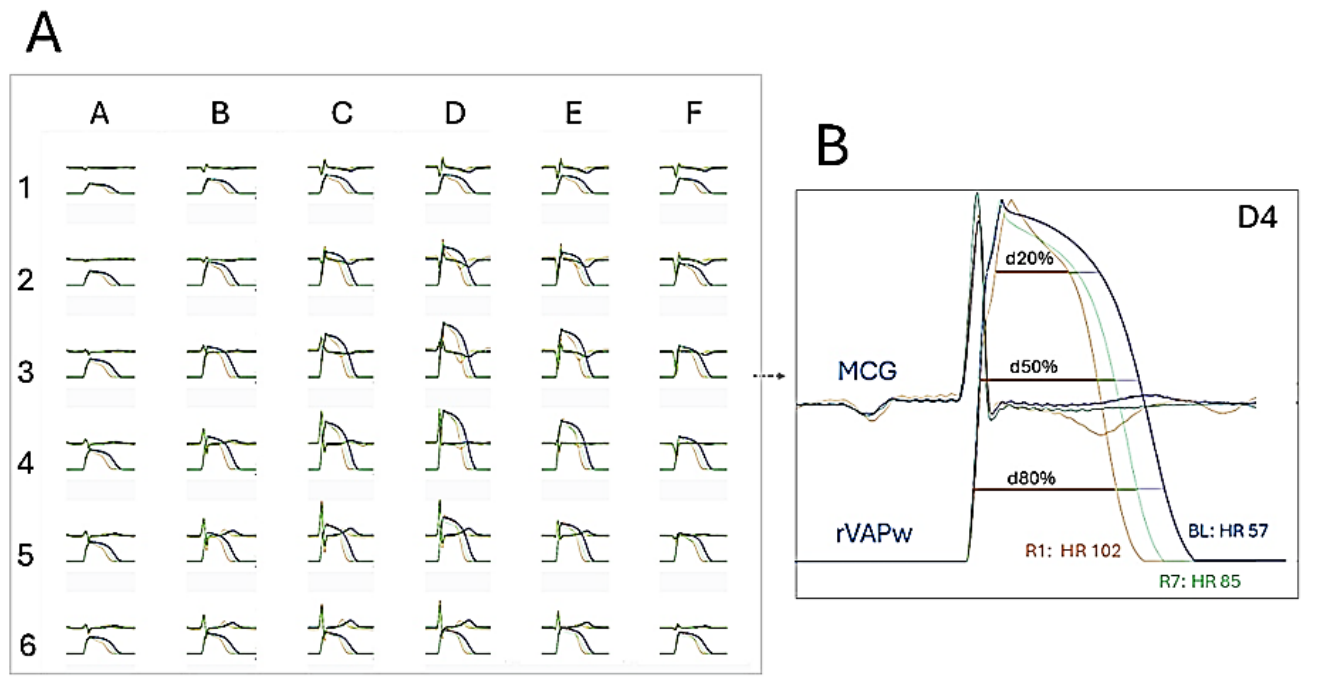
Figure 7.
Rate adaptation of the reconstructed durations within subjects. Each thin line is one subject: its three recordings (rest, early and late recovery), with the subject’s own mean cycle length (RR) and mean duration subtracted, so that only the change within the subject is shown. Top: rVAPw20, rVAPw50, rVAPw80 (time above 80%, 50% and 20% of the height of the reconstructed waveform); bottom: ph020, ph050, ph080 (the part of the same intervals before QRS offset). Blue: healthy subjects (n = 10); orange: patients (n = 10). Thick line: pooled within-subject slope of the cohort (Table 6); dotted line: median of the per-subject slopes. Dashed thin line: healthy subject 52, excluded from the slope estimates because the heart rate changed by less than 15 bpm (also after adding 5 bpm for the white-coat effect at rest). Values are medians over the 36 channels.
Figure 7.
Rate adaptation of the reconstructed durations within subjects. Each thin line is one subject: its three recordings (rest, early and late recovery), with the subject’s own mean cycle length (RR) and mean duration subtracted, so that only the change within the subject is shown. Top: rVAPw20, rVAPw50, rVAPw80 (time above 80%, 50% and 20% of the height of the reconstructed waveform); bottom: ph020, ph050, ph080 (the part of the same intervals before QRS offset). Blue: healthy subjects (n = 10); orange: patients (n = 10). Thick line: pooled within-subject slope of the cohort (Table 6); dotted line: median of the per-subject slopes. Dashed thin line: healthy subject 52, excluded from the slope estimates because the heart rate changed by less than 15 bpm (also after adding 5 bpm for the white-coat effect at rest). Values are medians over the 36 channels.
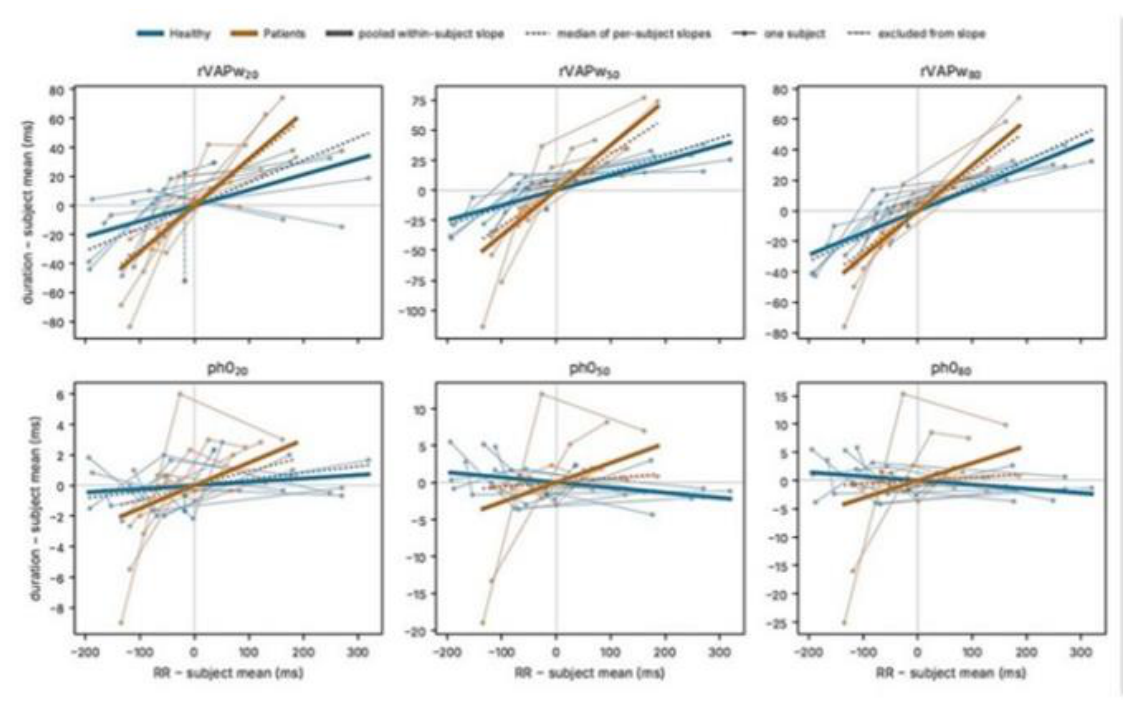
Figure 8.
Comparison of the rVAPw reconstructed with the unfiltered MCG signals (A) and that obtained after 50 Hz LP + COMB filtering (B). The rVAPw are almost aligned, although a prolongation of the unfiltered rVAPw duration is evident (green star in C), due to incorrect automatic detection of the T-wave offset of the unfiltered MCG (green vertical dashed line in C). After manual editing of the T-wave offset (green arrows), both reconstructed VAP waveforms are perfectly aligned (D). (Red vertical dashed line: appropriate T-wave offset).
Figure 8.
Comparison of the rVAPw reconstructed with the unfiltered MCG signals (A) and that obtained after 50 Hz LP + COMB filtering (B). The rVAPw are almost aligned, although a prolongation of the unfiltered rVAPw duration is evident (green star in C), due to incorrect automatic detection of the T-wave offset of the unfiltered MCG (green vertical dashed line in C). After manual editing of the T-wave offset (green arrows), both reconstructed VAP waveforms are perfectly aligned (D). (Red vertical dashed line: appropriate T-wave offset).
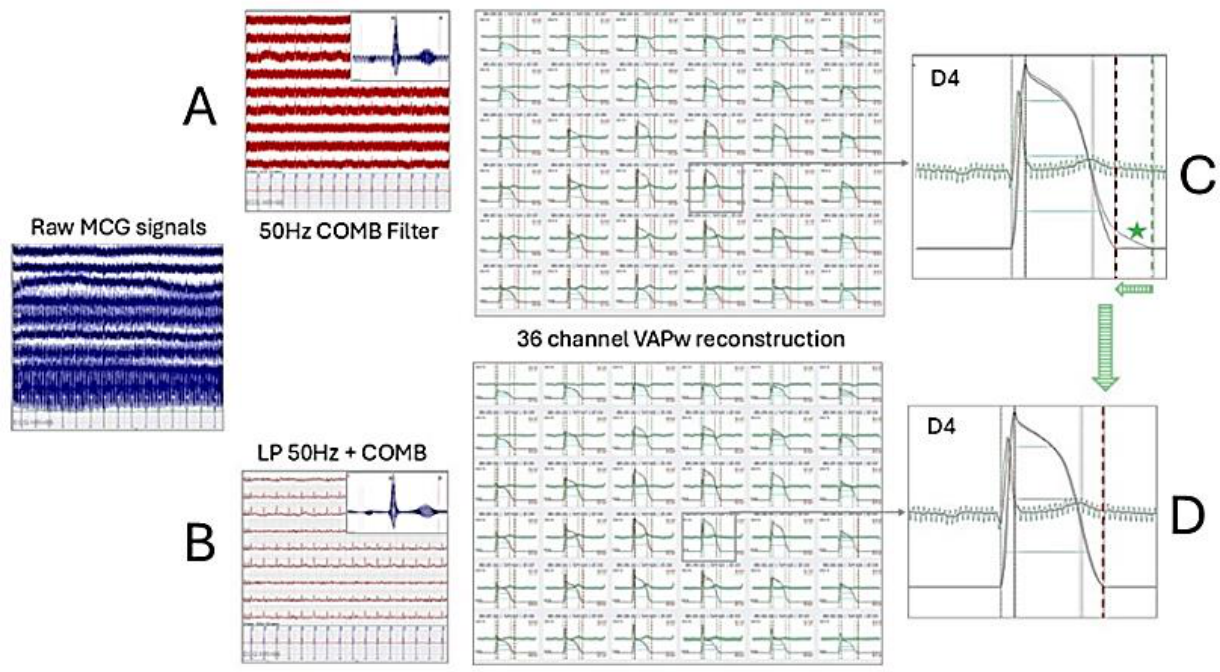
Figure 9.
Evaluation of VAPw reconstruction from unfiltered MCG row data. A) row MCG signals (blue tracings). Partial SNR improvement after averaging (butterfly MCG display). B) Despite high residual 50 Hz noise, the reconstructed VAPw is almost identical to that obtained after adaptive 50 Hz COMB filtering (C).
Figure 9.
Evaluation of VAPw reconstruction from unfiltered MCG row data. A) row MCG signals (blue tracings). Partial SNR improvement after averaging (butterfly MCG display). B) Despite high residual 50 Hz noise, the reconstructed VAPw is almost identical to that obtained after adaptive 50 Hz COMB filtering (C).
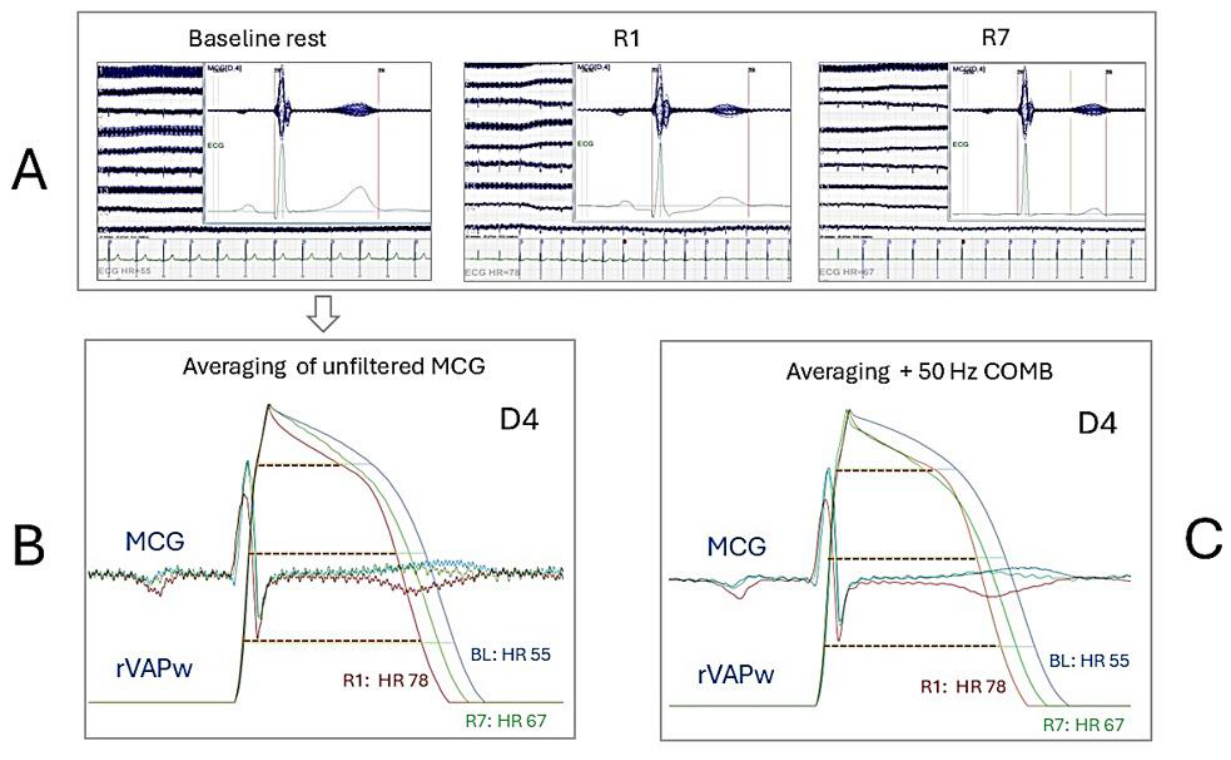

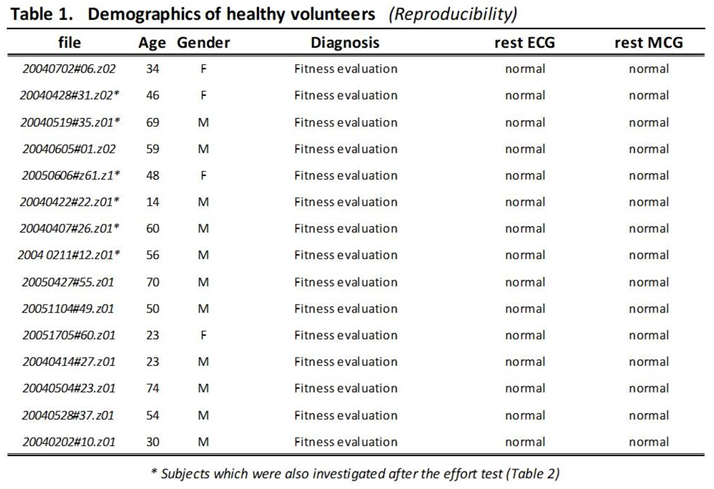 |
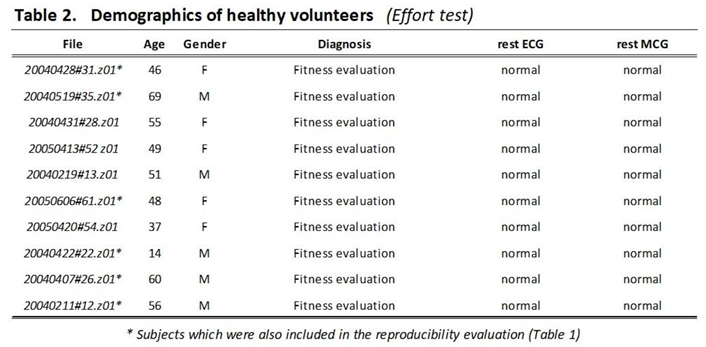 |
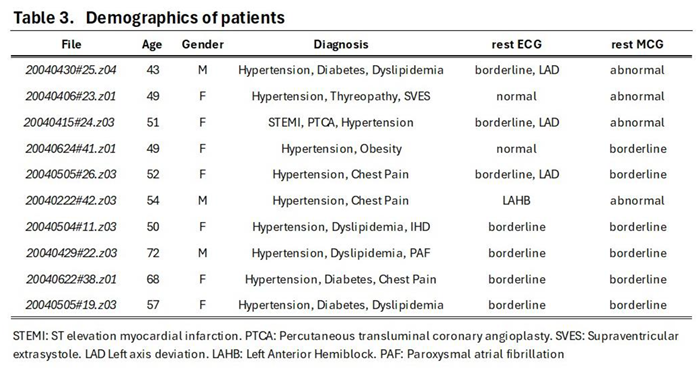 |
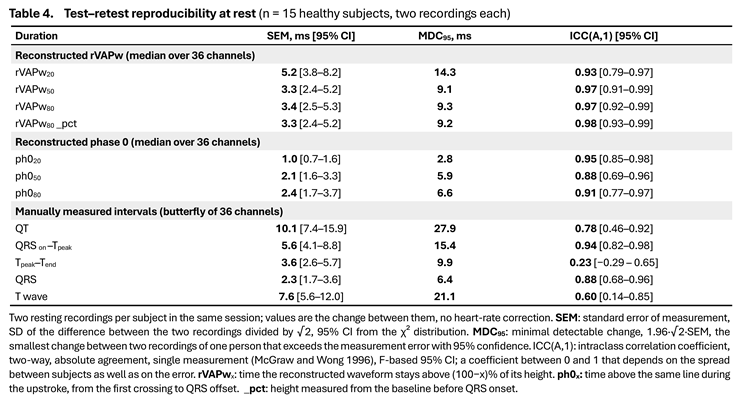 |
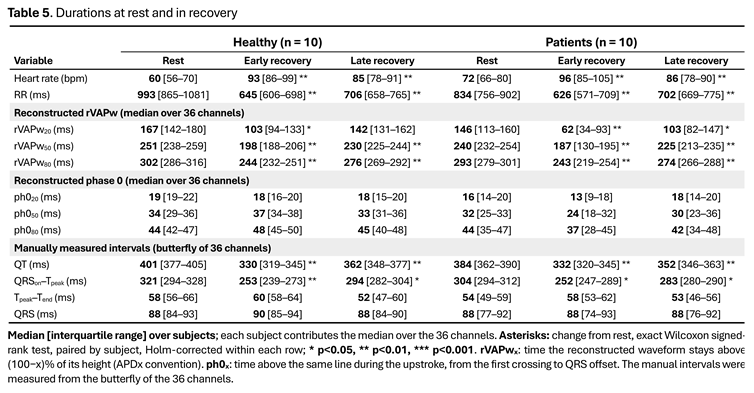 |
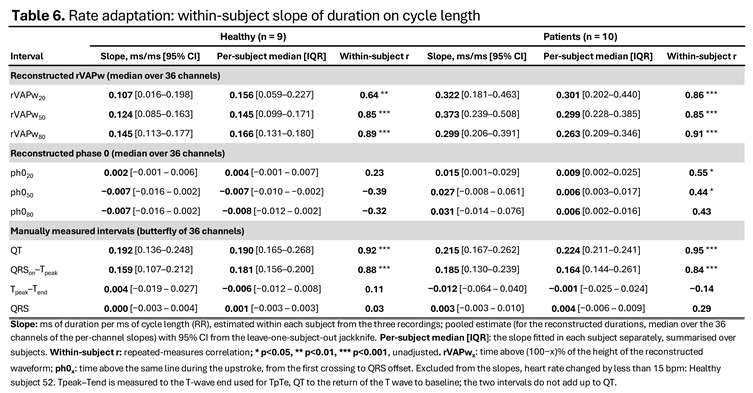 |
Disclaimer/Publisher’s Note: The statements, opinions and data contained in all publications are solely those of the individual author(s) and contributor(s) and not of MDPI and/or the editor(s). MDPI and/or the editor(s) disclaim responsibility for any injury to people or property resulting from any ideas, methods, instructions or products referred to in the content. |
© 2026 by the authors. Licensee MDPI, Basel, Switzerland. This article is an open access article distributed under the terms and conditions of the Creative Commons Attribution (CC BY) license (http://creativecommons.org/licenses/by/4.0/).
Copyright: This open access article is published under a Creative Commons CC BY 4.0 license, which permit the free download, distribution, and reuse, provided that the author and preprint are cited in any reuse.