
Submitted:
26 October 2026
Posted:
29 October 2026
You are already at the latest version
Abstract
Employee surveys and documentary records are seldom examined together, so it is rarely known whether the people who work in a public utility describe it in the way its own records do. This study addresses that question for Himachal Pradesh State Electricity Board Limited (HPSEBL), an Indian state distribution utility, through a convergent mixed-methods design. A stratified survey of 414 employees, analysed by partial least squares structural equation modelling, was set beside documentary indicators for 2014-15 to 2023-24 from the utility's accounts, regulatory orders and national performance ratings, and each construct and each of twelve hypothesised paths was graded against its documentary counterpart under criteria fixed in advance. Both sources show weak finances alongside operations that compare well with national averages. Agreement was strong for financial sustainability, partial or bounded for governance, operations, well-being and sector development, and limited to context for commitment and for six paths that the records cannot observe. In 2022-23 the regulator recorded a surplus of ₹136.44 crore against an accounting loss of ₹1,436.71 crore, and employees' ratings of the finances appear to follow the accounting position more closely than the regulatory one. The study offers a transparent protocol for comparing employee perceptions with documentary records.
Keywords:
mixed methods
; triangulation
; electricity distribution
; soft budget constraint
; regulatory and accounting positions
; employee perceptions
; India
1. Introduction
The views of employees are among the most commonly collected data in management research, and they are usually taken to say something real about the organisation. In a public utility whose accounts, tariff orders and performance ratings are published, that assumption can be checked, because the conditions that employees are asked about are also recorded in documents that do not depend on what any employee thinks. The comparison matters for a practical reason. If employees describe the utility as the records do, a survey of them becomes more credible as a description of the organisation and not only of the respondents. If they do not, either the records leave out something that employees see, or employees lack information that the records contain, and the managerial responses to those two possibilities differ.
Indian distribution utilities are a useful setting for the question because their condition is recorded on several bases that do not always agree. The Power Finance Corporation (PFC) reports on the performance of state utilities every year, the Ministry of Power grades them in an annual integrated rating on financial sustainability, performance and the external environment (Ministry of Power, 2026), and state regulators set their revenue requirements and review their results in tariff orders. A utility can therefore recover its approved costs in one record and make a large loss in another, and employees may be exposed more to one record than to the other. Himachal Pradesh State Electricity Board Limited (HPSEBL), the only distribution company of its state (Himachal Pradesh Electricity Regulatory Commission [HPERC], 2018), shows the pattern. In the ten years from 2014-15 to 2023-24 its accounts recorded a deficit in seven years, and by March 2024 its accumulated losses were ₹3,754.38 crore (₹1 crore = ₹10 million) and its net worth was negative at ₹2,860.11 crore (Himachal Pradesh State Electricity Board Limited [HPSEBL], 2024). Its operating record is better. Its aggregate technical and commercial (AT&C) loss was 10.98 per cent in 2023-24, and in the years for which both figures could be verified its loss levels were about half the national average ("Performance assessment," 2017; "Performance report," 2020). In the 14th integrated rating it was placed in grade B (Ministry of Power, 2026).
This study uses a convergent mixed-methods design to compare what 414 employees of HPSEBL reported about six features of their utility with what the documentary record shows for the same features over ten years. Its question differs from that of an earlier qualitative study of the same utility, which examined how institutional capacity and terrain constrained the implementation of national reform schemes (Thakur & Jain, 2025). The present paper does not revisit staffing, training or terrain as constraints on reform. It asks whether the survey agrees with the records, where the two differ, and what the differences suggest. In the literature reviewed for this study, no comparison of this kind was found for an Indian distribution utility. Studies of utilities rely on records (for example, Josey et al., 2025) or on employee surveys (for example, Kumar & Saha, 2017; Sidhu et al., 2019), and seldom on both.
Three research questions guide the study. First, do the ratings that employees give to the six constructs agree in direction with the documentary indicators that correspond to them? Second, where the two sources differ, what accounts for the difference? Third, does the difference between the regulatory and the accounting position of the utility help to explain how employees rate its finances? The study contributes a rule-based protocol for matching survey constructs with documentary indicators and for grading their agreement, a decade of documentary evidence for a hill-state utility set against the views of its workforce, and a reading of the regulatory–accounting gap as a matter of what employees are placed to see. Section 2 sets out the conceptual background, Section 3 describes the materials and methods, Section 4 reports the documentary record and its comparison with the survey, Section 5 discusses the findings together with the limitations of the study, and Section 6 concludes.
2. Conceptual Background
2.1. How the Condition of a Distribution Utility Is Recorded
The condition of an Indian distribution utility is recorded through several instruments, each with its own purpose. The annual accounts show the surplus or deficit, the balance sheet and the funding of long-term liabilities. Regulatory orders show the revenue that the commission approves for the year and the gap between that revenue and the revenue expected from tariffs, which can be closed through later tariff revisions or carried forward as a regulatory asset (Devaguptapu & Tongia, 2023). The performance reports of PFC and the integrated rating of the Ministry of Power benchmark utilities against one another and against national norms (Ministry of Power, 2025, 2026). Josey et al. (2025) show that distribution utilities borrow heavily to meet day-to-day costs and that the resulting liabilities limit their capacity to invest. Rescue schemes have been built on these records. Under the Ujwal DISCOM Assurance Yojana (UDAY), states took over part of the debt of their utilities in exchange for commitments on losses and tariffs (Kaur & Chakraborty, 2018), and the results were mixed (Kumar, 2021).
For the question of this paper, the important point is that these records need not agree and that they reach different audiences. The regulatory position is set out in orders that are read mainly by the commission, the utility's regulatory staff and specialists. The accounting position appears in the annual accounts and, in a more personal form, in the pay, pension and promotion decisions that affect employees directly. Employees may therefore be better placed to observe the second than the first.
2.2. The Soft Budget Constraint and the Unequal Discipline of Operating and Financial Results
The theory of the soft budget constraint offers a way of reading a utility that meets many operating targets and still shows persistent financial stress. A budget constraint is soft when the managers of an enterprise expect that its losses will be met by an outside party, usually the state, so that spending is not held to the revenue that the enterprise earns (Kornai, 1986; Kornai et al., 2003). Studies of Indian distribution describe rescues of state utilities that were not matched by accountability for results (Chitnis et al., 2012), and the political economy of electricity in the states shows that tariff and regulatory decisions reflect political as well as technical considerations (Dubash & Rao, 2008; Dubash et al., 2018). In this study regulatory forbearance means carrying forward the gap between cost and revenue instead of closing it in the year in which it arises. Operating results such as loss levels are tested every year against targets, whereas financial results can be carried by borrowing and by later tariff revisions. The weakness of the balance sheet can therefore stay visible to employees even in years when operations compare well. The theory is used here only as a lens for reading the comparison, because the records do not show what managers or employees expected from the state.
2.3. Perceptions, Records and the Choice of a Convergent Design
Research on public organisations has often relied on perceptions, for example when employee-reported performance is related to commitment and motivation (Brewer & Selden, 2000; Kim, 2005). Perceptions matter in their own right, because an employee's attachment depends on what the employee believes the employer provides and owes (Rousseau, 1989; Robinson & Rousseau, 1994; Rhoades & Eisenberger, 2002). They are also usable evidence about the organisation. Wall et al. (2004) tested subjective and objective measures of company performance in three samples and found that the two were positively related, that the relationship was stronger than that between different performance aspects measured by the same method, and that both kinds of measure related to other variables in similar ways. Two cautions follow from the public-sector literature. Performance in public organisations is multifaceted, since such organisations pursue several goals, some of which conflict (Andrews et al., 2006), so that employees can rate one aspect high and another low without inconsistency, which is the pattern expected here. And reports collected from a single source are exposed to common-source bias, which can produce spurious relationships (Meier & O'Toole, 2013; Podsakoff et al., 2003). Records offer an independent check on both counts.
Methodologists describe the value of combining sources in similar terms. Jick (1979) presented triangulation as a way of testing whether findings depend on the method that produced them, and Greene et al. (1989) distinguish triangulation, in which agreement between independent sources raises confidence in a finding, from initiation, in which disagreement prompts an explanation that neither source would suggest alone. A design that collects the two strands separately and compares them at the stage of interpretation is a convergent design (Creswell & Plano Clark, 2018; Bryman, 2016). Fetters et al. (2013) describe three ways of reporting such integration at the interpretation stage: narrative, data transformation and joint display. This study uses a narrative and two joint displays (Table 5 and Table 6). The design suits the question because the two strands have different units of observation, the individual employee at one point in time and the whole utility over a decade, so that they can be compared in direction and pattern but not matched case by case.
3. Materials and Methods
3.1. The Survey Strand
The population was the 18,130 employees of HPSEBL, comprising regular, contractual, outsourced, daily-wage and other categories according to the utility's Annual Administrative Report, which served as the sampling frame. It was divided into five functional strata (technical, finance and accounts, administrative and information technology, contractual and outsourced, and managerial), and respondents were drawn from employee lists by simple random selection within each stratum at a uniform sampling rate of 2.3 per cent. Cochran's (1977) formula for a proportion, at 95 per cent confidence, a 5 per cent margin of error and a finite population correction, gave 376, and a 6.4 per cent allowance for unusable returns raised the target to 400. Of 450 questionnaires distributed, 414 were complete and usable, a response rate of 92 per cent that is higher than the averages reported for organisational research (Baruch & Holtom, 2008). Of the respondents, 81.6 per cent were men, 61.6 per cent had eleven or more years of service, 46.1 per cent were graduates and 23.7 per cent were contractual or outsourced workers.
The instrument had 33 reflective items in English and Hindi, rated on a five-point agreement scale, for six constructs: governance and regulatory compliance (GRC, three items), financial sustainability (FS, seven), operational efficiency (OE, seven), employee well-being (EWB, five), organisational commitment (OC, five) and power sector development (PSD, six), and the full wording of the items is given in Supplementary Table S1. Items on commitment follow established measures of affective and attitudinal commitment (Allen & Meyer, 1990; Mowday et al., 1979), and the other items were written from concepts and indicators documented in the literature. A draft of 45 items was reviewed by two academics and two senior officials of the utility and tested on a pilot of 30 employees, after which 12 items were removed. Participation was voluntary and anonymous, questionnaires were distributed on paper to field staff and online to other staff, and the survey was conducted at a single point in time during the course of this study. Returned questionnaires were screened for incomplete, straight-line and inconsistent responses. Early and late respondents did not differ significantly on the constructs compared (Armstrong & Overton, 1977), and in Harman's single-factor test the largest factor explained 40.03 per cent of the variance, below the 50 per cent guideline (Podsakoff et al., 2003).
The model was estimated by partial least squares structural equation modelling in SmartPLS 4 (version 4.1.1.7; Ringle et al., 2024), with 5,000 bootstrap subsamples and the two-stage assessment recommended by Hair et al. (2017). The measurement model was adequate (Table 1). Twenty-nine of the 33 loadings were at or above 0.70, with an average of 0.793, and the four lower loadings (0.624 to 0.693) were retained for content validity. Reliability and convergent validity met the usual thresholds, and the highest heterotrait–monotrait ratio, 0.809, was below 0.85 (Henseler et al., 2015). The twelve hypotheses of the structural model link governance to finances and operations (H1, H2), finances and operations to well-being (H3, H4), well-being to commitment (H5), commitment to sector development (H6), finances and operations to sector development directly (H7, H8), and four mediated paths through well-being and commitment (H9 to H12). All twelve were supported at p ≤ 0.001, and the model explained 55.2 per cent of the variance in well-being, 50.8 per cent in sector development, 40.6 per cent in commitment, 27.6 per cent in financial sustainability and 11.2 per cent in operational efficiency. The comparison below uses the mean of each construct, its position relative to the scale midpoint of 3.0, and the standardised coefficients of the twelve paths. The position relative to the midpoint is descriptive and was not tested statistically. Figure 1 shows the structural model with the direct paths and the variance explained.
3.2. The Documentary Strand
The documentary record covers the ten years from 2014-15 to 2023-24. It consists of the annual reports of HPSEBL for 2014-15 to 2021-22, its annual financial result for 2022-23 and its consolidated balance sheet for 2023-24 (HPSEBL, 2015, 2017, 2018, 2019, 2020, 2021, 2022, 2023, 2024); four tariff and review orders of the Himachal Pradesh Electricity Regulatory Commission (HPERC, 2018, 2019, 2022, 2025); the performance reports of the Power Finance Corporation (PFC, 2016, 2020, 2024, 2025); and the 14th integrated rating of the Ministry of Power (2026). Where a figure is derived from two reported figures by a standard formula, the derivation follows the definition in the note to the table. Four features of the record affect how it can be read. The balance sheet figures for 2022-23 and 2023-24 are consolidated and are marginally higher than standalone figures. The AT&C series starts in 2015-16 because the Central Electricity Authority revised its method from 2016-17 and the earlier figure is not comparable. The funding of the pension liability is reported in only two years. And net worth is negative from 2016-17, the first year in which the accounts were prepared under the Indian Accounting Standards (Ind AS), so that comparisons of net worth over time should allow for the change of basis.
The decade does not move in one direction, and it is divided into four phases that follow the main events in the record. Phase 1 covers 2014-15 and 2015-16, before UDAY (Kaur & Chakraborty, 2018). Phase 2 covers 2016-17 to 2019-20, the UDAY years, in which the accounts recorded small profits in three consecutive years. Phase 3 covers 2020-21 to 2022-23, which combines the COVID-19 restrictions that the World Bank (2023) links to a deterioration in losses with the settlement of arrears from a pay revision. Phase 4 covers 2023-24, in which the Revamped Distribution Sector Scheme (RDSS) was being implemented (Press Information Bureau [PIB], 2021).
3.3. Matching Rule and Grading of Agreement
For the comparison to be meaningful, each construct must be matched with documentary indicators that refer to the same concept. Table 2 sets out the correspondence. The rule for judging agreement was fixed before the comparison was made. The direction of each survey result, that is whether employees rate a construct above or below the midpoint, was compared with the direction of the documentary indicators over the period, and agreement was graded by the criteria in Table 3. A path between two constructs was graded only when both constructs have a documentary counterpart in Table 2, whether direct or a proxy of conditions. Organisational commitment has no such counterpart, so that every path involving it is graded context only. Divergences were treated as results to be explained through timing, accounting basis or the limits of what each source can observe, and not as errors in either strand (Greene et al., 1989). The grading was done by one researcher, which is a limitation noted in Section 5.5, and the criteria are stated in full so that others can apply them.
3.4. Ethical Conduct
The survey was carried out as part of the first author's doctoral programme at Banasthali Vidyapith, under the ethical approval reported in the Institutional Review Board Statement at the end of this article, and with written administrative permission from the utility. Participation was voluntary and anonymous, informed consent was obtained through the opening note of the questionnaire, and no personal identifiers were recorded. The documentary strand uses only published records.
4. Results
4.1. The Documentary Record
Table 4 summarises the five indicators that carry most of the comparison: the net result of the accounts, the current ratio, the employee cost ratio, the margin by which the actual transmission and distribution (T&D) loss differed from the HPERC target, and the AT&C loss. The AT&C series begins in 2015-16, and the table starts in that year so that every cell has a value.
4.1.1. Finances
The accounts showed a deficit in seven of the ten years, and the current ratio stayed between 0.439 and 0.685, below the benchmark of 1.0, in every year. Net worth was negative from 2016-17 and reached ₹(2,860.11) crore in 2023-24, when accumulated losses stood at ₹3,754.38 crore (HPSEBL, 2024). Finance cost fell from ₹535.52 crore in 2014-15 to ₹408.63 crore in 2018-19, the clearest benefit of the UDAY years in the accounts. Accumulated losses fell by ₹523.25 crore between 2016-17 and 2019-20, although most of that fall was recorded in 2017-18, when the profit was only ₹3.66 crore, and it reads as a balance sheet adjustment and not as an operating gain. On the accounts basis, revenue from sales did not cover the full cost of supply in any year from 2015-16 to 2023-24. The pension liability was 6.3 per cent funded in 2019-20 and 9.6 per cent in 2021-22 (HPSEBL, 2020, 2022), which left ₹1,171.93 crore and ₹967.66 crore unfunded. The employee cost ratio was above the benchmark in every year, even before the pay-revision arrears of 2022-23.
4.1.2. Regulation and Operations
HPSEBL met or beat the T&D loss target set by HPERC in all five years of the third multi-year tariff (MYT) period, 2014-15 to 2018-19, and missed it in all five years of the fourth, 2019-20 to 2023-24, although the margin narrowed from 3.92 percentage points in 2020-21 to 0.79 in 2023-24. The fourth-period targets were set lower than those of the third period, and the pandemic fell in the first two years of the period. The AT&C loss was 48 to 50 per cent below the national average in 2015-16, 2017-18 and 2018-19, when it was 12.56, 11.08 and 11.39 per cent against national averages of 23.98, 22.33 and 22.01 per cent ("Performance assessment," 2017; "Performance report," 2020). It rose to 16.42 per cent in 2019-20 and fell to 10.57 per cent in 2022-23. Collection efficiency was 98.99 per cent or more in every year, but billing efficiency, which lay between 83.58 and 89.79 per cent, stayed below the benchmark of 92 per cent throughout (PFC, 2024).
The regulatory position was mixed in the first half of the decade and became a surplus in later years. HPERC recorded a regulatory surplus of ₹122.95 crore for 2018-19, a final surplus of ₹136.44 crore for 2022-23 and a surplus of ₹172.72 crore for 2023-24 (HPERC, 2018, 2019, 2022, 2025). In 2022-23 the accounts of HPSEBL showed the largest loss of the decade, ₹1,436.71 crore, because of a provision for pay-revision arrears (HPSEBL, 2023). The Ministry of Power (2026) reports that the cash-adjusted gap between the cost of supply and the revenue realised narrowed from ₹0.74 per unit in 2022-23 to ₹0.34 per unit in 2023-24, and it placed HPSEBL in grade B with a score of 53.69 in the 14th integrated rating, up from grade B- and a score of 47.87 in the 13th. Figures for 2024-25 lie outside the period and are not used, although the state government announced a profit for that year (Press Trust of India, 2025) and CARE Ratings Ltd. (2026) reports a consolidated profit after tax on a different basis.
4.2. Construct-level comparison
Table 5 sets the survey result for each construct beside the documentary evidence and gives the grade, and Figure 2 summarises the means and grades. Employees rated governance, operations and development above the scale midpoint and rated finances and their own well-being below it, and they rated commitment above it. The documents show the same split between operations and finances, because the utility was strong on operating measures relative to national averages and weak on financial measures throughout the decade. The differences between the sources lie in the detail.

Table 5.
Construct-level comparison of the survey and the documentary evidence.
| Construct | Survey result | Documentary evidence | Grade |
|---|---|---|---|
| Governance and regulatory compliance | Mean 3.84, above the midpoint | HPERC loss targets met or beaten in all five years of the third MYT period and missed in all five of the fourth; regulatory surpluses for 2018-19, 2022-23 and 2023-24; grade B in the 14th integrated rating | Partial |
| Financial sustainability | Mean 2.67, the lowest of the six | Deficit in seven of ten years; accumulated losses of ₹3,754.38 crore and net worth of ₹(2,860.11) crore in 2023-24; current ratio below 1.0 in every year; pension liability 6.3 per cent funded in 2019-20 and 9.6 per cent in 2021-22 | Strong |
| Operational efficiency | Mean 3.92, the highest of the six | AT&C loss of 10.57 per cent in 2022-23 and 10.98 per cent in 2023-24, and about half the national average in the years verified; billing efficiency below the 92 per cent benchmark in every year; fourth-period T&D targets missed | Bounded |
| Employee well-being | Mean 2.89, below the midpoint | Proxy conditions only: employee cost ratio of 23.39 to 40.35 per cent against a benchmark of 15 to 20 per cent; pension liability largely unfunded; ₹850.56 crore provision for pay-revision arrears in 2022-23 | Partial |
| Organisational commitment | Mean 3.61, above the midpoint | No documentary counterpart; the T&D target was met in all five years of the third MYT period despite negative net worth from 2016-17, and AT&C loss fell in the year of the largest deficit, which is noted descriptively | Context only |
| Power sector development | Mean 3.78, above the midpoint | AT&C loss 48 to 50 per cent below the national average in three verified years and down from 16.42 per cent in 2019-20 to 10.98 per cent in 2023-24; collection efficiency of 98.99 per cent or more; grade B | Partial |
Note. Grades follow the criteria in Table 3.
4.3. Where the Two Sources Agree
The clearest agreement concerns financial sustainability. Employees gave it the lowest mean of the six constructs, and the accounts show why: deficits in seven years, liquidity below the benchmark in every year, negative net worth from 2016-17 and a pension liability that was more than 90 per cent unfunded in both years for which it is reported. Because the two sources agree in direction and in magnitude, the low rating is better read as a response to the financial position of the utility than as an effect of the wording of the questions.
A second agreement concerns the order of the constructs. Employees rated operations, governance and development above finances and well-being, and the documents show the same order, since AT&C loss was about half the national average in the verified years while the finances were weak throughout. The agreement is partial for governance and development and bounded for operations, because HPERC targets were missed in the fourth period and billing efficiency never reached its benchmark. That responses differ across constructs in the same way as the documents also suggests that respondents distinguished between the constructs and did not give the same answer to every item. This is the multifaceted pattern that the public-sector performance literature would lead one to expect (Andrews et al., 2006).
A third agreement concerns governance and finances together. The survey shows a positive path from governance and regulatory compliance to financial sustainability (β = 0.525), and the record is consistent with it in the third MYT period, when targets were met, finance costs fell, the accounts showed small profits from 2017-18 to 2019-20 and a regulatory surplus was recorded for 2018-19. In the fourth period targets were missed and deficits returned from 2020-21. The two series moved together over the decade, as the survey path would lead one to expect, but annual figures for one utility cannot show which moved first, so the agreement is graded partial.
4.4. Where the Two Sources Differ
Three differences call for explanation, and each explanation offered is a possible reading that the data cannot test.
The first is the persistence of low financial ratings despite improving accounts. Between 2016-17 and 2019-20 finance costs fell, accumulated losses fell by ₹523.25 crore, net worth rose from ₹(870.02) crore to ₹(748.44) crore and three small profits were recorded, yet the survey finds financial sustainability at 2.67. Three points help to explain this. The improvement was small relative to the constraints that remained, since in 2019-20 the pension liability was only 6.3 per cent funded, the current ratio was 0.685 and the employee cost ratio was 28.0 per cent. Most of the fall in accumulated losses was recorded in a year with a profit of only ₹3.66 crore, which is a balance sheet adjustment and not a gain that employees would have noticed. And the accounts worsened again from 2020-21, so respondents may have rated the whole period and not its best years. The survey cannot show how views changed over time, and its date cannot be matched to a single year of the record, so repeated surveys would be needed to test this reading.
The second difference is that commitment is rated higher than well-being. Employees rated organisational commitment at 3.61, against 2.89 for well-being and 2.67 for finances, and the documents show that operations were kept at a good level in years of financial strain: AT&C loss fell from 12.90 per cent in 2021-22 to 10.57 per cent in 2022-23, the year of the largest deficit. This does not contradict the survey path from well-being to commitment (β = 0.637), because that path means that employees with higher well-being report higher commitment, and the average level of commitment can still exceed the average level of well-being. It does raise the question of why commitment is not lower. Commitment can rest on reasons other than satisfaction with pay and security, such as a sense of obligation to stay or a wish to serve the public (Meyer & Allen, 1991; Perry & Wise, 1990; Perry, 1996). The survey did not measure these reasons, so the explanation is a proposal for later research.
The third difference lies within the documents themselves. In 2022-23 the accounts showed a loss of ₹1,436.71 crore, mainly because of a provision for pay-revision arrears, while HPERC recorded a regulatory surplus of ₹136.44 crore for the same year, and the PFC report gave a net worth of ₹(1,362) crore on its own basis, better than the ₹(1,706) crore of 2020-21 (HPERC, 2025; HPSEBL, 2023; PFC, 2024). Employees see their pay, retirement benefits and the accounts of their own institution more directly than they see regulatory orders, so it is possible that their view of the finances follows the accounting position more closely than the regulatory position. The strong path from financial sustainability to well-being (β = 0.666) is consistent with this, since well-being is formed in the pay and pension decisions that the accounts record. The reading is an inference. The survey did not ask which records respondents used, and a direct test would ask them.
4.5. Hypothesis-Level Assessment
Table 6 applies the criteria of Table 3 to the twelve hypotheses, all of which were supported in the survey. One path agrees strongly with the documents, five agree partially or within limits, and six cannot be tested with documents. This does not weaken the survey results, which stand on the survey data and its tests. It shows that documents are best used to describe the setting of the paths and to check the constructs that have documentary counterparts, namely finances, governance and operations. Every path that involves commitment, including the mediation paths, can be tested only with survey data.
Table 6.
Hypothesis-level agreement between the survey and the documentary evidence.
| Hypothesis | Path | β | Grade |
|---|---|---|---|
| H1 | Governance → financial sustainability | 0.525 | Partial |
| H2 | Governance → operational efficiency | 0.335 | Bounded |
| H3 | Financial sustainability → well-being | 0.666 | Strong |
| H4 | Operational efficiency → well-being | 0.131 | Partial |
| H5 | Well-being → commitment | 0.637 | Context only |
| H6 | Commitment → power sector development | 0.433 | Context only |
| H7 | Financial sustainability → power sector development | 0.274 | Partial |
| H8 | Operational efficiency → power sector development | 0.161 | Partial |
| H9 | Financial sustainability → well-being → commitment | 0.425 | Context only |
| H10 | Well-being → commitment → power sector development | 0.276 | Context only |
| H11 | Governance → finances → well-being → commitment → development | 0.097 | Context only |
| H12 | Operational efficiency → well-being → commitment | 0.083 | Context only |
Note. β = standardised path coefficient (H1 to H8) or specific indirect effect (H9 to H12) from the survey model described in Section 3.1. Grades follow Table 3.
Two grades merit a word. For H4 the documents show that operating results varied from year to year, with the T&D loss at 14.02 per cent in 2020-21 and 10.29 per cent in 2023-24, whereas the proxy conditions for well-being, an employee cost ratio above its benchmark and a largely unfunded pension, persisted in every year. That difference in persistence is consistent with the smaller effect of operations on well-being (β = 0.131), although the proxies do not measure well-being. For H8 the same loss indicators serve both constructs, so the documents cannot separate them, which is why the grade is partial.
5. Discussion
5.1. One Picture From Two Sources
Read together, the two sources give one consistent picture of HPSEBL: a utility whose finances are weak and whose operations compare well with national averages. The records point to the finances as the main constraint, and the survey does not show weak commitment, which stands at 3.61. Measures aimed only at the behaviour or motivation of employees are therefore unlikely to be enough unless the financial constraints, such as the funding of pensions and the cost of past debt, are also addressed. This is a reading of the evidence of this study and should be tested before it is generalised.
5.2. A Lens: Operating Discipline and Financial Discipline
The combination of low losses and persistent financial stress can be read through the soft budget constraint (Kornai, 1986; Kornai et al., 2003). The records of HPSEBL are consistent with the reading in three respects, although they cannot test it. Operating discipline was visible and checked, because the losses that HPERC monitors against annual targets and that the integrated rating scores were kept low. Financial discipline appears less binding, since deficits occurred in seven of ten years, net worth was negative from 2016-17 and total debt rose from ₹4,209.53 crore in 2014-15 to ₹6,005.10 crore in 2023-24, the last figure being consolidated. And the regulatory position showed surpluses in years when the accounts showed large losses. The last difference is consistent with forbearance as defined in Section 2.2, and it is equally consistent with the recovery of costs through tariff revisions over several years. The records do not show which applies. Other explanations of the financial stress, such as terrain, the arrangements for free power and the arrears of the pay revision, also remain open (World Bank, 2023). The lens helps to explain why a utility that meets many of its operating targets can still be rated low on its finances by its own employees, and it is consistent with the survey means of 3.92 for operational efficiency and 2.67 for financial sustainability.
5.3. Implications for Theory and Method
For theory, the comparison supports the view that employees' judgements of their employer reflect the conditions that bear on them personally. In the language of the psychological contract, what employees perceive the employer to owe them is formed from the evidence they see (Rousseau, 1989; Robinson & Rousseau, 1994), and in this utility that evidence appears to be the accounting position and the funding of benefits more than the regulatory orders. For method, the study offers three lessons. The first concerns timing. The survey was taken at one point in time whereas the documents cover ten years, and the gap between improved accounts and low financial ratings shows that perceptions may reflect experience over many years and not only the latest year, so repeated surveys would help to separate the two (Creswell & Plano Clark, 2018). The second concerns the choice of financial framework. The regulatory and accounting positions differed in 2022-23, so a study of a distribution utility should state which it uses and should report both when they differ. The third concerns the limits of documents. They corroborated the constructs of finances, governance and operations, but they could not test the paths through commitment, for which interviews or a second survey would add evidence.
5.4. Implications for Practice
The practical implication concerns information. The survey shows that employees rate the finances of the utility low, and the survey model shows that a higher rating of finances goes with a higher rating of well-being, commitment and development. The records show that the regulatory position improved in 2022-23 and 2023-24 and that the cash gap per unit narrowed (Ministry of Power, 2026). If the regulatory position and the one-time nature of the arrears of 2022-23 were explained to employees, their view of the finances might become better informed. The effect on the other constructs cannot be predicted from this study, because the model describes associations and not the result of an intervention. Utilities that report on more than one financial basis could also publish a short reconciliation of the bases for their staff each year.
5.5. Limitations and Directions for Future Research
Several limits should be kept in mind. The documents describe the utility as a whole and cannot be linked to individual respondents, and the survey records perceptions at one point in time that cannot be matched to a single year of the record, so the study can show whether the two strands are consistent but cannot show that one causes the other. The survey is exposed to common-source bias, which the design and the single-factor test reduce but cannot remove (Meier & O'Toole, 2013; Podsakoff et al., 2003). The grades rest on the judgement of one researcher, although the criteria were fixed in advance and are given in full, and no independent second coder was used. The position of each construct relative to the scale midpoint is descriptive and was not tested. Organisational commitment and six paths could not be tested with documents. The documentary figures follow different bases in different years, including the change to Ind AS and the consolidated figures of the last two years, and the loss measures of HPERC and PFC are defined differently and should not be compared year by year. HPSEBL also operates its own hydroelectric stations and receives free power from the state, so the cost and loss figures describe the whole network and not the distribution business alone, and comparisons with utilities that buy all of their supply need care (World Bank, 2023). The study covers one utility, and the soft budget constraint is offered as a lens and not as a finding. Future research could repeat the survey over several years and match each wave to the records of the same year, ask employees directly which financial records they rely on, interview employees and managers to test the explanations offered for the three divergences, and apply the protocol to utilities in other states.
6. Conclusions
This study asked whether employees of a state distribution utility describe it as its records do. For the most part they do. Both sources describe a utility with weak finances and operations that compare well with national averages, and the agreement is strongest where the documents offer the most direct counterpart, financial sustainability. Three differences emerged, and each points to the question of what employees are placed to see. Employees rated the finances of the utility low even when the accounts improved, they reported commitment above their well-being, and their ratings appear to follow the accounting position more closely than the regulatory position. The practical message is that a utility reporting on more than one financial basis gains from explaining the difference to its staff, because the way employees read its finances is related to how they rate their well-being, commitment and the development of the sector. The protocol used here fixes the matching rule and the grading criteria in advance and can be applied to other utilities and other years.
Author Contributions
Conceptualization, R.T. and N.J.; methodology, R.T. and N.J.; software, R.T.; validation, R.T. and N.J.; formal analysis, R.T.; investigation, R.T.; resources, R.T.; data curation, R.T.; writing—original draft preparation, R.T.; writing—review and editing, N.J. and R.T.; visualization, R.T.; supervision, N.J.; project administration, R.T. All authors have read and agreed to the published version of the manuscript.
Funding
This research received no external funding.
Institutional Review Board Statement
The study was conducted in accordance with the Declaration of Helsinki and approved by the Banasthali Vidyapith.
Informed Consent Statement
Informed consent was obtained from all subjects involved in the study. The opening note of the questionnaire explained the purpose of the study, stated that participation was voluntary and anonymous, and recorded consent before any question was answered; no personal identifiers were collected.
Data Availability Statement
The survey data presented in this study are available on reasonable request from the corresponding author, because the responses were collected from employees of HPSEBL under an assurance of anonymity and under an administrative permission from the utility that does not extend to public release. The documentary data were taken from publicly available records of HPSEBL, the Himachal Pradesh Electricity Regulatory Commission, the Power Finance Corporation and the Ministry of Power, all of which are listed in the References.
Acknowledgments
The authors thank the management of HPSEBL for permission to conduct the survey and the employees who took part in it.
Conflicts of Interest
The authors declare no conflicts of interest.
References
- Allen, N.J.; Meyer, J.P. The measurement and antecedents of affective, continuance and normative commitment to the organization. J. Occup. Psychol. 1990, 63, 1–18. [Google Scholar] [CrossRef]
- Andrews, R.; Boyne, G.A.; Walker, R.M. Subjective and objective measures of organizational performance: An empirical exploration. In Public service performance: Perspectives on measurement and management; Boyne, G. A., Meier, K.J., O'Toole, L.J., Jr., Walker, R. M., Eds.; Cambridge University Press, 2006; pp. 14–34. [Google Scholar] [CrossRef]
- Armstrong, J.S.; Overton, T.S. Estimating nonresponse bias in mail surveys. J. Mark. Res. 1977, 14, 396–402. [Google Scholar] [CrossRef]
- Baruch, Y.; Holtom, B.C. Survey response rate levels and trends in organizational research. Hum. Relat. 2008, 61, 1139–1160. [Google Scholar] [CrossRef]
- Brewer, G.A.; Selden, S.C. Why elephants gallop: Assessing and predicting organizational performance in federal agencies. J. Public Adm. Res. Theory 2000, 10, 685–712. [Google Scholar] [CrossRef]
- Bryman, A. Social research methods, 5th ed.; Oxford University Press, 2016. [Google Scholar]
- CARE Ratings Ltd. (2026, April 9). Press release: Himachal Pradesh State Electricity Board Limited. Available online: https://www.careratings.com/upload/CompanyFiles/PR/202604150400_HIMACHAL_PRADESH_STATE_ELECTRICITY_BOARD_LIMITED.pdf.
- Chitnis, A.; Dixit, S.; Josey, A. Bailing out unaccountability. Econ. Political Wkly. 2012, 47, 22–25. Available online: https://energy.prayaspune.org/images/pdf/bailing_out_unaccountability.pdf.
- Cochran, W.G. Sampling techniques, 3rd ed.; John Wiley & Sons, 1977. [Google Scholar]
- Creswell, J.W.; Plano Clark, V.L. Designing and conducting mixed methods research, 3rd ed.; SAGE, 2018. [Google Scholar]
- Devaguptapu, R.; Tongia, R. 2023. Breaking down the gap in DisCom finances: Explaining the causes of missing money (CSEP Impact Series 012023-01). Centre for Social and Economic Progress. Available online: https://csep.org/wp-content/uploads/2023/05/Breaking-Down-the-Gap-in-DisCom-Finances.pdf.
- Dubash, N.K.; Rao, D.N. Regulatory practice and politics: Lessons from independent regulation in Indian electricity. Util. Policy 2008, 16, 321–331. [Google Scholar] [CrossRef]
- Dubash, N.K.; Kale, S.S.; Bharvirkar, R. (Eds.) Mapping power: The political economy of electricity in India's states; Oxford University Press, 2018. [Google Scholar]
- Fetters, M.D.; Curry, L.A.; Creswell, J.W. Achieving integration in mixed methods designs: Principles and practices. Health Serv. Res. 2013, 48, 2134–2156. [Google Scholar] [CrossRef] [PubMed]
- Fornell, C.; Larcker, D.F. Evaluating structural equation models with unobservable variables and measurement error. J. Mark. Res. 1981, 18, 39–50. [Google Scholar] [CrossRef]
- Greene, J.C.; Caracelli, V.J.; Graham, W.F. Toward a conceptual framework for mixed-method evaluation designs. Educ. Eval. Policy Anal. 1989, 11, 255–274. [Google Scholar] [CrossRef]
- Hair, J.F.; Hult, G.T.M.; Ringle, C.M.; Sarstedt, M. A primer on partial least squares structural equation modeling (PLS-SEM), 2nd ed.; SAGE, 2017. [Google Scholar]
- Henseler, J.; Ringle, C.M.; Sarstedt, M. A new criterion for assessing discriminant validity in variance-based structural equation modeling. J. Acad. Mark. Sci. 2015, 43, 115–135. [Google Scholar] [CrossRef]
- Himachal Pradesh Electricity Regulatory Commission. (2018, May 4). Fourth annual performance review order for the third MYT control period (FY 2014-15 to FY 2018-19), determination of tariff for FY 2018-19 and true-up of FY 2015-16 for HPSEBL. Available online: https://hperc.org/wp-content/uploads/file/to%20FY18-19.pdf.
- Himachal Pradesh Electricity Regulatory Commission. (2019, June 29). Multi year tariff order for HPSEBL for the fourth control period (FY 2019-20 to FY 2023-24) and true-up of FY 2016-17 (Petition No. 28/2019). Available online: https://hperc.org/wp-content/uploads/file/Distribution19.pdf.
- Himachal Pradesh Electricity Regulatory Commission. (2022, March 29). Mid-term performance review order for the fourth MYT control period (FY 2019-20 to FY 2023-24) and determination of tariff for FY 2022-23 for HPSEBL. Available online: https://hperc.org/wp-content/uploads/file/ftariff22-23.pdf.
- Himachal Pradesh Electricity Regulatory Commission. (2025, March 28). Determination of aggregate revenue requirement and tariff for FY 2025-26 and final true-up of FY 2022-23 (fourth MYT control period) for HPSEBL (Petition No. 156 of 2024). Available online: https://hperc.org/wp-content/uploads/file/tariff2025-26.pdf.
- Himachal Pradesh State Electricity Board Limited. Annual report 2014-15 (6th annual report). 2015.
- Himachal Pradesh State Electricity Board Limited. Annual report 2015-16 (7th annual report). 2017.
- Himachal Pradesh State Electricity Board Limited. Annual report 2017-18 (9th annual report). 2018. Available online: https://webdocuploader.hpseb.in/uploader/download2.php?link=/portal/bse/Final%20Annual%20Report%202017-18.pdf.
- Himachal Pradesh State Electricity Board Limited. Annu. Rep. 2018-19 (10th annual report) 2019. [CrossRef]
- Himachal Pradesh State Electricity Board Limited. Annu. Rep. 2019-20 (11th annual report) 2020. [CrossRef] [PubMed]
- Himachal Pradesh State Electricity Board Limited. Annu. Rep. 2020-21 (12th annual report) 2021. [CrossRef]
- Himachal Pradesh State Electricity Board Limited. Annual report 2021-22 (13th annual report). 2022. Available online: https://webdocuploader.hpseb.in/uploader/download2.php?link=/portal/bse/Annual%20Report%202022.pdf.
- Himachal Pradesh State Electricity Board Limited. Audited financial results (standalone and consolidated) for the year ended 31 March 2023. 2023. Available online: https://webdocuploader.hpseb.in/uploader/download2.php?link=/portal/bse/Annual%20Financial%20Result%202023.pdf.
- Himachal Pradesh State Electricity Board Limited. Consolidated balance sheet as at 31 March 2024 (approved by the Board of Directors). 2024.
- Jick, T.D. Mixing qualitative and quantitative methods: Triangulation in action. Adm. Sci. Q. 1979, 24, 602–611. [Google Scholar] [CrossRef]
- Josey, A.; Dixit, S.; Jog, M.; Sheth, C.; Potty, V.; Wanjale, A.; Gambhir, A. Grid lines and bottom lines: Analysis of the financial performance of electricity distribution companies [Study prepared for the Sixteenth Finance Commission]. Prayas (Energy Group). 2025. Available online: https://fincomindia.nic.in/asset/doc/commission-reports/16th-FC/studies/commission/Study%20on%20Power%20sector%20by%20Prayas.pdf.
- Kaur, A.; Chakraborty, L. UDAY power debt in retrospect and prospects: Analyzing the efficiency parameters (Working Paper No. 244). National Institute of Public Finance and Policy. 2018. Available online: https://nipfp.org.in/publications/working-papers/1839.
- Kim, S. Individual-level factors and organizational performance in government organizations. J. Public Adm. Res. Theory 2005, 15, 245–261. [Google Scholar] [CrossRef]
- Kornai, J. The soft budget constraint. Kyklos 1986, 39, 3–30. [Google Scholar] [CrossRef]
- Kornai, J.; Maskin, E.; Roland, G. Understanding the soft budget constraint. J. Econ. Lit. 2003, 41, 1095–1136. [Google Scholar] [CrossRef]
- Kumar, A. (2021, December 9). Impact of Ujwal DISCOM Assurance Yojana (UDAY) [Policy brief]. PRS Legislative Research. Available online: https://prsindia.org/policy/analytical-reports/impact-of-ujwal-discom-assurance-yojana-uday.
- Kumar, S.P.; Saha, S. Influence of trust and participation in decision making on employee attitudes in Indian public sector undertakings. SAGE Open 2017, 7, 2158244017733030. [Google Scholar] [CrossRef]
- Meier, K.J.; O'Toole, L.J., Jr. Subjective organizational performance and measurement error: Common source bias and spurious relationships. J. Public Adm. Res. Theory 2013, 23, 429–456. [Google Scholar] [CrossRef]
- Meyer, J.P.; Allen, N.J. A three-component conceptualization of organizational commitment. Hum. Resour. Manag. Rev. 1991, 1, 61–89. [Google Scholar] [CrossRef]
- Ministry of Power. 13th integrated rating & ranking: Power distribution utilities. Government of India. February 2025. Available online: https://pfcindia.co.in/DocumentRepository/ckfinder/files/GOI_INITIATIVE/Annual_Integrated_Ratings_of_State_DISCOMs/13th%20Annual%20Integrated%20Rating%20and%20Ranking%20of%20Power%20Distribution%20UtilitieEA2.pdf.
- Ministry of Power. 14th annual integrated rating and ranking of power distribution utilities. Government of India. 2026. Available online: https://jmkresearch.com/wp-content/uploads/2026/03/14th_Annual_Integrated-Rating-and-Ranking-of-Power-Distribution_Utilities.pdf.
- Mowday, R.T.; Steers, R.M.; Porter, L.W. The measurement of organizational commitment. J. Vocat. Behav. 1979, 14, 224–247. [Google Scholar] [CrossRef]
- Performance assessment: Highlights of PFC's report on state power utilities. (2017, November 5). Powerline. Available online: https://powerline.net.in/2017/11/05/performance-assessment/.
- Performance report: Operational and financial status of state power utilities. (2020, July 31). Powerline. Available online: https://powerline.net.in/2020/07/31/performance-report/.
- Perry, J.L. Measuring public service motivation: An assessment of construct reliability and validity. J. Public Adm. Res. Theory 1996, 6, 5–22. [Google Scholar] [CrossRef]
- Perry, J.L.; Wise, L.R. The motivational bases of public service. Public Adm. Rev. 1990, 50, 367–373. [Google Scholar] [CrossRef]
- Podsakoff, P.M.; MacKenzie, S.B.; Lee, J.-Y.; Podsakoff, N.P. Common method biases in behavioral research: A critical review of the literature and recommended remedies. J. Appl. Psychol. 2003, 88, 879–903. [Google Scholar] [CrossRef] [PubMed]
- Power Finance Corporation. Report on the performance of state power utilities 2013-14 to 2015-16. 2016. Available online: https://www.pfcindia.co.in/en/pages/operations/performance-report-of-power-utilities.
- Power Finance Corporation. Report on performance of state power utilities 2018-19. 2020. Available online: https://www.pfcindia.co.in/en/pages/operations/performance-report-of-power-utilities.
- Power Finance Corporation. Report on performance of power utilities 2022-23. 2024. Available online: https://www.pfcindia.co.in/en/pages/operations/performance-report-of-power-utilities.
- Power Finance Corporation. Report on performance of power utilities 2023-24. 2025. Available online: https://www.pfcindia.co.in/en/pages/operations/performance-report-of-power-utilities.
- Press Information Bureau. (2021, June 30). Cabinet approves Revamped Distribution Sector Scheme: A reforms based and results linked scheme [Press release]. Government of India. Available online: https://www.pib.gov.in/PressReleasePage.aspx?PRID=1731473.
- Press Trust of India. (2025, August 2). HP electricity board records Rs 315 cr profit in FY25 after years of losses. The Week. Available online: https://www.theweek.in/wire-updates/business/2025/08/02/nrg4-hp-electricity-board-profit.html.
- Rhoades, L.; Eisenberger, R. Perceived organizational support: A review of the literature. J. Appl. Psychol. 2002, 87, 698–714. [Google Scholar] [CrossRef] [PubMed]
- Ringle, C.M.; Wende, S.; Becker, J.-M. SmartPLS 4 [Computer software]. SmartPLS. Available online: https://www.smartpls.com.
- Robinson, S.L.; Rousseau, D.M. Violating the psychological contract: Not the exception but the norm. J. Organ. Behav. 1994, 15, 245–259. [Google Scholar] [CrossRef]
- Rousseau, D.M. Psychological and implied contracts in organizations. Empl. Responsib. Rights J. 1989, 2, 121–139. [Google Scholar] [CrossRef]
- Sidhu, A.K.; Singh, H.; Virdi, S.S.; Kumar, R. Identification of sources of job stress: A study among officers and supervisors. Int. J. Indian Cult. Bus. Manag. 2019, 19, 147–167. [Google Scholar] [CrossRef]
- Thakur, R.; Jain, N. Institutional capacity and operational constraints in power distribution utilities: Evidence from a Himalayan state utility. Enterp. Dev. Microfinance 2025, 35, 439–456. Available online: https://www.papjournals.com/index.php/edm/article/view/1139.
- Wall, T.D.; Michie, J.; Patterson, M.; Wood, S.J.; Sheehan, M.; Clegg, C.W.; West, M. On the validity of subjective measures of company performance. Pers. Psychol. 2004, 57, 95–118. [Google Scholar] [CrossRef]
- World Bank. (2023). Himachal Pradesh Power Sector Development Program: Technical assessment. Available online: https://documents1.worldbank.org/curated/en/099060523090532232/pdf/P17603202e609e02097ea015273e559c6c.pdf.
Figure 1.
Structural model estimated by partial least squares structural equation modelling (PLS-SEM) in SmartPLS 4 (n = 414), showing the standardised direct path coefficients for H1 to H8 and the variance explained (R²) in each endogenous construct. All paths were significant at p ≤ 0.001. The mediated paths H9 to H12 are specific indirect effects through well-being and commitment and are reported in Table 6.
Figure 1.
Structural model estimated by partial least squares structural equation modelling (PLS-SEM) in SmartPLS 4 (n = 414), showing the standardised direct path coefficients for H1 to H8 and the variance explained (R²) in each endogenous construct. All paths were significant at p ≤ 0.001. The mediated paths H9 to H12 are specific indirect effects through well-being and commitment and are reported in Table 6.
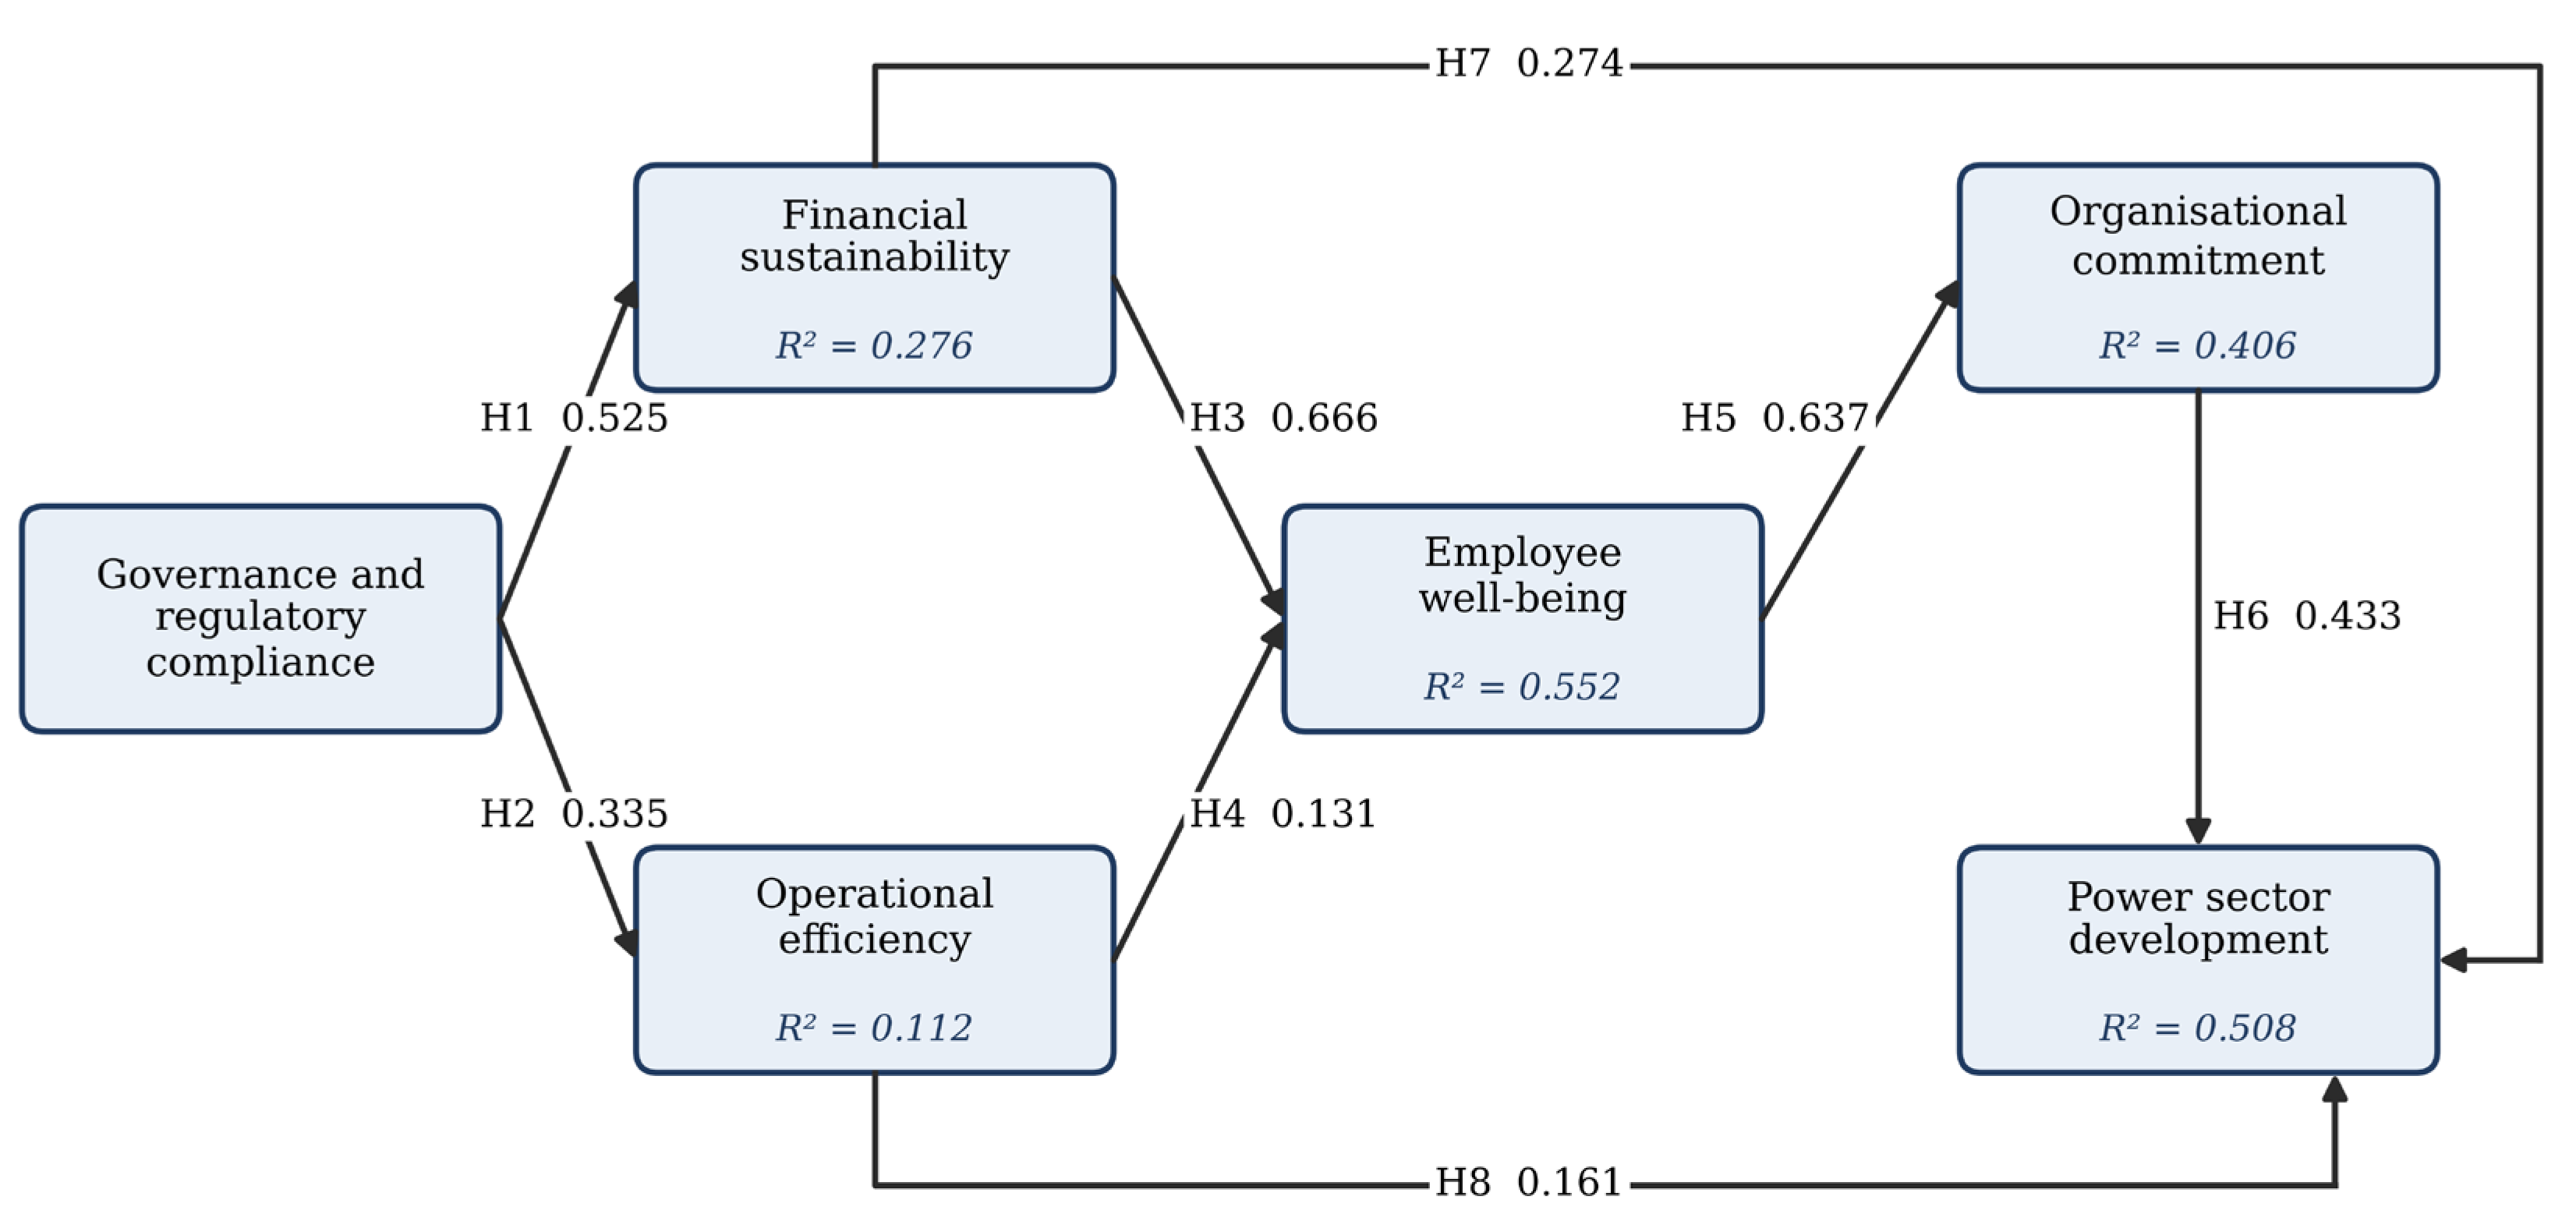
Figure 2.
Mean survey ratings of the six constructs and the grade of agreement with the documentary record. Bars in the lower range fall below the scale midpoint.
Figure 2.
Mean survey ratings of the six constructs and the grade of agreement with the documentary record. Bars in the lower range fall below the scale midpoint.
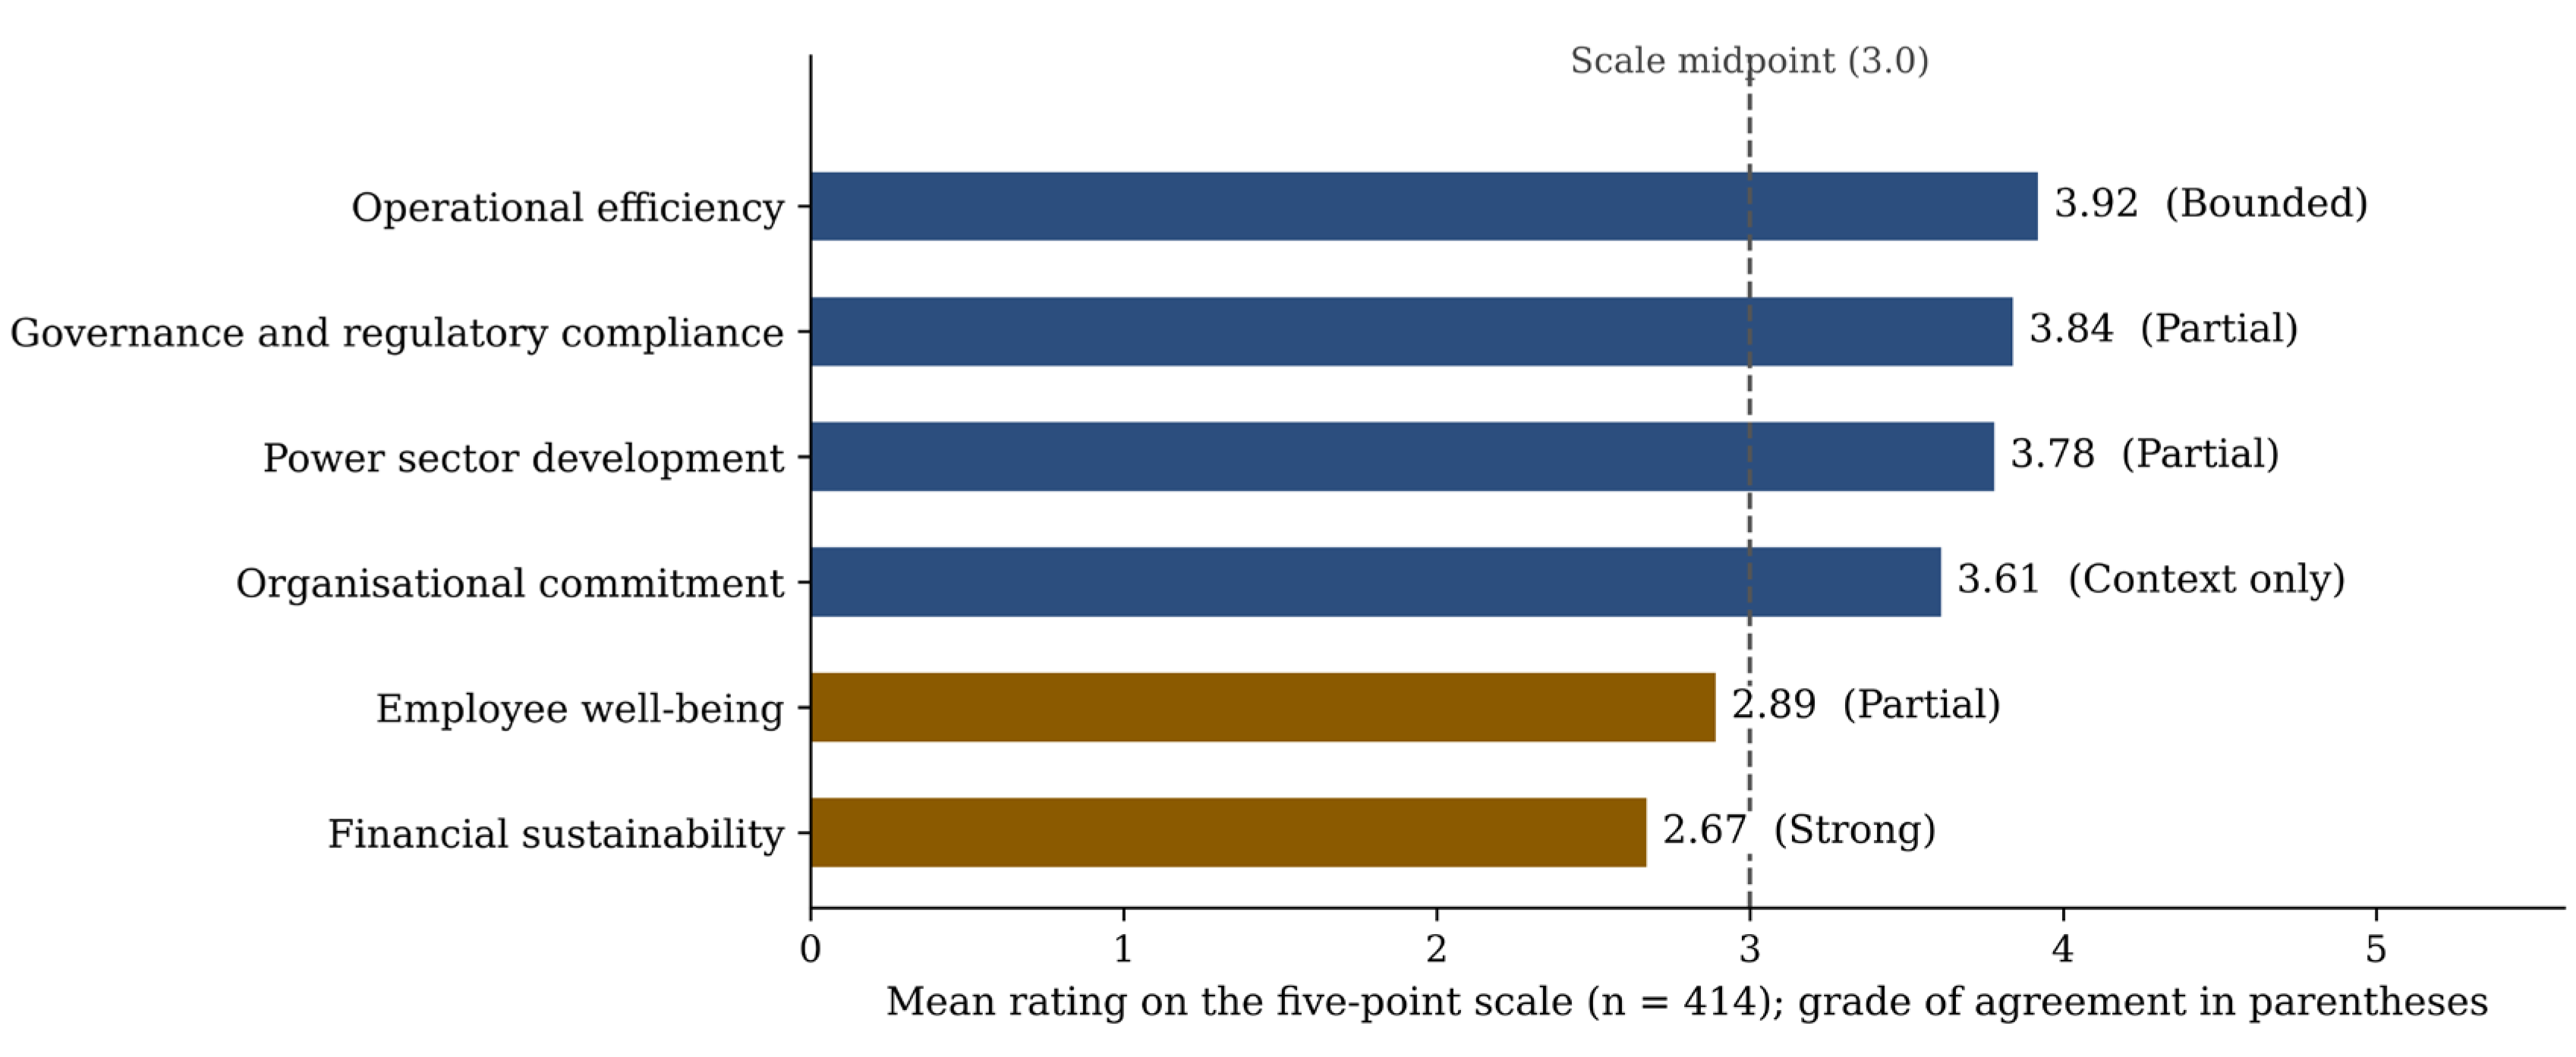
Table 1.
Reliability and convergent validity of the survey constructs.
| Construct | Items | Mean | Cronbach’s α | ρc | AVE |
|---|---|---|---|---|---|
| Governance and regulatory compliance (GRC) | 3 | 3.84 | 0.733 | 0.848 | 0.650 |
| Financial sustainability (FS) | 7 | 2.67 | 0.899 | 0.921 | 0.626 |
| Operational efficiency (OE) | 7 | 3.92 | 0.845 | 0.881 | 0.515 |
| Employee well-being (EWB) | 5 | 2.89 | 0.908 | 0.932 | 0.731 |
| Organisational commitment (OC) | 5 | 3.61 | 0.870 | 0.906 | 0.658 |
| Power sector development (PSD) | 6 | 3.78 | 0.902 | 0.924 | 0.671 |
Note. n = 414. Means are raw means on the five-point scale. ρc = composite reliability; AVE = average variance extracted (Fornell & Larcker, 1981).
Table 2.
Correspondence between survey constructs and documentary indicators.
| Construct | Survey measure | Documentary indicators |
|---|---|---|
| Governance and regulatory compliance | Compliance with tariff orders, reform schemes and board oversight | Achievement of HPERC loss targets; outcome of annual true-ups; grade in the integrated rating |
| Financial sustainability | Revenue, debt, cost recovery, subsidy, pensions, investment and overall viability | Surplus or deficit; accumulated losses and net worth; current ratio; cost–revenue gap; funding of the pension liability |
| Operational efficiency | Billing, aggregate technical and commercial (AT&C) loss, collection, faults, grievances, technical loss and metering | Transmission and distribution (T&D) loss against targets; AT&C loss; billing and collection efficiency |
| Employee well-being | Security, pay, workload, development and work–life balance | Proxy conditions: employee cost ratio; funding of the pension liability; provision for pay-revision arrears |
| Organisational commitment | Belonging, pride, intention to remain, effort and values | None; continuity of operating performance in years of financial stress is noted descriptively |
| Power sector development | Rural access, renewables, reliability, infrastructure, service and technology | Losses against the national average; collection performance; progress of network investment |
Note. The documentary indicators are drawn from the annual reports of HPSEBL, the orders of HPERC, the reports of PFC and the integrated rating of the Ministry of Power for 2014-15 to 2023-24. HPSEBL = Himachal Pradesh State Electricity Board Limited; HPERC = Himachal Pradesh Electricity Regulatory Commission; PFC = Power Finance Corporation.
Table 3.
Criteria for grading agreement.
| Grade | Criterion |
|---|---|
| Strong | Every documentary indicator for the construct points in the same direction as the survey rating, and none contradicts it |
| Partial | Most indicators agree, but at least one qualifies the agreement, for example a period in which the record points the other way or an indicator that measures a related condition and not the construct itself |
| Bounded | Indicators agree for one part of the construct and disagree for another, so that agreement holds only within stated limits |
| Context only | At least one construct in the path has no documentary counterpart, so that the documents can describe the setting but cannot test the path |
Note. Grades for constructs apply the first three criteria to the indicators in Table 2. Grades for paths apply all four criteria to the pair of constructs.
Table 4.
Selected financial and operating indicators of HPSEBL, 2015-16 to 2023-24.
| Year | Net surplus/ (deficit) (₹ crore) | Current ratio | Employee cost ratio (%) | T&D loss minus target (pp) | AT&C loss (%) |
|---|---|---|---|---|---|
| 2015-16 | (10.51) | 0.459 | 25.14 | −0.51 | 12.56 |
| 2016-17 | (111.44) | 0.550 | 27.08 | −0.97 | 11.48 |
| 2017-18 | 3.66 | 0.530 | 28.86 | 0.00 | 11.08 |
| 2018-19 | 3.56 | 0.580 | 24.71 | 0.00 | 11.39 |
| 2019-20 | 10.91 | 0.685 | 28.00 | 1.81 | 16.42 |
| 2020-21 | (185.32) | 0.610 | 28.45 | 3.92 | 14.02 |
| 2021-22 | (103.69) | 0.570 | 27.30 | 1.40 | 12.90 |
| 2022-23 | (1,436.71) | 0.439 | 40.35 | 0.89 | 10.57 |
| 2023-24 | (573.41) | 0.473 | 34.04 | 0.79 | 10.98 |
Note. Figures in parentheses are deficits. A negative entry for the T&D margin means that the loss was below the HPERC target. The net result and ratios for 2023-24 and the current ratio for 2022-23 are on a consolidated basis, and the employee cost ratio for 2022-23 includes a provision of ₹850.56 crore for pay-revision arrears (29.71 per cent without it). The benchmarks used by PFC are a current ratio of at least 1.0 and an employee cost ratio of 15 to 20 per cent (PFC, 2024). pp = percentage points.
Disclaimer/Publisher’s Note: The statements, opinions and data contained in all publications are solely those of the individual author(s) and contributor(s) and not of MDPI and/or the editor(s). MDPI and/or the editor(s) disclaim responsibility for any injury to people or property resulting from any ideas, methods, instructions or products referred to in the content. |
© 2026 by the authors. Licensee MDPI, Basel, Switzerland. This article is an open access article distributed under the terms and conditions of the Creative Commons Attribution (CC BY) license (http://creativecommons.org/licenses/by/4.0/).
Copyright: This open access article is published under a Creative Commons CC BY 4.0 license, which permit the free download, distribution, and reuse, provided that the author and preprint are cited in any reuse.