
Submitted:
27 October 2026
Posted:
28 October 2026
You are already at the latest version
Abstract
Run-time power prediction on heterogeneous accelerators underpins energy-aware scheduling, thermal throttling, and capacity planning. Conventional counter-based regression models must be rebuilt for every new platform, delaying deployment. We present an architecture-aware transfer learning framework that recycles knowledge from a data-rich source GPU to predict power on an unseen target from a small labelled subset. The core idea encodes raw counters into a shared representation of normalized utilization signals and explicit architectural descriptors, making the two feature spaces directly comparable. A base predictor trained on the source is then adapted through a lightweight architecture-gated residual. On a V100 source and three targets (RTX 2080 Ti, Tesla T4, A100) spanning Turing and Ampere, the method attains with only 10% of the target data a mean absolute percentage error (MAPE) of 7.8% averaged over the three transfer targets (7.7% including the source)—cutting the error of direct transfer by 52.9% on those targets (95% CI [47.4%, 58.3%]) and approaching the full-data oracle. Cross-platform power models can thus be built economically by reusing architectural knowledge.
Keywords:
power prediction
; hardware performance counter
; domain adaptation
; cross-platform modeling
; energy efficiency
I. Introduction
Heterogeneous accelerators such as GPUs and domain-specific chips now dominate compute in high-performance computing, cloud, and deep-learning infrastructures. Because these devices are power-bound, accurate and timely power estimation underpins dynamic voltage and frequency scaling, thermal throttling, and energy-aware job scheduling. Although many accelerators expose on-board power readouts, these interfaces are often coarse-grained, delayed, or user-inaccessible; accurate estimation must therefore come from predictive models.
Power estimates also enter instance pricing and sustainability accounting. Every GPU generation exhibits a distinct power signature, so the need for prediction grows with accelerator diversity. A workflow that scales with this diversity, instead of restarting from zero for each platform, motivates the transfer-based treatment developed here.
The prevailing approach couples hardware performance counters with regression: a model maps counters—issued instructions, multiprocessor activity, memory traffic—to measured power. Although effective on a fixed platform, it has a known weakness: each new platform demands a fresh benchmark sweep and thousands of labelled samples before a usable model emerges—a prohibitive cost as devices proliferate. A natural remedy is transfer learning [1], yet naive cross-platform transfer is hampered by differences in counter semantics, scales, and availability across microarchitectures, so a model trained on one GPU translates poorly to another.
Recent attempts address this gap through hierarchical transfer and model fusion, most notably CP3 [2], or through dedicated cross-architecture performance estimators such as the hardware-informed, tile-level NeuSight framework [3]. We take a complementary, feature-level view: the source predictor is a black box to be reused, not retrained, so adaptation must stay lightweight by design; our contributions are threefold:
(1) A common feature schema that normalizes 18 GPU counters by platform-specific calibration peaks and appends five static architectural descriptors. (2) An architecture-gated residual transfer scheme in which a black-box base predictor is reused as-is and only a small gated residual head is fine-tuned on the target, making the approach applicable to any regressor; and (3) A validation across four GPU platforms and three microarchitectures, with per-target ablations, confidence intervals on the aggregate gains, and an explicitly defined architectural distance.
II. Related Work
A. Counter-Based Power Modeling
Performance-counter-driven power modeling has matured into a diverse toolkit. Moolchandani et al. [4] predicted performance and power for concurrent GPU execution, and Antepara et al. [5] developed a microbenchmark-parameterized energy-attribution model across four GPU generations. Nichols et al. [6] used counter-based features for cross-architecture performance prediction. Niu et al. [7] benchmarked LLM-inference power on a dual-H100 node, and Liao et al. [8] predicted GPU training energy from task metadata. These studies address different targets and metrics, so they do not establish a common MAPE range or a unified low-cost adaptation method for a new platform.
B. Cross-Platform and Transfer Learning Prediction
Source-free domain adaptation generally reuses a source-trained model with unlabeled target data and without access to the source data [9]. Our setting instead uses a small labeled target subset, with the source-target gap represented through hardware counters and architectural characteristics. CP3 combines hierarchical feature division, partial transfer, and model fusion; NeuSight uses hardware-informed tile-level prediction for unseen GPUs; and ATFormer [10] uses attention-inspired modules and transfer learning across workloads and devices. Our method transfers an arbitrary pretrained regressor at the feature level through a lightweight architecture-gated residual, without application/platform model decomposition.
III. Architecture-Aware Transfer Learning
A. Problem Formulation
A workload run on accelerator platform p produces a vector of hardware performance counters c and a measured power draw y; we treat each run as a sample (c, y; p). The source domain Ds collects many such samples on a mature platform ps, whereas the target domain Dt contains only a few samples on a newly deployed platform pt. The goal is a predictor that estimates power on pt accurately from as few target samples as possible, by reusing the information carried by Ds.
B. Architecture-Aware Feature Encoding
Raw counters are architecture-specific: a given counter has a different peak value, and sometimes meaning, on each microarchitecture—the root cause of poor naive transfer. We therefore re-express every counter as a dimensionless utilization signal by dividing it by its platform-specific peak:
uk = ck/ρk (p)
Counter peaks are calibrated once per platform: ρk(p) is the 99th-percentile peak value of counter k on platform p, measured over stress microkernels that saturate each functional unit. The resulting u lies in [0, 1] and describes how hard each sub-unit is exercised, irrespective of the platform. To expose the structural gap, we append a compact vector of static, datasheet-published architectural descriptors a = [nSM, peak FP32, peak bandwidth, base clock, process node]. The final feature is z = [u; a]. The encoded vector has 23 dimensions (18 counters, five descriptors), with values exceeding the peak clipped to 1. Identical workload behavior thus maps to similar u on any platform while a carries the remaining context, so source and target samples live in a single, directly comparable space.
Because the five static descriptors span widely different scales, they are normalized before being compared across platforms. Each entry is expressed as a log-ratio relative to the source platform ps,
âk(p) = log(ak(p)/ak(ps)),
so that âk vanishes on the source and its magnitude measures the relative scale gap of descriptor k. The architectural distance between a target platform pt and the source ps is the root-mean-square deviation over the K = 5 descriptors,
d(pt, ps) = ((1/K) Σk âk(pt)2)1/2,
a single scalar in which each descriptor contributes in proportion to its log-scale mismatch. The normalized entries âk enter this distance computation only; the feature vector z keeps the raw values of a. With the datasheet values of Table 1 (SM count, peak FP32 throughput, peak memory bandwidth, base clock, and process node, with the V100 as the source platform), d = 0.20 for the RTX 2080 Ti, d = 0.44 for the A100, and d = 0.72 for the Tesla T4; Section IV–D uses this ordering to interpret the transfer gains.
C. Base Predictor and Additive Residual Transfer
We train a base predictor f on the source domain to minimize a regularized squared error over z; the construction wraps any tabular regressor, and we use a gradient-boosted-tree (GBT) base as f and a shallow multilayer perceptron (MLP) as the residual head Δ. Rather than retraining f on the scarce target data, we keep the source weights frozen and learn a small architecture-gated correction: a gate g(a) = σ(Wg a + bg) maps the static descriptors to per-channel factors in (0, 1) that modulate the correction channels of Δ before a linear read-out collapses them to a scalar—written compactly as g(a) ⊙ Δ(z;φ)—absorbing the residual mismatch:
ŷ = f(z) + g(a) ⊙ Δ(z;φ)
Only φ—about 190 residual and gate weights in total—is optimized on the adaptation subset, leaving the source behavior intact and confining adaptation to a low-capacity head. Because g(a) is bounded in (0, 1), each correction channel is confined to a bounded recalibration of the frozen prediction, and the L2 term shrinks corrections towards zero where evidence is sparse. The training objective on the target domain is:
Lt(φ) = Σ(z,y)∈Dt [f(z) + g(a) ⊙ Δ(z;φ) − y]2 + λ‖φ‖2
The shrinkage weight λ in (5) balances correction magnitude against the risk of adaptation over-fitting. The gated residual thus fits the remaining domain-specific error—such as the Ampere’s markedly higher memory bandwidth—from the target samples. The design reflects a bias–variance argument: an under-parameterized corrector on a frozen source model keeps the adapted variance close to that of the source, whereas re-training a high-capacity model on a few hundred samples inflates it. The whole pipeline is summarized in Figure 1.
The training procedure has three stages. (i) Calibration: run a short stress-microbenchmark suite once per platform to obtain the per-counter peaks. (ii) Source training: fit f on the encoded source samples with early stopping. (iii) Target adaptation: the weights of f stay frozen and only the residual head Δ is optimized on the adaptation subset with a reduced learning rate and L2 regularization.
IV. Experimental Evaluation
A. Setup
We evaluated the framework on four NVIDIA accelerators from three microarchitectures: Volta V100, Turing RTX 2080 Ti and T4, and Ampere A100. Table 1 lists their key specifications. The workload suite spans compute- and memory-bound kernels (Rodinia, PolyBench/GPU), cuBLAS routines, and ResNet-50 and Transformer-encoder forward passes—42 kernels in total. Each kernel was swept over problem sizes and batch levels; 18 counters were collected through NVIDIA DCGM and power through NVML at 10 ms granularity over a stable execution window, yielding roughly 6000 samples per platform. The V100 served exclusively as the source; the other three each served as the target in turn. The adaptation subset was drawn from the target’s training pool, leaving the outer test set untouched. Each condition was repeated five times with resampled adaptation subsets and seeds, the outer test set fixed; we report the mean and standard deviation (SD) over five repeats, and aggregate reductions across the three targets additionally carry t-based 95% confidence intervals (CIs).
We compared four configurations. Naive-few retrains the base predictor from the 10% adaptation subset alone; Direct-transfer applies the V100-trained predictor without adaptation; Arch-Transfer is our full method; and Oracle, trained on the full training pool, is an upper reference. Accuracy is measured by MAPE and root-mean-square error (RMSE) in watts, reported as mean ± SD over five repeats.
B. Prediction Accuracy
Table 2 reports MAPE on each platform, the V100 row contrasts the frozen source model against a full-pool refit, and the RTX 2080 Ti, T4, and A100 as transfer targets; Figure 2 shows the same comparison. Naive-few suffers 19.8–23.6% error on the targets, while Direct-transfer still reaches 13.7–18.9%. Arch-Transfer achieves 6.8–8.6% across all targets—a 52.9% average reduction over Direct-transfer (95% CI [47.4%, 58.3%]; between-target SD of 2.2 percentage points) and 64.2% over Naive-few—landing within two to three points of the Oracle. RMSE follows the same ordering, from 3.1–11.2 W for our method against 7.4–26.5 W for Direct-transfer.
C. Data Efficiency and Ablation
We varied the adaptation subset from 5% to 40% of the target training pool, evaluating on the same outer test set. Arch-Transfer improved from 9.8 ± 0.6% MAPE at 5% to 6.4 ± 0.4% at 40%, while Naive-few improved from 24.0 ± 1.3% to 14.5 ± 1.1%. Even 5% of the target data—about 300 samples—already surpasses Direct-transfer. Table 3 reports the four ablations per target. Removing the architectural descriptors raised the average MAPE from 7.8 ± 0.5% to 11.6 ± 0.7%, with the penalty largest on the A100. An ungated head of identical size degraded the average to 8.5 ± 0.6% (worst on the T4), and full fine-tuning reached 9.9% with markedly higher variance (per-target SD 1.1–1.4 versus 0.4–0.6). Swapping the GBT base for an MLP shifted no target by more than 0.6% MAPE—the framework is regressor-agnostic. Figure 3 traces accuracy against the sample ratio.
D. Discussion
Across the three target GPUs, the gain over Direct-transfer grows monotonically with the architectural distance d defined in (3): the most distant T4 (d = 0.72) and the A100 (d = 0.44) benefit most, while the closest RTX 2080 Ti (d = 0.20) benefits least; per-target reductions are 54.5% (T4), 53.7% (A100), and 50.4% (RTX 2080 Ti), averaging 52.9%. The per-target ablations corroborate this reading: removing the descriptors hurts the distant A100 most, and the bandwidth descriptor alone proves essential (8.1 ± 0.4% → 13.4 ± 1.2%). The architecture-aware encoding, not the residual alone, is thus the principal driver. The lightweight corrector is deliberate: unlike NeuSight, which forecasts deep-learning performance on unseen GPUs using tile-level models trained across several devices, our method adapts a power predictor with a small residual head fitted on a labeled target subset.
The framework rests on two assumptions: a compatible counter set on both domains (true across NVIDIA generations, but needing manual alignment cross-vendor), and scale-level-only descriptors, so workloads with divergent stall behavior can still be mispredicted. NVML polling at 10 ms yielded an effective resolution of 20–50 ms, so the measurements characterize stable-window average power. Because only the small residual is retrained, the method also suits on-line re-calibration.
The adaptation cost is negligible: the residual head holds fewer than 200 parameters, so a single re-fit completes in seconds on a commodity CPU; fleet deployment amounts to storing one frozen model plus a tiny per-device head.
V. Conclusion
We have presented an architecture-aware transfer framework for cross-platform power prediction on heterogeneous accelerators: normalized counters, compact architectural descriptors, and a small architecture-gated residual adapt a new platform from very few samples. Across four GPU platforms, the framework reached 7.8% average MAPE on the transfer targets with only 10% of their data, cutting the Direct-transfer error by 52.9% (95% CI [47.4%, 58.3%]) and closely tracking a full-data oracle. Future work will prioritize multi-source training, cross-vendor evaluation, and on-line adaptation.
References
- Zhuang, F.; Qi, Z.; Duan, K.; Xi, D.; Zhu, Y.; Zhu, H.; Xiong, H.; He, Q. A comprehensive survey on transfer learning. Proc. IEEE 2021, 109, 43–76. [Google Scholar] [CrossRef]
- Qi, X.; Chen, J.; Deng, L. CP3: Hierarchical cross-platform power/performance prediction using a transfer learning approach. In Proceedings of the Algorithms and Architectures for Parallel Processing, ICA3PP 2022; Meng, W., Lu, R., Min, G., Vaidya, J., Eds.; LNCS 13777; Springer: Cham, Switzerland, 2023; pp. 117–138. [Google Scholar] [CrossRef]
- Lee, S.; Phanishayee, A.; Mahajan, D. Forecasting GPU performance for deep learning training and inference. In Proceedings of the 30th ACM International Conference on Architectural Support for Programming Languages and Operating Systems, (ASPLOS ’25), Rotterdam, The Netherlands, 30 March–3 April 2025; Volume 1, pp. 493–508. [Google Scholar] [CrossRef]
- Moolchandani, D.; Kumar, A.; Sarangi, S.R. Performance and power prediction for concurrent execution on GPUs. ACM Trans. Archit. Code Optim. 2022, 19, 35. [Google Scholar] [CrossRef]
- Antepara, O.; Zhao, Z.; Austin, B.; Ding, N.; Oliker, L.; Wright, N.J.; Williams, S. Benchmark-driven models for energy analysis and attribution of GPU-accelerated supercomputing. In Proceedings of the International Conference for High Performance Computing, Networking, Storage and Analysis (SC ’25), St. Louis, MI, USA, 16–21 November 2025; pp. 888–904. [Google Scholar] [CrossRef]
- Nichols, D.; Movsesyan, A.; Yeom, J.-S.; Sarkar, A.; Milroy, D.; Patki, T.; Bhatele, A. Predicting cross-architecture performance of parallel programs. In Proceedings of the 2024 IEEE International Parallel and Distributed Processing Symposium (IPDPS), San Francisco, CA, USA, 27–31 May 2024; pp. 570–581. [Google Scholar] [CrossRef]
- Niu, C.; Zhang, W.; Zhao, Y.; Chen, Y. Energy efficient or exhaustive? Benchmarking power consumption of LLM inference engines. ACM SIGENERGY Energy Inform. Rev. 2025, 5, 56–62. [Google Scholar] [CrossRef]
- Liao, X.; Li, Y.; Zhang, S.; Wei, X.; Hu, J. Predicting GPU training energy consumption in data centers using task metadata via symbolic regression. Energies 2026, 19, 448. [Google Scholar] [CrossRef]
- Li, J.; Yu, Z.; Du, Z.; Zhu, L.; Shen, H.T. A comprehensive survey on source-free domain adaptation. IEEE Trans. Pattern Anal. Mach. Intell. 2024, 46, 5743–5762. [Google Scholar] [CrossRef] [PubMed]
- Bai, Y.; Zhao, W.; Yin, S.; Wang, Z.; Yu, B. ATFormer: A learned performance model with transfer learning across devices for deep learning tensor programs. In Proceedings of the 2023 Conference on Empirical Methods in Natural Language Processing, Singapore, 6–10 December 2023; pp. 4102–4116. [Google Scholar] [CrossRef]
Figure 1.
Architecture-aware transfer learning framework for cross-platform power prediction.
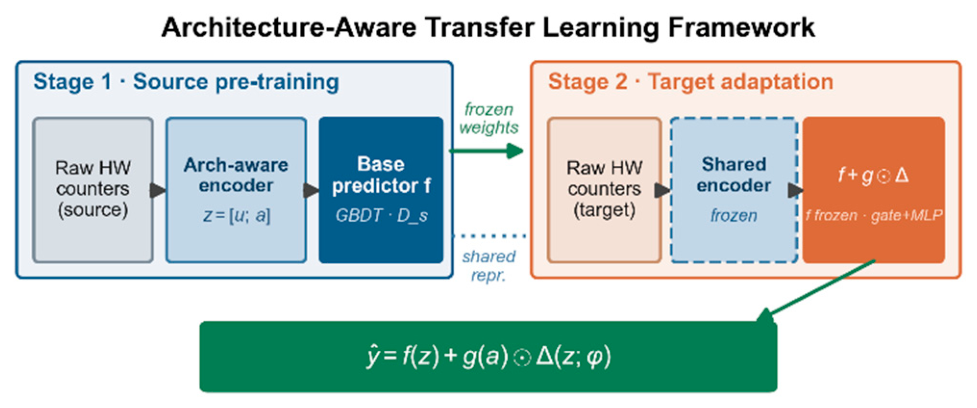
Figure 2.
MAPE of the four configurations on each platform; error bars denote ±1 SD across the five repeats.
Figure 2.
MAPE of the four configurations on each platform; error bars denote ±1 SD across the five repeats.
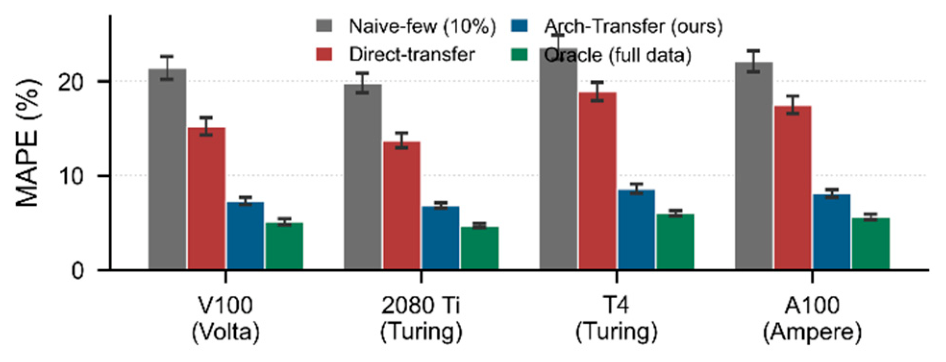
Figure 3.
Average MAPE over the three transfer targets versus sample ratio.
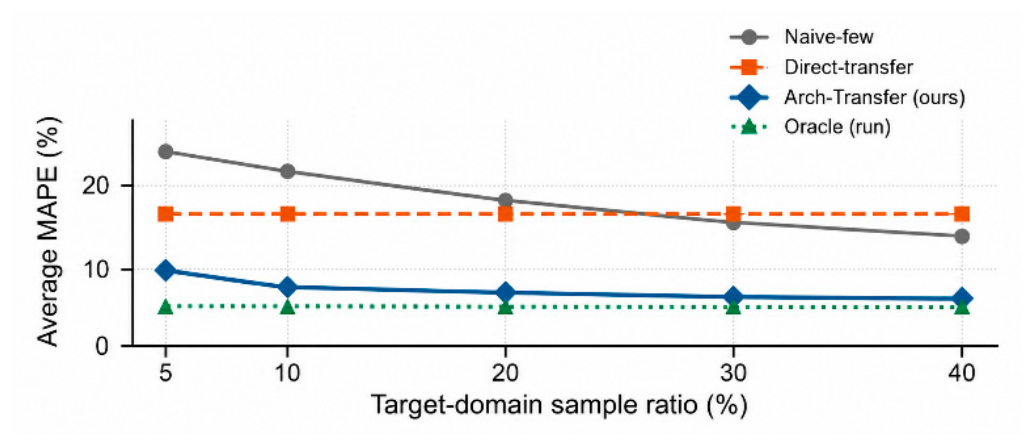

Table 1.
Specifications of the Evaluated GPU Platforms.
| GPU | Arch | Process (nm) | SMs | FP32 (TFLOPS) | Base Clock (MHz) | Memory (GB) | Bandwidth (GB/s) | TDP (W) |
|---|---|---|---|---|---|---|---|---|
| V100 PCIe | Volta | 12 | 80 | 15.7 | 1246 | 16 HBM2 | 900 | 250 |
| RTX 2080 Ti | Turing | 12 | 68 | 13.4 | 1350 | 11 GDDR6 | 616 | 250 |
| Tesla T4 | Turing | 12 | 40 | 8.1 | 585 | 16 GDDR6 | 320 | 70 |
| A100 PCIe | Ampere | 7 | 108 | 19.5 | 765 | 40 HBM2 | 1555 | 250 |
Table 2.
Prediction Error on Each Platform (Mean ± SD over Five Repeats).
| Platform | Metric | Naive-Few (10%) | Direct-Transfer | Arch-Transfer (Ours) | Oracle (Full) |
|---|---|---|---|---|---|
| V100 (source) | MAPE (%) | 21.4 ± 1.6 | 15.2 ± 1.2 | 7.3 ± 0.5 | 5.1 ± 0.4 |
| RMSE (W) | 36.9 ± 2.8 | 26.5 ± 2.1 | 10.9 ± 0.8 | 8.6 ± 0.6 | |
| RTX 2080 Ti | MAPE (%) | 19.8 ± 1.3 | 13.7 ± 1.0 | 6.8 ± 0.5 | 4.7 ± 0.4 |
| RMSE (W) | 27.7 ± 2.1 | 19.4 ± 1.5 | 9.5 ± 0.7 | 6.6 ± 0.5 | |
| Tesla T4 | MAPE (%) | 23.6 ± 1.7 | 18.9 ± 1.3 | 8.6 ± 0.6 | 6.0 ± 0.5 |
| RMSE (W) | 8.3 ± 0.6 | 7.4 ± 0.6 | 3.1 ± 0.2 | 2.1 ± 0.2 | |
| A100 | MAPE (%) | 22.1 ± 1.5 | 17.5 ± 1.2 | 8.1 ± 0.4 | 5.6 ± 0.5 |
| RMSE (W) | 30.9 ± 2.4 | 24.8 ± 1.9 | 11.2 ± 0.9 | 7.8 ± 0.6 | |
| Average | MAPE (%) | 21.7 ± 1.5 | 16.3 ± 1.2 | 7.7 ± 0.5 | 5.4 ± 0.5 |
Table 3.
Per-Target Ablation Results (MAPE, %, Mean ± SD over Five Repeats).
| Target | Arch-Transfer (Full) | w/o Descriptors | Ungated Residual | Full Fine-Tuning | MLP Base |
|---|---|---|---|---|---|
| RTX 2080 Ti | 6.8 ± 0.5 | 10.6 ± 0.8 | 7.6 ± 0.5 | 8.9 ± 1.1 | 7.1 |
| Tesla T4 | 8.6 ± 0.6 | 10.5 ± 0.6 | 9.4 ± 0.7 | 10.6 ± 1.4 | 9.0 |
| A100 | 8.1 ± 0.4 | 13.7 ± 0.9 | 8.5 ± 0.6 | 10.2 ± 1.3 | 8.5 |
| Average | 7.8 ± 0.5 | 11.6 ± 0.7 | 8.5 ± 0.6 | 9.9 ± 1.3 | 8.2 |
Disclaimer/Publisher’s Note: The statements, opinions and data contained in all publications are solely those of the individual author(s) and contributor(s) and not of MDPI and/or the editor(s). MDPI and/or the editor(s) disclaim responsibility for any injury to people or property resulting from any ideas, methods, instructions or products referred to in the content. |
© 2026 by the authors. Licensee MDPI, Basel, Switzerland. This article is an open access article distributed under the terms and conditions of the Creative Commons Attribution (CC BY) license (http://creativecommons.org/licenses/by/4.0/).
Copyright: This open access article is published under a Creative Commons CC BY 4.0 license, which permit the free download, distribution, and reuse, provided that the author and preprint are cited in any reuse.