

Submitted:
21 October 2026
Posted:
23 October 2026
You are already at the latest version
Abstract
Cellular morphology captures compound-induced changes in cell state, but the relationship between the magnitude of these changes and absorption, distribution, metabolism, excretion, and toxicity (ADMET) properties remains dependent on the endpoint and assay context. We developed MorphADMET to examine these relationships and evaluate complementary prediction and reference-retrieval tasks across six imaging datasets, seven morphological representations, eleven binary endpoints, and aqueous solubility. Endpoint comparisons used differences in median morphological response with 95% bootstrap confidence intervals from 2,000 resamples. Positive compounds showed greater responses in selected contexts, including A549–Ames, HUVEC–CYP1A2, HUVEC–CYP3A4, and HRCE–CYP2D6, whereas U2OS hERG-negative compounds showed greater responses. Structure-based ensembles predicted strong morphological responses with average precision (AP) of 0.353–0.472 and outperformed a compact descriptor baseline in four of five contexts. Models using measured morphology showed endpoint-dependent discrimination, including AP of 0.601 and AUROC of 0.786 for hERG in A549 cells. Exploratory compartment-level analyses identified differences in nuclear texture, cytoplasmic organization, and cell shape between endpoint-label groups. In the structure-based ADMET benchmark, MorphADMET achieved the highest observed AP for four of eleven classification endpoints and the lowest solubility mean absolute error, 0.660 log10 mol/L. Morphology-selected reference compounds showed higher class-balanced hERG label agreement than random references in all six cellular contexts. A CYP2D6 neighborhood illustrated shared physicochemical properties alongside partial scaffold similarity. These findings support endpoint-specific use of chemical and morphological information for compound assessment, while distinguishing overall perturbation, predictive discrimination, and retrospective reference agreement.
Keywords:
ellular morphology
; Cell Painting
; ADMET
; molecular descriptors
; phenotypic similarity
; machine learning
1. Introduction
Assessing compound properties requires information about both molecular structure and biological response. Structure-based models can estimate ADMET properties before experimental profiling, whereas high-content imaging measures changes in cells after compound exposure. Cell Painting uses multiplexed fluorescent stains to quantify diverse cellular features, providing a broad description of compound-induced phenotypes [1]. These measurements can complement structure-derived descriptors by capturing responses that depend on the cellular system and exposure conditions.
Previous work has shown that morphological profiles and chemical structures contain useful information for predicting compound activity [2]. Morphological descriptors have also been evaluated against molecular fingerprints for cytotoxicity- and proliferation-related assays [3]. In parallel, structure-based methods such as ADMET-AI and fingerprint-based approaches provide predictions across multiple ADMET endpoints [4,5]. These approaches motivate a closer examination of when cellular morphology contains endpoint-relevant information and how that information can support assessment alongside chemical structure.
An important distinction is the difference between the magnitude of a morphological response and its pattern. A compound may cause a large overall perturbation without being positive for a particular endpoint. Conversely, a compound with a modest overall response may produce a specific combination of nuclear, cytoplasmic, and whole-cell changes associated with an endpoint label. Endpoint positivity also has different meanings across the ADMET panel: it may indicate an inhibitory activity, a toxicity annotation, or blood–brain barrier penetration. Consequently, stronger morphological change cannot be assumed to imply greater toxicity or uniformly greater endpoint activity.
Here, we introduce MorphADMET as a framework for relating chemical structure, measured cellular morphology, and experimental ADMET annotations. We first compare morphological response magnitudes between endpoint-positive and endpoint-negative compounds across six cellular contexts. We then ask whether chemical structure predicts strong morphological responses and whether measured morphological profiles discriminate endpoint labels. Selected compartment-level features provide an exploratory view of the cellular changes associated with those labels. We next evaluate structure-based endpoint prediction against established approaches and examine whether nearby compounds in morphological space share endpoint annotations and chemical features. This sequence connects descriptive analysis with predictive evaluation and reference-based interpretation without treating these distinct forms of evidence as interchangeable.
2. Materials and Methods
2.1. Study Design
The study comprised descriptive endpoint comparisons, structure-based prediction of strong morphological response, morphology-based ADMET prediction, structure-based ADMET benchmarking, and morphology-based reference retrieval. These analyses used task-specific datasets and models. Figure 1 summarizes the data partitioning, grouped cross-validation, model-selection, and reserved-test evaluation scheme applied across the supervised analyses, and Figure 2 summarizes the overall MorphADMET framework, linking the two input types to their representations and to the four analyses reported here. Chemical inputs were derived from standardized molecular structures, while morphological inputs were measured profiles from high-content imaging. No model jointly concatenating chemical and morphological features was evaluated in the analyses reported here.
For supervised prediction, development data were used for model training, cross-validation, and selection, and reserved test data were used for final evaluation. Analyses of median response differences and selected cellular features were descriptive. Reference retrieval evaluated agreement between experimentally annotated compounds and their morphological neighbors. The unit of interpretation was the compound within a defined assay context, rather than an individual imaged cell.
2.2. Imaging Datasets and Morphological Representations
We used six imaging datasets spanning U2OS bone cancer cells, primary human hepatocytes, A549 lung cancer cells, HepG2 liver cancer cells, human umbilical vein endothelial cells (HUVECs), and human renal cortical epithelial cells (HRCEs). The datasets were JUMP, OASIS, LINCS, EU-OS, RxRx3-core, and RxRx19a, respectively [6,7,8,9,10,11,12]. Table 1 lists the selected concentrations and representations. These cell labels describe the experimental systems and do not imply that every endpoint was measured directly in the corresponding tissue.
Morphological representations included engineered CellProfiler measurements and learned image embeddings from DINOv2 and Cell-DINO (TMLR, DINOv2) [13,14]. OASIS was analyzed using both CellProfiler and DINOv2, giving seven representations for morphology-based endpoint prediction. The endpoint-comparison and reference-retrieval figures each show six cellular contexts, with one primary-hepatocyte representation.
Well-level profiles were linked to plate, treatment, compound, and control metadata. Where normalization was required, a feature value x was transformed relative to plate-matched DMSO controls as z = (x − medianDMSO)/(1.4826 × MADDMSO), where MAD is the median absolute deviation. Profiles supplied in normalized form were retained without repeated normalization.
2.3. Endpoint Annotations and Compound Matching
The endpoint panel included eleven binary classification tasks and aqueous-solubility regression (Table 2). Endpoint labels were assembled from publicly available datasets, including resources available through the Therapeutics Data Commons (TDC) [15]. Toxicity-related annotations included hERG inhibition [16], DICTrank cardiotoxicity [17], drug-induced liver injury (DILI) [18], drug-induced renal injury (DIRIL) [19], and Ames mutagenicity [20]. Distribution and metabolism tasks comprised blood–brain barrier (BBB) penetration [21] and inhibition of five cytochrome P450 enzymes [22]. Aqueous solubility was expressed as log10 mol/L [23].
Structure-based endpoint models used eligible labeled compounds regardless of morphology availability. Morphology-based models required both endpoint labels and measured profiles. The resulting endpoint-specific populations differed between these analyses, so their scores were not treated as a direct comparison of input modalities. Missing endpoint annotations were not interpreted as negative labels.
2.4. Morphological Response and Endpoint Comparisons
Morphological response magnitude summarized the overall deviation of a profile from its normalized reference. For profile i with included features Sᵢ, normalized values were clipped to the interval [−10, 10] and combined as Rᵢ = sqrt{Σⱼ∈Sᵢ [clip(zᵢⱼ, −10, 10)]² / |Sᵢ|}. This root-mean-square summary limits the influence of extreme feature values while retaining information about the magnitude of deviations in either direction. Because the underlying features and normalization differ across assays, response magnitudes were interpreted within each context.
For each binary endpoint and cellular context, we calculated Δ = median(Rpositive) − median(Rnegative). A positive Δ indicates greater median perturbation among endpoint-positive compounds, whereas a negative Δ indicates greater median perturbation among endpoint-negative compounds. Pointwise 95% bootstrap confidence intervals were calculated using 2,000 resamples. Intervals spanning zero were interpreted as leaving the direction of the median difference uncertain. These intervals describe individual comparisons and were not used to claim multiplicity-adjusted significance across the endpoint panel. The underlying response-magnitude distributions stratified by endpoint label are shown for each endpoint and cellular context in Supplementary Figure S1a–S1k.
For response prediction, a separate binary target identified compounds above the assay-specific 90th percentile of the development-set response distribution. With threshold T, a strong response was defined as Rᵢ > T and other responses as Rᵢ ≤ T. This target describes comparatively strong perturbation within an assay and is distinct from each experimental ADMET label.
2.5. Molecular Representations and Model Evaluation
Chemical inputs included RDKit molecular descriptors, two-dimensional Mordred descriptors, and structural fingerprints (RDKit documentation, https://www.rdkit.org/) [24,25]. Fingerprint families included Morgan binary and count fingerprints, atom-pair, topological-torsion, RDKit topological, MACCS, Avalon count, and extended reduced graph fingerprints. The structure-based endpoint analysis additionally considered learned molecular representations and graph models. RDKit descriptors describe properties such as molecular weight, lipophilicity, polarity, hydrogen-bonding capacity, and ring counts; the model inputs therefore extended beyond physicochemical descriptors alone.
Chemical groups based on Murcko scaffolds were used to separate related compounds during model evaluation [26]. Response and morphology-based endpoint models used three-fold grouped development cross-validation. Feature selection and learned transformations were fitted within training folds, followed by refitting of selected configurations on the full development set.
Average precision (AP) was the primary classification selection metric. Positive-class prevalence was reported as a reference because AP depends on class balance, and AUROC provided a complementary measure of discrimination [27]. AUROC of 0.5 corresponds to random ranking. Solubility models were selected and evaluated using mean absolute error (MAE), with lower error indicating better prediction. Test scores were excluded from model and ensemble selection. Comparisons of test scores describe observed performance; no statistical superiority is inferred from small differences in point estimates.
2.6. Prediction of Strong Morphological Response from Structure
Response models were developed separately for JUMP, EU-OS, LINCS, RxRx3-core, and RxRx19a. OASIS was excluded from response ensemble selection because too few strong responders were available in the training and validation folds (Supplementary Table S2). A histogram gradient boosting classifier using fourteen chemical descriptors served as the compact baseline.
Candidate response classifiers included logistic regression, histogram gradient boosting, CatBoost, XGBoost, LightGBM, and ExtraTrees, combined with alternative chemical feature sets and hyperparameters. Models were ranked by development cross-validation AP. Starting with the highest-ranked candidate, additional models were retained when averaging their validation predictions improved AP. Selected models were refitted on all development compounds, and their test predictions were averaged with equal weights. Supplementary Tables S1–S3 provide development scores, ensemble membership, and test performance.
2.7. Endpoint Prediction from Measured Morphology
For each of the twelve endpoints and seven morphological representations, we evaluated regularized linear models, CatBoost, LightGBM, XGBoost, ExtraTrees, and multilayer perceptrons. Logistic regression was used for binary linear models and ridge regression for solubility. Candidate configurations combined model settings with either ExtraTrees feature-importance selection or principal component analysis (PCA), using 16, 32, or 64 features or components where supported by the data.
Seventy-eight configurations were considered for each endpoint–representation pair. Selection used the highest mean development cross-validation AP for classification or lowest mean MAE for regression. Each selected configuration was refitted on the development data before evaluation on reserved test compounds. The seven representations and twelve endpoints yielded 84 selected models. Supplementary Tables S7–S13 report the selected configurations and their cross-validation results, and Supplementary Table S14 reports test-set sizes and positive counts.
2.8. Exploratory Analysis of Cellular Compartments
To examine whether endpoint labels were associated with specific morphological patterns, we analyzed selected features in A549 cells for hERG, HepG2 cells for CYP1A2, and HUVECs for hERG. Three features per context were selected using development-set labels to represent distinct measurements and reduce redundant displays. The selected features described nuclear texture, cytoplasmic organization, and whole-cell or cytoplasmic shape. Distributions were displayed as individual compound points and violins, with medians and interquartile ranges.
For the same three endpoint–context pairs and the same development compounds, we additionally summarized RDKit-derived physicochemical properties of the endpoint-positive and endpoint-negative groups, comprising molecular weight, calculated logP, TPSA, hydrogen-bond donor and acceptor counts, and aromatic-ring counts. These property distributions were displayed alongside the morphological comparisons to indicate whether label-associated morphological differences were accompanied by differences in bulk chemical properties. The features were selected and displayed in development compounds, making this an exploratory analysis of endpoint-associated morphology. It was not an independent validation of selected features and did not identify which variables drove the full predictive model.
2.9. Structure Based Endpoint Models and Benchmark Comparison
For structure-based ADMET prediction, candidate families included CatBoost, LightGBM, XGBoost, ExtraTrees, regularized linear models, multilayer perceptrons, mixture-of-experts networks, and directed message-passing neural networks (D-MPNNs). We also considered endpoint-specific fine-tuning of CheMeleon and MapLight-based candidates [5,28,29]. These candidates used complementary descriptor, fingerprint, or learned molecular representations.
Greedy ensemble selection combined candidate predictions according to development performance [30]. At each step, the candidate producing the greatest improvement in the combined prediction was added, allowing repeated selection to increase its weight. Selection continued for up to fifty steps, and the best development ensemble was retained. Supplementary Tables S4 and S5 summarize candidate scores and ensemble membership.
The final ensemble was compared with MapLight, D-MPNN, fine-tuned CheMeleon, and ADMET-AI on matched endpoint-specific test compounds (Supplementary Table S6). This benchmark measures performance under the study evaluation protocol rather than reproducing the original publications’ benchmark results.
2.10. Morphological Reference Retrieval and Chemical Characterization
Within each cellular context, compounds were ranked by Euclidean distance in a dataset-specific PCA representation of measured morphology. The ten nearest eligible compounds were retrieved for each query. For binary endpoints, agreement was the fraction of retrieved compounds sharing the query’s experimental label. Class-balanced agreement gave equal weight to the mean agreement for positive and negative queries. The same statistic was calculated for random reference selection, and the reported difference was morphology-selected minus random agreement in percentage points. The updated analysis included all six cellular contexts.
Reference retrieval used measured morphology and experimental annotations, rather than predicted endpoint probabilities. For a selected CYP2D6-positive HUVEC query, the ten nearest references were examined for shared substructures and full Murcko scaffolds. RDKit-derived molecular weight, calculated logP, topological polar surface area (TPSA), hydrogen-bond donor and acceptor counts, and aromatic-ring counts summarized the neighborhood’s chemical properties. This was a retrospectively selected example.
3. Results
The analyses reported below follow the evaluation scheme summarized in Figure 1, in which eligible compounds were divided into a development pool and a reserved test set, preprocessing and model selection were carried out within grouped development folds, and selected models were refitted before a single reserved-test evaluation. Figure 2 summarizes how the two input types, chemical structure and measured cellular morphology, map onto their representations and onto the four analyses presented here: structure-based prediction of strong morphological response, structure-based ADMET prediction, morphology-based ADMET prediction, and morphology-based reference retrieval.
3.1. Endpoint Associated Response Differences Depend on the Cellular Context
We first examined whether endpoint-positive and endpoint-negative compounds differed in median morphological response (Figure 3 and Figure 4). Across safety, distribution, and metabolism endpoints, both the direction and uncertainty of the difference varied among cellular contexts. Many pointwise confidence intervals crossed zero. Thus, the comparisons did not support a general rule that positive compounds induce stronger morphological changes.
For the safety-related endpoints, Ames-positive compounds in A549 lung cancer cells showed greater median morphological response than Ames-negative compounds, with the displayed confidence interval lying to the right of zero (Figure 3E). This comparison included 32 positive and 117 negative compounds. By contrast, hERG-positive compounds in U2OS bone cancer cells showed a lower median response than hERG-negative compounds, with the interval lying to the left of zero (Figure 3A; 118 positive and 466 negative compounds). These opposing patterns show that the direction of association depends on both endpoint and cellular context.
Among the metabolism endpoints, HUVEC profiles showed greater responses for CYP1A2-positive and CYP3A4-positive compounds, with displayed intervals on the positive side of zero (Figure 4B,F). These comparisons included 52 positive and 159 negative compounds for CYP1A2 and 33 positive and 188 negative compounds for CYP3A4. HRCE profiles similarly showed greater responses for CYP2D6-positive compounds (Figure 4E; 72 positive and 186 negative compounds). These examples were among several context-specific shifts in the plots rather than an exhaustive list of associations.
The median comparisons provide a starting point for modeling but do not measure classification performance. A difference in central tendency can coexist with substantial overlap between the two compound groups. Conversely, multivariate morphological patterns may contain discriminative information even when the median overall response differs little. We therefore evaluated response magnitude prediction and endpoint prediction as separate tasks.
3.2. Chemical Structure Predicts Strong Morphological Responses
Structure-based response ensembles achieved AP values of 0.353–0.472 and AUROC values of 0.807–0.876 across the five evaluated contexts (Figure 5; Table 3). AP exceeded the corresponding test-set strong-response prevalence in each context, which ranged from 7.5% to 13.6%. This indicates that structural features contained information for ranking compounds by their likelihood of producing comparatively strong morphological perturbations.
Relative to the fourteen-descriptor baseline, ensemble AP increased from 0.306 to 0.407 in U2OS, from 0.326 to 0.460 in HepG2, from 0.274 to 0.472 in A549, and from 0.230 to 0.353 in HRCE. The largest absolute increase was 0.198 in A549. HUVEC was the exception: AP decreased from 0.466 to 0.388, although AUROC increased from 0.813 to 0.822. Ensemble AUROC was higher than baseline AUROC in all five contexts (Supplementary Table S3).
The selected ensembles used different chemical representations and model families across contexts (Supplementary Table S2). These results support the feasibility of predicting strong morphological response from structure while showing that a more complex ensemble does not uniformly improve positive-class ranking. Because the baseline and ensemble differ in features, model families, and selection procedure, this comparison does not isolate the contribution of any one component.
3.3. Measured Morphology Supports Endpoint Prediction in Selected Settings
Models using measured morphology showed substantial variation across endpoints and representations (Figure 6). For hERG, AP and AUROC were 0.601 and 0.786 in A549, 0.666 and 0.760 in HUVEC, and 0.599 and 0.762 in HRCE. The corresponding positive-class prevalences were 20.2%, 25.9%, and 32.1%. In primary hepatocytes, the DINOv2 representation yielded hERG AP of 0.615 and AUROC of 0.739, compared with 0.491 and 0.632 for CellProfiler on the matched test population. This example shows that the representation can affect predictive performance even within the same cellular context.
Other favorable examples included Ames prediction in A549, with AP of 0.620 and AUROC of 0.728 against 14.8% positive prevalence, and CYP2D6 prediction in HUVEC, with AP of 0.579 and AUROC of 0.644 against 30.8% prevalence. These results indicate that morphology can contain endpoint-relevant information beyond the scalar response magnitude.
Higher AP values did not consistently imply strong discrimination. For U2OS DICTrank, AP was 0.775 against a positive prevalence of 75.4%, while AUROC was 0.456. Similarly, HepG2 DICTrank AP of 0.860 was accompanied by 88.1% positive prevalence and AUROC of 0.378. Some metabolism tasks also showed weak discrimination despite positive response-magnitude differences. In HUVEC, CYP1A2 and CYP3A4 AUROCs were 0.537 and 0.466, respectively, although both endpoints showed greater median responses among positive compounds in Figure 4. Group-level response differences therefore did not guarantee useful prediction on held-out compounds.
Solubility MAE ranged from 1.123 log10 mol/L for HRCE to 1.634 log10 mol/L for primary-hepatocyte CellProfiler profiles (Figure 6H). These values describe different test populations and should not be interpreted as a controlled ranking of cell types or a direct comparison with structure-based solubility performance. Several classification test sets were also small. For example, OASIS CYP3A4 contained one positive compound among 26 test compounds, and LINCS Ames contained four positives among 27 (Supplementary Table S14). Such sparse positive classes limit the stability of performance estimates.
We next examined selected features to describe the cellular patterns associated with endpoint labels (Figure 7). In A549, the hERG comparison included 288 development compounds, comprising 203 negatives and 85 positives. The displayed nuclear DNA texture, cytoplasmic endoplasmic-reticulum distribution, and cytoplasmic shape features each showed higher medians in the hERG-positive group, together with differences in distribution shape and dispersion (Figure 7A).
For HepG2 CYP1A2, 69 negative and 77 positive development compounds were examined. Positive compounds had a lower median for the displayed nuclear DNA texture feature, a higher median for the cytoplasmic ER–mitochondrial correlation feature, and a lower median for the cell-shape feature (Figure 7B). The opposite directions across features emphasize that an endpoint-associated profile can involve redistribution across measurements rather than a uniform increase in every cellular feature.
In HUVEC, the hERG comparison comprised 169 negative and 76 positive development compounds. Positive compounds showed higher median nuclear texture and cell-shape values and a lower median cell-texture value for the selected measurements (Figure 7C). Although the group distributions differed, they overlapped substantially. These exploratory examples identify measurable cellular correlates of endpoint labels, but they do not establish a common mechanism, causal organelle injury, or independent validation of a morphological biomarker.
3.5. Structure Based ADMET Performance Varies by Endpoint
We then evaluated endpoint prediction directly from chemical structure (Figure 8; Supplementary Table S6). MorphADMET achieved the highest observed AP among the five compared methods for hERG (0.682), DICTrank (0.914), BBB penetration (0.913), and CYP1A2 inhibition (0.929). For solubility, MorphADMET achieved MAE of 0.660 log10 mol/L, compared with 0.722 for MapLight, 0.863 for D-MPNN, 0.690 for CheMeleon, and 0.723 for ADMET-AI.
Using AP for classification and MAE for regression, MorphADMET had better point estimates than MapLight on eleven of twelve endpoints and ADMET-AI on ten of twelve. These pairwise summaries do not mean that MorphADMET led the complete five-method comparison on every endpoint. D-MPNN achieved higher DILI AP (0.801 versus 0.782). CheMeleon achieved slightly higher AP for DIRIL (0.747 versus 0.746), Ames (0.584 versus 0.579), and CYP2C19 (0.579 versus 0.574). MapLight had higher CYP2C9 AP (0.271 versus 0.230), while ADMET-AI had higher AP for CYP2D6 (0.776 versus 0.745) and CYP3A4 (0.890 versus 0.888).
The ranking also depended on the metric. MorphADMET had the highest observed AUROC for DIRIL, Ames, BBB, CYP1A2, and CYP2C19, whereas other methods led the remaining AUROC comparisons. Thus, the ensemble offered competitive endpoint prediction without a uniform advantage across endpoints or discrimination metrics. The small differences between several methods remain descriptive because uncertainty intervals or paired tests for the benchmark differences were not reported.
3.6. Physicochemical Properties of Endpoint Label Groups in the Compartment Level Contexts
Because morphological differences between label groups could coincide with differences in bulk chemical properties, we summarized RDKit-derived descriptors for the same three endpoint–context pairs and development compounds used for the compartment-level comparison (Figure 9). In A549 cells, hERG-positive compounds showed higher calculated logP and lower topological polar surface area than hERG-negative compounds, with broadly similar molecular weight and aromatic-ring counts and slightly lower hydrogen-bond donor and acceptor counts (Figure 9A).
In HepG2 cells, CYP1A2-positive compounds showed a narrower molecular-weight distribution, modestly higher calculated logP, lower TPSA, and lower hydrogen-bond donor and acceptor counts than CYP1A2-negative compounds, together with a higher median aromatic-ring count (Figure 9B). In HUVECs, hERG-positive compounds again showed higher calculated logP and lower TPSA, with lower hydrogen-bond donor and acceptor counts and comparable aromatic-ring counts (Figure 9C).
These property shifts are consistent with the lipophilicity and polarity trends commonly reported for hERG and CYP inhibition and indicate that the endpoint-associated morphological differences in Figure 7 occur in compound groups that also differ in bulk physicochemical properties. The distributions overlap substantially in every comparison, and the groups were defined by experimental labels rather than matched on chemistry. These displays therefore describe the chemical composition of the label groups and do not separate chemical from phenotypic contributions to the observed morphological differences.
3.7. Morphological Neighbors Show Enriched hERG Label Agreement
We next asked whether compounds with similar measured profiles also shared experimental endpoint annotations. At a neighborhood size of ten, morphology-selected references showed higher class-balanced hERG agreement than random references in all six cellular contexts (Figure 10A). Agreement was 52.1% versus 50.0% in U2OS, 52.6% versus 49.7% in primary hepatocytes, 58.0% versus 49.8% in A549, 53.9% versus 49.9% in HepG2, 55.3% versus 49.7% in HUVEC, and 57.6% versus 49.6% in HRCE. The displayed agreement differences ranged from 2.1 to 8.2 percentage points, with the largest gains in A549 and HRCE. Minor differences obtained by subtracting rounded percentages reflect plotting precision.
The pattern was less consistent for other endpoints (Figure 10B). HUVEC and HRCE showed CYP2D6 agreement gains of 4.3 and 4.4 percentage points, respectively, while A549 showed a 4.1-point gain for CYP3A4. Negative differences also occurred, including Ames in HUVEC (−3.6 points) and DIRIL in HepG2 (−2.9 points). Morphological proximity therefore enriched endpoint agreement in some settings but could be uninformative or less useful than random selection in others.
This analysis supports the use of measured morphology to retrieve contextual experimental evidence. Because the score measures neighbor-label agreement, it is distinct from the held-out endpoint-classification scores in Figure 6. The enrichment also does not show that all nearby compounds share a molecular target or adverse-effect mechanism.
3.8. A CYP2D6 Neighborhood Combines Partial Scaffold Similarity with Shared Properties
To examine the chemical context of a retrieved neighborhood, we inspected ten morphology-selected references for a CYP2D6-positive HUVEC query (Figure 11). All ten references were experimentally CYP2D6-positive. Their calculated logP values ranged from 3.06 to 4.98, with a median of 4.29, and each compound contained at least two aromatic rings. Median molecular weight was 330.61 g/mol (range 298.46–467.65), and median TPSA was 36.40 Ų (range 6.48–64.09). Hydrogen-bond donors ranged from zero to two and acceptors from two to five.
Two highlighted structural cores each occurred in three references. Core A was present in R4, R7, and R9, and core B in R1, R3, and R5. Within the displayed neighborhood, each core occurred in three of the ten retrieved references (Figure 11B). Identical full Murcko scaffolds were restricted to the R1/R5 and R4/R9 pairs, and no full scaffold spanned all ten compounds. Thus, morphological retrieval recovered a neighborhood with shared endpoint labels and broadly similar physicochemical characteristics while retaining structural differences.
The example is compatible with both structural contributions to phenotypic similarity and convergence among different structures. It cannot establish scaffold-independent retrieval, because related chemical motifs occur within the neighborhood and no scaffold-matched control is shown. As a retrospectively selected case, it illustrates interpretation of a reference set rather than the expected accuracy of retrieval for an arbitrary query.
4. Discussion
We see that the relationship between morphology and ADMET is conditional on both the endpoint and the cellular assay. The initial median comparisons showed stronger perturbation among positive compounds for selected endpoint–context pairs and the opposite pattern for others. Subsequent prediction and retrieval analyses reinforced this heterogeneity. MorphADMET therefore provides several ways to use chemical and morphological information, with each output addressing a different aspect of compound assessment.
The distinction between response magnitude and response pattern is particularly important. A single response-magnitude score summarizes how far a profile deviates from its normalized reference but discards the identities and directions of individual feature changes. This helps explain why a median difference may not translate into strong endpoint prediction, as seen for HUVEC CYP1A2 and CYP3A4. Conversely, the hERG models in several contexts discriminated labels even though greater overall perturbation was not a consistent property of hERG-positive compounds. The compartment-level plots provide examples of the heterogeneous feature shifts that a multivariate profile can retain. They support further investigation of specific cellular measurements without establishing that these selected features explain model predictions.
Structure-based prediction of strong response offers a potential route to prioritizing compounds for imaging. Across five contexts, response AP exceeded the corresponding positive prevalence, and four ensembles improved on the compact descriptor baseline. However, the lower HUVEC AP demonstrates that increased model complexity can fail to improve the ranking most relevant to positive-compound prioritization. Moreover, a strong-response prediction concerns an assay-specific percentile threshold. It does not establish endpoint positivity, cytotoxicity, or clinical risk. Prospective evaluation would be needed to determine whether these rankings improve experimental selection.
Measured morphology supported endpoint prediction in selected settings, with hERG providing several favorable examples. However, high AP on positive-dominated tasks could coexist with weak AUROC, and some apparently favorable results were based on very few positive test compounds. Interpretation therefore requires both class counts and complementary performance metrics. The variation between CellProfiler and DINOv2 for primary-hepatocyte hERG further suggests that representation choice can influence the information available to a predictive model. It does not demonstrate an overall advantage of learned embeddings across endpoints.
The structure-based benchmark addresses a different use case, in which predictions can be made without imaging data. MorphADMET achieved favorable pairwise comparisons with MapLight and ADMET-AI and the lowest solubility MAE among the evaluated methods, while leading AP on four classification endpoints. Other methods performed better on the remaining classification tasks. This endpoint dependence is consistent with selecting different combinations of representations and algorithms for different targets. The present benchmark does not isolate the effects of descriptors, neural representations, hyperparameter search, and ensembling, and it should not be interpreted as a comparison of algorithms at identical computational budgets.
Morphological reference retrieval adds an interpretable neighborhood of annotated compounds. The consistent direction of hERG agreement improvement across six contexts suggests that morphological similarity can enrich for related annotations, although the observed gains were modest and variable. The CYP2D6 example shows how such a neighborhood can be examined for shared chemical properties and structural motifs. References may help formulate hypotheses or choose follow-up experiments, but their labels are not independent measurements of the query. Related scaffolds, general cell stress, exposure, and shared off-target activities remain alternative explanations for similarity.
As with any retrospective benchmarking study, several aspects warrant further study. The datasets differ in cell type, exposure conditions, and representation, and the structure- and morphology-based evaluations draw on different compound populations, so cross-dataset and cross-modality comparisons are best treated as descriptive; the illustrative compartment and chemical examples are likewise exploratory and are intended to show the kinds of signals the framework surfaces. Matched-compound fusion experiments, per-compound calibration and uncertainty estimates, and prospective experimental confirmation are natural next steps.
Future evaluation will build on this work in several directions. Matched multimodal test sets, repeated scaffold-grouped or temporal validation, and prospective compound selection would strengthen the performance estimates reported here. Testing whether morphology adds predictive signal beyond structure on the same compounds would characterize complementarity more directly, while scaffold-restricted and property-matched controls would help resolve how much of the retrieval signal reflects shared phenotypic information rather than structural similarity. Replicating selected compartment-level patterns in independent compounds and concentration-response experiments would further support their biological interpretation.
5. Conclusions
MorphADMET connects descriptive morphological analysis with structure-based response prediction, endpoint-specific ADMET modeling, and retrieval of experimentally annotated morphological neighbors. Greater morphological change was associated with endpoint positivity in selected cellular contexts, but the direction was not universal. Structure-based ensembles predicted strong responses in five contexts, measured morphology supported selected endpoint predictions, and structure-based ADMET models achieved competitive benchmark performance with the lowest observed solubility error. Morphological retrieval enriched hERG label agreement across six contexts and provided chemical context for a selected CYP2D6 neighborhood. Overall, these results support context-specific use of structural and phenotypic evidence while preserving the distinction between perturbation, prediction, and reference agreement.
Competing interests
The authors declare that they have no competing interests.
Data availability
This study utilized existing datasets from JUMP, OASIS, LINCS, EU-OS, RxRx3-core, and RxRx19a. ADMET endpoint data were obtained from the Therapeutics Data Commons (TDC) and published toxicity resources, including the DILIst/DILIrank-derived gold-standard dataset, DICTrank, and FDA DIRIL. The original datasets and their associated publications are cited in the manuscript.
Code availability
The source code for MorphADMET is publicly available on GitHub at https://github.com/DigitalEtherComputing-AI/MorphADMET.
Supplementary Materials
The following supporting information can be downloaded at the website of this paper posted on Preprints.org. Supplementary Figure Legends. Supplementary Figure S1a–S1k. Distributions of morphological response magnitude stratified by endpoint label across the six cellular contexts, for Ames mutagenicity, BBB penetration, CYP1A2, CYP2C9, CYP2C19, CYP2D6, and CYP3A4 inhibition, DICTrank cardiotoxicity, DILI, DIRIL, hERG inhibition, and aqueous solubility. These distributions underlie the median differences summarized in Figure 3 and Figure 4.
Author Contributions
Md Wasi Ul Kabir and Naeyma Islam contributed to methodology, software, data curation, formal analysis, visualization, and writing. Asif Mahmud and Sayanto Pal contributed to data collection. Ryan King provided technical expertise. Thomas Caulfield and Naeyma Islam contributed to conceptualization, supervision, and writing – review and editing.
Funding
This research received no specific grant from any funding agency in the public, commercial, or not-for-profit sectors.
Acknowledgments
The authors gratefully acknowledge the researchers and organizations responsible for generating, curating, and sharing the imaging and ADMET datasets utilized in this study. We also acknowledge the developers and contributors of the open-source software tools and computational resources that supported this research.
References
- Bray, M.A.; et al. Cell Painting, a high-content image-based assay for morphological profiling using multiplexed fluorescent dyes. Nat. Protoc. 2016, 11(9), 1757–74. [Google Scholar] [CrossRef]
- Moshkov, N.; et al. Predicting compound activity from phenotypic profiles and chemical structures. Nat. Commun. 2023, 14(1), 1967. [Google Scholar] [CrossRef]
- Seal, S.; et al. Comparison of Cellular Morphological Descriptors and Molecular Fingerprints for the Prediction of Cytotoxicity- and Proliferation-Related Assays. Chem. Res. Toxicol. 2021, 34(2), 422–437. [Google Scholar] [CrossRef]
- Swanson, K.; et al. ADMET-AI: a machine learning ADMET platform for evaluation of large-scale chemical libraries. Bioinformatics 2024, 40(7). [Google Scholar] [CrossRef]
- Notwell, J.H.; Wood, M.W. ADMET property prediction through combinations of molecular fingerprints. arXiv [q-bio.BM] 2023. [Google Scholar]
- Way, G.P.; et al. Morphology and gene expression profiling provide complementary information for mapping cell state. Cell Syst. 2022, 13(11), 911–923 e9. [Google Scholar] [CrossRef]
- Wolff, C.; et al. Morphological profiling data resource enables prediction of chemical compound properties. iScience 2025, 28(5), 112445. [Google Scholar] [CrossRef]
- Chandrasekaran, S.N.; et al. JUMP Cell Painting dataset: morphological impact of 136,000 chemical and genetic perturbations. bioRxiv 2023. [Google Scholar] [CrossRef]
- Ewald, J.D.; et al. Cell Painting for cytotoxicity and mode-of-action analysis in primary human hepatocytes. Cell Syst. 2026, 17(5), 101566. [Google Scholar] [CrossRef]
- Kraus, O.; et al. RxRx3-core: Benchmarking drug-target interactions in High-Content Microscopy. arXiv [q-bio.QM] 2025. [Google Scholar]
- Heiser, K.; et al. Identification of potential treatments for COVID-19 through artificial intelligence-enabled phenomic analysis of human cells infected with SARS-CoV-2. bioRxiv 2020, 2020.04.21.054387. [Google Scholar] [CrossRef]
- Ewald, J. Axiom OASIS profiles and metadata; Zenodo, 2025. [Google Scholar]
- Stirling, D.R.; et al. CellProfiler 4: improvements in speed, utility and usability. BMC Bioinform. 2021, 22(1), 433. [Google Scholar] [CrossRef]
- Moutakanni, T.; et al. Cell-DINO: Self-supervised image-based embeddings for cell fluorescent microscopy. PLoS Comput Biol. 2025, 21(12), e1013828. [Google Scholar] [CrossRef]
- Huang, K.; et al. Artificial intelligence foundation for therapeutic science. Nat. Chem. Biol. 2022, 18(10), 1033–1036. [Google Scholar] [CrossRef]
- Karim, A.; et al. CardioTox net: a robust predictor for hERG channel blockade based on deep learning meta-feature ensembles. J. Cheminform 2021, 13(1), 60. [Google Scholar] [CrossRef]
- Qu, Y.; et al. DICTrank: The largest reference list of 1318 human drugs ranked by risk of drug-induced cardiotoxicity using FDA labeling. Drug Discov. Today 2023, 28(11), 103770. [Google Scholar] [CrossRef]
- Seal, S.; et al. Improved Detection of Drug-Induced Liver Injury by Integrating Predicted In Vivo and In Vitro Data. Chem. Res. Toxicol. 2024, 37(8), 1290–1305. [Google Scholar] [CrossRef]
- Connor, S.; et al. Generation of a drug-induced renal injury list to facilitate the development of new approach methodologies for nephrotoxicity. Drug Discov. Today 2024, 29(4), 103938. [Google Scholar] [CrossRef]
- Xu, C.; et al. In silico prediction of chemical Ames mutagenicity. J. Chem. Inf. Model 2012, 52(11), 2840–7. [Google Scholar] [CrossRef]
- Martins, I.F.; et al. A Bayesian approach to in silico blood-brain barrier penetration modeling. J. Chem. Inf. Model 2012, 52(6), 1686–97. [Google Scholar] [CrossRef]
- Veith, H.; et al. Comprehensive characterization of cytochrome P450 isozyme selectivity across chemical libraries. Nat. Biotechnol. 2009, 27(11), 1050–5. [Google Scholar] [CrossRef]
- Sorkun, M.C.; Khetan, A.; Er, S. AqSolDB, a curated reference set of aqueous solubility and 2D descriptors for a diverse set of compounds. Sci. Data 2019, 6(1), 143. [Google Scholar] [CrossRef]
- Moriwaki, H.; et al. Mordred: a molecular descriptor calculator. J. Cheminform 2018, 10(1), 4. [Google Scholar] [CrossRef]
- Rogers, D.; Hahn, M. Extended-connectivity fingerprints. J. Chem. Inf. Model 2010, 50(5), 742–54. [Google Scholar] [CrossRef]
- Bemis, G.W.; Murcko, M.A. The properties of known drugs. 1. Molecular frameworks. J. Med. Chem. 1996, 39(15), 2887–93. [Google Scholar] [CrossRef]
- Saito, T.; Rehmsmeier, M. The precision-recall plot is more informative than the ROC plot when evaluating binary classifiers on imbalanced datasets. PLoS ONE 2015, 10(3), e0118432. [Google Scholar] [CrossRef]
- Heid, E.; et al. Chemprop: A Machine Learning Package for Chemical Property Prediction. J. Chem. Inf. Model 2024, 64(1), 9–17. [Google Scholar] [CrossRef]
- Burns, J.W.; et al. Deep Learning Foundation Models for Low-Data Regimes from Classical Molecular Descriptors. J. Chem. Inf. Model 2026, 66(17), 10692–10701. [Google Scholar] [CrossRef]
- Caruana, R.; et al. Ensemble selection from libraries of models. In Proceedings of the Twenty-First International Conference on Machine Learning, 2004; Association for Computing Machinery; p. 18. [Google Scholar]
Figure 1.
Study design, grouped validation, and model selection. (A) Eligible compounds were assigned to a development pool and a reserved test set using compound and scaffold groups, and development data were split into three grouped cross-validation folds with preprocessing fitted within training folds only. (B) Model selection used development data alone for each of the three supervised analyses: structure-based prediction of strong morphological response (six model families, equal-weight ensemble built by adding a model only when averaging improved validation AP); structure-based ADMET prediction (tabular and neural models over fingerprints, descriptors, and graphs, combined by greedy weighted ensemble selection); and morphology-based ADMET prediction (model and preprocessing configuration with the best development performance). (C) Selected models were refitted on the full development set, frozen, and evaluated once on the reserved test set using AP and AUROC for classification or MAE for solubility. Test scores were not used for selection.
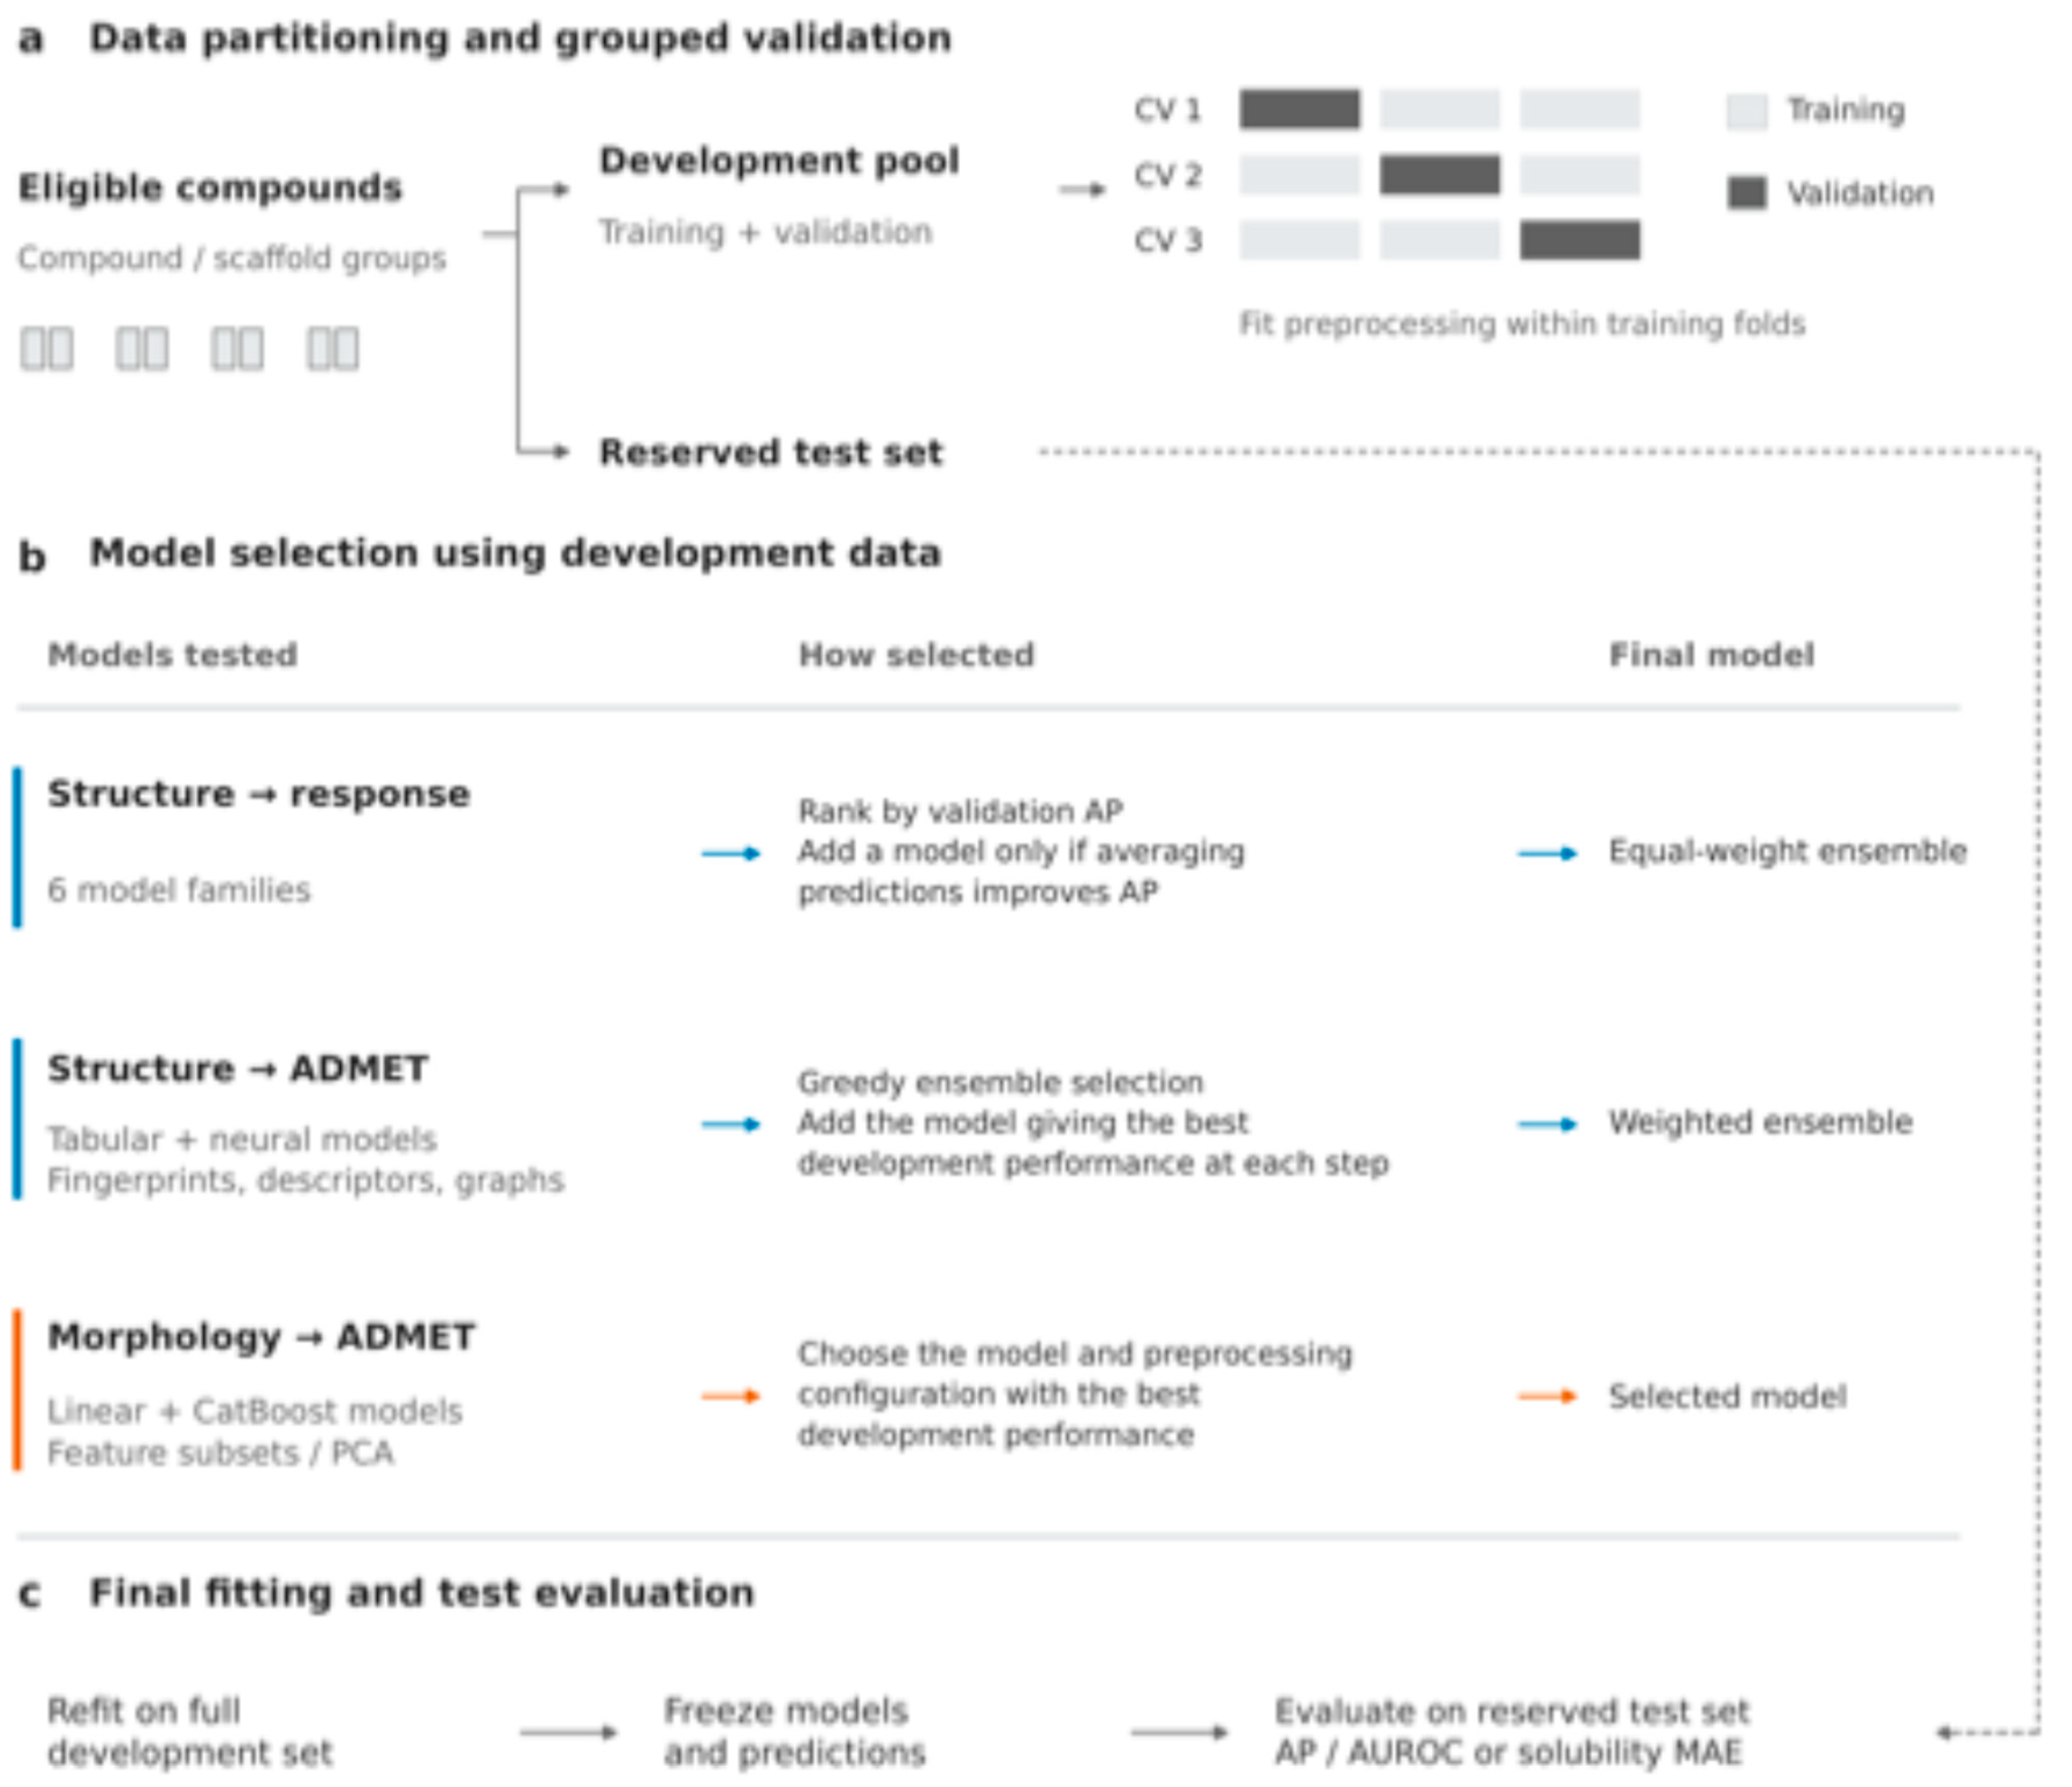
Figure 2.
Overview of the MorphADMET framework. Chemical structure, supplied as standardized SMILES for endpoint-labeled compounds, was represented by molecular descriptors and structural fingerprints, with additional learned molecular and graph representations used for structure-based ADMET prediction. Measured morphology, from six Cell Painting and high-content imaging datasets giving seven representations, was represented by CellProfiler measurements or DINO-family image embeddings. These inputs supported four analyses: (1) prediction of strong assay-specific cellular perturbation from structure, (2) structure-based ADMET prediction, (3) morphology-based ADMET prediction, and (4) reference retrieval based on phenotypic similarity. No model jointly concatenating chemical and morphological features was evaluated.
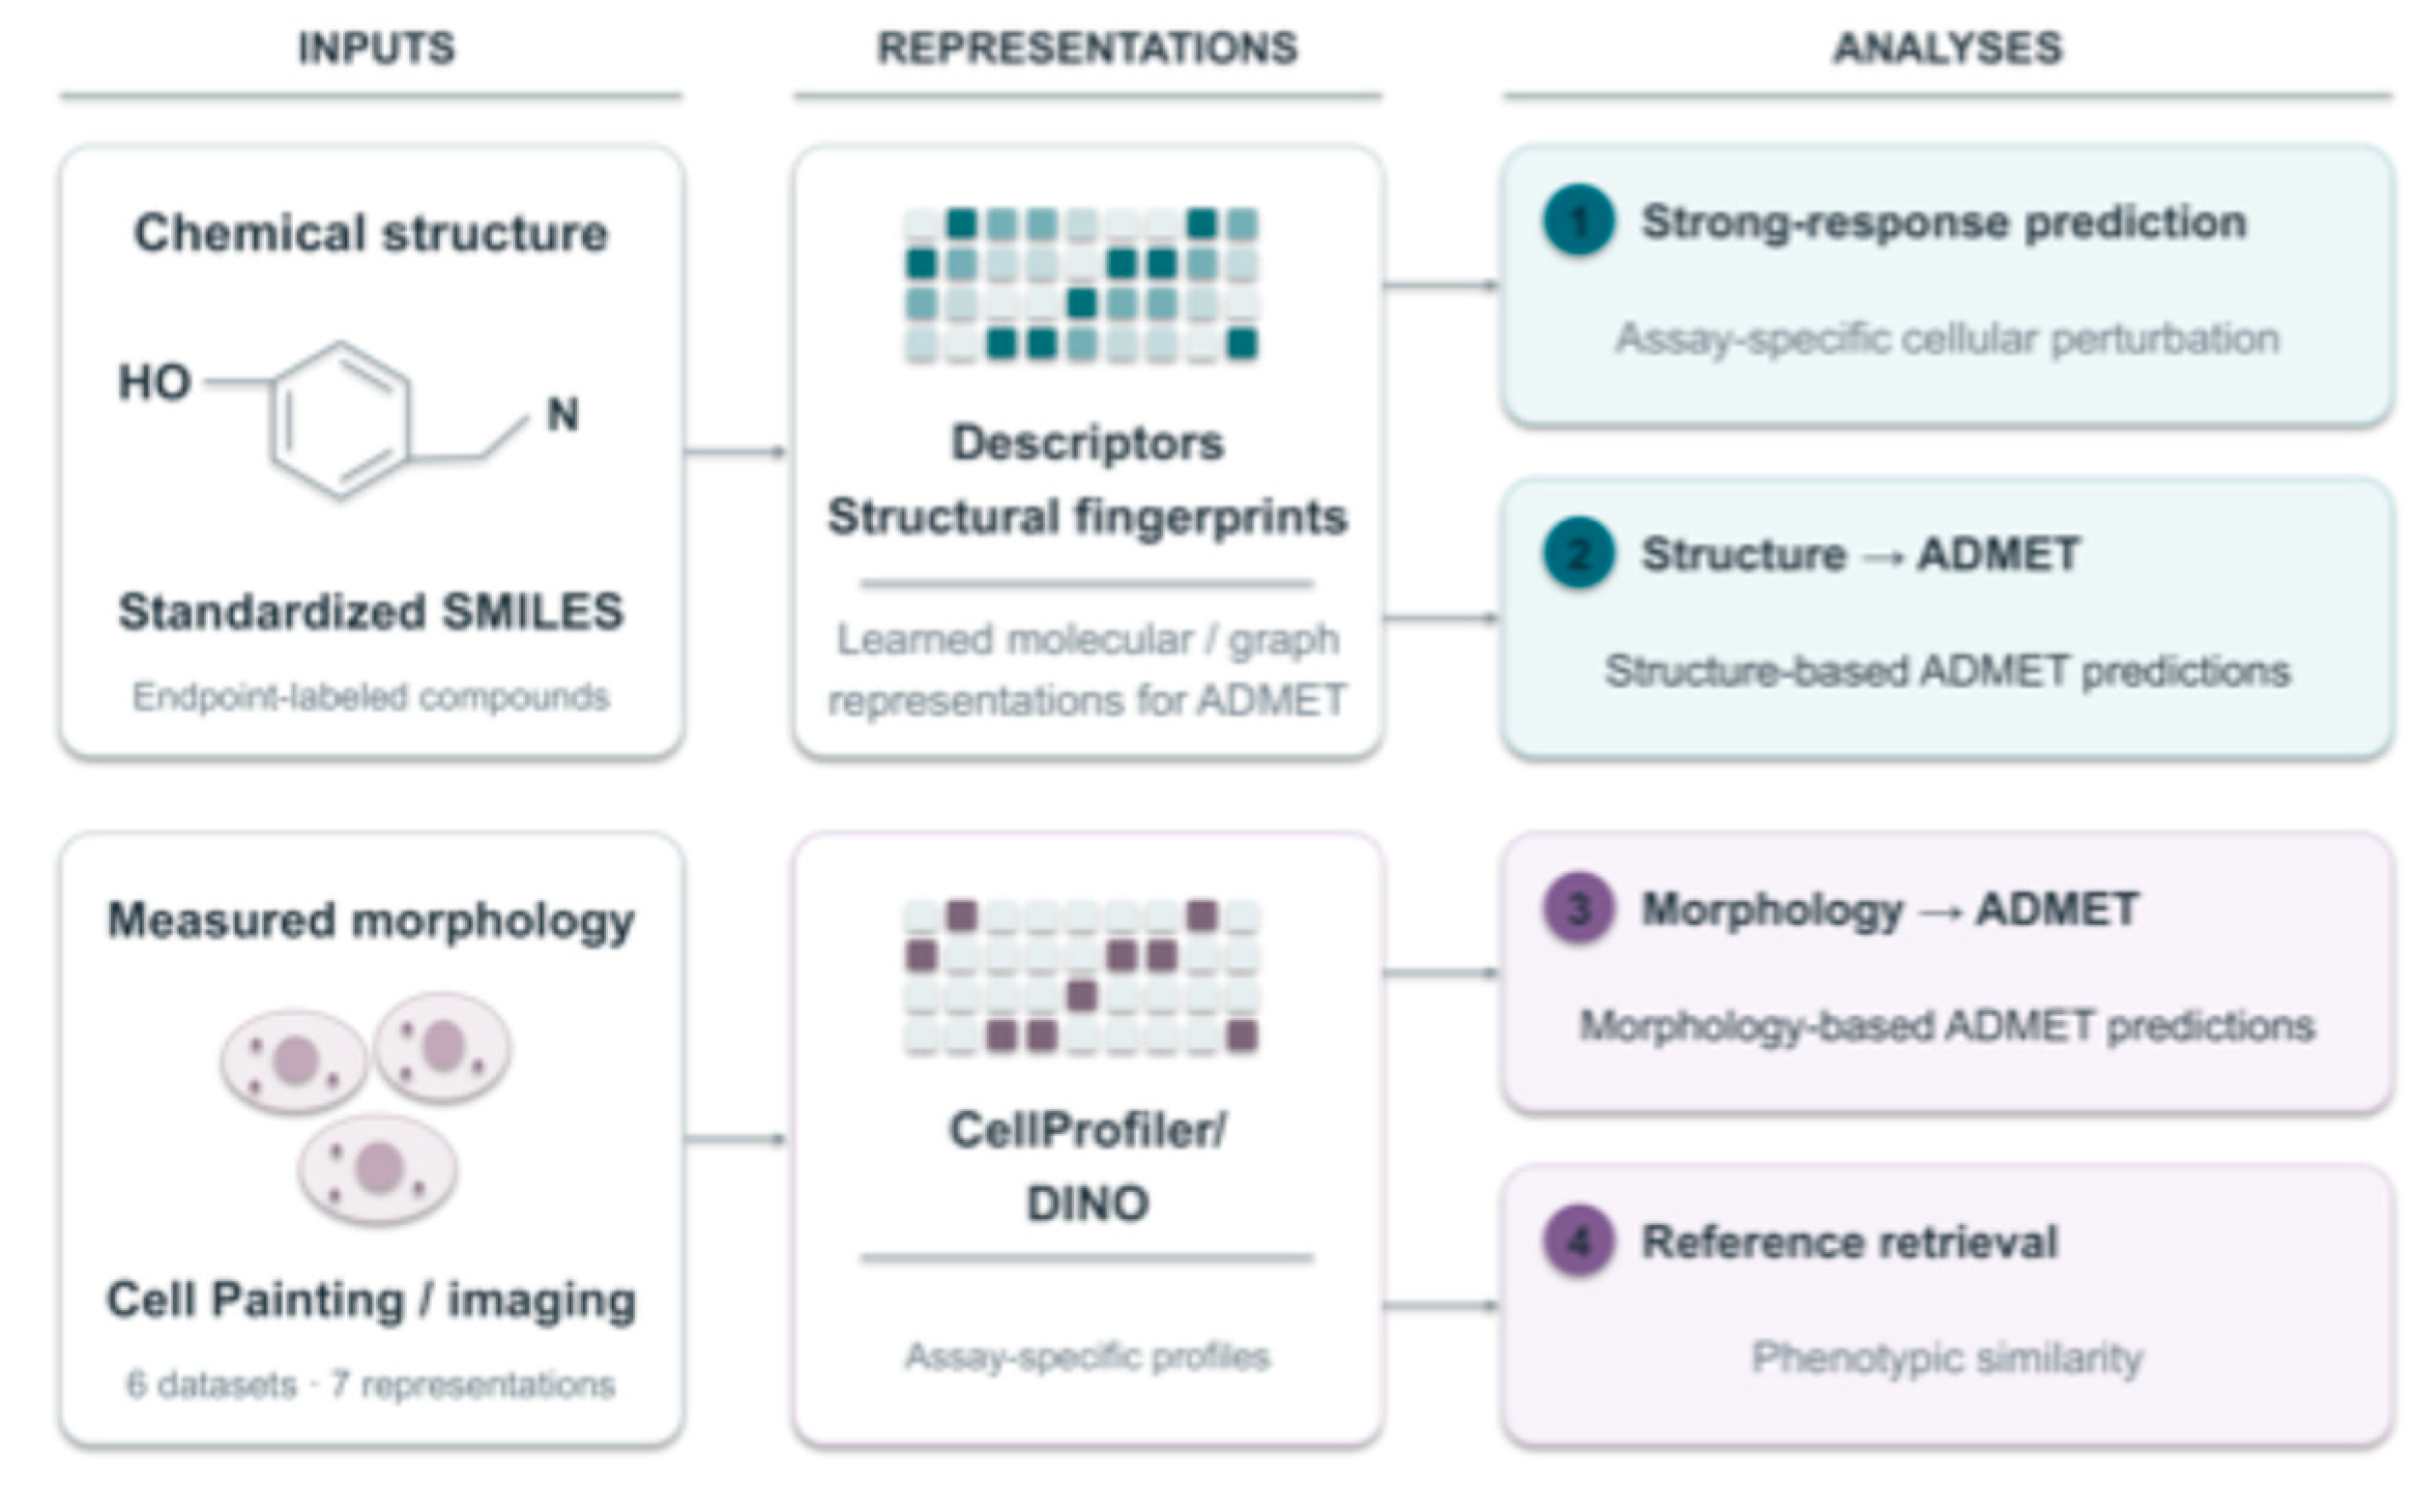
Figure 3.
Median morphological response differences across safety endpoints. Panels show (A) hERG inhibition, (B) DICTrank cardiotoxicity, (C) DILI, (D) DIRIL, and (E) Ames mutagenicity across six cellular contexts, labeled by cell description: bone cancer cells (U2OS, JUMP), primary liver cells (primary human hepatocytes, OASIS), lung cancer cells (A549, LINCS), liver cancer cells (HepG2, EU-OS), primary vascular endothelial cells (HUVEC, RxRx3-core), and primary kidney epithelial cells (HRCE, RxRx19a). Each point represents the median response among endpoint-positive compounds minus the median response among endpoint-negative compounds. Values to the right of zero indicate greater median response among positive compounds; values to the left indicate greater response among negative compounds. Horizontal bars are pointwise 95% bootstrap confidence intervals calculated using 2,000 resamples. An interval crossing zero leaves the direction uncertain. Counts beside each row give positive/negative compound numbers. Colors identify cellular contexts. These descriptive comparisons do not measure classifier performance or establish multiplicity-adjusted significance. Response-magnitude distributions for each endpoint are shown in Supplementary Figure S1a–S1k.
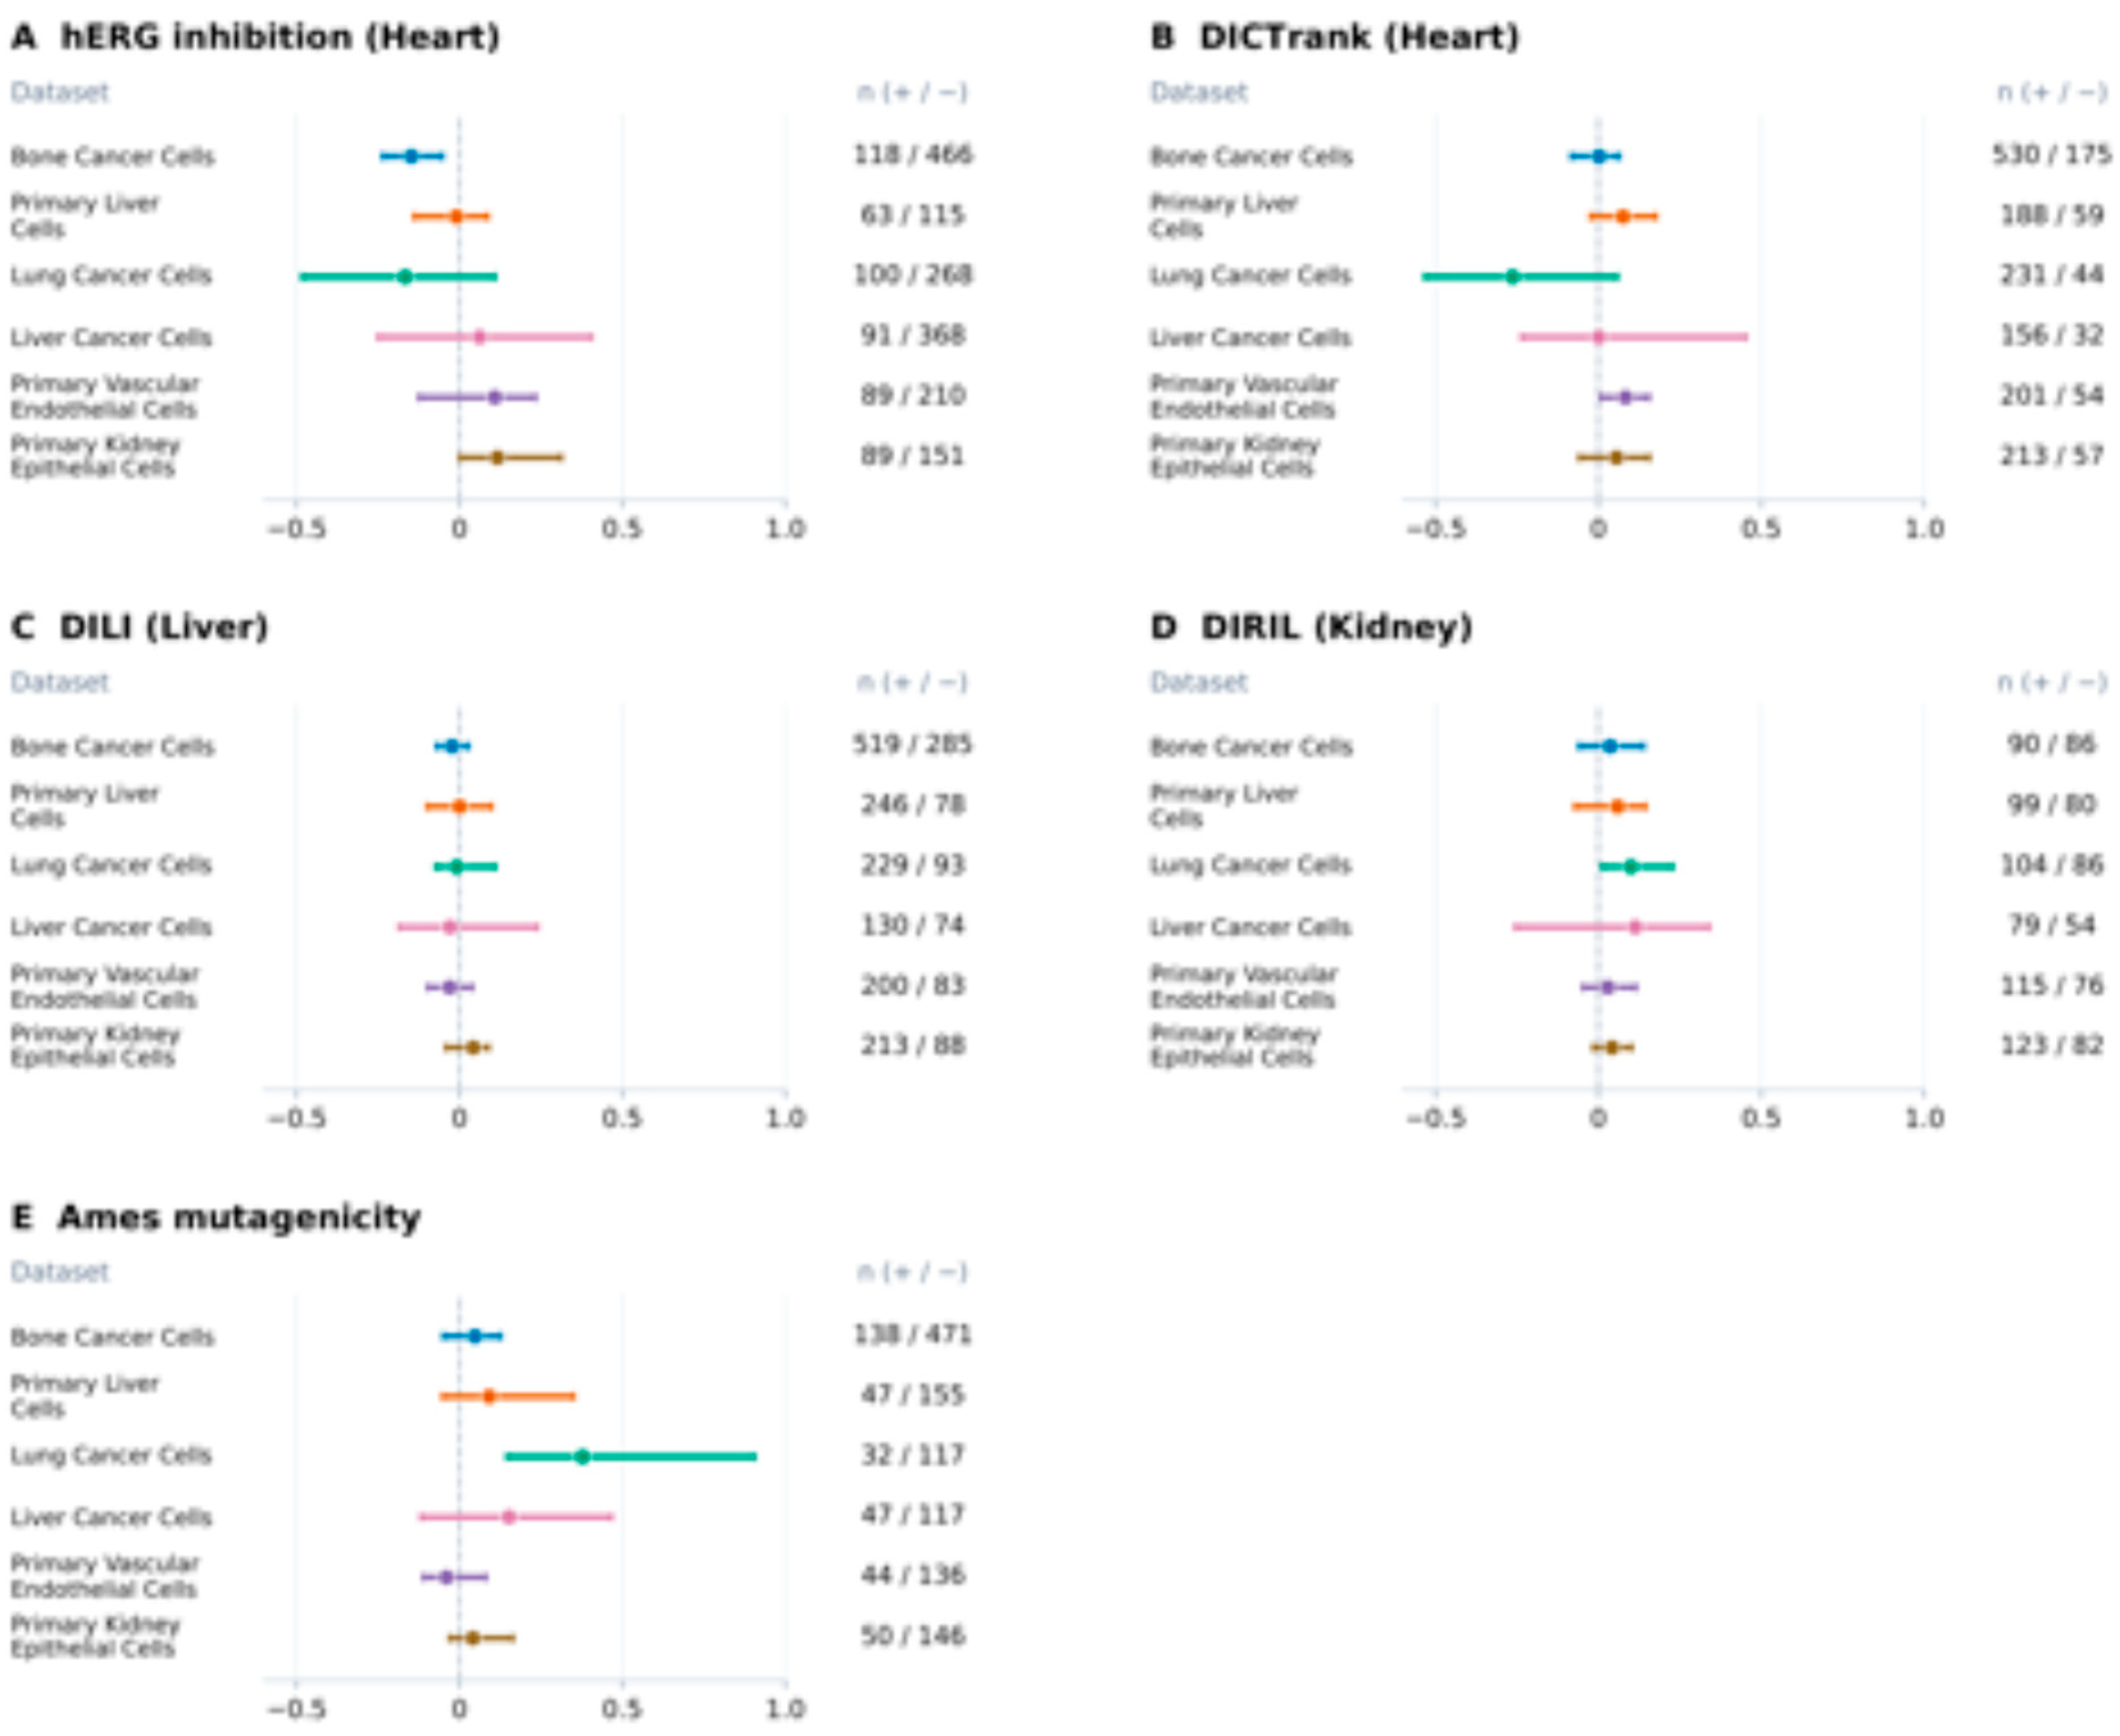
Figure 4.
Median morphological response differences across distribution and metabolism endpoints. Panels show (A) BBB penetration and inhibition of (B) CYP1A2, (C) CYP2C19, (D) CYP2C9, (E) CYP2D6, and (F) CYP3A4. Points are positive-minus-negative differences in median morphological response across the same six cellular contexts and labeling convention as Figure 3. Horizontal bars are pointwise 95% bootstrap confidence intervals from 2,000 resamples, and the dashed vertical line marks zero. Positive values indicate greater response among positive compounds. Counts give positive/negative compound numbers. Endpoint positivity denotes penetration or inhibition, as appropriate, and does not have a uniform interpretation as toxicity. The panel does not include solubility.
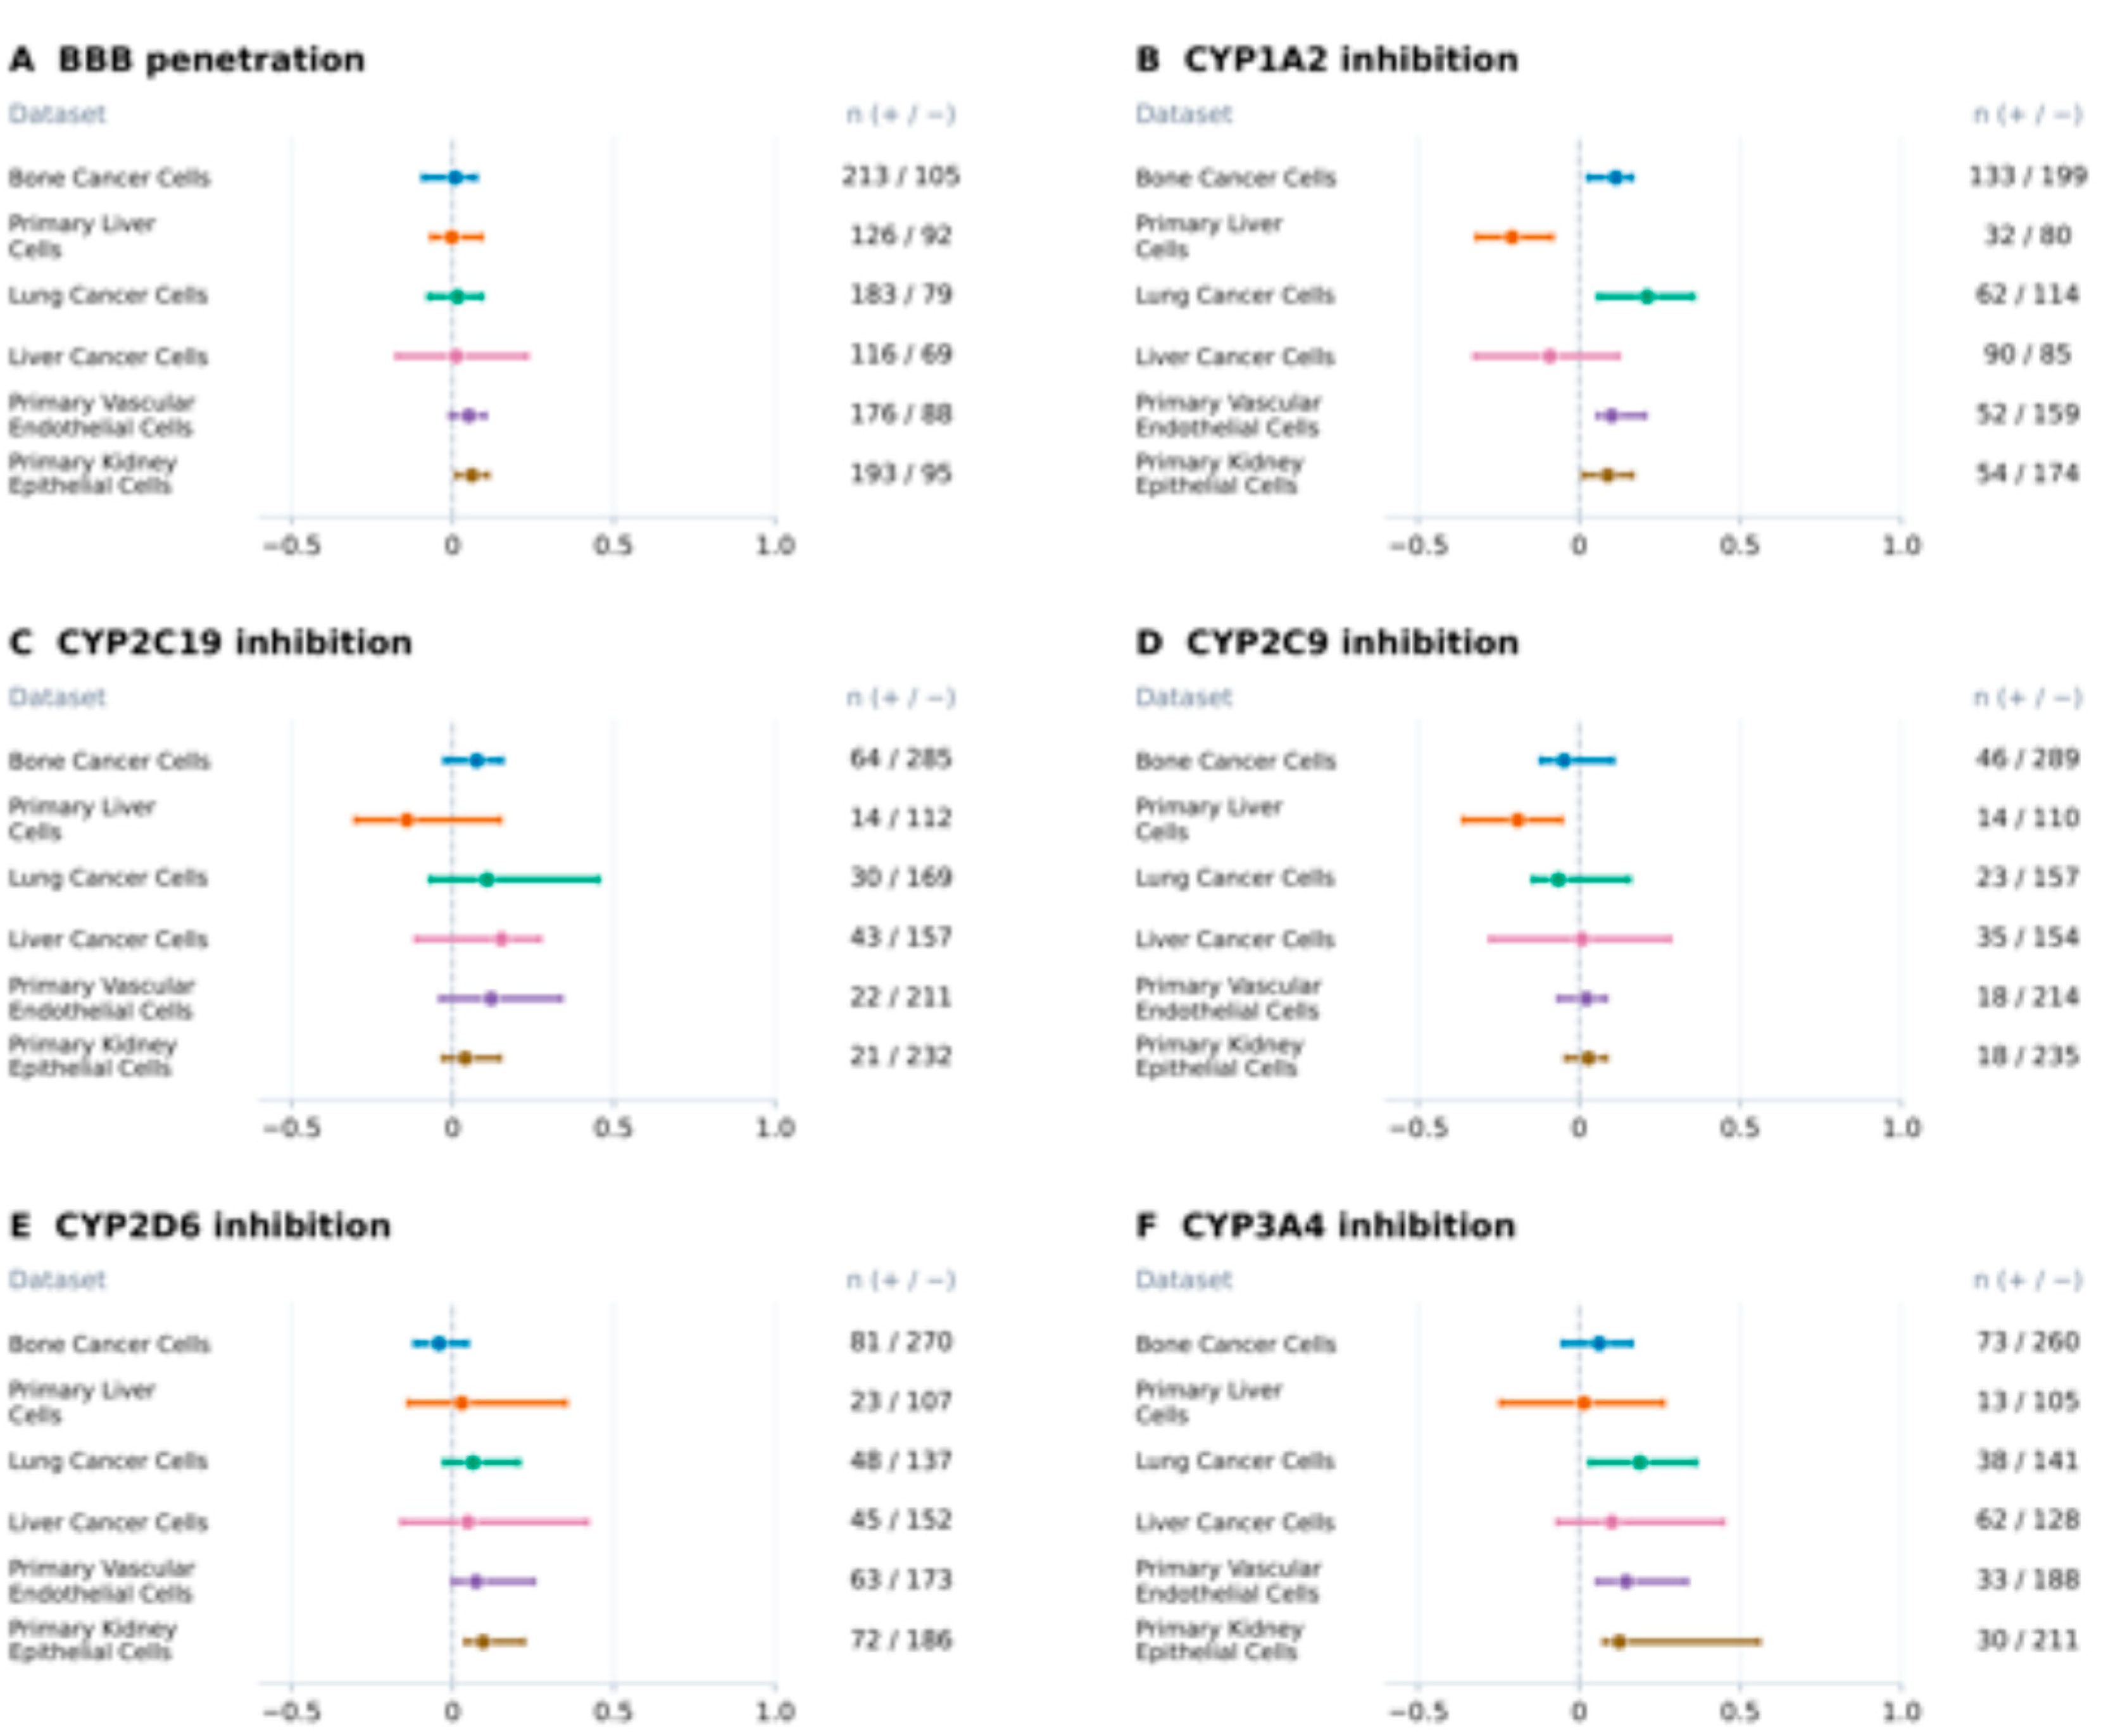
Figure 5.
Prediction of strong morphological response from chemical structure. Reserved-test AP and AUROC of the selected MorphADMET response ensembles in bone cancer cells (U2OS), liver cancer cells (HepG2), lung cancer cells (A549), primary vascular endothelial cells (HUVEC), and primary kidney epithelial cells (HRCE). Strong responses exceed the assay-specific development-set 90th-percentile threshold. Blue and orange bars show AP and AUROC, respectively. Percentages below the context labels indicate strong-response prevalence in the test set (10.0%, 7.5%, 11.3%, 13.6%, and 7.7%), which provides the AP reference. Random-ranking AUROC is 0.50. OASIS was excluded from this analysis because of insufficient strong responders in development folds. Baseline comparisons and compound counts are reported in Supplementary Table S3.
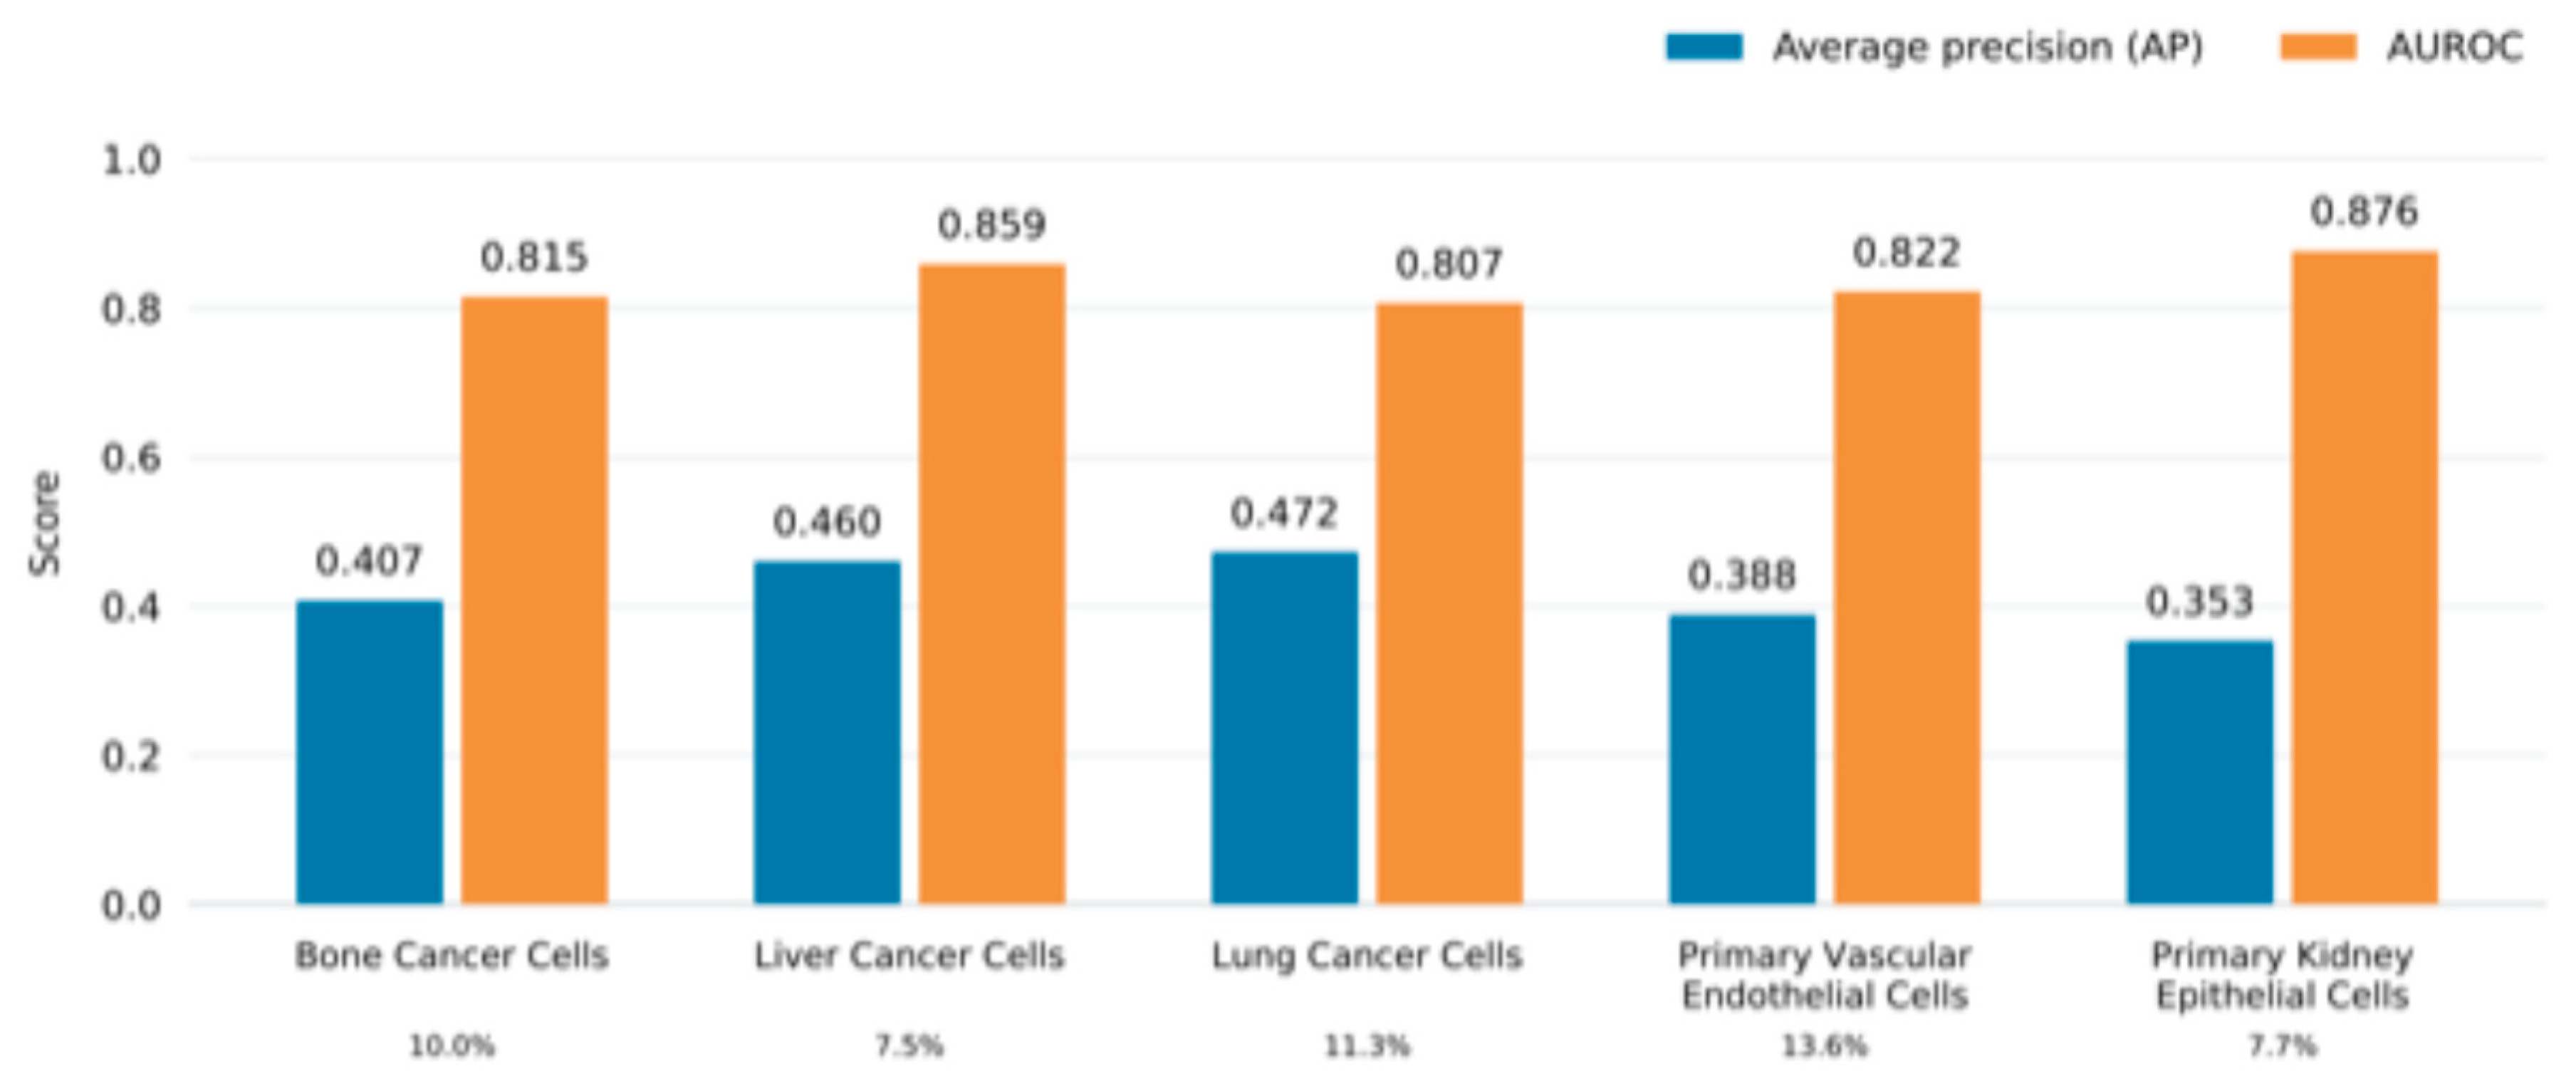
Figure 6.
ADMET prediction from measured cellular morphology. Panels (A)–(G) show reserved-test AP and AUROC for eleven classification endpoints using bone cancer cell (U2OS) CellProfiler, primary liver cell CellProfiler, primary liver cell DINOv2, lung cancer cell (A549) CellProfiler, liver cancer cell (HepG2) CellProfiler, primary vascular endothelial cell (HUVEC) CellProfiler, and primary kidney epithelial cell (HRCE) Cell-DINO profiles, respectively. Each endpoint–representation model was selected using development cross-validation. Percentages denote positive test-compound prevalence, the reference for AP; random-ranking AUROC is 0.50. Panel (H) shows solubility MAE in log10 mol/L. Lower MAE indicates better performance. Endpoint-specific populations differ between contexts, and some have few positives. Test counts are provided in 3.4. Compartment Level Features Reveal Endpoint Associated Morphological Patterns
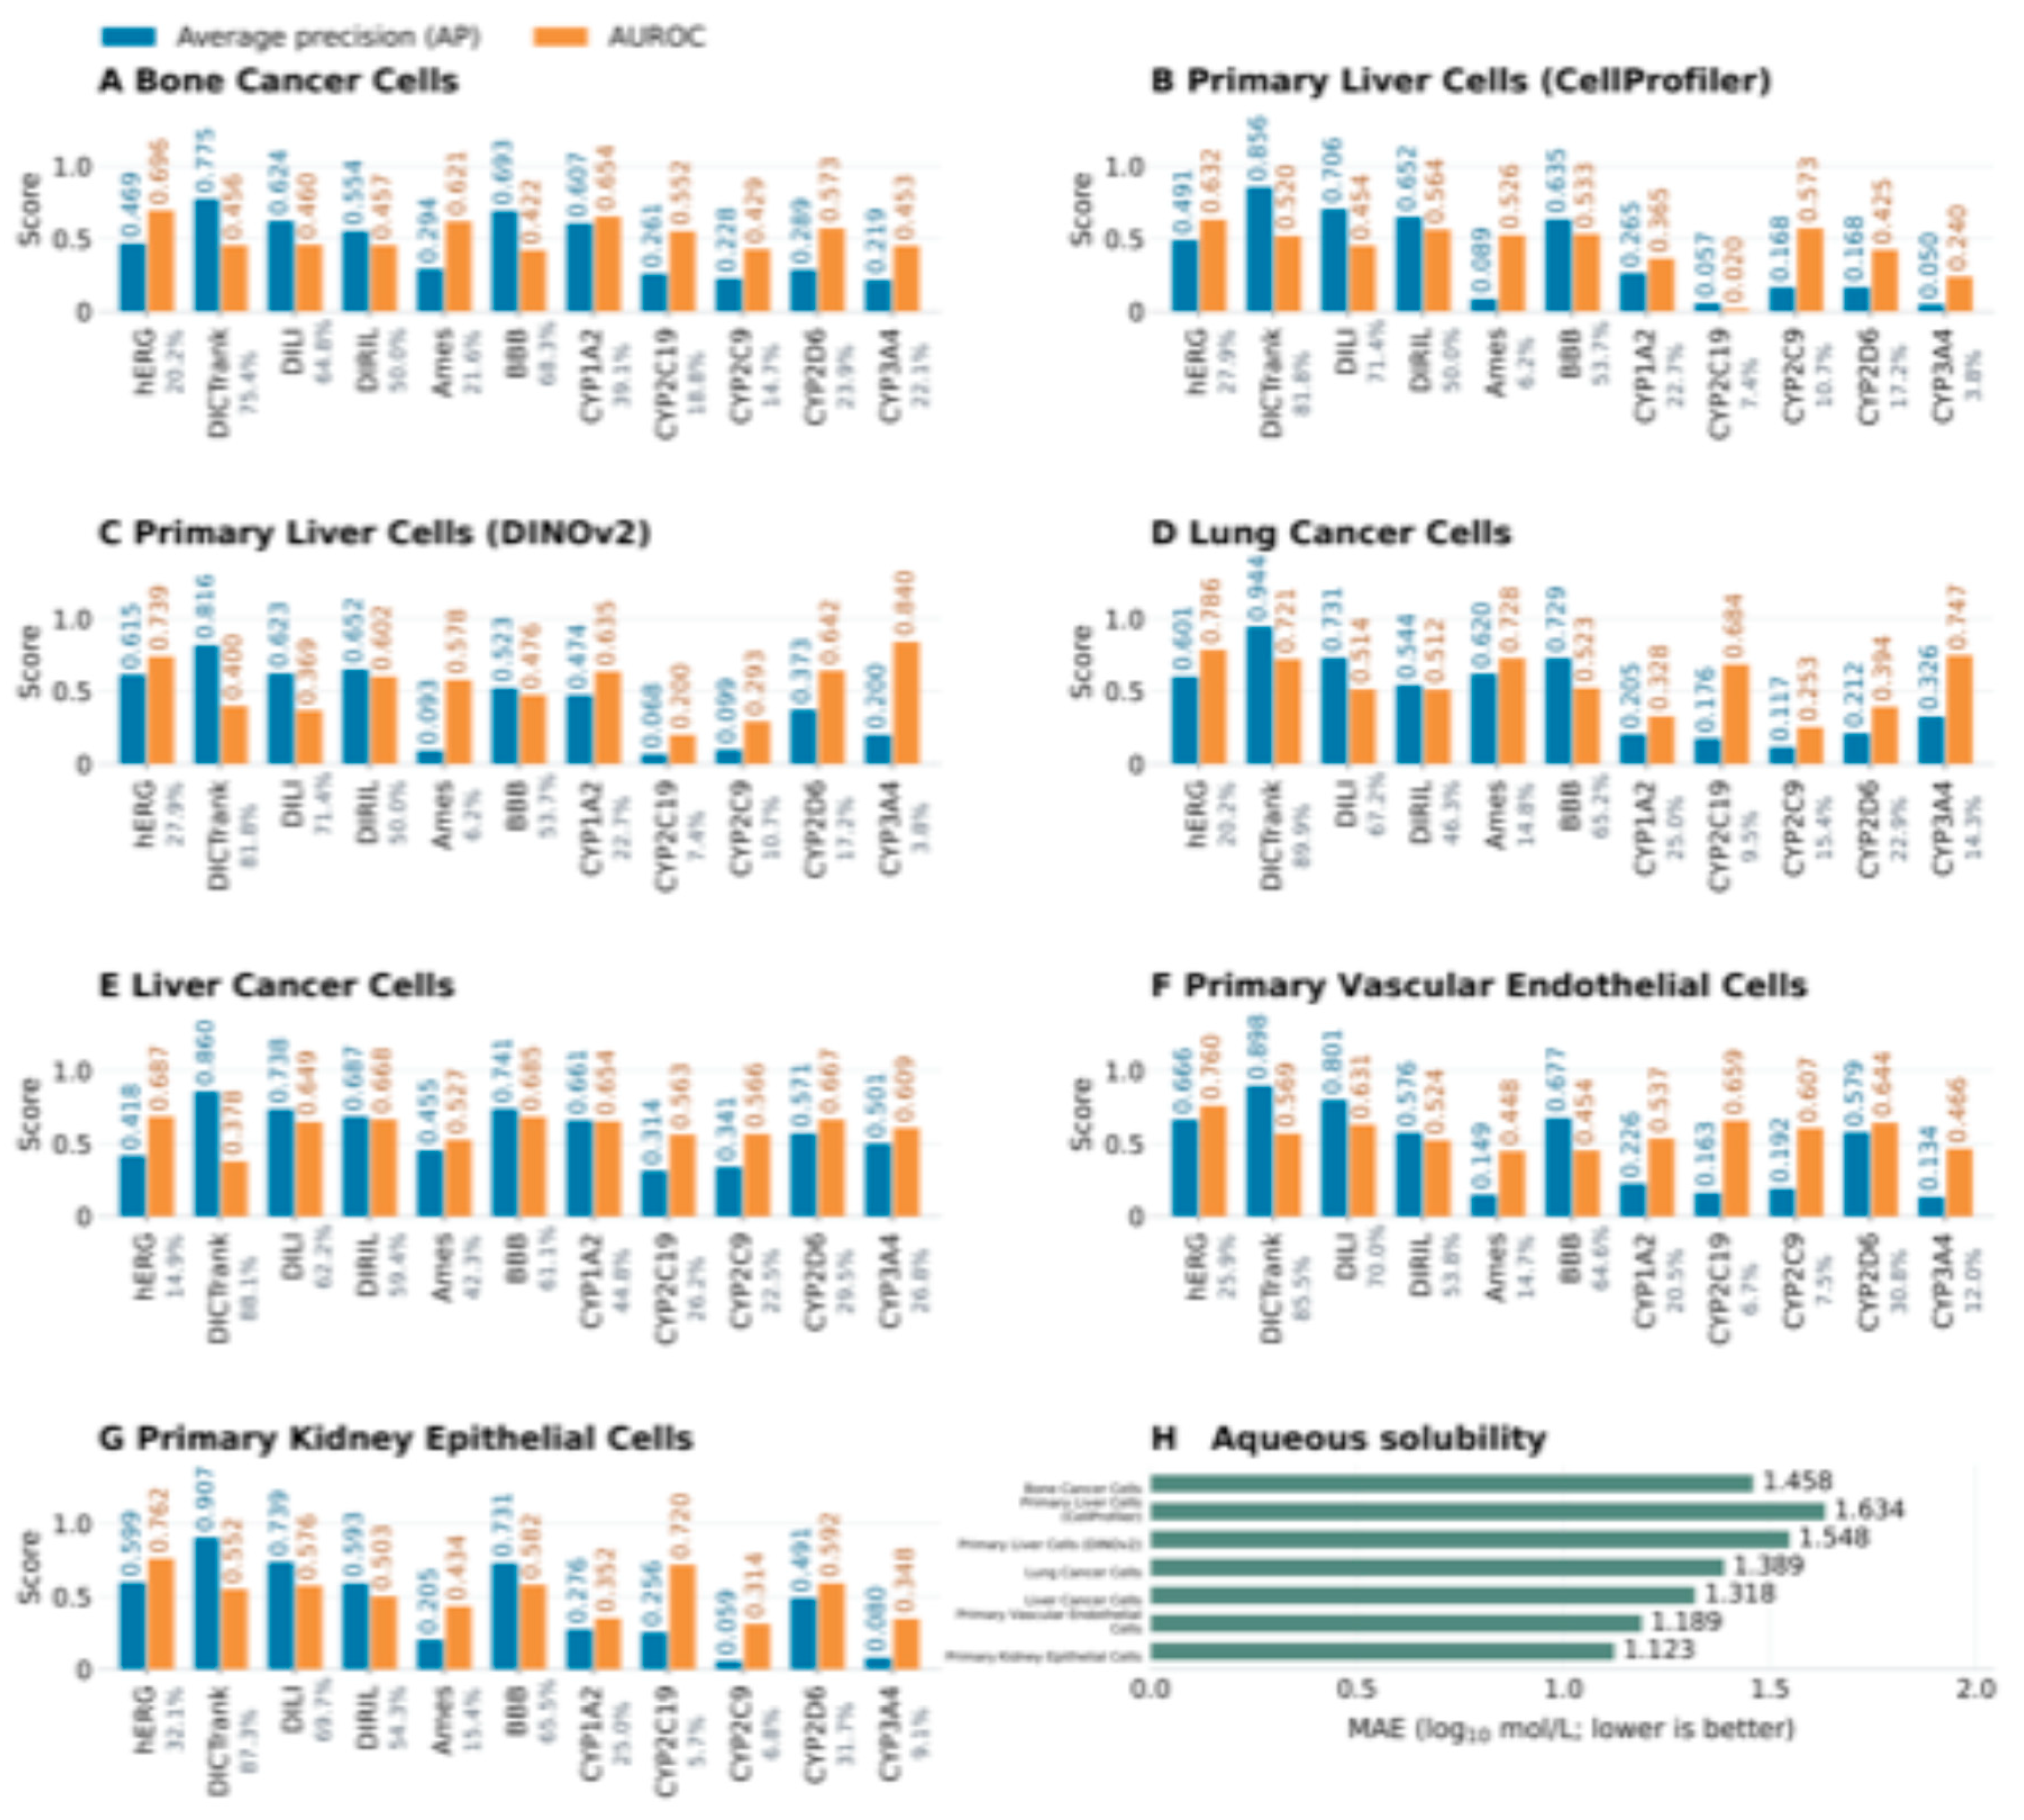
Figure 7.
Exploratory compartment level features associated with endpoint labels. Selected morphological features are shown for (A) lung cancer cells (A549), hERG inhibition, with 203 negative and 85 positive development compounds; (B) liver cancer cells (HepG2), CYP1A2 inhibition, with 69 negative and 77 positive compounds; and (C) primary vascular endothelial cells (HUVEC), hERG inhibition, with 169 negative and 76 positive compounds. The panels show the indicated nuclear texture, cytoplasmic organization, and shape or texture measurements. Each dot represents a compound; violins show distributions, white dots mark medians, and dark bars show interquartile ranges. The vertical scale shows centered features divided by IQR. Features were selected and displayed using development compounds, so these are exploratory associations rather than independent validation or causal evidence.
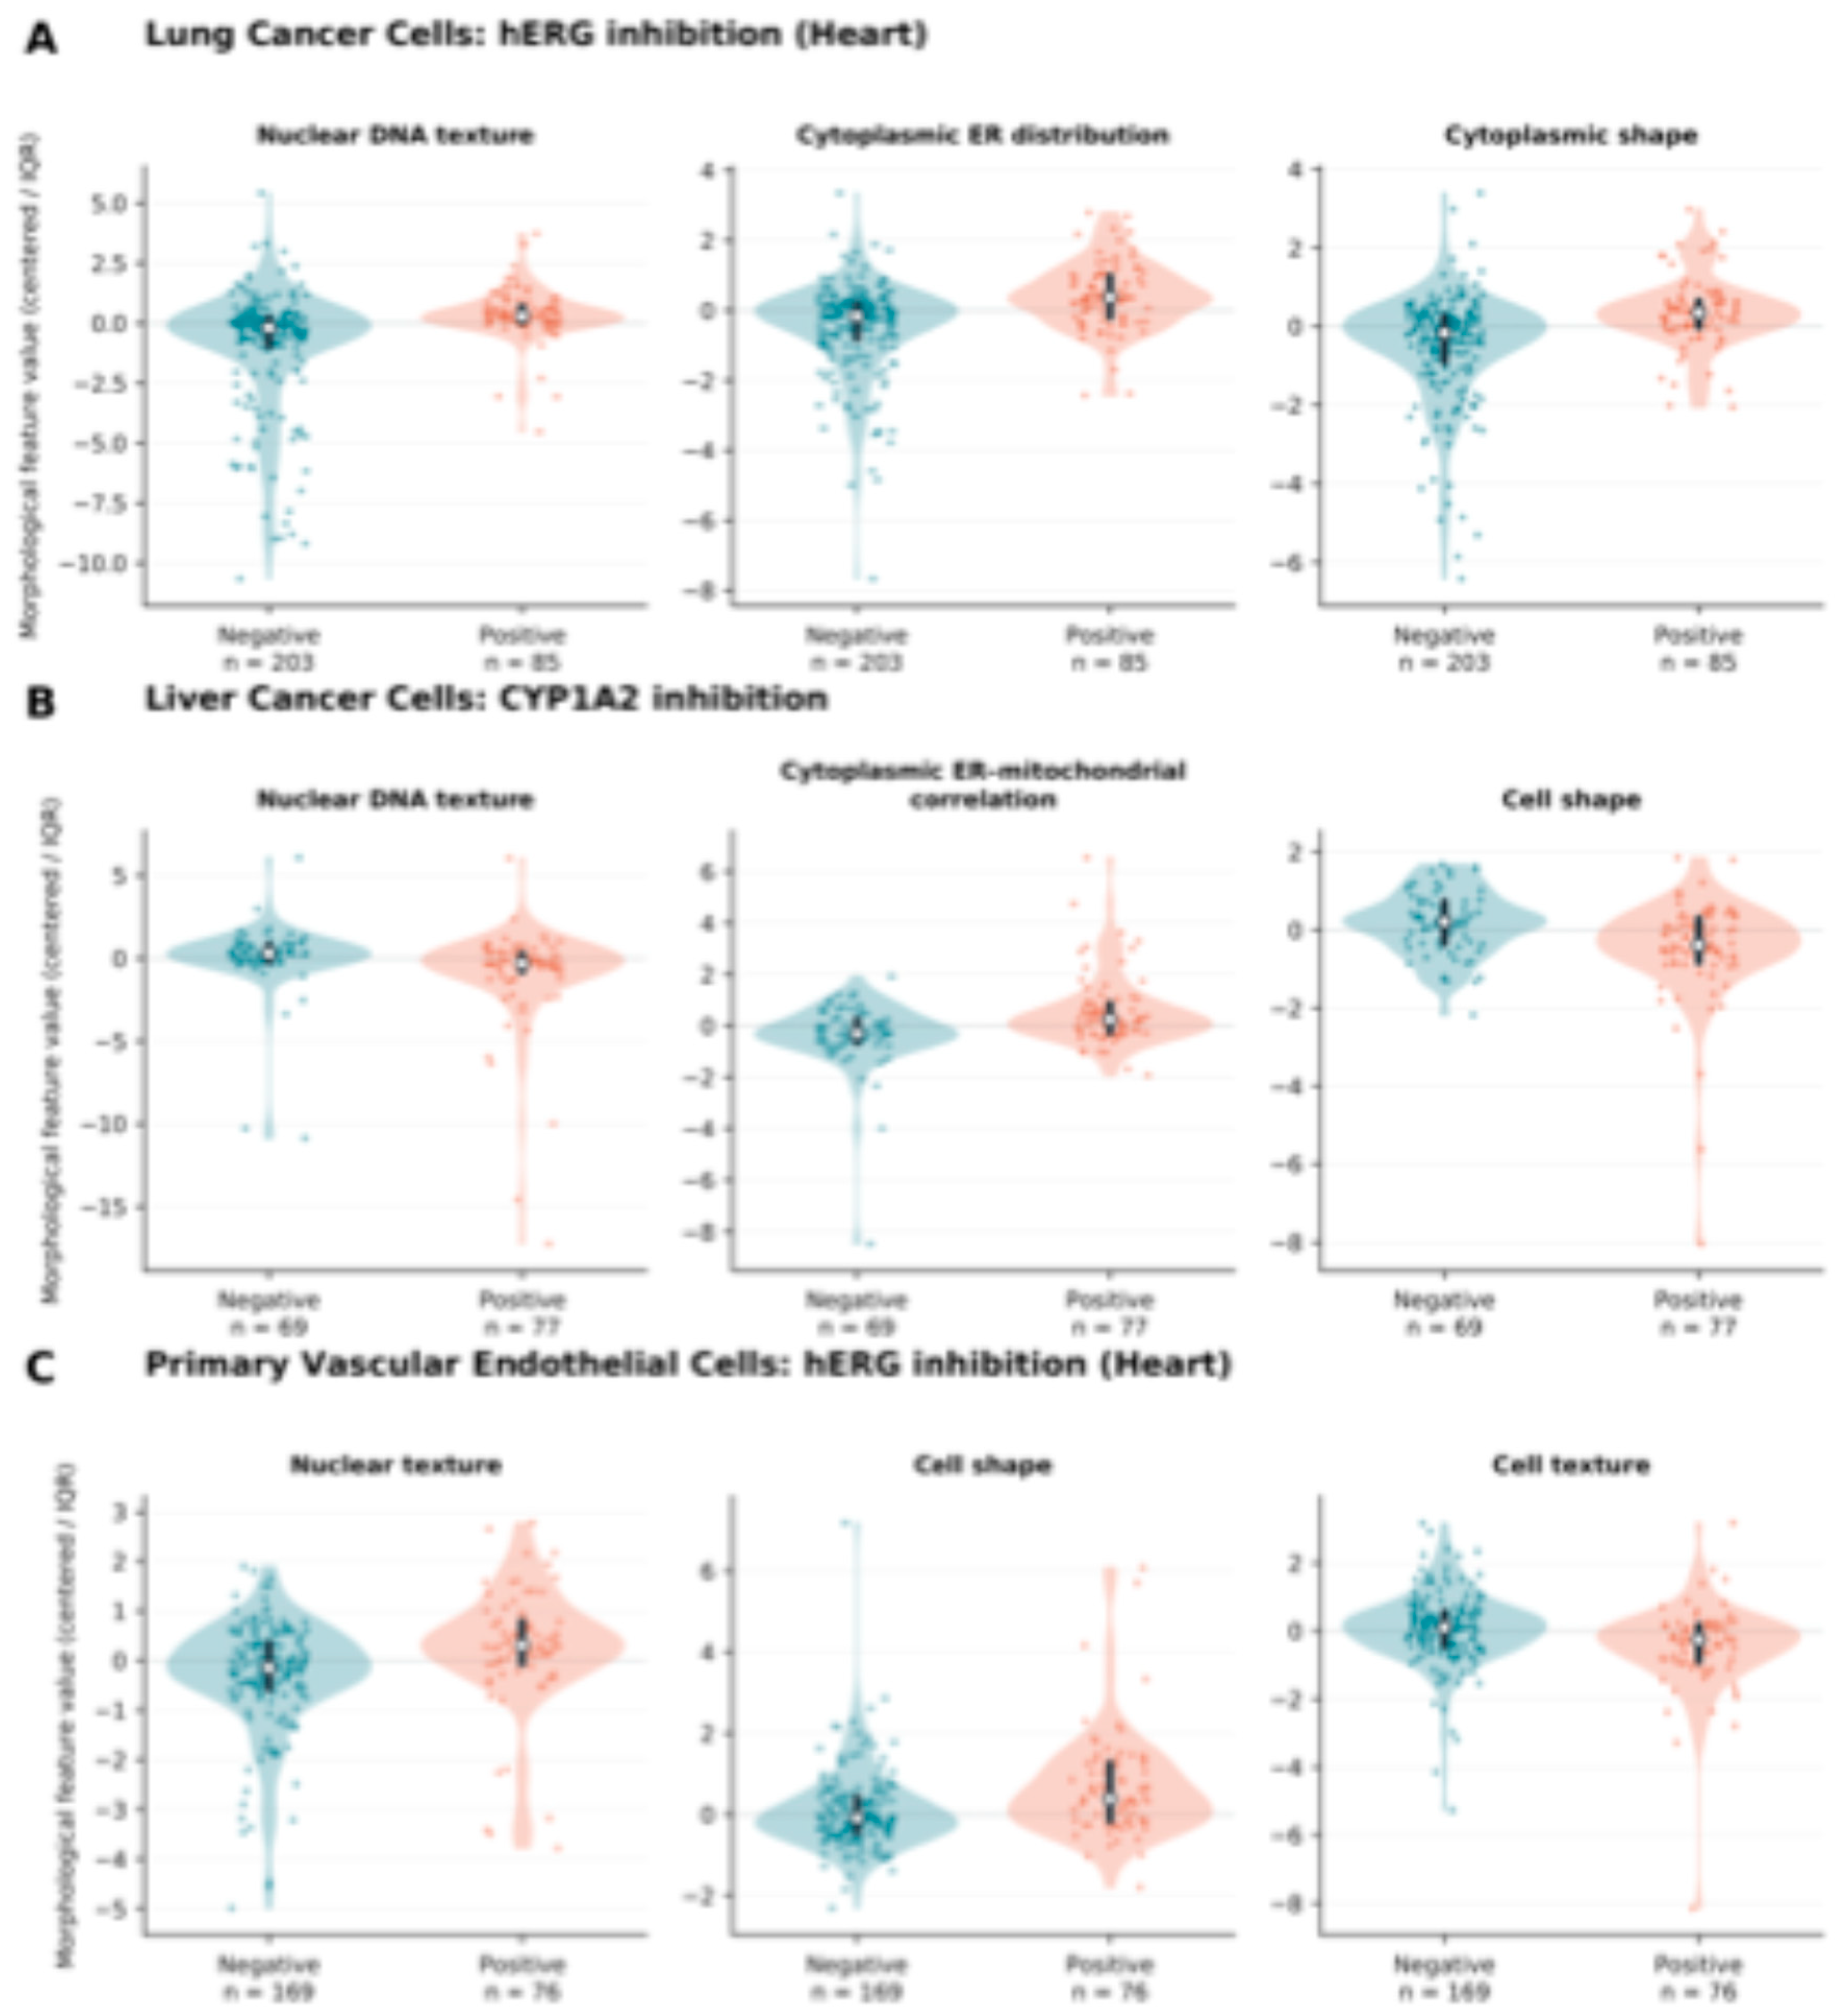
Figure 8.
Structure based ADMET benchmark on matched test compounds. MorphADMET is compared with MapLight, D-MPNN, CheMeleon, and ADMET-AI using (A) AP, (B) AUROC, and (C) solubility MAE. Each endpoint comparison uses the same endpoint-specific development and test compounds. Higher AP/AUROC and lower MAE indicate better performance. Percentages beside classification endpoints indicate test-set positive prevalence. Red diamonds and asterisks mark the best observed score among the five methods for that endpoint and metric, not statistical significance. Solubility error is expressed in log10 mol/L. Numerical scores and sample sizes are provided in Supplementary Table S6.
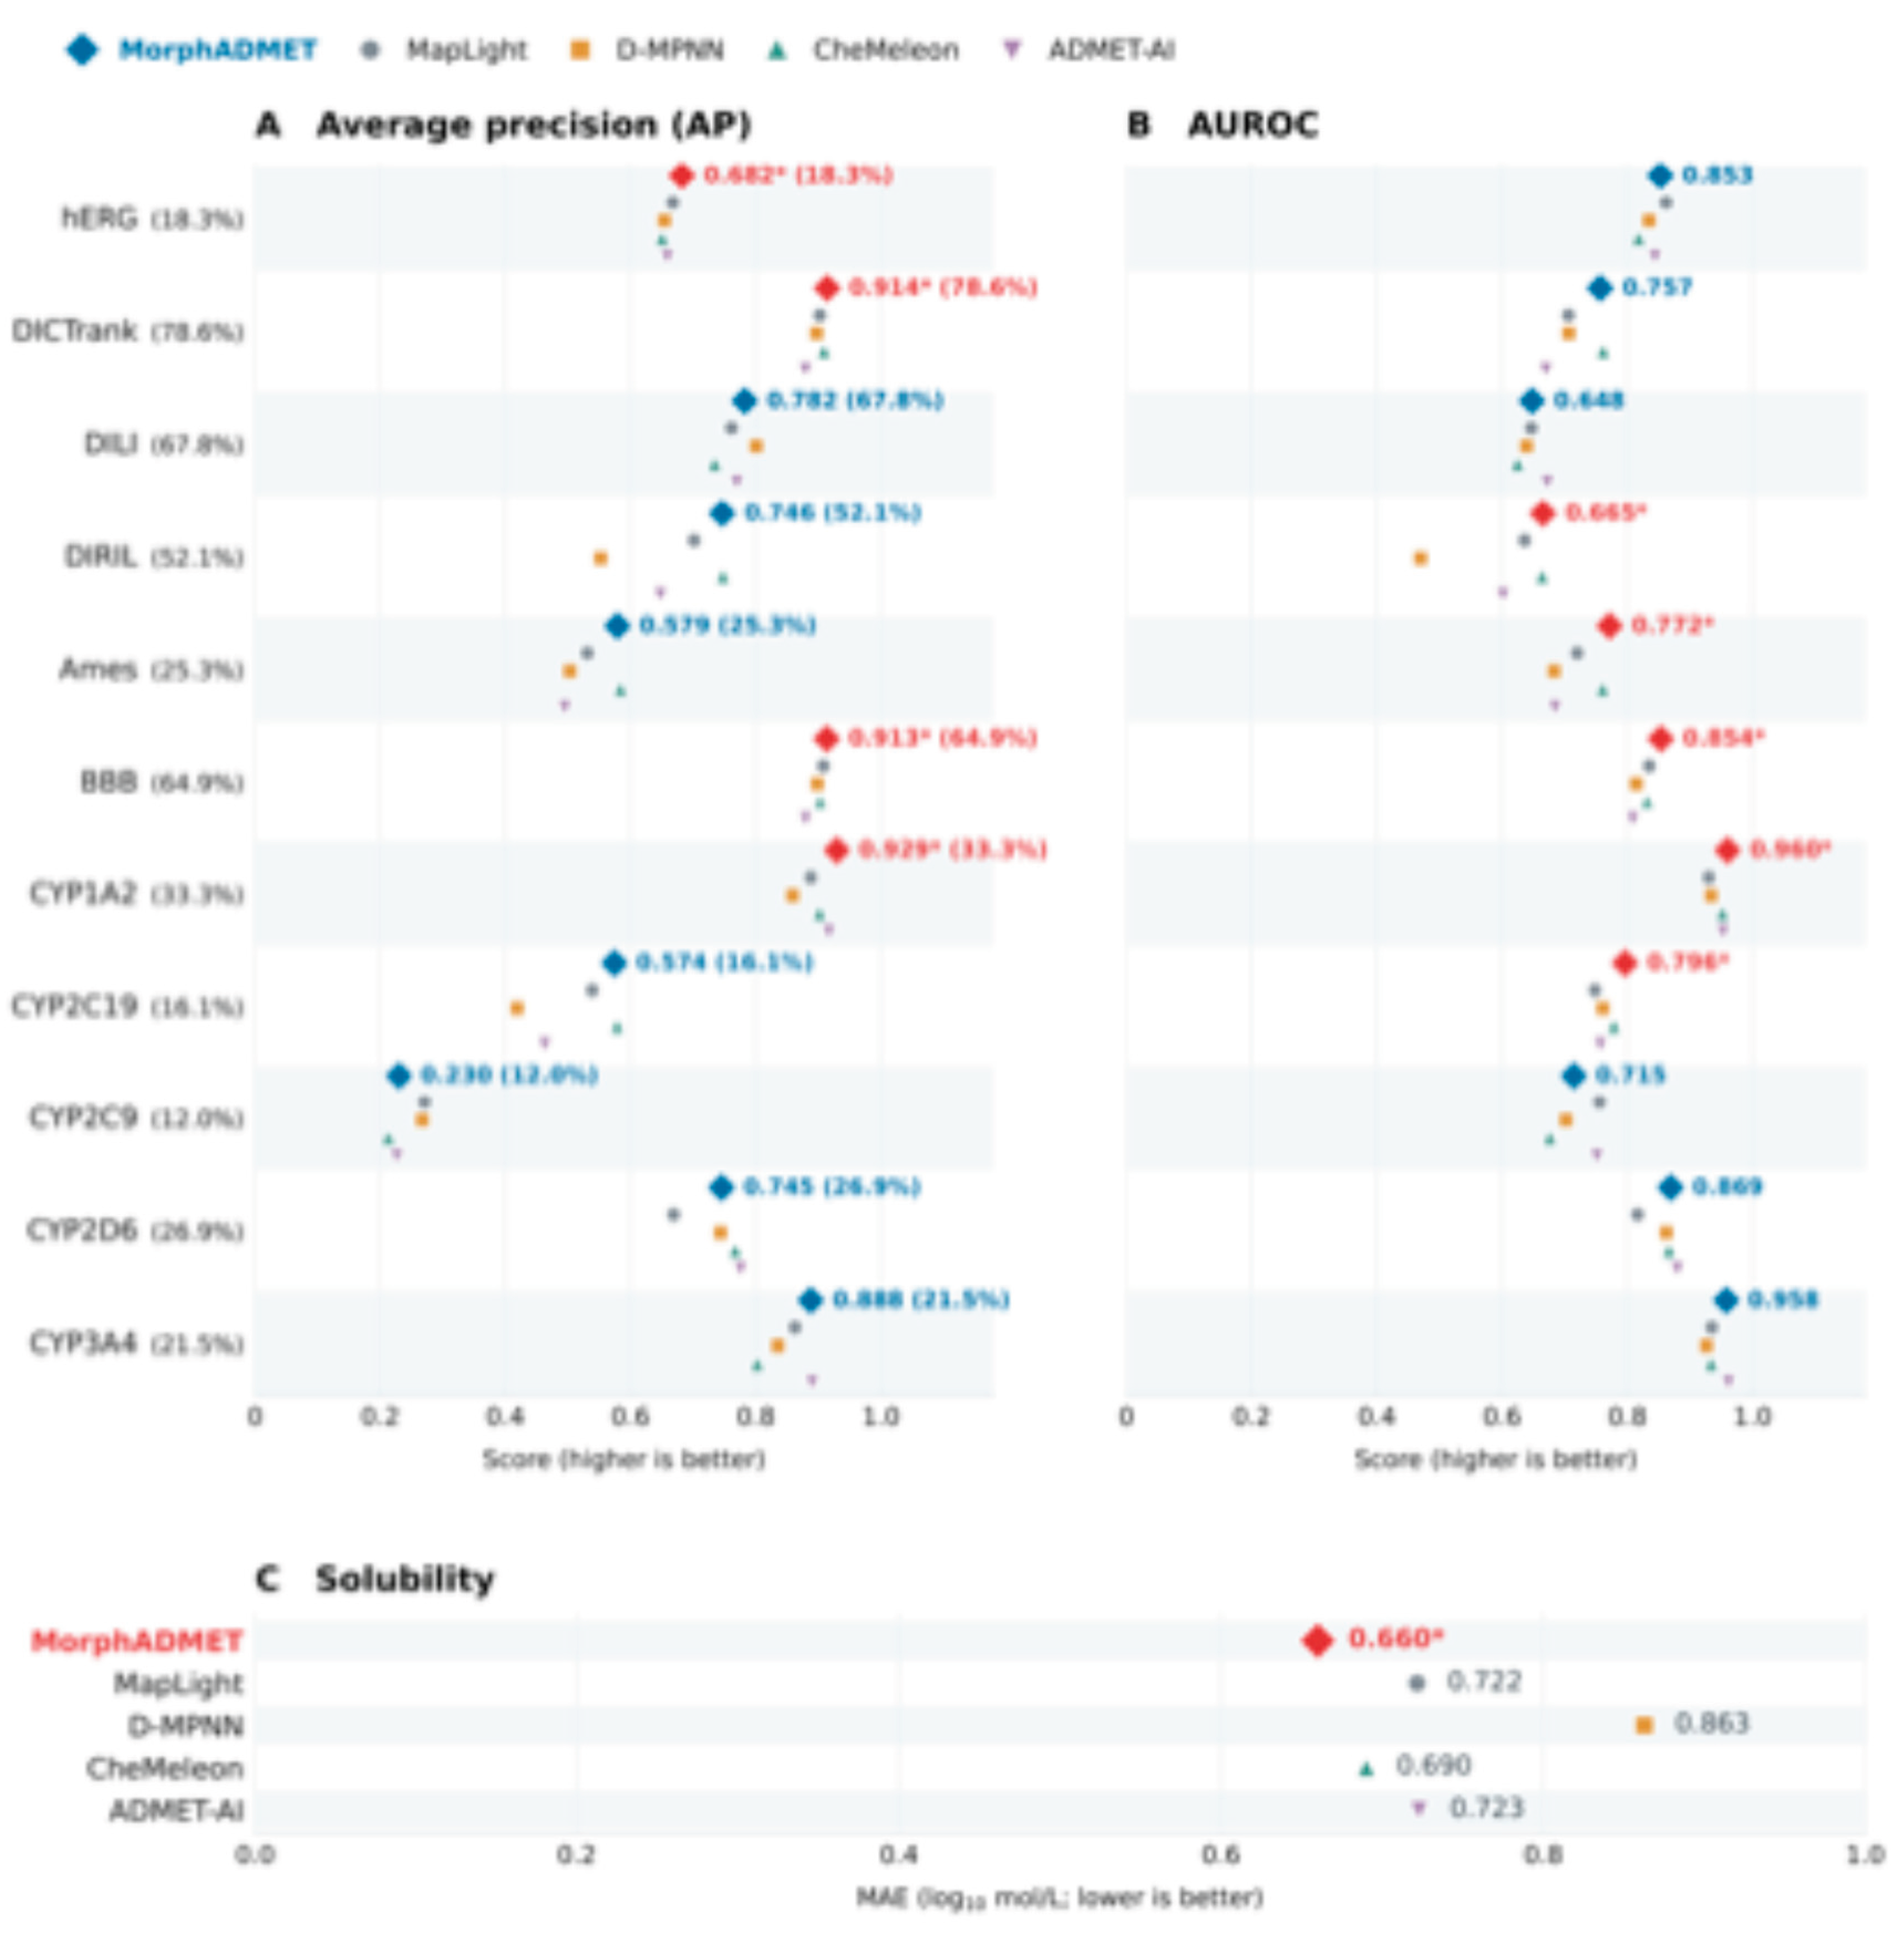
Figure 9.
Physicochemical properties of endpoint label groups in the compartment level contexts. RDKit-derived molecular weight, calculated logP, topological polar surface area, hydrogen-bond donor and acceptor counts, and aromatic-ring counts are shown for endpoint-negative and endpoint-positive development compounds in (A) lung cancer cells (A549), hERG inhibition, 203 negative and 85 positive; (B) liver cancer cells (HepG2), CYP1A2 inhibition, 69 negative and 77 positive; and (C) primary vascular endothelial cells (HUVEC), hERG inhibition, 169 negative and 76 positive. Compound sets match those in Figure 7. Each dot represents a compound; violins show distributions, white dots mark medians, and dark bars show interquartile ranges. The groups were defined by experimental endpoint labels and were not matched on chemical properties, so these displays describe the chemical composition of the label groups rather than isolating chemical from phenotypic contributions.
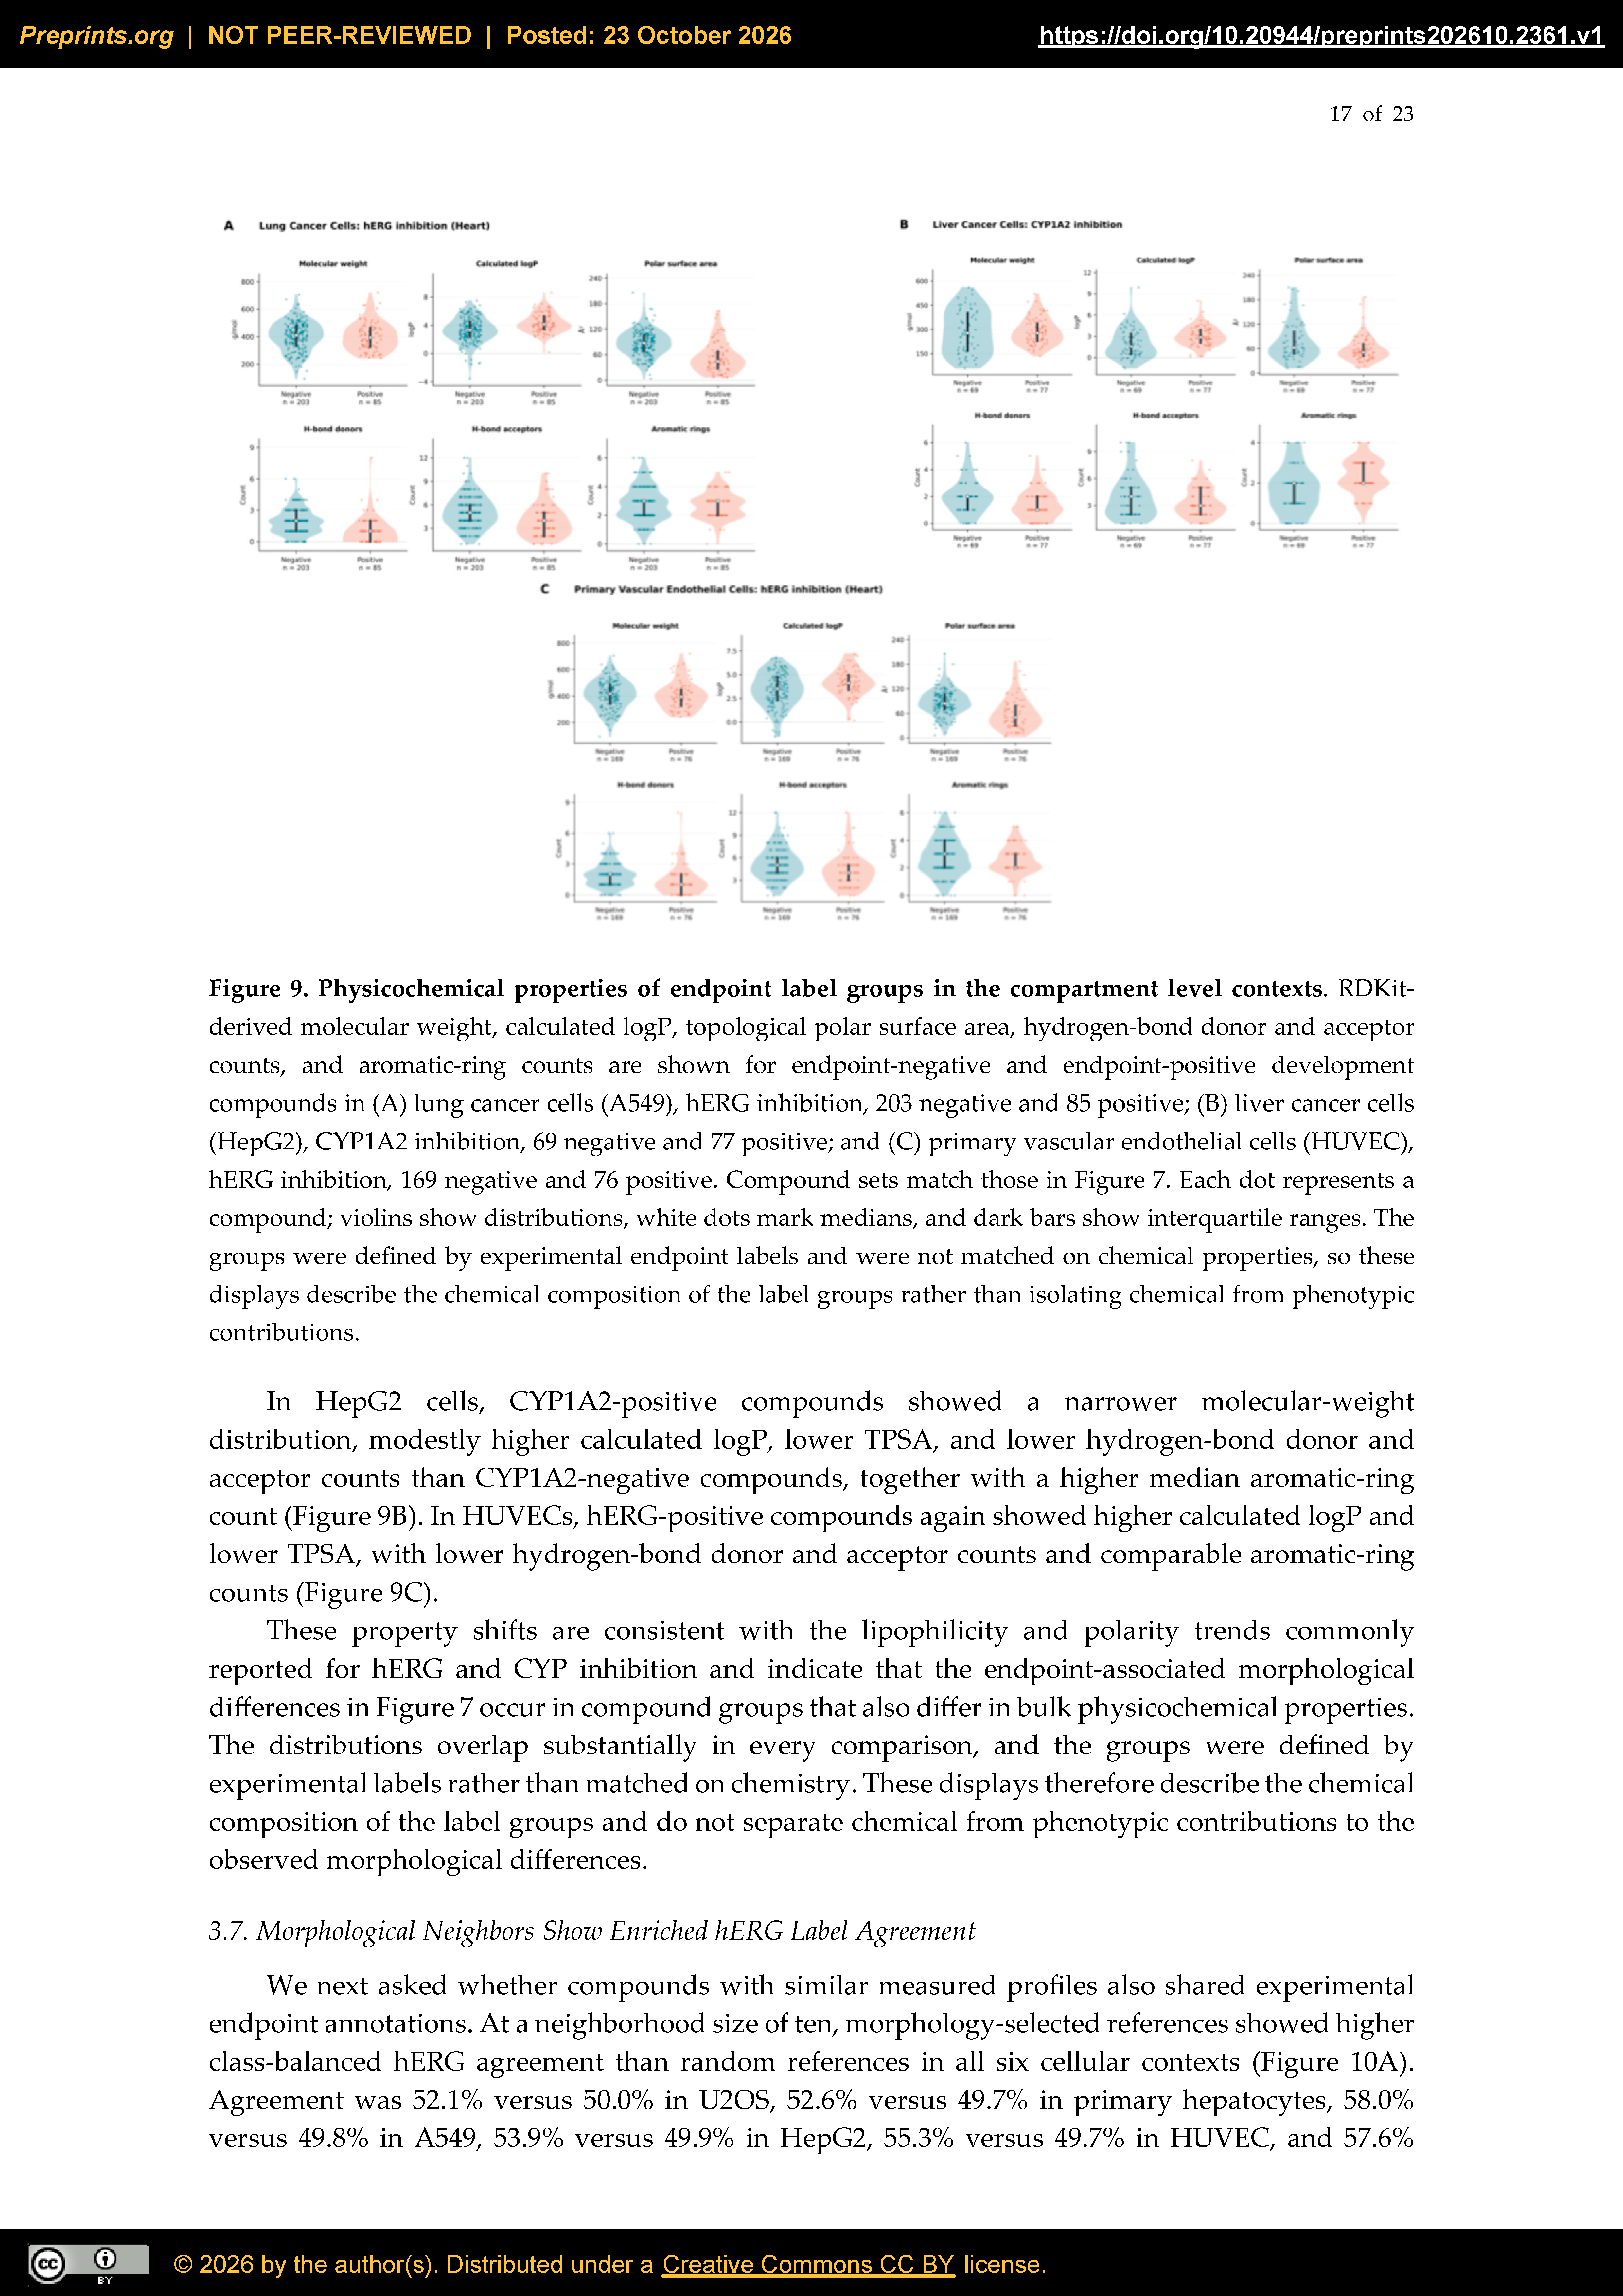
Figure 10.
Experimental endpoint agreement among morphological neighbors. (A) Class-balanced hERG same-label agreement for ten morphology-selected references and ten random references in six cellular contexts. Class balancing gives equal weight to mean agreement for positive and negative queries. (B) Agreement differences across eleven binary endpoints, calculated as morphology-selected minus random agreement in percentage points. Lines connect point estimates to zero and are not confidence intervals. Positive values indicate higher agreement for morphological neighbors; negative values indicate lower agreement. The analysis uses experimental query and reference annotations, not model-predicted labels. Rounded percentages in panel A may not reproduce panel B differences exactly.
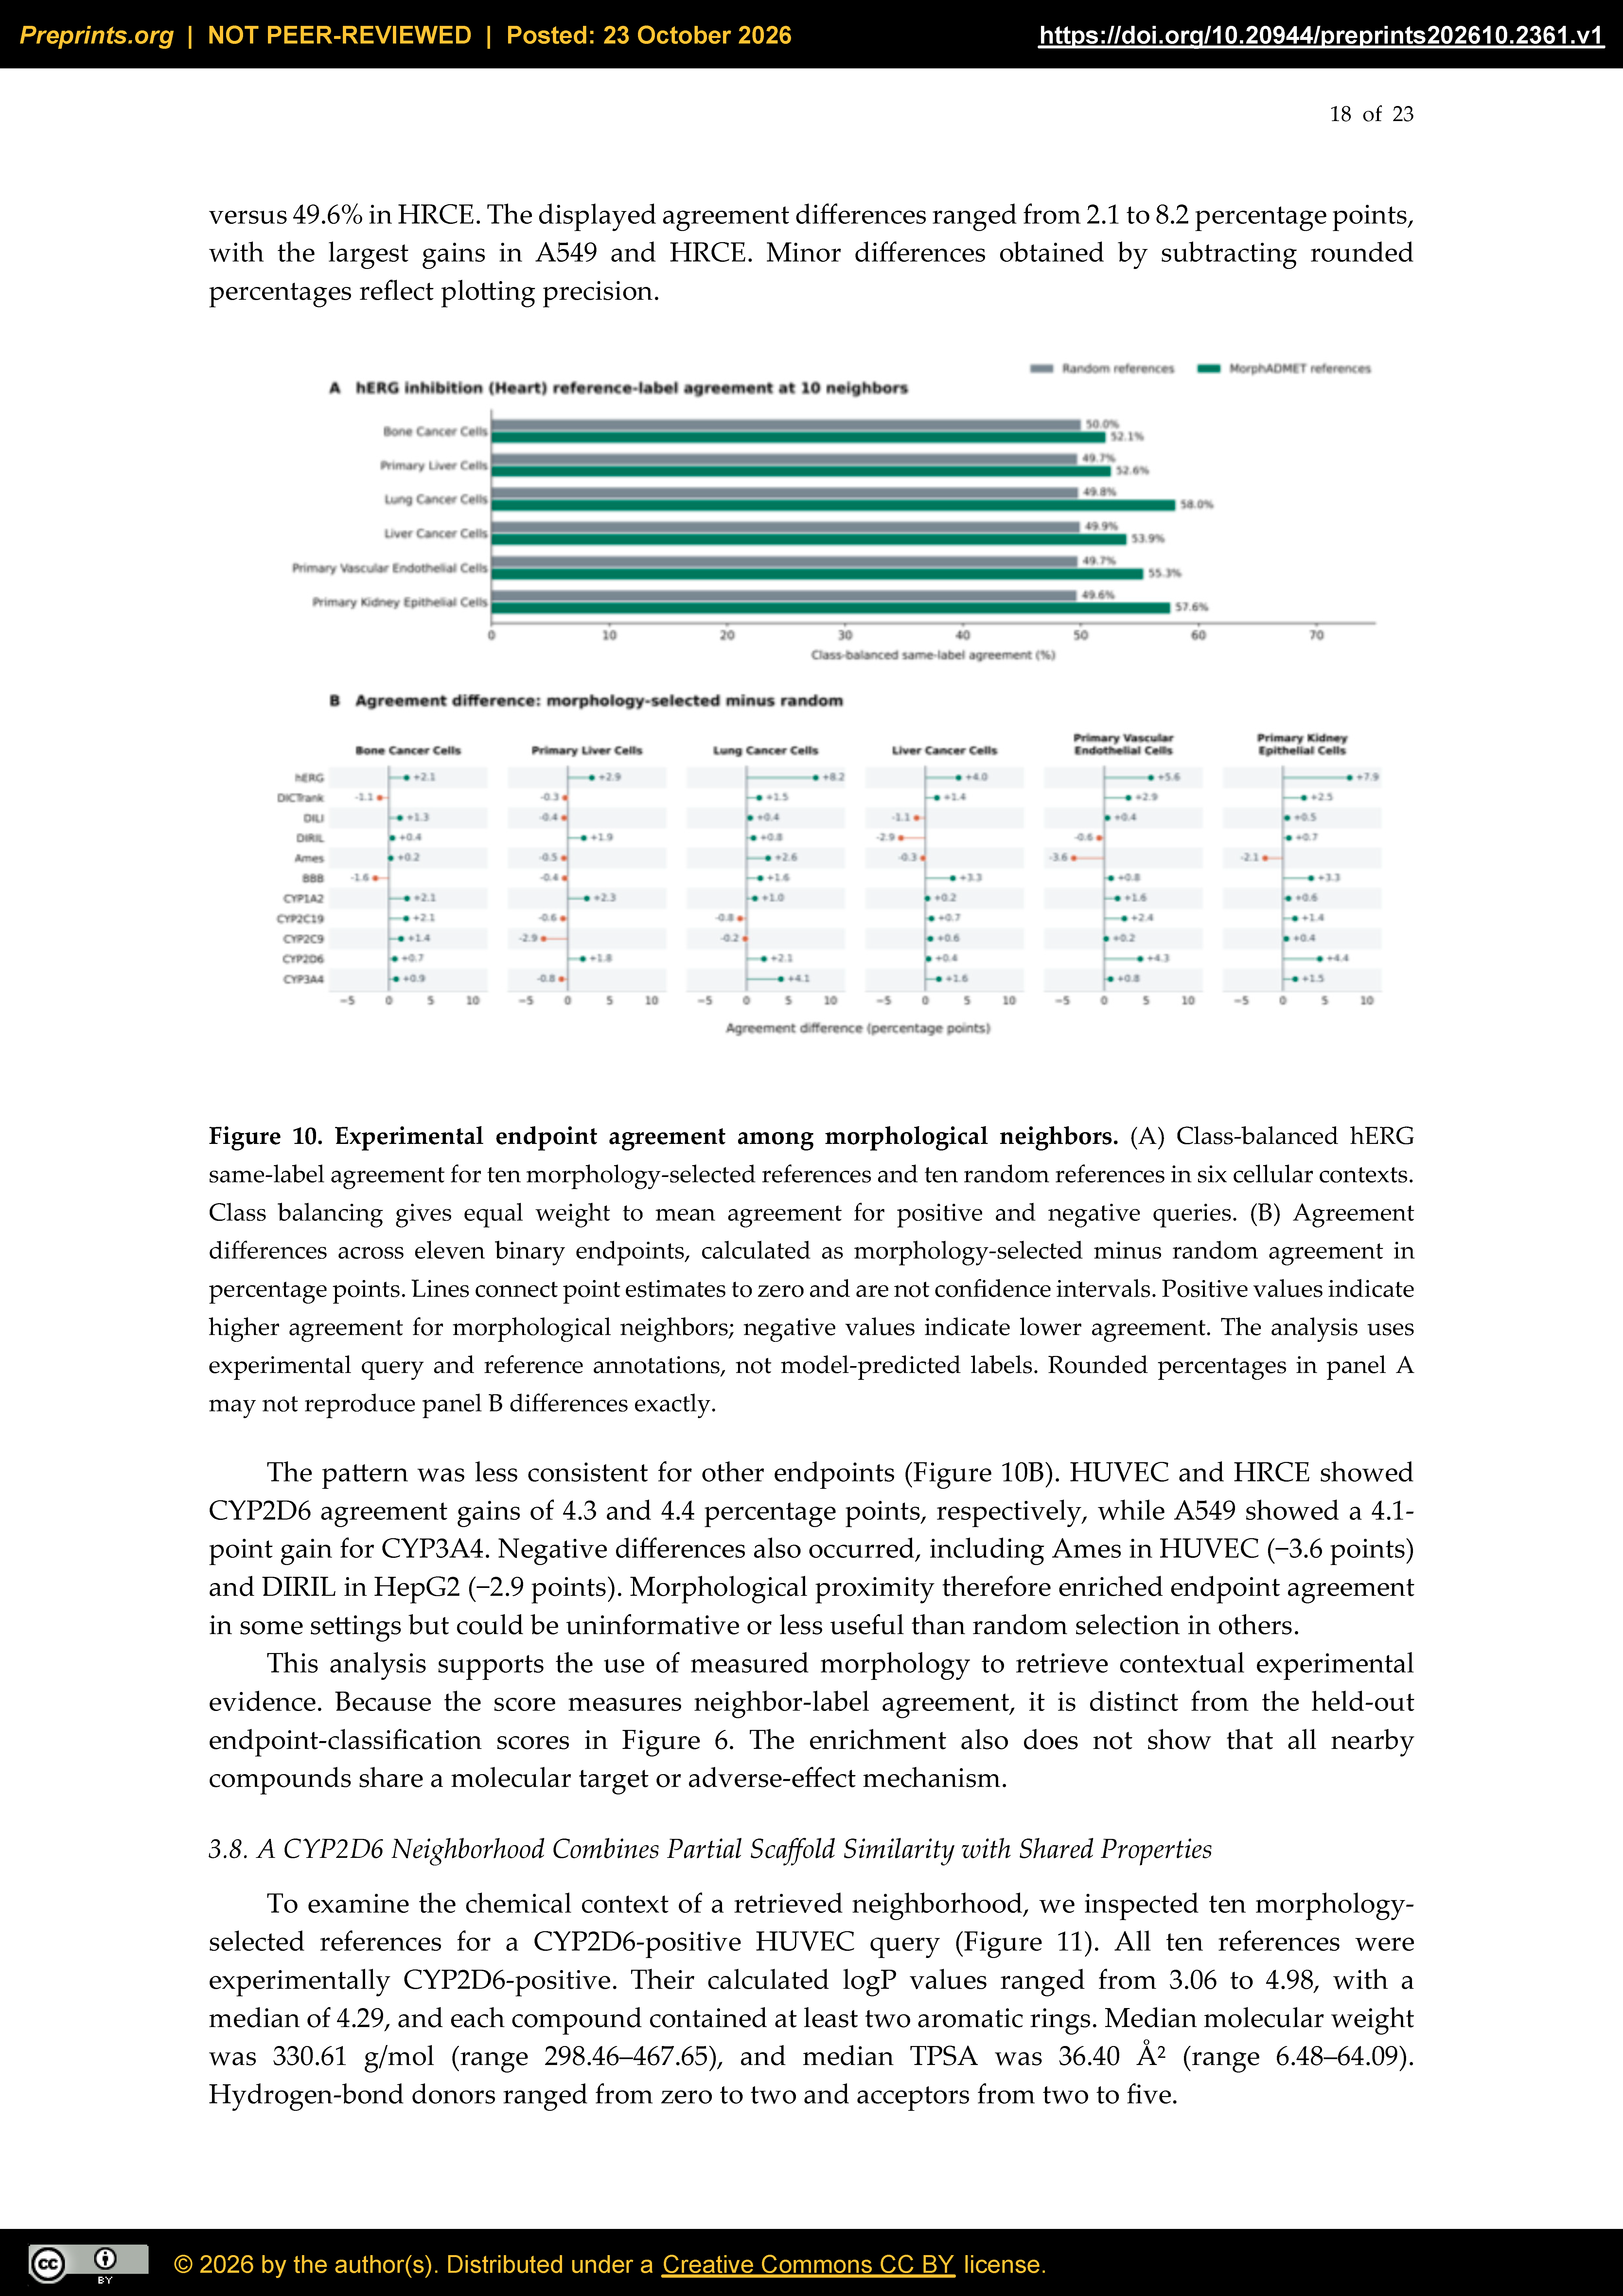
Figure 11.
Chemical characteristics of a morphology selected CYP2D6 neighborhood. (A) The ten nearest morphological references for a CYP2D6-positive primary vascular endothelial cell (HUVEC) query, displayed in retrieval rank order. All ten references are experimentally CYP2D6-positive. Structures are annotated with TPSA and calculated logP. (B) Recurring cores highlighted in subsets: core A occurs in R4, R7, and R9 and core B in R1, R3, and R5, each in three of the ten references. Identical full Murcko scaffolds occur in R1/R5 and R4/R9; no full scaffold is shared by all ten references. (C) Median and range of RDKit-derived physicochemical descriptors across the ten references. All references have calculated logP ≥3 and at least two aromatic rings. The retrospectively selected example provides structural context and does not establish a shared mechanism or prospective retrieval performance.
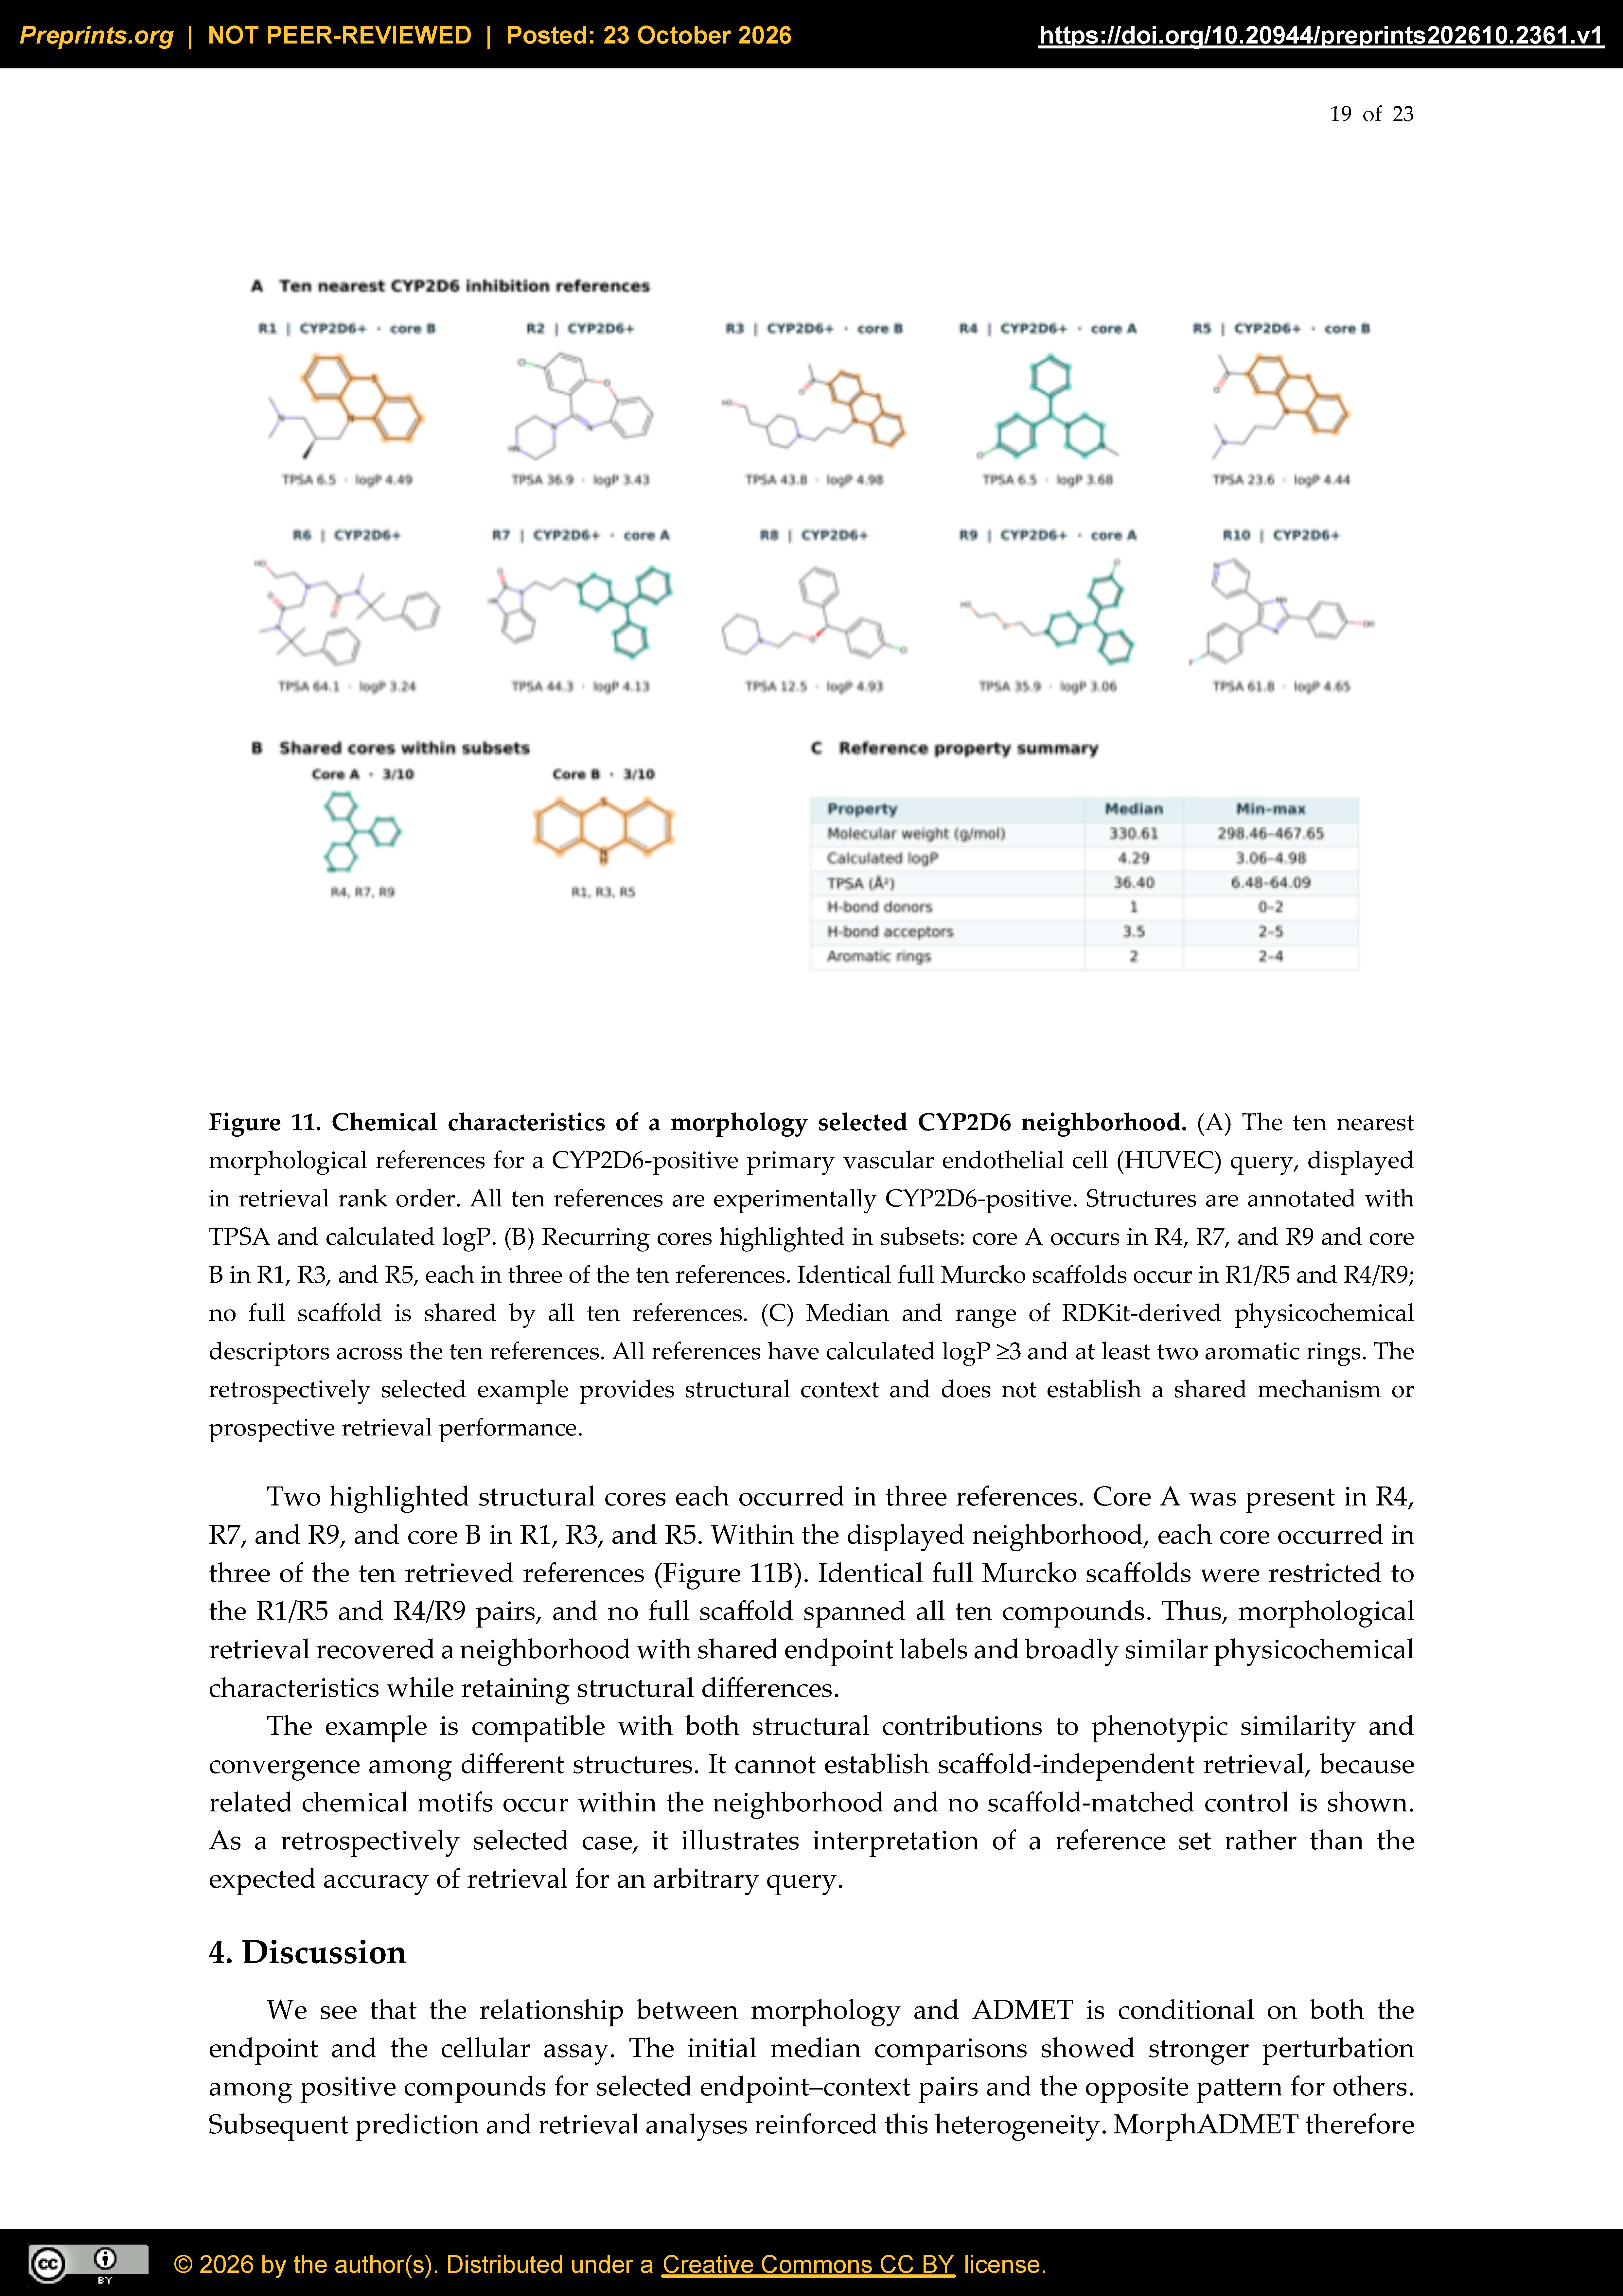

Table 1.
Imaging datasets and morphological representations.
| Dataset | Cellular context | Dose (µM) | Representation |
| JUMP | U2OS, bone cancer | 0.625 | CellProfiler |
| OASIS | Primary human hepatocytes | 11 | CellProfiler and DINOv2 |
| LINCS | A549, lung cancer | 10 | CellProfiler |
| EU-OS | HepG2, liver cancer | 10 | CellProfiler |
| RxRx3-core | HUVEC, primary vascular endothelial | 10 | CellProfiler |
| RxRx19a | HRCE, primary kidney epithelial | 3 | Cell-DINO |
Table 2.
Endpoint panel evaluated in this study.
| Endpoint | Task | Positive label or target |
| hERG | Binary classification | hERG inhibition |
| DICTrank | Binary classification | Cardiotoxicity category under the study mapping |
| DILI | Binary classification | Drug-induced liver injury annotation |
| DIRIL | Binary classification | Drug-induced renal injury annotation |
| Ames | Binary classification | Ames mutagenicity |
| BBB | Binary classification | Blood–brain barrier penetration |
| CYP1A2, CYP2C19, CYP2C9, CYP2D6, CYP3A4 | Five binary classifications | Inhibition of the specified CYP isoform |
| Aqueous solubility | Regression | Measured log10 solubility in mol/L |
Table 3.
Reserved test performance for strong morphological response prediction.
| Context | Test n (+) | Baseline AP | Ensemble AP | Ensemble AUROC |
| U2OS / JUMP | 862 (86) | 0.306 | 0.407 | 0.815 |
| HepG2 / EU-OS | 453 (34) | 0.326 | 0.460 | 0.859 |
| A549 / LINCS | 230 (26) | 0.274 | 0.472 | 0.807 |
| HUVEC / RxRx3-core | 154 (21) | 0.466 | 0.388 | 0.822 |
| HRCE / RxRx19a | 169 (13) | 0.230 | 0.353 | 0.876 |
Disclaimer/Publisher’s Note: The statements, opinions and data contained in all publications are solely those of the individual author(s) and contributor(s) and not of MDPI and/or the editor(s). MDPI and/or the editor(s) disclaim responsibility for any injury to people or property resulting from any ideas, methods, instructions or products referred to in the content. |
© 2026 by the authors. Licensee MDPI, Basel, Switzerland. This article is an open access article distributed under the terms and conditions of the Creative Commons Attribution (CC BY) license (http://creativecommons.org/licenses/by/4.0/).
Copyright: This open access article is published under a Creative Commons CC BY 4.0 license, which permit the free download, distribution, and reuse, provided that the author and preprint are cited in any reuse.