

Submitted:
20 October 2026
Posted:
21 October 2026
You are already at the latest version
Abstract
Red blood cell (RBC) transfusion is commonly prescribed in units and assessed through changes in recipient hemoglobin concentration. Unit count leaves the administered hemoglobin mass unspecified, while the concentration increment also reflects recipient blood volume, fluid balance, bleeding and cell persistence. This narrative review examines component hemoglobin content, quality specifications, preparation, storage and clinical studies of content-based allocation. Components meeting the same quality specifications can contain different hemoglobin masses [1]. Anticoagulants, additive solutions, container materials and processing further define the component administered. Hemolysis changes the distribution of hemoglobin between cellular and extracellular compartments; posttransfusion recovery measures subsequent cell persistence. Oxygen affinity and oxygen-release kinetics add functional information that concentration and mass alone do not capture. We propose prospective studies linking representative final-component measurements to delivered volume, recipient physiology and samples collected at defined times. The first test is whether measured administered hemoglobin mass improves prediction of the recipient increment beyond routine component and patient data. A subsequent comparison can assess the additional value of oxygen-release measurements and perfusion variables. Clinical benefit requires independently measured physiological and patient outcomes. This approach would make transfusion exposure more explicit and allow the value of individual component characterization to be tested within established compatibility and patient blood management practice.
Keywords:
red cell transfusion
; hemoglobin content
; transfusion dose
; component variability
; oxygen affinity
; P50
; storage lesion
; hemoglobin increment
; measurement uncertainty
; storage additives
; blood bags
Introduction
A prescription for one or two red cell units specifies a component count. The hemoglobin mass delivered depends on the content of those units and the volume that reaches the patient. The subsequent recipient concentration reflects that exposure together with blood volume, bleeding, fluid shifts and cell persistence.
We distinguish three measurements throughout this review: recipient Hb concentration, administered Hb mass and tissue oxygenation. Concentration describes a blood sample; mass describes the material delivered; tissue oxygenation reflects the interaction of oxygen carriage, release, perfusion and demand. Our question is whether measuring individual component content and function improves the description of transfusion exposure and prediction of the recipient response.
Coleman and colleagues’ viewpoint on blood products and crystalloids in hemorrhagic shock emphasizes the choice of resuscitation strategy [2]. Within such comparisons, recording the actual red cell Hb mass, plasma and fluid volumes would provide a more complete account of the intervention.
The analysis concerns red cell components. Whole blood, plasma and platelets have additional compositional and functional attributes that require their own dosing analyses.
Scope and Evidence Selection
We conducted a targeted narrative search of web-indexed PubMed and PubMed Central records, publisher pages, official component specifications and regulatory documents, updated through 20 October 2026. Topics included RBC hemoglobin content, content-based allocation, recipient Hb increments, preparation and storage, hemolysis, oxygen affinity and release, hemorrhage, extracorporeal support and transfusion thresholds. Reference lists, including a manufacturer’s scientific bibliography, were used to locate original records. Sources were selected for their relevance to dose measurement, component characterization or interpretation of recipient response; official product labels supplied formulation and container details. Related preprints were checked on their publication pages and used for conceptual, historical and comparative context.
This is a selective narrative review without a systematic-search protocol, formal risk-of-bias assessment or pooled analysis. Experimental measurements, observational associations, randomized outcomes and quality specifications are interpreted according to their designs. Reikvam, Martel and Zheng were assessed from abstracts; their complete reports and supplementary data were not reviewed. No new patient data were generated.
Indication, Threshold, Target, and Dose Are Separate Decisions
The 2023 AABB guideline recommends considering transfusion below 7 g/dL in hemodynamically stable hospitalized adults, with provisions for particular populations and attention to clinical context [3]. Such a threshold does not specify the hemoglobin mass required by an individual recipient. The treatment threshold, intended posttransfusion target and administered dose therefore need separate records. The guideline permits thresholds of 7.5 g/dL for cardiac surgery and 8 g/dL for preexisting cardiovascular disease [3]. For acute myocardial infarction, the 2025 AABB guideline conditionally suggests a liberal strategy when Hb is below 10 g/dL, on low-certainty evidence [4]. These recommendations concern distinct populations and do not define a universal cardiovascular target. TRICS III found a restrictive threshold strategy noninferior for its primary composite outcome in moderate- to high-risk cardiac surgery; it compared clinical strategies rather than equal administered grams of Hb [5].
The RESULT-Hip investigator protocol separates strategy, target and outcome. In adults aged at least 60 years undergoing hip-fracture surgery, the liberal strategy uses a transfusion threshold of Hb ≤90 g/L and a target of 90–110 g/L; the restrictive strategy uses a threshold of Hb ≤75 g/L and a target of 75–90 g/L. Version 6.0 specifies a composite of death, major adverse cardiac events or new myocardial injury after noncardiac surgery. The protocol provides no efficacy result [6]. Thresholds and targets define the assigned strategies, whereas measured administered Hb mass would describe exposure within each strategy. The clinical endpoint assesses their consequences.
Gammon, Blumberg and colleagues argue in their review of patient blood management that hemoglobin and hematocrit should inform clinical judgment rather than independently determine the indication [7]. Asante, Nguyen and Blumberg discuss limitations of threshold interpretation in acute leukemia [8].
Spiess’s 2007 review emphasized clinical reasoning behind transfusion prescriptions [9]. His 2026 editorial, “Heart Programs Are Strengthened by Pumping Iron,” returns to the limitations of treating a hemoglobin value in isolation [10]. These contributions place the laboratory trigger within the broader clinical indication.
Across these publications, the recurring concern is the need to state the indication explicitly. Stable anemia, active hemorrhage and repeated transfusion for chronic disease impose different conditions on the interpretation of hemoglobin measurements and cannot be reduced to a single calculation.
One Unit Is a Component Count, Not a Fixed Hemoglobin Mass
Agnihotri and colleagues measured 125 complete red cell units at expiry in their collection and processing setting. Hemoglobin content ranged from 42.3 to 80.8 g, with a mean of approximately 61.3 g; they proposed labeling units by content [11].
Jain and colleagues calculated Hb content in 900 red cell units using concentration measurements and volume estimates. Content ranged from 30.77 to 87.36 g, with a mean of 52.91 ± 9.99 g [12]. The single-center sample combined 350 mL and 450 mL collection systems and different processing protocols, which limits generalization of the range to other inventories.
Donor screening determines eligibility without standardizing the hemoglobin mass collected. US requirements, for example, specify minimum donor hemoglobin or hematocrit values, with defined exceptions [13]. Eligible donors can contribute different total red cell and hemoglobin masses, and collection volume and processing further affect the final component. Donor eligibility measurements are therefore an inadequate surrogate for the hemoglobin content of an individual transfusable unit.
A red cell unit contains cells suspended in a liquid medium. Its volume, hematocrit and hemoglobin concentration are related but describe different characteristics, and component concentration must be distinguished from recipient concentration. Equal component volumes can contain different hemoglobin masses; equal hemoglobin masses can be supplied in different volumes.
Component hemoglobin mass is concentration in g/dL multiplied by volume in dL. A 250 mL component with a measured concentration of 20 g/dL, for example, contains 50 g of hemoglobin. The accuracy of this illustrative calculation depends on representative sampling, adequate mixing, analytical precision and volume measurement. The administered mass also depends on the fraction of the component that reaches the patient.
An order for two units therefore leaves the total grams administered unspecified. Recording individual content would make the material dose explicit; prospective studies would need to establish whether that information changes decisions or improves response prediction.

Table 1.
Quantities used to describe a red cell transfusion.
| Quantity | What it describes | What it does not establish |
|---|---|---|
| Recipient Hb, g/dL | Concentration at a sampling time | Total circulating Hb mass or the dose required |
| Unit count | Number of red cell components | Hb mass in each component or the amount delivered |
| Component volume, mL | Volume of the suspension | Hb mass without a representative concentration |
| Administered Hb, g | Mass in the component volume delivered | Subsequent retention, losses, or recipient blood volume |
| Recipient Hb increment, g/dL | Difference between two concentrations | The separate effects of transfusion, fluid balance, and losses |
Abbreviation: Hb, hemoglobin.
Regulated Quality Specifications Do Not Imply Identical Composition
The FDA regulates blood collection, product standards and associated devices and inspects blood establishments [14]. Component specifications define acceptance criteria; their relationship to individual dose documentation is considered here.
For example, the Joint UK Blood Transfusion and Tissue Transplantation Services Professional Advisory Committee (JPAC) lists ≥40 g Hb/unit, volume 280 ± 60 mL, and hematocrit 0.50–0.70 for leucocyte-depleted red cells in additive solution [1]. The ≥40 g value is part of sampled quality control, not an individually measured minimum guaranteed for every issued unit: at least 75% of components tested must meet the listed values, with a separate 90% compliance requirement for hematocrit. Hb-content testing uses 1% sampling or statistical process control, and units measured below 30 g Hb require concessionary release. Individual total Hb content is not on the mandatory label. The specification therefore permits variation while controlling component quality [1].
Process standardization establishes component quality within defined acceptance criteria. Individual Hb measurement supplies the dose in grams. These records serve complementary purposes.
Reports should distinguish individually measured content from estimates based on quality-control samples or generic unit assumptions. Storage history and subsequent cell persistence add separate sources of variation.
Storage Age, Expiry, and Preparation Describe Different Unit Attributes
No single storage period applies to all red cell components. The US table in 21 CFR 610.53 lists 21 days for red cells in ACD, CPD, or CP2D, 35 days in CPDA-1, and 42 days with additive solutions, at 1 to 6 °C. Different periods may apply under FDA-approved or cleared system instructions [15]. The standard JPAC component discussed above has a maximum storage period of 35 days at 4 ± 2 °C [1].
Expiry applies to a specified product and storage system. Storage age records elapsed time, while preparation history identifies collection, additives, filtration, irradiation and subsequent temperature exposure. These details make the description “stored blood” reproducible.
In REDS-III-Omics, D’Alessandro and colleagues found that processing and additive solutions contributed substantially to variation in stored red cell metabolism [16]. Dose studies should therefore record product preparation alongside storage age.
Doctor and Spinella reviewed processing and storage changes, including depletion of adenosine triphosphate (ATP) and 2,3-diphosphoglycerate (2,3-DPG, also termed 2,3-bisphosphoglycerate or 2,3-BPG) [17]. These mechanisms extend component characterization beyond storage age and total Hb content.
A storage description should identify the component, preparation, additive, container, storage conditions and measurement time. The permitted expiry applies to that validated combination.
Lyophilized preparations make final-product measurement especially important. Characterization after rehydration should include final volume and Hb mass, hemolysis, methemoglobin, oxygen-release properties and in-vivo cell persistence, with defined methods and denominators [18]. Zheng et al. report approximately 95% RBC recovery after rehydration and at least three months of ambient storage using a protective membrane coating [19]. These abstract-reported experimental findings concern preservation, without a clinical transfusion outcome.
Collection Anticoagulants and Red Cell Storage Additives
Collection anticoagulants and red cell storage additives serve different purposes. Citrate-based anticoagulants prevent clotting during collection. Separated red cells can retain plasma and anticoagulant and receive an additional storage solution, all of which contribute to final component volume. Neither the original donation volume nor the volume printed on a solution bag establishes the final hemoglobin mass [20,21,22,23,24].
Acid citrate dextrose solution A (ACD-A) contains citrate and dextrose. Citrate phosphate dextrose (CPD) adds phosphate; citrate phosphate double dextrose (CP2D) contains a higher dextrose concentration; citrate phosphate dextrose adenine (CPDA-1) also contains adenine [20,22,23,24,25]. A labeled CPDA-1 collection set, for example, contains 63 mL of anticoagulant for a 450 mL donation, whereas the cited CPD/AS-5 set contains 70 mL of CPD for a 500 mL donation. In apheresis, anticoagulant is metered into the collection. A 250 mL anticoagulant supply bag is therefore not evidence that its entire contents enter one red cell unit [22,23,24].
Citrate binds calcium to inhibit coagulation and contributes to the chemical environment; phosphate buffers, glucose provides metabolic substrate and adenine supports ATP maintenance. Sodium chloride contributes to osmotic balance, and mannitol helps protect the membrane [21,22,23,24].
Saline–adenine–glucose–mannitol (SAGM) contains saline, adenine, glucose and mannitol. AS-1 and AS-5 use the same principal classes of constituents in different amounts. AS-3 contains citrate and phosphate; mannitol is not listed in the cited formulation. Phosphate–adenine–glucose–guanosine–saline–mannitol (PAGGSM) adds phosphate and guanosine to adenine, glucose, saline and mannitol [20,21,22,26,27,28].
Table 2.
Composition of three labeled red cell additive formulations.
| Constituent g per 100 mL additive |
AS-1 Adsol [20] |
AS-3 Formula 3 [21] |
AS-5 Reveos Select [22] |
|---|---|---|---|
| Dextrose as listed | 2.200 monohydrate |
1.100 monohydrate |
0.818 anhydrous |
| Sodium chloride | 0.900 | 0.410 | 0.877 |
| Mannitol | 0.750 | Not listed | 0.525 |
| Adenine | 0.0273 | 0.0300 | 0.0315 |
| Trisodium citrate dihydrate | Not listed | 0.590 | Not listed |
| Monobasic sodium phosphate monohydrate | Not listed | 0.280 | Not listed |
| Citric acid monohydrate | Not listed | 0.042 | Not listed |
| Volume used as the source denominator | 110 mL | 100 mL | 111 mL |
Values describe the cited additive formulations, rather than the complete contents of a transfused unit. AS-1 and AS-5 amounts were normalized arithmetically from label quantities of 110 mL and 111 mL and rounded. The labels specify different dextrose hydration forms, so the listed masses are not chemically equivalent. Water for injection completes each formulation. “Not listed” refers to the additive label; the final component may contain the substance through residual collection anticoagulant [20,21,22].
The amount of additive mixed with red cells needs to be recorded separately from the supply bag’s nominal capacity. An Hb-free solution changes volume and concentration while leaving hemoglobin mass unchanged. Calculating dose therefore requires both final volume and a representative component concentration. Washing, partial administration and transfer to another container introduce additional changes that need documentation.
Dumont and colleagues enrolled eight healthy volunteers in a randomized crossover study of an experimental storage system [29]. Controls received 110 mL AS-3 with aerobic storage; test units received 200 mL OFAS-3 with anaerobic storage. The authors attributed the higher starting volume and lower hemoglobin concentration in test units to the larger additive volume. At six weeks, 24-hour posttransfusion recovery was higher in the test arm. After nine weeks, two of eight test units had hemolysis above 1%. Because the comparison changed both formulation and gas conditions, it cannot isolate the effect of oxygen removal. It demonstrates the need to document additive volume alongside final concentration, without establishing a permitted nine-week shelf life for commercial components.
Container Materials form Part of the Storage System
Blood bags combine a sterile blood-contacting film with ports and tubing, often as an interconnected closed collection and component set. Many red cell systems use flexible polyvinyl chloride (PVC). The base polymer and plasticizer need separate identification: di(2-ethylhexyl) phthalate (DEHP) is one PVC plasticizer; DINCH and BTHC, listed in Table 3, are alternatives. A plasticizer change can leave the base polymer unchanged. The associated additive solution is also part of the system description [22,27,28].
Vermeulen and colleagues compared storage combinations over 42 days [27]. Hemolysis was 0.66% ± 0.18% in SAGM/BTHC-PVC and 0.36% ± 0.17% in SAGM/DEHP-PVC. With PAGGSM, the reported values were 0.38% ± 0.12% in BTHC-PVC and 0.48% ± 0.17% in DINCH-PVC. The differences support reporting container and solution together.
A paired investigation of pediatric RBC storage bags found that blood-contacting plasticizers affected extracellular hemoglobin, vesiculation, osmotic fragility and deformability during 42-day storage [30]. In the tested configuration, the rise in supernatant hemoglobin was approximately twice as large in BTHC-plasticized bags as in DINCH- and DEHP-plasticized bags. This in vitro result supports identifying the actual container formulation rather than recording only “PVC”.
In a 2026 evaluation, van Wonderen and colleagues used DINCH-plasticized collection sets, storage bags containing a proprietary DINCH/BTHC blend and PAGGSM [28]. They compared in vitro parameters in 32 test and 24 control concentrates and assessed 24-hour recovery after 42 days of storage and autologous transfusion in 24 healthy participants. Mean recovery was 93.3% ± 6.7%. Validation applies to this combination. Clinical outcomes in hemorrhagic shock were not compared, and several authors disclosed manufacturer employment.
Table 3 lists selected storage systems. Product identifiers and validated instructions remain necessary because generic polymer and plasticizer names may omit proprietary constituents and manufacturing details.
The FDA description of Hemanext illustrates a change in storage environment without adding a substance to blood [31]. Red cells release oxygen across a sterile permeable membrane into a separate compartment containing iron-based sorbents and then enter a barrier storage bag. The sorbents remain outside the blood-contacting compartment. The cited clearance covers specified preparations and storage up to 42 days; the later record gives the applicable preparation conditions [32].
Routine component quality control and individual-unit oxygen-function measurement serve different purposes. JPAC lists volume, Hb content, hematocrit, hemolysis and residual leukocytes for the component discussed here, without routine unit-level P50 or unloading measurements [1]. Functional characterization does occur in research and regulatory evaluation. The HEMANEXT ONE FDA De Novo assessment (BR220665), granted on 15 September 2023, included ATP, 2,3-DPG, P50, hemolysis, animal-model oxygen delivery and recovery/survival [31]. The evaluated system had higher day-21 2,3-DPG and P50 than controls, with similar ATP during storage. These were system-validation measurements rather than tests of every issued unit.
The additive supply container also differs from the final blood storage bag. The AS-3 label describes a multilayer polyolefin solution container, and the Haemonetics CP2D label explicitly excludes blood-component storage in its solution container [21,24]. An outer foil pouch may provide a moisture barrier before use; this differs from a validated gas-barrier system operating during red cell storage [21,22].
What Studies of Modified Storage Add to the Question
Yoshida and colleagues examined 492 research RBC units and conducted a separate split-unit experiment [33]. Initial oxygen saturation and laboratory storage markers varied across preparation and storage conditions, supporting their inclusion in component records.
Agostini and colleagues’ 2025 European multicenter in vitro validation of hypoxic storage found residual variation in total Hb despite compliance with study acceptance criteria [34]. At day 42, center means ranged from 48.8 to 56.0 g per unit.
D’Alessandro and colleagues compared donor-paired standard and hypoxically stored units from 12 healthy volunteers [35]. After 42 days, mean 24-hour autologous posttransfusion recovery was 90.2% ± 6.5% for hypoxic units and 87.3% ± 4.1% for controls, with a reported one-tailed paired test of p < 0.05. End-storage hemolysis did not differ significantly. Recovery and hemolysis therefore did not change in parallel. Several authors disclosed employment or consulting relationships with Hemanext.
The 2025 FDA summary specifies CP2D/AS-3 or ACD-A/AS-3 leukocyte-reduced red cells and a processed component volume no greater than 350 mL [32]. It defines collection, filtration, and processing conditions, including completion windows of 12 or 72 hours for the respective preparation pathways. Processing occurs at 20 to 26 °C, followed by storage for up to 42 days at 1 to 6 °C. These conditions apply to the specified anticoagulant, additive, and device combination. A generic description of “deoxygenated blood” would omit information needed to reproduce the preparation.
Some authors of the European validation reported manufacturer relationships, and the paper disclosed funded writing assistance [34]. Appraisal here uses the reported design and measurements.
Single-cell experiments found faster oxygen unloading after hypoxic storage under the tested laboratory conditions [36]. Whether such measurements improve prediction of recipient response can be tested by linking validated functional assays to measured Hb mass and clinical observations.
JPAC provisional specifications for rejuvenated and washed red cells include ATP and/or 2,3-DPG measurements [37]. Testing is performed on every component on the day after manufacture for retrospective quality monitoring, rather than as a pre-release requirement. Neither ATP nor 2,3-DPG alone determines oxygen affinity: P50 also depends on pH, temperature, carbon dioxide and other assay conditions, while ATP principally reflects red cell energy status. Whether a standardized oxygen-dissociation curve adds predictive information beyond these biochemical measurements remains to be tested.
Hemolysis Specifications and Biological Exposure
Hemolysis limits developed as criteria for storage integrity. Heaton’s historical account describes early storage studies with a 1% poststorage hemolysis goal, followed by FDA practice using less than 0.5% hemolysis and greater than 70% posttransfusion recovery. At the December 1982 FDA Blood Products Advisory Committee meeting, the 0.5% limit was reported to hinder additive-solution development. Although that meeting made no recommendation on either criterion, subsequent practice shifted to less than 1% hemolysis and 75% recovery; the later European specification used 0.8% [38]. This history describes the evolution of a quality standard rather than a clinically demonstrated toxicity threshold.
The JPAC specification includes hemolysis below 0.8% of red cell mass [1]. In the FDA De Novo evaluation of Hemanext ONE, the day-42 acceptance rule required a one-sided 95% lower confidence bound showing that at least 95% of units had hemolysis below 1% [31]. The numerical limit, sampling population and statistical acceptance rule together define the specification.
At a fixed percentage of hemolysis, extracellular Hb mass varies with total component Hb mass. For illustration, 0.5% of a 50 g Hb component corresponds to 0.25 g extracellular Hb; four such components correspond to 1 g. These calculated masses describe exposure. Component volume, extracellular Hb concentration, delivered fraction and administration time define the corresponding dose record. End-storage hemolysis, intact-cell Hb content and posttransfusion recovery represent separate measurements [18].
Hess reviewed stored red cell quality measurements, including ATP, 2,3-diphosphoglycerate, electrolyte changes and lipid breakdown products [18]. They capture different aspects of the storage lesion and can require specialized or destructive testing. Each attribute should be reported with its method and time point; one biochemical result cannot describe component quality completely.
Hemolysis also changes the biological form of Hb exposure. In a guinea-pig transfusion model, Baek and colleagues found that older stored blood produced intravascular hemolysis, hypertension, vascular injury and kidney dysfunction; coinfusion of haptoglobin attenuated Hb-mediated injury [39]. Hb oxidation and heme release connect extracellular Hb exposure to redox injury and endogenous inflammatory signaling. Figueiredo and colleagues demonstrated heme-induced macrophage TNF-alpha secretion involving TLR4, MyD88 and CD14 [40]. In transgenic sickle mice, Belcher and colleagues linked heme exposure to endothelial TLR4 activation, adhesion-molecule expression and vaso-occlusion [41].
The molecular form of heme affects these responses. Vallelian and colleagues found that protein-associated heme or Hb did not induce inflammatory gene expression across the tested endothelial, macrophage and mouse exposure systems, whereas non-protein-associated heme activated human neutrophils [42]. Hb/heme speciation and binding therefore belong alongside concentration and exposure time in the interpretation of hemolysis-associated vascular and inflammatory effects.
Rapido and colleagues randomized 60 healthy adults to autologous, leukocyte-reduced AS-3 RBC transfusion after one to six weeks of storage [43]. Longer storage was associated with lower recovery, a smaller hematocrit increase and greater extravascular hemolysis. Recovery was measured at 20 hours rather than 24 hours for logistical reasons. These measurements distinguish postadministration cell loss from hemolysis in the storage bag; estimates for bleeding or critically ill recipients need their own data.
RECESS randomized 1,481 participants; 1,098 met the transfused evaluation criteria. Storage of no more than 10 days was compared with at least 21 days, with median ages of 7 and 28 days. Shorter storage did not improve the primary change in multiple-organ dysfunction score [44].
RECAP included 55 patients with qualifying postoperative index transfusions, with observations varying by endpoint. Thenar and cerebral tissue oxygen-saturation responses and sublingual microvascular flow showed no significant between-group differences [45]. Its small sample limits precision. Neither RECAP nor RECESS allocated components by measured oxygen-release phenotype.
Donovan et al. measured single-cell oxygen unloading in concentrates from six donors and conducted additional rejuvenation experiments using pooled units. One concentrate showed marked impairment by day 2, while some retained rapid unloading after a week [46]. Donor-level replication was six despite the much larger number of cells measured. The laboratory variation motivates clinical validation of functional selection.
In nine healthy volunteers, Weiskopf et al. found similar reversal of the measured anemia-induced neurocognitive deficit with very fresh and three-week-stored autologous RBCs [47]. ARIPI randomized 377 premature very-low-birth-weight infants and found no improvement in its primary composite outcome with fresher RBCs [48]. These clinical findings temper extrapolation from biochemical storage changes.
TOTAL randomized 290 children with severe anemia and lactic acidosis to longer- or shorter-storage RBCs, with median ages of 32 and 8 days. Longer storage met the prespecified noninferiority criterion for lactate reduction, using an absolute margin of 25 percentage points [49]. Trials of measured functional selection would address a different intervention and should be designed prospectively.
The Recipient Increment Is Not a Direct Measure of Administered Mass
Roubinian and colleagues linked donor and component records to 23,194 recipients and 38,019 single-unit transfusions [50]. Predictors of the measured increment included donor and recipient sex, collection method, irradiation, recipient age and body mass index, and pretransfusion hemoglobin. The observational design identifies several contributors without establishing causality for every association.
A later multicenter analysis by Roubinian and colleagues included 46,705 patients and 102,043 evaluable single-unit episodes [51]. Hemoglobin increments were associated with donor and recipient characteristics, component preparation and storage duration. Longer storage was associated with a smaller hemoglobin increment and a greater bilirubin increment. Posttransfusion samples came from a 12- to 36-hour window. Confounding and variation in measurement conditions limit causal interpretation of these retrospective associations.
The expected rise of approximately 1 g/dL after one adult RBC unit is a clinical heuristic. Wiesen and colleagues studied equilibration in medical inpatients without active bleeding [52]. Applying an expected increment elsewhere requires attention to recipient blood volume, bleeding, fluids and sampling time.
Among 13,620 adult surgical patients, Lo and colleagues found lower mean increments per unit as weight increased: 0.85 g/dL in the 40 to 59.9 kg group and 0.55 g/dL in the 120 to 139.9 kg group [53]. These population-specific observations illustrate the limits of applying one expected increment to every recipient.
In an idealized fixed volume, adding 50 g of hemoglobin to 5 L of blood raises concentration by 1 g/dL; adding the same mass to 7 L raises it by approximately 0.71 g/dL. The calculation omits the component’s added volume, bleeding, fluid shifts and cell loss. It illustrates the mass–concentration relationship rather than providing a bedside dosing formula.
Fluid administration can change concentration without adding or removing red cells. Quispe-Cornejo and colleagues reviewed 65 studies involving 2,794 participants; 63 studies entered a meta-analysis [54]. Rapid fluid administration was followed by a pooled mean hemoglobin decrease of 1.33 g/dL, with substantial heterogeneity. The review excluded studies involving bleeding, transfusion or extracorporeal circulation. It supports documenting fluid exposure around sampling, but supplies no universal correction factor for bleeding or transfused patients.
A posttransfusion result should be linked to the sampling time and intervening fluids, losses and additional components. This connects the measured concentration to the exposure that preceded it.
Roberts and colleagues measured Hb within 15 minutes, at 4 hours and at 12 hours after transfusion in 24 stable postpartum patients [55]. Early and later values did not differ significantly; ongoing bleeding and hemodynamic instability were exclusion criteria. The small prospective study supports evaluation of an early sampling protocol in that population.
Carter and Dunham modeled published cohorts with myelodysplastic syndrome or thalassemia using a mass balance incorporating transfusion interval, red cell lifespan and endogenous Hb contribution [56]. Their model describes why serial concentrations depend on more than the latest unit count.
In repeated transfusion, administered hemoglobin mass also permits an estimate of hemoglobin-associated iron exposure. At approximately 3.4 mg iron per gram of hemoglobin, components containing 30 g and 87 g correspond to approximately 102 mg and 296 mg iron, respectively. This compositional estimate does not measure retained body iron, iron overload or chelation requirements [12,56].
Dose Reconstruction During Hemorrhagic Shock
Reuland and colleagues used four historical datasets to examine blood-product administration during intensive care unit (ICU) resuscitation for hemorrhagic shock [57]. They estimated administered red cell hemoglobin using an assumed packed-cell concentration of 0.2 g/mL. Unit volume and content varied, and records of bleeding and source control were limited. The analysis documents practice variation while showing the difficulty of reconstructing material exposure from routine records.
Practice variation, component variation and reconstruction error contribute differently to retrospective dose estimates. The ICU datasets did not directly measure every unit’s content, and hemorrhage complicates interpretation of any subsequent concentration increment.
Aquina, Blumberg and colleagues found variation in transfusion practice among surgeons and hospitals after upper gastrointestinal cancer resection [58]. Combining practice records with component measurements would help separate prescribing patterns from product variation.
Measured dose would add exposure information within randomized transfusion strategies. Variation in component content does not invalidate the assigned strategy comparison.
RePHILL assigned trauma patients with hemorrhagic shock to up to two units each of RBCs and lyophilized plasma, or up to four 250 mL boluses of 0.9% saline; additional fluids were recorded [59]. Component Hb measurements would describe the red cell exposure within that regimen. The comparison was RBCs plus plasma against saline, rather than whole blood against crystalloid.
Oxygen-dissociation curves and P50 characterize equilibrium oxygen affinity under specified conditions [60,61,62]. Linking these results to final-component Hb mass and cell integrity would extend the exposure record. Oxygen-release kinetics and recipient tissue response are additional measurements.
Testing the added value of oxygen-dissociation measurements requires representative samples and defined temperature, pH, carbon dioxide, reproducibility, processing time and cost [60,61,62]. The assay conditions should accompany the reported P50.
A conceptual mass balance relates concentration to a defined interval: hemoglobin concentration at sampling ≈ (initial circulating hemoglobin mass + hemoglobin mass administered + other hemoglobin mass entering the circulation − hemoglobin mass lost or cleared during the interval) / circulating blood volume at sampling. Every term must cover the same interval and use compatible units. Losses and clearance already included in a retained-dose term must not be subtracted twice. The relationship does not constitute a validated clinical prediction equation or resolve uncertainty in blood volume, bleeding, cell survival and measurement.
Hemoglobin Accounting During Extracorporeal Support
In cardiopulmonary bypass (CPB) and extracorporeal membrane oxygenation (ECMO), Hb accounting requires a defined patient or patient-plus-circuit boundary. A patient-plus-circuit inventory includes blood in the patient and the specified connected circuit compartments. Blood moved from a reservoir into the patient changes the patient-only inventory but does not add Hb to an already inclusive patient-plus-circuit inventory. Representative component Hb concentration and the volume actually delivered establish the transfused mass [63]. Blood entering or leaving the selected boundary, Hb-containing prime, Hb-free fluids and fluid removal must be recorded. Circuit recirculation adds no new Hb. Adding or removing Hb-free fluid changes concentration without changing Hb mass.
VV-ECMO provides extracorporeal gas exchange while native cardiac output supplies systemic blood flow. Pump flow is therefore not a substitute for cardiac output in the systemic DO2 calculation. The recirculation fraction and the ratio of ECMO flow to native cardiac output are separate determinants of systemic oxygenation [65]. Interpretation of oxygen delivery also depends on the support configuration, systemic blood flow and sampling location [64,65,66]. A randomized CPB study targeting indexed oxygen delivery reduced stage 1 acute kidney injury, without a significant reduction in stages 2–3 [67]. The dose analysis should therefore link measured Hb exposure to the physiological conditions under which the recipient response is assessed.
Clinical Studies of Hemoglobin Content and Transfusion Allocation
Arslan and colleagues reported 72 units administered rather than 104 originally ordered in 51 hematology patients [68]. Reikvam and the BEST Collaborative evaluated 52 transfusion episodes in hemodynamically stable recipients. Component Hb content ranged from 38.7 to 69.0 g per unit, and accounting for estimated recipient blood volume improved prediction of the Hb increment [69]. The Reikvam pilot examined dose-response prediction rather than randomized allocation between content-based and conventional policies.
Atilla and colleagues enrolled 89 hematology patients and randomized 178 transfusion episodes: 92 to Hb-content-based allocation and 86 to conventional unit-based allocation [70]. Content-based selection saved 38 of the 192 units originally ordered in the intervention arm (19.8%). Suitable Hb-content-matched components were identified in 38 of 92 intervention episodes (41.3%). Target-Hb attainment did not differ significantly between allocation groups (p = 0.125). These results demonstrate reduced unit use in the studied allocation system, with no detected difference in target attainment.
The HEMOCON study linked Hb-content-selected units to a greater observed recipient Hb increment in thalassemia [71]. A randomized crossover investigation by Gamberini and colleagues reported fewer annual units with a preparation having greater Hb content [72]; Kaur and colleagues compared formula-based with conventional weight-based allocation in children with thalassemia [73]. The FUEL randomized trial compared preparation methods with mean contents of 50.60 ± 5.12 versus 56.98 ± 5.92 g Hb and recipient Hb increments of 2.11 ± 0.89 versus 2.48 ± 0.88 g/dL [74]. Together, these investigations address dose prediction, component utilization and recipient Hb increments in defined clinical populations.
Individual-unit dose studies need to establish that samples represent the final transfusable component. Upstream products and unvalidated tubing samples may differ. Kurach et al. found significant parent-unit versus segment differences in Hb, hematocrit and hemolysis [63]. Protocols should specify source, mixing, time, processing stage, analytical platform, component volume and uncertainty. Postprocessing content becomes especially important after washing, filtration, transfer or incomplete administration; washing losses have been shown to depend on method [75].
Administered Hemoglobin and Posttransfusion Persistence
Total measured component Hb includes intracellular and extracellular fractions. Subtracting measured extracellular Hb from total Hb defines the cell-associated Hb mass of the administered component. Posttransfusion cell recovery describes persistence at a specified time, commonly 24 hours [18,35,43]. These quantities distinguish material administered, cellular Hb delivered and subsequent retention.
The 24-hour recovery endpoint describes cells remaining in circulation at that time. It does not measure cumulative oxygen transport over the interval. Dose-response analyses can use total administered Hb as the exposure and examine extracellular Hb, hemolysis, cell recovery and oxygen-release properties as distinct variables.
Hb-content selection belongs within the pool of components meeting the patient’s compatibility and processing requirements, including ABO/RhD, relevant antigen matching and antibody-related exclusions [76]. Studies should record the eligible inventory, time to a compatible unit and emergency-release decisions.
Interpreting a Physiological Response
Hb concentration and calculated DO2 describe determinants of convective oxygen transport. Tissue oxygen tension, microvascular perfusion, oxygen consumption and organ recovery assess subsequent physiological effects. Interpretation depends on baseline status, the territory measured and concurrent changes in flow and demand [45,65,77].
Studies should define the expected response and observation interval. NIRS estimates regional Hb saturation, while sublingual microscopy observes a particular microvascular bed. These measurements need to be interpreted within their anatomical and methodological scope [45,64].
Sakr et al. assessed 35 patients with severe sepsis before and after transfusion. Overall sublingual microvascular perfusion did not change significantly, while response varied with baseline capillary perfusion [77]. The observational design supports recording baseline status, without identifying Hb dose, storage age or unloading phenotype as the cause.
Baseline physiology may modify response, but subgroup claims need prespecified interaction analyses and adequate power. Selecting extreme baseline values also introduces regression to the mean. Repeated baseline measurements, consistent conditions, blinded assessment where feasible and a concurrent comparator can help. Analyses must distinguish prognostic markers from markers of differential treatment benefit.
A Focused Research Agenda for Dose and Measurement
We propose a staged investigation of dose measurement and response. The first stage tests prediction of recipient Hb concentration. The second adds component oxygen-function measurements and independently measured physiological outcomes. Existing laboratory methods provide a basis for characterization [17,27,28,31,36].
This work should support indication-driven transfusion and reassessment within patient blood management practice [3,7].
Reikvam/BEST examined dose-response prediction, whereas Atilla tested allocation and unit utilization [69,70]. The next study should specify which of these questions it addresses and compare measured Hb mass with the information already available in routine care.
An initial prospective study should enroll a defined stable population, link each component to the recipient and measure representative final-component Hb concentration and delivered volume. Recipient samples should be collected at prespecified times, with starting Hb, recipient size and intervening treatment recorded. The primary question is whether measured administered grams reduce prediction error compared with routine component and patient data.
Implementation assessment should cover sampling burden, traceability, reporting uncertainty, cost and integration with blood-bank and clinical records.
A prespecified baseline model should use routine component data, recipient size, starting Hb and information available at the stated prediction time. Adding measured administered Hb mass would then be assessed for clinically meaningful error reduction, calibration and prediction-interval coverage in an independent validation sample [50]. Component hemolysis and extracellular Hb can enter as product attributes; measured posttransfusion recovery belongs in an explanatory analysis or a separately validated persistence model. Analyses should account for repeated transfusions and clustering by center or supplier, with all episodes from a recipient kept in the same development or validation partition. Missingness and uncertainty in blood volume, losses and compartment boundaries should be addressed through prespecified sensitivity analyses.
Across institutions or suppliers, administered grams could complement unit counts and single-unit rates in patient blood management comparisons. Benchmarking value would be an additional study endpoint.
Chronic-transfusion studies require serial measurements and transfusion intervals. Hemorrhage studies require time-resolved administration, fluid, blood-loss and source-control records. These settings should be analyzed separately from stable single-unit transfusions.
NICE recommends a single unit for nonbleeding adults, followed by clinical reassessment and an Hb check before further transfusion [78]. Measuring that unit’s content would allow the dose-to-response relationship to be studied within an established workflow.
The Minimum Effective Dose as a Research Question
A dose-to-response study needs a prespecified response threshold, observation interval, rescue criteria and safety endpoints. An unmet tissue-saturation target requires assessment of flow, oxygenation, demand and measurement conditions before attributing the result to insufficient Hb. Research sampling must not delay emergency transfusion or source control.
We define minimum effective Hb exposure as the smallest delivered mass achieving a prespecified response in a defined population and interval, within compatibility, safety and rescue rules. Estimation therefore depends on the intervention and endpoint rather than a universal number of grams.
Functional assays can be added to the prediction model, with baseline-physiology interactions prespecified and exploratory analyses identified. Because Hb enters the calculation of DO2, their correlation cannot independently validate tissue benefit. Mechanistic studies should use independently measured endpoints where possible and address mathematical coupling between calculated delivery and consumption.
A later intervention trial could test an allocation rule with defined compatibility requirements, rescue treatment and adverse-event surveillance. Organ injury and mortality claims would require those outcomes to be measured directly.
Automated equilibrium analyzers and microplate approaches provide established methods for measuring oxygen dissociation [60,61,62]. Their suitability for routine component testing depends on throughput, reproducibility and cost.
Active follow-up affects recognition of transfusion reactions [79]. Martel et al. reported 36 previously unreported reactions, including 22 cases of transfusion-associated circulatory overload, after a multicomponent recognition, reporting and surveillance initiative [80]. Dose studies should define follow-up, adjudication and denominators and record delivered volume, infusion rate, concurrent fluids, interruptions and rescue treatment. Changes in event detection should be distinguished from changes in underlying incidence.
Table 4.
Proposed minimum records for a prospective dose study.
| Record | Information to retain |
|---|---|
| Indication and target | Clinical setting; reason for transfusion; pretransfusion Hb; intended target if used |
| Individual component | Identifier; measured or estimated total Hb content and method; volume; collection and processing; additive; storage age |
| Administration | Start and end times; components and volume actually delivered; incomplete or interrupted administration |
| Recipient | Height and weight; bleeding status; blood-volume estimation method if used |
| Intervening events | Fluids; additional components; recorded losses; relevant events between Hb samples |
| Measurement | Hb values and sample times; specimen conditions; analytical method; measurement uncertainty and missing data |
| Storage system | Collection anticoagulant and metered volume; additive formulation and volume actually mixed; manufacturer and product identifier; blood-contacting polymer and plasticizer; gas-barrier arrangement and processing where applicable |
| Compatibility and availability | Required matching and processing; clinically eligible pool; time to compatible blood; emergency release and allocation constraints |
| Extracorporeal support, if applicable | Patient or patient-plus-circuit boundary; Hb-containing prime; transfusions and blood returned or discarded; Hb-free fluids and fluid removal; support configuration; sampling sites and times; systemic-flow method |
| Hemoglobin compartments | Total, cell-associated and extracellular Hb; component hemolysis and assay; recipient plasma-free Hb where relevant; measurement time and uncertainty |
| Cell recovery assessment | Method and observation interval; autologous or allogeneic setting; measured versus estimated recovery; linked component and recipient; loss or clearance assumptions |
| Component oxygen function | Methemoglobin; oxygen affinity and unloading kinetics; assay pH, temperature and gas conditions; specimen source and measurement time |
| Physiology and demand | Baseline and serial endpoints; blood flow; ventilation; temperature; vasoactive treatment; demand-related changes; organ-function outcomes |
| Safety and follow-up | Volume and rate; concurrent fluids; prespecified suspected and adjudicated events; renal, inflammatory and endothelial endpoints; follow-up window and denominator; rescue rules; patient-important outcomes |
Storage-Dependent P50 and the Limits of a Single Functional Descriptor
Oxygen affinity changes during refrigerated red-cell storage. Serial experimental measurements show shifts in the oxygen-dissociation curve and P50 associated with 2,3-diphosphoglycerate (2,3-DPG) and the storage environment. Chng and colleagues reported a P50 decrease from 33.2 ± 0.87 mmHg at day 0 to 24.9 ± 0.16 mmHg at day 42, despite no significant change in mean corpuscular hemoglobin concentration [81]. Kassa and colleagues found a decrease from 30.0 ± 0.09 to 22.1 ± 0.21 mmHg by day 42, alongside changes in 2,3-DPG, ATP, oxidative markers and band-3-associated processes [82]. Kassa’s repeated oxygen-dissociation measurements came from the same blood bag, limiting inference about between-donor variability.
Under fixed assay conditions, lower P50 indicates higher oxygen affinity. Affinity and unloading kinetics should be reported separately because they characterize different aspects of oxygen exchange [82,83].
Interpreting P50 requires the assay conditions: pH, temperature, CO2, buffer and specimen processing can all affect the curve. Kassa and colleagues used washed, resuspended RBCs in a defined buffer at pH 7.4 and 37 °C and acknowledged differences from other buffer systems [82]. Cross-product comparisons therefore need documented protocols and representative samples of the final component, rather than unvalidated tubing segments or upstream samples.
P50 alone cannot describe oxygen-release dynamics. Chng and colleagues found lower P50 alongside increased D50 during storage [81]. Their D50 measures the time for oxygen tension in the surrounding microwell to fall by half during deoxygenation. RBC oxygen release slows that decline and increases D50, so the index is not an RBC deoxygenation half-time. Rejuvenation increased P50 without returning the oxygen-release measurement to its fresh-cell baseline. Gelderman and colleagues also examined equilibrium and oxygen-binding/unloading kinetics during cold storage [84]. These method-dependent indices require separate reporting and interpretation.
Chen and colleagues compared conventional, hypoxic and CO2-preserved hypoxic storage and found different ATP, 2,3-DPG and P50 trajectories; ATP export did not consistently track those measurements [83]. Collection, additive, gas environment and assay conditions therefore belong alongside storage time. Effects of container material on P50 need direct controlled measurements.
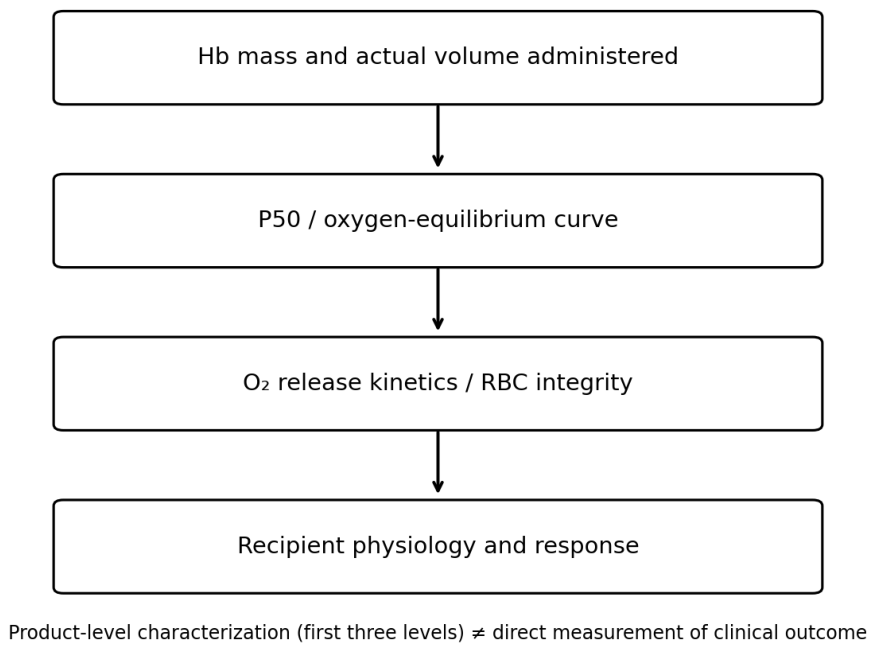
Characterization can combine measured Hb exposure, equilibrium oxygen affinity and functional or integrity measurements, including unloading kinetics, hemolysis, membrane condition and recovery. Guarnone et al. reported intra-assay and inter-assay coefficients of variation of 1.9% and 3.0% for an oxygen-equilibrium analyzer [85], supporting analytical feasibility while leaving clinical acceptance thresholds to be established.
In mice, Wang et al. found higher erythrocyte 2,3-BPG, increased P50 and reduced brain hypoxic signals after remote ischemic conditioning. Transfusion of 2,3-BPG-rich erythrocytes from conditioned donors also improved the measured ischemic-tissue response [86]. This experimental link supports investigation of RBC properties alongside Hb exposure; the design did not isolate P50 as the sole mechanism.
Figure 1.
P50 at day 0 and day 42 in two independent experimental studies [81,82]. Chng et al.: 33.2 and 24.9 mmHg; Kassa et al.: 30.0 and 22.1 mmHg. Lines connect selected endpoints without fitting storage trajectories. Experimental conditions differed, precluding pooling. The figure was redrawn from numerical results; no published artwork was reproduced. Chng et al. reported five biologically independent samples for bulk P50, while Kassa et al. repeated equilibrium measurements from one blood bag. The endpoints therefore differ in donor-level replication [81,82].
Figure 1.
P50 at day 0 and day 42 in two independent experimental studies [81,82]. Chng et al.: 33.2 and 24.9 mmHg; Kassa et al.: 30.0 and 22.1 mmHg. Lines connect selected endpoints without fitting storage trajectories. Experimental conditions differed, precluding pooling. The figure was redrawn from numerical results; no published artwork was reproduced. Chng et al. reported five biologically independent samples for bulk P50, while Kassa et al. repeated equilibrium measurements from one blood bag. The endpoints therefore differ in donor-level replication [81,82].
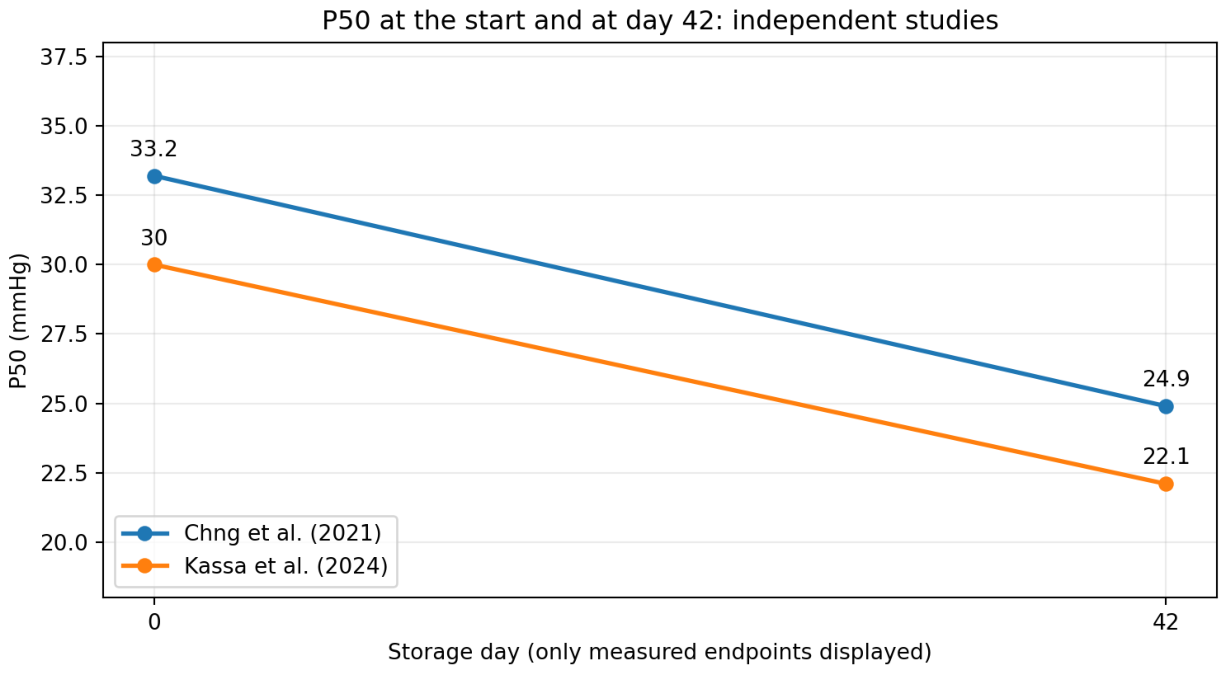
Figure 2.
Qualitative synthesis of Chng et al.’s storage findings [81]. Lower P50 occurred alongside greater oxygen release in the microfluidic assay. The text explains the assay-specific D50 interpretation. Arrows indicate reported relationships and directions, without quantifying effects or predicting tissue oxygenation. Original schematic.
Figure 2.
Qualitative synthesis of Chng et al.’s storage findings [81]. Lower P50 occurred alongside greater oxygen release in the microfluidic assay. The text explains the assay-specific D50 interpretation. Arrows indicate reported relationships and directions, without quantifying effects or predicting tissue oxygenation. Original schematic.
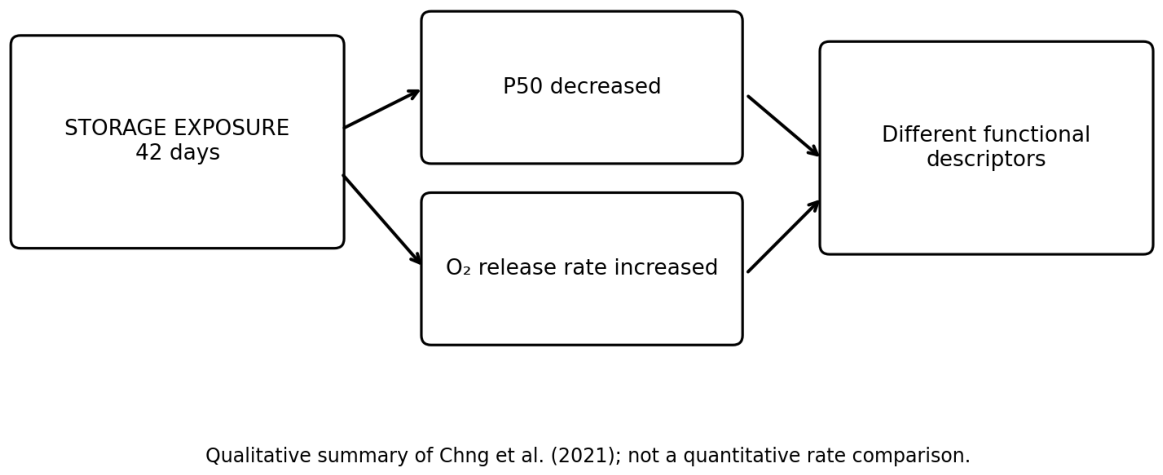
Figure 3.
Complementary measurements for component characterization. The author-developed diagram groups quantitative exposure, oxygen-affinity and functional or integrity measurements; it is a proposed assessment structure rather than a validated prediction algorithm.
Figure 3.
Complementary measurements for component characterization. The author-developed diagram groups quantitative exposure, oxygen-affinity and functional or integrity measurements; it is a proposed assessment structure rather than a validated prediction algorithm.
Limitations
The evidence spans different products, populations and periods. Single-center content ranges, observational studies, laboratory validation and clinical trials address different questions and were not pooled. Individual Hb measurements retain sampling and analytical uncertainty, while recipient blood volume, bleeding and cell persistence add uncertainty to response prediction. The review identifies a dose-documentation problem and a testable research approach; clinical superiority of content-based prescribing remains to be established.
Antigen exposure is an additional dimension of transfusion. Purvis et al. assessed early antibody formation after Rh(D)-positive low-titer group O whole blood or Rh(D)-negative RBC components in 3,531 trauma patients [87]. Such antibody outcomes should be recorded separately from Hb mass and interpreted within the study’s screening interval.
Patient blood management also changes transfusion exposure. Observational cardiac-surgery data associated intensive conservation in patients refusing allogeneic blood with fewer selected short-term complications than in matched transfused controls; selection and indication-for-transfusion bias limit causal interpretation [88]. In randomized ITACS, preoperative intravenous iron reduced the proportion of anemic elective cardiac-surgery patients receiving RBC transfusion from 68.2% to 61.1% [89]. These findings concern prevention and utilization alongside component characterization.
A laboratory tumor-environment model found impaired human natural killer cell proliferation and target-cell killing during sustained severe hypoxia, with a different response under the tested higher-oxygen conditions [90]. This provides an example of a cellular oxygen-response endpoint, rather than clinical evidence for transfusion or oxygen-carrier treatment. Clinical immune-function studies would need local oxygenation and actual target-cell killing measures.
Related Preprints and Comparative Context
Our Precision Oxygen Therapeutics preprint examines the relationship between oxygen-carrying material and the physiological function it is intended to support [91]. Before Blood Arrives applies this perspective to resuscitation when donor blood is delayed [92].
Two companion historical reviews address emergency and military development: the broader review traces the progression from blood-logistics concerns to product characterization and physiological design [93], while the RESUS review examines the documented research and regulatory decision pathway from 2003 to 2008 [94].
A separate narrative review of William W. Muir’s work links veterinary cardiorespiratory physiology, microvascular perfusion and hemoglobin-based oxygen therapeutics [95]. All five related works are non-peer-reviewed preprints, cited here for conceptual, historical and comparative context.
Historical Oxygen Carriers and Formulation Specific Evidence
Historical hemoglobin-based oxygen carrier (HBOC) studies show the need to assess Hb mass and physiological effect for each formulation, route and setting. George et al. observed smaller infarcts and better regional function after HBOC-201 in canine myocardial ischemia [96]. Standl et al. reported a faster rise in skeletal-muscle PO2 during severe hemodilution in dogs [97]. In swine, te Lintel Hekkert et al. preserved regional function during brief coronary occlusion by infusing preoxygenated HBOC-201 directly distal to the occlusion; effects depended on flow and temperature [98]. These mechanistic animal findings demonstrate neither human clinical efficacy nor efficacy of a different Biological Hemoglobin Oxygen Carrier (BHOC) formulation.
Contrary findings also need consideration. García-Ruiz et al. found greater infarct size after bloodless reperfusion with HBOC-201 alone in a porcine model. Glucose and insulin reversed the worsening without reducing infarct size relative to ordinary reperfusion [99]. A historical meta-analysis of 16 human trials, five cell-free Hb products and 3,711 patients found increased risks of death and myocardial infarction [100]. It cannot quantify risk for an untested formulation, but favorable animal physiology alone cannot demonstrate that these safety concerns have been resolved.
Formulation, dose, route and physiological setting determine the scope of oxygen-carrier evidence. RBCs, historical cell-free products and a new BHOC formulation require separate characterization and evaluation. For the present dose question, their comparison shows why equal Hb mass is insufficient to predict equal physiological behavior or clinical benefit.
Conclusion
A red cell unit is a practical inventory measure, but its Hb content varies within accepted quality standards. Recipient Hb concentration adds essential clinical information while remaining dependent on blood volume, fluids, losses and cell persistence. We propose linking measured final-component Hb content to the volume actually delivered and to samples collected at defined times. This would make material exposure explicit within established compatibility and patient blood management practice.
The next step is a prospective study in a defined stable population comparing prediction from routine component and recipient data with prediction after adding measured administered Hb mass. Independent validation should establish whether the gain is clinically meaningful and operationally feasible. Oxygen affinity, release kinetics, extracellular Hb and recipient perfusion can then be evaluated for additional predictive value, using independently measured physiological and clinical endpoints. This sequence would test whether more complete component characterization improves transfusion decisions and recipient outcomes.
AI Assistance
OpenAI ChatGPT assisted with literature searches, drafting and editing of selected passages, figure preparation, and manuscript formatting.
Funding
This work was self-funded. No external funding was received.
Acknowledgments
Dr Arun V. J., MD, MBA, Assistant Professor and Blood Centre In-charge, Department of Transfusion Medicine, Malabar Medical College Hospital & Research Centre, Kerala, India, provided a critical reading of the manuscript and constructive comments on hemoglobin dosing and the interpretation of transfusion-related evidence. Ari Gargir, PhD, CEO and Founder of RedC Biotech Ltd., commented on component quality specifications and the distinction between regulatory compliance and individual hemoglobin-dose standardization. Sarah Walbolt, a nurse executive and CEO of SANG Innovations Inc., is founder and host of Let’s Talk Patient Blood Management, serves on the Board of Directors of the Society for the Advancement of Patient Blood Management (SABM), and is a member of the AABB Patient Blood Management Standards Committee. Her comments informed the discussion of patient blood management, single-unit reassessment, hemoglobin-dose variability, iron exposure, and utilization metrics. Ahmed Sannat Alotaibi, MSc, BSc, Blood Transfusion & Blood Bank Specialist, Laboratory Department, Riyadh Third Health Cluster – Afif General Hospital, Afif, Saudi Arabia (ORCID: 0009-0007-6460-9092), reviewed clinical hemoglobin-content transfusion studies, sampling validity, final-component measurements, compatibility requirements, and dose uncertainty. Zahra Ghasemi, PharmD, PhD in Pharmacoeconomics, PGCPH, Georgetown Blood and Plasma Research Group, Washington, USA, advised on donor-related variation, interpretation of post-transfusion hemoglobin increments, and the distinction between administered and retained hemoglobin mass. Tom Ferry, B.S., CCP, Central Coast Perfusion, reviewed and commented on the extracorporeal support and hemoglobin mass accounting sections. Lee Ka Yan Karen is acknowledged for her assistance in collecting information and preparing materials for this manuscript, and for her collaboration with the authors on their earlier publications.
Conflicts of Interest
Carl W. Rausch and Archil Jaliashvili are involved in development of the BHOC Therapeutics project.
References
- Joint UK Blood Transfusion and Tissue Transplantation Services Professional Advisory Committee. Red Book section 7.3.2. Red Cells in Additive Solution, Leucocyte Depleted. 17 February 2026. Available online: https://www.jpac.org.uk/guidelines/red-book/chapters/7/7-3/7-3-2/ (accessed on 13 October 2026).
- Coleman, J.R.; Henry, R.; Raykar, N.; Holcomb, J.B. Blood or Crystalloids for Hemorrhagic Shock-Response to the Agency for Healthcare Research and Quality. JAMA Surg. Published online. 2026. [Google Scholar] [CrossRef] [PubMed]
- Carson, J.L.; Stanworth, S.J.; Guyatt, G.; Valentine, S.; Dennis, J.; Bakhtary, S.; et al. Red Blood Cell Transfusion: 2023 AABB International Guidelines. JAMA 2023, 330(19), 1892–1902. [Google Scholar] [CrossRef] [PubMed]
- Pagano, M.B.; Stanworth, S.J.; Dennis, J.; et al. Red cell transfusion in acute myocardial infarction: AABB international clinical practice guidelines. Ann. Intern Med. 2025. [Google Scholar] [CrossRef] [PubMed]
- Mazer, C.D.; Whitlock, R.P.; Fergusson, D.A.; et al. Restrictive or liberal red-cell transfusion for cardiac surgery. N Engl. J. Med. 2017, 377, 2133–2144. [Google Scholar] [CrossRef] [PubMed]
- Gillies, M.; Walsh, T.; Sinclair, R.; Keerie, C.; Stoddart, A. The impact of REStrictive versUs LIberaL Transfusion strategy on cardiac injury and death in patients undergoing surgery for Hip Fracture (RESULT-Hip). Protocol version 6.0, 31 January 2025. University of Edinburgh and Lothian NHS Board. ISRCTN28818784. Protocol, not an efficacy report. Available online: https://usher.ed.ac.uk/sites/default/files/2025-08/RESULT-HIP_Protocol_Version_6_31Jan2025.pdf (accessed on 19 October 2026).
- Gammon, R.R.; Blumberg, N.; Gilstad, C.; Mandal, S.; Nair, A.R.; Bocquet, C. Patient blood management: Myths and facts about red blood cell transfusions. Vox Sang. 2023, 118(7), 509–516. [Google Scholar] [CrossRef] [PubMed]
- Asante, A.; Nguyen, P.L.; Blumberg, N. A commentary on the optimal red blood cell transfusion threshold in acute leukemia patients. Blood Transfus. 2023, 21(6), 461–462. [Google Scholar] [CrossRef] [PubMed]
- Spiess, B.D. Red cell transfusions and guidelines: a work in progress. Hematol. Oncol. Clin. North Am. 2007, 21(1), 185–200. [Google Scholar] [CrossRef] [PubMed]
- Spiess, B.D. Heart Programs Are Strengthened by Pumping Iron. Innovations (Phila). Published online. 28 September 2026. [CrossRef]
- Agnihotri, N.; Pal, L.; Thakur, M.; Kumar, P. The need to label red blood cell units with their haemoglobin content: a single centre study on haemoglobin variations due to donor-related factors. Blood Transfus. 2014, 12(4), 520–526. [Google Scholar] [CrossRef] [PubMed]
- Jain, R.; Sachdev, S.; Marwaha, N.; Gupta, A. Assessment of hemoglobin content of packed red cells: A prospective study on hemoglobin content variation due to donor, collection, and processing-related factors. Is it time to label each unit with hemoglobin content? Glob. J. Transfus. Med. 2022, 7(1), 36–41. [Google Scholar] [CrossRef] [PubMed]
- Electronic Code of Federal Regulations. 21 CFR § 630.10(f)(3): Donor hemoglobin or hematocrit determination and minimum eligibility standards. Available online: https://www.ecfr.gov/current/title-21/chapter-I/subchapter-F/part-630/subpart-B/section-630.10 (accessed on 13 October 2026).
- US Food and Drug Administration. Blood & Blood Products. Available online: https://www.fda.gov/vaccines-blood-biologics/blood-blood-products (accessed on 13 October 2026).
- Electronic Code of Federal Regulations. 21 CFR 610.53. Dating periods for Whole Blood and blood components. Available online: https://www.ecfr.gov/current/title-21/chapter-I/subchapter-F/part-610/subpart-F/section-610.53 (accessed on 13 October 2026).
- D'Alessandro, A.; Culp-Hill, R.; Reisz, J.A.; Anderson, M.; Fu, X.; Nemkov, T.; et al. Heterogeneity of blood processing and storage additives in different centers impacts stored red blood cell metabolism as much as storage time: lessons from REDS-III-Omics. Transfusion 2019, 59(1), 89–100. [Google Scholar] [CrossRef] [PubMed]
- Doctor, A.; Spinella, P. Effect of processing and storage on red blood cell function in vivo. Semin Perinatol. 2012, 36(4), 248–259. [Google Scholar] [CrossRef] [PubMed]
- Hess, J.R. Measures of stored red blood cell quality. Vox Sang. 2014, 107(1), 1–9. [Google Scholar] [CrossRef] [PubMed]
- Zheng, X.; Wang, L.; Cao, H.; et al. Stress-Resistant Plant Cell-Wall Inspired Cell Armor Enables Red Blood Cell Lyophilization. Adv. Mater. Published online. 2026, e75447. [Google Scholar] [CrossRef] [PubMed]
- Kabi, Fresenius. U.S.A. Adsol Red Cell Preservation CPD/AS-1 kit. Official product labeling, formulation and blood collection set. DailyMed. Available online: https://dailymed.nlm.nih.gov/dailymed/drugInfo.cfm?setid=9c2a477c-c155-414e-a969-36810a1b7753 (accessed on 13 October 2026).
- Terumo, B.C.T. Additive Solution Formula 3 AS-3. Official product labeling, sections 3, 11 and 12. DailyMed. 30 January 2026. Available online: https://dailymed.nlm.nih.gov/dailymed/drugInfo.cfm?setid=9a5247a1-cc05-442d-b2d0-950f887f03c2 (accessed on 13 October 2026).
- Terumo, B.C.T. Reveos Select CPD with AS-5 red cell preservative solution for collection of 500 mL of blood. Official product labeling, sections 3, 11, 12 and 16. DailyMed. Available online: https://dailymed.nlm.nih.gov/dailymed/drugInfo.cfm?setid=58bdabc8-283a-47bd-8abe-dd9284f3f497 (accessed on 13 October 2026).
- Fenwal. CPDA-1 Anticoagulant Citrate Phosphate Dextrose Adenine solution. Official product labeling and collection-set formulation. DailyMed. Available online: https://dailymed.nlm.nih.gov/dailymed/drugInfo.cfm?setid=cf9f43a0-c750-4cf0-ac49-176ab2105aab (accessed on 13 October 2026).
- Haemonetics. Anticoagulant Citrate Phosphate Double Dextrose solution CP2D. Official product labeling, intended use, formulations and solution-container description. DailyMed. Available online: https://dailymed.nlm.nih.gov/dailymed/drugInfo.cfm?setid=1c149b86-5f9d-4e60-8f17-4ec03ca80563 (accessed on 13 October 2026).
- Haemonetics. Anticoagulant Citrate Dextrose Solution USP ACD Solution A. Official product labeling. DailyMed. Available online: https://dailymed.nlm.nih.gov/dailymed/drugInfo.cfm?setid=ec28b740-2fd1-453e-9ee9-1aa20d223d6c (accessed on 13 October 2026).
- Terumo, B.C.T. Safety Data Sheet PN 777960-001B. Revised 22 May 2013; SAG-M Saline Adenine Glucose Mannitol. Available online: https://www.terumobct.com/content/dam/terumo-bct/local-documents/safety-data-sheets/Safety%20Data%20Sheet%20for%20Saline%20Adenine%20Glucose%20-%20Mannitol%20%28SAG-M%29.pdf (accessed on 13 October 2026).
- Vermeulen, C.; den Besten, G.; van den Bos, A.G.; Go, M.; Gouwerok, E.; Vlaar, R.; et al. Clinical and in vitro evaluation of red blood cells collected and stored in a non-DEHP plasticized bag system. Vox Sang. 2022, 117(10), 1163–1170. [Google Scholar] [CrossRef] [PubMed]
- van Wonderen, S.F.; Vermeulen, C.; Lagerberg, J.; van Amstel, R.B.E.; Ribble, L.; Sedjo, R.L.; et al. In vitro and in vivo evaluation of leukoreduced red cell concentrates stored in non-DEHP storage bags. Vox Sang. 2026, 121(6), 789–800. [Google Scholar] [CrossRef] [PubMed]
- Dumont, L.J.; Yoshida, T.; AuBuchon, J.P. Anaerobic storage of red blood cells in a novel additive solution improves in vivo recovery. Transfusion 2009, 49(3), 458–464. [Google Scholar] [CrossRef] [PubMed]
- Bicalho, B.; Serrano, K.; Dos Santos Pereira, A.; Devine, D.V.; Acker, J.P. Blood Bag Plasticizers Influence Red Blood Cell Vesiculation Rate without Altering the Lipid Composition of the Vesicles. Transfus. Med. Hemother 2016, 43(1), 19–26. [Google Scholar] [CrossRef] [PubMed]
- US Food and Drug Administration; Hemanext ONE. BR220665 De Novo Decision Summary. 2023. Available online: https://www.fda.gov/media/172729/download (accessed on 13 October 2026).
- US Food and Drug Administration. Hemanext ONE. BK251294 510(k) Summary. 13 November 2025. Available online: https://www.fda.gov/media/191504/download (accessed on 13 October 2026).
- Yoshida, T.; Blair, A.; D'alessandro, A.; Nemkov, T.; Dioguardi, M.; Silliman, C.C.; et al. Enhancing uniformity and overall quality of red cell concentrate with anaerobic storage. Blood Transfus. 2017, 15(2), 172–181. [Google Scholar] [CrossRef] [PubMed]
- Agostini, V.; Henschler, R.; Lunde, T.H.F.; Kristoffersen, E.K.; Hetland, G.; Danilova, E.; et al. A validation study of the in vitro performance of hypoxic red blood cells for transfusion across centers in Europe. Transfusion 2025, 65(12), 2306–2315. [Google Scholar] [CrossRef] [PubMed]
- DʼAlessandro, A.; Yoshida, T.; Nestheide, S.; Nemkov, T.; Stocker, S.; Stefanoni, D.; et al. Hypoxic storage of red blood cells improves metabolism and post-transfusion recovery. Transfusion 2020, 60(4), 786–798. [Google Scholar] [CrossRef] [PubMed]
- Rabcuka, J.; Blonski, S.; Meli, A.; Sowemimo-Coker, S.; Zaremba, D.; Stephenson, D.; et al. Metabolic reprogramming under hypoxic storage preserves faster oxygen unloading from stored red blood cells. Blood Adv. 2022, 6(18), 5415–5428. [Google Scholar] [CrossRef] [PubMed]
- JPAC. Red Cells, Rejuvenated and Washed, Leucocyte Depleted. Annex 3, A3.4. 17 February 2026. Available online: https://www.jpac.org.uk/guidelines/red-book/annex-3/3-4/ (accessed on 13 October 2026).
- Heaton, W.A. Red blood cell hemolysis: an old standard in changing times. Transfusion 2009, 49(12), 2551–2554. [Google Scholar] [CrossRef] [PubMed]
- Baek, J.H.; D'Agnillo, F.; Vallelian, F.; Pereira, C.P.; Williams, M.C.; Jia, Y.; et al. Hemoglobin-driven pathophysiology is an in vivo consequence of the red blood cell storage lesion that can be attenuated in guinea pigs by haptoglobin therapy. J. Clin. Invest. 2012, 122(4), 1444–1458. [Google Scholar] [CrossRef] [PubMed]
- Figueiredo, R.T.; Fernandez, P.L.; Mourao-Sa, D.S.; Porto, B.N.; Dutra, F.F.; Alves, L.S.; et al. Characterization of heme as activator of Toll-like receptor 4. J. Biol. Chem. 2007, 282(28), 20221–20229. [Google Scholar] [CrossRef] [PubMed]
- Belcher, J.D.; Chen, C.; Nguyen, J.; Milbauer, L.; Abdulla, F.; Alayash, A.I.; et al. Heme triggers TLR4 signaling leading to endothelial cell activation and vaso-occlusion in murine sickle cell disease. Blood 2014, 123(3), 377–390. [Google Scholar] [CrossRef] [PubMed]
- Vallelian, F.; Schaer, C.A.; Deuel, J.W.; Ingoglia, G.; Humar, R.; Buehler, P.W.; et al. Revisiting the putative role of heme as a trigger of inflammation. Pharmacol. Res. Perspect. 2018, 6(2), e00392. [Google Scholar] [CrossRef] [PubMed]
- Rapido, F.; Brittenham, G.M.; Bandyopadhyay, S.; La Carpia, F.; L'Acqua, C.; McMahon, D.J.; et al. Prolonged red cell storage before transfusion increases extravascular hemolysis. J. Clin. Invest. 2017, 127(1), 375–382. [Google Scholar] [CrossRef] [PubMed]
- Steiner, M.E.; Ness, P.M.; Assmann, S.F.; et al. Effects of red-cell storage duration on patients undergoing cardiac surgery. N Engl. J. Med. 2015, 372(15), 1419–1429. [Google Scholar] [CrossRef] [PubMed]
- Stowell, C.P.; Whitman, G.; Granger, S.; et al. The impact of red blood cell storage duration on tissue oxygenation in cardiac surgery. J. Thorac. Cardiovasc Surg. 2017, 153(3), 610–619.e2. [Google Scholar] [CrossRef] [PubMed]
- Donovan, K.; Meli, A.; Cendali, F.; et al. Stored blood has compromised oxygen unloading kinetics that can be normalized with rejuvenation and predicted from corpuscular side-scatter. Haematologica 2022, 107(1), 298–302. [Google Scholar] [CrossRef] [PubMed]
- Weiskopf, R.B.; Feiner, J.; Hopf, H.W.; et al. Fresh blood and aged stored blood are equally efficacious in immediately reversing anemia-induced brain oxygenation deficits in humans. Anesthesiology 2006, 104(5), 911–920. [Google Scholar] [CrossRef] [PubMed]
- Fergusson, D.A.; Hébert, P.; Hogan, D.L.; et al. Effect of fresh red blood cell transfusions on clinical outcomes in premature, very low-birth-weight infants: the ARIPI randomized trial. JAMA 2012, 308(14), 1443–1451. [Google Scholar] [CrossRef] [PubMed]
- Dhabangi, A.; Ainomugisha, B.; Cserti-Gazdewich, C.; et al. Effect of Transfusion of Red Blood Cells With Longer vs Shorter Storage Duration on Elevated Blood Lactate Levels in Children With Severe Anemia: The TOTAL Randomized Clinical Trial. JAMA 2015, 314(23), 2514–2523. [Google Scholar] [CrossRef] [PubMed]
- Roubinian, N.H.; Plimier, C.; Woo, J.P.; Lee, C.; Bruhn, R.; Liu, V.X.; et al. Effect of donor, component, and recipient characteristics on hemoglobin increments following red blood cell transfusion. Blood 2019, 134(13), 1003–1013. [Google Scholar] [CrossRef] [PubMed]
- Roubinian, N.H.; Reese, S.E.; Qiao, H.; Plimier, C.; Fang, F.; Page, G.P.; et al. Donor genetic and nongenetic factors affecting red blood cell transfusion effectiveness. JCI Insight 2022, 7(1), e152598. [Google Scholar] [CrossRef] [PubMed]
- Wiesen, A.R.; Hospenthal, D.R.; Byrd, J.C.; Glass, K.L.; Howard, R.S.; Diehl, L.F. Equilibration of hemoglobin concentration after transfusion in medical inpatients not actively bleeding. Ann. Intern Med. 1994, 121(4), 278–280. [Google Scholar] [CrossRef] [PubMed]
- Lo, B.D.; Cho, B.C.; Hensley, N.B.; Cruz, N.C.; Gehrie, E.A.; Frank, S.M. Impact of body weight on hemoglobin increments in adult red blood cell transfusion. Transfusion 2021, 61(5), 1412–1423. [Google Scholar] [CrossRef] [PubMed]
- Quispe-Cornejo, A.A.; Alves da Cunha, A.L.; Njimi, H.; Mongkolpun, W.; Valle-Martins, A.L.; Arébalo-López, M.; et al. Effects of rapid fluid infusion on hemoglobin concentration: a systematic review and meta-analysis. Crit. Care 2022, 26(1), 324. [Google Scholar] [CrossRef] [PubMed]
- Roberts, A.W.; Crowe, E.; Moustafa, A.Z.; Shepherd, M.C.; Sibai, B.; Blackwell, S.C. Hemoglobin equilibration after transfusion in stable postpartum patients. Pregnancy 2026, 2(2), e70248. [Google Scholar] [CrossRef] [PubMed]
- Carter, P.W.; Dunham, A.J. Modeling hemoglobin levels of patients chronically transfused with red blood cells. Transfusion 2023, 63(5), 952–959. [Google Scholar] [CrossRef] [PubMed]
- Reuland, M.C.; Raasveld, S.J.; Dongelmans, D.A.; Elbers, P.W.G.; Müller, M.C.A.; Vlaar, A.P.J. Hemorrhagic shock in intensive care: Variation in blood product administration during resuscitation. Vox Sang. Published online. 23 September 2026. [CrossRef]
- Aquina, C.T.; Blumberg, N.; Probst, C.P.; Becerra, A.Z.; Hensley, B.J.; Iannuzzi, J.C.; et al. Significant Variation in Blood Transfusion Practice Persists following Upper GI Cancer Resection. J. Gastrointest. Surg. 2015, 19(11), 1927–1937. [Google Scholar] [CrossRef] [PubMed]
- Crombie, N.; Doughty, H.A.; Bishop, J.R.B.; et al. Resuscitation with pre-hospital blood products in adults with trauma-related haemorrhagic shock: the RePHILL RCT. Effic. Mech. Eval. 2024, 11(2), 1–61. [Google Scholar] [CrossRef] [PubMed]
- Woyke, S.; Ströhle, M.; Brugger, H.; Strapazzon, G.; Gatterer, H.; Mair, N.; et al. High-throughput determination of oxygen dissociation curves in a microplate reader-A novel, quantitative approach. Physiol. Rep. 2021, 9(16), e14995. [Google Scholar] [CrossRef] [PubMed]
- Vanhille, D.L.; Nussenzveig, R.H.; Glezos, C.; Perkins, S.; Agarwal, A.M. Best practices for use of the HEMOX analyzer in the clinical laboratory: quality control determination and choice of anticoagulant. Lab Hematol. 2012, 18(3), 17–19. [Google Scholar] [CrossRef] [PubMed]
- Chu, Z.; Wang, Y.; You, G.; Wang, Q.; Ma, N.; Li, B.; et al. The P50 value detected by the oxygenation-dissociation analyser and blood gas analyser. Artif. Cells Nanomed. Biotechnol. 2020, 48(1), 867–874. [Google Scholar] [CrossRef] [PubMed]
- Kurach, J.D.; Hansen, A.L.; Turner, T.R.; Jenkins, C.; Acker, J.P. Segments from red blood cell units should not be used for quality testing. Transfusion 2014, 54(2), 451–455. [Google Scholar] [CrossRef] [PubMed]
- Wahba, A.; Kunst, G.; De Somer, F.; et al. 2024 EACTS/EACTAIC/EBCP Guidelines on cardiopulmonary bypass in adult cardiac surgery. Br. J. Anaesth. 2025, 134(4), 917–1008. [Google Scholar] [CrossRef] [PubMed]
- Tonna, J.E.; Abrams, D.; Brodie, D.; et al. Management of adult patients supported with venovenous extracorporeal membrane oxygenation: guideline from the Extracorporeal Life Support Organization (ELSO). ASAIO J. 2021, 67(6), 601–610. [Google Scholar] [CrossRef] [PubMed]
- Lorusso, R.; Shekar, K.; MacLaren, G.; et al. ELSO Interim Guidelines for Venoarterial Extracorporeal Membrane Oxygenation in Adult Cardiac Patients. ASAIO J. Associated erratum: ASAIO J. 2022. 2021, 67(8) 68(7), 827–844 e133. [Google Scholar] [CrossRef] [PubMed]
- Ranucci, M.; Johnson, I.; Willcox, T.; et al. Goal-directed perfusion to reduce acute kidney injury: a randomized trial. J. Thorac. Cardiovasc Surg. 2018, 156(5), 1918–1927.e2. [Google Scholar] [CrossRef] [PubMed]
- Arslan, O.; Toprak, S.; Arat, M.; Kayalak, Y. Hb content-based transfusion policy successfully reduces the number of RBC units transfused. Transfusion 2004, 44(4), 485–488. [Google Scholar] [CrossRef] [PubMed]
- Reikvam, H.; Prowse, C.; Roddie, H.; Heddle, N.M.; Hervig, T.; BEST collaborative. A pilot study of the possibility and the feasibility of haemoglobin dosing with red blood cells transfusion. Vox Sang. 2010, 99(1), 71–76. [Google Scholar] [CrossRef] [PubMed]
- Atilla, E.; Toprak, S.K.; Civriz Bozdağ, S.; Topçuoğlu, P.; Arslan, Ö. A Randomized Comparison of Hemoglobin Content-Based Versus Standard (Unit-Based) Red Blood Cell Transfusion Policy. Turk. J. Haematol. 2017, 34(3), 244–249. [Google Scholar] [CrossRef] [PubMed]
- Raja, A.; Jain, A.; Marwaha, N.; Trehan, A. Comparison of efficacy of packed red blood cell transfusion based on its hemoglobin content versus the standard transfusion practice in thalassemia major patients (HEMOCON study). Transfus. Apher. Sci. 2020, 59(3), 102736. [Google Scholar] [CrossRef] [PubMed]
- Gamberini, M.R.; Fortini, M.; Stievano, A.; Calori, E.; Riontino, M.V.; Ceccherelli, G.; et al. Impact of the preparation method of red cell concentrates on transfusion indices in thalassemia patients: A randomized crossover clinical trial. Transfusion 2021, 61(6), 1729–1739. [Google Scholar] [CrossRef] [PubMed]
- Kaur, M.; Kaur, R.; Sood, T.; Jindal, G.; Kaur, P.; Mittal, K. Efficacy of packed red blood cell transfusions based on weight versus formula in thalassemic children: An open-label randomized control trial. Transfusion 2022, 62(4), 791–796. [Google Scholar] [CrossRef] [PubMed]
- Arunkumari, A.; Jain, A.; Malhotra, S.; Dhawan, H.K.; Peyam, S.; Kumari, S.; et al. Transfusion efficacy of leucoreduced packed red blood cells prepared by two different methods: A randomized controlled trial in transfusion-dependent thalassaemia patients (FUEL trial). Vox Sang. 2025, 120(4), 419–427. [Google Scholar] [CrossRef] [PubMed]
- Proffitt, S.; Curnow, E.; Brown, C.; Bashir, S.; Cardigan, R. Comparison of automated and manual methods for washing red blood cells. Transfusion 2018, 58(9), 2208–2216. [Google Scholar] [CrossRef] [PubMed]
- Wolf, J.; Blais-Normandin, I.; Bathla, A.; Keshavarz, H.; Chou, S.T.; Al-Riyami, A.Z.; et al. Red cell specifications for blood group matching in patients with haemoglobinopathies: An updated systematic review and clinical practice guideline from the International Collaboration for Transfusion Medicine Guidelines. Br. J. Haematol. 2025, 206(1), 94–108. [Google Scholar] [CrossRef] [PubMed]
- Sakr, Y.; Chierego, M.; Piagnerelli, M.; et al. Microvascular response to red blood cell transfusion in patients with severe sepsis. Crit. Care Med. 2007, 35(7), 1639–1644. [Google Scholar] [CrossRef] [PubMed]
- National Institute for Health and Care Excellence. Blood transfusion. NICE guideline NG24. Recommendations 1.6.1 and 1.6.2. Updated. 26 February 2026. Available online: https://www.nice.org.uk/guidance/ng24/resources/blood-transfusion-1837331897029 (accessed on 13 October 2026).
- Bueno, J.L.; Bocanegra, A.B.; Sánchez, I.; et al. Transfusion-associated adverse events incidence and severity after the implementation of an active hemovigilance program with 24 h follow-up. A prospective cohort study. Transfusion 2023, 63(10), 1859–1871. [Google Scholar] [CrossRef] [PubMed]
- Martel, E.; Forte, K.; Tremblay, E.; et al. Quality improvement program for transfusion reaction reporting and management. Transfusion. Published online. 18 October 2026. [CrossRef]
- Chng, K.Z.; Ng, Y.C.; Namgung, B.; Tan, J.K.S.; Park, S.; Tien, S.L.; et al. Assessment of transient changes in oxygen diffusion of single red blood cells using a microfluidic analytical platform. Commun. Biol. 2021, 4(1), 271. [Google Scholar] [CrossRef] [PubMed]
- Kassa, T.; Jana, S.; Baek, J.H.; Alayash, A.I. Impact of cold storage on the oxygenation and oxidation reactions of red blood cells. Front Physiol. 2024, 15, 1427094. [Google Scholar] [CrossRef] [PubMed]
- Chen, Y.; Darrow, C.; Murray, A.; Wise, T.; Li, Z.L.; Srivastava, N.; et al. Human red blood cell ATP content and export under hypoxic and/or isocapnic storage conditions. Front Physiol. 2025, 16, 1641343. [Google Scholar] [CrossRef] [PubMed]
- Gelderman, M.P.; Yazer, M.H.; Jia, Y.; Wood, F.; Alayash, A.I.; Vostal, J.G. Serial oxygen equilibrium and kinetic measurements during RBC storage. Transfus. Med. 2010, 20(5), 341–345. [Google Scholar] [CrossRef] [PubMed]
- Guarnone, R.; Centenara, E.; Barosi, G. Performance characteristics of Hemox-Analyzer for assessment of the hemoglobin dissociation curve. Haematologica 1995, 80(5), 426–430. Available online: https://pubmed.ncbi.nlm.nih.gov/8566883/. [PubMed]
- Wang, L.; Ren, C.; Li, Y.; et al. Remote ischemic conditioning enhances oxygen supply to ischemic brain tissue in a mouse model of stroke: Role of elevated 2,3-biphosphoglycerate in erythrocytes. J. Cereb. Blood Flow Metab. 2021, 41(6), 1277–1290. [Google Scholar] [CrossRef] [PubMed]
- Purvis, C.D.; Bavishi, D.; Rigi, M.; Foster, A.P.; Clemens, E.A.; Van Gent, J.M.; et al. What is the Incidence of Early Antibody Formation After Resuscitation of Hemorrhage? A Comparison of RH(D)+ Whole Blood and RH(D)- Red Blood Cells in 3531 Trauma Patients. Ann. Surg. 2026, 284(3), 566–572. [Google Scholar] [CrossRef] [PubMed]
- Pattakos, G.; Koch, C.G.; Brizzio, M.E.; et al. Outcome of patients who refuse transfusion after cardiac surgery: a natural experiment with severe blood conservation. Arch. Intern Med. 2012, 172(15), 1154–1160. [Google Scholar] [CrossRef] [PubMed]
- Myles, P.S.; et al. Intravenous iron to treat anaemia before cardiac surgery (ITACS): international, double blind, placebo controlled randomised trial. BMJ 2026, 394, e100407. [Google Scholar] [CrossRef] [PubMed]
- Kennedy, P.R.; Arvindam, U.S.; Phung, S.K.; et al. Metabolic programs drive function of therapeutic NK cells in hypoxic tumor environments. Sci. Adv. 2024, 10(44), eadn1849. [Google Scholar] [CrossRef] [PubMed]
- Rausch, C.W.; Jaliashvili, A. Precision Oxygen Therapeutics: From Blood Substitutes to the Biological Hemoglobin Oxygen Carrier (BHOC) Framework for Controlled Microvascular and Tissue-Level Oxygen Delivery. Preprints.org [Preprint]. Version 1; not peer reviewed. 2026. [Google Scholar] [CrossRef]
- Wong, B.L.; Rausch, C.W.; Jaliashvili, A.; Karen, Lee Ka Yan. Before Blood Arrives: Function-Based Resuscitation for Military Medicine and EMS in the Era of Prolonged and Drone-Contested Evacuation. Preprints.org [Preprint]. Version 1; not peer reviewed. 2026. [Google Scholar] [CrossRef]
- Rausch, C.W.; Wong, B.L.; Jaliashvili, A. BHOC - Biological Hemoglobin Oxygen Carriers in Emergency, Prehospital, and Military Medicine: Historical Development, Product Characterization, and the Evolution Toward Precision Oxygen Therapeutics. Preprints.org [Preprint] ., Version 1; not peer reviewed; 2026. [Google Scholar] [CrossRef]
- Rausch, C.W.; Wong, B.L.; Jaliashvili, A. The RESUS Decision Pathway in US Military Trauma Research from 2003 to 2008. Preprints.org [Preprint]. Version 1; not peer reviewed. 2026. [Google Scholar] [CrossRef]
- Jaliashvili, A. Oxygen Delivery, Tissue Function, and Veterinary Oxygen Therapeutics: A Narrative Review of William W. Muir’s Scientific Contributions. Preprints.org [Preprint]. Version 1; not peer reviewed. 2026. [Google Scholar] [CrossRef]
- George, I.; Yi, G.H.; Schulman, A.R.; et al. A polymerized bovine hemoglobin oxygen carrier preserves regional myocardial function and reduces infarct size after acute myocardial ischemia. Am. J. Physiol. Heart Circ. Physiol. 2006, 291(3), H1126–H1137. [Google Scholar] [CrossRef] [PubMed]
- Standl, T.; Freitag, M.; Burmeister, M.A.; et al. Hemoglobin-based oxygen carrier HBOC-201 provides higher and faster increase in oxygen tension in skeletal muscle of anemic dogs than do stored red blood cells. J. Vasc. Surg. 2003, 37(4), 859–865. [Google Scholar] [CrossRef] [PubMed]
- te Lintel Hekkert, M.; Dubé, G.P.; Regar, E.; et al. Preoxygenated hemoglobin-based oxygen carrier HBOC-201 annihilates myocardial ischemia during brief coronary artery occlusion in pigs. Am. J. Physiol. Heart Circ. Physiol. 2010, 298(3), H1103–H1113. [Google Scholar] [CrossRef] [PubMed]
- García-Ruiz, J.M.; Galán-Arriola, C.; Fernández-Jiménez, R.; et al. Bloodless reperfusion with the oxygen carrier HBOC-201 in acute myocardial infarction: a novel platform for cardioprotective probes delivery. Basic Res. Cardiol. 2017, 112(2), 17. [Google Scholar] [CrossRef] [PubMed]
- Natanson, C.; Kern, S.J.; Lurie, P.; Banks, S.M.; Wolfe, S.M. Cell-free hemoglobin-based blood substitutes and risk of myocardial infarction and death: a meta-analysis. JAMA 2008, 299(19), 2304–2312. [Google Scholar] [CrossRef] [PubMed]
Table 3.
Examples of container materials and gas-control arrangements.
| Container or system | Material or arrangement | What should be recorded |
|---|---|---|
| Conventional PVC with DEHP | PVC film plasticized with di(2-ethylhexyl) phthalate. DEHP contributes to red cell membrane stabilization during storage [27]. | Bag identity and additive; DEHP identifies the plasticizer, not the entire finished film. |
| PVC with DINCH | PVC plasticized with 1,2-cyclohexane dicarboxylic acid diisononyl ester [27,28]. | Collection bag and final storage bag separately; the tested solution and storage interval. |
| PVC with BTHC | PVC plasticized with N-butyryl-tri-n-hexyl citrate [27]. | BTHC and its associated additive; results from one combination cannot be assigned to all combinations. |
| PVC with DINCH/BTHC blend | A proprietary blend of alternative plasticizers used in the 2026 evaluation [28]. | Manufacturer and product identifier; published descriptions do not specify every blend proportion. |
| Hemanext ONE oxygen-controlled system | An oxygen-reduction bag and a barrier storage bag; gas exchange occurs across a sterile membrane [31,32]. | Processing method, O₂/CO₂ reduction, and storage bag; permitted preparations and expiry specified in the system instructions. |
Disclaimer/Publisher’s Note: The statements, opinions and data contained in all publications are solely those of the individual author(s) and contributor(s) and not of MDPI and/or the editor(s). MDPI and/or the editor(s) disclaim responsibility for any injury to people or property resulting from any ideas, methods, instructions or products referred to in the content. |
© 2026 by the authors. Licensee MDPI, Basel, Switzerland. This article is an open access article distributed under the terms and conditions of the Creative Commons Attribution (CC BY) license (http://creativecommons.org/licenses/by/4.0/).
Copyright: This open access article is published under a Creative Commons CC BY 4.0 license, which permit the free download, distribution, and reuse, provided that the author and preprint are cited in any reuse.