

Submitted:
20 October 2026
Posted:
20 October 2026
You are already at the latest version
Abstract
IEEE 802.11ax (Wi-Fi 6) has been designed to improve spectral efficiency, network capacity, and user experience in dense wireless environments through advanced features such as Orthogonal Frequency Division Multiple Access, Multi-User Multiple Input Multiple Output, and spatial reuse mechanisms. However, despite extensive simulation-based evaluations, there remains limited empirical evidence regarding the performance of 802.11ax networks under realistic noisy and interference-prone conditions. This study addresses this gap by experimentally investigating the impact of noise and interference on 802.11ax link throughput in a controlled yet representative wireless environment. A series of measurements was conducted under varying interference levels to quantify throughput degradation and assess the robustness of Wi-Fi 6 communications in challenging radio-frequency environments. Specifically, a series of six measurements scenarios (residential living room, university library, cafeteria, ferry terminal, building construction site, and a busy road) were conducted under varying interference levels to evaluate throughput degradation and assess the robustness of Wi-Fi 6 communications in challenging radio-frequency conditions. The results demonstrate that link throughput deteriorates significantly as interference intensity increases, highlighting the practical limitations of 802.11ax in congested wireless environments despite its enhanced PHY and MAC layer capabilities. The findings further reveal discrepancies between theoretical performance expectations and operational behaviour observed in real deployments, emphasizing the importance of empirical validation for next-generation wireless technologies. By providing experimentally derived performance benchmarks, this work contributes to a deeper understanding of Wi-Fi 6 reliability and resilience in dense wireless scenarios. The results offer valuable insights for network planning, interference management, and deployment optimization in smart campuses, enterprise networks, and Future Internet infrastructures. Furthermore, the study establishes a foundation for future research on interference-aware wireless networking, intelligent spectrum management, and the performance evaluation of emerging standards such as IEEE 802.11be (Wi-Fi 7).
Keywords:
Wi-Fi 6
; IEEE 802.11ax
; field measurements
; throughput
; ad-hoc network
; wireless LAN
; interference
; 2.4 GHz
; 5 GHz
1. Introduction
The IEEE 802.11ax (Wi-Fi 6) wireless local area networks are popular Internet access technologies [1,2,3]. The newer IEEE 802.11be (Wi-Fi 7) standard builds on 802.11ax with wider 320 MHz channels, 4096-QAM, and multi-link operation to deliver extremely high throughput [5,6,7], so a clear understanding of how 802.11ax behaves in real, noisy environments is a useful baseline for evaluating these next generation networks. 802.11ax technology can be used for high efficiency, but the impact of radio propagation models on system performance in noisy channels needs to be thoroughly investigated [8,9]. Therefore, this article examines how a typical 802.11ax network performs in noisy channels using propagation models such as two-ray ground, free space, shadowing path loss, and overall shadowing in the 2.4- and 5 GHz frequency bands. The field results indicate that the performance of 802.11ax is significantly impacted by noise and interference. The results presented in this study offer insight into Wi-Fi performance in noisy channels to help network researchers and administrators further contribute to developing Wi-Fi networks that can function in noisy channels. A simulation environment to test 802.11ax using a computer is less expensive. However, many critical factors, such as moving obstacles and home appliances that operate at the same frequency, must be considered to test the performance of the 802.11ax network before full-phase implementation. The analysis of this research shows that noise and interference severely affect the system’s performance. To address this issue, it is important to analyze the propagation model. A comparatively free space path loss model can be used to obtain better output. A strong wireless local area network (WLAN) performance analysis is required to understand the full advantage. Effective WLAN planning must be completed in advance to provide a high-quality WLAN infrastructure [10,11]. The sections below discuss motivation and related work, the noisy and interfering environment considered, results and discussion, finding the closest match between propagation measurements and models, and the conclusion. The research challenges, scope, and contribution are discussed next.
1.1. Research Challenges
A better plan is needed before implementing the 802.11ax network at 2.4- and 5 GHz bands in the living room, library, cafeteria, ferry terminal, construction site, and busy road. Because 2.4 GHz band performance can affect by interference from household devices like microwaves and Bluetooth, EMI from tools and machinery, and nearby hotspots, similarly, 5 GHz band performance can be affected by signal penetration through walls, furniture, bookshelves, concrete, and metal. The following three research questions are addressed in this paper:
Research Question 1: What impact do noisy and interference environments (both indoor and outdoor) have on 802.11ax link throughput? This question attempts to investigate the effects of noise and interference on the robustness of 802.11ax connection throughput to comprehend how different degrees of electromagnetic interference (EMI) and physical barriers affect system performance. We studied the system’s performance through extensive indoor and outdoor radio propagation field experiments.
Research question 2: What effect does interference sources such as Bluetooth devices, microwave ovens, other devices have on 802.11ax link throughput? The main goal of this question is to find and measure the effects of common types of interference in indoor and outdoor settings. It also offers comprehensive information on how each interference impacts the network.
Research question 3: What theoretical propagation model best fits the 802.11ax measured RSS in noise and interfering environments?
This question aims to improve the predictability and dependability of IEEE 802.11ax deployment strategies by identifying the most efficient model to simulate and predict network behavior under various interference conditions. We contrast empirical data from field trials with predictions made by different propagation models to identify the model that best fits the propagation models and the field data. Four widespread propagation models, free space, two-ray ground, shadowing path loss, and overall shadowing, are considered and examined.
1.2. Key Contributions, Research Gap, and Novelty
Despite the significant body of research on IEEE 802.11ax (Wi-Fi 6), much of the existing knowledge is derived from simulation-based studies, analytical models, or highly controlled laboratory environments. Consequently, there remains a critical gap in understanding how 802.11ax performs under realistic noisy and interference-prone conditions, where environmental variability, spectrum congestion, and external wireless activity can substantially affect network behaviour. Furthermore, relatively few studies have systematically quantified the relationship between interference intensity and achievable throughput using real-world measurements. This lack of empirical evidence limits the ability of researchers and practitioners to accurately evaluate the effectiveness of Wi-Fi 6 technologies in operational deployments.
The novelty of this work lies in its comprehensive empirical investigation of 802.11ax throughput performance under controlled yet realistic interference and noise conditions, providing experimental insights that cannot be fully captured through simulation alone. Unlike prior studies that primarily evaluate idealized network scenarios, this research directly measures the impact of adverse wireless environments on link throughput, thereby revealing the practical performance boundaries of Wi-Fi 6 deployments. The study further contributes by examining throughput degradation patterns across varying interference levels, offering a deeper understanding of the resilience of 802.11ax in environments representative of modern dense wireless networks. Specifically, we make the following four key contributions.
- We provide a rigorous experimental characterization of throughput degradation in 802.11ax networks under noisy and interfering conditions, generating practical performance benchmarks for real-world WLAN deployments.
- It bridges the gap between theoretical expectations and observed operational performance by validating and extending findings previously reported in simulation-based research.
- We offer valuable insights into the robustness and reliability of Wi-Fi 6 networks in dense deployment scenarios such as smart campuses, enterprise environments, and Internet-enabled infrastructures, which are central to the Future Internet paradigm.
- The findings provide actionable guidance for network planning, interference management, and wireless performance optimization while establishing a benchmark dataset and experimental framework for future studies on spatial reuse, OFDMA efficiency, AI-driven interference mitigation, and next-generation standards such as IEEE 802.11be (Wi-Fi 7).
Overall, our principal contribution is not merely the measurement of 802.11ax throughput, but the generation of experimentally validated knowledge regarding the real-world impact of noise and interference on Wi-Fi 6 performance, thereby addressing a significant gap in the literature and advancing the practical understanding of next-generation wireless networking systems.
The remainder of this paper is organized as follows: Section 2 highlights the motivation for this work and reviews literature on 802.11ax performance. Section 3 describes the research design and methodology. Section 4 details the noisy and interfering environments considered in the study. The empirical results are presented in Section 5. Section 6 compares the measured propagation data against theoretical models to identify the closest match. The practical system implications are discussed in Section 7, and Section 8 provides recommendations and guidelines. Finally, Section 9 concludes the paper.
2. Motivation and Related Work
Overall, our principal contribution is not merely the measurement of 802.11ax throughput, but the generation of experimentally validated knowledge regarding the real-world impact of noise and interference on Wi-Fi 6 performance, thereby addressing a significant gap in the literature and advancing the practical understanding of next-generation wireless networking systems.
An overview of how interference and noise impact the performance of 802.11ax networks is given in this section. IEEE 802.11ax is an invention designed to address the growing need for greater network capacity and efficiency, particularly in densely populated areas. In 2.4- GHz and 5 GHz frequency ranges, one of the significant innovations brought about by 802.11ax is Orthogonal Frequency-Division Multiple Access (OFDMA) [12]. These features aim to enhance network performance through increased throughput, decreased latency, and improved congestion control [13,14]. However, a significant challenge for IEEE 802.11ax is its susceptibility to noise and interference, which can significantly impact its performance [15]. Noise and interference are two important issues that can seriously hinder wireless communication systems’ ability to perform. In this context, noise refers to unwanted random signals that might obstruct data transport, whereas interference is the overlapping of many signals that may disrupt communication. Numerous factors can cause interference in 802.11ax networks, including reflections from moving objects, like moving cars, adjacent channel interference, co-channel interference, other Wi-Fi networks using the same channel, and non-Wi-Fi devices using the same frequency bands, like microwave ovens and Bluetooth devices. These issues become more problematic in congested environments where multiple devices and access points are functioning simultaneously [16]. To mitigate the effects of interference, the 802.11ax standard incorporates several improvements. Additionally, OFDMA reduces the possibility of interference by dividing a single channel into smaller sub-channels, which permits several users to use it [17]. However, the configuration of the network and the environment in which it operates can affect how effective these tactics are. Higher frequencies, such 5GHz, can have a major impact on 802.11ax networks due to interference [18]. In this study, the consequences of interference and mitigation strategies are examined. The following subsections discuss the motivation for this study and the related work.
2.1. Motivation for Studying Wi-Fi 6 (IEEE 802.11ax)
Although IEEE 802.11be (Wi-Fi 7) has been standardised and early products are available [4], Wi-Fi 6 (IEEE 802.11ax) remains widely deployed, with a large installed base of access points and client devices, including laptops, that is expected to remain in service for years. Wi-Fi 7 adoption is gradual: its headline features, such as 320 MHz channels, 4096-QAM and multi-link operation, require compatible hardware on both ends of the link, and the widest channels depend on spectrum in the 6 GHz band that may be unavailable or restricted in some regions. Wi-Fi 6 therefore continues to be the practical technology for many real-world deployments, particularly in cost-constrained and infrastructure-limited settings such as the portable, infrastructure-free network studied in this work. Finally, the measurements provide an empirical baseline against which future Wi-Fi 7 field studies can be compared. Quantifying the real-world performance of Wi-Fi 6 is a prerequisite for assessing how much improvement newer standards deliver in practice, and the methodology presented here (fixed geometry, identical hardware and repeated trials per band and location) can be reused directly for Wi-Fi 7 devices.
2.2. Related Work
Understanding how interference and noise affect Wi-Fi performance is not straightforward, largely because real-world environments differ so widely from one another. A living room, a busy cafeteria, a ferry terminal, and a construction site each pose unique electromagnetic challenges, and despite its significant advancements over previous Wi-Fi standards, IEEE 802.11ax (Wi-Fi 6) remains susceptible to these environmental effects. This section reviews the prior work most relevant to this theme and explains how our study builds on and differs from it. Table 1 provides a summary of related work on the effect of noise and interference on Wi-Fi system performance.
Much of the early groundwork predates 802.11ax. Gul and Sarkar [19] investigated 802.11n performance in noisy channels using simulation, covering both the 2.4 GHz and 5 GHz bands in indoor settings and comparing propagation models against measured data. Soorty and Sarkar [20] compared Wi-Fi radio propagation measurements with models in a crowded office block across both bands. These were useful contributions, but neither addressed 802.11ax, so their findings have limited applicability to modern Wi-Fi 6 deployments.
Within the 802.11ax literature itself, most studies rely on simulation. Wilhelmi et al. [21] examined the viability of spatial reuse under interference and varying network densities, and Yang et al. [22] maximized performance in dense multi-cell WLANs using capacity entropy. Both offer valuable insight into how 802.11ax handles congestion and interference, but neither was validated against field measurements, and neither examined indoor versus outdoor deployments or differences between frequency bands. Bellalta and Kosek-Szott [23] studied the benefits of AP-initiated multi-user transmissions, which is directly relevant to 802.11ax, but likewise did not address specific deployment environments.
A handful of studies have incorporated real measurements. Wang and Psounis [24] addressed user assignment to subcarriers with multiple resource units and compared indoor 802.11ax measurements at 5 GHz with simulation results. This is a step in the right direction, though its scope is limited to a single band and does not account for outdoor conditions. Nurchis and Bellalta [25] examined how Target Wake Time (TWT) and multi-user transmission affect throughput, but their experiments were conducted under controlled conditions that do not reflect the environmental variability encountered in practice. Bardou et al. [26] improved spatial reuse in 802.11ax using a multi-armed bandit approach, evaluated without venturing into real-world environments.
What emerges from this review is a clear gap: to the best of our knowledge, no prior study has combined real field measurements, dual-band coverage, and both indoor and outdoor environments within the 802.11ax context. Our work, shown in the last row of Table 1, addresses this gap directly. We collected empirical data from multiple locations with different interference and noise characteristics, at both 2.4 GHz and 5 GHz, and used it to evaluate how well established propagation models describe actual 802.11ax behavior. Although Wi-Fi 7 (IEEE 802.11be) is now emerging [4,5,6,7], Wi-Fi 6 remains widely deployed, and field-validated results provide a baseline against which newer standards can be assessed. To build this review, we examined more than 30 peer-reviewed articles published over the past ten years, drawing from IEEE Xplore, Scopus, Google Scholar, ScienceDirect, MDPI, and Wiley Online Library, as well as selected journals and conference proceedings on wireless communications.
3. Research Design and Methodology
Figure 1 shows the experimental set-up for 802.11ax Wi-Fi 6 performance study in noise and interference environments. Two laptops were placed 1.5 m apart with a clear line of sight (LOS) and no obstruction between them, with the laptops between 0.8 and 1 m above the ground depending on the space available at each site. Each laptop used a Wi-Fi 6 dual-band network adapter: where the internal card did not support 802.11ax, a USB 802.11ax adapter was attached, the internal card was disabled and the laptop was set to use the USB adapter. The transmitting laptop hosted a WLAN using the Windows hotspot application Hotspot Lite, which does not require an Internet connection, and the receiving laptop joined it. We refer to this as a peer-to-peer (ad-hoc style) link; it is a single-client network with no separate access point or router. It should be explicitly stated whether Hotspot Lite establishes a software access point (infrastructure BSS with a single client) or a true Independent Basic Service Set (IBSS). Because modern Windows versions no longer support the creation of IBSS networks, the former is more likely. If this is the case, the term “software-hosted peer-to-peer link” should be used throughout the manuscript, including in Table 3, instead of “ad-hoc.” For performance evaluation, a 1195 MB Windows 10 Pro ISO image was transferred from the transmitter (Tx) to the receiver (Rx) using NitroShare, and the total transfer duration was measured from initiation to successful completion of the file transfer.
3.1. Hardware, Software and Experimental Specifications
The hardware and software used in the field trials are listed in Table 2, and the physical (PHY) and medium access control (MAC) configuration of the Wi-Fi 6 links, together with the experimental parameters, is given in Table 3. Two laptops were used: an HP Pavilion (2022) as the transmitter and an HP ProBook 455R G6 (2020) as the receiver. Both laptops ran Windows 10 Pro. A D-Link AX1800 Wi-Fi 6 USB adapter was used on any laptop whose internal network card did not support 802.11ax. The transmitting laptop hosted the WLAN hotspot using Hotspot Lite, and NitroShare was used to send and receive the file. NetSpot was used to measure the signal strength and noise level at the receiving laptop.
3.2. Measurement Protocol and Data Handling
Baseline. The baseline was measured in a home kitchen/dining room in Murrays Bay, Auckland, with no other household members present and with mobile and smart-home devices switched off. The room has a high ceiling and a wide floor plan that favours propagation. The same hardware, software and geometry were used at every site. Except for the baseline, the noise and interference at each site were not altered; devices normally present, such as mobile phones, were left on so that the results reflect the conditions a user would typically experience. Differences between sites should therefore be read as the combined effect of each environment’s interference and propagation conditions rather than of a single isolated factor.
Trials. Ten file-transfer trials were planned in each band at each site. Before each trial, NetSpot was used at the receiver to record the RSS and the noise level, and to observe the surrounding networks (channel, band, protocol and RSS).
The throughput for each trial was calculated from the measured file-transfer time using Equation 1. To facilitate assessment of time-varying interference, the measurement methodology should explicitly specify the order in which the frequency bands and trials were conducted (e.g., alternating or blocked), whether the 2.4 GHz and 5 GHz measurements were performed consecutively, and the time of day associated with each test site. Measurement campaigns were conducted at the times listed in Table 4.
Exclusion of long transfers. On the client’s advice, transfers that took much longer than expected (more than 60 s) were treated as outliers caused by uncontrollable external factors and were excluded in the cafeteria (2.4 GHz) and the construction site (both bands), leaving in those three cases ( elsewhere). Three transfers in the busy-road 2.4 GHz data (106 s, 136 s and 148 s) are retained. Either justify keeping them (for example, they are characteristic of the busy road) or apply the 60 s rule consistently and re-run the analysis; reviewers will ask.
3.3. Performance Metrics and Statistical Analysis
Throughput is the rate at which data are successfully delivered over the link in a given time. It is calculated from the file size S (1195 MB, i.e. 9560 Mbit) and the transfer time t:
This is an application-layer throughput that includes protocol overhead and any retransmissions. The throughput degradation of a scenario relative to the baseline of the same band is
where denotes the mean throughput over the trials.
The signal-to-noise ratio is computed from the RSS and the noise level reported by NetSpot at the receiver:
In an earlier report of this work this quantity was called the signal-to-noise and interference ratio (SNIR). Because the noise level reported by NetSpot does not include the airtime consumed by other transmitters, Equation (3) is, strictly, an SNR, and we use that term in the remainder of the paper. Power conversions follow
For each band and site we report the sample size n, mean, standard deviation (SD), the half-width of the 95% confidence interval , the median, the range and the coefficient of variation (CV ). Each environment is compared with the baseline using Welch’s t-test (unequal variances) and the Mann–Whitney U test (no normality assumption), with Holm’s step-down correction over the six comparisons in each band, and the effect size is reported as Cohen’s d (pooled SD). Confidence intervals for the degradation in Equation (2) are obtained by bootstrap resampling of both the baseline and scenario trials (10 000 resamples, percentile intervals). The 2.4 and 5 GHz means at each site are compared with Welch’s t-test. The association between SNR (or RSS) and mean throughput across the seven sites is measured with Spearman’s rank correlation. With trials per cell, these tests have limited power, so non-significant results should not be read as evidence of no effect.
4. Noisy and Interfering Environments Considered
Table 4 describes the seven sites and the interference sources observed at each, and Figure 2, Figure 3, Figure 4, Figure 5, Figure 6 and Figure 7 show the locations.
The baseline site is the quietest environment and provides the reference throughput and RSS for each band. All other sites were measured with their normal interference sources active.
4.1. Characterisation of Interference at Each Site
Table 5 maps the five interference classes onto the sites, using the NetSpot scans and the site observations, together with the measured noise floor. The noise floor ranges from dBm in the library to dBm at the construction site, a spread of 9 dB, with the construction site (machinery) having the highest noise floor and the library the lowest. Co-channel and adjacent-channel interference are present wherever other Wi-Fi networks were visible (living room, library, cafeteria, busy road), while non-Wi-Fi sources dominate the cafeteria (microwave ovens), the ferry terminal (RFID readers, CCTV) and the construction site (machinery).
NetSpot recorded the channel, band, protocol and RSS of every visible network (Figure 5 of the experimental report shows an example for the construction zone). To provide quantitative evidence of co-channel and adjacent-channel interference, a table should be included showing, for each test site and frequency band, the total number of visible wireless networks, together with the number operating on the same channel and on overlapping channels as the experimental link. This information directly addresses the reviewer’s request for a quantified assessment of the interference environment.
4.2. Indoor Environments
The loss of penetration in the indoor floor can significantly degrade the performance of IEEE 802.11ax (Wi-Fi 6) devices, which influences data rates and overall network reliability [28]. The key factors influencing system performance are highlighted below.
- Higher Frequencies (5 GHz): The reflection and dispersion of signals by walls can result in multi-path propagation, which can create signal interference and impair signal quality [29]. Because walls and other obstacles tend to absorb higher frequencies more, these effects are more pronounced at 5 GHz than at 2.4 GHz. For quick communications, 802.11ax commonly uses the 5 GHz band. The impact of penetration losses from walls and floors increases with frequency [30]. 802.11ax incorporates state-of-the-art methods, such as OFDMA (Orthogonal Frequency Division Multiple Access), MU-MIMO, and Target Wake Time (TWT), to improve overall performance and mitigate the effects of these losses, although they cannot completely eliminate the drawbacks. Due to outside radio interference, it can be challenging to get a strong Wi-Fi throughput in a library setting. These interferences are mainly caused by wireless devices that use the same frequency as well as the materials surrounding the library, weakening the signal and reducing network connectivity [31].
-
Lower Frequencies (2.4 GHz): Although the 2.4 GHz band usually has lower penetration losses from walls and floors, it is more susceptible to interference from other devices like Bluetooth and microwave ovens. Wi-Fi performance at 2.4 GHz is often slower than at 5 GHz, but is more reliable. Since numerous appliances and electronic equipment use the 2.4 GHz frequency, the 2.4 GHz band used in 802.11 ax is more vulnerable to interference from other devices. The reason for this is because many devices in the home send signals that are jammed into the 2.4 GHz frequency range, such as:1. Microwave ovens: When microwaves are used, they generate electromagnetic interference in the 2.4 GHz range, which can disrupt Wi-Fi signals and reduce the efficiency of wireless networks.2. Bluetooth Devices: The 2.4 GHz frequency used by Bluetooth technology can also cause interference, particularly in environments with numerous Bluetooth devices, including wireless headphones, smart home appliances, and accessories.3. Other Wireless Devices: The 2.4 GHz frequency band is used by wireless cameras and many other wireless technologies, which results in congestion and interference.4. Limited Spectrum: The 2.4 GHz range has more channel overlap and congestion because it is just 100 MHz wide compared to the broader 5 GHz spectrum. The closely spaced and overlapping channels in the 2.4 GHz band make it difficult to prevent interference. Because lower frequencies can more easily travel through obstacles like walls, the 2.4 GHz band has a better range but is also more vulnerable to interference from other devices.
4.3. Outdoor Environments
Timing inconsistencies and delay widths are usually larger in outdoor broadcasts. Therefore, outdoor spatial channel models in 2.4- and 5 GHz are required to evaluate IEEE 802.11ax performance at the link and system levels. Despite the emphasis on pedestrian mobility in IEEE 802.11ax outdoor operation, the Doppler effect can be amplified by reflections from swiftly moving objects, such as automobiles. Advanced 802.11ax techniques, including OFDMA (orthogonal frequency division multiple access) and MU-MIMO (multi-user multiple-input, multiple-output), are crucial advancements designed to enhance network efficiency, particularly in environments with numerous connected devices, such as stadiums, offices, or smart homes. However, Doppler shifts may make it more difficult for the system to properly synchronize the transmission’s timing, which may lead to decreased throughput, higher latency, or data loss. The Doppler effect occurs when the frequency of a radio signal shifts between the transmitter and receiver due to the motion of objects, such as a moving car, a person, or even a reflective surface [32]. The following challenges may arise due to the rapid changes in the received frequency caused by fast-moving objects, such as cars.
- Increased Doppler Shift: Automobiles moving may quickly produce a noticeably more significant Doppler shift than pedestrians. In systems that rely on precise time or frequency synchronization, like 802.11ax OFDM (Orthogonal Frequency Division Multiplexing), this could distort the signal and cause issues with delivered data synchronization and decoding by Doppler effect frequency shift [33,34].
- Interference and Signal Quality: Moving objects can rapidly change a signal’s strength, often leading to multi-path fading or interference. Because of the vehicle’s speed and reflections from nearby structures or other objects, the signal may arrive at the receiver at different times, leading to higher errors or even connection dropouts.
5. Results and Discussion
The residential living room, university library, cafeteria, ferry terminal, construction site, and busy road were among the carefully selected indoor and outdoor scenario settings from which data were collected using an ad hoc network operating at 2.4- and 5 GHz. To assess propagation characteristics across different environments, the measured data were analyzed using the free-space, two-ray ground, overall shadowing, and shadowing path-loss models, with the objective of identifying the model that provides the best fit for each scenario.
5.1. Effect of Indoor Interfering Scenarios on Link Throughput
Figure 8 displays the average throughput for the indoor scenario, such as the living room, the library, and the cafeteria. The throughput in the living room is 606 Mbps at 2.4 GHz, reaching 835 Mbps at 5 GHz. In the living area, 2.4 GHz is more susceptible to interference from static or electromagnetic fields generated by everyday household appliances, such as radios, televisions, microwaves, and networking hardware. The library’s throughput is 580 Mbps at 2.4 GHz and 673 Mbps at 5 GHz. An example of a library-style setting with concentrated noise zones, such as networking infrastructure to support specific systems in designated locations, is the AUT library, which features more computer rooms and seating areas. Several networks were visible in the library setting, as well as other devices, including PCs, phones, tablets, and various Bluetooth versions. The library scenario’s 2.4 GHz band is more impacted than the 5 GHz band. The average throughput in the cafeteria is 553 Mbps at 2.4 GHz and 466 Mbps at 5 GHz. The scenario recorded interference from lifts, microwaves, ovens, radio systems, cell phones, and other café equipment. The use of lifts, microwaves, ovens, radio systems, cell phones, and other equipment is a significant source of noise and interference. In the cafeteria scenario, the 5 GHz band is more impacted than the 2.4 GHz band. With numerous home appliance devices and the increased Doppler shift caused by people moving around, the cafeteria’s average throughput is 553 Mbps at 2.4 GHz and 466 Mbps at 5 GHz. The graph data indicates that the cafeteria and library have a greater influence than the living room at home.
Figure 9 demonstrates the average throughput degradation in indoor scenarios for the 2.4- and 5 GHz bands. In the living room, the average throughput degradation rate is 11% for the 2.4 GHz band and 16% for the 5 GHz band. In the library, the degradation rate for 5 GHz is 36%, while the degradation rate for 2.4 GHz is 15%. The 5 GHz band is more affected in the library due to greater interference from the bookshelves compared to the living room. In the cafeteria, the throughput degradation at 2.4 GHz is 19%, while at 5 GHz, it rises to 53%. The 5 GHz band experiences more degradation in the cafeteria than in the living room and library, likely due to the presence of moving people and various obstacles that interfere with the signal. Although the 5 GHz band has more channels, which can help reduce congestion, it is also more susceptible to interference from nearby objects and equipment. This increases signal attenuation, or weakening, as the signal travels through walls and furniture. Specially, hard materials such as concrete, metal, and thick wood can significantly impair the 5 GHz signal.
5.2. Effect of Outdoor Interfering Scenarios on Link Throughput
Figure 10 shows the average throughput in the ferry terminal, construction site, and busy road area. The baseline average throughput is 679 Mbps at 2.4 GHz and 993 Mbps at 5 GHz. The throughput at the ferry terminal is 507 Mbps at 2.4 GHz and 453 Mbps at the 5 GHz band. Mobile devices, ferries, public address systems, CCTV security cameras, and other potential devices may hinder throughput speeds and introduce noise in an 802.11ax ad-hoc network. In the construction-site scenario, the average throughput was 541 Mbps at 2.4 GHz and 325 Mbps at 5 GHz. The results indicate that construction-related activities and equipment can adversely affect IEEE 802.11ax network performance, with the impact being more pronounced in the 5 GHz band. In the busy-road scenario, the average throughput decreased to 357 Mbps at 2.4 GHz and 304 Mbps at 5 GHz, suggesting that environmental conditions and surrounding electromagnetic activity may also contribute to throughput degradation. Therefore, there is sufficient evidence that the throughput of an 802.11ax network is significantly impacted by noise and interference caused by traffic. Furthermore, the data shows that heavy traffic introduces a significant variance in performance. Our research indicates that automobile traffic generates substantial noise and interference, which reduces the throughput of the WiFi 6 network at both 2.4- and 5 GHz bands.
Figure 11 shows the throughput degradation rate in an outdoor environment for 2.4- and 5 GHz compared to baseline throughput. The throughput degradation in the ferry terminal 25% and 54% for 2.4 GHz and 5 GHz, respectively.. The throughput degradation in the construction zone is 46% at 2.4 GHz and 67% at 5 GHz. In case of busy road, throughput degrades 47% and 69% for 2.4 GHz and 5 GHz, respectively. In the busy road area 5 GHz frequency are more impacted than the construction area and the ferry terminal due to moving obstacles. The 5 GHz band is more heavily affected in all scenarios compared to the 2.4 GHz band due to the smaller wavelength of the 5 GHz band. This is because 5 GHz shorter wavelengths, making them more susceptible to absorption or reflection by obstacles like moving cars. Due to its higher frequency, the signal is more susceptible to interference, especially from objects that can absorb or scatter radio waves.
5.3. Effect of 2.4- and 5GHz Band
In the living room, Bluetooth devices (game controllers, smart speakers, headphones) and other Wi-Fi networks impact the performance of the 802.11ax network at 2.4 GHz. In a shorter range, performance drops off quickly through walls/furniture at 5 GHz in the living room. Congested spectrum due to nearby APs in different parts of the library and interference from wireless peripherals like keyboards, mice, or older devices affect the performance of the 802.11ax network at 2.4 GHz. In the library longer range 2.4 GHz band increases the chance of co-channel interference from distant APs. In the library, the performance of 802.11ax at 5GHz is affected by shorter range, bookshelves, stacks, and interior walls. At 2.4 GHz in the cafeteria, microwave ovens cause intense interference bursts, leading to packet loss and retransmissions. Bluetooth devices use frequency hopping, causing random interference at 2.4 GHz in the cafeteria. Shorter range and poorer penetration through cafeteria walls and structures at 5 GHz affect the 802.11ax network performance.
At the ferry terminal, IEEE 802.11ax performance in the 2.4 GHz band is adversely affected by overlapping access point (AP) coverage in a large public environment, as well as by the presence of numerous Bluetooth-enabled devices, including wireless headsets, smartwatches, mobile phones, public-address systems, and CCTV equipment that operate within the same frequency band. In the 5 GHz band, network performance is constrained by the shorter propagation range of higher-frequency signals and their greater susceptibility to attenuation and blockage caused by metallic infrastructure and dense crowds of passengers. Inconsistent coverage also reduces the performance at 5 GHz if AP placement is poor or not adjusted for large open areas. The construction site at 2.4 GHz is susceptible to interference from industrial devices such as welders, motors, power tools, and generators. Also, reflections and multipath effects caused by metal and concrete surfaces can cause signal degradation. In the construction site, 5 GHz reduces signal strength due to its shorter range and poor penetration through thick materials like concrete and steel. An obstruction-heavy environment causes signal absorption and reflection, and frequent layout changes (walls, machinery) can quickly disrupt signal paths. In busy roads, the network performance is affected at 2.4 GHz due to electromagnetic interference (EMI) from engines and power systems, overlapping signals from nearby access points (e.g., shops, vehicles with hotspots), Bluetooth interference from pedestrians and drivers (headsets, phones, smartwatches). In busy roads, the network performance is affected by 5 GHz due to weak penetration through vehicles and structures, quick signal degradation with movement or obstacles, reflection, and multipath issues from metal car bodies and road signs.
5.4. Accuracy and Validation of Field Study Results
The accuracy of the testbed results was improved by addressing the following issues. Firstly, we conducted testing at the same time slots every week to stick to similar environmental conditions, such as the number of people in the area. Secondly, we ensured the environment had as little co-channel interference as much as possible from other networks or devices. To mitigate any interference, we chose a wireless channel that had the least amount of traffic. Finally, when taking test results, we gathered the results multiple times. We also verified the results against the datasheets for the wireless cards and access points.
6. Finding the Closest Match Between Propagation Measurements and Models
This study utilized the two-ray ground, free-space, shadowing path loss, and overall shadowing to analyze the impact of noise and interference on 802.11ax network and to determine the closest match between measurements and models.
Table 6 shows the four selected propagation models and their corresponding received signal power. These models are used to find the best-fit model for indoor and outdoor scenarios. The formulas in column 2 (Table 6) are used to calculate the RSS value for all four propagation models considered in the study.
6.1. Measured Versus Calculated RSS
Table 7 shows the power conversion from Watts to dBm for the free space model in the living room for all propagation models. Here, first the P(Watt) data has been converted to P(dBW) by using Equation (4). Then the P(dBw) data has been converted to P(dBm) using Equation (5). The RSS of measured as well as the four selected theoretical models (2.4- and 5 GHz) are presented in Table 8. At 2.4 GHz, the baseline RSS in different indoor environments are as follows: the living room has a signal intensity of -38 dBm, the library measures -48 dBm, and the cafeteria records -47 dBm. According to the free-space propagation model, the RSS at 2.4 GHz is -28.8 dBm for all three settings. The RSS for the two-ray ground models is 12.9 dBm at 2.4 GHz in cafeterias and libraries and 0.9 dBm in the home living area. The shadowing path loss and the overall shadowing model RSS have been reduced compared to the baseline RSS. At 2.4 GHz, the RSS at a ferry terminal and construction site is -47 dBm, with the baseline at -41 dBm. Additionally, the RSS on the busy road is -42 dBm. For all three of these settings, the RSS of the free space loss propagation model at 2.4 GHz is -28.8 dBm. The RSS for the two-ray ground model operating at 2.4 GHz is 12.9 dBm for these three outside settings. Unlike the free-space model RSS, shadowing path loss and overall shadowing model RSS are lower. The results were positive when data was collected using the two-ray ground model one and a half meters above the ground.
This model is effective because it accounts for both the direct and reflected paths in its data computation. The analysis suggests that the free space model can reduce noise in various environments and is suitable for indoor 802.11ax networks. In an indoor setting, the baseline received signal strengths in a living room, library, and cafeteria were measured at -44 dBm, -47 dBm, and -48 dBm, respectively, at 5 GHz. In the free-space propagation model, the received signal intensity at 5 GHz is -35.5 dBm in each of the three scenarios.
For the two-ray ground model, the predicted RSS is 12.9 dBm in cafeterias and libraries and 0.9 dBm in homes. For the outdoor sites at 5 GHz, the measured RSS is dBm at the ferry terminal, dBm on the busy road and dBm at the construction site (Table 8). The free-space model predicts dBm at all three sites, which is 8 to 12 dB above the measurements. The shadowing path-loss and overall shadowing models predict dBm and dBm, and the two-ray ground model predicts 12.9 dBm. All three models overestimate the measured RSS by a wider margin than free space. Free space is therefore the closest match at 5 GHz.
The analysis suggests that the free space model can effectively minimize interference in various environments and is well-suited for outdoor 802.11ax networks. Noise in this frequency range may come from microwaves, Bluetooth devices, cordless phones, and other equipment. The path loss exponent is usually determined empirically from field measurements, as shown in Table 6. The throughput and RSS measurements for 2.4GHz and 5GHz (both indoor and outdoor) are discussed next.
Figure 12 shows the RSS degradation (%) for indoor environments (living room, library, and cafeteria) under the free-space model. In the living room, the RSS degradation rate is 24% at 2.4 GHz and 20% at 5 GHz. The library’s RSS degradation rate is 40% at 2.4 GHz and 26% at 5 GHz. In the cafeteria, the RSS degradation is 39% at 2.4 GHz and 27% at 5 GHz. The degradation rate at the cafeteria and library is higher than in the living room at 2.4GHz. Figure 13 shows the 802.11ax link RSS degradation for outdoor scenarios for the free-space model data. In the ferry terminal, the RSS degradation rate is 30% at 2.4 GHz and 19% at 5 GHz. In the busy road, the RSS degradation rate is 31% at 2.4 GHz and 30% at 5 GHz. In the construction zone, the RSS degradation rate is 39% at 2.4 GHz and 26% at 5 GHz. The throughput degradation rate for the Free space model is more impacted in the 2.4 GHz band.
6.2. Received Signal Strength
Table 9 shows each scenario’s RSS, noise level, and signal to noise and interference ratio (SNIR). The baseline RSS is -46 dBm at 2.4 GHz and 5 GHz, while the noise level is -90 dBm. The baseline SNIR is 44 dBm for both bands. The SNIR in the living room is 52 dBm at 2.4 GHz and 46 dBm at 5 GHz. The SNIR of the library is 48 dBm at 2.4 GHz and 49 dBm at 5 GHz. The cafeteria’s SNIR is 43 dBm at 2.4 GHz and 42 dBm at 5 GHz. The SNIR is 47 dBm at 2.4 GHz and 43 dBm at 5 GHz in the busy road. The SNIR in the ferry terminal is 48 dBm at 2.4 GHz and 46 dBm at 5 GHz. The SNIR on the construction site are 40 dBm and at 2.4 GHz and 40 dBm at 5 GHz.
6.3. Results Accuracy and Validation
To ensure that the measured throughputs are accurate and repeatable, the same hardware, software and node geometry (1.5 m separation, 0.8–1 m height, clear line of sight) were used in every trial. Ten file-transfer trials were performed in each band at each location, and the mean and standard deviation of the throughput are reported. Before each trial, the negotiated radio type, channel, link rate and signal strength were checked using [tool, e.g., NetSpot] to confirm that the link was operating in the intended 802.11ax mode. Data were collected in six real-world environments, each characterized by different sources of noise and interference (Table . Except for the baseline scenario, the noise and interference conditions at each location were not altered. Devices normally present, such as mobile phones, were left in normal operation so that the results reflect the conditions a user would typically experience. Consequently, differences in throughput between locations should be interpreted as the combined effect of each environment’s interference and propagation conditions, rather than of a single isolated factor.
7. Discussion and Practical Implications
This section summarizes the causes of throughput degradation, the non-linear behavior and threshold effects, the steeper degradation at 5 GHz, and the practical implications for 802.11ax networks.
7.1. Why Throughput Degrades
At every site the RSS was between and dBm and the SNR was 40–52 dB (Table 9). A link with this margin should sustain high MCS values, so the 16–69% throughput reductions are not a link-budget effect. The data are more consistent with three mechanisms that act in combination. We state them as interpretations: the campaign did not log MCS, retries or airtime, so their relative contributions cannot be separated.
- 1.
- Contention and deferral. With CSMA/CA, energy or preambles detected from co-channel Wi-Fi networks and from non-Wi-Fi sources (Bluetooth, microwave ovens, RFID readers) cause the transmitter to defer and to back off, so less airtime is available even when the received signal is strong. This is consistent with the busy sites having both high SNR and low throughput.
- 2.
- Interference-induced errors and rate adaptation. Bursts of interference corrupt frames, trigger retransmissions and push rate adaptation towards lower MCS values; this lowers the PHY rate and again consumes airtime.
- 3.
- Transport-layer amplification. A file transfer over TCP reacts to loss and delay by reducing its congestion window and, after repeated losses, by timeouts. Small MAC-layer disturbances can therefore be amplified into large throughput drops, which is the likely origin of the very slow busy-road transfers.
7.2. Non-Linear Behaviour and Threshold Effects
Throughput does not fall smoothly with the severity of the environment. The busy-road 2.4 GHz data are bimodal, with three transfers at 65–90 Mbps next to seven at 376–612 Mbps, and the relation between SNR and throughput is flat. This is typical of threshold effects: while interference bursts are short enough for retransmissions and rate adaptation to absorb them, throughput is only moderately reduced, but when bursts become long or frequent, TCP time-outs and back-off dominate and throughput collapses. Note also that the average of throughput is dominated by the slowest transfers: since transfer time is inversely proportional to throughput, a few long transfers (up to 148 s against a typical 16–25 s) have a large effect on the mean, which is why medians and distributions are reported alongside the means.
7.3. Why 5 GHz Degrades More Steeply
The 5 GHz baseline is higher than the 2.4 GHz baseline, but the 5 GHz relative degradation is larger at every site (Table 10). Two explanations are plausible. First, wider channels are more likely to overlap active transmissions: if the 5 GHz link used an 80 MHz channel (the 600/1200 Mbps nominal rates are consistent with 40 MHz and 80 MHz channels, respectively), interference on any part of the channel can force fallback to a narrower bandwidth or deferral, while the 2.4 GHz link is limited to at most 40 MHz. Second, 5 GHz signals are attenuated and blocked more by people and objects.
7.4. Practical System Implications
Table 10 represents the SNIR and the throughput degradation of all scenarios. The 2.4 GHz band has a more extended range and better penetration, but also experiences more interference from Bluetooth, microwaves, and other household appliance devices that operate on the same frequency. The 5 GHz band has more bandwidth and less interference from household devices but has a shorter range and more attenuation through walls and moving obstacles. In the living room, the performance of the 2.4- and 5 GHz networks is nearly identical. In the library, the 2.4 GHz band is more suitable for use than the 5 GHz band due multi-path fading from bookshelves. The 5 GHz band experiences greater degradation in the cafeteria than the 2.4 GHz band. In the ferry terminal, construction zone, and busy road, the 2.4 GHz band usually provides better average throughput than the 5 GHz band due to moving obstacles that lead to higher degradation.
The wavelength of the 5 GHz band is significantly smaller than that of the 2.4 GHz band. Multiple wireless access points (APs) can be deployed to effectively utilize the 5 GHz band in outdoor environments. The free-space propagation model closely matches the measurement results obtained in both indoor and outdoor scenarios.
8. Recommendation and Guidelines
The research findings from this study translate directly into actionable guidelines for network planners for the deployment of Gigabit Wi-Fi networks.
8.1. Environment-Specific Band Selection
Use 2.4 GHz in large-area coverage scenarios with limited obstructions (e.g., libraries or open rooms), but avoid it in environments prone to RF interference (e.g., cafeterias, construction sites, busy roads). Prioritize 5 GHz in high-density indoor spaces (e.g., offices, living rooms) to reduce co-channel interference and improve throughput, but mitigate its shorter range and limited wall penetration through strategic access point (AP) placement.
8.2. Access Point Placement and Density Optimization
Increase AP density in environments with heavy obstruction (e.g., living rooms, construction zones) or high mobility (e.g., ferry terminals) to counteract signal attenuation and Doppler effects. Use lower transmit power levels and smaller coverage cells in dense areas (cafeterias, libraries) to reduce co-channel interference and ensure balanced client distribution across APs.
8.3. Mitigation of Interference and Noise
Deploy band steering to shift compatible devices to 5 GHz and reduce congestion in the 2.4 GHz band. Use Dynamic Frequency Selection (DFS) and automatic channel allocation to minimize interference from non-Wi-Fi devices such as microwaves and Bluetooth. Shielding or physical separation of APs from major interference sources (e.g., kitchen appliances, power tools) is recommended in mixed-use or industrial environments.
8.4. Advanced Features and Planning Tools
Utilize Wi-Fi 6 features like OFDMA, MU-MIMO, and BSS Coloring to maximize spectral efficiency and reduce collisions in high-density deployments. Incorporate propagation modeling tools (e.g., Free-space, Two-ray ground) and site surveys during design to simulate real-world losses due to multi-path fading, especially for outdoor or obstructed deployments. Regularly monitor SNIR, throughput, and packet loss post-deployment using spectrum and channel analysis software to fine-tune network parameters.
9. Conclusions
This study investigated the impact of noisy and interfering wireless environments on IEEE 802.11ax (Wi-Fi 6) link throughput through an empirical evaluation conducted under realistic operating conditions. The results obtained have demonstrated that, despite the advanced efficiency mechanisms introduced by 802.11ax, network throughput remains significantly affected by increasing levels of noise and interference. The findings reveal a clear relationship between adverse radio-frequency conditions and throughput degradation, highlighting the practical performance limitations that may arise in dense and spectrum-congested wireless deployments. The study addresses an important gap in the literature by providing experimentally validated evidence of 802.11ax performance in real-world environments, complementing prior research that has largely relied on simulations and analytical models. The empirical results confirm that practical deployment conditions can substantially influence achievable throughput and may differ from theoretical expectations. Consequently, our research contributes valuable insights into the robustness, reliability, and operational behaviour of Wi-Fi 6 networks under challenging channel conditions. From a practical perspective, the findings have important implications for wireless network design, deployment, and management. Network administrators and engineers can use the results to better anticipate performance degradation, optimize access point placement, improve channel planning strategies, and develop more effective interference mitigation approaches in dense wireless environments such as smart campuses, enterprise networks, and Internet-enabled infrastructures. Overall, this work advances the practical understanding of next-generation WLAN performance by bridging the gap between theoretical capabilities and observed operational behaviour. Future research would extend the present study to multi-user and multi-access-point scenarios, investigate the influence of specific 802.11ax mechanisms such as OFDMA and MU-MIMO under interference, and explore intelligent spectrum management techniques for emerging wireless standards, including IEEE 802.11be (Wi-Fi 7). Such efforts will further support the development of resilient, high-performance wireless networks for the evolving Future Internet ecosystem.
Internet ecosystem.
Acknowledgments
We thank our research and development project mentor, Brian Cusack, and the students Daniel Willis, Euan Raill, Gurman Singh, Richard Thavongsy, and Yuwen Fang (Auckland University of Technology) for their assistance in conducting the field experiments.
Appendix A: Abbreviation used in this paper
| Acronym | Explanation |
| CCTV | Closed-circuit television |
| CSMA | Carrier sense multiple access |
| dBm | Decibel-milliwatts |
| dBW | Decibel watts |
| EMI | Electromagnetic interference |
| Gbps | Gigabits per second |
| GHz | Gigahertz |
| IEEE | Institute of Electrical and Electronics Engineers |
| LOS | Line of sight |
| MAC | Media access control |
| Mbps | Megabits per second |
| MIMO | Multiple input, multiple output |
| MU-MIMO | Multi-user multi-input, multiple output |
| OFDMA | Orthogonal frequency division multiple access |
| P2P | Peer-to-peer |
| RSS | Receive signal strength |
| SNIR | Signal to noise and interference ratio |
| SR | Spatial reuse |
| USB | Universal serial bus |
| Wi-Fi | Wireless fidelity |
| WLAN | Wireless local area network |
| 802.11ax | IEEE standard for WLANs succeeding 802.11ac, also known as Wi-Fi 6 |
References
- Sarkar, N.; Sowerby, K. The Combined Effect of Signal Strength and Traffic Type on WLAN Performance. Proc. Int. Symp. Comput. Commun. 2009, 1–6. [Google Scholar] [CrossRef]
- Memon, S.; Sarkar, N.; Al-Anbuky, A.; Hossain, M.A. Preemptive Admission Control Mechanism for Strict QoS Guarantee to Life-Saving Emergency Traffic in Wireless LANs. J. Netw. Comput. Appl. 2021, 199, 103318. [Google Scholar] [CrossRef]
- Muhammad, S.; Zhao, J.; Refai, H. An Empirical Analysis of IEEE 802.11ax. Proc. ICCSPA 2021. [Google Scholar] [CrossRef]
- Khorov, E.; Levitsky, I.; Akyildiz, I.F. Current Status and Directions of IEEE 802.11be, the Future Wi-Fi 7. IEEE Access 2020, 8, 88664–88688. [Google Scholar] [CrossRef]
- Deng, C.; Fang, X.; Han, X.; Wang, X.; Yan, L.; He, R.; Long, Y.; Guo, Y. IEEE 802.11be Wi-Fi 7: New Challenges and Opportunities. IEEE Commun. Surv. Tutor. 2020, 22, 2136–2166. [Google Scholar] [CrossRef]
- López-Pérez, D.; Garcia-Rodriguez, A.; Galati-Giordano, L.; Kasslin, M.; Doppler, K. IEEE 802.11be Extremely High Throughput: The Next Generation of Wi-Fi Technology Beyond 802.11ax. IEEE Commun. Mag. 2019, 57, 113–119. [Google Scholar] [CrossRef]
- Garcia-Rodriguez, A.; López-Pérez, D.; Galati-Giordano, L.; Geraci, G. IEEE 802.11be: Wi-Fi 7 Strikes Back. IEEE Commun. Mag. 2021, 59, 102–108. [Google Scholar] [CrossRef]
- Selinis, I.; Katsaros, K.; Vahid, S.; Tafazolli, R. An IEEE 802.11ax Interference-Aware MAC Queue. Proc. PIMRC 2020.
- Suer, M.-T.; Jose, P.; Hugues, N.T. Experimental Evaluation of IEEE 802.11ax: Low Latency and High Reliability with Wi-Fi 6? Proc. GLOBECOM 2022, 377–382. [Google Scholar] [CrossRef]
- Valkanis, A.; Iossifides-Iosifidis, A.; Chatzimisios, P. An Interference-Based Dynamic Channel Access Algorithm for Dense WLAN Deployments. Proc. PACET 2017.
- Yang, M.; Li, B.; Yan, Z. MAC Technology of IEEE 802.11ax: Progress and Tutorial. Mob. Netw. Appl. 2021, 26, 1122–1136. [Google Scholar] [CrossRef]
- Jiang, F.; Li, Q.; Chen, X. Channel Smoothing for 802.11ax Beamformed MIMO-OFDM. IEEE Commun. Lett. 2021. [Google Scholar] [CrossRef]
- Ta, V.T.; Ma, P.N.T.; Nam, L.; Ha, N.; Nguyen, T. Convergence Evaluation of OFDMA-IDMA Combination Based on IEEE 802.11ax. Proc. KST 2024, 248–253. [Google Scholar] [CrossRef]
- Khorov, E.; Kiryanov, A.; Lyakhov, A.; Bianchi, G. A Tutorial on IEEE 802.11ax High Efficiency WLANs. In IEEE Commun. Surv. Tutor.; 2018. [Google Scholar]
- Sarkar, N. A Cross Layer Framework for WLANs: Joint Radio Propagation and MAC Protocol. Proc. ICCITECHN 2010. [Google Scholar] [CrossRef]
- Valkanis, A.; Iossifides-Iosifidis, A.; Chatzimisios, P.; Angelopoulos, C.M.; Katos, V. IEEE 802.11ax Spatial Reuse Improvement: An Interference-Based Channel Access Algorithm. IEEE Veh. Technol. Mag. 2019. [Google Scholar] [CrossRef]
- Ta, V.T.; Nam, L.; Ha, N.; Nguyen, T.T. Massive Up-Link Multi-User with OFDMA-IDMA Combination Based on IEEE 802.11ax. Proc. VTC Spring, 2024. [Google Scholar]
- Šepić, N.; Kočan, E.; Pejanović-Djurišić, M. Evaluating Spatial Reuse in 802.11ax Networks with Interference Threshold Adjustment. Proc. IT Conf. 2020. [Google Scholar] [CrossRef]
- Gul, S.; Sarkar, N. The Effect of Propagation Models on IEEE 802.11n over 2.4 GHz and 5 GHz in Noisy Channels: A Simulation Study. Book Chapter 2019, 113–121. [Google Scholar] [CrossRef]
- Soorty, B.; Sarkar, N. Finding a Closest Match between Wi-Fi Propagation Measurements and Models. Proc. APWCCSE 2015. [Google Scholar] [CrossRef]
- Wilhelmi, F.; Barrachina-Muñoz, S.; Cano, C.; Selinis, I.; Bellalta, B. Spatial Reuse in IEEE 802.11ax WLANs. arXiv 2019. [Google Scholar]
- Yang, A.; Li, B.; Yang, M.; Yan, Z.; Cai, X. Utility Maximization of Capacity Entropy for Dense IEEE 802.11ax WLANs Based on Interference Characteristics. Mob. Netw. Appl. 2022, 27, 1–17. [Google Scholar] [CrossRef]
- Bellalta, B.; Kosek-Szott, K. AP-Initiated Multi-User Transmissions in IEEE 802.11ax WLANs. Ad. Hoc Netw. 2019, 85, 145–159. [Google Scholar] [CrossRef]
- Wang, K.; Psounis, K. Scheduling and Resource Allocation in 802.11ax. Proc. IEEE INFOCOM, 2018; pp. 279–287. [Google Scholar]
- Nurchis, M.; Bellalta, B. Target Wake Time: Scheduled Access in IEEE 802.11ax WLANs. IEEE Wirel. Commun. 2019, 26, 142–150. [Google Scholar] [CrossRef]
- Bardou, A.; Begin, T.; Busson, A. Improving the Spatial Reuse in IEEE 802.11ax WLANs: A Multi-Armed Bandit Approach. Proc. ACM 2021. [Google Scholar]
- Sarkar, N. Improving the Performance of Wireless LANs: A Practical Guide; CRC Press, 2014. [Google Scholar]
- Natkaniec, M.; Kras, M. An Optimization of Network Performance in IEEE 802.11ax Dense Networks. Int. J. Electron. Telecommun. 2022, 169–176. [Google Scholar] [CrossRef]
- Lee, D.; Neve, M.; Sowerby, K. The Impact of Structural Shielding on the Performance of Wireless Systems in a Single-Floor Office Building. IEEE Trans. Wirel. Commun. 2007, 6, 1787–1695. [Google Scholar] [CrossRef]
- Havinga, T.; Jiao, X.; Liu, W.; Moerman, I. Experimental Study Towards Efficient Interference Avoidance Using Wi-Fi 6 OFDMA on SDR. Proc. INFOCOM Workshops, 2024. [Google Scholar]
- Sarkar, N.I.; Mussa, O.; Gul, S. Impact of People’s Movement on Wi-Fi Link Throughput in Indoor Propagation Environments: An Empirical Study. Electronics 2021, 10, 856. [Google Scholar] [CrossRef]
- Sarkar, N.; Lol, W. A Study of MANET Routing Protocols: Joint Node Density, Packet Length and Mobility. Proc. Int. Symp. Comput. Commun. 2010, 515–520. [Google Scholar] [CrossRef]
- IEEE. IEEE 802.11-14/0882r4 Wireless LANs IEEE 802.11ax Channel Model Document. IEEE Mentor, 2011. [Google Scholar]
- Storrer, L.; Yildirim, H.; Crauwels, M.; Copa, E.; Pollin, S.; Louveaux, J.; Doncker, P.; Horlin, F. Indoor Tracking of Multiple Individuals with an 802.11ax Wi-Fi-Based Multi-Antenna Passive Radar. IEEE Sens. J. 2021. [Google Scholar] [CrossRef]
Figure 1.
Experimental set-up: a 1195 MB file is transferred from the transmitting laptop (Laptop 1, hosting the Wi-Fi 6 hotspot) to the receiving laptop (Laptop 2) over a 1.5 m line-of-sight link, with both laptops 0.8–1 m above the ground. NetSpot at the receiver records RSS and noise level.
Figure 1.
Experimental set-up: a 1195 MB file is transferred from the transmitting laptop (Laptop 1, hosting the Wi-Fi 6 hotspot) to the receiving laptop (Laptop 2) over a 1.5 m line-of-sight link, with both laptops 0.8–1 m above the ground. NetSpot at the receiver records RSS and noise level.
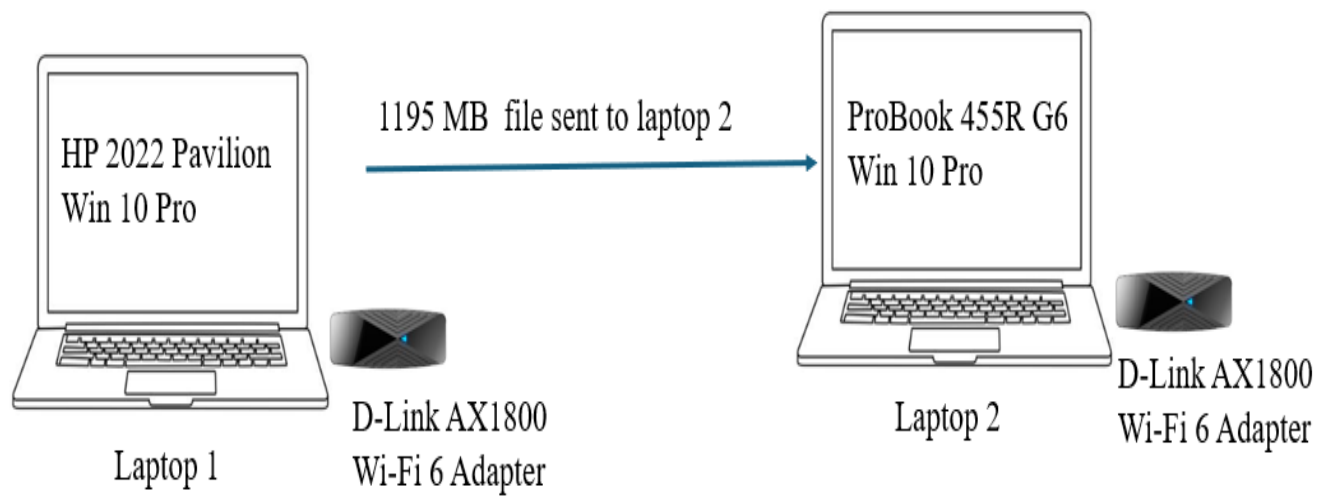
Figure 2.
Living room environment in Auckland.
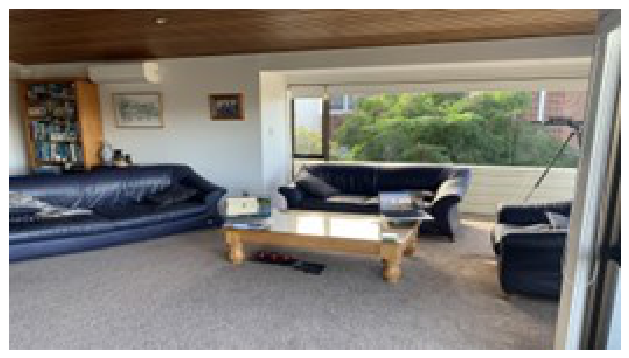
Figure 3.
University library environment.
Figure 4.
Cafeteria (food court) in Auckland city.
Figure 5.
Ferry terminal in Auckland city.
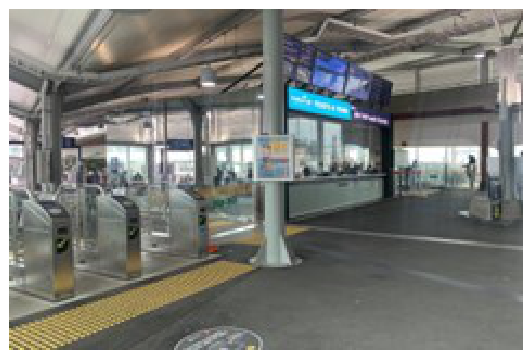
Figure 6.
Construction site in Auckland city.
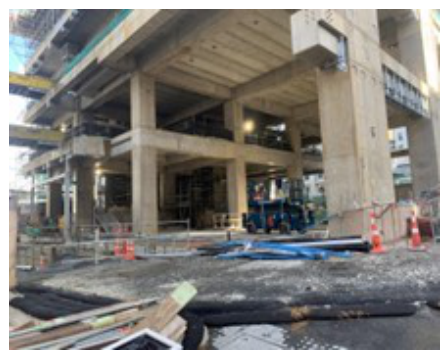
Figure 7.
Busy road scenario in Auckland city.
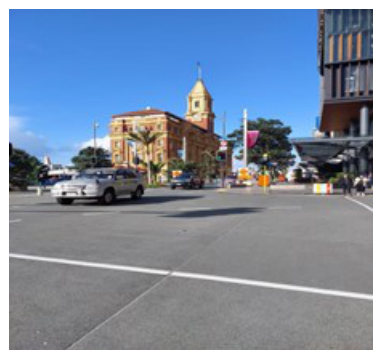
Figure 8.
Comparison of 802.11ax link throughput for indoor scenarios (Living room, Library, and Cafeteria)
Figure 8.
Comparison of 802.11ax link throughput for indoor scenarios (Living room, Library, and Cafeteria)
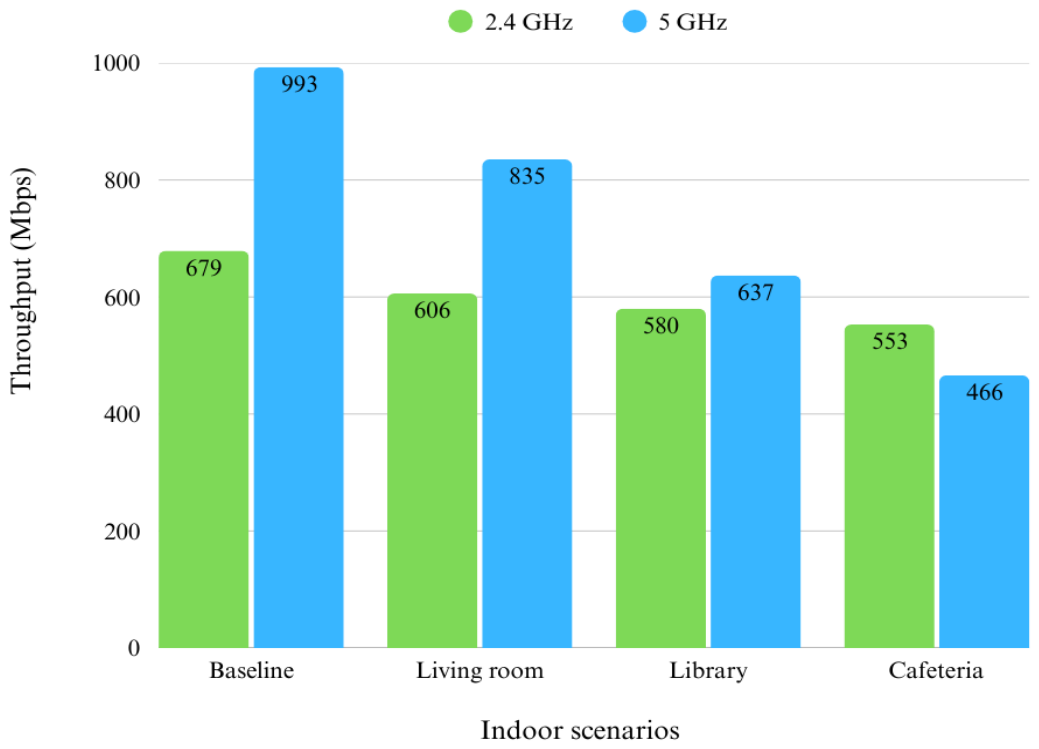
Figure 9.
802.11ax Throughput degradation for indoor scenarios (Living room, Library, and Cafeteria)
Figure 9.
802.11ax Throughput degradation for indoor scenarios (Living room, Library, and Cafeteria)
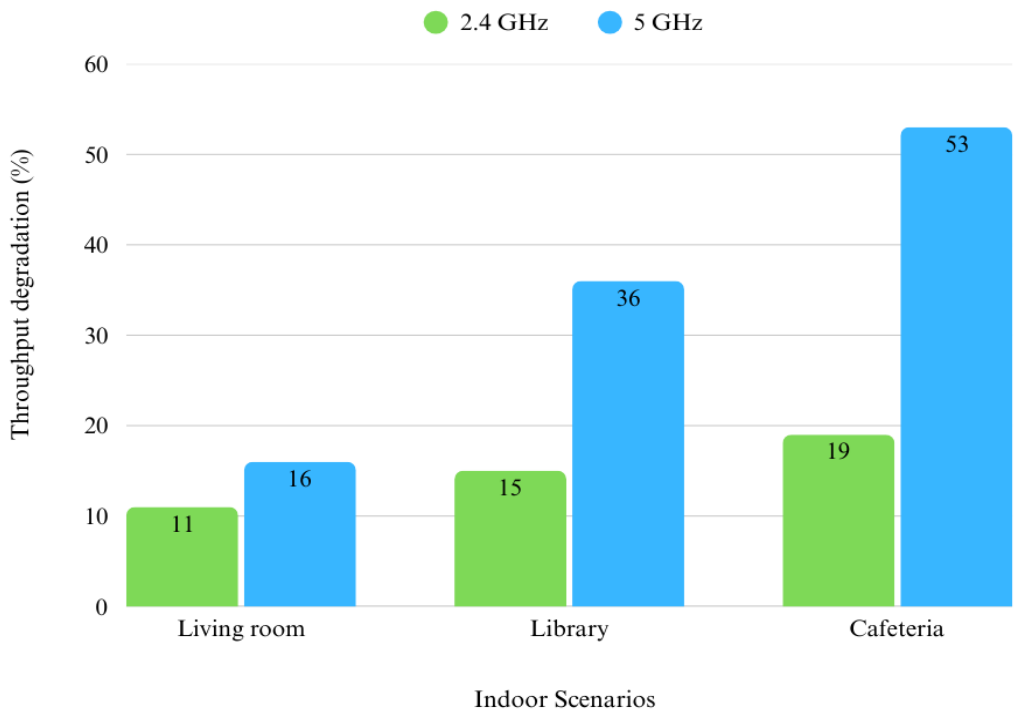
Figure 10.
Comparison of 802.11ax link throughput for outdoor scenarios (Ferry terminal, Construction site, and Busy road)
Figure 10.
Comparison of 802.11ax link throughput for outdoor scenarios (Ferry terminal, Construction site, and Busy road)
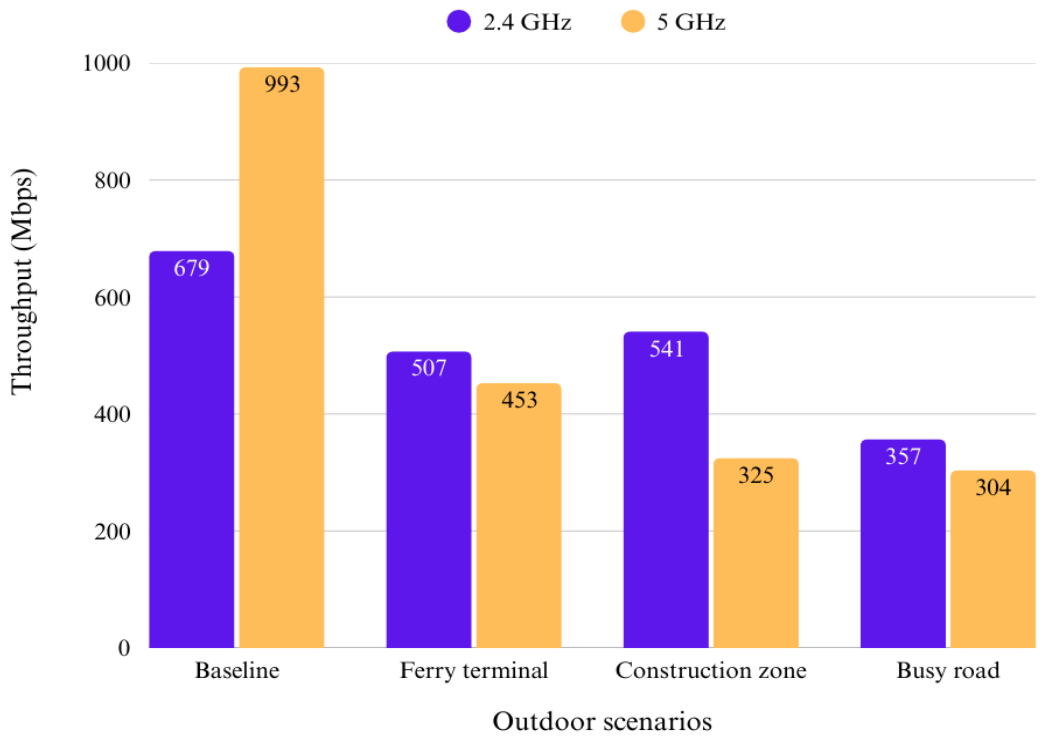
Figure 11.
Throughput degradation for outdoor scenarios (Ferry terminal, Construction site, and Busy road)
Figure 11.
Throughput degradation for outdoor scenarios (Ferry terminal, Construction site, and Busy road)
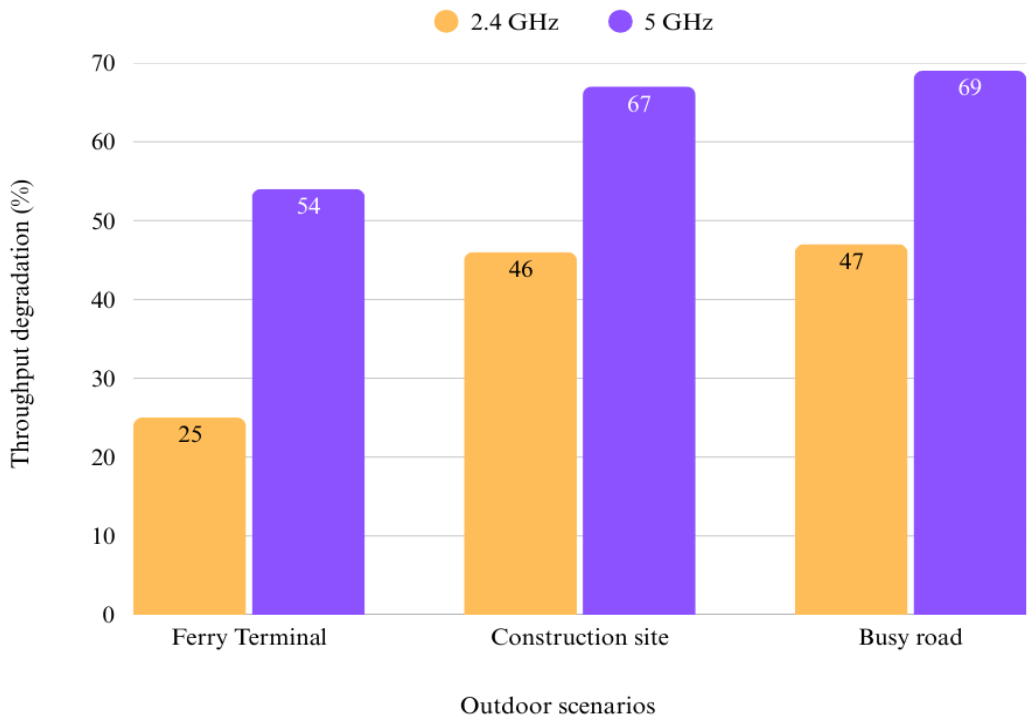
Figure 12.
RSS degradation (%) for indoor scenarios (Free space model)
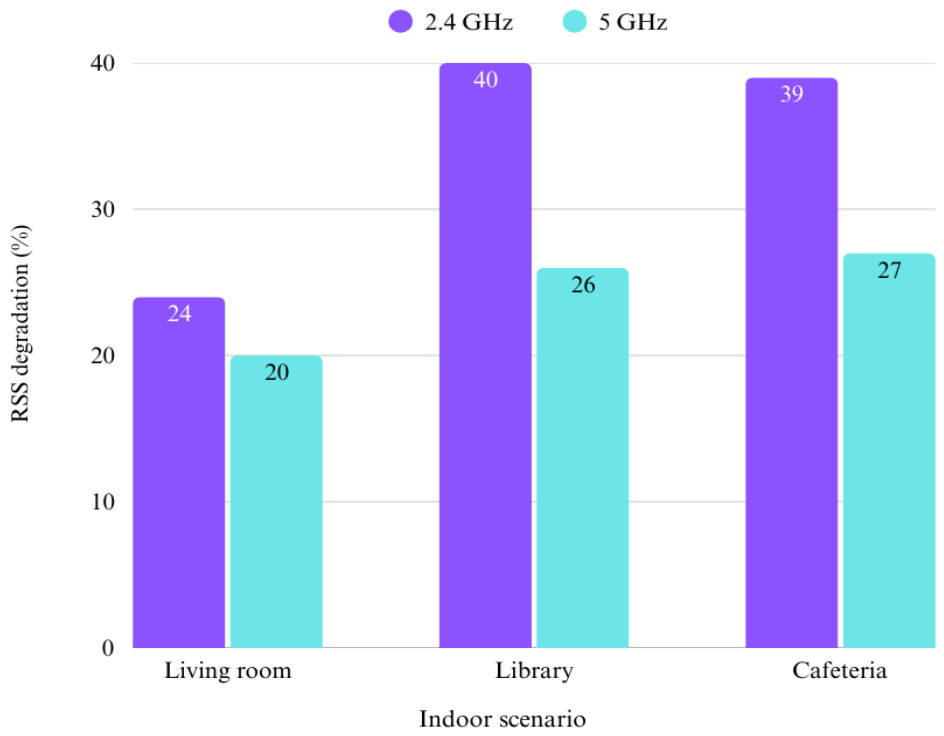
Figure 13.
RSS degradation (%) for outdoor scenarios (Free space model)
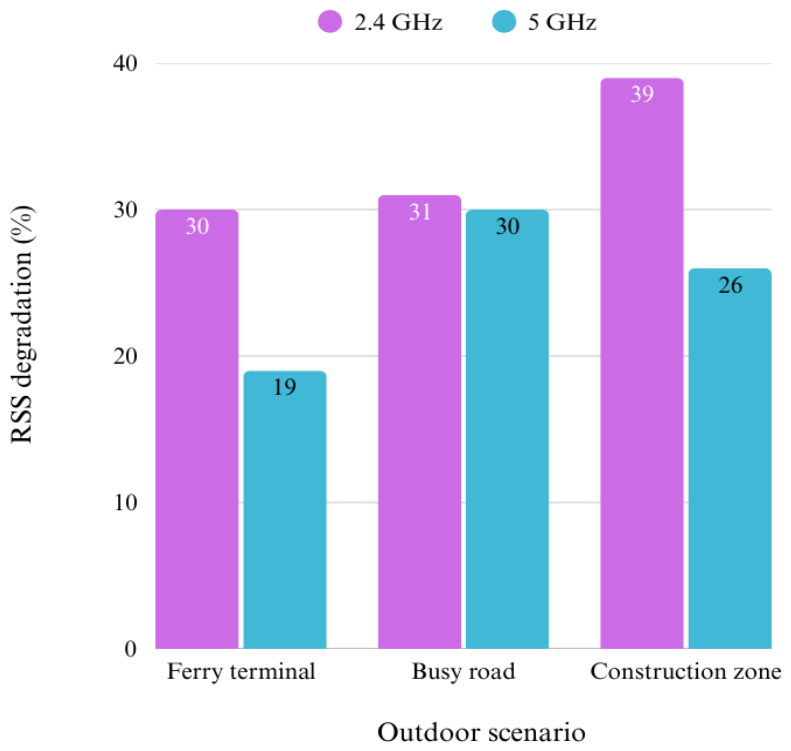

Table 1.
Summary of related work
| Problem addressed | 802.11ax | Field experiment | Indoor | Outdoor | 2.4GHz | 5GHz | Model vs Measurement | Reference |
|---|---|---|---|---|---|---|---|---|
| Impact of 2.4 and 5 GHz on system performance (802.11n) in noisy channels | × | × | √ | × | √ | √ | √ | [19] |
| Radio propagation measurements versus models in a crowded office block | × | √ | √ | √ | √ | √ | √ | [20] |
| Spatial reuse viability under interference and varying densities (simulation) | √ | × | × | × | × | × | × | [21] |
| Performance maximization in dense multi-cell WLANs using capacity entropy | √ | × | × | × | × | × | × | [22] |
| MU-MIMO transmission benefits in 802.11ax | √ | × | × | × | √ | √ | √ | [23] |
| User assignment to subcarriers with multiple resource units | √ | √ | √ | × | × | √ | √ | [24] |
| Target Wake Time (TWT) and multi-user transmission for throughput | √ | √ | × | × | × | × | × | [25] |
| QoS investigation in 802.11ax | √ | × | × | × | √ | √ | × | [26] |
| Effect of noisy and interfering environments (indoor and outdoor) | √ | √ | √ | √ | √ | √ | √ | This work |
Table 2.
Hardware and software specifications
| Equipment | Specifications |
|---|---|
| Laptop 1 (Transmitter) | Vendor: HP |
| Model: Pavilion (2022) | |
| Operating system: Windows 10 Pro | |
| Wi-Fi adapter used: internal 802.11ax / D-Link AX1800 USB | |
| Chipset, driver and firmware versions: from Device Manager | |
| Antennas: internal laptop antennas / USB adapter antennas; number and orientation | |
| Role: Hosts the network (Hotspot Lite) and sends the file | |
| Laptop 2 (Receiver) | Vendor: HP |
| Model: ProBook 455R G6 (2020) | |
| Operating system: Windows 10 Pro | |
| Wi-Fi adapter used: internal 802.11ax / D-Link AX1800 USB | |
| Chipset, driver and firmware versions: from Device Manager | |
| Antennas: as above | |
| Role: Joins the network and receives the file | |
| IEEE 802.11ax (Wi-Fi 6) USB adapter | Vendor: D-Link |
| Model: AX1800 (USB 3.0) | |
| Wireless standard: IEEE 802.11ax | |
| Interface: USB | |
| Nominal speed (datasheet): 600 Mbps (2.4 GHz), 1200 Mbps (5 GHz) | |
| Hotspot software | Hotspot Lite (creates the network without Internet access) |
| File transfer software | NitroShare, version (https://nitroshare.net) |
| Signal strength and noise measurement software | NetSpot, version (https://www.netspotapp.com); also records the channel, band, protocol and RSS of surrounding networks |
Table 3.
PHY/MAC configuration and experimental parameters
| Category | Parameter and value |
|---|---|
| Physical (PHY) layer | Standard: IEEE 802.11ax (Wi-Fi 6) |
| Bands: 2.4 and 5 GHz | |
| Channel and channel width (20/40/80 MHz): per band; record from NetSpot or driver | |
| Spatial streams: N; AX1800-class adapters are nominally 2×2 | |
| Guard interval: 0.8 / 1.6 / 3.2 s | |
| MCS index / negotiated link rate: record per trial; not logged in the current data | |
| Transmit power: default / measured; 0.1 W (20 dBm) assumed in the propagation models | |
| MAC / network layer | Network mode: Software-hosted peer-to-peer link (single client) |
| Channel access: CSMA/CA (EDCA), driver defaults | |
| OFDMA, MU-MIMO, BSS Colouring, TWT: not configured or exercised (single client, single BSS) | |
| Security: WPA2-PSK / open | |
| MTU: 1500 bytes | |
| Rate adaptation, aggregation, RTS/CTS: driver defaults | |
| Experimental parameters | Transfer file: 1195 MB Windows 10 Pro build ISO |
| Transport protocol: TCP (NitroShare) | |
| Node separation: 1.5 m, clear line of sight | |
| Height above ground: 0.8–1 m (laptops); antenna height used in the propagation models: 1.5 m (0.5 m in the living room) | |
| Trials: 10 per band per location planned; 9 retained in three cases | |
| Metric: Mean throughput (Mbps) = , with S in megabytes and t in seconds |
Table 4.
Test sites, conditions during the measurements and observed interference sources
| Scenario | Site and conditions | Observed noise and interference sources |
|---|---|---|
| Baseline | Home kitchen/dining room, Murrays Bay, Auckland; high ceiling, open plan; no other occupants; mobile and smart-home devices off. | Minimal. Few neighbouring networks. |
| Living room (Figure 2) | Living room of the same house; household members present, as in normal use. | Home and neighbouring Wi-Fi networks, mobile and smart-home devices, TV, Bluetooth devices, and appliances such as microwave ovens and food processors. |
| Library (Figure 3) | Level 3 of the library building; measured during a period of high usage; waiting area, desktop computers and printers. | Many Wi-Fi networks including 802.11n access points, Bluetooth devices, mobile phones, laptops and desktop computers. |
| Cafeteria (Figure 4) | Food court, Commercial Bay, Auckland CBD; measured at lunchtime with many visitors. | Vendor Wi-Fi networks, microwave ovens, lifts, radio systems, mobile phones, Bluetooth headsets and people movement. |
| Ferry terminal (Figure 5) | Downtown Ferry Terminal, Auckland; Sunday, 12:30–13:30. | Mobile phones, RFID/HOP card readers, ferries, public address systems and CCTV cameras. |
| Construction site (Figure 6) | Active construction site in Auckland city; machinery in operation. | Heavy equipment, pedestrians with phones and Bluetooth headphones, passing cars and buses, and nearby business networks. |
| Busy road (Figure 7) | Lower Albert and Quay Streets intersection, next to the Commercial Bay bus station. | Cars, buses, trucks and bicycles; traffic signals; pedestrians’ devices; networks of surrounding businesses. |
Table 5.
Interference classes observed at each site and measured noise floor
| Scenario | Co-/adjacent-channel Wi-Fi | Non-Wi-Fi sources | Background EMI | Noise floor (dBm) |
|---|---|---|---|---|
| Baseline | Minimal | None (devices off) | None expected | |
| Living room | Home and neighbouring networks | Bluetooth, appliances | Household electronics | |
| Library | Many networks, 802.11n APs | Bluetooth, printers, phones | Computers | |
| Cafeteria | Vendor networks | Microwave ovens, Bluetooth, radio systems | Lifts, kitchen equipment | |
| Ferry terminal | count from NetSpot | RFID/HOP readers, CCTV, public address, phones | Ferries | |
| Construction site | count from NetSpot | Bluetooth, phones | Machinery | |
| Busy road | Business networks along the road | Bluetooth devices, traffic signals | Vehicle engines and power systems |
Table 6.
Four selected propagation models and their corresponding received signal power
| Model | Received signal power | Description |
|---|---|---|
| Free space [20] |
= received signal power (w)
d = distance between transmitting node and receiving node (m) = transmitted signal power (w) = transmitter antenna gain = receiver antenna gain L = System ‘Loss’ factor = wavelength (m) |
|
| Two-Ray ground reflection |
= received signal power (w)
d = distance between transmitting node and receiving node (m) = transmitted signal power (w) = transmitter antenna gain = receiver antenna gain L = System ‘Loss’ factor = Height of the transmitting antenna (m) = Height of the receiving antenna (m) |
|
| Shadowing path loss |
= received signal power at distance d (w)
d = distance between transmitting node and receiving node (m) = path loss exponent and is usually empirically determined by field measurement. |
|
| Overall shadowing |
= Gaussian random-variable with zero mean and standard deviation dB. dB is called the shadowing deviation and is also measured. |
Table 7.
Received signal strength (RSS) calculation
| Propagation model | RSS Calculation for four selected models | |||||
|---|---|---|---|---|---|---|
| RSS (Watts) | RSS (dBW) | RSS (dBm) | ||||
| 2.4 GHz | 5 GHz | 2.4 GHz | 5 GHz | 2.4 GHz | 5 GHz | |
| Free-space | 0.0000013 | 0.000000314 | -58.87 | -65.03 | -28.8 | -35.0 |
| Two-ray ground | 0.001235 | 0.001235 | -29.08 | -29.08 | 0.9 | 0.9 |
| Shadowing path loss | 0.00002 | 0.00002 | -46.2 | -46.2 | -16.2 | -16.2 |
| Overall shadowing | 0.00019 | 0.00019 | -37.2 | -37.2 | -7.2 | -7.2 |
Table 8.
Measured RSS versus calculated RSS for six selected scenarios (2.4- and 5 GHz)
| Calculated RSS (dBm) for the following models |
||||||
|---|---|---|---|---|---|---|
| Scenario | Measured RSS (dBm) |
Free-space (dBm) | Two-Ray Ground (dBm) | Shadowing Path-Loss (dBm) | Overall Shadowing (dBm) |
Spectrum (GHz) |
| Living Room | -38 | -28.8 | 0.9 | -16.2 | -7.2 | 2.4 |
| -44 | -35.0 | 0.9 | -16.2 | -7.2 | 5 | |
| Library | -48 | -28.8 | 12.9 | -16.2 | -7.2 | 2.4 |
| -47 | -35.0 | 12.9 | -16.2 | -7.2 | 5 | |
| Cafeteria | -47 | -28.8 | 12.9 | -16.2 | -7.2 | 2.4 |
| -48 | -35.0 | 12.9 | -16.2 | -7.2 | 5 | |
| Outdoor: Ferry Terminal |
-41 | -28.8 | 12.9 | -19.0 | -3.0 | 2.4 |
| -43 | -35.0 | 12.9 | -19.0 | -3.0 | 5 | |
| Construction Site | -47 | -28.8 | 12.9 | -19.0 | -3.0 | 2.4 |
| -47 | -35.0 | 12.9 | -19.0 | -3.0 | 5 | |
| Busy Road | -42 | -28.8 | 12.9 | -19.0 | -3.0 | 2.4 |
| -46 | -35.0 | 12.9 | -19.0 | -3.0 | 5 | |
Table 9.
Received signal strength (RSS), noise level, and SNIR for each scenario
| Scenarios | Measured RSS (dBm) | Noise (dBm) | SNIR (dB) | ||
|---|---|---|---|---|---|
| 2.4 GHz | 5 GHz | 2.4 GHz | 5 GHz | ||
| Baseline | -46 | -46 | -90 | 44 | 44 |
| Living room | -38 | -44 | -90 | 52 | 46 |
| Library | -48 | -47 | -96 | 48 | 49 |
| Cafeteria | -47 | -48 | -90 | 43 | 42 |
| Ferry terminal | -41 | -43 | -89 | 48 | 46 |
| Construction site | -47 | -47 | -87 | 40 | 40 |
| Busy road | -42 | -46 | -89 | 47 | 43 |
Table 10.
Signal to noise and interference ratio (SNIR), and throughput degradation
| Scenarios | SNIR (dB) | Throughput degradation (%) |
Difference of Throughput degradation (%) |
||
|---|---|---|---|---|---|
| 2.4 GHz | 5 GHz | 2.4 GHz | 5 GHz | ||
| Baseline | 44 | 44 | 0 | 0 | 0 |
| Living room | 52 | 46 | 11 | 16 | 31.3 |
| Library | 48 | 49 | 15 | 36 | 58.3 |
| Cafeteria | 43 | 42 | 19 | 53 | 64.2 |
| Ferry terminal | 48 | 46 | 25 | 54 | 53.7 |
| Construction site | 40 | 40 | 46 | 67 | 32.1 |
| Busy road | 47 | 43 | 47 | 69 | 31.8 |
Disclaimer/Publisher’s Note: The statements, opinions and data contained in all publications are solely those of the individual author(s) and contributor(s) and not of MDPI and/or the editor(s). MDPI and/or the editor(s) disclaim responsibility for any injury to people or property resulting from any ideas, methods, instructions or products referred to in the content. |
© 2026 by the authors. Licensee MDPI, Basel, Switzerland. This article is an open access article distributed under the terms and conditions of the Creative Commons Attribution (CC BY) license (http://creativecommons.org/licenses/by/4.0/).
Copyright: This open access article is published under a Creative Commons CC BY 4.0 license, which permit the free download, distribution, and reuse, provided that the author and preprint are cited in any reuse.