

Submitted:
19 October 2026
Posted:
20 October 2026
You are already at the latest version
Abstract
Online mapping could simplify the collection of adolescents’ school travel routes, but its spatial agreement with recorded travel needs to be established. We assessed the spatial agreement between usual school routes drawn by adolescents in INDARES (International Database for Research and Educational Support) and subsequently recorded Global Positioning System (GPS) routes. The study involved 112 adolescents aged 12–18 years from two schools in Olomouc, Czech Republic. Paired route data were available for analysis in 58 participants (40 girls). Adolescents drew their usual home-to-school route on a Google Maps background under researcher supervision before wearing a Holux RCV-3000 GPS logger for seven days. Spatial agreement was defined as the percentage of each drawn route within a 50 m buffer around the retained GPS linework of the same participant. Mean drawn route length was 7.80 km (standard deviation [SD] 6.44), and 39 routes (67.2%) involved both active and passive transport. Mean spatial agreement was 80.98% (SD 25.53%; 95% bootstrap confidence interval [CI] 74.21–87.13%), with a median of 92.11% (interquartile range 75.69–97.74%). Agreement was at least 80% in 42 participants (72.4%) and below 50% in nine (15.5%). The high median agreement supports the potential of supervised online mapping for assessing usual school routes in adolescents. Individual discrepancies and uncertainty in the selected, processed GPS reference limit conclusions about interchangeability with GPS. Lower collection costs and workload are plausible advantages that require direct evaluation.
Keywords:
active transport
; digital route drawing
; school travel
; adolescent
; GPS
; spatial agreement
1. Introduction
Active commuting to and from school provides regular opportunities for physical activity (PA) in children and adolescents. A systematic review and meta-analysis of device-based studies found that active school journeys contribute significantly to daily PA (Campos-Garzón et al., 2023).
Understanding where journeys take place helps connect travel behaviour with the environments encountered along the way. Route characteristics provide information beyond the residential neighbourhood or the reported transport mode and can be combined with geographic information system (GIS) to examine school travel environments (Broberg & Sarjala, 2015; Burian et al., 2026). Such applications depend on the quality of the route information.
Global Positioning System (GPS) receivers provide location records that can be combined with GIS and accelerometry to describe travel and the contexts in which PA occurs (Jankowska et al., 2015; Vorlíček et al., 2024). However, using dedicated loggers requires device preparation, distribution and retrieval, participant adherence and subsequent data processing. Missing observations and positional error also need to be considered when interpreting recorded routes (Kerr et al., 2011). These requirements can make GPS deployment difficult in school studies involving many participants.
Interactive online maps offer another way to collect spatial information. Participants can identify locations and draw routes directly on a map, producing data that can be exported for GIS analysis (Chaix et al., 2012). In adolescents, Stewart et al. (2017) found that agreement between drawn and GPS-assessed school routes varied with transport mode, route complexity and the use of alternative routes. This supports further evaluation of specific mapping applications and collection procedures. A tool that records a familiar route may be useful when continuous monitoring is unnecessary, provided its spatial limitations are understood.
The INDARES (International Database for Research and Educational Support) system includes a mapping module in which users can draw a route by placing points on a Google Maps background and identifying the transport modes used along it. Earlier work described the use of INDARES for online PA recording and school transport assessment (Chmelík et al., 2008; Kudláček et al., 2013). The present study addresses a focused measurement question: how closely do adolescents’ usual school routes drawn in INDARES correspond spatially to their subsequently recorded GPS routes? The objective was to assess this agreement using GPS as the reference method.
2. Methods
2.1. Participants and Study Design
Data were collected between September 2014 and November 2015 at a primary and a secondary schools in Olomouc, Czech Republic, within the Czech part (Mitáš et al., 2018) of the IPEN Adolescent project (Cain et al., 2021). The participating schools were Hálkova Primary School and Slovanské Gymnázium. The original sample comprised 112 adolescents aged 12–18 years, including 42 boys and 70 girls. Of the 112 participants, 32 did not draw a route in INDARES. Of the 80 who did, 19 did not provide GPS data, leaving 61 with both data sources. Three of these 61 participants were excluded because their GPS records did not capture a journey from their place of residence to school. The route comparison therefore included 58 participants with both a complete drawn home-to-school route and a complete GPS record of a home-to-school journey. Their characteristics are presented in Table 1.
Sex was obtained from the questionnaire and recorded as boy or girl.
The study was approved by the Ethics Committee of the Faculty of Physical Culture, Palacký University Olomouc (reference 14/2014), and followed the principles of the Declaration of Helsinki. Written consent was obtained from participants and their parents. Participants received information about the study procedures and their right to withdraw.
2.2. INDARES Mapping Application
INDARES (International Database for Research and Educational Support) is a web-based system developed at Palacký University Olomouc for recording and providing feedback on PA and related behaviours (Chmelík et al., 2008). Its mapping module used the Google Maps platform, including map and aerial imagery and Google Street View. Participants placed successive points on the map to create a line representing their usual route from home to school. They could distinguish walking, cycling, car travel and public transport within the same route, allowing journeys with more than one transport mode to be represented (Figure 1).
The application also allowed users to enter travel time and annotate places along the route. It displayed route distance, an elevation profile and the proportions of active and passive travel. Saved routes were stored on a server and exported in GIS-compatible formats. The present validation concerned the geometry of the drawn route.
2.3. GPS Recording and Procedure
At the initial school session, participants were introduced to the study, registered in INDARES and drew their usual home-to-school route with supervision and assistance from a trained researcher. Route drawing therefore preceded GPS monitoring. Participants were then provided with a Holux RCV-3000 GPS logger (Holux Technology Inc., Hsinchu, Taiwan) and a charger.
GPS units were configured to record positions at 15-second intervals using Holux ezTour version 2.3. Participants were instructed to wear the devices in pockets on an elastic belt at the hip for seven consecutive days and to recharge the GPS logger each night. Equipment was collected at school eight days after distribution. The accelerometer component provided the wider PA context; spatial agreement between the drawn and GPS routes was the outcome of the present study. Previous studies have evaluated the spatial performance of the Holux RCV-3000 in dynamic and static conditions (Vorlíček et al., 2019, 2021).
2.4. Route Processing and Spatial Agreement
GPS and accelerometer records were processed using the Personal Activity and Location Measurement System (PALMS), which has been evaluated for identifying travel and classifying travel modes (Carlson et al., 2015). Data from the fitting day were excluded, and implausible GPS observations were filtered before export. A PostgreSQL geodatabase supported further organisation of transport records for GIS analysis. The route comparison used the retained processed GPS linework linked to each participant.
INDARES lines and GPS lines were matched by participant identifier. All retained GPS line features belonging to a participant were combined to construct that participant’s spatial reference. Coordinates were transformed from WGS84 geographic coordinates to WGS84 / UTM zone 33N (EPSG:32633), allowing buffers and route lengths to be calculated in metres. A 50 m buffer was constructed around the GPS reference linework. Spatial agreement was calculated as agreement (%) = 100 × drawn route length within the GPS buffer / total drawn route length.
Thus, spatial agreement represented the proportion of the drawn route lying within the GPS corridor. Only the GPS reference from the same participant contributed to the calculation, and overlapping buffer areas were counted once. Numerator and denominator were calculated in the same coordinate system. The measure describes coverage by the participant’s retained GPS linework; it does not require that the whole drawn route was followed on one particular recorded journey. The 50 m tolerance defines the spatial scale of the comparison. Figure 2 illustrates the calculation.
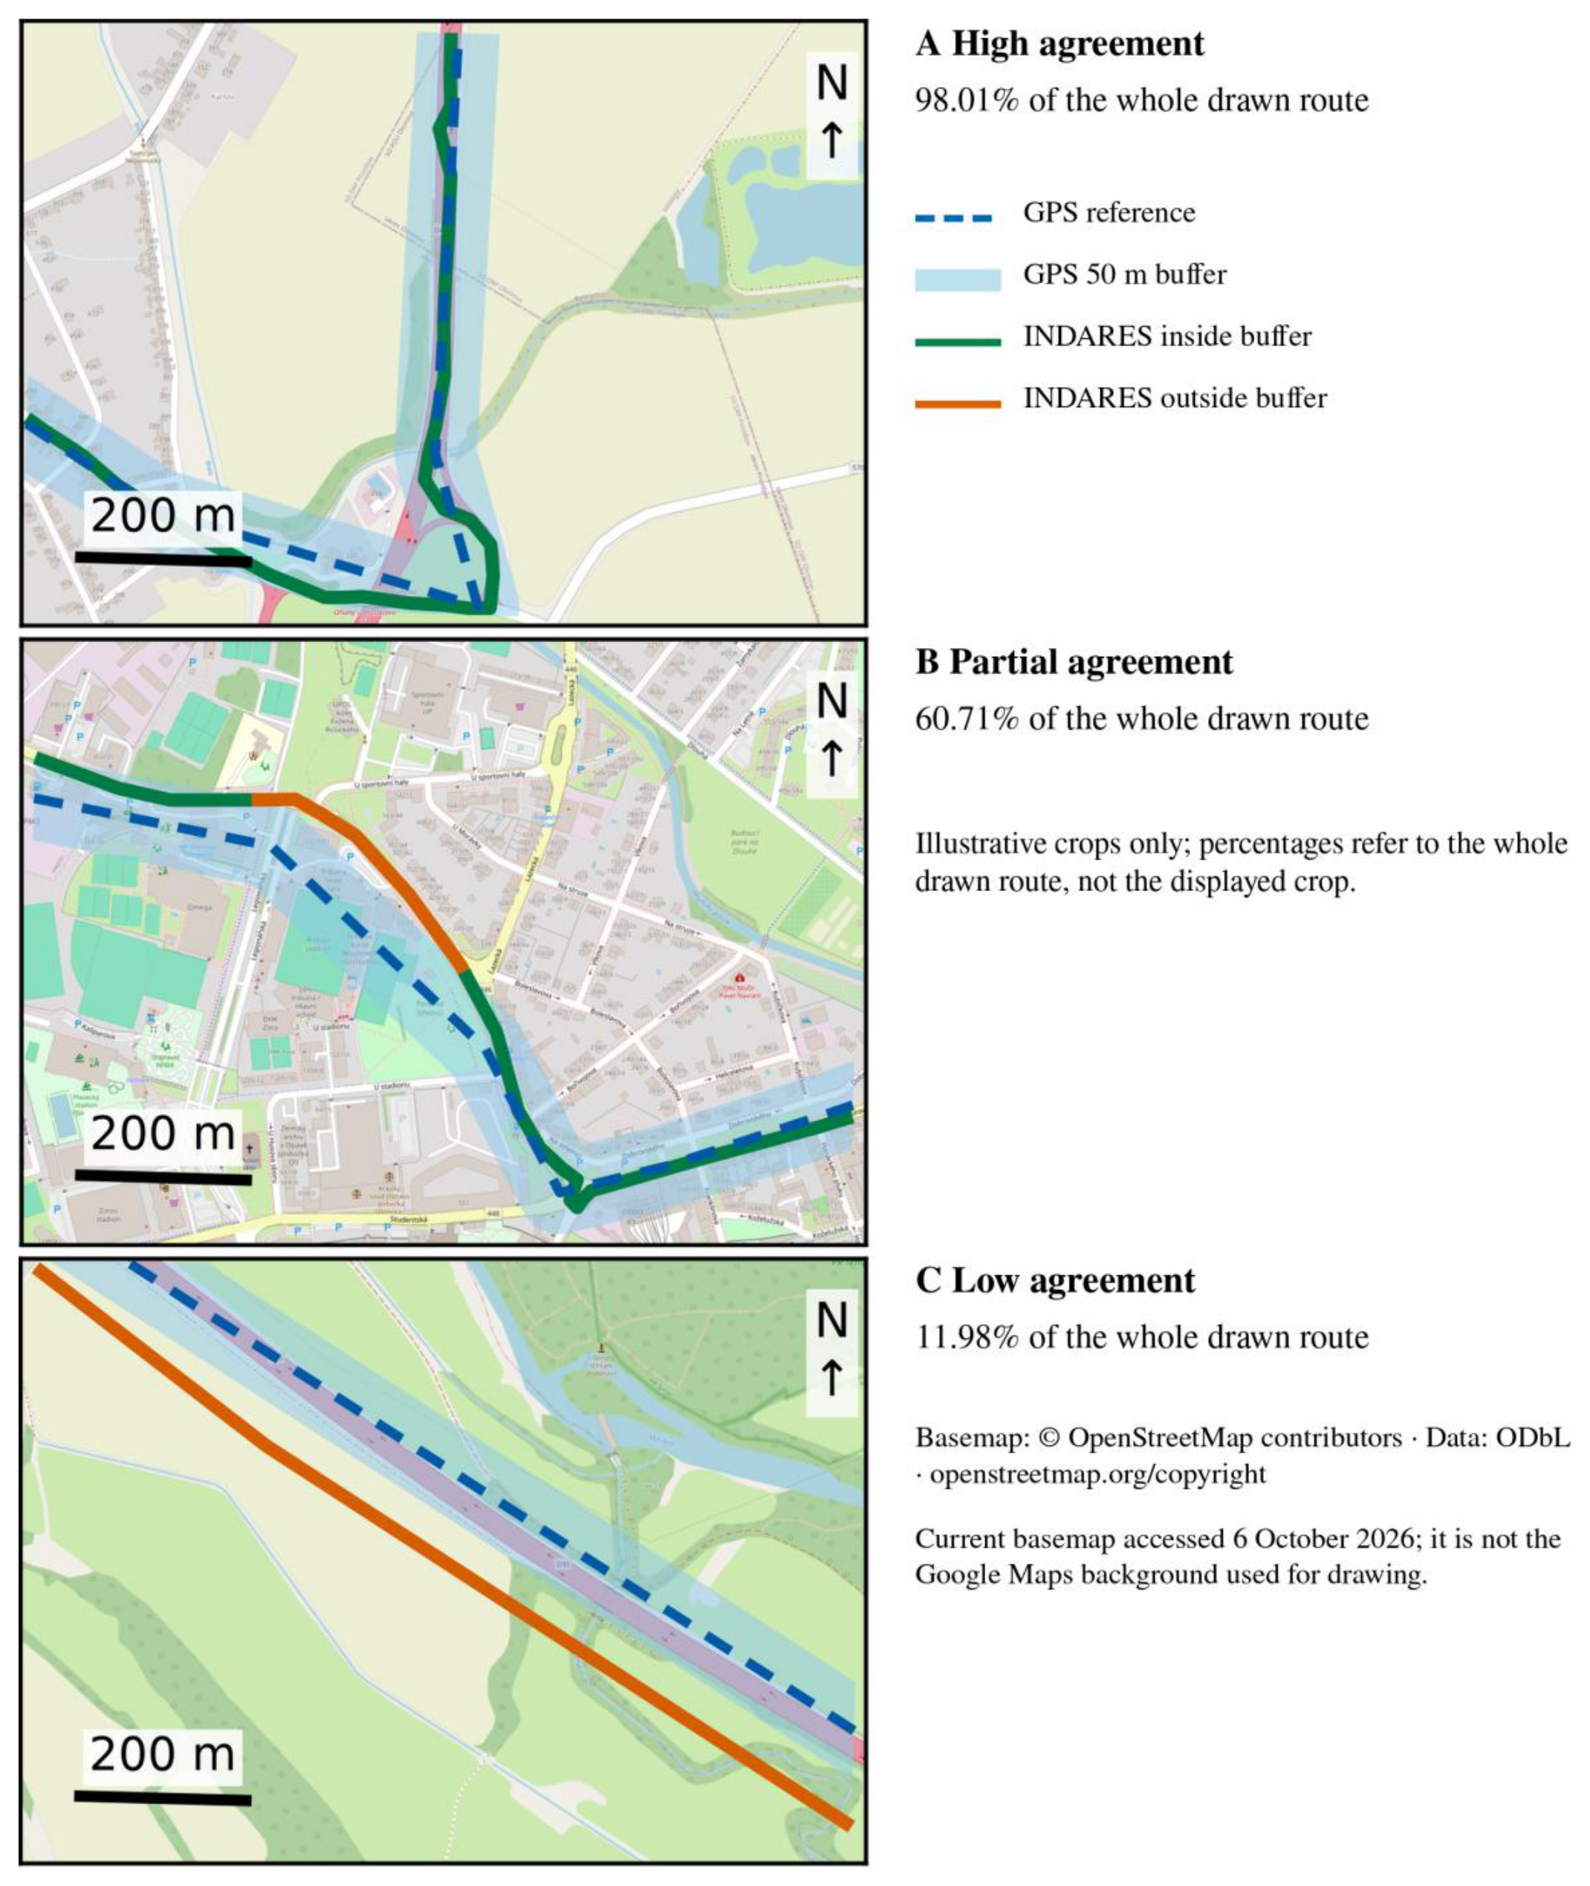
Three actual participant examples were selected illustratively for high, partial and low whole-route agreement and for a readable crop, not as representative cases or additional validity criteria. Figure 4 uses the same participant-specific merged GPS reference and 50 m buffer as the primary analysis. Display windows were at least 400 m from every endpoint of the selected drawn and GPS line components, without relying on assumed home-to-school orientation. Source linework was neither moved, simplified, smoothed nor repaired. Overlays were physically intersected with the display window before vector export; map reprojection and display cropping did not alter the analytical route lengths or whole-route percentages. No participant identifiers, pseudonyms or home endpoints are displayed. A current OpenStreetMap basemap was used for contextual display, not for route drawing or historical data processing.
2.5. Statistical Analysis
Each participant contributed one spatial agreement percentage, with equal weighting regardless of route length or the number of GPS line features. Agreement was summarised using the mean, sample standard deviation (SD), median, first and third quartiles, and range. A percentile 95% confidence interval (CI) for the mean was estimated from 20,000 bootstrap samples, resampling participants with replacement using NumPy 2.3.5 (PCG64 generator; random seed 20261006). Participant counts across descriptive agreement bands were also reported; these bands do not define a threshold for acceptable validity. The absolute length outside the GPS buffer was calculated as total drawn length minus the length inside the buffer. As an exploratory description, agreement was summarised for drawn routes shorter than 2 km, more than 2 to less than 5 km, and 5 km or longer. These distance groups were chosen for presentation and were not eligibility or validity criteria. No hypothesis tests or adjusted comparisons between groups were performed. Participant characteristics and transport modes were summarised as means and SDs or counts and percentages. Additional exploratory summaries were calculated by age in completed years and by the transport mode reported in INDARES (active only, passive only, and active and passive combined). Within each observed age and transport category, n, mean and median agreement were reported without hypothesis tests or adjusted models.
ChatGPT/Codex (OpenAI; accessed in October 2026) assisted with writing Python code for the descriptive summaries, bootstrap confidence interval, spatial calculations and data visualisation. Calculations and plots were produced from the recorded data and retained route geometries using statistical and GIS software; AI was not used to generate participant observations or replace missing route data.
3. Results
3.1. Participant and Route Characteristics
The analytic sample comprised 58 adolescents, representing 51.8% of the original 112 participants. Forty were girls (69.0%) and 18 were boys (31.0%). Mean age was 14.91 years (SD 1.75; range 12–18 years). Thirty participants attended the primary school and 28 attended the secondary school.
Mean INDARES route length was 7.80 km (SD 6.44), with a median of 7.21 km (interquartile range 2.48–10.54 km) and a range of 0.19–29.35 km. Thirteen participants (22.4%) reported exclusively active travel, six (10.3%) exclusively passive travel, and 39 (67.2%) a combination of active and passive transport. The sample therefore included a wide range of distances and both single-mode and multimodal journeys (Table 1).
3.2. Spatial Agreement Between INDARES and GPS
On average, 80.98% of the length of the route drawn in INDARES lay within 50 m of the same participant’s GPS reference (SD 25.53%; 95% bootstrap CI 74.21–87.13%). Median agreement was 92.11%, with an interquartile range of 75.69–97.74% and a range of 0.79–100.00% (Table 2). Agreement reached at least 80% in 42 participants (72.4%), at least 90% in 32 (55.2%) and at least 95% in 24 (41.4%). Nine participants (15.5%) had agreement below 50%. The distribution shows high agreement for many participants alongside a smaller group with substantial discrepancies (Figure 3).
The median length of the drawn route outside the GPS buffer was 431 m (interquartile range 88–1,433 m). In 15 participants (25.9%), less than 100 m of the drawn route fell outside the buffer. The mean outside-buffer length was 2.00 km (SD 4.67), reflecting the influence of some long unmatched sections. These values describe lengths along the drawn route and are not estimates of lateral GPS positional error.
Illustrative cropped examples show high (A, 98.01%), partial (B, 60.71%) and low (C, 11.98%) whole-route agreement (Figure 4). These percentages describe each complete drawn route, whereas each panel displays only an interior crop. The examples are not representative of their agreement categories.
3.3. Exploratory Description by Route Length
For routes shorter than 2 km (n = 10), mean agreement was 83.63% and the median was 96.38%. Corresponding values were 84.37% and 90.71% for routes of 2 to less than 5 km (n = 16), and 78.46% and 89.98% for routes of at least 5 km (n = 32; Table 3). The longest-distance group had a lower observed mean, while median agreement was approximately 90% or higher in all three groups. These descriptive results do not establish an independent association between route length and agreement.
3.4. Exploratory Description by Age and Transport Mode
Agreement varied descriptively across observed age groups (Table 4). Mean agreement was 97.60% at age 12 (n = 1), 79.80% at age 13 (n = 18), 65.10% at age 14 (n = 11), 86.15% at age 16 (n = 13), 86.68% at age 17 (n = 13), and 100.00% at age 18 (n = 2). There were no participants aged 15 in this analytic sample. Mean (median) agreement was 84.38% (97.57%) for active-only travel (n = 13), 63.79% (89.17%) for passive-only travel (n = 6), and 82.49% (91.00%) for combined active and passive travel (n = 39). These are unadjusted sample descriptions; the youngest and oldest groups are particularly small.
4. Discussion
4.1. Main Findings
Approximately 81% of the length of adolescents’ self-drawn school routes fell within a 50 m corridor around their GPS reference, with a median of 92%. This indicates that supervised route drawing in INDARES captured much of the spatial course of school travel for many participants. The lower mean and the nine participants with agreement below 50% also show why the method should be evaluated in relation to its intended use. A high sample median does not ensure an accurate route for every individual. These results address the location of a usual school route, rather than the timing, frequency or day-to-day consistency of travel. Participants drew a familiar route before monitoring, whereas GPS recorded travel on subsequent days. Disagreement may therefore reflect an inaccurately drawn line, a different route taken during monitoring, or limitations of the GPS reference. The present design does not separate these sources of disagreement.
The absolute unmatched lengths add a practical perspective to the percentages. A small percentage of a long commute can still represent a sizeable section of the route, and agreement on most of the journey may be insufficient if the research question concerns a specific junction or a short environmental exposure. The descriptive distance groups likewise suggest that high median agreement can coexist with marked individual discrepancies across different route lengths. They should not be interpreted as evidence of equal accuracy across groups or as a causal effect of distance.
4.2. Comparison with Previous Research
Our findings are consistent with the potential for adolescent online mapping identified by Stewart et al. (2017). Their study showed that agreement could vary with transport mode, additional mode transitions and the use of multiple school routes. The high proportion of multimodal routes in our sample demonstrates the relevance of allowing several modes to be represented within one drawn route. However, the present descriptive analysis does not establish that accuracy is equivalent across active, passive and multimodal journeys. Numerical comparisons between studies also need to account for differences in the reference routes, spatial tolerance and unit of analysis.
The additional age and transport-mode summaries describe the linked historical sample rather than independent effects. The passive-only category had a lower observed mean than the other transport categories, but its median was considerably higher than its mean and it contained only six participants. Age-group findings were also sensitive to very small cells, with one participant aged 12 and two aged 18. No adjusted analysis separates age, route length, school, transport mode or selection and processing factors; these findings do not establish superiority or equivalent validity for any subgroup. Figure 4 illustrates local corridor correspondence and discrepancies but cannot establish the accuracy of the entire journey from the displayed crop.
GPS provides a useful spatial reference, but positional error, signal loss and data processing can affect the recorded route (Kerr et al., 2011). The 50 m corridor used here accommodates local discrepancies; it is a comparison tolerance rather than a claim about the device’s typical error. Agreement at this scale should therefore be interpreted as correspondence between travel corridors.
Interactive mapping can combine route geometry with participant-reported context (Chaix et al., 2012). Subsequent environmental analyses may require greater spatial precision than the present comparison establishes. For example, an analysis of manually mapped school routes used 25 m environmental buffers (Burian et al., 2026). Agreement within a 50 m validation corridor does not automatically establish sufficient precision for such a narrower exposure assessment.
4.3. Practical Implications
Online route drawing can be incorporated into a supervised school session and avoids the distribution, charging and retrieval of dedicated GPS loggers for that task. Routes are available in digital form for subsequent GIS use. These features make INDARES a plausible option for larger school studies that need an approximate description of usual travel routes, particularly when device deployment would be difficult. The high median agreement supports further use and evaluation in this setting. For transport planners and school-health programmes, this approach may support initial characterisation of school-route environments; decisions about specific crossings or short segments require more precise route information. The study did not measure completion time, staff workload, financial costs or perceived ease of use. It therefore cannot quantify savings or establish that mapping is easier for all adolescents. The opportunity to reduce equipment and collection demands should be presented as a practical advantage to evaluate, rather than a measured economic outcome. Researchers must also match the 50 m comparison scale to their question: identifying a broad travel corridor requires different precision from locating a particular crossing, footpath or exposure. GPS remains useful when time-resolved travel, route changes or repeated journeys are central to the research question.
Figure 4.
Actual illustrative crops of INDARES–GPS spatial agreement Note. Panels A–C show illustrative high (98.01%), partial (60.71%) and low (11.98%) agreement in the 58-participant sample. Percentages refer to the whole drawn route, not the displayed interior crop; cases were selected for illustration and readable cropping, not representativeness. Blue dashes show the participant-specific merged GPS reference used in the primary analysis; pale blue is its 50 m buffer. Green and orange show INDARES linework inside and outside the buffer. Endpoints and participant identifiers are omitted; exported vector overlays contain only displayed sections. Geometry was not moved or simplified. Map frames delineate the displayed study areas, not national boundaries. Basemap: © OpenStreetMap contributors, ODbL (https://www.openstreetmap.org/copyright), accessed 6 October 2026; contemporary context, not the historical Google Maps background. Map-production code was prepared with assistance from ChatGPT/Codex (OpenAI; accessed in October 2026).
Figure 4.
Actual illustrative crops of INDARES–GPS spatial agreement Note. Panels A–C show illustrative high (98.01%), partial (60.71%) and low (11.98%) agreement in the 58-participant sample. Percentages refer to the whole drawn route, not the displayed interior crop; cases were selected for illustration and readable cropping, not representativeness. Blue dashes show the participant-specific merged GPS reference used in the primary analysis; pale blue is its 50 m buffer. Green and orange show INDARES linework inside and outside the buffer. Endpoints and participant identifiers are omitted; exported vector overlays contain only displayed sections. Geometry was not moved or simplified. Map frames delineate the displayed study areas, not national boundaries. Basemap: © OpenStreetMap contributors, ODbL (https://www.openstreetmap.org/copyright), accessed 6 October 2026; contemporary context, not the historical Google Maps background. Map-production code was prepared with assistance from ChatGPT/Codex (OpenAI; accessed in October 2026).
4.4. Strengths and Limitations
A strength of the study is the comparison of routes drawn by adolescents with subsequently collected GPS data from the same participants. Drawing preceded monitoring, and the application allowed both single-mode and multimodal routes to be represented. Reporting the distribution of participant-level agreement, alongside its average, makes individual variability visible.
Several limitations affect interpretation. The sample was small, came from two schools in one Czech city and included only 58 of the 112 original participants. The paired analytic sample may differ from participants who were not included. Route drawing was supervised, so the results should not be generalised directly to unsupervised use or to younger children. Data collection also took place in 2014–2015, and the findings relate to the interface and procedures used at that time. The participant-level bootstrap CI describes sampling uncertainty within the analytic sample and does not account for selection bias or between-school variation. Agreement was not examined by questionnaire-reported sex, so possible differences in measurement performance between boys and girls remain unknown.
The GPS reference consisted of selected, processed linework. Route selection, missing observations and any manual corrections may affect the comparison; the extent to which corrections could have introduced dependence between methods could not be established. Combining retained line features also allows different parts of the drawn route to be covered by different GPS components. The outcome therefore describes agreement with a participant’s recorded travel corridor, rather than the accuracy of a single complete journey. GPS itself is subject to positional error and signal loss (Kerr et al., 2011).
Finally, the comparison used one directional measure at a single 50 m tolerance. It does not describe the proportion of GPS travel captured by the drawn route, and nearby but distinct streets may fall within the same corridor. The study did not evaluate test–retest reliability, independent completion success, usability or costs. Further evaluation should examine these outcomes and the circumstances in which large individual discrepancies arise.
5. Conclusions
Among 58 adolescents, school routes drawn in INDARES showed a mean spatial agreement of 80.98% and a median of 92.11% with the participant-specific GPS reference at a 50 m tolerance. The findings support the potential of supervised online mapping for collecting usual school routes when an approximate spatial representation is sufficient. In practice, supervised route drawing appears suitable when a study needs the corridor of a usual school route, for example to describe environments along it at the 50 m comparison scale used here. Where analyses depend on specific crossings, short route segments or day-to-day route changes, GPS or a combination of both methods remains preferable. Individual discrepancies and limitations of the processed GPS reference should inform its use, and time and cost savings require direct measurement. Beyond INDARES, the comparison procedure offers a framework for evaluating current web-mapping tools in further studies, including studies of unsupervised use and younger children.
Funding
This article has been produced with the support of the project ReDiKid: Resilient Kid in Digital World, reg. no. CZ.02.01.01/00/23_025/0008686 co-funded by the EU. The research was also supported by the National Institutes of Health, USA (R01 HL111378), through the project “IPEN Adolescent: International study of built environments and physical activity”; the Czech Science Foundation (14-26896S), through “Multifactorial research on built environment, active lifestyle and physical fitness in Czech adolescents”.
Data Availability
De-identified study data are available on Zenodo (Vorlíček et al., 2026): https://doi.org/10.5281/zenodo.23469931.
Acknowledgments
The authors thank the adolescents, their parents and the participating schools for their involvement in the study.
Declaration of competing interest
The authors declare no conflicts of interest.
Declaration of generative AI and AI-assisted technologies in the manuscript preparation process
During the preparation of this work, the authors used ChatGPT/Codex (OpenAI) for language editing, manuscript organisation, reference checking, assistance with Python analysis and visualisation code, and preparation of the explanatory schematic, and Claude (Anthropic) to support manuscript checking. The authors reviewed and edited the outputs as needed and take full responsibility for the content of the publication.
References
- Broberg, A.; Sarjala, S. School travel mode choice and the characteristics of the urban built environment: The case of Helsinki, Finland. Transport Policy 2015, 37, 1–10. [Google Scholar] [CrossRef]
- Burian, J.; Vorlíček, M.; Rypl, O.; Koníček, J.; Dygrýn, J.; Pánek, J. Environmental influences on children’s active travel: A spatial analysis of school routes. Journal of Maps 2026, 22(1), 2689151. [Google Scholar] [CrossRef]
- Cain, K. L.; Salmon, J.; Conway, T. L.; Cerin, E.; Hinckson, E.; Mitáš, J.; Schipperijn, J.; Frank, L. D.; Anjana, R. M.; Barnett, A.; Dygrýn, J.; Islam, M. Z.; Molina-García, J.; Moran, M.; Muda, W. A. M. W.; Oyeyemi, A. L.; Reis, R.; Santos, M. P.; Schmidt, T.; Sallis, J. F. International Physical Activity and Built Environment Study of adolescents: IPEN Adolescent design, protocol and measures. BMJ Open 2021, 11(1), e046636. [Google Scholar] [CrossRef] [PubMed]
- Campos-Garzón, P.; Sevil-Serrano, J.; García-Hermoso, A.; Chillón, P.; Barranco-Ruiz, Y. Contribution of active commuting to and from school to device-measured physical activity levels in young people: A systematic review and meta-analysis. Scandinavian Journal of Medicine & Science in Sports 2023, 33(11), 2110–2124. [Google Scholar] [CrossRef] [PubMed]
- Carlson, J. A.; Jankowska, M. M.; Meseck, K.; Godbole, S.; Natarajan, L.; Raab, F.; Demchak, B.; Patrick, K.; Kerr, J. Validity of PALMS GPS scoring of active and passive travel compared with SenseCam. Medicine & Science in Sports & Exercise 2015, 47(3), 662–667. [Google Scholar] [CrossRef] [PubMed]
- Chaix, B.; Kestens, Y.; Perchoux, C.; Karusisi, N.; Merlo, J.; Labadi, K. An interactive mapping tool to assess individual mobility patterns in neighborhood studies. American Journal of Preventive Medicine 2012, 43(4), 440–450. [Google Scholar] [CrossRef] [PubMed]
- Chmelík, F.; Frömel, K.; Křen, F.; Stelzer, J.; Engelová, L.; Kudláček, M.; Mitáš, J. The verification of the usability of the online Indares.com system in collecting data on physical activity – pilot study. Acta Universitatis Palackianae Olomucensis. Gymnica 2008, 38(4), 59–66. [Google Scholar]
- Jankowska, M. M.; Schipperijn, J.; Kerr, J. A framework for using GPS data in physical activity and sedentary behavior studies. Exercise and Sport Sciences Reviews 2015, 43(1), 48–56. [Google Scholar] [CrossRef] [PubMed]
- Kerr, J.; Duncan, S.; Schipperijn, J. Using global positioning systems in health research: A practical approach to data collection and processing. American Journal of Preventive Medicine 2011, 41(5), 532–540. [Google Scholar] [CrossRef] [PubMed]
- Kudláček, M.; Nováková Lokvencová, P.; Rubín, L.; Chmelík, F.; Frömel, K. Objektivizace monitoringu aktivního transportu adolescentů v souvislosti se školou [Objectification of the school-related transport monitoring of the adolescents]. Tělesná kultura 2013, 36(2), 46–64. [Google Scholar] [CrossRef]
- Mitáš, J.; Dygrýn, J.; Rubín, L.; Křen, F.; Vorlíček, M.; Nykodým, J.; Řepka, E.; Bláha, L.; Suchomel, A.; Feltlová, D.; Klimtová, H.; Valach, P.; Frömel, K. Multifaktoriální výzkum zastavěného prostředí, aktivního životního stylu a tělesné kondice české mládeže: Design a metodika projektu [Multifactorial research on built environment, active lifestyle and physical fitness in Czech adolescents: Design and methods of the study]. Tělesná kultura 2018, 41(1), 17–24. [Google Scholar] [CrossRef]
- Stewart, T.; Schipperijn, J.; Snizek, B.; Duncan, S. Adolescent school travel: Is online mapping a practical alternative to GPS-assessed travel routes? Journal of Transport & Health 5 2017, 113–122. [Google Scholar] [CrossRef]
- Vorlíček, M.; Stewart, T.; Dygrýn, J.; Rubín, L.; Mitáš, J.; Schipperijn, J. The comparison of Holux and Qstarz GPS receivers in free living conditions: Dynamic accuracy in different active transport modes. Acta Gymnica 2019, 49(3), 109–114. [Google Scholar] [CrossRef]
- Vorlíček, M.; Stewart, T.; Dygrýn, J.; Rubín, L.; Mitáš, J.; Burian, J.; Duncan, S.; Schipperijn, J.; Pratt, M. Where are Czech adolescents active? The patterns of movement and transport behavior in different active living domains. Journal of Physical Activity and Health 2024, 21(6), 586–594. [Google Scholar] [CrossRef] [PubMed]
- Vorlíček, M.; Stewart, T.; Schipperijn, J.; Burian, J.; Rubín, L.; Dygrýn, J.; Mitáš, J.; Duncan, S. Smart watch versus classic receivers: Static validity of three GPS devices in different types of built environments. Sensors 2021, 21(21), 7232. [Google Scholar] [CrossRef] [PubMed]
Figure 1.
INDARES route drawing interface Note. An illustrative route in the INDARES mapping module, using the Google Maps background. The route shown is fictional and is not a participant’s GPS record. Different line colours identify transport modes. The account name and email address have been masked. The screenshot was resampled and lightly sharpened for legibility.
Figure 1.
INDARES route drawing interface Note. An illustrative route in the INDARES mapping module, using the Google Maps background. The route shown is fictional and is not a participant’s GPS record. Different line colours identify transport modes. The account name and email address have been masked. The screenshot was resampled and lightly sharpened for legibility.
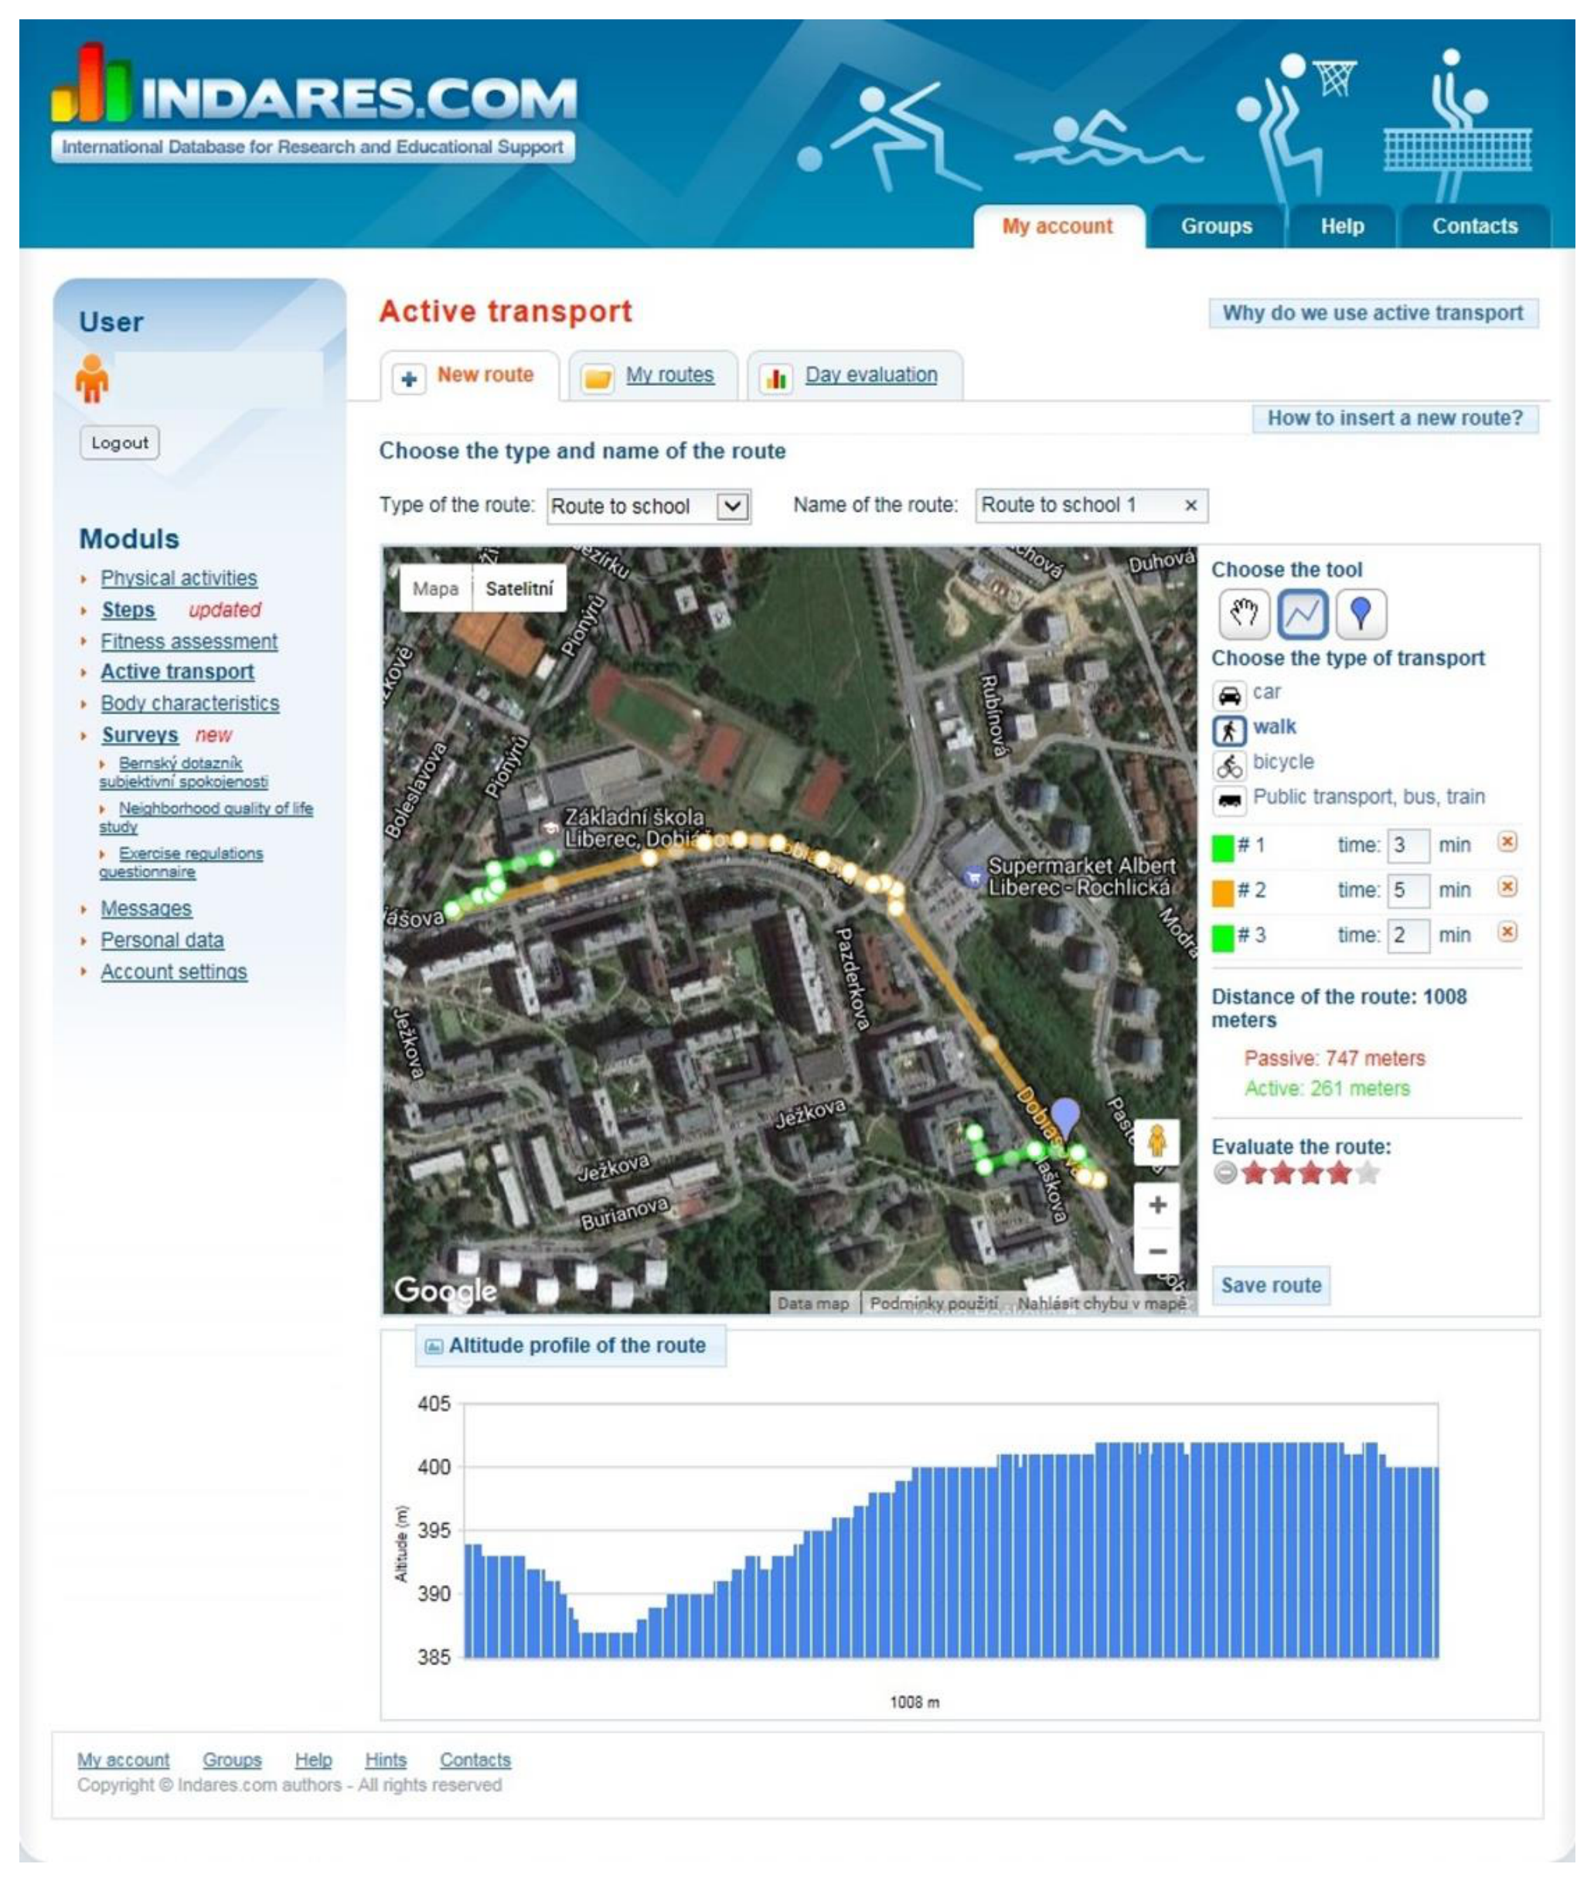
Figure 2.
Calculation of spatial agreement Note. Schematic illustration using fictional routes, not participant data. The blue dashed line represents the GPS reference and the pale blue area its 50 m buffer. Green and orange sections show drawn INDARES linework inside and outside that buffer. In the analysis, the GPS reference included all retained linework from the same participant. Overlapping buffer areas were counted once. The schematic was prepared in Python with coding assistance from ChatGPT/Codex (OpenAI; accessed in October 2026).
Figure 2.
Calculation of spatial agreement Note. Schematic illustration using fictional routes, not participant data. The blue dashed line represents the GPS reference and the pale blue area its 50 m buffer. Green and orange sections show drawn INDARES linework inside and outside that buffer. In the analysis, the GPS reference included all retained linework from the same participant. Overlapping buffer areas were counted once. The schematic was prepared in Python with coding assistance from ChatGPT/Codex (OpenAI; accessed in October 2026).
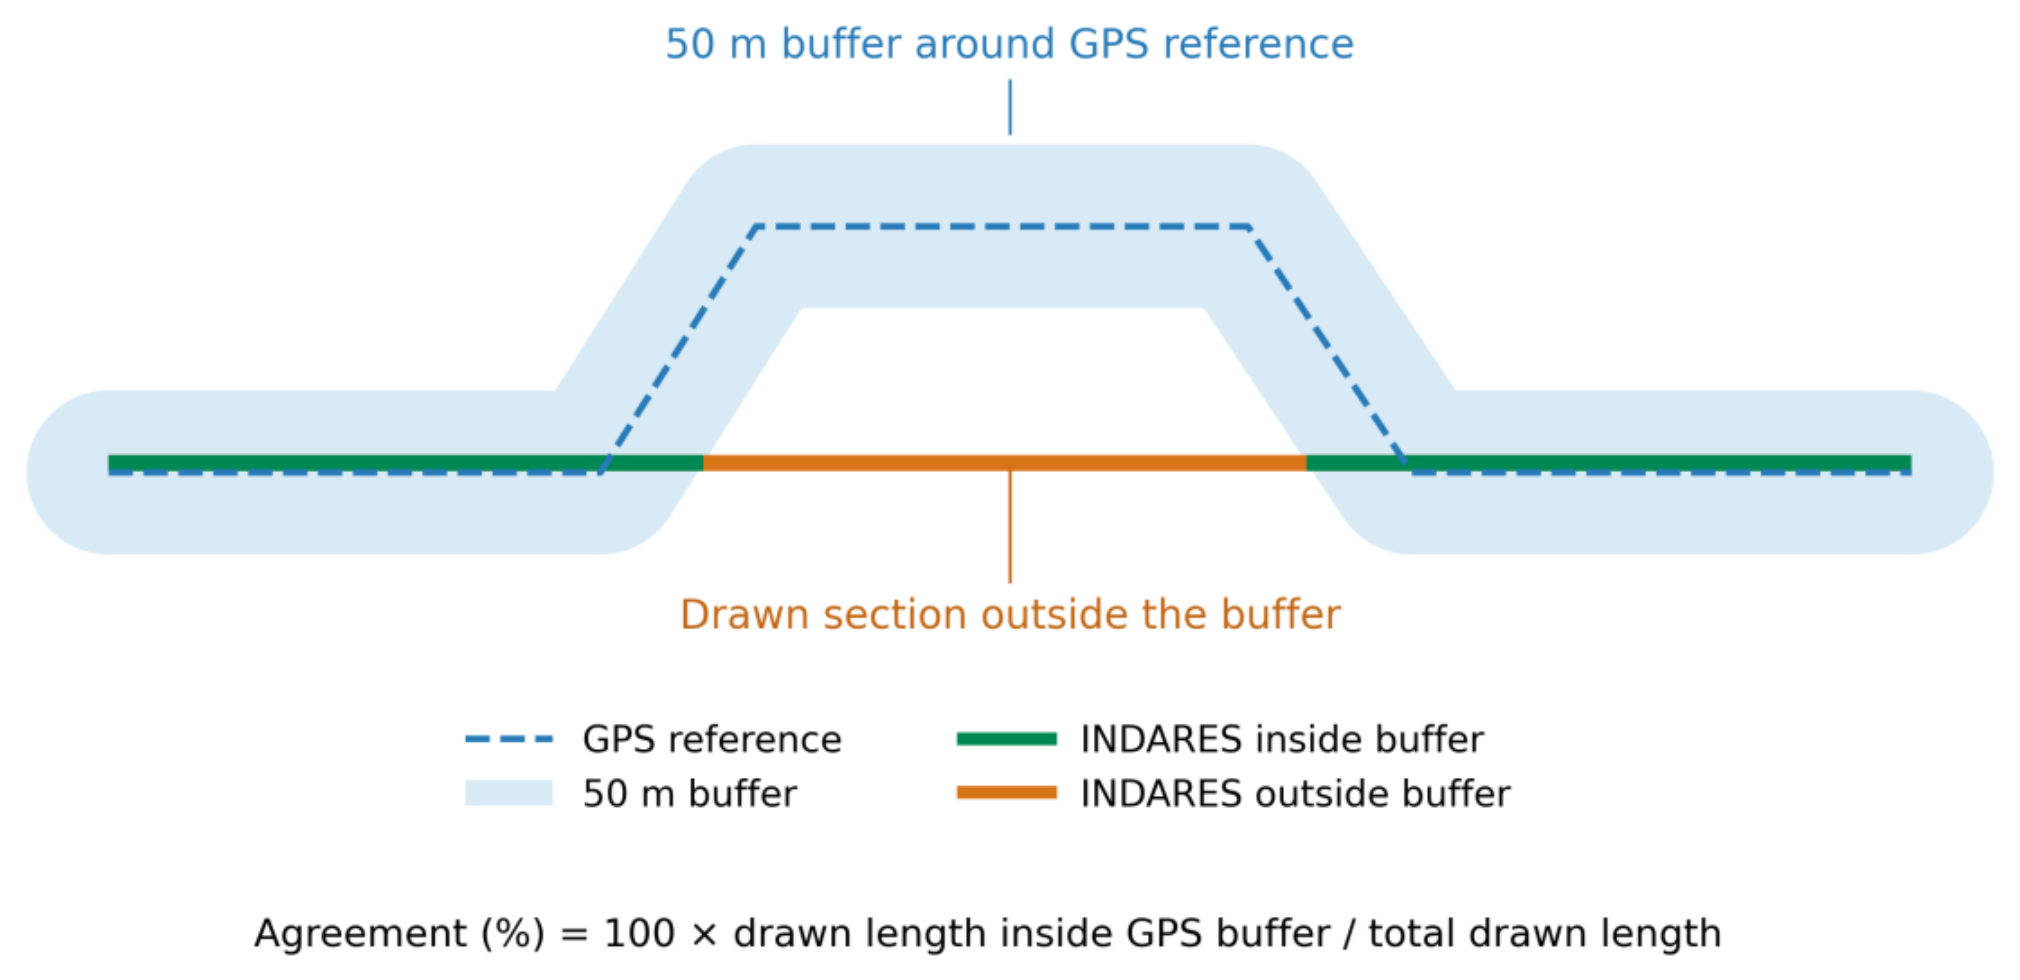
Figure 3.
Distribution of participant spatial agreement Note. Each point represents one participant, ordered from the lowest to the highest agreement. Agreement is the percentage of the INDARES route length within 50 m of the same participant’s retained GPS linework. The dashed and dotted lines indicate the mean and median, respectively. Participant rank does not identify an individual. Plotting code was prepared with assistance from ChatGPT/Codex (OpenAI; accessed in October 2026); plotted values were derived from recorded participant data.
Figure 3.
Distribution of participant spatial agreement Note. Each point represents one participant, ordered from the lowest to the highest agreement. Agreement is the percentage of the INDARES route length within 50 m of the same participant’s retained GPS linework. The dashed and dotted lines indicate the mean and median, respectively. Participant rank does not identify an individual. Plotting code was prepared with assistance from ChatGPT/Codex (OpenAI; accessed in October 2026); plotted values were derived from recorded participant data.
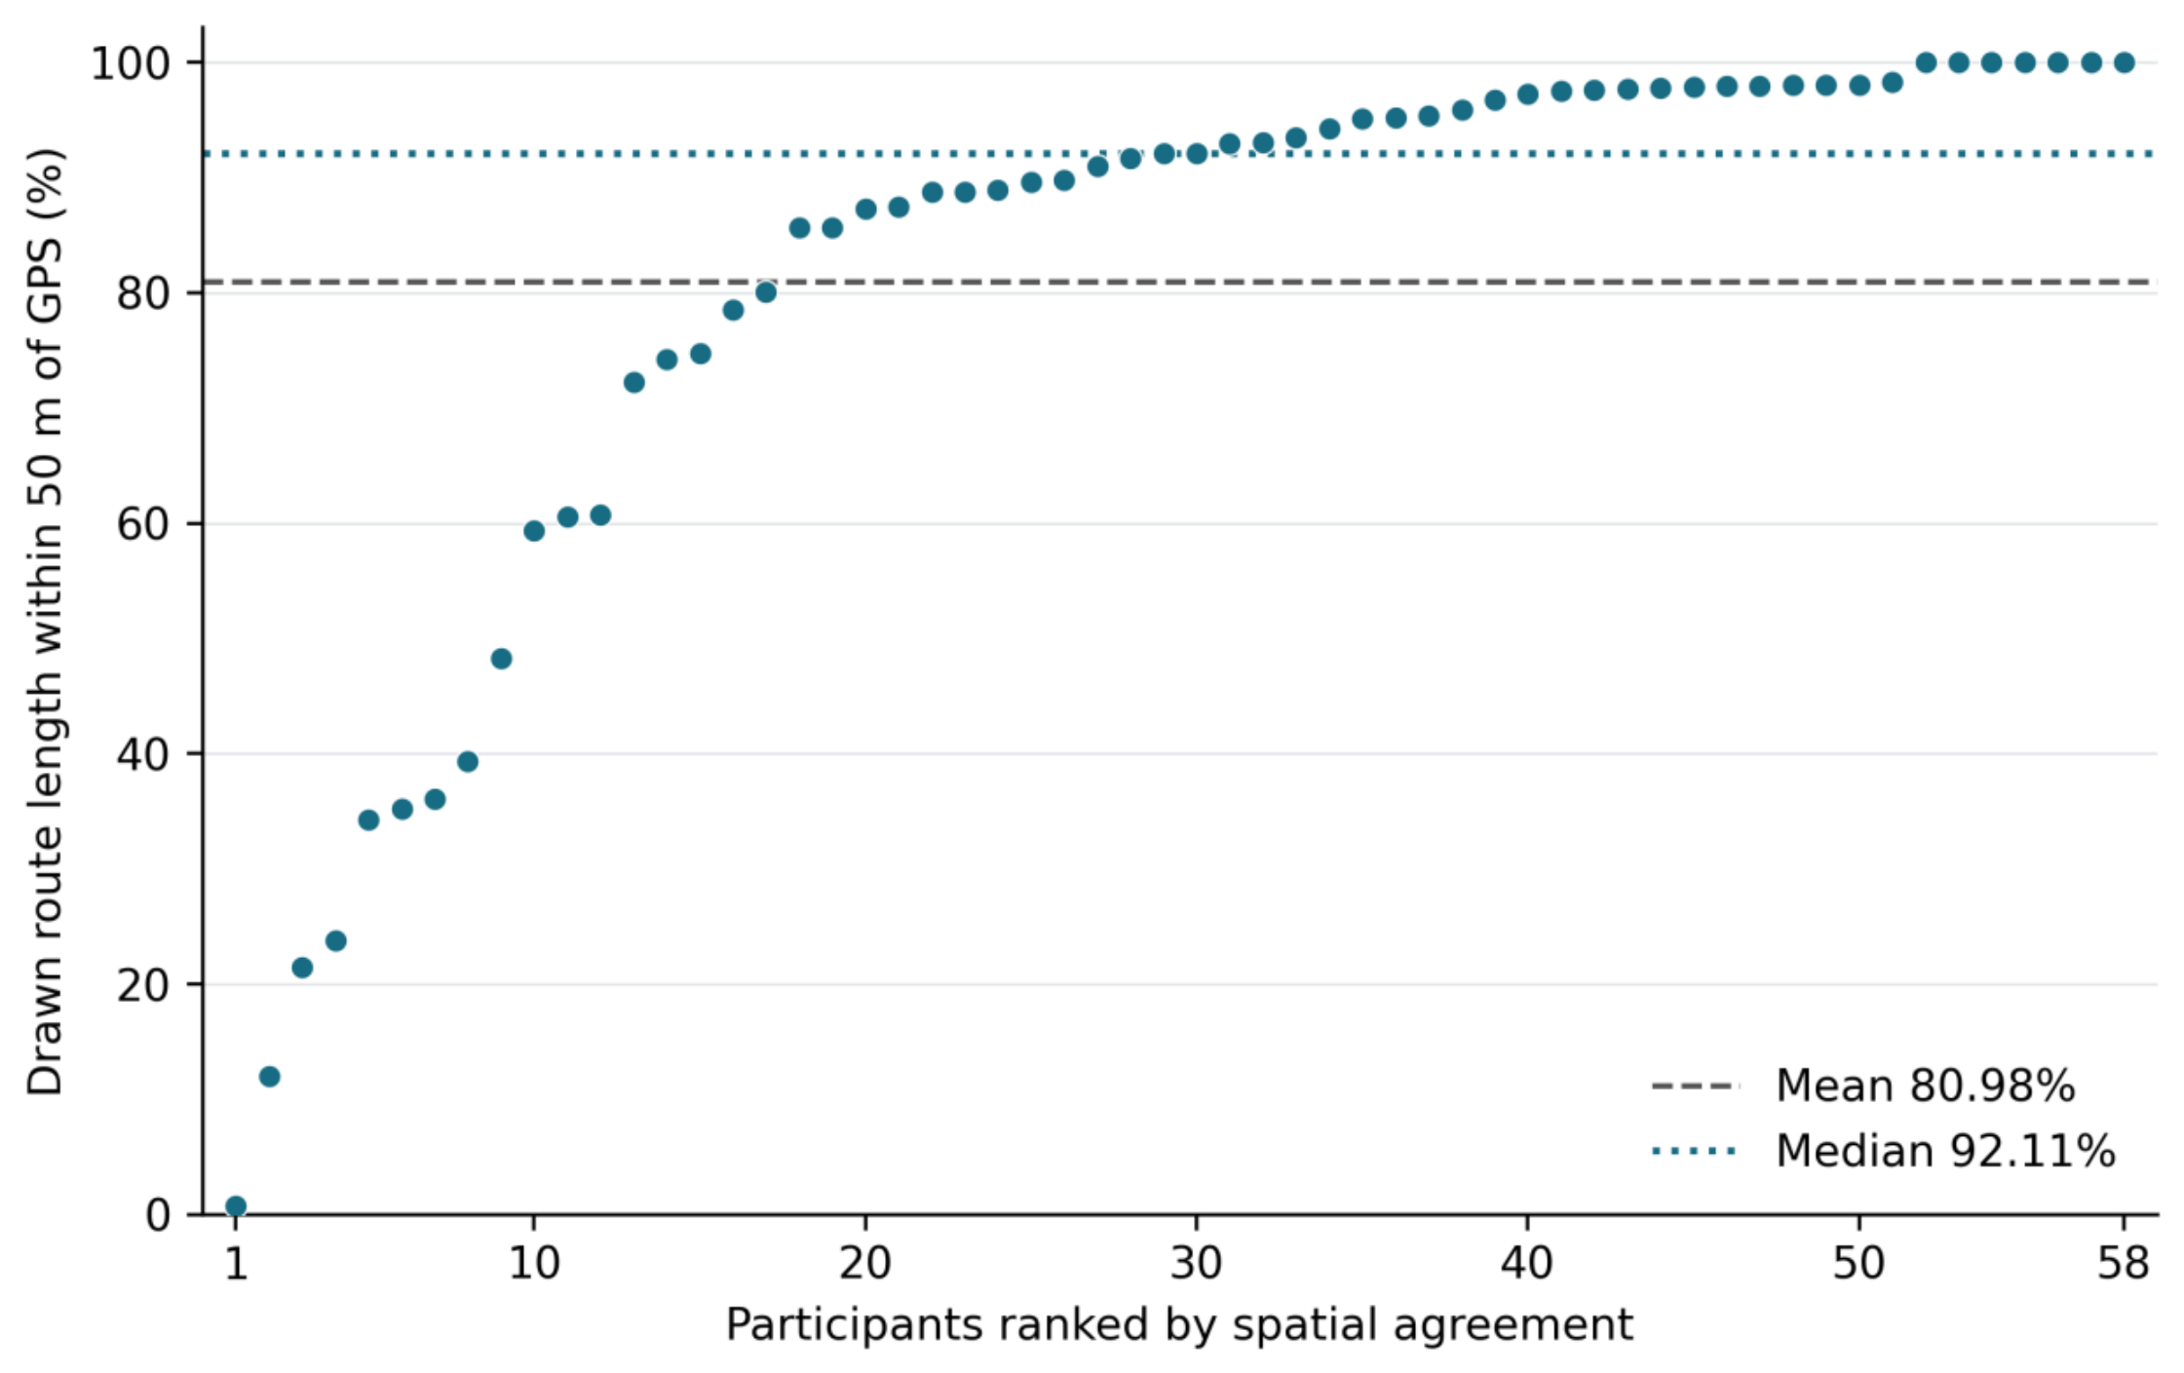

Table 1.
Participant and drawn route characteristics.
| Characteristic | Value |
| Participants, n | 58 |
| Girls, n (%) | 40 (69.0) |
| Boys, n (%) | 18 (31.0) |
| Age, mean (SD), years | 14.91 (1.75) |
| Age range, years | 12–18 |
| Primary school, n (%) | 30 (51.7) |
| Secondary school, n (%) | 28 (48.3) |
| Drawn route length, mean (SD), km | 7.80 (6.44) |
| Drawn route length, median (Q1–Q3), km | 7.21 (2.48–10.54) |
| Drawn route length, range, km | 0.19–29.35 |
| Active travel only, n (%) | 13 (22.4) |
| Passive travel only, n (%) | 6 (10.3) |
| Active and passive travel combined, n (%) | 39 (67.2) |
Note. SD, standard deviation. Transport modes refer to the route reported in INDARES. Percentages may not sum to 100 because of rounding.
Table 2.
Spatial agreement between INDARES routes and GPS.
| Measure | Value |
| Mean (SD), % | 80.98 (25.53) |
| 95% bootstrap CI for the mean, % | 74.21–87.13 |
| Median (Q1–Q3), % | 92.11 (75.69–97.74) |
| Range, % | 0.79–100.00 |
| Below 50% agreement, n (%) | 9 (15.5) |
| 50% to below 80% agreement, n (%) | 7 (12.1) |
| 80% to below 90% agreement, n (%) | 10 (17.2) |
| 90% to 100% agreement, n (%) | 32 (55.2) |
| Outside-buffer length, median (Q1–Q3), m | 431 (88–1,433) |
| Outside-buffer length, mean (SD), km | 2.00 (4.67) |
| Outside-buffer length below 100 m, n (%) | 15 (25.9) |
Note. n = 58. Agreement is the percentage of each drawn route within 50 m of the same participant’s retained GPS linework. CI, confidence interval, obtained from 20,000 participant bootstrap samples. Q1 and Q3 are the first and third quartiles. Outside-buffer length measures the unmatched length along the drawn line, not lateral positional error. Agreement bands are descriptive, not pass–fail criteria.
Table 3.
Exploratory description of agreement by drawn route length.
| Route length, km | n | Mean, % | Median (Q1–Q3), % |
| <2 | 10 | 83.63 | 96.38 (93.20–99.50) |
| 2 to <5 | 16 | 84.37 | 90.71 (80.81–97.71) |
| ≥5 | 32 | 78.46 | 89.98 (74.62–97.35) |
Note. Distance groups are descriptive presentation categories. Groups were not compared using hypothesis tests or adjusted models. Differences should not be attributed to route length independently of age, transport mode or other characteristics.
Table 4.
Exploratory description of agreement by age and INDARES transport mode.
| Grouping | Category | n | Mean, % | Median, % |
| Age, years | 12 | 1 | 97.60 | 97.60 |
| Age, years | 13 | 18 | 79.80 | 91.87 |
| Age, years | 14 | 11 | 65.10 | 72.22 |
| Age, years | 16 | 13 | 86.15 | 95.19 |
| Age, years | 17 | 13 | 86.68 | 95.93 |
| Age, years | 18 | 2 | 100.00 | 100.00 |
| Transport mode | Active only | 13 | 84.38 | 97.57 |
| Transport mode | Passive only | 6 | 63.79 | 89.17 |
| Transport mode | Active and passive combined | 39 | 82.49 | 91.00 |
Note. Each grouping describes the same 58 participants. Age in completed years; no participants were aged 15. Transport mode as reported in INDARES. The summaries are unadjusted and descriptive; small groups, particularly ages 12 and 18, warrant caution. No subgroup hypothesis tests were performed.
Disclaimer/Publisher’s Note: The statements, opinions and data contained in all publications are solely those of the individual author(s) and contributor(s) and not of MDPI and/or the editor(s). MDPI and/or the editor(s) disclaim responsibility for any injury to people or property resulting from any ideas, methods, instructions or products referred to in the content. |
© 2026 by the authors. Licensee MDPI, Basel, Switzerland. This article is an open access article distributed under the terms and conditions of the Creative Commons Attribution (CC BY) license (http://creativecommons.org/licenses/by/4.0/).
Copyright: This open access article is published under a Creative Commons CC BY 4.0 license, which permit the free download, distribution, and reuse, provided that the author and preprint are cited in any reuse.