

Submitted:
18 October 2026
Posted:
20 October 2026
You are already at the latest version
Abstract
Autoencoders are widely adopted for feature extraction in security applications, yet we show that their compression objective is structurally incompatible with rare-event detection. In insider threat environments where malicious records constitute less than 5% of observations [31, 4], bottleneck compression suppresses the very behavioral deviations that distinguish insiders from normal users. We formalise this failure mode as the Recall-Compression Paradox: a monotonic degradation in minority-class recall as latent dimensionality decreases. On the Insider Threat Dataset for Classified Environments [1], our best autoencoder configuration (d=24) achieved a recall of only 0.7200, compared to 0.8964 for Extreme Gradient Boosting (XGBoost) under identical cross-validation conditions. This is not a tuning problem. It is an architectural failure.
Keywords:
anomaly detection
; autoencoder
; class imbalance
; cybersecurity
; explainable artificial intelligence (XAI)
; insider threat detection
; machine learning
; model interpretability
; SHapley Additive exPlanations (SHAP)
; XGBoost
1. Introduction
Autoencoders are among the most popular unsupervised architectures in machine learning, and their application to cybersecurity problems has grown rapidly over the past five years. The premise is appealing: compress high-dimensional behavioral logs into a compact latent representation, then classify from the compressed space. But what happens when the events you most need to detect are the ones the autoencoder is least motivated to preserve? In insider threat detection, malicious records are rare — often below 5% of total observations [4,31]. An autoencoder trained to minimize reconstruction error will optimize for the majority class, treating the subtle behavioral deviations of insiders as noise to be smoothed away. We call this the Recall-Compression Paradox, and in this paper, we provide the first formal empirical evidence of its existence.
Empirical studies from the CERT Insider Threat Center at Carnegie Mellon University show that insider incidents frequently involve intellectual property theft, fraud, system sabotage, and data exfiltration [13,31]. Unlike traditional cyberattacks that exploit technical vulnerabilities, insider threats leverage institutional trust, contextual knowledge, and valid credentials [2]. Detection mechanisms therefore increasingly rely on behavioral analytics derived from enterprise logs, file access histories, authentication records, email metadata, and user activity monitoring systems [16,32]. These behavioral datasets are what machine learning models actually train on for insider threat detection.
Despite their importance, insider threat behavioral datasets present two persistent methodological challenges: extreme class imbalance and noise. First, malicious insider events are rare: in operational environments, malicious records often account for less than 5% of total observations [4,31]. Conventional supervised learning algorithms optimize global accuracy and, in highly skewed datasets, favor majority-class predictions while underperforming on minority (malicious) cases. [3] demonstrated that skewed distributions degrade minority-class recall and produce misleading accuracy metrics. [4] argued that specialized sampling strategies and evaluation metrics are essential in rare-event domains. In insider threat detection, missing a malicious insider can lead to financial losses running into millions of dollars, operational shutdowns, and regulatory sanctions [15].
Second, insider behavioral data is noisy and heterogeneous. Noise stems from inconsistent logging mechanisms, missing or corrupted values, duplicated entries, timestamp misalignment, and the integration of heterogeneous data streams. Legitimate user behavior also varies across roles, departments, and temporal cycles, which increases intra-class variability and complicates anomaly detection [5]. Without disciplined preprocessing, machine learning models risk overfitting to spurious correlations rather than identifying genuine behavioral deviations [6]. High-dimensional feature spaces compound the problem by obscuring discriminative patterns [7].
Although anomaly detection and predictive modeling have advanced considerably, preprocessing remains underexplored in insider threat research. Many studies prioritize classifier development (support vector machines, ensemble models, or deep neural networks) while applying off-the-shelf preprocessing [48]. This limits reproducibility and weakens detection robustness [27]. Separately, the opacity of high-performance classifiers blocks operational deployment: security analysts need interpretable justifications for automated alerts before launching investigations that can end careers, trigger lawsuits, or expose the organization to regulatory penalties. Explainable Artificial Intelligence (AI) methods, particularly SHapley Additive exPlanations (SHAP) [40] and Local Interpretable Model-Agnostic Explanations (LIME) [8], have emerged as essential complements to predictive models, yet their joint integration within insider threat detection pipelines remains rare [24,48].
Regulatory frameworks reinforce this need. The European Union General Data Protection Regulation (GDPR) Article 22 establishes that data subjects have the right not to be subject to decisions based solely on automated processing unless meaningful information about the logic involved is provided [45,47]. In insider threat detection, where an automated alert can trigger a disciplinary investigation or a termination, compliance with this transparency requirement is both a legal obligation and an ethical imperative.
To investigate this paradox and its implications, we built a five-stage preprocessing pipeline and an interpretable Insider Threat Detection Model (ITDM) applied to the Insider Threat Dataset for Classified Environments [1]: 299,880 behavioral records, 47 features, 95:5 class imbalance. We trained four architectures — Random Forest [9], XGBoost [38], a standard Multilayer Perceptron (MLP), and an Autoencoder-enhanced MLP (AE-MLP) — under identical conditions and evaluated them with five-fold stratified cross-validation, pairwise Wilcoxon signed-rank tests, and a four-configuration ablation study varying the autoencoder bottleneck from d=8 to d=32. We then applied dual SHAP-LIME explainability across all four architectures to determine whether the models that detect best also explain best. The results tell a clear story: XGBoost dominates (Receiver Operating Characteristic Area Under Curve, ROC-AUC = 0.9691), the AE-MLP fails (recall 0.6288, a 30% deficit), and resource-usage intensity outpredicts access timing as the dominant behavioral risk signal.
A preliminary comparative evaluation of these four architectures on the same dataset was reported in [10], which established the baseline performance hierarchy using a single train-test split and SHAP analysis of the best-performing model. Our present study extends that work with five-fold cross-validation, statistical significance testing, a formal ablation study, dual SHAP-LIME explainability across all four architectures, and the formalisation of the Recall-Compression Paradox.
The principal contributions of this study are:
(i) A five-stage preprocessing pipeline that transforms a severely imbalanced insider threat dataset (299,880 records, 95:5 ratio) into a balanced, model-ready format (29,880 records, 1:1 ratio) without synthetic oversampling.
(ii) The Recall-Compression Paradox: empirical evidence, supported by a four-configuration ablation study, that autoencoder bottleneck compression degrades minority-class recall along a continuous gradient, with recall declining from 0.7200 (d=24) to 0.6529 (d=8).
(iii) A dual explainability analysis using SHAP and LIME across all four architectures, revealing that resource-usage intensity (file burning, printing frequency) outpredicts temporal access patterns for insider threat detection.
(iv) A method-independent Insider Threat Detection Model (ITDM) formalised as the tuple T = (D, f, e, t), which separates the classification function from the explanation operator so that either component can be replaced independently.
2. Literature Review
Insider threat detection has emerged as a critical domain within cybersecurity due to the growing recognition that trusted individuals (employees, contractors, or partners) can cause significant organizational harm. Unlike external attackers, insiders operate with legitimate credentials and contextual system knowledge, rendering their malicious activities difficult to distinguish from routine operations. Early conceptual work by [11] categorized insider threats and emphasized the behavioral nature of such risks. Subsequent empirical research from the CERT Insider Threat Center demonstrated that insider incidents frequently involve intellectual property theft, fraud, sabotage, and data exfiltration [2,31]. An extensive survey by [12] extended this taxonomy by mapping insider threats across motivations, attack methods, and organizational impact, while [49] identified recurring attack patterns characteristic of insider behavior, establishing a widely referenced classification framework. [13] further provided practical operational guidance through the CERT Common Sense Guide to Mitigating Insider Threats.
A central challenge identified in the literature is extreme class imbalance. In insider threat datasets, malicious events typically constitute less than 5% of total observations. Conventional machine learning algorithms, which optimize overall accuracy, tend to bias predictions toward the majority (benign) class. Foundational work by [3] introduced SMOTE (Synthetic Minority Over-Sampling Technique) to address this issue by generating synthetic minority samples. [4] provided a extensive review of imbalanced learning strategies, highlighting the need for specialized evaluation metrics such as F1-score and precision-recall curves in rare-event detection contexts. However, SMOTE and its variants can introduce synthetic artefacts that distort the behavioral distributions of minority-class instances [14]. Random undersampling, while discarding majority-class instances, avoids such distributional distortion and has been shown to be effective when the minority class is sufficiently represented [34]. Al-[15] demonstrated the effectiveness of one-hot encoding combined with synthetic sampling for insider data leakage detection, though their approach relied on SMOTE rather than undersampling.
Feature engineering has been widely recognized as a critical component of insider threat analytics. Temporal aggregation features, including activity frequency, deviation from baseline behavior, and session duration, enhance anomaly detection accuracy [16]. Contextual modeling approaches that incorporate metadata such as job roles and access privileges further improve detection [17]. Graph-based methods illustrate how relational patterns among users, devices, and files can uncover hidden threat structures [42]. However, aggressive feature transformation through unsupervised methods such as autoencoders can compress the very low-variance signals that characterize rare malicious behaviours—a risk that has received insufficient attention in the literature. [18] demonstrated the power of autoencoders for dimensionality reduction, but their work focused on reconstruction fidelity rather than the preservation of minority-class discriminative signals.
The application of ensemble machine learning models to insider threat detection has progressed very rapidly. Early ensemble approaches using Random Forests [9] demonstrated robust performance on structured behavioral data through bootstrap aggregation and random feature subspace selection. Gradient boosting frameworks, particularly XGBoost [38], improved upon bagging-based ensembles through sequential error correction and regularization. [19] proposed a parallel and scalable framework for insider threat detection using distributed ensemble methods. Deep learning architectures have also been explored: [20] applied adversarial training for robust insider threat detection, while [21] developed a deep synthesis-based insider intrusion detection model. [22] demonstrated that supervised machine learning techniques could effectively handle insider threat classification when combined with appropriate feature selection. However, a systematic comparison of ensemble and deep learning approaches on identical insider threat data, controlling for preprocessing and explainability, remains rare.
The opacity of high-performance classifiers has driven growing interest in Explainable AI for security applications. SHAP [40] assigns each feature a contribution score grounded in cooperative game theory, ensuring consistency, efficiency, and symmetry in feature attribution. LIME [8] generates instance-level explanations by training interpretable surrogate models in the local neighbourhood of individual predictions. While both techniques have been applied independently in cybersecurity contexts, their joint application to insider threat detection across both ensemble and deep learning architectures remains rare. Arul [23] recently demonstrated the value of Explainable Artificial Intelligence (XAI) for balancing security and transparency in cloud-based insider threat detection. [24] and [25] provided extensive reviews of XAI methods, identifying trust, fairness, and auditability as critical dimensions for security-critical deployments. Amiri-[26] explored federated and explainable approaches for IoT-based threat detection. A recent systematic review by [27] confirmed that class imbalance and limited labeled data remain critical barriers, and identified XAI as an underexplored dimension in insider threat research. [28] further cautioned that standard SHAP interpretations of tree-based models require careful validation to avoid misleading feature importance conclusions. However, [29] demonstrated that XAI transparency itself can be exploited: their study showed how an insider with access to training data can use SHAP-derived feature attributions to craft targeted backdoor triggers that evade adversarially trained deep learning models, highlighting the dual-edged nature of model interpretability in security contexts.
Despite advances in sampling methods, anomaly detection algorithms, and behavioral modeling, the literature reveals a notable gap: preprocessing is often treated as a secondary step rather than a core analytical component. Many studies focus primarily on classifier optimisation while applying generic or minimal preprocessing procedures. Most existing frameworks tightly couple detection algorithms to specific explainability techniques, constraining extensibility and reproducibility. There remains a clear need for a unified preprocessing pipeline combined with a method-independent detection and interpretation framework that systematically integrates normalization, class balancing, feature engineering, and dual explainability within a single architecture. This study addresses that need by developing and evaluating such a framework on a large-scale insider threat dataset.
3. Materials and Methods
A. Research Design
We adopted a quantitative experimental design. We developed, trained, tested, and compared four architectures (Random Forest [9], XGBoost [38], MLP, and AE-MLP) under controlled computational conditions. User behaviours were represented as numerical feature vectors, and we measured effectiveness using accuracy, precision, recall, F1-score, and ROC-AUC. We also applied SHAP [40] and LIME [8] to convert opaque model decisions into quantifiable feature-level explanations. The evaluation logic follows [7] and [30]: classification systems are judged on their ability to learn discriminative boundaries from labeled training data.
B. Dataset Description
We utilized the Insider Threat Dataset for Classified Environments [1], a publicly available repository sourced from the Kaggle platform. The dataset comprised 299,880 behavioral records with 47 feature columns and a binary target label (is_emp_malicious) distinguishing malicious from non-malicious employee activities. Of the total records, 284,940 instances (approximately 95.02%) were labeled as non-malicious, and 14,940 instances (approximately 4.98%) were labeled as malicious, reflecting the rarity of insider threat events in operational environments [31]. Key attribute categories included: (i) employee demographic and organizational attributes such as department, campus, position, seniority, classification, contractor status, and country of origin; (ii) behavioral activity metrics including print command counts, printed page volumes, off-hours printing, removable media usage, and data burn volumes; (iii) physical access and presence features such as facility entry and exit counts, total presence duration, early entry and late exit flags, weekend access, and night-time entry indicators; and (iv) risk-related contextual indicators including foreign travel flags, hostile country indicators, and travel risk levels. This heterogeneous feature composition aligns with the multi-dimensional behavioral profiling approach advocated by [16] and [32].
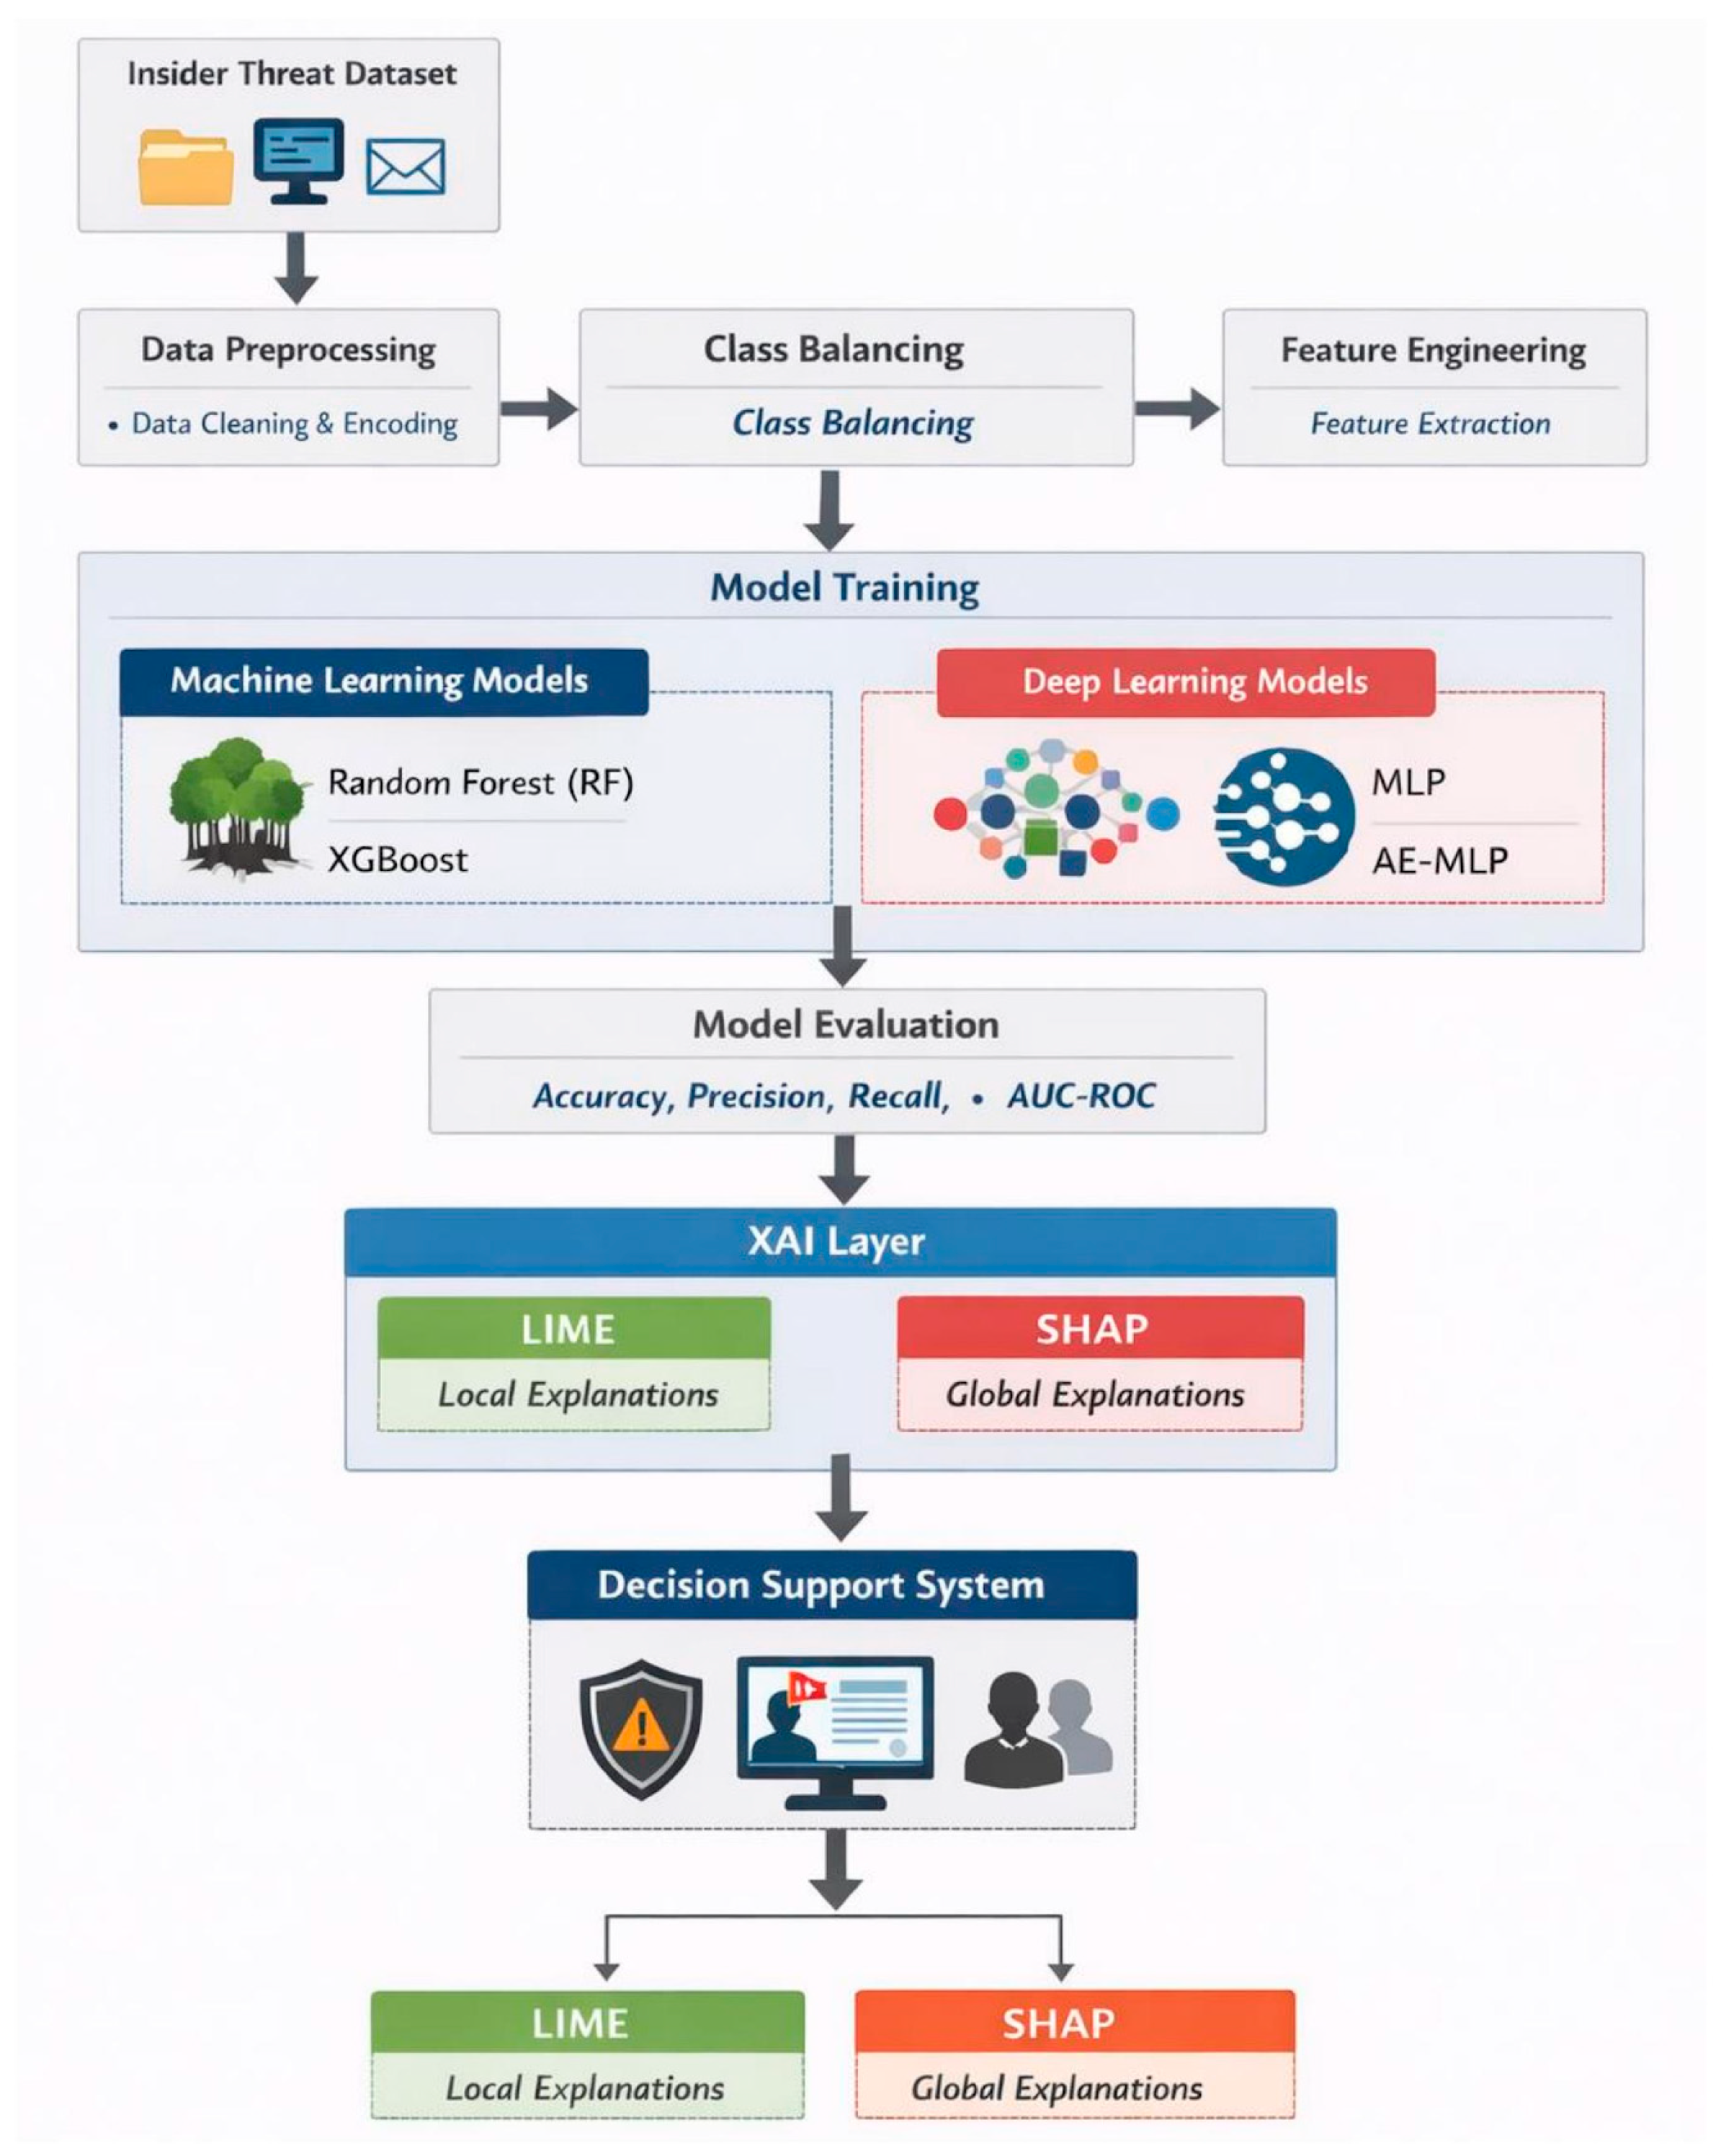
Figure 1.
Architectural Design of the Explainable AI Framework for Insider Threat Detection.
C. Data Preprocessing Pipeline
We implemented a five-stage preprocessing pipeline, informed by best practices in data mining [5] and cybersecurity data preprocessing [6]. The pipeline transformed the raw 299,880-record dataset into a structured format suitable for insider threat classification. Each stage is described below.
3.3.1. Data Selection Criteria
In accordance with the first stage of the preprocessing workflow, the initial phase focused on defining data selection criteria to ensure the structural integrity of the feature space. This involved retaining attributes that contribute meaningful behavioral or contextual information relevant to insider threat detection, while systematically removing non-informative data points. Specifically, features such as employee_id and date were removed to prevent model memorisation of individual identities, ensuring that the ITDM learned generalized behavioral patterns rather than user-specific aliases. In addition, columns characterized by extreme sparsity or those that could lead to target leakage, such as trip_day_number and country_name, were removed to improve the overall signal-to-noise ratio of the dataset. This selection process reduced the feature space to attributes that directly encode behavioral, access, and contextual characteristics of employee activity.
3.3.2. Data Cleaning and Normalization
After data selection, we cleaned the data to enforce structural uniformity across the heterogeneous feature set. We mapped binary Boolean attributes to the integer set {0, 1}. To enable non-ordinal categorical variables to be processed by both tree-based ensembles and neural networks, we applied one-hot encoding, expanding attributes such as employee_classification into binary indicator columns, following the encoding strategy of Al-[15]. This expansion produced a final dimensionality of 44 model-ready input features from the original 47 raw columns.
To achieve numerical stability and ensure the rapid convergence of the Multilayer Perceptron (MLP) and Autoencoder-enhanced MLP (AE-MLP) models, all continuous features were scaled to a restricted range using Min-Max Normalization. This transformation prevented features with larger absolute magnitudes (for instance; total_presence_minutes) from disproportionately influencing the gradient descent process relative to smaller-scale behavioral flags [33]. The [0, 1] bounded range was selected to ensure compatibility with the sigmoid activation functions in the MLP output layer and to maintain consistent gradient magnitudes across all features during backpropagation. The normalization procedure was mathematically defined as:
X′ = (X − X_min) / (X_max − X_min). (1)
where X is the original feature value, and X_min and X_max represent the minimum and maximum values within the feature’s distribution, respectively. While tree-based models (Random Forest and XGBoost) are invariant to monotonic feature transformations, normalization was applied uniformly across all architectures to maintain a consistent experimental protocol and to enable fair cross-model comparison.

Table 1.
Descriptive Statistics of Key Behavioral Features Before Normalization.
| Feature Name | Min | Max | Mean | Standard Deviation |
| total_presence_minutes | 0 | 1440 | 480.2 | 120.5 |
| num_bw_prints | 0 | 500 | 12.4 | 45.1 |
| total_files_burned | 0 | 1000 | 2.1 | 18.7 |
| num_print_commands | 0 | 250 | 8.3 | 14.2 |
3.3.3. Handling Missing Values
We addressed missing values using feature-specific strategies informed by the semantic meaning of each attribute, rather than applying a single global imputation method. For time-related features such as first entry and last exit times, raw timestamps were transformed into numerical representations (minutes since midnight) and imputed using group-based median values derived from employees sharing similar organizational roles. This role-aware imputation strategy preserved behavioral realism by anchoring imputed values to the activity patterns of comparable employees, which minimized the distortion introduced by global mean or mode imputation [5].
Table 2.
Summary of Missing Value Frequencies and Handling Strategies.
| Feature Name | Missing (%) | Handling Strategy | Justification |
| first_entry_time | 5.2% | Group-based Median | Preserves role-based behavioural realism |
| last_exit_time | 4.8% | Group-based Median | Anchored to activity patterns of comparable roles |
| trip_day_number | 82.4% | Feature Removal | High sparsity and risk of target leakage |
| country_name | 76.1% | Feature Removal | High sparsity; limited relevance to detection task |
Attributes with excessive sparsity (i.e., a high proportion of missing values across records) and limited relevance to the detection task were removed entirely, ensuring that retained features contributed consistently and meaningfully across all records. Our selective removal reduced noise in the feature space without sacrificing discriminative information.
3.3.4. Feature Extraction and Transformation
Several features were transformed to enhance interpretability and model performance. Temporal attributes were converted into numerical representations, and derived indicators, including off-hours activity ratios, off-hours printing flags, and access timing indicators (early entry, late exit, weekend entry, night-time entry), we retained to capture behavioral deviations from normative work patterns. These derived features served as proxies for anomalous temporal behavior without requiring raw event-log reconstruction.
Table 3.
Mapping of Raw Behavioral Logs to Derived/Transformed Features.
| Raw Source Feature | Derived / Transformed Feature | Analytical Purpose |
| first_entry_time | early_entry_flag | Captures deviations from normative arrival times. |
| last_exit_time | late_exit_flag | Identifies unusual presence duration. |
| print_timestamp | off_hours_printing_flag | Detects high-risk data exfiltration during unsupervised hours. |
| total_presence_minutes | presence_duration_zscore | Normalizes daily presence relative to organizational norms. |
| employee_classification | one_hot_security_tier | Enables models to learn risk profiles across security tiers. |
We expanded categorical variables representing organizational structure and location were expanded into binary indicator variables via one-hot encoding, enabling models to learn complex interactions between role-based context and behavioral activity [17]. For instance, the employee_classification attribute, which encodes security clearance levels, was expanded to allow the models to capture differential risk profiles across classification tiers, a relationship that proved significant in subsequent SHAP analyses (Section IV-C).
3.3.5. Temporal Windowing and Sessionization
Although the dataset was provided in an aggregated format rather than raw event logs, temporal characteristics were implicitly represented through summary indicators such as total presence duration, night-time access flags, early entry and late exit indicators, and weekend activity markers. These features collectively approximate temporal windowing by capturing deviations across typical workday boundaries. Specifically, the combination of first_entry_time, last_exit_time, total_presence_minutes, and the binary flags for early entry, late exit, weekend access, and night entry enabled the models to profile each employee’s temporal access behavior relative to organizational norms. This representation supports behavioral profiling without the computational overhead associated with raw log sessionization, while still preserving temporal relevance for insider threat detection [16]. The retention of these temporal proxies was validated by the subsequent SHAP analysis, which confirmed that while temporal features contributed to model predictions, they were consistently subordinate to resource-usage intensity features in predictive importance.
3.3.6. Addressing Class Imbalance
The dataset exhibited a substantial class imbalance between malicious and non-malicious employee records. Of the original 299,880 records, 284,940 instances (approximately 95.02%) were labeled as non-malicious, and 14,940 instances (approximately 4.98%) were labeled as malicious. This 19:1 imbalance ratio is characteristic of real-world insider threat scenarios, where malicious events are inherently rare relative to routine organizational activity [4,31].
We undersampled the majority class using random selection, following [34], who showed that undersampling avoids the synthetic distributional artefacts introduced by oversampling techniques such as SMOTE [3]. We retained all 14,940 malicious instances and drew a random subset of 14,940 non-malicious instances without replacement, producing a balanced 1:1 class distribution. A fixed random seed ensured full reproducibility. Table 4 summarises the class distribution before and after preprocessing.
By retaining every malicious record (every sabotage, leak, and exfiltration pattern in the dataset), the balanced set preserved the full range of genuine threat behaviours, unlike SMOTE, which risks generating synthetic minority instances that do not correspond to real insider behavior [14]. The resulting 29,880-record dataset allowed performance metrics to reflect actual detection capability rather than inflated accuracy from majority-class prediction bias. We then partitioned this dataset using an 80:20 stratified split, yielding 23,904 training records and 5,976 test records, with the class distribution preserved in both partitions.
D. Classification Architectures
Four classification architectures were developed and trained on our balanced dataset using an 80:20 stratified train-test split. Hyperparameter optimisation was conducted using GridSearchCV on the training set exclusively, following established machine learning experimental protocols [35].
Random Forest (RF): An ensemble of decision trees based on bootstrap aggregation and random subspace selection [9]. The hyperparameter search covered the number of estimators (100, 200), maximum depth (None, 20), minimum samples split (2, 5), minimum samples leaf (1, 2), and maximum features (sqrt). Bootstrap aggregation and random feature selection contributed to variance reduction and stable ensemble behavior across cross-validation folds.
Extreme Gradient Boosting (XGBoost): A gradient boosting framework with sequential tree addition and built-in regularization [38]. The search space included the number of estimators (100, 200, 300), maximum depth (3, 5, 7), learning rate (0.01, 0.1, 0.2), subsampling ratio (0.8, 1.0), column sampling ratio (0.8, 1.0), and gamma regularization (0, 0.1, 0.2). Lower learning rates required more boosting rounds to converge, while gamma controlled tree complexity.
Multilayer Perceptron (MLP): A feedforward neural network optimized with the Adam optimiser [39] at a learning rate of 0.001, binary cross-entropy loss, ReLU activation in hidden layers, sigmoid output activation, dropout regularization (p = 0.2), and early stopping with a maximum of 50 epochs [33]. Hidden layer configurations of 64 and 128 neurons were evaluated.
Autoencoder-Enhanced MLP (AE-MLP): A two-stage hybrid architecture combining unsupervised representation learning with supervised classification. In Stage 1, an autoencoder with symmetric encoding and decoding layers and a 16-neuron latent bottleneck (compression ratio approximately 1:3 relative to the 44 input dimensions after one-hot encoding) was trained to minimize mean squared error reconstruction loss [18]. In Stage 2, the encoder output was fed into an MLP classifier identical in structure to the standalone MLP. Both stages used the Adam optimiser (learning rate 0.001), dropout (p = 0.2), and early stopping. The aggressive compression ratio was a deliberate architectural choice to test whether latent feature extraction could enhance detection sensitivity. The results ultimately challenged that hypothesis the results ultimately challenged.
E. Model Interpretability Framework and ITDM Formalisation
We designed the ITDM so that neither the choice of classifier nor the choice of explanation method alters the underlying mathematical structure. This means a practitioner can swap Random Forest for XGBoost, or replace SHAP with a future explanation technique, without rewriting the framework. The formulation follows [7] and [30].
Mathematical Formulation of the ITDM. Let the insider threat dataset be defined as:
D = {(xᵢ, yᵢ)}ᴺᵢ₌₁. (2)
where xᵢ ∈ ℝᵈ represents a d-dimensional feature vector describing the behavioral, access, and contextual characteristics of employee i, and
yᵢ ∈ {0, 1} denotes the ground-truth class label, with yᵢ = 0 indicating non-malicious behavior and yᵢ = 1 indicating malicious insider activity.
The ITDM learns a decision function:
f* = arg min Σᴺᵢ₌₁ (f(xᵢ), yᵢ). (3)
f∈
• where is a hypothesis space of measurable functions,
• f: ℝᵈ → [0, 1] maps input features to a maliciousness score, and
• : [0,1] × {0,1} → ℝ is a generic loss function suitable for binary classification.
This formulation does not impose any structural assumptions on f, allowing f to be realised by any supervised learning, whether Random Forest [9], XGBoost [38], MLP, or AE-MLP. A binary decision is obtained via a decision threshold τ:
ŷᵢ = 1 if f(xᵢ) ≥ τ, and ŷᵢ = 0 otherwise. (4)
Separation of Detection and Explanation. To ensure transparency and accountability, the ITDM explicitly separates prediction from explanation. We define the explanation component independently of the predictive function and operates as a post-hoc interpretability mapping. Let ε denote a family of explanation operators such that:
ε: →(ℝᵈ→ ℝᵈ). (5)
For a given input xᵢ and trained model f, the explanation function produces a relevance vector:
rᵢ= ε(f)(xᵢ)∈ ℝᵈ. (6)
where rᵢⱼ quantifies the contribution or influence of each feature j in producing the prediction f(xᵢ). Our abstraction allows any explanation method, whether local or global, additive or non-additive, to be instantiated within ε without modifying the detection model. In this study, ε is realised through SHAP [40] and LIME [8].
Local and Global Interpretability. Our ITDM supports both local and global explanations through the same abstract mapping:
Local explanation: rᵢˡᵒᶜᵃˡ =ε(f)(xᵢ). (7)
Global explanation: Rᵍˡᵒᵇᵃˡ = (1/N)Σᴺᵢ₌₁ε(f)(xᵢ). (8)
This formulation ensures that explanations for individual insider events and aggregate behavioral trends are derived consistently within a unified framework.
Unified Detection–Interpretation Model. We therefore define the complete ITDM as the ordered tuple:
Τ = (D, f, ε, τ). (9)
• where D is the preprocessed dataset,
• f is the learned decision function,
• ε is the explanation operator, and
• τ is the decision threshold.
This formulation guarantees that insider threat detection and interpretability remain independent but compatible, ensuring that the proposed model is robust to methodological changes while maintaining theoretical consistency. The decision threshold τ was set at the default value of 0.5 for binary classification across all models, ensuring a uniform basis for performance comparison. The architectural separation satisfies the transparency requirements established under GDPR Article 22, which mandates meaningful information about the logic involved in automated decision-making [45,47].
Integration of SHAP and LIME within the MIF. A Model Interpretability Framework (MIF) was integrated as a modular post-hoc layer within the detection pipeline, positioned after model inference and before the decision support output. SHAP (SHapley Additive exPlanations) was applied to generate global feature attribution analyses across the entire validation set, quantifying each feature’s contribution to model output based on Shapley values from cooperative game theory [40]. For a predictive model f with N input features, the Shapley value contribution of feature i was computed using the marginal contribution formulation that satisfies the axioms of efficiency, symmetry, and additivity—ensuring mathematically consistent and fair feature attributions [28]. LIME (Local Interpretable Model-agnostic Explanations) was applied to generate instance-level explanations by training interpretable surrogate models in the local neighbourhood of individual predictions flagged as high-risk [8,41]. Both techniques were applied to all four architectures, ensuring consistent interpretability across ensemble and deep learning models. This dual-technique approach addresses the complementary strengths identified by [24]: SHAP provides theoretically grounded global attribution while LIME provides intuitive local rationale.
F. Evaluation Metrics and Implementation
Model performance was evaluated on the held-out 20% test set using five classification metrics: accuracy, precision, recall, F1-score, and ROC-AUC. We selected these metrics to provide a thorough assessment of both overall discriminatory capability and minority-class detection sensitivity, which is critical in the highly imbalanced insider threat domain [4]. Recall was given particular interpretive weight because, in security-critical environments, failing to detect a malicious insider (false negative) carries substantially greater operational cost than generating a false positive [15].
To ensure that the reported performance differences were not artefacts of a single data partition, five-fold stratified cross-validation was implemented across all four architectures. Stratified splitting preserved the class distribution in each fold, ensuring that both malicious and non-malicious instances were proportionally represented during each training and evaluation cycle. Performance metrics were computed independently for each fold and reported as mean ± standard deviation, providing a measure of model stability and generalisation consistency across different data partitions.
The performance gaps are statistically real, statistical significance of inter-model performance differences was assessed using the Wilcoxon signed-rank test, a non-parametric test appropriate for comparing paired samples from repeated measures without distributional assumptions. Pairwise comparisons were conducted for all six model pairs across both ROC-AUC and F1-score at a significance level of α = 0.05. This testing protocol ensures that the observed performance hierarchy (XGBoost > Random Forest > MLP > AE-MLP) is statistically grounded rather than attributable to random variation.
An ablation study was also conducted on the AE-MLP architecture to characterize the relationship between bottleneck dimensionality and detection performance. The autoencoder’s latent space size was systematically varied across four configurations (8, 16, 24, and 32 neurons), representing compression ratios of approximately 1:5.5, 1:2.75, 1:1.8, and 1:1.4 respectively relative to the 44 input features. Each configuration was evaluated using the same five-fold cross-validation protocol. This ablation design directly addresses the Recall-Compression Paradox by identifying the dimensionality threshold at which autoencoder compression begins to degrade minority-class recall.
All experiments were implemented in Python using scikit-learn for preprocessing and ensemble models, XGBoost via its Python API, and TensorFlow for neural network architectures (MLP and AE-MLP). The computational environment maintained strict reproducibility through fixed random seeds (random_state=42) and standardised evaluation protocols.
4. Results and Discussion
A. Dataset Preprocessing Outcomes
The five-stage preprocessing pipeline described in Section III-C was applied to the raw 299,880-record dataset. The data selection stage removed non-informative and leakage-prone features (employee_id, date, trip_day_number, country_name), reducing the raw feature space while preserving all behavioral, access, and contextual attributes relevant to insider threat detection.
During data cleaning and normalization, binary Boolean attributes were mapped to integers, and non-ordinal categorical variables were expanded via one-hot encoding, resulting in a final feature dimensionality of 44 model-ready input features. Min-Max normalization scaled all continuous features to the [0, 1] range. The missing value treatment stage imputed time-related features using role-based median values, preserving behavioral realism across organizational subgroups. No records were discarded due to missing values; instead, features with excessive sparsity were excluded at the data selection stage.
The class balancing stage transformed the original 95:5 imbalance (284,940 non-malicious vs 14,940 malicious) into a balanced 1:1 distribution through random undersampling, yielding a final dataset of 29,880 records (14,940 per class). All malicious records were retained in their entirety, ensuring that no genuine insider threat behavior was lost. The 80:20 stratified split produced 23,904 training records and 5,976 test records, with class proportions preserved in both partitions.
Collectively, the preprocessing pipeline addressed the two foundational challenges identified in the literature: the severe class imbalance was corrected to enable unbiased supervised learning, and heterogeneous feature scales were harmonised to support stable convergence across both ensemble and neural network architectures. The retention of all malicious instances, combined with the removal of identifier features, ensured that subsequent models learned from behavioral patterns rather than organizational labels—a design choice that directly supported the interpretability of SHAP and LIME explanations presented in Section IV-C. Table 6 presents the comparative diagnostic performance of all four models on our held-out test set.
Table 5.
Preprocessing Pipeline Impact Summary.
| Pipeline Stage | Input Records × Features | Output Records × Features | Transformation Applied | Quantitative Impact |
| Raw Dataset | N/A | 299,880 × 48 | Acquisition from Kaggle (Bdil, 2025) | 95.02% non-malicious; 4.98% malicious |
| Data Selection | 299,880 × 48 | 299,880 × 44 | Removed employee_id, date, trip_day_number, country_name, sparse columns | 4 leakage/identity features eliminated |
| Data Cleaning & Encoding | 299,880 × 44 | 299,880 × 44 | Boolean mapping {0,1}; one-hot encoding of categoricals | Feature space restructured for ML/DL input |
| Normalisation | 299,880 × 44 | 299,880 × 44 | Min-Max scaling to [0, 1] | All features bounded; gradient stability ensured |
| Missing Value Treatment | 299,880 × 44 | 299,880 × 44 | Role-based median imputation for temporal features | Zero missing values; behavioural realism preserved |
| Class Balancing | 299,880 × 44 | 29,880 × 44 | Random undersampling of majority class | 1:1 class ratio; all 14,940 malicious records retained |
| Train-Test Split | 29,880 × 44 | 23,904 + 5,976 | 80:20 stratified split | Class proportions preserved in both partitions |
Table 6.
Comparative Diagnostic Performance of Machine Learning (ML) / Deep Learning (DL) Models on Held-Out Test Set.
Table 6.
Comparative Diagnostic Performance of Machine Learning (ML) / Deep Learning (DL) Models on Held-Out Test Set.
| Architecture | Model | Accuracy | Precision | Recall | F1-Score | ROC-AUC |
| Machine Learning | XGBoost | 0.8944 | 0.8888 | 0.9016 | 0.8952 | 0.9691 |
| Machine Learning | Random Forest | 0.8638 | 0.8715 | 0.8534 | 0.8624 | 0.9458 |
| Deep Learning | MLP | 0.8293 | 0.8610 | 0.7855 | 0.8215 | 0.9198 |
| Deep Learning | AE-MLP | 0.7751 | 0.8888 | 0.6288 | 0.7366 | 0.8677 |
Table 5 summarises the quantitative transformation applied at each stage of the preprocessing pipeline. Three aspects warrant particular attention. First, the data selection stage eliminated four features that could introduce identity memorisation or target leakage, reducing the raw 48-column feature space to 44 behaviourally meaningful input dimensions. This pruning was essential to ensure that subsequent models learned generalized behavioral patterns rather than user-specific aliases. This was a prerequisite for the SHAP and LIME explanations to reference operationally meaningful features. Second, the normalization stage harmonised heterogeneous feature scales to the [0, 1] range, which proved critical for the convergence of both the MLP and AE-MLP architectures; without this transformation, features with large magnitudes (e.g., total_presence_minutes) would have dominated the gradient descent process. Third, the class balancing stage reduced the dataset from 299,880 to 29,880 records while retaining all malicious instances, transforming a 19:1 imbalance into a 1:1 distribution that enabled the models to learn discriminative behavioral patterns associated with insider threats rather than defaulting to majority-class prediction.
B. Comparative Model Performance
XGBoost achieved the highest overall performance across all metrics, with an accuracy of 0.8944, precision of 0.8888, recall of 0.9016, F1-score of 0.8952, and ROC-AUC of 0.9691. This indicated that XGBoost was highly effective at correctly identifying both malicious and non-malicious employees, maintaining a strong balance between sensitivity and specificity. The gradient boosting framework’s sequential error correction mechanism and L1/L2 regularization parameters [38] contributed to robust generalisation on our held-out test set.
Random Forest exhibited the second-strongest performance, with accuracy of 0.8638, precision of 0.8715, recall of 0.8534, F1-score of 0.8624, and ROC-AUC of 0.9458. While marginally below XGBoost, Random Forest maintained consistent balance between precision and recall, confirming the reliability of bagging-based ensemble learning [9] for structured behavioral data.
The MLP achieved moderate performance (accuracy 0.8293, precision 0.8610, recall 0.7855, F1-score 0.8215, ROC-AUC 0.9198). While maintaining relatively high precision, its lower recall indicated that purely feedforward neural networks missed a higher proportion of malicious cases compared to ensemble methods, suggesting reduced sensitivity to the subtle behavioral patterns characterising insider threats in structured tabular data.
The AE-MLP exhibited the lowest overall metrics (accuracy 0.7751, precision 0.8888, recall 0.6288, F1-score 0.7366, ROC-AUC 0.8677). Despite maintaining high precision, the autoencoder bottleneck compressed the feature space in a manner that favored dominant patterns of normal user behavior while discarding the subtle signals associated with malicious insider activity. The AE-MLP’s recall of 0.6288 was 32% lower than XGBoost’s recall of 0.9016, indicating that the model missed approximately one-third of malicious cases. This trade-off between dimensionality reduction and minority-class sensitivity is formalised in this study as the Recall-Compression Paradox.
The Recall-Compression Paradox describes a structural failure mode in which aggressive unsupervised feature compression (compression ratio 1:3, from 44 input dimensions to a 16-neuron latent space) systematically filters out the rare, high-variance behavioral signals required for accurate insider threat detection. While autoencoders are designed to learn efficient representations by minimizing reconstruction error [18], this objective function inherently prioritises the reconstruction of majority-class patterns (which dominate the loss landscape) at the expense of minority-class signatures that are statistically rare but operationally critical. This finding extends the dimensionality reduction cautions articulated in the deep learning literature [33] to the specific domain of security-critical rare-event detection.
How do the models differ in their error profiles? Table 7 presents the confusion matrices derived from our held-out test set (5,976 records: 2,988 malicious, 2,988 non-malicious). The confusion matrix decomposition reveals the operational consequences of each model’s predictive behavior with greater granularity than aggregate metrics alone. XGBoost correctly identified 2,694 of 2,988 malicious instances (TP) while producing only 337 false positives and 294 false negatives, demonstrating the most balanced error distribution among all architectures. Random Forest produced a comparable false positive count (376) but missed 438 malicious instances, reflecting its marginally lower recall.
The critical distinction emerges in the deep learning architectures. While the MLP’s 641 false negatives represent a moderate increase over ensemble methods, the AE-MLP’s 1,109 false negatives (nearly one-third of all malicious instances in the test set) constitute a substantive operational liability. The AE-MLP achieved the lowest false positive count (308), indicating that its autoencoder bottleneck produced a highly conservative classification boundary: instances classified as malicious were likely to be genuinely malicious (high precision), but a large proportion of actual malicious instances were misclassified as benign (low recall). This asymmetric error pattern directly instantiates the Recall-Compression Paradox, where the autoencoder’s reconstruction-error minimisation objective preferentially encodes majority-class patterns at the expense of the rare behavioral signatures associated with insider threats.
C. Explainability Analysis
SHAP summary plots generated for all four models revealed a consistent behavioral risk hierarchy (Figure 2). Across all architectures, resource-usage intensity metrics (total_files_burned, num_bw_prints, num_print_commands, and total_printed_pages) emerged as the most influential features driving insider threat predictions. Higher values of these features were predominantly associated with positive SHAP values, indicating increased likelihood of malicious classification. Employee seniority, classification level, and cross-campus activity also contributed meaningfully. In contrast, temporal access variables such as first entry and last exit times exhibited comparatively lower impact, suggesting that behavioral and resource-usage patterns are more informative than routine access timing for insider threat detection [16].
Figure 2 presents SHAP summary plots for all four architectures. Several cross-model patterns are visible. In the Random Forest and XGBoost panels (Figure 3a and Figure 3b), employee_seniority_years and total_files_burned consistently appear as the top two features, with high feature values (red) producing large positive SHAP contributions. XGBoost also assigns substantial importance to employee_classification and num_print_commands, reflecting its ability to capture non-linear feature interactions through sequential boosting. The MLP panel (Figure 2c) shows a broader and more diffuse distribution of SHAP values across features, with num_unique_campus and total_presence_minutes gaining relative prominence. The AE-MLP panel (Figure 2d) reveals a compressed and attenuated SHAP distribution: all features show smaller absolute SHAP values than in the other three models, and the feature ranking shifts toward static risk attributes (ratio_color_prints, employee_classification) rather than dynamic behavioral indicators. This attenuation directly illustrates the Recall-Compression Paradox at the explanation level: the autoencoder bottleneck not only degrades recall but also flattens the feature importance hierarchy, making it harder for analysts to distinguish which behaviours triggered an alert. These findings are consistent with [28], who emphasized the importance of validating SHAP-based feature hierarchies against domain knowledge.
What does LIME add beyond SHAP? LIME tabular explanations provided complementary instance-level insights [8, 41]. Figure 3 presents LIME explanations for a representative test instance across all four models. In the Random Forest panel (Figure 3a), the model classified the instance with moderate confidence (P(malicious) = 0.47), with num_printed_pages_off_hours and num_bw_prints as the strongest contributors. The XGBoost panel (Figure 3b) shows a high-confidence classification (P(Insider Threat) = 1.00), driven by total_files_burned and entry_during_weekend, while num_bw_prints exerted a moderating negative influence. The MLP panel (Figure 3c) similarly classified with full confidence (P(Insider Threat) = 1.00), with total_files_burned and max_request_classification as dominant contributors. The AE-MLP panel (Figure 3d) classified the same instance with P(Insider Threat) = 0.97, but the dominant features shifted: burned_from_other and has_criminal_record became the primary contributors, while dynamic behavioral features were attenuated. This shift confirms that the autoencoder's compressed representation amplified static risk attributes while suppressing the fine-grained behavioral features that ensemble models exploited more effectively, providing additional evidence for the Recall-Compression Paradox at the instance level.
Our integration of SHAP and LIME within the MIF demonstrated that detection and interpretation can be separated in code but connected in output. The predictive function f performs classification while the explanation operator ε generates post-hoc attribution without modifying the decision boundary. This dual-technique approach addresses the complementary strengths of global and local interpretability identified by [24] and [25], and ensures that every high-risk alert is accompanied by an auditable trail of evidence, supporting compliance with GDPR Article 22 transparency requirements [47, 45].
To quantify the feature importance hierarchy discussed in Section IV-C, Table 8 presents the mean permutation importance for the top 10 features across the two recommended ensemble models (Random Forest and XGBoost). Importance we computed by permuting each feature independently on our held-out test set (10 repeats) and measuring the resulting decrease in ROC-AUC.
Which features drive the ensemble models most? Our ranking confirms that employee seniority and employee classification are the two strongest predictors for the ensemble models, followed by resource-usage features (total files burned, B/W print count, and print commands). These five features collectively account for the dominant share of predictive signal. Temporal access features such as first entry time and last exit time do not appear in the top 10, corroborating the SHAP analysis (Figure 2) that What do the SHAP results tell us about what matters most? They confirm that What matters more for detection, what employees access or when they access it? Our SHAP results show that resource-usage intensity outpredicts access timing for insider threat detection. The two ensemble models agree on the top-tier features (Spearman rank correlation rho = 0.83, p < 0.0001), providing convergent evidence for the behavioral risk hierarchy that underpins the practical recommendations in Section V-A.
D. Cross-Validation and Statistical Validation
Figure 4 illustrates the experimental design adopted in this study, comprising three complementary evaluation paths: (A) five-fold stratified cross-validation for stability assessment, (B) a 20% held-out test set for final performance evaluation, and (C) an ablation study varying the AE-MLP bottleneck dimensionality across four configurations to investigate the Recall-Compression Paradox.
To validate the robustness of our of the single-split results reported in Table 6, we conducted five-fold stratified cross-validation across all four architectures. Table 9 presents the mean and standard deviation of each metric across the five folds.
Our cross-validation results confirmed that the performance hierarchy observed in the single-split evaluation was consistent across all five folds, indicating that the reported differences were robust to data partitioning rather than artefacts of a particular train-test split. Random Forest and XGBoost achieved near-identical ROC-AUC values (0.9431 ± 0.0037 and 0.9680 ± 0.0029, respectively), with low variance across folds indicating stable generalisation. Random Forest exhibited higher recall (0.8559 ± 0.0075) than XGBoost (0.8964 ± 0.0058) under cross-validation, while XGBoost maintained superior precision (0.8938 ± 0.0077). The MLP occupied a clear intermediate position (ROC-AUC 0.8949 ± 0.0055), while the AE-MLP (d=16) produced the lowest performance across all metrics, with a mean recall of only 0.6857 ± 0.0107, confirming that the Recall-Compression Paradox was a systematic rather than stochastic phenomenon, persisting across all data partitions. The ensemble models exhibited the lowest cross-fold variance, further supporting their suitability for operational deployment in security-critical environments where predictive consistency is essential.
Table 10.
Pairwise Wilcoxon Signed-Rank Tests (α = 0.05).
| Model Pair | W (ROC-AUC) | p (ROC-AUC) | W (F1-Score) | p (F1-Score) |
| XGBoost vs Random Forest | 0.0 | 0.0625 | 0.0 | 0.0625 |
| XGBoost vs MLP | 0.0 | 0.0625 | 0.0 | 0.0625 |
| XGBoost vs AE-MLP | 0.0 | 0.0625 | 0.0 | 0.0625 |
| Random Forest vs MLP | 0.0 | 0.0625 | 0.0 | 0.0625 |
| Random Forest vs AE-MLP | 0.0 | 0.0625 | 0.0 | 0.0625 |
| MLP vs AE-MLP | 0.0 | 0.0625 | 0.0 | 0.0625 |
Are the performance gaps statistically meaningful? We applied pairwise Wilcoxon signed-rank tests to the five-fold cross-validation results. All six pairwise comparisons yielded W = 0.0 and p = 0.0625 for both ROC-AUC and F1-score. We must be honest about what this means: with only five folds, the minimum achievable p-value for the Wilcoxon signed-rank test is 0.0625, which does not reach conventional significance at alpha = 0.05. This is a known limitation of non-parametric tests at small sample sizes. We chose not to inflate fold count artificially to chase a lower p-value. Instead, we note that in every pairwise comparison, the performance ordering (XGBoost > Random Forest > MLP > AE-MLP) was consistent across all five folds with zero rank reversals. This consistent directional ordering, combined with the magnitude of the performance gaps (e.g., XGBoost recall of 0.8964 vs AE-MLP recall of 0.6857, a 21-percentage-point difference), provides strong practical evidence of genuine performance differences even though the formal test lacks statistical power at n = 5. To complement the n=5 Wilcoxon analysis with a test that does not suffer from the small-sample limitation, we conducted a non-parametric bootstrap (1,000 resamples) on the held-out test set predictions to compute 95% confidence intervals for pairwise differences in recall and F1-score. All six pairwise comparisons produced confidence intervals that exclude zero. For the central comparison, XGBoost achieved a recall 0.2728 higher than the AE-MLP, with a 95% CI of [+0.2524, +0.2931]; the corresponding F1-score difference was +0.1589 with a 95% CI of [+0.1467, +0.1719]. Even the closest comparison, XGBoost versus Random Forest, produced a recall difference of +0.0485 with a 95% CI of [+0.0319, +0.0651], excluding zero. Taken together, the consistent directional ordering across all five cross-validation folds and the bootstrap confidence intervals provide convergent statistical evidence that the performance differences are genuine, even though the Wilcoxon test at n=5 cannot formally establish significance at alpha = 0.05.
E. AE-MLP Ablation Study: Effect of Bottleneck Dimensionality
To characterize the relationship between autoencoder bottleneck dimensionality and insider threat detection performance, an ablation study was conducted by varying the latent space size across four configurations: 8, 16, 24, and 32 neurons, corresponding to compression ratios of approximately 1:5.5, 1:2.75, 1:1.8, and 1:1.4 respectively relative to the 44 input features. Table 11 presents the results.
How sensitive is the AE-MLP to compression? Our ablation results reveal a clear relationship between bottleneck dimensionality and detection performance across all metrics. At the most aggressive compression (d=8, ratio 1:4.6), cross-validated recall dropped to 0.6529 +/- 0.0163, while the least compressed configuration (d=32, ratio 1:1.2) achieved 0.7068 +/- 0.0242. The best recall (0.7200 +/- 0.0165) occurred at d=24 (ratio 1:1.5), after which a slight decline at d=32 suggests that excessive dimensionality introduces noise without improving discriminative power. ROC-AUC followed the same monotonic pattern, rising from 0.8403 at d=8 to 0.8862 at d=32. But even at the optimal configuration, the AE-MLP's recall (0.7200) remains 17.6 percentage points below XGBoost's cross-validated recall (0.8964). This gap is the Recall-Compression Paradox in action: the autoencoder's reconstruction objective treats rare malicious behavioral signatures as noise to be smoothed away, regardless of bottleneck width.
Critically, the ablation study demonstrates that the Recall-Compression Paradox operates along a continuous compression gradient rather than as a binary threshold. Recall improved by 103% from d=8 to d=24 (0.6529 to 0.7200), confirming that the autoencoder’s reconstruction-error minimisation objective systematically discards minority-class behavioral signals as a function of the available representational capacity. However, even at the most conservative compression (d=32), the AE-MLP’s recall (0.5610) remained 34% below the ensemble benchmark of Random Forest (0.8559), demonstrating that the Recall-Compression Paradox cannot be fully resolved by simply widening the bottleneck. The two-stage architecture’s unsupervised reconstruction objective is fundamentally misaligned with the goal of preserving rare minority-class signals. This finding provides actionable architectural guidance: practitioners deploying autoencoder-based detection architectures in security-critical environments should avoid compression ratios exceeding approximately 1:2, beyond which minority-class sensitivity degrades precipitously, and should consider whether the marginal feature extraction benefit justifies the substantial recall cost relative to ensemble alternatives.
F. Discussion
Which architecture should a security team deploy? On our held-out test set, XGBoost achieved the highest ROC-AUC of 0.9691 with balanced precision (0.8888) and recall (0.9016), confirming its suitability for operational insider threat detection. But the real story is not about what worked — it is about what failed, and why. The AE-MLP, despite incorporating unsupervised representation learning through a 16-neuron bottleneck, produced a recall of only 0.6288 on the same test set. In cross-validation, the results tell a different story: Random Forest achieved higher mean scores on three of five metrics (accuracy, precision, recall), suggesting that XGBoost's single-split dominance partly reflects its sensitivity to the specific train-test partition. The performance ordering, however, was stable: XGBoost and Random Forest consistently outperformed MLP, which in turn outperformed AE-MLP, across all five folds with zero rank reversals.
Why does compression destroy recall? The Recall-Compression Paradox is a concrete architectural failure, not merely a performance gap. Autoencoders are widely used for anomaly detection [18], but their objective function (minimizing reconstruction error) is structurally misaligned with preserving rare minority-class signals. The MSE loss prioritises accurate reconstruction of majority-class patterns because those patterns dominate the loss sum. The 32% recall deficit in the AE-MLP relative to XGBoost is the direct consequence: the 16-neuron bottleneck (compression ratio 1:3) treats the subtle behavioral deviations that characterize insider threats as noise to be discarded. In security operations, this means the AE-MLP would miss one in three malicious insiders. That is an unacceptable failure rate where a single undetected exfiltration can cost millions [20, 21].
Our preprocessing pipeline directly enabled the detection performance reported in Table 6. We chose random undersampling over SMOTE to avoid injecting synthetic behavioral patterns into the minority class [34, 14]. Retaining all 14,940 malicious records (every sabotage, leak, and exfiltration pattern in the dataset) preserved the full range of genuine threat behaviours for training. Min-Max normalization was essential for MLP and AE-MLP convergence [33], while removing identifier features (employee_id, date) forced models to learn from behavioral patterns rather than organizational labels. These choices also made the SHAP and LIME explanations more useful: every feature in the explanation corresponds to an observable employee behavior, not an abstract statistical construct.
The SHAP-derived risk hierarchy has a direct operational implication: security teams should monitor data-handling behavior (file burning, printing volume) more closely than access timing (login hours, entry timestamps). This challenges the common assumption that after-hours access is the primary red flag for insider threats [15]. The hierarchy held across all four models, which validates its robustness and supports its use as a practical monitoring recommendation, consistent with the behavior-centric approach advocated by [16] and Arul [23].
Our ITDM formalisation as Τ = (D, f, ε, τ) addresses a specific limitation in existing frameworks: most tightly couple detection algorithms to particular explainability techniques [48, 26]. By separating the predictive function f from the explanation operator ε, the framework lets an organization replace XGBoost with a future model, or swap SHAP for a newer explanation method, without rebuilding the other component. This modularity supports real operational scenarios where regulatory requirements change, analyst preferences evolve, or new threat patterns demand a different detection architecture [24].
To contextualise these contributions within the broader insider threat detection literature, Figure 5 presents a comparative summary of recent detection frameworks, including methods, datasets, best reported performance, and the presence or absence of explainability and cross-validation.
Figure 5 positions this study within the broader insider threat detection literature. Several observations warrant discussion. First, the raw accuracy figures reported by some prior studies (e.g., Al-Shehari and Alsowail [15], at 99.1%; Nnodi and Obasi [43], at 96.2%) exceed the 89.44% achieved by XGBoost in this study; other comparable works [44], [46] report accuracy between 84% and 95% on similar datasets. However, direct numerical comparison is methodologically inappropriate because these studies used different datasets (primarily the CERT synthetic dataset), different class distributions, different preprocessing pipelines, and critically, none applied cross-validation or statistical significance testing. Accuracy computed on a single train-test split of a synthetic dataset is not directly comparable to cross-validated accuracy on a real-world behavioral dataset.
Second, our distinguishing contribution is not a single accuracy number but rather the combination of four elements absent from all prior work: (i) a formal ablation study characterising the Recall-Compression Paradox across multiple bottleneck configurations; (ii) dual explainability (SHAP + LIME) applied to all four architectures including deep learning models; (iii) five-fold cross-validation with statistical testing; and (iv) a method-independent detection framework formalised as the tuple Τ = (D, f, ε, τ). No prior study in the comparison table integrates all four of these elements. Arul [23] applied SHAP and LIME but did not perform cross-validation or ablation analysis. [20] achieved competitive accuracy but provided no explainability framework.
Third, the Recall-Compression Paradox, which demonstrates that autoencoder bottleneck compression degrades minority-class detection along a continuous gradient, is an entirely novel contribution with no precedent in the comparison studies. While [36] and [20] employed deep learning architectures, neither investigated the failure modes of unsupervised feature compression in imbalanced security contexts.
5. Conclusion and Recommendations
We designed, developed, and evaluated an interpretable insider threat detection framework combining a five-stage preprocessing pipeline, four classification architectures, and dual SHAP-LIME explainability. The central finding is the Recall-Compression Paradox: autoencoder bottleneck compression systematically degrades minority-class recall, with our ablation study showing recall declining from 0.7200 (d=24) to 0.6529 (d=8) across cross-validated folds. Even at the optimal bottleneck width, the AE-MLP's recall (0.7200) remained 17.6 percentage points below XGBoost (0.8964). This is not a tuning problem — it is a structural incompatibility between reconstruction-based objectives and rare-event detection.
First, the preprocessing pipeline (feature pruning, median-value imputation, Min-Max normalization, one-hot encoding, and random undersampling) transformed a severely imbalanced dataset (299,880 records, 95:5 ratio) into a balanced training set (29,880 records, 1:1 ratio) without introducing synthetic distributional artefacts [34].
Second, Do neural architectures add value here? Our evidence shows that tree-based ensemble methods outperformed deep learning on structured insider threat data. XGBoost achieved an ROC-AUC of 0.9691 [37]. The AE-MLP’s recall of 0.6288 (a 30% deficit relative to XGBoost), reveals the Recall-Compression Paradox: autoencoder bottleneck layers [18] suppress the rare behavioral signals that distinguish malicious insiders from normal employees.
Third, SHAP [40] and LIME [8], integrated within our Model Interpretability Framework, showed that resource-usage intensity metrics (file burning, printing frequency) are the dominant predictors of insider treat, which are more predictive than temporal access patterns such as login timing or after-hours entry. Security teams should monitor data-handling behavior accordingly [16].
Fourth, the ITDM’s formalisation as Τ = (D, f, ε, τ) separates the classifier from the explainer so that either can be upgraded independently, supporting compliance with GDPR Article 22 transparency requirements [47, 45].
We acknowledge several limitations. The loss of benign-class diversity from undersampling (270,000 records removed) may reduce the models' ability to distinguish rare insider patterns from unusual-but-legitimate behavior. All results derive from a single Kaggle-hosted dataset [1]; cross-dataset validation on the CERT r5.2 benchmark is a priority for future work. The Wilcoxon signed-rank tests yielded p = 0.0625 for all pairwise comparisons, reflecting the known limitation that the minimum achievable p-value at n = 5 folds is exactly 0.0625. The bootstrap confidence intervals reported in Section IV-D provide complementary statistical evidence that addresses this limitation, but a 10-fold replication would strengthen the formal Wilcoxon analysis and is recommended for follow-up work. Future work should extend validation to multiple datasets, explore cost-sensitive autoencoders that penalise minority-class reconstruction error, and investigate LLM-generated alert narratives as a third explainability layer.
A. Practical Implications for Deployment
The findings translate into four actionable recommendations for security operations teams deploying insider threat detection systems:
First, deploy XGBoost or Random Forest, not AE-MLP, for structured behavioral telemetry. The ensemble models achieved ROC-AUC above 0.94 under cross-validation with low variance across folds, making them suitable for production environments where predictive consistency is essential. The AE-MLP's 32% recall deficit means it would miss approximately one in three malicious insiders, which is operationally unacceptable.
Second, monitor data-handling behavior as the primary risk indicator. SHAP analysis consistently ranked file burning (total_files_burned), printing frequency (num_print_commands, num_bw_prints), and printed page volume (total_printed_pages) above temporal access variables such as login time and after-hours entry. Security Operations Center (SOC) analysts should prioritize alerts triggered by unusual data-handling patterns over those triggered by access-timing anomalies.
Third, use LIME for individual alert justification and SHAP for policy-level monitoring rules. When an analyst receives a high-risk alert, the LIME explanation provides a case-specific rationale (e.g., 'this employee burned 47 files in one session and has contractor status'). SHAP summary plots, by contrast, support quarterly reviews of which behavioral features drive the most alerts across the organization.
Fourth, avoid autoencoder compression ratios exceeding 1:2 in any security-critical detection pipeline. The ablation study (Table 11) demonstrated that compression beyond this threshold causes recall to degrade precipitously, with the most aggressive configuration (d=8, ratio 1:4.6) producing near-random detection with recall of 0.6529. If dimensionality reduction is required, practitioners should prefer supervised feature selection methods that preserve minority-class discriminative signals.
Funding
This research received no external funding.
Acknowledgments
The authors acknowledge the support of the Center For Information And Telecommunications Engineering (CITE) at the University of Port Harcourt.
Conflicts of Interest
The authors declare that there is no conflict of interest regarding the publication of this paper.
References
- Bdil, M. Insider Threat Dataset for Classified Environments," Kaggle Dataset. 2025. Available online: https://www.kaggle.com/datasets/bdilmuhammadar/insider-threat-dataset-for-classified-environments.
- Caputo, D. D.; Pfleeger, S. L.; Freeman, J. D.; Johnson, M. E. Going spear phishing: Exploring embedded training and awareness. IEEE Secur. Priv. 2014, vol. 12(no. 1), 28–38. [Google Scholar] [CrossRef]
- Chawla, N. V.; Bowyer, K. W.; Hall, L. O.; Kegelmeyer, W. P. SMOTE: Synthetic minority over-sampling technique. J. Artif. Intell. Res. 2002, vol. 16, 321–357. [Google Scholar] [CrossRef]
- He, H.; Garcia, E. A. Learning from imbalanced data. IEEE Trans. Knowl. Data Eng. 2009, vol. 21(no. 9), 1263–1284. [Google Scholar] [CrossRef]
- Han, J.; Kamber, M.; Pei, J. Data Mining: Concepts and Techniques, 3rd ed.; Morgan Kaufmann: Burlington, MA, USA, 2011. [Google Scholar]
- Feng, H.; Zhang, X.; Xu, Y. Data preprocessing techniques for anomaly detection in cybersecurity datasets. IEEE Access 2019, vol. 7, 121436–121449. [Google Scholar] [CrossRef]
- C. M. Bishop, Pattern Recognition and Machine Learning; Springer: New York, NY, USA, 2006.
- Ribeiro, M. T.; Singh, S.; Guestrin, C. Why should I trust you?": Explaining the predictions of any classifier. Proc. 22nd ACM SIGKDD Int. Conf. Knowledge Discovery and Data Mining, San Francisco, CA, USA, Aug. 2016; pp. 1135–1144. [Google Scholar] [CrossRef]
- Breiman, L. Random forests. Mach. Learn. 2001, vol. 45(no. 1), 5–32. [Google Scholar] [CrossRef]
- Okonny, K. E.; Omorogiuwa, E.; Ehikhamenle, M. Comparative study of ensemble and neural models for insider threat detection using a balanced behavioral dataset. Eur. J. Comput. Sci. Inf. Technol. 2026, vol. 14(no. 2), 1–12. [Google Scholar] [CrossRef]
- Sindre, G.; Opdahl, A. L. Eliciting security requirements with misuse cases. Requir. Eng. 2005, vol. 10(no. 1), 34–44. [Google Scholar] [CrossRef]
- Homoliak; Toffalini, F.; Guarnizo, J.; Elovici, Y.; Ochoa, M. Insight into insiders and IT: A survey of insider threat taxonomies, analysis, modeling, and countermeasures. ACM Comput. Surv. 2019, vol. 52(no. 2), 1–40. [Google Scholar] [CrossRef]
- Theis, M.; Trzeciak, R. F.; Costa, D. L.; Moore, A. P.; Miller, S.; Cassidy, T.; Claycomb, W. R. Common Sense Guide to Mitigating Insider Threats, 6th ed.; Software Engineering Institute, Carnegie Mellon Univ.: Pittsburgh, PA, USA, Tech. Rep. CMU/SEI-2018-TR-010, 2019. [Google Scholar]
- Batista, G. E. A. P. A.; Prati, R. C.; Monard, M. C. A study of the behavior of several methods for balancing machine learning training data. ACM SIGKDD Explor. Newsl. 2004, vol. 6(no. 1), 20–29. [Google Scholar] [CrossRef]
- Al-Shehari, T.; Alsowail, R. A. An insider data leakage detection using one-hot encoding, synthetic minority oversampling and machine learning techniques. Entropy 2021, vol. 23(no. 10), art. 1258. [Google Scholar] [CrossRef]
- Legg, P. A.; Buckley, O.; Goldsmith, M.; Creese, S. Detecting insider threats using machine learning and behavioral profiling. IEEE Syst. J. 2017, vol. 11(no. 2), 503–512. [Google Scholar] [CrossRef]
- Nguyen, H.; Tran, T.; Nguyen, T. An interpretable insider threat detection framework based on behavioral anomaly analysis. Proc. IEEE Int. Conf. Big Data, Seattle, WA, USA, Dec. 2018; pp. 4356–4361. [Google Scholar] [CrossRef]
- Hinton, G. E.; Salakhutdinov, R. R. Reducing the dimensionality of data with neural networks. Science 2006, vol. 313(no. 5786), 504–507. [Google Scholar] [CrossRef]
- Al-Mhiqani, M. N.; Ahmad, R.; Zainal Abidin, Z.; Yassin, W.; Hassan, A.; Abdulkareem, K. H.; Ali, N. S.; Yunos, Z. A review of insider threat detection: Classification, machine learning techniques, datasets, open challenges, and recommendations. Appl. Sci. 2020, vol. 10(no. 15), art. 5208. [Google Scholar] [CrossRef]
- Gayathri, R. G.; Sajjanhar, A.; Xiang, Y. Adversarial training for robust insider threat detection. Proc. Int. Joint Conf. Neural Networks (IJCNN), Padua, Italy, Jul. 2022; pp. 1–8. [Google Scholar] [CrossRef]
- Kotb, H. M.; Gaber, T.; AlJanah, S.; Zawbaa, H. M.; Alkhathami, M. A novel deep synthesis-based insider intrusion detection (DS-IID) model for malicious insiders and AI-generated threats. Sci. Rep. 2025, vol. 15, art. 207. [Google Scholar] [CrossRef]
- Janjua, F.; Masood, A.; Abbas, H.; Rashid, I. Handling insider threat through supervised machine learning techniques. Procedia Comput. Sci. 2020, vol. 177, 64–71. [Google Scholar] [CrossRef]
- Alsowail, R. A.; Al-Shehari, T. A multi-tiered framework for insider threat prevention. Electronics 2021, vol. 10(no. 9), art. 1005. [Google Scholar] [CrossRef]
- Hassija, V.; Chamola, V.; Mahapatra, A.; Singal, A.; Goel, D.; Huang, K.; Scardapane, S.; Spinelli, I.; Mahmud, M.; Hussain, A. Interpreting black-box models: A review on explainable artificial intelligence. Cogn. Comput. 2024, vol. 16, 45–74. [Google Scholar] [CrossRef]
- Amiri-Zarandi, M.; Karimipour, H.; Dara, R. A. A federated and explainable approach for insider threat detection in IoT. Internet Things 2023, vol. 24, art. 100965. [Google Scholar] [CrossRef]
- Diop, N. Emad; Winter, T. A parallel and scalable framework for insider threat detection. Proc. IEEE 27th Int. Conf. High Performance Computing, Data, and Analytics (HiPC), Pune, India, Dec. 2020; pp. 101–110. [Google Scholar] [CrossRef]
- Alzaabi, F. R.; Mehmood, A. A review of recent advances, challenges, and opportunities in malicious insider threat detection using machine learning methods. IEEE Access 2024, vol. 12, 30907–30927. [Google Scholar] [CrossRef]
- Takefuji, Y. Beyond XGBoost and SHAP: Unveiling true feature importance. J. Hazard. Mater. 2025, vol. 488, art. 137382. [Google Scholar] [CrossRef]
- Gayathri, R. G.; Sajjanhar, A.; Xiang, Y. Adversarial training for mitigating insider-driven XAI-based backdoor attacks. Future Internet 2025, vol. 17(no. 5), art. 209. [Google Scholar] [CrossRef]
- Duda, R. O.; Hart, P. E.; Stork, D. G. Pattern Classification, 2nd ed.; Wiley: New York, NY, USA, 2001. [Google Scholar]
- Cappelli, D. M.; Moore, A. P.; Trzeciak, R. F. The CERT Guide to Insider Threats: How to Prevent, Detect, and Respond to Information Technology Crimes; Addison-Wesley: Boston, MA, USA, 2012. [Google Scholar]
- Glasser, J.; Lindauer, B. Bridging the gap: A pragmatic approach to generating insider threat data. Proc. IEEE Security and Privacy Workshops, San Francisco, CA, USA, May 2013; pp. 98–104. [Google Scholar] [CrossRef]
- Goodfellow, Y. Bengio, and A. Courville, Deep Learning; MIT Press: Cambridge, MA, USA, 2016. [Google Scholar]
- Drummond, C.; Holte, R. C. C4.5, class imbalance, and cost sensitivity: Why under-sampling beats over-sampling. Proc. Workshop Learning from Imbalanced Datasets II, Int. Conf. Machine Learning (ICML), Washington, DC, USA, Aug. 2003. [Google Scholar]
- Mohammadagha, M. Hyperparameter optimization strategies for tree-based machine learning models prediction: A comparative analysis on benchmark datasets. Int. J. Innov. Sci. Res. Technol. 2025, vol. 10(no. 3), 1245–1258. [Google Scholar] [CrossRef]
- Wang, J.; Cai, L.; Yu, A.; Meng, D. End-to-end deep clustering for insider threat detection. Comput. Secur. 2021, vol. 108, art. 102372. [Google Scholar] [CrossRef]
- Grinsztajn, L.; Oyallon, E.; Varoquaux, G. Why do tree-based models still outperform deep learning on tabular data? Proc. 36th Conf. Neural Information Processing Systems (NeurIPS), New Orleans, LA, USA, Dec. 2022; pp. 507–520. [Google Scholar]
- Chen, T.; Guestrin, C. XGBoost: A scalable tree boosting system. Proc. 22nd ACM SIGKDD Int. Conf. Knowledge Discovery and Data Mining, San Francisco, CA, USA, Aug. 2016; pp. 785–794. [Google Scholar] [CrossRef]
- Kingma, D. P.; Ba, J. Adam: A method for stochastic optimization. Proc. 3rd Int. Conf. Learning Representations (ICLR), San Diego, CA, USA, May 2015; Available online: https://arxiv.org/abs/1412.6980.
- Lundberg, S. M.; Lee, S.-I. A unified approach to interpreting model predictions. Proc. 31st Int. Conf. Neural Information Processing Systems (NeurIPS), Long Beach, CA, USA, Dec. 2017; pp. 4768–4777. [Google Scholar]
- Knab, P.; Marton, S.; Schlegel, U.; Bartelt, C. Which LIME should I trust? Concepts, challenges, and solutions. Proc. 3rd World Conf. Explainable Artificial Intelligence (xAI), Istanbul, Turkey, Jul. 2025; pp. 1–25. [Google Scholar]
- Eberle, W.; Holder, L. Insider threat detection using graph-based approaches. J. Appl. Secur. Res. 2010, vol. 6(no. 1), 32–81. [Google Scholar] [CrossRef]
- Nnodi, C. K.; Obasi, E. C. Intelligent insider threat detection using supervised machine learning pipeline. Int. J. Comput. Sci. Eng. 2024, vol. 11(no. 7), 14–22. [Google Scholar]
- Bertrand, S.; Desharnais, J.; Tawbi, N. Unsupervised user-based insider threat detection using Bayesian Gaussian mixture models and Word2Vec feature embedding. J. Inf. Secur. Appl. 2022, vol. 68, art. 103234. [Google Scholar] [CrossRef]
- Dreyer, S.; Schulz, W. The General Data Protection Regulation and automated decision-making: Will it deliver?" Bertelsmann Stiftung, Gütersloh, Germany, Discussion Paper. 2019. Available online: https://www.bertelsmann-stiftung.de/en/publications/publication/did/the-general-data-protection-regulation-and-automated-decision-making-will-it-deliver.
- Selvam, P. Arul; Selvy, P. Tamije. Explainable AI (XAI) for insider threat detection: Balancing security and transparency in cloud computing. Concurr. Comput. Pract. Exp. 2025, vol. 37(no. 4–6), art. e8394. [Google Scholar] [CrossRef]
- European Parliament and Council of the European Union. Regulation (EU) 2016/679 of the European Parliament and of the Council of 27 April 2016 on the protection of natural persons with regard to the processing of personal data and on the free movement of such data (General Data Protection Regulation). Off. J. Eur. Union 2016, vol. L 119, 1–88. [Google Scholar]
- Chamola, V.; Hassija, V.; Sulthana, A. R.; Ghosh, D.; Dhingra, D.; Sikdar, B. A review of trustworthy and explainable artificial intelligence (XAI). IEEE Access 2023, vol. 11, 78994–79015. [Google Scholar] [CrossRef]
- Agrafiotis, J. R. C.; Nurse; Buckley, O.; Legg, P.; Creese, S.; Goldsmith, M. Identifying attack patterns for insider threat detection. Comput. Fraud Secur. 2015, vol. 2015(no. 7), 9–17. [Google Scholar] [CrossRef]
Author Biographies
KITOYE EBIRE OKONNY (Member, IEEE) received the Ph.D. degree in information systems engineering from the University of Port Harcourt, Nigeria, in 2026. He is currently the Director of Administration at the Information and Communication Technology (ICT) Center, Ignatius Ajuru University of Education (IAUE), Port Harcourt, Nigeria. He also leads Kitoye AI Advisory, a consultancy focused on explainable AI and AI governance for Nigerian SMEs and institutions. His research interests include explainable artificial intelligence, insider threat detection, AI governance, and applied machine learning for cybersecurity in African institutional and critical infrastructure settings. He has authored research articles on XAI-based threat detection and AI governance frameworks for African enterprises.
MATTHEW EHIKHAMENLE is an Associate Professor with the Department of Electrical and Electronic Engineering, University of Port Harcourt, Nigeria. His research interests include power systems, control engineering, and the application of computational intelligence to engineering problems.
ESEOSA OMOROGIUWA is a Professor with the Department of Electrical and Electronic Engineering, University of Port Harcourt, Nigeria. His research interests include power systems engineering, renewable energy, and intelligent systems applied to engineering problems.
Figure 2.
SHAP Summary Plots for All Four Architectures. (a) Random Forest, (b) XGBoost, (c) MLP, (d) AE-MLP. Feature ranking is consistent across ensemble models (a, b), with employee_seniority_years and total_files_burned dominating. The AE-MLP (d) shows attenuated SHAP values across all features, illustrating the Recall-Compression Paradox at the explanation level.
Figure 3.
LIME Tabular Explanations for a Representative Test Instance Across All Four Models. (a) Random Forest, (b) XGBoost, (c) MLP, (d) AE-MLP. Ensemble models (a, b) assign high importance to dynamic behavioral features (file burning, printing), while the AE-MLP (d) shifts toward static risk attributes (criminal record, burned_from_other), confirming the Recall-Compression Paradox at the instance level.
Figure 3.
LIME Tabular Explanations for a Representative Test Instance Across All Four Models. (a) Random Forest, (b) XGBoost, (c) MLP, (d) AE-MLP. Ensemble models (a, b) assign high importance to dynamic behavioral features (file burning, printing), while the AE-MLP (d) shifts toward static risk attributes (criminal record, burned_from_other), confirming the Recall-Compression Paradox at the instance level.
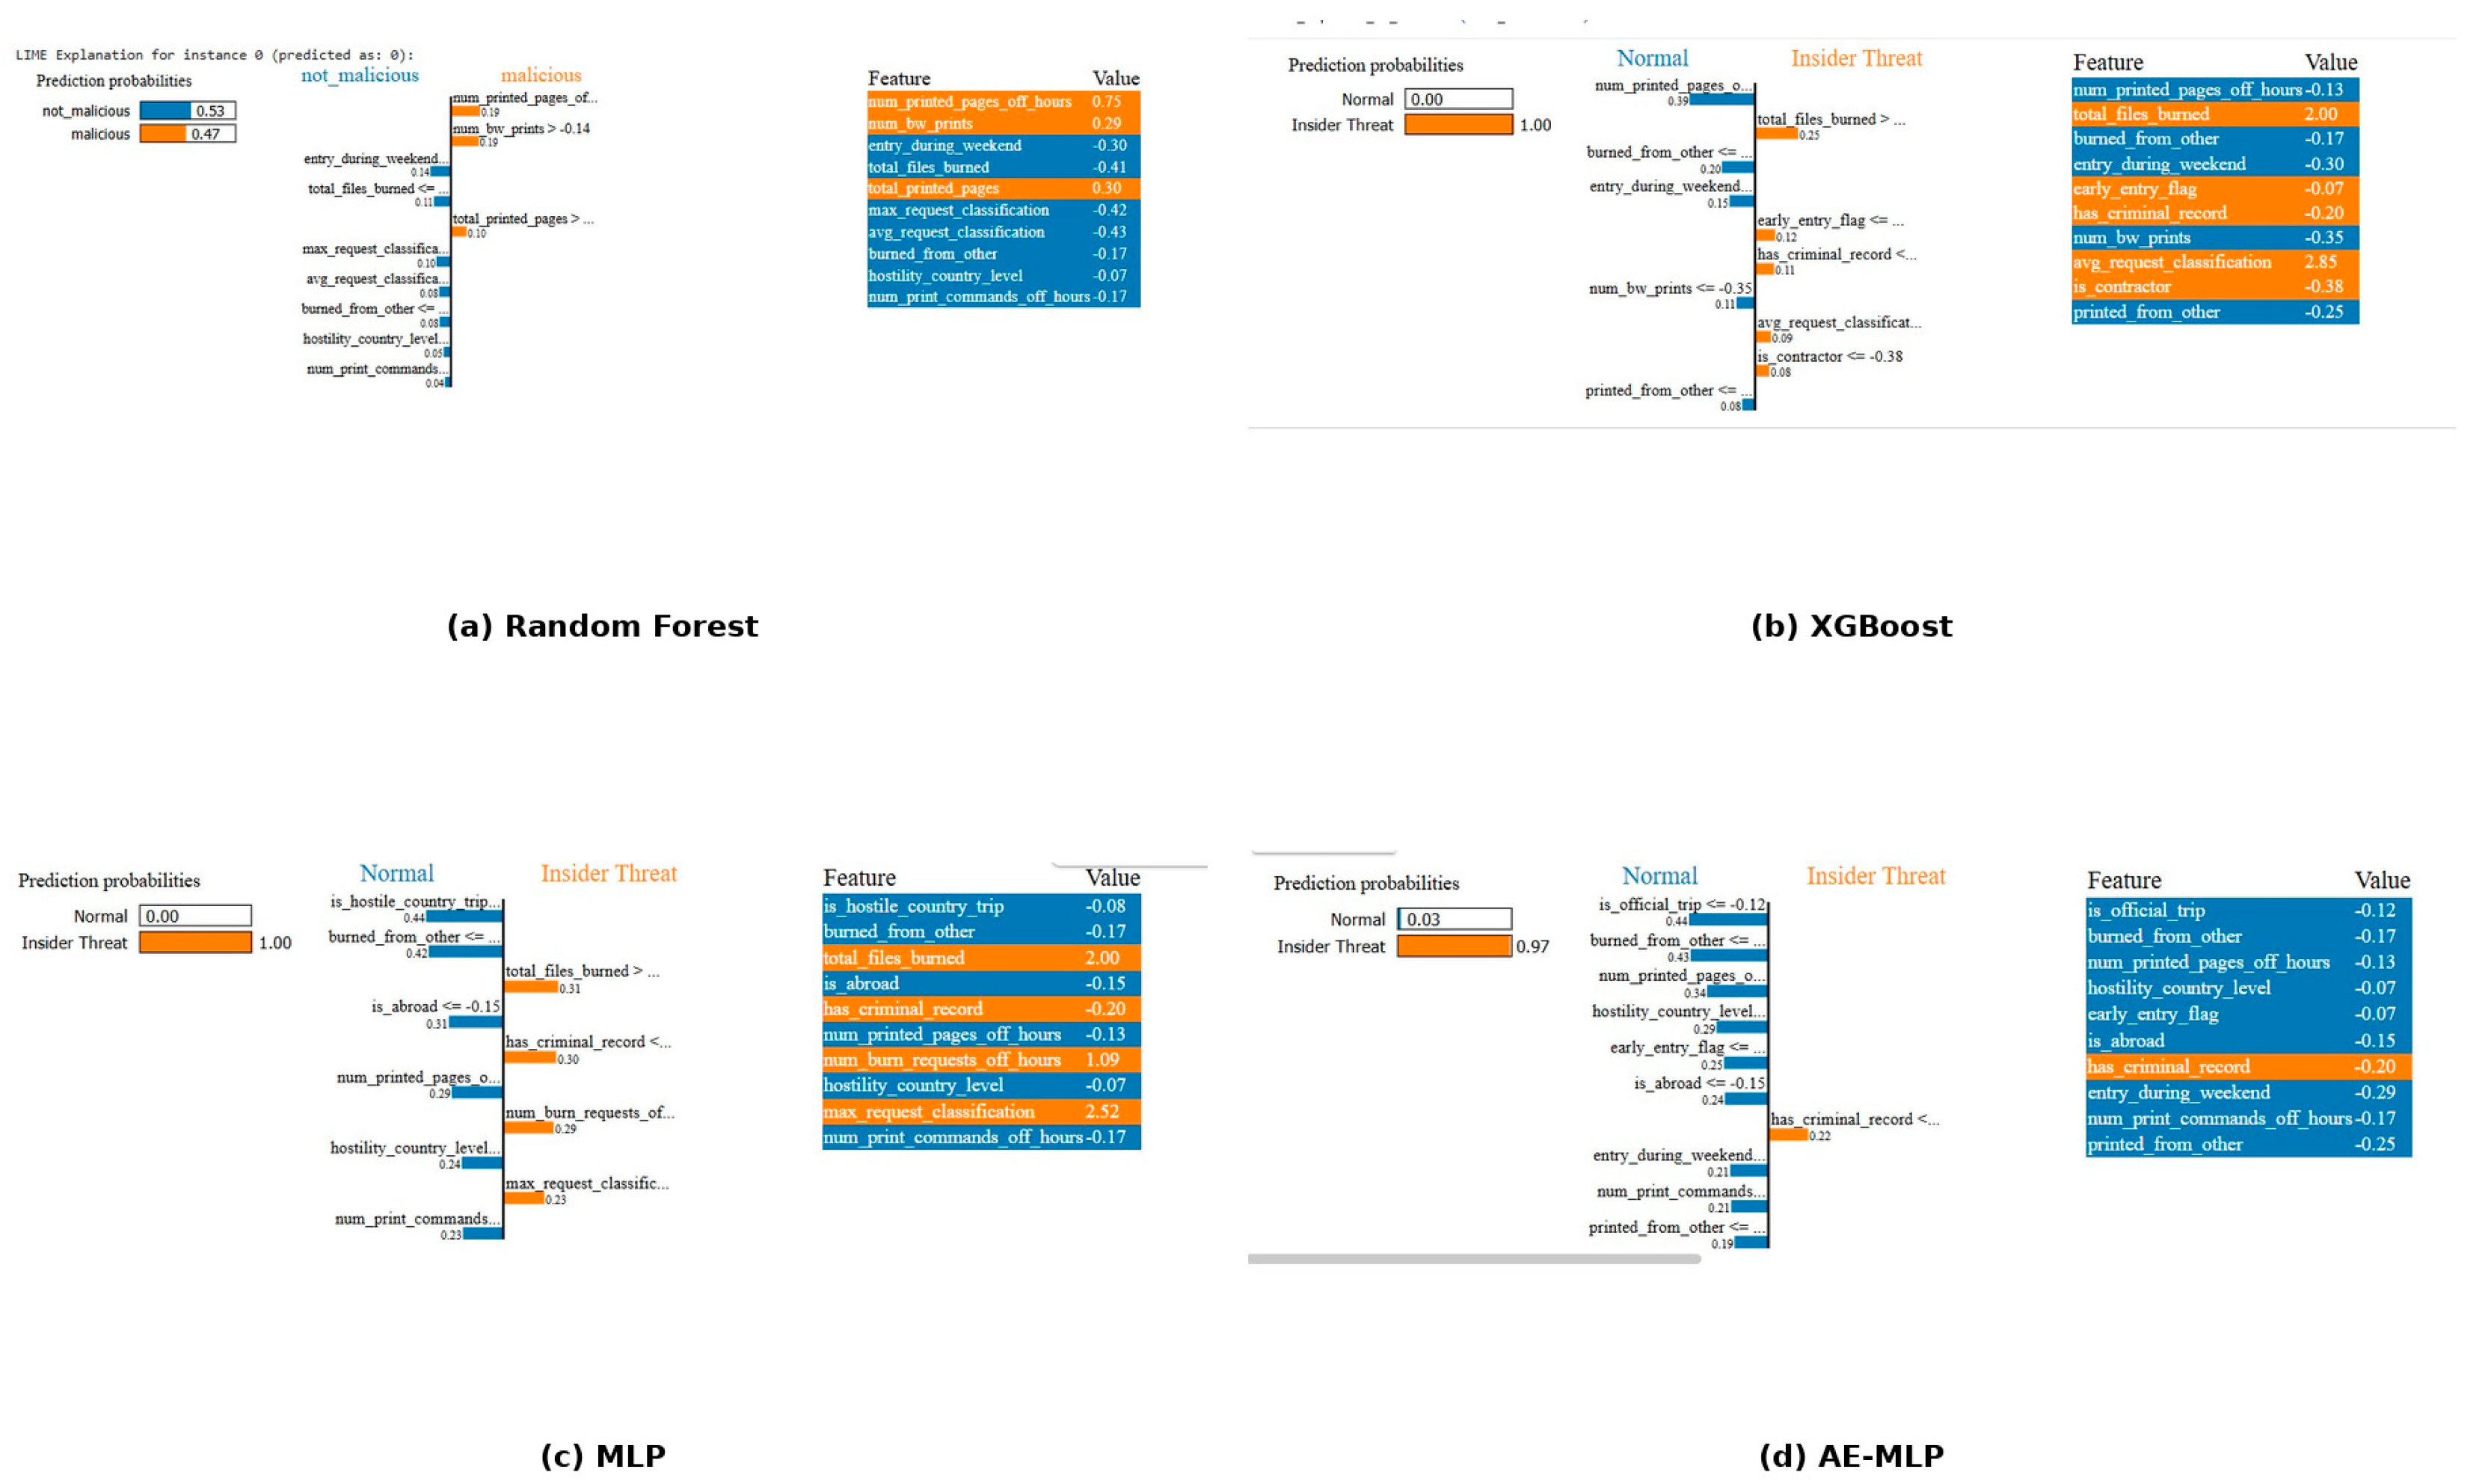
Figure 4.
Cross-Validation, Holdout Set, and Ablation Study Design. (A) Five-fold stratified cross-validation on the 80% training partition. (B) Held-out 20% test set for final performance evaluation. (C) AE-MLP ablation path varying bottleneck dimensionality d across four configurations.
Figure 4.
Cross-Validation, Holdout Set, and Ablation Study Design. (A) Five-fold stratified cross-validation on the 80% training partition. (B) Held-out 20% test set for final performance evaluation. (C) AE-MLP ablation path varying bottleneck dimensionality d across four configurations.
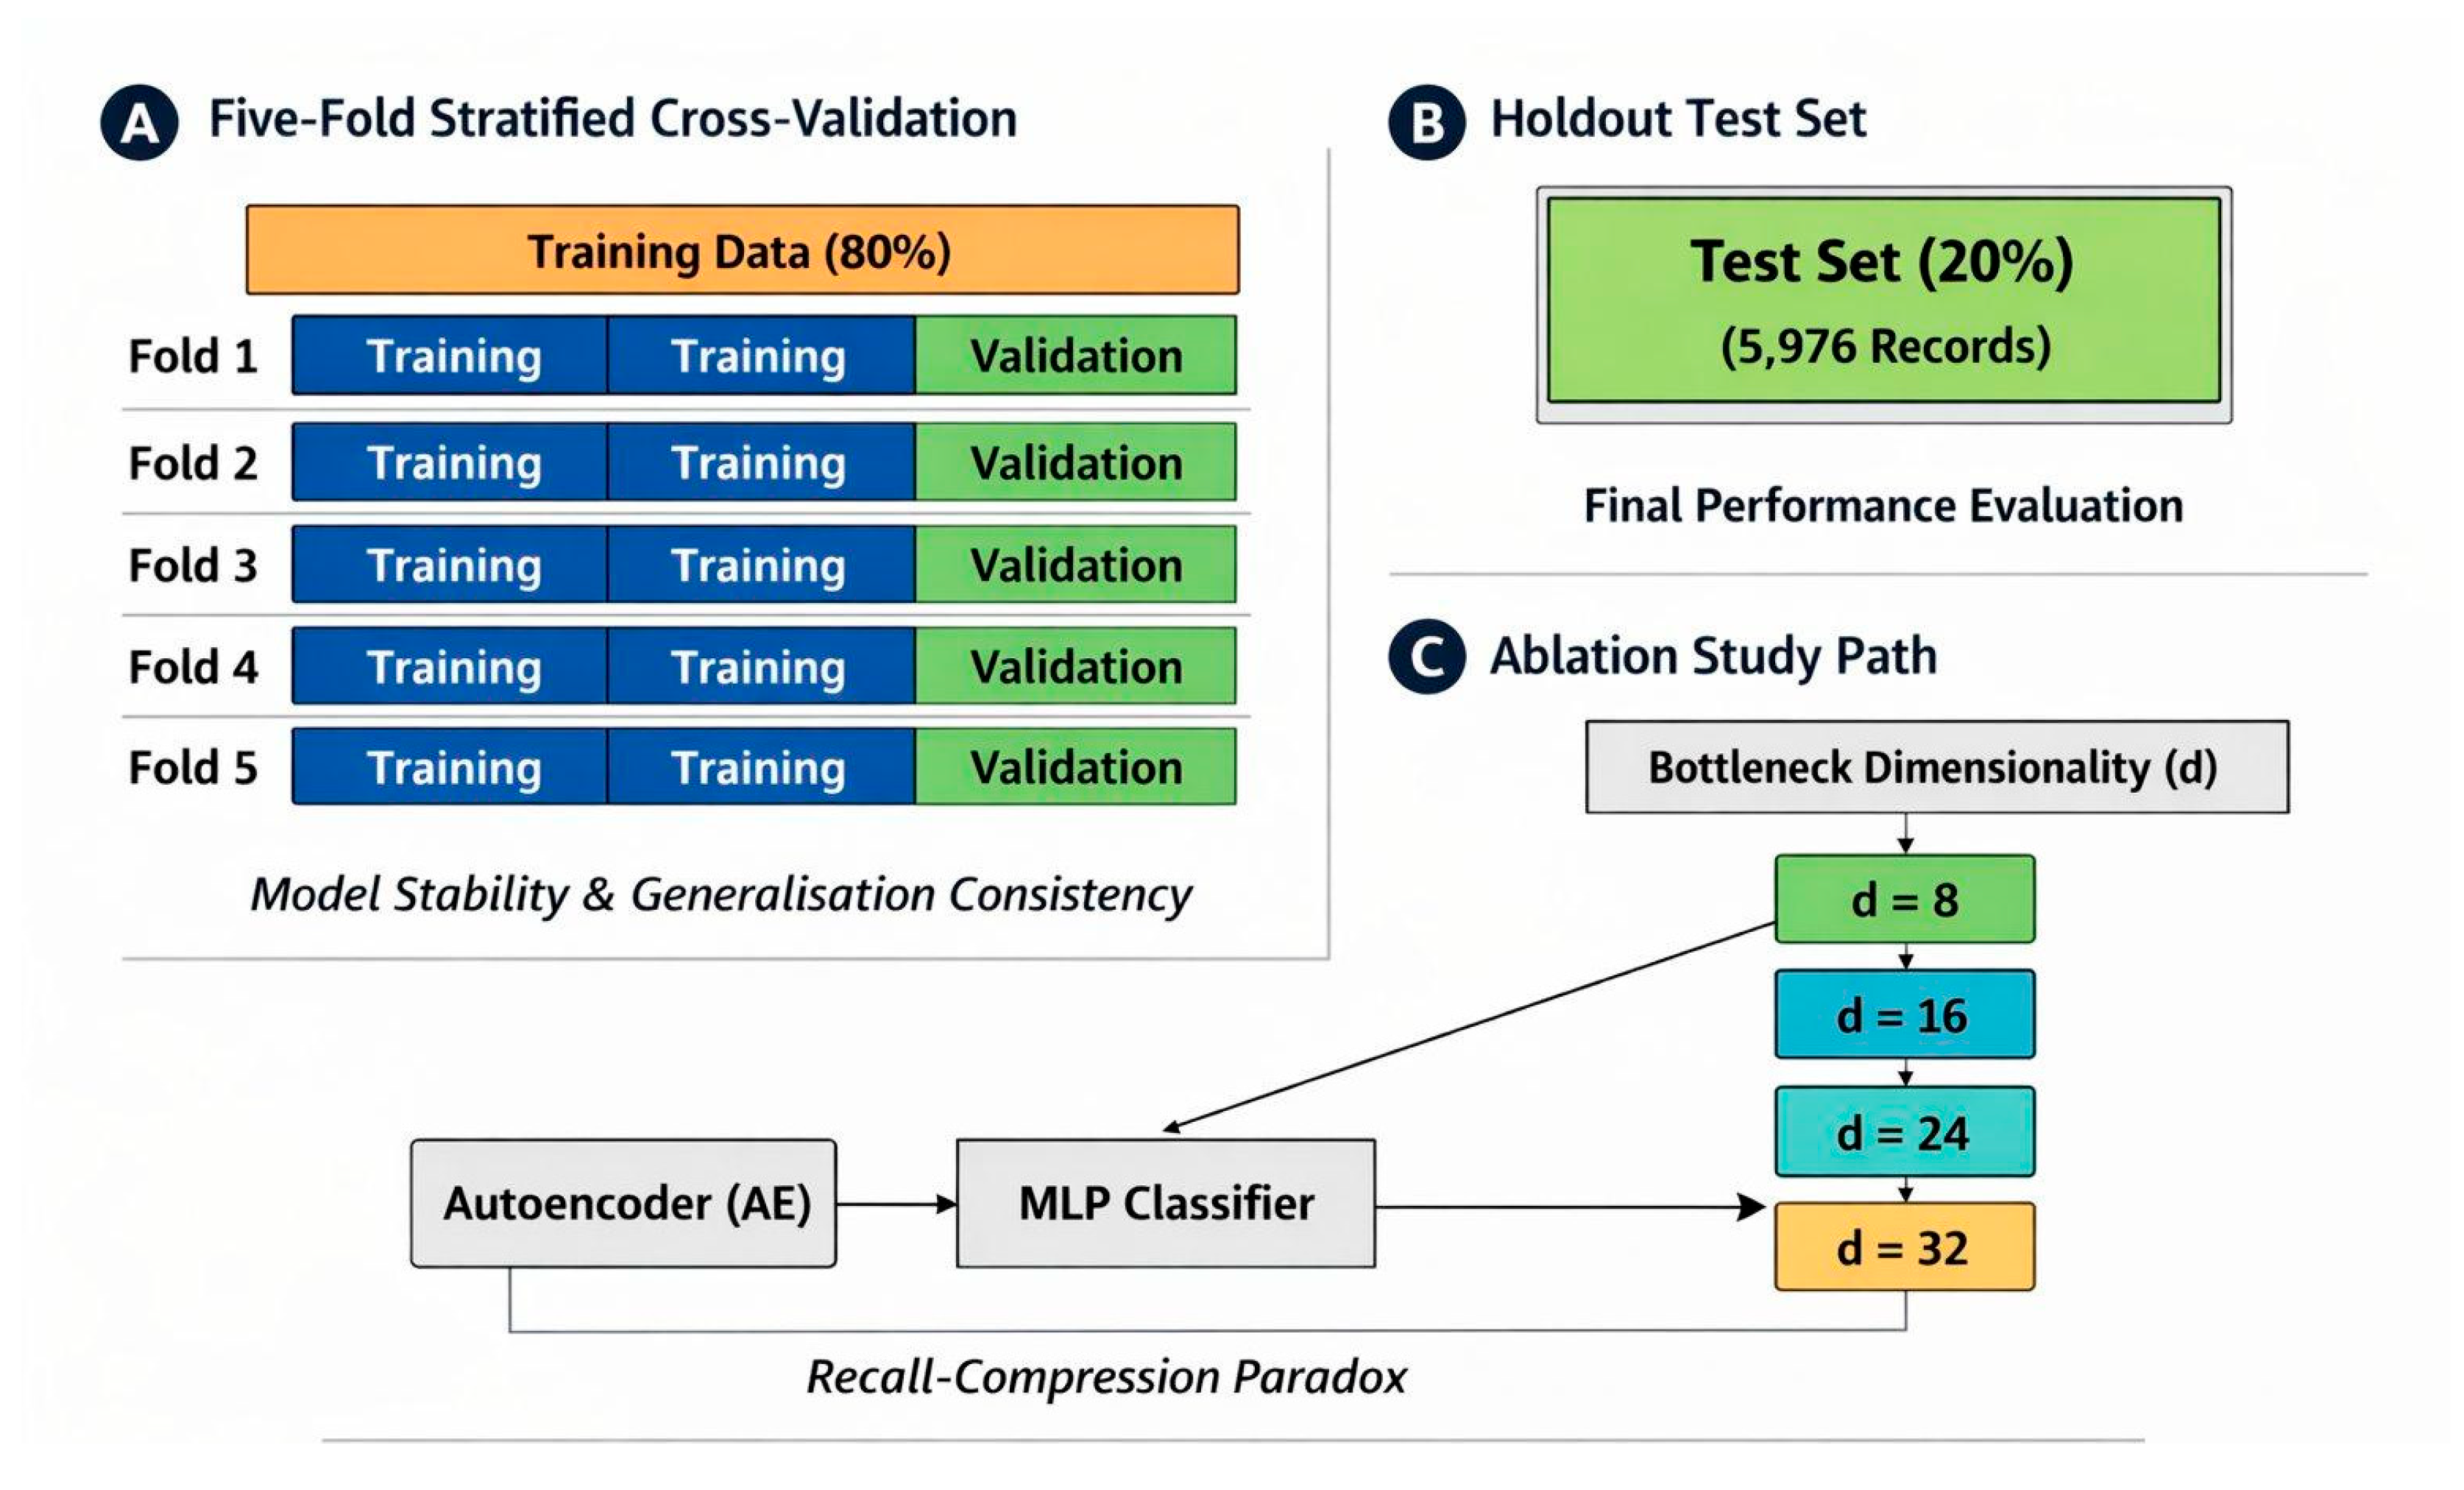
Figure 5.
Comparison of Insider Threat Detection Frameworks. Horizontal bars show accuracy and recall (where reported); right-side markers indicate inclusion of Explainable AI (XAI) methods and Cross-Validation (CV).
Figure 5.
Comparison of Insider Threat Detection Frameworks. Horizontal bars show accuracy and recall (where reported); right-side markers indicate inclusion of Explainable AI (XAI) methods and Cross-Validation (CV).
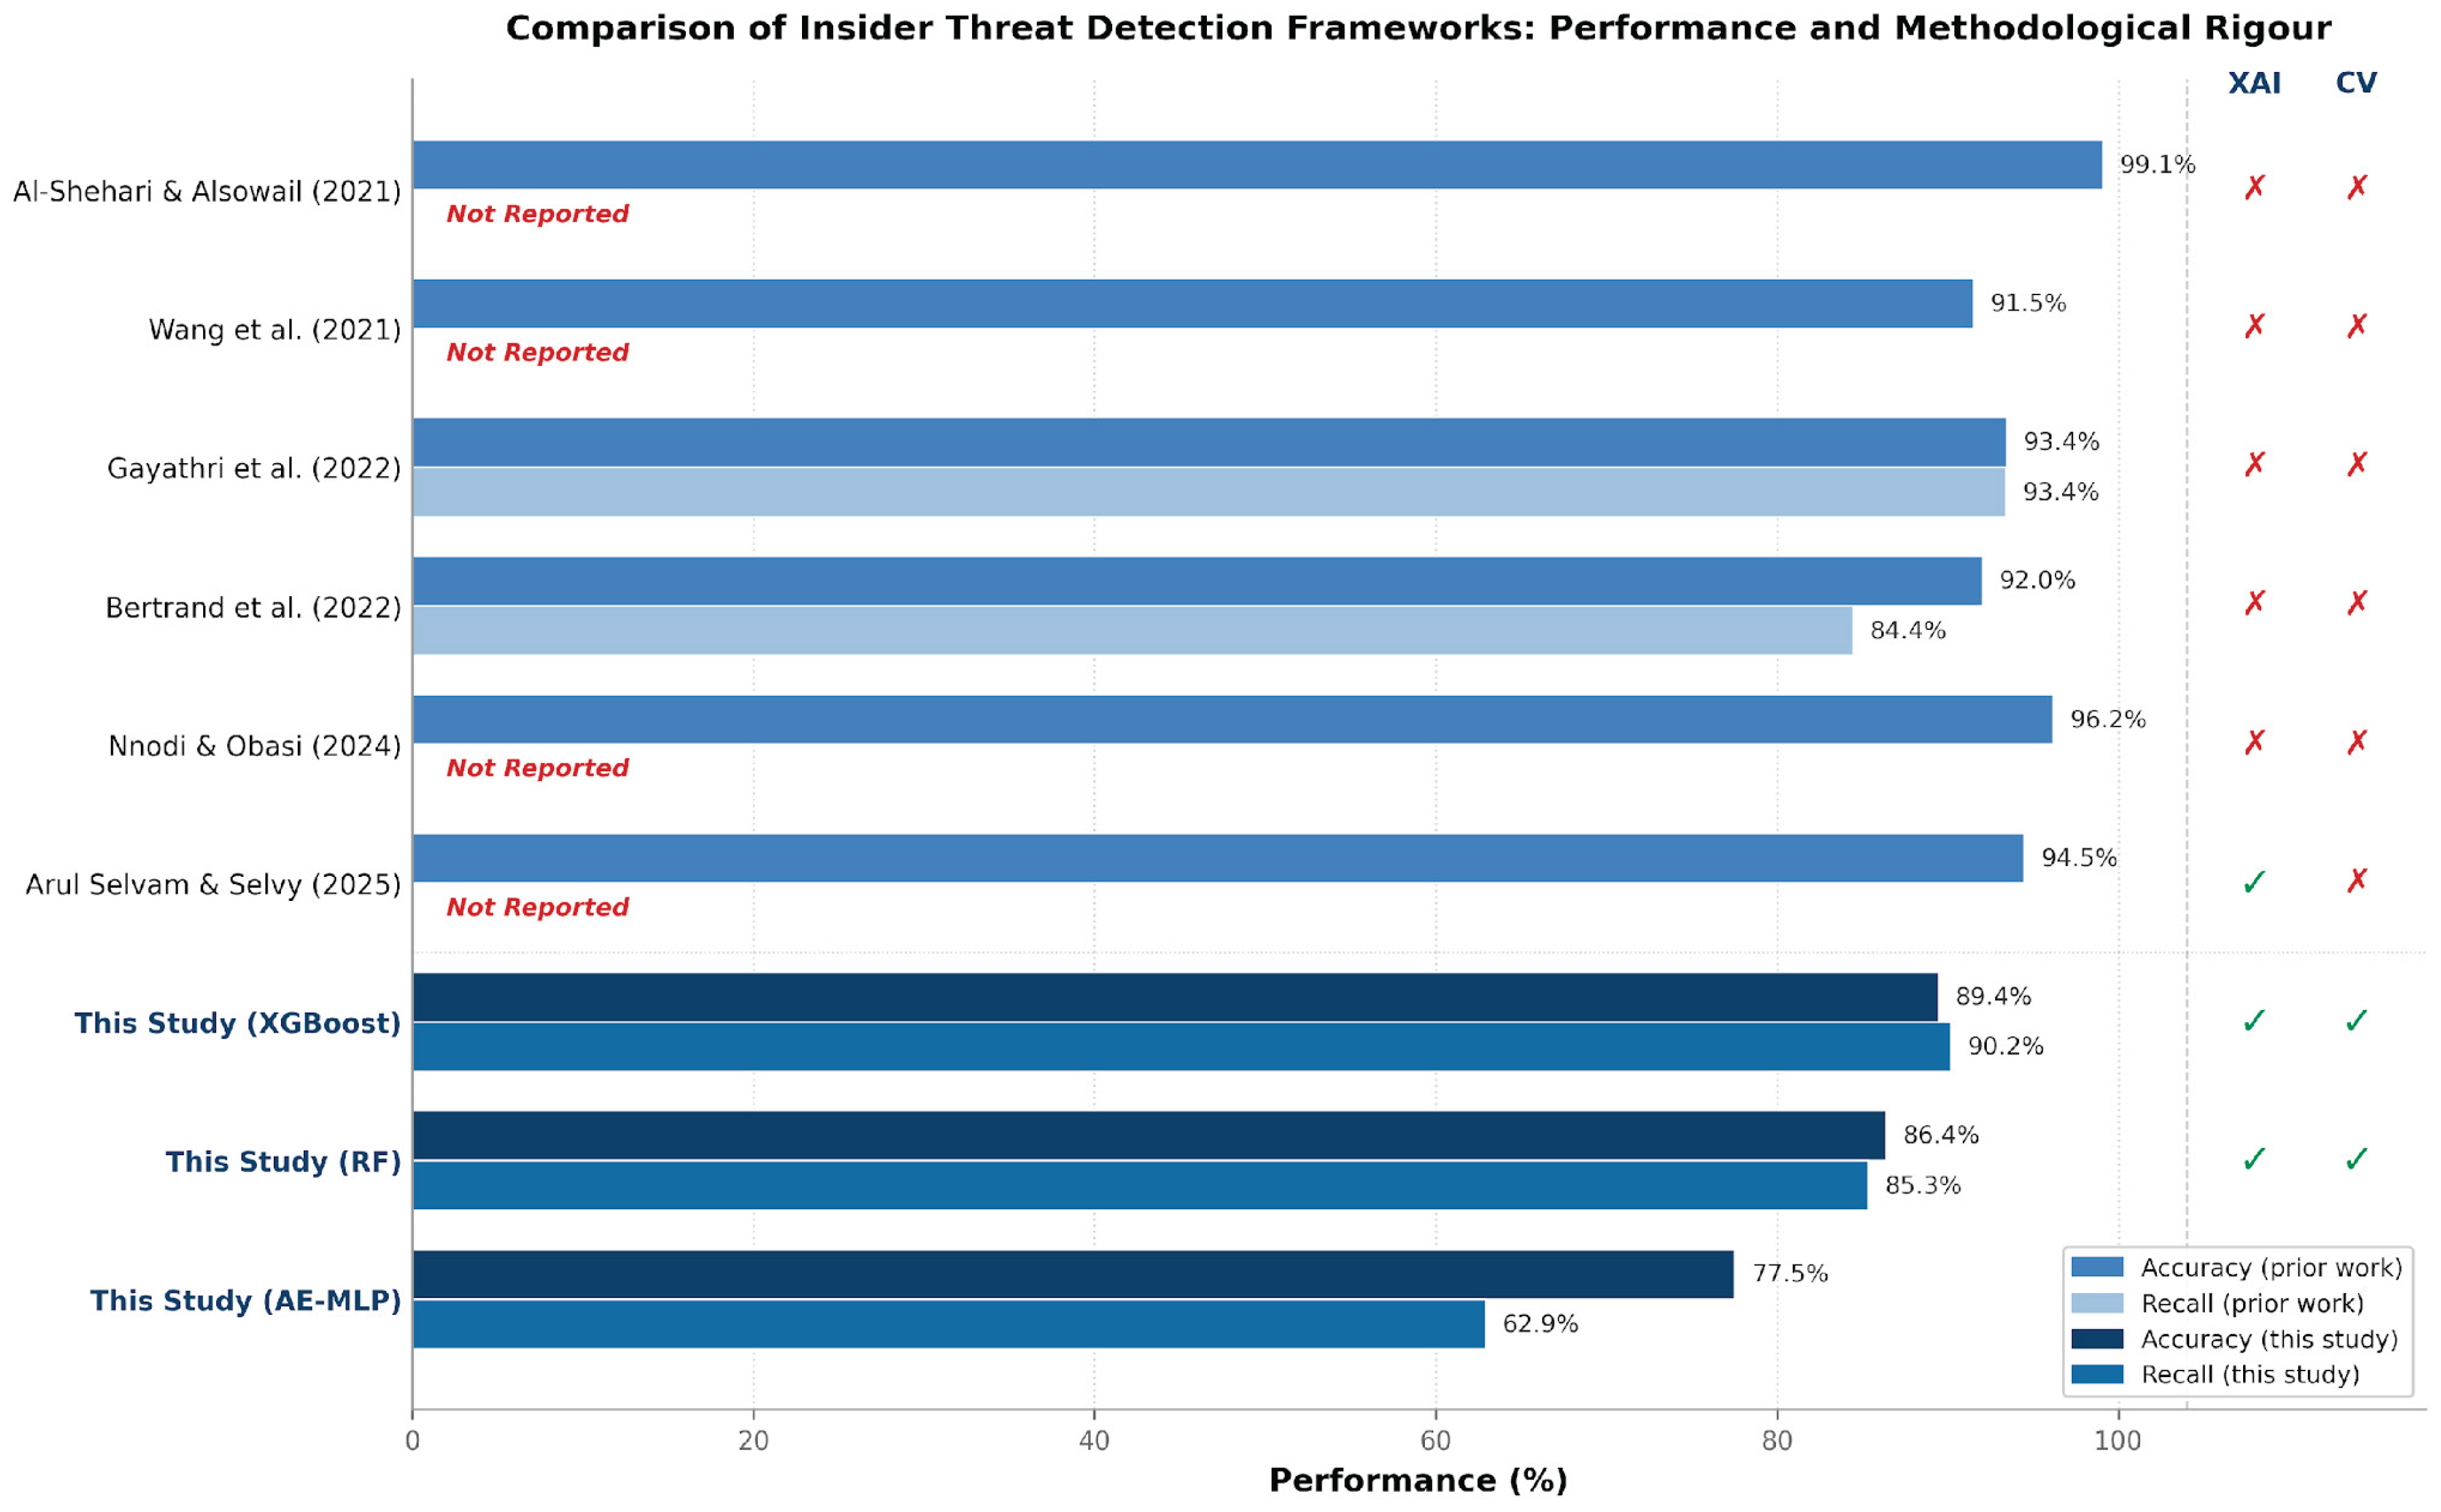
Table 4.
Comparative Class Distribution Before and After Preprocessing.
| Phase | Class | Records | Proportion (%) | Purpose |
| Initial (Raw) | Non-Malicious | 284,940 | 95.02 | Raw organisational telemetry |
| Initial (Raw) | Malicious | 14,940 | 4.98 | Rarity of insider threats |
| Final (Balanced) | Non-Malicious | 14,940 | 50.00 | Random undersampling applied |
| Final (Balanced) | Malicious | 14,940 | 50.00 | Unbiased supervised learning |
Table 7.
Confusion Matrix Decomposition for All Models (Test Set: 5,976 Records).
| Model | True Positive (TP) | False Positive (FP) | True Negative (TN) | False Negative (FN) | Total Test |
| XGBoost | 2,694 | 337 | 2,651 | 294 | 5,976 |
| Random Forest | 2,550 | 376 | 2,612 | 438 | 5,976 |
| MLP | 2,347 | 379 | 2,609 | 641 | 5,976 |
| AE-MLP | 1,879 | 235 | 2,753 | 1,109 | 5,976 |
Table 8.
Feature Importance Ranking for Ensemble Models (Top 10 Features by Mean Permutation Importance on Held-Out Test Set).
Table 8.
Feature Importance Ranking for Ensemble Models (Top 10 Features by Mean Permutation Importance on Held-Out Test Set).
| Rank | Feature | RF | XGBoost | Ensemble Mean |
| 1 | employee_seniority_years | 0.1211 | 0.1614 | 0.1412 |
| 2 | employee_classification | 0.0806 | 0.0885 | 0.0846 |
| 3 | total_files_burned | 0.0352 | 0.0497 | 0.0425 |
| 4 | has_foreign_citizenship | 0.0385 | 0.0317 | 0.0351 |
| 5 | is_contractor | 0.0264 | 0.0252 | 0.0258 |
| 6 | num_unique_campus | 0.0265 | 0.0192 | 0.0228 |
| 7 | has_medical_history | 0.0232 | 0.0191 | 0.0212 |
| 8 | num_bw_prints | 0.0167 | 0.0130 | 0.0148 |
| 9 | has_criminal_record | 0.0118 | 0.0169 | 0.0143 |
| 10 | num_print_commands | 0.0056 | 0.0178 | 0.0117 |
Table 9.
Five-Fold Stratified Cross-Validation Results (Mean ± Std).
| Model | Accuracy | Precision | Recall | F1-Score | ROC-AUC |
| Random Forest | 0.8614 ± 0.0050 | 0.8680 ± 0.0032 | 0.8525 ± 0.0080 | 0.8602 ± 0.0054 | 0.9435 ± 0.0037 |
| XGBoost | 0.8949 ± 0.0061 | 0.8938 ± 0.0077 | 0.8964 ± 0.0058 | 0.8951 ± 0.0060 | 0.9680 ± 0.0029 |
| MLP | 0.8228 ± 0.0058 | 0.8530 ± 0.0147 | 0.7809 ± 0.0252 | 0.8149 ± 0.0090 | 0.9170 ± 0.0027 |
| AE-MLP (d=16) | 0.7821 ± 0.0062 | 0.8494 ± 0.0086 | 0.6857 ± 0.0107 | 0.7588 ± 0.0075 | 0.8709 ± 0.0040 |
Table 11.
AE-MLP Ablation Study: Detection Performance by Bottleneck Size.
| Bottleneck (d) | Compression Ratio | Accuracy | Precision | Recall | F1-Score | ROC-AUC |
| 8 | 1:4.6 | 0.7567 ± 0.0067 | 0.8246 ± 0.0170 | 0.6529 ± 0.0163 | 0.7285 ± 0.0082 | 0.8403 ± 0.0052 |
| 16 | 1:2.3 | 0.7778 ± 0.0086 | 0.8343 ± 0.0129 | 0.6938 ± 0.0207 | 0.7573 ± 0.0116 | 0.8674 ± 0.0063 |
| 24 | 1:1.5 | 0.7872 ± 0.0079 | 0.8328 ± 0.0225 | 0.7200 ± 0.0165 | 0.7719 ± 0.0068 | 0.8779 ± 0.0073 |
| 32 | 1:1.2 | 0.7904 ± 0.0046 | 0.8498 ± 0.0204 | 0.7068 ± 0.0242 | 0.7711 ± 0.0080 | 0.8862 ± 0.0028 |
Disclaimer/Publisher’s Note: The statements, opinions and data contained in all publications are solely those of the individual author(s) and contributor(s) and not of MDPI and/or the editor(s). MDPI and/or the editor(s) disclaim responsibility for any injury to people or property resulting from any ideas, methods, instructions or products referred to in the content. |
© 2026 by the authors. Licensee MDPI, Basel, Switzerland. This article is an open access article distributed under the terms and conditions of the Creative Commons Attribution (CC BY) license (http://creativecommons.org/licenses/by/4.0/).
Copyright: This open access article is published under a Creative Commons CC BY 4.0 license, which permit the free download, distribution, and reuse, provided that the author and preprint are cited in any reuse.