
Submitted:
19 October 2026
Posted:
20 October 2026
You are already at the latest version
Abstract
Consumer wearables increasingly report sleep stages, yet many low-cost fitness b ands c arry only an accelerometer and no optical heart-rate sensor. This paper measures how far deep learning can take four-class sleep staging (Wake, Light, Deep and REM) from wrist motion alone, and what photoplethysmography (PPG) heart rate adds. A one-dimensional convolutional encoder with attention pooling learns an embedding from each raw 30-second tri-axial acceleration epoch, and a bidirectional long short-term memory (BiLSTM) network reads 20 consecutive epochs of context. Four model configurations are compared under identical subject-wise five-fold cross-validation on the 31-subject Apple Watch dataset of Walch et al., which was recorded alongside clinical polysomnography. Motion alone reaches Cohen’s κ = 0.101, heart rate alone 0.327, and the two combined 0.346. A paired bootstrap over subjects shows that heart rate adds +0.244 to motion (95% CI +0.202 to +0.284), whereas motion adds only +0.018 to heart rate (95% CI −0.005 to +0.042), which is not significant. The per-class analysis shows that the two signals are complementary: motion is the better sleep/wake discriminator (binary κ 0.419 against 0.242), while heart rate supplies almost all of the separation between Deep and REM sleep. An accelerometer-only band can therefore estimate how long a person slept, but not the architecture of that sleep.
Keywords:
sleep stage classification
; deep learning
; wearable sensors
; accelerometer
; actigraphy
; photoplethysmography
; heart rate
; convolutional neural network
; BiLSTM
; attention
; Cohen’s Kappa
1. Introduction
Sleep is scored clinically by polysomnography (PSG): an overnight laboratory recording of brain activity (EEG), eye movement and muscle tone that a trained technician divides into 30-second epochs and labels by stage according to the American Academy of Sleep Medicine (AASM) rules [1]. PSG is accurate but expensive, needs a laboratory bed, and captures one or two nights. Wrist-worn devices offer the opposite trade-off: they are cheap, comfortable and can record every night for months, but they see only indirect signals of sleep.
The oldest of those signals is movement. Wrist actigraphy algorithms such as Cole–Kripke [2] and Sadeh [3] score activity counts to separate sleep from wake, and they remain widely used. They were never designed to separate the stages within sleep. Light, Deep and REM sleep are all largely motionless, and the cues that distinguish them come mainly from the brain and the autonomic nervous system. Recent studies therefore combine movement with cardiac signals such as PPG or ECG, or use cardiac signals alone [4,5,6,7].
That pairing leaves an open question. Many fitness bands in circulation carry an accelerometer but no PPG sensor, for reasons of cost or battery life. If deep learning applied to raw motion could recover the sleep stages, those devices could report sleep architecture at no extra hardware cost. If it cannot, it is worth knowing exactly what is lost without heart rate, and why.
This paper answers that question on a public dataset, with every configuration trained and tested on identical subject-wise splits. Its contributions are:
- A deep model that learns directly from the raw 30 Hz tri-axial acceleration waveform, combining a 1-D CNN encoder, attention pooling and a BiLSTM over 10 minutes of context, with no hand-crafted motion features and no time-of-day prior.
- A controlled comparison of four configurations (motion without context, motion, heart rate, and motion plus heart rate) using Cohen’s , macro F1 and a paired bootstrap over subjects.
- A per-class and signal-level analysis showing why the configurations differ: motion detects wakefulness, while heart-rate variability separates Deep from REM sleep.
- A data pipeline that measures the raw files instead of trusting their documentation, and rejects sensor dropouts that would otherwise masquerade as deep sleep.
2. Literature Review
Classical actigraphy. Cole et al. [2] derived a weighted sum of wrist activity counts over neighbouring minutes and validated it against PSG in 41 subjects, reaching about 88% epoch agreement for sleep versus wake. Sadeh et al. [3] studied the methodological choices behind activity-based scoring, such as which wrist is used and how sensitive the scoring is, with concurrent PSG in adults and adolescents. Both methods remain the reference for wrist actigraphy, and both are strictly binary: they say whether a person is asleep, not in which stage.
Machine learning on wrist movement. Palotti et al. [8] benchmarked traditional actigraphy algorithms against machine-learning methods for sleep/wake classification on the large MESA cohort. Sundararajan et al. [9] trained random forests on features of raw wrist acceleration from 134 adults in three studies and reached an F1 score of 73.9% for sleep versus wake on unseen subjects, but reported that classifying the individual sleep stages from the accelerometer alone was difficult. That observation is the starting point of the present study, which asks whether a deep model on the raw waveform changes the picture.
Movement plus cardiac signals. Walch et al. [4] collected the Apple Watch dataset used here and compared logistic regression, k-nearest neighbours, random forests and a multilayer perceptron on features of motion, heart rate and a circadian “clock proxy”. They reported 90% accuracy for sleep/wake and about 72% for the three classes Wake, NREM and REM, with the combined features clearly ahead of any single one. Zhai et al. [5] compared CNN and LSTM models with traditional machine learning on movement and cardiac data from 1,743 participants; their ensemble reached 78.2% accuracy and 69.8% F1 on a three-stage task. Fonseca et al. [6] fed 132 ECG-derived heart-rate-variability (HRV) features and actigraphy into an LSTM and reached on four classes (Wake, N1–N2, N3, REM) in a sleep-disordered population.
Cardiac signals alone. Radha et al. [7] trained a stacked bidirectional LSTM on HRV features from 584 nights of 292 participants and obtained (accuracy 77.0%). SleepPPG-Net [10] applies a residual CNN and a temporal convolutional network to the raw PPG waveform of 2,374 patients and reaches a median of 0.75 on four classes, 0.74 on an external database. These studies use continuous ECG or PPG waveforms, which carry beat-to-beat information that the coarse heart-rate stream of a consumer watch does not.
EEG-based deep learning. With the brain signal available, deep models approach expert scorers. DeepSleepNet [11] combines convolutional feature extraction with a bidirectional LSTM that learns stage transitions, reaching 86.2% accuracy (macro F1 81.7%) on MASS and 82.0% on Sleep-EDF from a single raw EEG channel. SeqSleepNet [12] adds attention inside a hierarchical recurrent network and reports 87.1% accuracy and on 200 subjects, and U-Time [13] shows that a fully convolutional encoder–decoder can segment sleep stages without recurrence. The architecture in this paper borrows two of these ideas, a convolutional epoch encoder followed by a recurrent sequence model, and attention pooling.
The human ceiling. Expert scorers do not agree perfectly either. In the AASM inter-scorer reliability programme, more than 2,500 scorers agreed on 82.6% of epochs overall but only 67.4% for N3 and 63.0% for N1 [14], and Danker-Hopfe et al. [15] measured between scorers under the AASM rules. A wearable cannot be expected to exceed this.
Table 1 summarises these studies. Two gaps remain. First, no study isolates what deep learning on the raw accelerometer waveform can achieve for four stages, without heart rate and without a circadian prior that is not itself a motion signal. Second, studies that combine the two signals rarely measure the reverse question of what motion adds once heart rate is present, under identical subject-wise splits. This paper addresses both.
3. Methodology
3.1. Dataset
The study uses the dataset of Walch et al. [4], distributed through PhysioNet [16,17] under the Open Data Commons Attribution License. It contains 31 adults who wore an Apple Watch during a night of clinical PSG. For each subject it provides raw tri-axial acceleration, PPG-derived heart rate, step counts, and expert sleep stages for every 30-second epoch. The stages are merged into four classes: Wake; Light (N1 and N2); Deep (N3); and REM.
Before writing any parser, a probing script measured the raw files, and they disagree with the documentation in ways that would fail silently rather than raise an error. Stage code 4 (Rechtschaffen–Kales stage 4, the deepest slow-wave sleep, which the AASM later merged into N3) appears in 356 epochs although it is undocumented; treating it as unknown would have discarded about a tenth of the Deep class, which is already the scarcest. Code (unscored) appears in 438 epochs. The accelerometer sampling rate varies from 10.0 to 66.6 Hz across subjects rather than the stated 50 Hz, and some timestamps begin up to 486,000 s (5.6 days) before the study night.
After quality filtering, 25,285 of 27,211 epochs (92.9%) remain. Figure 1 shows the class balance: Light sleep is more than half of all epochs and Wake fewer than one in eleven, which is typical of a normal night but makes plain accuracy a misleading metric.
3.2. Pre-Processing
Epoch alignment. The label file defines the epoch axis, and the acceleration is mapped onto it. Deriving epochs from the accelerometer clock instead would let a device that started late shift every epoch boundary relative to the PSG scoring, a constant misalignment that no metric would reveal.
Quality gate. An epoch is kept only if real samples span at least half of its 30 seconds and no gap between consecutive samples exceeds 5 s. Interpolating across a sensor dropout produces a smooth, near-zero-variance segment, which is exactly what deep sleep looks like; without this gate a model learns that “no signal” means “Deep” and reports an inflated score. One subject (7749105) has no acceleration samples at all in 86% of its epochs, and the gate removes them.
Resampling. Because the sampling interval is irregular, each kept epoch is linearly interpolated onto a uniform 30 Hz grid (900 samples). FFT-based resampling assumes uniform input spacing and would silently distort time. A fourth channel, the vector magnitude
is added because it does not depend on how the watch sits on the wrist. Each channel is standardised with the mean and standard deviation of the training subjects only.
Heart-rate features. PPG readings arrive far more sparsely than acceleration, so heart rate is summarised per epoch as five features: mean, standard deviation, minimum, maximum, and deviation from the subject’s median heart rate over the night. Epochs without a reading get zeroed features and an explicit validity flag, so that “no measurement” is never confused with “0 bpm”.
3.3. Models Employed
Figure 2 shows the architecture. Its design follows from one observation: Deep and REM sleep both involve almost no gross movement, so a single isolated epoch cannot tell them apart. What differs is the epoch’s position in the roughly 90-minute sleep cycle, so the model classifies each epoch in context.
Epoch encoder. Three convolutional blocks (32, 64 and 128 filters, kernel size 7, batch normalisation, GELU activation, max-pooling by 2 and dropout) turn a epoch into a feature map .
Attention pooling. Most of a sleeping epoch is quiet, so averaging over time would dilute the few informative moments. Instead, additive attention learns a weight for each time step:
where , , and are learned and is the epoch embedding.
Context model. A single-layer bidirectional LSTM [18] with 128 hidden units per direction reads the 20 epoch embeddings of a window (10 minutes) and a linear layer outputs four-class logits for every epoch in the window. When heart rate is used, its six inputs pass through a two-layer perceptron (32 units) and are concatenated with z before the BiLSTM.
Four configurations are compared (Table 2). They share every hyper-parameter, fold and random seed; only the inputs and the context model change.
3.4. Training Procedure
Subject-wise cross-validation. One night yields about a thousand epochs from one person, and neighbouring epochs from the same wrist are far more alike than epochs from different people. Splitting by epoch would let a model score well by recognising the wearer. The 31 subjects are therefore divided into five folds; in each fold the held-out subjects are used only for testing, four of the remaining subjects are used for checkpoint selection, and the rest for training. An assertion that no subject appears in two roles runs at the start of every training run, and the fold assignment is saved and reused by every configuration.
Loss. Weighted cross-entropy is used, with masked epochs ignored. The weight of class c is the inverse class frequency raised to the power 0.5,
where is the number of training epochs of class c and the predicted probability of the true class. Full inverse frequency (power 1.0) was also tried: it predicted Deep for 9,946 epochs against Light’s 6,498 although Light is four times as common, and its accuracy (0.346) fell below the 55% obtained by always answering “Light”. The square root is the usual compromise between learning the rare classes and keeping the prior.
Optimisation. AdamW [19] (learning rate , weight decay ) with cosine annealing, batches of 32 windows, gradient clipping at norm 5, dropout 0.2, and 8 epochs per fold. Training windows overlap by half (stride 10 epochs) as a form of augmentation; the checkpoint with the best validation macro F1 is kept. One complete five-fold run took under five minutes on an Apple-silicon laptop GPU using PyTorch [20] and its MPS backend.
3.5. Evaluation Metrics
Accuracy is reported but is not the primary metric, since answering “Light” for every epoch already scores 55%. For each class c, with , and the true positives, false positives and false negatives,
The primary metric is Cohen’s kappa [21], which measures agreement with the PSG labels beyond what chance alone would produce:
where is the observed agreement (accuracy) and the agreement expected by chance from the two label distributions. On the commonly used scale of Landis and Koch [22], 0.21–0.40 is “fair” and 0.41–0.60 “moderate”; this study takes as the target. A binary sleep/wake is also reported, by merging the three sleep stages.
Metrics are pooled over all held-out epochs of all five folds. Evaluation windows tile each recording without overlap except for the final window, which is aligned to the recording’s end, so 284 of the 25,569 scored predictions (1.1%) repeat an epoch already scored; removing them changes pooled by at most 0.001 for every configuration. Differences between configurations are tested with a paired bootstrap over subjects (1,000 resamples): subjects rather than epochs are resampled because epochs within one night are not independent, and the same resample is applied to both configurations being compared.
3.6. Use of AI Tools
Claude (Anthropic), an AI assistant, was used to help write the analysis code and to draft and edit the text of this paper. The authors reviewed the code, results and text, and take full responsibility for the content.
4. Results and Discussion
4.1. Overall Comparison
Table 3 and Figure 3 summarise the four configurations. None of them reaches the target, and there is a clear divide between the configurations with heart rate and those without.
Motion alone is not enough. The accelerometer-only model reaches , well inside the “slight” band. Its accuracy (0.517) is even below the 55% majority baseline: class weighting pushes it to attempt the rare stages, and it mostly gets them wrong. Its per-class F1 for Deep (0.090) and REM (0.105) shows where it fails.
Heart rate carries the stage information. Heart rate alone reaches , more than three times the motion-only figure, and adding motion to it raises this only to 0.346.
Context matters, narrowly. Removing the BiLSTM lowers from 0.101 to 0.078. The model without context almost never predicts Deep or REM (36 and 101 times in 25,569 epochs) and collapses onto the two classes motion can detect, Wake and Light; its seemingly higher accuracy (0.568) comes entirely from predicting Light.
4.2. Statistical Comparison
Figure 4 shows the paired-bootstrap differences. Adding heart rate to motion improves by (95% CI to ), and heart rate alone beats motion alone by ( to ). The reverse comparison is the decisive one: adding motion to heart rate gives , with an interval ( to ) that contains zero. At this sample size, the accelerometer brings no detectable benefit once heart rate is available. Removing temporal context costs ( to ), an interval that only just excludes zero.
4.3. Per-Class Analysis: Two Complementary Signals
The headline hides the most useful finding. Table 4 and Figure 5 and Figure 6 show that motion and heart rate are not stronger and weaker versions of one signal; they answer different questions.
Motion decides whether a person is awake. The accelerometer-only model attains a binary sleep/wake of 0.419 against 0.242 for heart rate alone, and a higher Wake F1 (0.471 against 0.291). This is why classical actigraphy has been clinically useful for sleep/wake scoring for decades [2,3].
Heart rate decides which stage of sleep. Heart rate lifts Deep F1 from 0.090 to 0.487 and REM F1 from 0.105 to 0.531, in exactly the regime where motion is nearly blind.
Combining both gives the best binary (0.443), the best Wake and REM F1, and the best macro F1 (0.537). The four-class barely moves because it is dominated by the three sleep-stage distinctions, where motion contributes little; motion is not uninformative in general.
4.4. Why the Signals Differ
To check that the models reflect the physiology rather than an artefact, the two raw signals were compared stage by stage within each person (Table 5), for the 28 subjects with at least 10 usable epochs of Wake, Deep and REM. Movement is the per-epoch standard deviation of the acceleration magnitude, and heart-rate spread the per-epoch standard deviation of heart rate.
Wake is visible in motion for almost everyone. Deep and REM sleep, however, are separated not by the level of heart rate (REM is higher for only 17 of 28 people, by a median of 0.5 bpm) but by its variability, which is higher in REM for 27 of 28. This matches the familiar autonomic pattern of sleep, a steady heart rhythm in slow-wave sleep and an irregular one in REM, which is also why HRV-based stagers work [6,7]; it explains why the per-epoch heart-rate standard deviation is such a useful feature here. A wrist that is equally still in both stages offers no comparable cue.
4.5. Qualitative Results
Figure 7 plots one full night (subject 781756, 8.2 hours, 977 scored epochs) for the combined model, on the real time axis with each epoch counted once. The model agrees with the PSG on 63.6% of epochs. It tracks Light sleep well (77.5% of Light epochs correct) but labels most of the long REM periods as Light: only 29.8% of this subject’s 235 REM epochs are called REM, against a REM recall of 58.1% across all subjects. It also predicts Wake about twice as often as the PSG (171 against 83 epochs), mostly in bursts of one to three epochs. Single nights can therefore be considerably worse than the pooled figures suggest.
Figure 8 shows the training curves averaged over folds. For every configuration the fold-averaged validation macro F1 varies by less than 0.01 over the last three epochs, so the large gap between configurations is not an artefact of the short training budget, although longer training might add a little to each.
4.6. Comparison with Prior Work
Direct comparison with Table 1 is limited, because the studies differ in dataset, number of classes and input signals, but the broad picture is consistent. The motion-only result agrees with Sundararajan et al. [9], who also found staging from the accelerometer alone difficult even with 134 subjects; this study shows the same with a deep model on the raw waveform. The combined model’s is well below the 0.60–0.61 of HRV-based LSTMs [6,7] and the 0.75 of SleepPPG-Net [10]. Those models see continuous ECG or PPG waveforms with beat-to-beat timing and were trained on hundreds to thousands of nights; the consumer watch here provides only a sparse heart-rate stream for 31 nights. That gap points to the cardiac signal, not to motion, as the place where a wearable stager gains its accuracy. All automatic methods remain below the inter-scorer agreement of human experts ( [15]).
4.7. Limitations
Sample size. Thirty-one subjects is small. The interval for adding motion to heart rate reaches , so a modest true benefit cannot be ruled out; the correct reading is “no detectable benefit at this sample size”.
One device, one night. All data come from one watch model in one study, with one night per person. The sampling rate varies from 10 to 67 Hz between subjects, which suggests heterogeneous recording conditions even within this cohort.
Limited tuning. Every configuration used the same hyper-parameters and an 8-epoch budget, with no hyper-parameter search; absolute scores would probably rise with tuning, though the comparisons are internally consistent.
Class weighting. The weighting exponent moves and accuracy in opposite directions (power 1.0 gave for motion alone but accuracy 0.346). All configurations use the same exponent, so the comparison is fair, but absolute values depend mildly on this choice.
Heart-rate baseline. The per-subject baseline is the median over the whole night, including epochs that are later scored. This is realistic for a device that scores a night after it ends, but it would not hold for real-time staging.
5. Conclusions
This study compared four deep-learning configurations for four-class sleep staging from a wrist-worn consumer device, under identical subject-wise cross-validation. From the raw accelerometer alone, the best model reaches Cohen’s , far below a usable level, and adding the accelerometer to heart rate produces no statistically detectable gain (, 95% CI to ). The hypothesis that motivated the work, that a motion-only band could report sleep architecture, is not supported.
The more useful finding is the decomposition. Motion and heart rate are complementary: motion determines wakefulness (binary 0.419 against 0.242), while heart rate, and specifically its variability, determines the stage of sleep. This explains both why classical actigraphy works for its intended sleep/wake task and why extending it to four stages fails. In practice, a band without an optical heart-rate sensor can honestly report total sleep time and sleep efficiency, but should not present Deep and REM breakdowns.
Several directions could extend this work. Larger cohorts, and repeated nights per person, would narrow the confidence intervals and allow per-person calibration. Self-supervised pre-training on large unlabelled accelerometry collections could improve the motion encoder. Beat-to-beat (inter-beat interval) data, rather than the coarse heart-rate stream used here, would allow proper heart-rate-variability features. Finally, temporal convolutional or transformer context models over a whole night could capture the 90-minute sleep cycle more directly than a 10-minute window. The code, including an interactive dashboard that replays each night, is available at https://github.com/ameyypawar/sleep-accel-dl.
Institutional Review Board Statement
Data Availability Statement
The dataset is openly available on PhysioNet [16]. The code that produces every result reported here is available at
.
Conflicts of Interest
The authors declare no conflicts of interest.
References
- Berry, R. B.; et al. The AASM Manual for the Scoring of Sleep and Associated Events: Rules, Terminology and Technical Specifications; American Academy of Sleep Medicine: Darien, IL, USA, 2012. [Google Scholar]
- Cole, R. J.; Kripke, D. F.; Gruen, W.; Mullaney, D. J.; Gillin, J. C. Automatic sleep/wake identification from wrist activity. Sleep 1992, vol. 15(no. 5), 461–469. [Google Scholar] [CrossRef] [PubMed]
- Sadeh, A.; Sharkey, K. M.; Carskadon, M. A. Activity-based sleep-wake identification: An empirical test of methodological issues. Sleep 1994, vol. 17(no. 3), 201–207. [Google Scholar] [CrossRef] [PubMed]
- Walch, O.; Huang, Y.; Forger, D.; Goldstein, C. Sleep stage prediction with raw acceleration and photoplethysmography heart rate data derived from a consumer wearable device. Sleep 2019, vol. 42(no. 12), Art. no. zsz180. [Google Scholar] [CrossRef] [PubMed]
- Zhai, B.; Perez-Pozuelo, I.; Clifton, E. A. D.; Palotti, J.; Guan, Y. Making sense of sleep: Multimodal sleep stage classification in a large, diverse population using movement and cardiac sensing. Proc. ACM Interact. Mob. Wearable Ubiquitous Technol. 2020, vol. 4(no. 2), 1–33. [Google Scholar] [CrossRef]
- Fonseca, P.; van Gilst, M. M.; Radha, M.; Ross, M.; Moreau, A.; Cerny, A.; Anderer, P.; Long, X.; van Dijk, J. P.; Overeem, S. Automatic sleep staging using heart rate variability, body movements, and recurrent neural networks in a sleep disordered population. Sleep 2020, vol. 43(no. 9), Art. no. zsaa048. [Google Scholar] [CrossRef] [PubMed]
- Radha, M.; Fonseca, P.; Moreau, A.; et al. Sleep stage classification from heart-rate variability using long short-term memory neural networks. Sci. Rep. 2019, vol. 9, Art. no. 14149. [Google Scholar] [CrossRef] [PubMed]
- Palotti, J.; Mall, R.; Aupetit, M.; Rueschman, M.; Singh, M.; Sathyanarayana, A.; Taheri, S.; Fernandez-Luque, L. Benchmark on a large cohort for sleep-wake classification with machine learning techniques. npj Digit. Med. 2019, vol. 2, Art. no. 50. [Google Scholar] [CrossRef] [PubMed]
- Sundararajan, K.; Georgievska, S.; te Lindert, B. H. W.; Gehrman, P. R.; Ramautar, J. R.; Mazzotti, D. R.; Sabia, S.; Weedon, M. N.; Van Someren, E.; Ridder, L.; Wang, J.; van Hees, V. T. Sleep classification from wrist-worn accelerometer data using random forests. Sci. Rep. 2021, vol. 11, Art. no. 24. [Google Scholar] [CrossRef] [PubMed]
- Kotzen, K.; Charlton, P. H.; Salabi, S.; Amar, L.; Landesberg, A.; Behar, J. A. SleepPPG-Net: A deep learning algorithm for robust sleep staging from continuous photoplethysmography. IEEE J. Biomed. Health Inform. 2023, vol. 27(no. 2), 924–932. [Google Scholar] [CrossRef] [PubMed]
- Supratak, A.; Dong, H.; Wu, C.; Guo, Y. DeepSleepNet: A model for automatic sleep stage scoring based on raw single-channel EEG. IEEE Trans. Neural Syst. Rehabil. Eng. 2017, vol. 25(no. 11), 1998–2008. [Google Scholar] [CrossRef] [PubMed]
- Phan, H.; Andreotti, F.; Cooray, N.; Chén, O. Y.; De Vos, M. SeqSleepNet: End-to-end hierarchical recurrent neural network for sequence-to-sequence automatic sleep staging. IEEE Trans. Neural Syst. Rehabil. Eng. 2019, vol. 27(no. 3), 400–410. [Google Scholar] [CrossRef] [PubMed]
- Perslev, M.; Jensen, M. H.; Darkner, S.; Jennum, P. J.; Igel, C. U-Time: A fully convolutional network for time series segmentation applied to sleep staging. Proc. Adv. Neural Inf. Process. Syst. (NeurIPS), 2019; vol. 32. [Google Scholar]
- Rosenberg, R. S.; Van Hout, S. The American Academy of Sleep Medicine inter-scorer reliability program: Sleep stage scoring. J. Clin. Sleep Med. 2013, vol. 9(no. 1), 81–87. [Google Scholar] [CrossRef] [PubMed]
- Danker-Hopfe, H.; Anderer, P.; Zeitlhofer, J.; et al. Interrater reliability for sleep scoring according to the Rechtschaffen & Kales and the new AASM standard. J. Sleep Res. 2009, vol. 18(no. 1), 74–84. [Google Scholar] [CrossRef] [PubMed]
- Walch, O. Motion and heart rate from a wrist-worn wearable and labeled sleep from polysomnography (version 1.0.0). PhysioNet 2019. [Google Scholar] [CrossRef]
- Goldberger, A. L.; Amaral, L. A. N.; Glass, L.; Hausdorff, J. M.; Ivanov, P. Ch.; Mark, R. G.; Mietus, J. E.; Moody, G. B.; Peng, C.-K.; Stanley, H. E. PhysioBank, PhysioToolkit, and PhysioNet: Components of a new research resource for complex physiologic signals. Circulation 2000, vol. 101(no. 23), e215–e220. [Google Scholar] [CrossRef] [PubMed]
- Hochreiter, S.; Schmidhuber, J. Long short-term memory. Neural Comput. 1997, vol. 9(no. 8), 1735–1780. [Google Scholar] [CrossRef] [PubMed]
- Loshchilov, I.; Hutter, F. Decoupled weight decay regularization. Proc. Int. Conf. Learn. Represent. (ICLR) 2019. [Google Scholar] [CrossRef]
- Paszke, A.; et al. PyTorch: An imperative style, high-performance deep learning library. Proc. Adv. Neural Inf. Process. Syst. (NeurIPS), 2019; vol. 32. [Google Scholar]
- Cohen, J. A coefficient of agreement for nominal scales. Educ. Psychol. Meas. 1960, vol. 20(no. 1), 37–46. [Google Scholar] [CrossRef]
- Landis, J. R.; Koch, G. G. The measurement of observer agreement for categorical data. Biometrics 1977, vol. 33(no. 1), 159–174. [Google Scholar] [CrossRef]
Figure 1.
Class distribution of the 25,285 usable epochs.
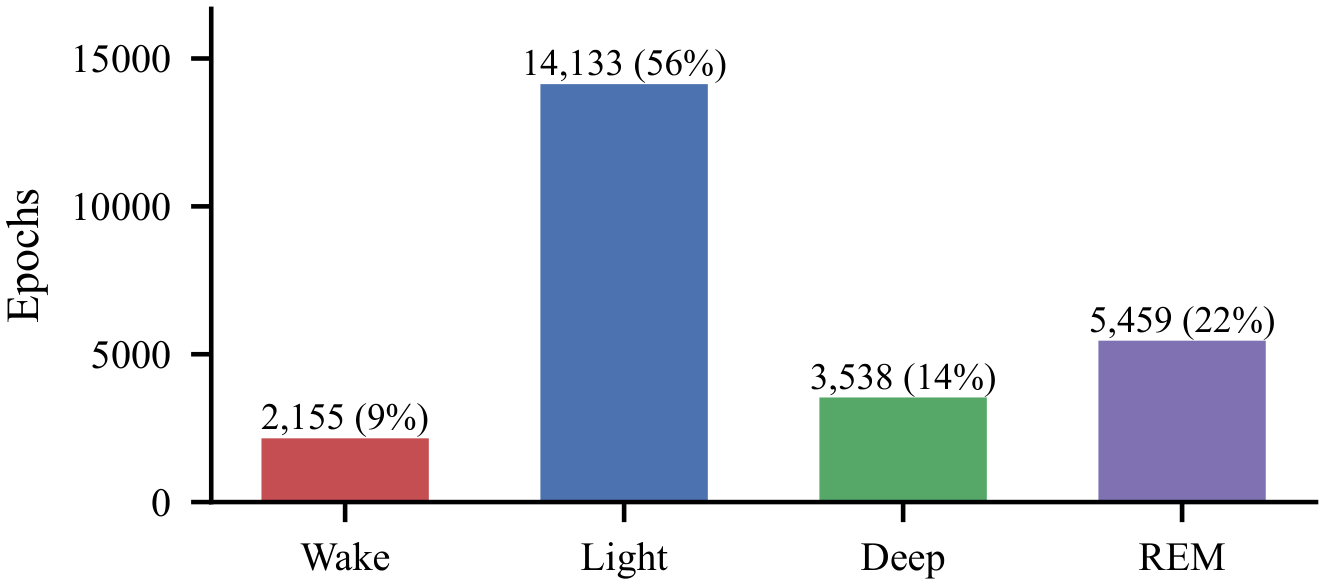
Figure 2.
Proposed architecture. The blue branch exists only in the configurations that use motion and the orange branch only in those that use heart rate; the “no context” configuration replaces the BiLSTM with a per-epoch classifier.
Figure 2.
Proposed architecture. The blue branch exists only in the configurations that use motion and the orange branch only in those that use heart rate; the “no context” configuration replaces the BiLSTM with a per-epoch classifier.
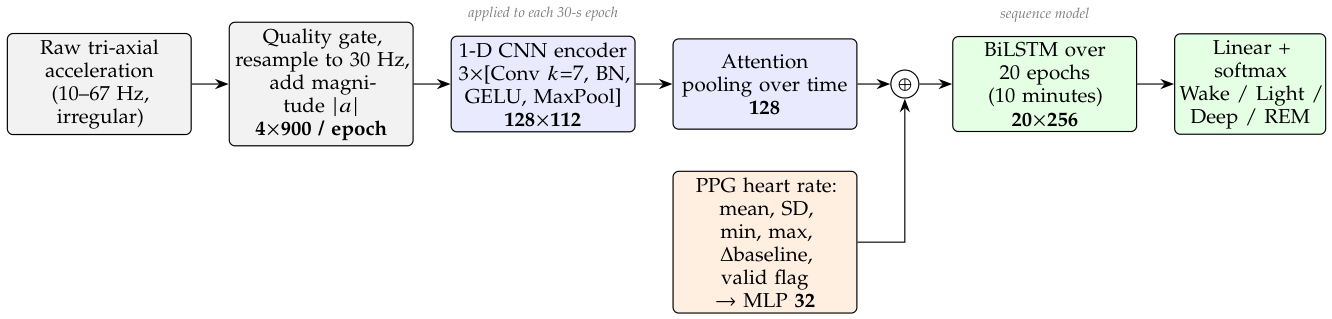
Figure 3.
Four-class by configuration (mean ± SD across the five folds). Only the heart-rate configurations approach the 0.40 target.
Figure 3.
Four-class by configuration (mean ± SD across the five folds). Only the heart-rate configurations approach the 0.40 target.
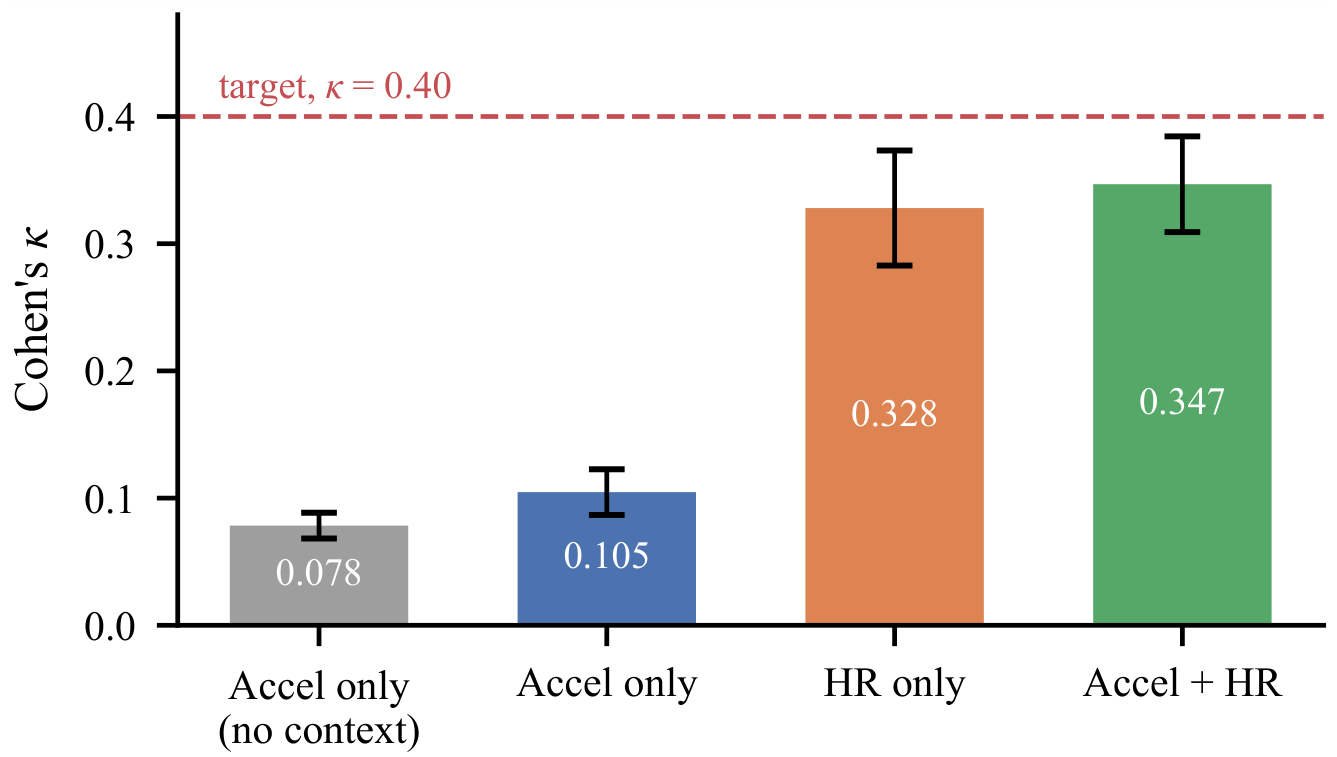
Figure 4.
Paired-bootstrap difference in with 95% confidence intervals, resampling subjects. Grey: the interval contains zero (not significant).
Figure 4.
Paired-bootstrap difference in with 95% confidence intervals, resampling subjects. Grey: the interval contains zero (not significant).
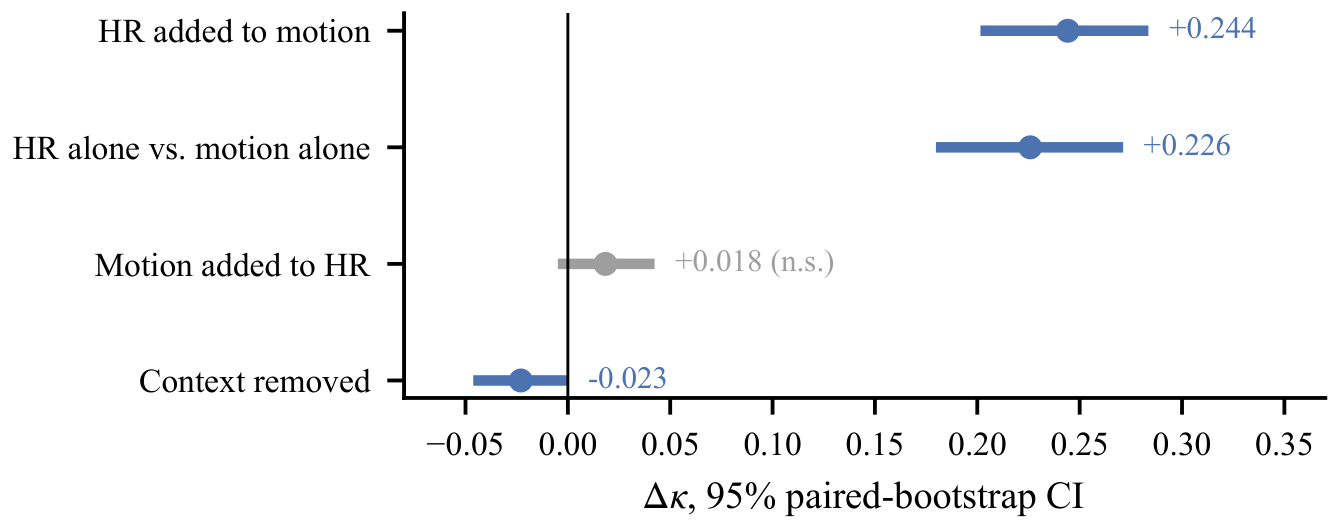
Figure 5.
Row-normalised confusion matrices: each row shows how the epochs of one true PSG stage were classified. Without heart rate, Deep and REM are almost entirely absorbed into Light; with it, both gain a substantial diagonal.
Figure 5.
Row-normalised confusion matrices: each row shows how the epochs of one true PSG stage were classified. Without heart rate, Deep and REM are almost entirely absorbed into Light; with it, both gain a substantial diagonal.
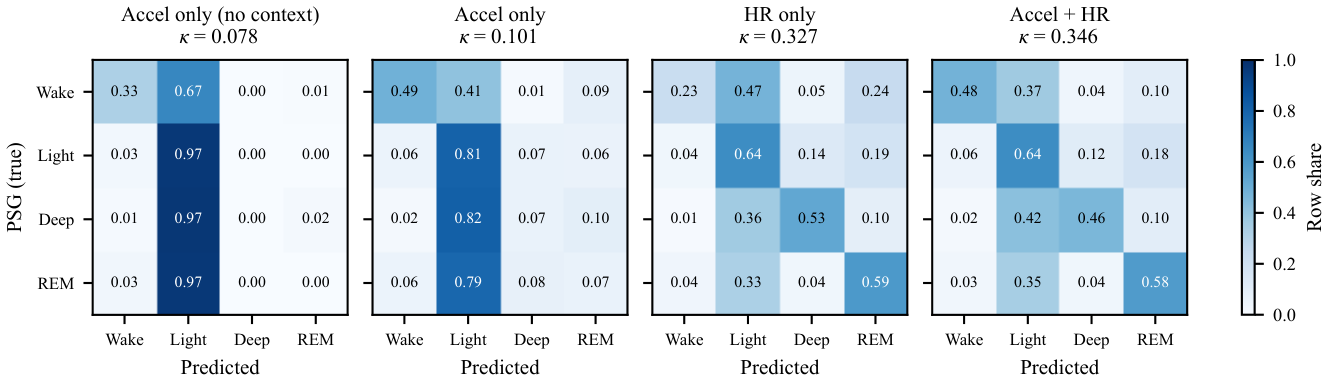
Figure 6.
Per-class F1 by configuration. Motion is the better Wake detector; heart rate supplies the Deep and REM distinctions.
Figure 6.
Per-class F1 by configuration. Motion is the better Wake detector; heart rate supplies the Deep and REM distinctions.
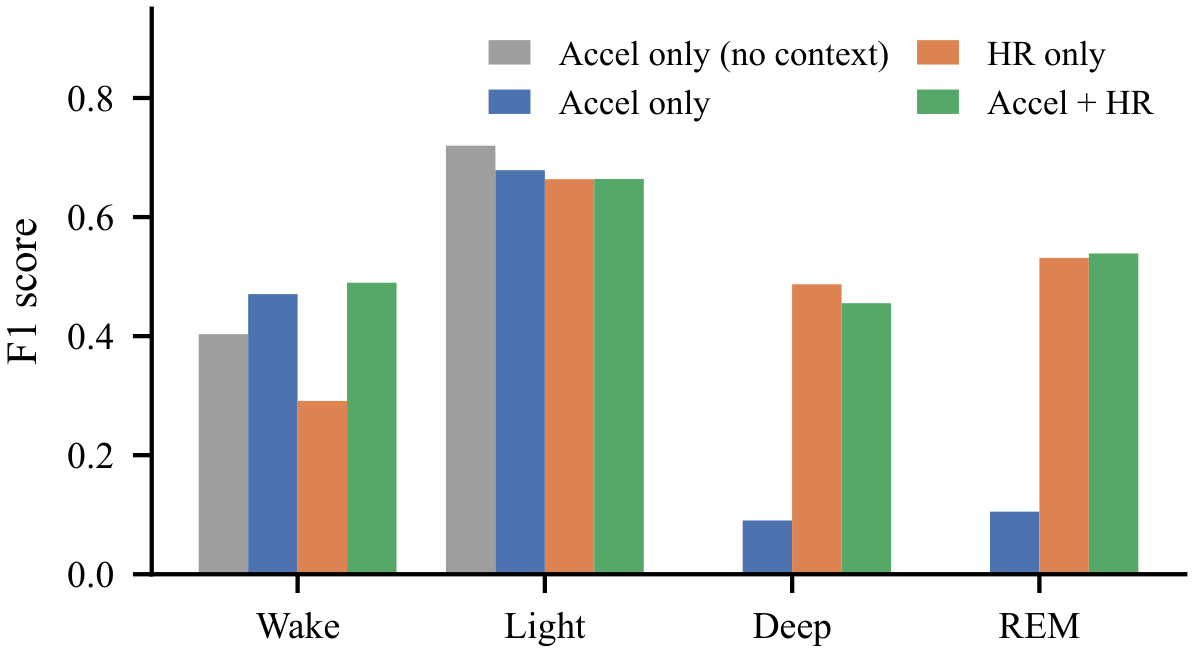
Figure 7.
Hypnogram of the longest recording (subject 781756), accelerometer + heart-rate model against PSG. The lower strip marks the epochs where the two disagree (63.6% agreement).
Figure 7.
Hypnogram of the longest recording (subject 781756), accelerometer + heart-rate model against PSG. The lower strip marks the epochs where the two disagree (63.6% agreement).
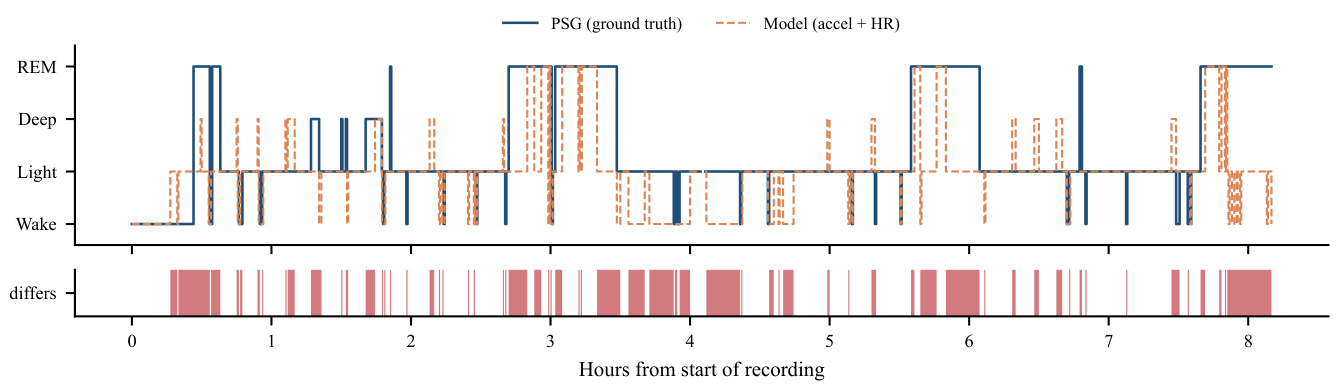
Figure 8.
Training loss and validation macro F1, averaged over the five folds.
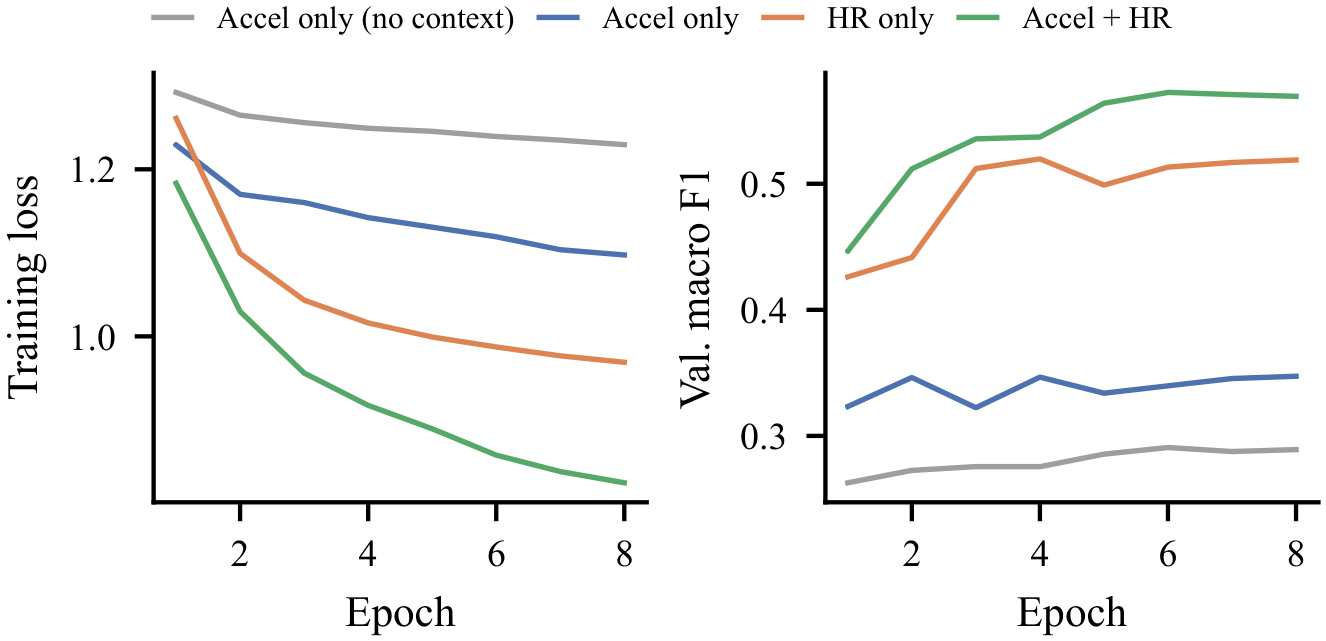

Table 1.
Comparative Study of Existing Sleep Staging Methods
| Ref. | Methodology | Dataset / signals | Results | Research gap |
|---|---|---|---|---|
| [2] | Weighted sum of wrist activity counts | 41 subjects; wrist actigraphy | ≈88% sleep/wake agreement with PSG | Binary only; hand-set linear weights |
| [9] | Random forest on raw-accelerometer features | 134 adults, 3 studies; wrist accelerometer | F1 73.9% sleep/wake on unseen subjects | Multi-stage staging from motion reported as difficult; no deep model |
| [4] | LR, k-NN, random forest, MLP on motion, HR and clock proxy | 31 subjects; Apple Watch | 90% sleep/wake; ≈72% Wake/NREM/REM accuracy | Three classes; hand-crafted features; circadian prior confounds motion |
| [5] | CNN, LSTM and classical ML on movement and cardiac data | 1,743 participants | Ensemble 78.2% accuracy, 69.8% F1 (three stages) | Three stages; relies on cardiac sensing |
| [6] | LSTM on 132 ECG-derived HRV features + actigraphy | Sleep-disordered clinical cohort | , four classes | Needs ECG; activity counts, not raw motion |
| [7] | Stacked BiLSTM on HRV features | 292 participants, 584 nights; ECG | , accuracy 77.0% | No movement input; needs beat-to-beat data |
| [10] | Residual CNN + TCN on raw PPG waveform | 2,374 patients; clinical PPG | Median ; 0.74 external | Continuous clinical PPG, not consumer HR; no motion |
| [11] | CNN feature extractor + BiLSTM | MASS, Sleep-EDF; single-channel EEG | 86.2% / 82.0% accuracy | Needs EEG electrodes; not wearable |
| [12] | Hierarchical RNN with attention | 200 subjects; EEG | 87.1% accuracy, | Needs EEG; not wearable |
| This work | 1-D CNN + attention + BiLSTM on raw acceleration; four input configurations | 31 subjects; Apple Watch | 0.101 motion, 0.327 HR, 0.346 both | Isolates the motion-only ceiling and the two-way contribution of each signal |
Table 2.
Model configurations compared
| Configuration | Inputs | Context | Parameters |
|---|---|---|---|
| Accel only (no context) | motion | none | 82,085 |
| Accel only | motion | BiLSTM | 346,789 |
| HR only | heart rate | BiLSTM | 168,196 |
| Accel + HR | both | BiLSTM | 380,837 |
Table 3.
Overall performance (pooled over 31 held-out subjects)
| Configuration | (folds) | Acc. | Macro P | Macro R | Macro | |
|---|---|---|---|---|---|---|
| Accel (no ctx.) | 0.078 | 0.078 ± 0.010 | 0.568 | 0.282 | 0.324 | 0.281 |
| Accel only | 0.101 | 0.105 ± 0.018 | 0.517 | 0.348 | 0.358 | 0.336 |
| HR only | 0.327 | 0.328 ± 0.045 | 0.580 | 0.503 | 0.498 | 0.493 |
| Accel + HR | 0.346 | 0.347 ± 0.038 | 0.591 | 0.534 | 0.541 | 0.537 |
Table 4.
Per-class F1 score and binary sleep/wake
| Configuration | Wake | Light | Deep | REM | Binary |
|---|---|---|---|---|---|
| Accel (no ctx.) | 0.403 | 0.720 | 0.000 | 0.001 | 0.361 |
| Accel only | 0.471 | 0.679 | 0.090 | 0.105 | 0.419 |
| HR only | 0.291 | 0.664 | 0.487 | 0.531 | 0.242 |
| Accel + HR | 0.490 | 0.664 | 0.455 | 0.539 | 0.443 |
Table 5.
Within-person signal comparison (28 subjects)
| Comparison (medians within each person) | Subjects |
|---|---|
| Wrist moves more in Wake than in Deep sleep | 26 / 28 |
| Heart-rate spread higher in REM than in Deep sleep | 27 / 28 |
| Mean heart rate higher in REM than in Deep sleep | 17 / 28 |
Disclaimer/Publisher’s Note: The statements, opinions and data contained in all publications are solely those of the individual author(s) and contributor(s) and not of MDPI and/or the editor(s). MDPI and/or the editor(s) disclaim responsibility for any injury to people or property resulting from any ideas, methods, instructions or products referred to in the content. |
© 2026 by the authors. Licensee MDPI, Basel, Switzerland. This article is an open access article distributed under the terms and conditions of the Creative Commons Attribution (CC BY) license (http://creativecommons.org/licenses/by/4.0/).
Copyright: This open access article is published under a Creative Commons CC BY 4.0 license, which permit the free download, distribution, and reuse, provided that the author and preprint are cited in any reuse.