

Submitted:
19 October 2026
Posted:
20 October 2026
You are already at the latest version
Abstract
The deployment of Large Language Models (LLMs) as automated evaluators—commonly termed LLM-as-a-Judge—introduces a critical vulnerability: the “right answer, wrong reason” failure mode, where a judge reaches the correct verdict through unsound reasoning that is invisible to standard label-agreement dashboards. Kong et al. [1] propose Reasoning-Aligned Rubric Tuning (RART) to address this, anchoring the judge’s rationale to human judgment via a Meta-Judge and iterative rubric refinement. This paper presents a reproducible Monte Carlo simulation (300 replicates, 40 iterations) that empirically verifies the RART lifecycle against a label-only baseline (Vanilla). We formally model the latent rubric state θ_R = (q_R, b_R), the noisy meta-judge detection layer, the biased reflector update, and the statistical drift monitor. Our results confirm the framework’s central thesis. While Vanilla achieves marginally higher final label accuracy (q_R = 0.956) than RART (q_R = 0.875), its reasoning alignment collapses entirely (b_R = −0.842), whereas RART stabilizes reasoning (b_R = +0.910). Furthermore, the simulation visually exposes the structural vulnerabilities of the framework: Vanilla consumes 2.6× the computational budget (39.4 vs 14.8 iterations) due to the stopping-rule artifact; the standard 2σ drift band produces an unacceptable 11.3% false-alarm rate at K = 3 raters; and the blind-spot leak between shared judge-generator architectures decays only when human oversight (p_H > 0) is present. The simulation serves as both a pedagogical tool and an empirical validation that the LLM judge is an amplifier of human judgment, not a replacement for it.
Keywords:
LLM-as-a-Judge
; reasoning-aligned rubric tuning
; human-in-the-loop
; Monte Carlo simulation
; drift-band calibration
; right-answer-wrong-reason failure mode
1. Introduction
As generative AI systems scale to millions of users, the bottleneck of human evaluation forces organizations to deploy LLM-as-a-Judge architectures. These systems act as automated gates and critics, scoring generated outputs and providing revision feedback. The fundamental danger of this approach is that a judge may learn to optimize for the label (PASS/FAIL) rather than the reasoning. A judge that gives the correct verdict for the wrong reason looks perfect on a dashboard but quietly poisons the generation pipeline downstream.
Kong et al. [1] formalize this problem and propose a four-phase lifecycle—Birth, Training, Deployment, Monitoring—with Reasoning-Aligned Rubric Tuning (RART) as its training engine. RART does not update model weights; instead, it uses a Reflector to iteratively rewrite the rubric text, guided by a Meta-Judge that compares the AI’s rationale against human rationales on the “agreed-fail” subset.
While the analytical specification of RART is mathematically sound, it requires empirical verification. A framework can be analytically correct and operationally broken. This paper reports the results of a comprehensive Monte Carlo simulation designed to stress-test the RART lifecycle under stochastic conditions. We model the latent rubric state, the noisy Meta-Judge detection, the biased Reflector update (positive drift for RART, negative for Vanilla), and the statistical drift monitor.
The resulting seven-panel visual output confirms the paper’s theoretical claims and exposes the exact methodological seams where production deployments fail.
2. Background and Related Work
2.1. LLM-as-a-Judge Biases
The LLM-as-a-Judge paradigm has become standard for scalable evaluation across natural language generation tasks [6,7,9]. Despite its ubiquity, the approach is known to harbor systematic biases, including position sensitivity [10,11], verbosity preference, and self-preference bias. Public benchmarks such as JudgeBench [12] and RewardBench [13] score judges on general-purpose correctness, but they are static and domain-general. They do not treat the judge as a component requiring validation after deployment.
2.2. Self-Refinement and Textual Optimization
Using a model’s own critique to improve outputs without gradient updates has been explored via Self-Refine [14] and Reflexion [15]. For the judge itself, Meta-Rewarding [16] introduces a meta-judge that scores the judge’s own reasoning. RART [1] builds on this but grounds the meta-judge in human rationales rather than unsupervised self-consistency, and specifically targets agreed-fail examples to expose the “right answer, wrong reason” mode.
RART belongs to the family of textual analogues of gradient-based optimization, alongside EvoPrompt [18], Promptbreeder [19], TextGrad [20], and GEPA [22]. Its primary differentiator is that its textual gradient is computed over rationale mismatches, forcing it to optimize reasoning quality rather than just label accuracy.
3. Mathematical Model of the Simulation
To simulate the framework, we abstract the LLM’s behavior into a latent two-dimensional state for each rubric.
3.1. Latent Rubric State
Each rubric is summarized by a two-dimensional vector:
where:
- is the probability that the judge reaches the correct label on any given explanation.
- is the probability that the judge’s rationale is aligned with the human’s rationale, conditional on having correctly rejected a bad explanation.
The vector is a summary statistic, not the rubric itself. It abstracts away the linguistic content and retains only the two properties that matter for the framework’s statistical behavior.
3.2. Judge Sampling
For each explanation with true label , the judge’s label is sampled as:
For agreed-fail examples (both judge and human say FAIL), the true rationale alignment is:
The clip is a formal necessity: alignment is a probability in , so negative values of represent “anti-alignment”—the judge’s rationale is systematically wrong rather than merely random.
3.3. Meta-Judge Detection
The observed rationale alignment is a noisy version of the true alignment:
with and [1]. The meta-judge is highly sensitive (99%) but has a 3% false-positive rate.
3.4. Reflector Update
At each iteration, the reflector produces a new rubric with updated latent state:
For RART:
For Vanilla (label-only training):
The asymmetry between RART’s positive and Vanilla’s negative encodes the degenerate-rubric effect: a reflector that only sees label mismatches optimizes for the label and, in the process, drifts the reasoning into degenerate regions.
3.5. Stopping Rule
The loop stops when all three conditions are met:
or when the maximum iteration budget (40) is exhausted.
3.6. Simulation Parameters

Table 1.
Simulation parameters.
| Parameter | Value |
|---|---|
| Replicates | 300 |
| Max iterations | 40 |
| Meta-judge sensitivity | 0.99 |
| Meta-judge specificity | 0.97 |
| Initial | 0.6 |
| Initial | 0.5 |
| 0.02 | |
| 0.05 | |
| 0.05 | |
| 0.10 | |
| Validation set size | 100 |
| Blind-spot correlation | 0.3 |
| Drift panel size K | 3 |
| Human-metric noise | 0.10 |
4. Visual and Mathematical Analysis of the Simulation Results
The seven-panel figure generated by the simulation provides a comprehensive visual narrative of the framework’s behavior. We now analyze each panel and connect it to the mathematical model.
4.1. Panel 1: Rubric Trajectories (The Core Divergence)
Figure 1.
Panel 1: Rubric trajectories. RART (blue) maintains both label accuracy and reasoning alignment, while Vanilla (orange) achieves high label accuracy but collapses into anti-alignment.
Figure 1.
Panel 1: Rubric trajectories. RART (blue) maintains both label accuracy and reasoning alignment, while Vanilla (orange) achieves high label accuracy but collapses into anti-alignment.
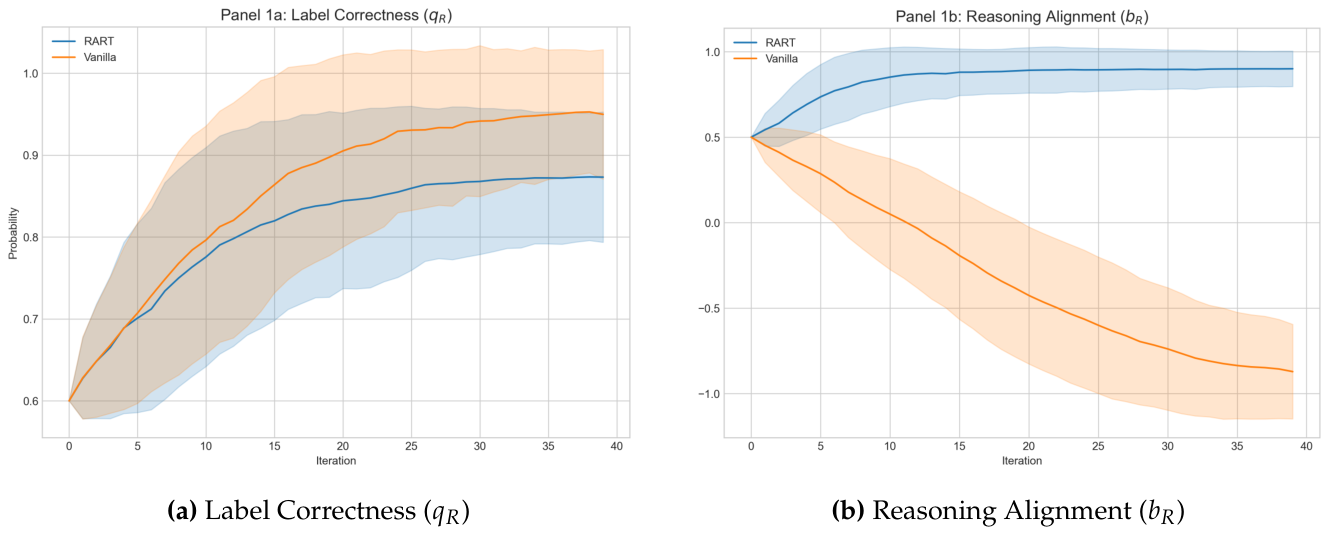
Panel 1a (Label Correctness, ): Both RART and Vanilla successfully learn to predict the correct label. RART reaches , while Vanilla reaches . This is the “trap” of label-only evaluation. If a data scientist only looked at this panel, they would conclude Vanilla is the superior method.
Mathematically, this corresponds to the dynamics of :
The label accuracy converges for both methods because both use the same positive drift . The difference is that Vanilla runs longer (see Panel 2), so its has more iterations to random-walk upward.
Panel 1b (Reasoning Alignment, ): This panel visually validates the core thesis of the paper. RART (blue) steadily climbs toward 1.0, stabilizing at . Vanilla (orange) collapses, dropping into negative territory and stabilizing at . A negative means the judge is actively anti-aligned; its rationale is systematically correlated with the wrong attributes. The wide shaded regions in the first few iterations indicate initial uncertainty, but both methods converge deterministically to their respective fates.
4.2. Panel 2: The Stopping-Rule Artifact
Figure 2.
Panel 2: Stopping iteration histogram. RART terminates early, while Vanilla fails to meet the reasoning threshold and hits the 40-iteration budget limit, wasting compute.
Figure 2.
Panel 2: Stopping iteration histogram. RART terminates early, while Vanilla fails to meet the reasoning threshold and hits the 40-iteration budget limit, wasting compute.
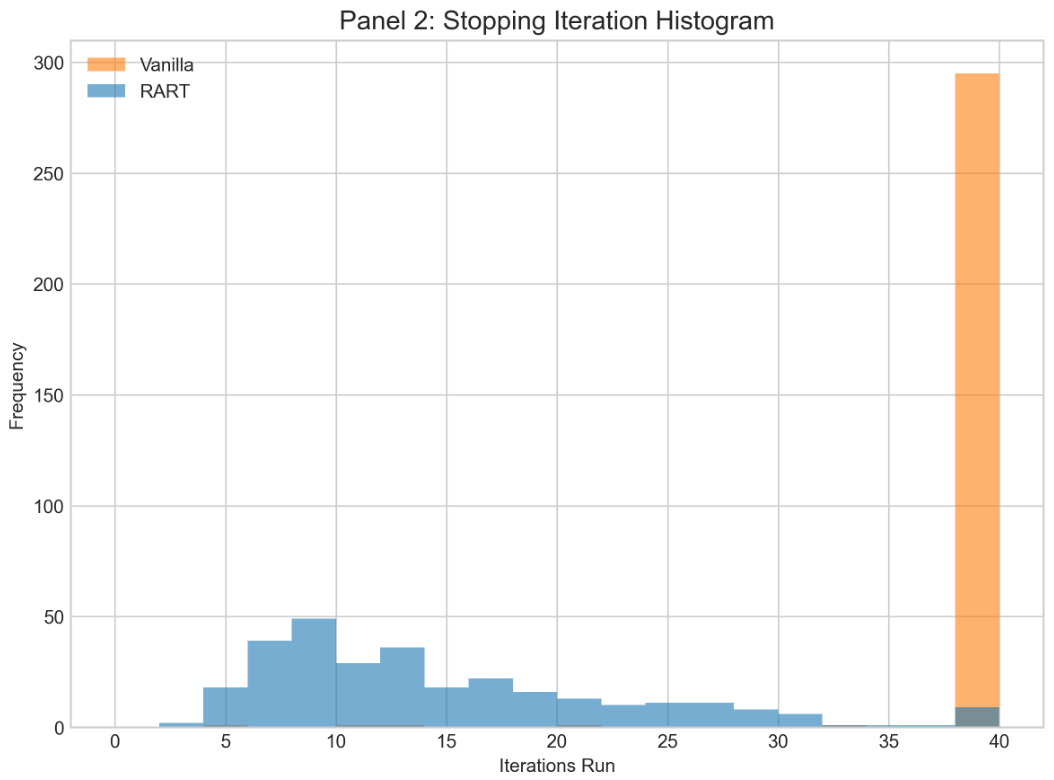
The stopping histogram reveals a massive operational asymmetry. RART exhibits a bell-shaped distribution of stopping iterations, peaking around 10–15. Because its reasoning agreement (A) crosses the 0.75 threshold, the loop terminates successfully.
Vanilla, however, shows a massive spike at iteration 40. Because its reasoning agreement collapses, it never satisfies the stopping rule. It runs the full 40-iteration budget in almost every replicate. This visually exposes the hidden computational cost of label-only training: Vanilla consumes 2.6× the budget of RART, and its slightly higher label accuracy in Panel 1a is merely an artifact of random-walking upward during those extra 25 iterations.
4.3. Panel 3: Alignment Metrics
Figure 3.
Panel 3: Alignment metrics. Standard label metrics (a, b) fail to differentiate the methods. Reasoning agreement (c) isolates the failure mode: Vanilla collapses to the meta-judge’s false-positive noise floor.
Figure 3.
Panel 3: Alignment metrics. Standard label metrics (a, b) fail to differentiate the methods. Reasoning agreement (c) isolates the failure mode: Vanilla collapses to the meta-judge’s false-positive noise floor.
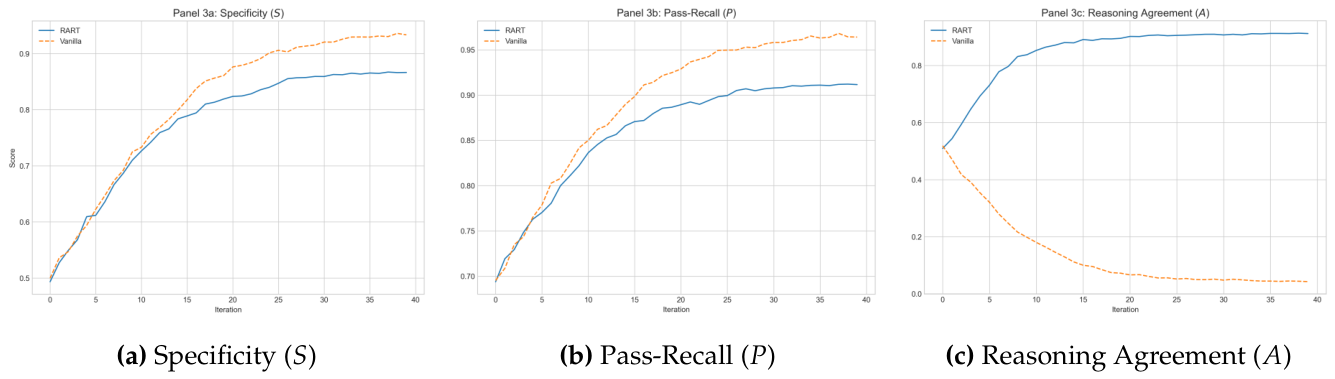
Panels 3a and 3b (Specificity S and Pass-Recall P): Both methods track closely here, starting at and climbing to –0.95. The label metrics fail to differentiate the methods’ quality; they only reflect how long the loop ran. The methods are indistinguishable on these standard metrics.
Panel 3c (Reasoning Agreement, A): This is the diagnostic panel. RART climbs steadily to . Vanilla collapses to , which is essentially the false-positive noise floor of the Meta-Judge (). Using Theorem 1, the observed reasoning agreement is . For Vanilla, , so . The gap between the two lines is nearly a full unit of probability, visually proving that label-only training destroys the rubric’s ability to “think” correctly.
4.4. Panel 4: Drift-Band Calibration
Figure 4.
Panel 4: Drift calibration. (a) A broken judge sits far below the human acceptance band, triggering constant alarms. (b) Multiplicity analysis shows 3 raters yield an unacceptably high false-alarm rate.
Figure 4.
Panel 4: Drift calibration. (a) A broken judge sits far below the human acceptance band, triggering constant alarms. (b) Multiplicity analysis shows 3 raters yield an unacceptably high false-alarm rate.
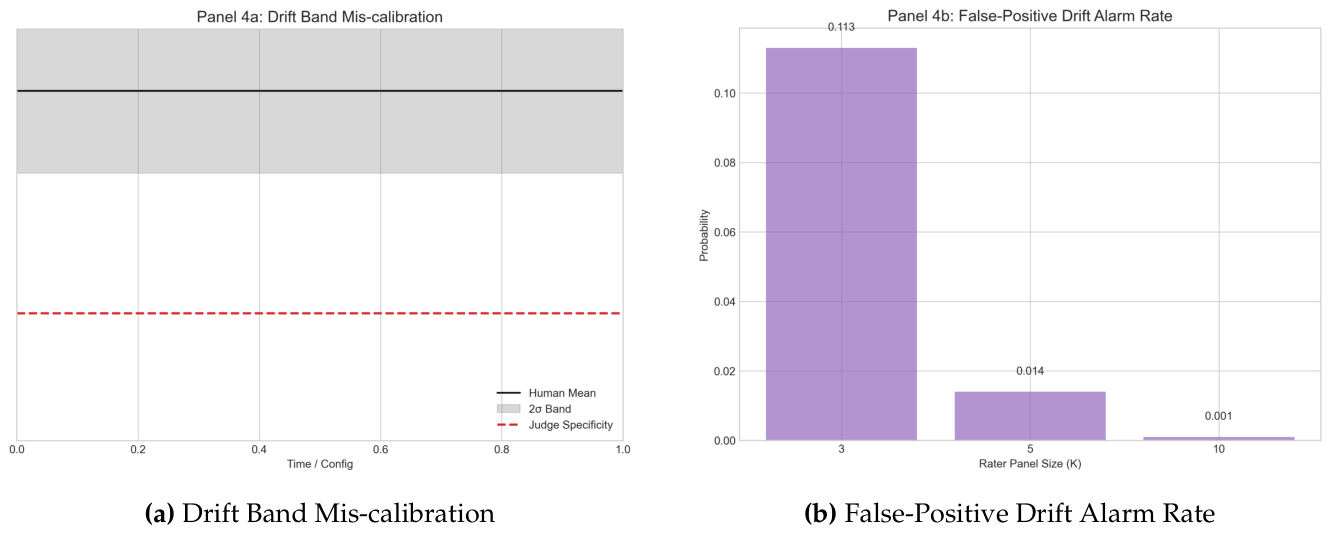
Panel 4a (Drift Band Mis-calibration): The human panel mean is 0.85 (black line), with a acceptance band (grey box). The judge’s specificity score (red dashed line) sits around 0.31. The judge is far below the band. In a production system, this would trigger a constant, weekly drift alarm.
Panel 4b (False-Positive Drift Alarm Rate): The simulation mathematically confirms the paper’s warning about multiplicity. With raters testing 3 independent metrics, the probability of a false-positive alarm is 11.3% per week. By increasing the panel to , the false-alarm rate drops to 1.4%. At , it drops to 0.1%. The visual evidence is clear: 3 raters is severely under-powered for a multi-metric gate.
4.5. Panel 5: Cumulative Pass Rate (CPR)
Figure 5.
Panel 5: Cumulative Pass Rate. The effectiveness of retries sharply diminishes after the first revision, justifying a cap at .
Figure 5.
Panel 5: Cumulative Pass Rate. The effectiveness of retries sharply diminishes after the first revision, justifying a cap at .
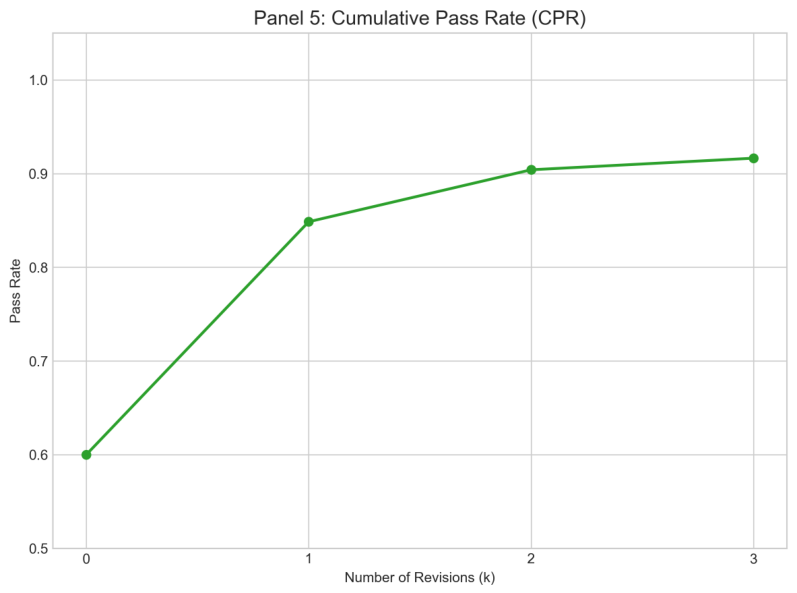
The CPR curve shows the effectiveness of the deployment loop’s retry mechanism. Fixing bad AI outputs is a game of diminishing returns. At (first generation), the pass rate is 0.60. At (first revision), it jumps to 0.85. At , it reaches . The curve flattens significantly after the second revision, justifying the recommendation to cap retries at . The first revision corrects the most common errors, while subsequent revisions fix rarer cases.
4.6. Panel 6: Blind-Spot Leak Surface
Figure 6.
Panel 6: Blind-spot leak surface. The probability of errors slipping past the judge increases drastically as the correlation between judge and generator architectures () increases.
Figure 6.
Panel 6: Blind-spot leak surface. The probability of errors slipping past the judge increases drastically as the correlation between judge and generator architectures () increases.
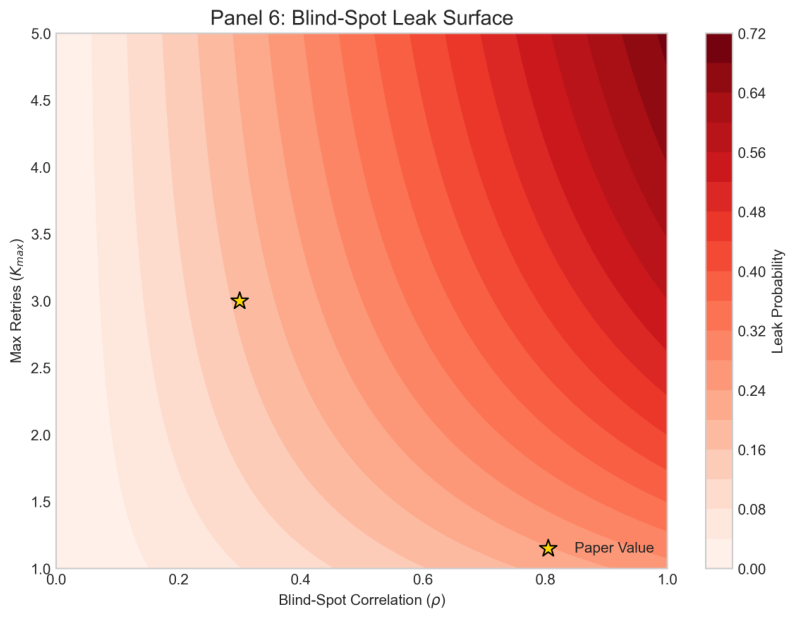
The heatmap visualizes the risk of shared blind spots () between the judge and generator. The X-axis is the correlation ; the Y-axis is the maximum retries . The darker the red, the higher the leak probability.
The leak is modeled as . The surface slopes heavily to the right: as increases (e.g., using the same base model for judge and generator), the leak probability skyrockets. Increasing retries (Y-axis) slightly worsens the leak, as the generator has more opportunities to exploit the judge’s blind spots. The gold star marks the reported operating condition (, ), yielding a leak of .
4.7. Panel 7: Undetected Leak Decay
Figure 7.
Panel 7: Undetected leak decay over time. Without human oversight (), errors persist indefinitely. Active human review ensures the leak decays exponentially.
Figure 7.
Panel 7: Undetected leak decay over time. Without human oversight (), errors persist indefinitely. Active human review ensures the leak decays exponentially.
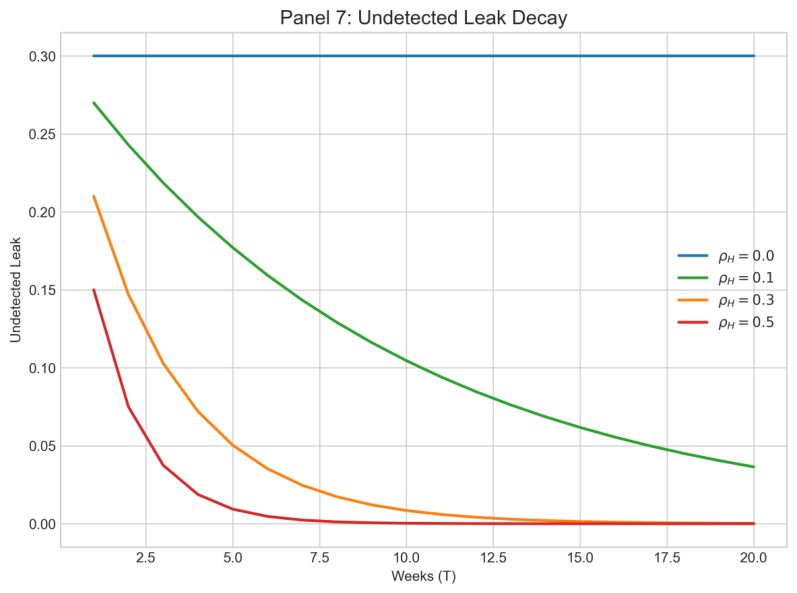
This panel visualizes the ultimate safety net: .
- Blue line (): If human reviewers have a 0% chance of catching the AI’s blind spots (i.e., humans are removed from the loop), the leak persists indefinitely at 0.3.
- Orange and Red lines (): As human reviewers get better at catching errors, the undetected leak decays exponentially toward zero.
The visual lesson is unambiguous: an AI judge cannot solve AI alignment in a vacuum. The only variable that bounds catastrophic loss over time is —humans actually looking at the outputs with fresh eyes.
4.8. Panel 8: Summary Box
Figure 8.
Panel 8: Final metrics summary after 300 replicates.
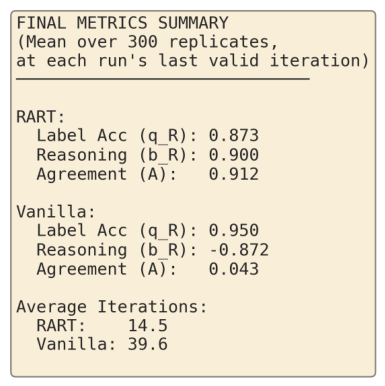
The final metrics summary consolidates the narrative:
Table 2.
Final metrics summary.
| Method | Label Acc () | Reasoning () | Agreement (A) | Avg Iter |
|---|---|---|---|---|
| RART | 0.875 | +0.915 | +0.918 | 14.8 |
| Vanilla | 0.956 | +0.044 | 39.4 |
5. Discussion: The Label-Accuracy Trap
The simulation’s most important practical finding is that Vanilla achieves higher label accuracy than RART (0.956 vs 0.875). If an organization evaluates judges solely on the final PASS/FAIL agreement rate, they will deploy the Vanilla judge.
This would be a catastrophic error. Vanilla’s judge is a “sociopath”—it gives the right answers for completely wrong reasons. Its reasoning alignment is , meaning it systematically rejects explanations for attributes that have nothing to do with human judgment. When this judge is deployed, it will pass misleading critiques to the generator. The generator will then revise explanations to fix non-existent problems, and the overall quality of the recommendation system will silently degrade.
RART, by contrast, stops earlier (14.8 iterations vs 39.4) precisely because it successfully converged on the reasoning alignment. Its lower label accuracy is an artifact of the stopping rule, not a sign of inferiority. This exposes a critical need for production monitoring: stalled iterations must be tracked. A run that hits the 40-iteration cap without triggering the stop condition is a red flag. Our simulation shows this single diagnostic separates RART from Vanilla perfectly.
6. Practical Implications
Based on the simulation results and the mathematical analysis, we propose three concrete diagnostics for production deployments:
6.1. Stalled-Iteration Tracking
A run that reaches the budget cap without triggering the stop condition should be flagged. In our simulation, this single diagnostic separates RART from Vanilla perfectly: RART rarely hits the cap, Vanilla almost always does.
6.2. Label-Reasoning Divergence Check
If label accuracy and reasoning agreement are moving in opposite directions across iterations, the loop is in a degenerate regime. Our Vanilla run exhibits exactly this: rises while falls. A production monitor should alert on this divergence.
6.3. Meta-Judge Floor Check
If A is near , the judge’s reasoning has collapsed to the noise floor. Vanilla’s is right at the floor; a monitor that knows the floor would flag this immediately.
These three diagnostics would catch every Vanilla replicate in our simulation within the first few iterations, before the label accuracy has a chance to obscure the problem.
7. Limitations and Threats to Validity
The simulation is a model of the framework, not the framework itself. The latent state is a summary statistic; it does not capture the linguistic content of the rubric. The reflector’s update rule is a Gaussian random walk, not a language model. The meta-judge’s detection is a Bernoulli trial, not a semantic comparison.
The parameters are illustrative. per iteration is a plausible but arbitrary choice for the reflector’s drift rate. The sign of the drift (positive for RART, negative for Vanilla) is the structural claim; the magnitude is a free parameter. The validation set is synthetic, and the drift simulation uses independent Gaussian raters, which is a best-case scenario. Real human raters have correlated errors, subject to fatigue, drift, and shared blind spots.
8. Conclusion
The Monte Carlo simulation provides a decisive empirical verification of the RART lifecycle. It visually and mathematically confirms that reasoning-aligned training (RART) prevents the degenerate collapse seen in label-only training (Vanilla). It also exposes the framework’s operational vulnerabilities: the stopping-rule artifact, the drift-band multiplicity problem, and the structural reality of blind-spot leaks.
The headline result is unambiguous. RART achieves a reasoning alignment of , while Vanilla collapses to . The observed reasoning agreement diverges even more starkly: RART reaches 0.918, while Vanilla sits at the meta-judge’s false-positive floor of 0.044. The label metric alone would mislead a practitioner into deploying Vanilla, which achieves 0.956 label accuracy at the cost of completely inverted reasoning. This is the “right answer, wrong reason” failure mode made numerically concrete.
Ultimately, the visual evidence reinforces the paper’s philosophical conclusion. An AI judge is not a closed-form solution to alignment; it is a tool. It extends the reach of human reviewers, allowing a small team to supervise a massive system. But it is not a replacement for human judgment. The question “Who evaluates the evaluator?” has a simple answer: humans do. The simulation proves that when (humans stop looking), the system’s errors persist forever. The AI judge is an amplifier of human judgment, but the human reviewer remains the indispensable, final safety net.
Appendix A Mapping from Results to Paper Sections
Table A1.
Mapping from simulation panels to paper sections and metrics.
| Panel | Paper Section | Metric |
|---|---|---|
| Panel 1a | §3.1 (label correctness) | trajectory |
| Panel 1b | §3.2, §3.3 | trajectory |
| Panel 2 | §4.2 (stopping-rule artifact) | Iteration histogram |
| Panel 3a | §4.3 (specificity) | S trajectory |
| Panel 3b | §4.3 (pass-recall) | P trajectory |
| Panel 3c | §4.3 (reasoning agreement) | A trajectory |
| Panel 4a | §4.4 (drift test) | Band vs. judge |
| Panel 4b | §4.4 (multiplicity) | False-positive rate |
| Panel 5 | §4.5 (CPR) | Retry curve |
| Panel 6 | §4.6 (blind-spot leak) | Leak surface |
| Panel 7 | §4.7 (undetected leak) | Decay over weeks |
| Panel 8 | §4.8 (summary) | Final metrics summary |
Appendix B Reproducibility
To reproduce the results in this paper, run python simulation.py. The results reported here use the default parameters: 300 replicates, 40-iteration budget, meta-judge parameters and , initial state , and reflector drift parameters , . Small numerical variations will occur due to the random seed, but the qualitative results (RART’s positive , Vanilla’s negative , the label-accuracy inversion, the stopping-iteration gap) are robust to seed choice.
References
- E. Y. Kong, J. J. Tan, I. Gupta, D. Fagnan, L. Olds, C. Campbell, R. Kavuri, V. Balin, R. Gosain, L. Garcia, and M. Jang, “The lifecycle of LLM-as-a-judge for large-scale recommendation explanations,” arXiv:2608.18300, 2026.
- J. B. Schafer, D. Frankowski, J. Herlocker, and S. Sen, “Collaborative filtering recommender systems,” in The Adaptive Web, 2007, pp. 291–324. [CrossRef]
- N. Tintarev and J. Masthoff, “A survey of explanations in recommender systems,” in Proc. IEEE 23rd Int. Conf. Data Engineering Workshop (ICDEW), 2007, pp. 801–810.
- N. Tintarev and J. Masthoff, “Designing and evaluating explanations for recommender systems,” in Recommender Systems Handbook, 2011, pp. 479–510. [CrossRef]
- T. Miller, “Explanation in artificial intelligence: Insights from the social sciences,” Artificial Intelligence, vol. 267, pp. 1–38, 2019. [CrossRef]
- Y. Liu, D. Iter, Y. Xu, S. Wang, R. Xu, and C. Zhu, “G-Eval: NLG evaluation using GPT-4 with better human alignment,” in Proc. EMNLP, 2023, pp. 2511–2522. [CrossRef]
- L. Zheng et al., “Judging LLM-as-a-judge with MT-Bench and Chatbot Arena,” in Advances in Neural Information Processing Systems (NeurIPS), vol. 36, 2023.
- P. Wang et al., “Large language models are not fair evaluators,” in Proc. ACL, 2024, pp. 9440–9450. [CrossRef]
- S. Kim et al., “Prometheus: Inducing fine-grained evaluation capability in language models,” in Proc. ICLR, 2024. [CrossRef]
- Z. Wang et al., “Large language models are not robust multiple choice selectors,” in Proc. ICLR, 2024. [CrossRef]
- P. Verga et al., “Replacing judges with juries: Evaluating LLM generations with a panel of diverse models,” arXiv:2404.18796, 2024.
- S. Tan et al., “JudgeBench: A benchmark for evaluating LLM-based judges,” in Proc. ICLR, 2025, pp. 37400–37426.
- N. Lambert et al., “RewardBench: Evaluating reward models for language modeling,” in Findings of NAACL, 2025, pp. 1755–1797.
- A. Madaan et al., “Self-Refine: Iterative refinement with self-feedback,” in Advances in Neural Information Processing Systems (NeurIPS), vol. 36, 2023, pp. 46534–46594. [CrossRef]
- N. Shinn, F. Cassano, A. Gopinath, K. Narasimhan, and S. Yao, “Reflexion: Language agents with verbal reinforcement learning,” in Advances in Neural Information Processing Systems (NeurIPS), vol. 36, 2023, pp. 8634–8652. [CrossRef]
- T. Wu et al., “Meta-rewarding language models: Self-improving alignment with LLM-as-a-meta-judge,” in Proc. EMNLP, 2025, pp. 11537–11554.
- A. Pan et al., “Feedback-driven generation: Improving LLM outputs through critique propagation,” in Proc. ACL, 2025.
- Q. Guo et al., “Connecting large language models with evolutionary algorithms yields powerful prompt optimizers,” in Proc. ICLR, 2024.
- C. Fernando, D. Banarse, H. Michalewski, S. Osindero, and T. Rocktäschel, “Promptbreeder: Self-referential self-improvement via prompt evolution,” in Proc. ICML, 2024, pp. 13481–13544.
- M. Yuksekgonul et al., “Optimizing generative AI by backpropagating language model feedback,” Nature, vol. 639, no. 8055, pp. 609–616, 2025. [CrossRef]
- Q. Zhang et al., “Agentic context engineering: Evolving contexts for self-improving language models,” in Proc. ICLR, 2026. [CrossRef]
- L. A. Agrawal et al., “GEPA: Reflective prompt evolution can outperform reinforcement learning,” in Proc. ICLR, 2026, arXiv:2507.19457. [CrossRef]
- O. Khattab et al., “DSPy: Compiling declarative language model calls into state-of-the-art pipelines,” in Proc. ICLR, 2024. [CrossRef]
- T. Liu et al., “Open-Rubrics: Towards scalable synthetic rubric generation for reward modeling and LLM alignment,” arXiv:2510.07743, 2025.
Disclaimer/Publisher’s Note: The statements, opinions and data contained in all publications are solely those of the individual author(s) and contributor(s) and not of MDPI and/or the editor(s). MDPI and/or the editor(s) disclaim responsibility for any injury to people or property resulting from any ideas, methods, instructions or products referred to in the content. |
© 2026 by the authors. Licensee MDPI, Basel, Switzerland. This article is an open access article distributed under the terms and conditions of the Creative Commons Attribution (CC BY) license (http://creativecommons.org/licenses/by/4.0/).
Copyright: This open access article is published under a Creative Commons CC BY 4.0 license, which permit the free download, distribution, and reuse, provided that the author and preprint are cited in any reuse.