

Submitted:
18 October 2026
Posted:
20 October 2026
You are already at the latest version
Abstract
Background/Objectives: Depressive symptoms, malnutrition and falls are common geriatric syndromes with shared risk factors, yet they are usually studied separately. We aimed to identify latent subgroups defined by their co-occurrence among older adults in Northeast Thailand and the factors associated with membership. Methods: In this cross-sectional survey (October–December 2025), 12,115 community-dwelling adults aged ≥60 years in 39 subdistricts of Maha Sarakham Province were interviewed. Latent class indicators were the Thai 9-item depression scale, Mini Nutritional Assessment Short-Form, calf circumference, recent falls and gait impairment. Associated factors and concurrent correlates were estimated with bias-adjusted three-step models and cluster-robust standard errors. Results: Depressive symptoms affected 8.4%, malnutrition risk 24.5% and fall risk 17.0%; all three co-occurred in 2.2%, 6.2 times more often than expected under independence, mainly reflecting pairwise associations. Three classes emerged: robust (77.3%), nutritional risk (16.2%) and complex multidomain (6.5%). The complex multidomain class featured gait impairment (78.2%) and malnutrition risk (70.2%), with elevated depressive symptoms (40.9%) and recent falls (26.8%). Membership was associated with age ≥80 years (adjusted odds ratio 4.39, 95% CI 2.68–7.18), not working (4.23, 2.59–6.90), high household debt (2.45, 1.29–4.65), ≥2 chronic conditions (3.54, 2.23–5.64), polypharmacy (2.45, 1.73–3.47) and per additional home hazard (1.44, 1.29–1.61). Members more often rated their health as worse than peers (38.6% vs. 1.8% in the robust class). Conclusions: An estimated 6.5% of older adults (5.0–8.5% across closely agreeing specifications) formed a subgroup characterised by mobility impairment, malnutrition risk and socioeconomic disadvantage. Interpreting existing screening results jointly may help target integrated primary care, social welfare and home-modification support; prospective evaluation is needed.
Keywords:
latent class analysis
; depressive symptoms
; malnutrition
; accidental falls
; older adults
; Thailand
1. Introduction
Thailand is one of the most rapidly ageing middle-income countries. Adults aged 60 years or older made up about one-fifth of the population in 2024, and this proportion is projected to reach 28% within the next decade, when Thailand becomes a super-aged society [1]. In Maha Sarakham, a predominantly agricultural province in the Northeast, 20.3% of residents are aged 60 years or older [2]. Among the health problems that accompany this transition, depressive symptoms, malnutrition and falls are common and consequential. Falls are the second leading cause of unintentional injury death worldwide; adults aged over 60 years sustain the greatest number of fatal falls, and more than 80% of fall-related deaths occur in low- and middle-income countries [3]. In Thailand, a meta-analysis estimated that 37.8% of older adults are at risk of malnutrition on the Mini Nutritional Assessment Short-Form [4], depression was identified in 18.5% of older adults in a rural community study [5] and in 17.7% of rural older adults in Southeast Asian studies pooled in a regional meta-analysis [6], and 34.5% of rural older adults in Maha Sarakham reported a fall in the previous six months [7].
These three conditions are unlikely to occur independently. They are geriatric syndromes: multifactorial conditions that share risk factors such as older age, functional and mobility impairment and multimorbidity, and that converge on common outcomes including disability and loss of independence [8]. Malnutrition is associated with approximately twice the odds of depression in older adults (pooled odds ratio 2.03, 95% CI 1.47–2.81) [9], and both depression and malnutrition have been associated with a higher risk of falls [10], although reviews have not consistently found an association between depression and falls [11]. Reflecting this interdependence, the World Health Organization’s Integrated Care for Older People (ICOPE) approach frames declines in mobility, vitality (including nutrition) and psychological capacity as related domains of intrinsic capacity that should be assessed and managed together in the community rather than condition by condition [12].
Despite this, most epidemiological studies examine these conditions one at a time or in pairs. Such variable-centred analyses estimate average associations across the population, but they cannot show how conditions combine within individuals, which subgroups carry the greatest combined burden, or whom integrated care should prioritise. Person-centred methods such as latent class analysis (LCA) address these questions by identifying unobserved subgroups with distinct patterns of co-occurring conditions, which can then inform targeted interventions [13]. Studies that have applied LCA to intrinsic capacity in China have identified subgroups with concurrent declines in several domains, including locomotion, psychological function and vitality; in one community sample, a small class with declines in locomotion, psychological function, cognition and vitality had more disability and more hospitalisation over one year [14], and in a rural sample, class membership was associated with living alone, lower household income, work participation and use of multiple medications, among other factors [15]. This evidence, however, comes from relatively small samples of about 600–760 participants in China, has rarely examined socioeconomic and home-environment factors that local governments can act on, and has seldom accounted for the clustering of older adults within communities. We are not aware of any study that has applied a person-centred approach to depressive symptoms, malnutrition risk and fall risk among older adults in Thailand or elsewhere in Southeast Asia.
This gap has practical consequences. Thailand’s community-based long-term care programme, introduced in 2016 under the Universal Coverage Scheme and delivered through local administrative organisations, care managers and trained caregivers, focuses on older people who are already dependent [16]. Older adults who remain independent but have co-occurring psychological, nutritional and mobility-related risks, among whom prevention might delay dependency, fall largely outside its core services. Although depressive symptoms, nutritional status and fall risk are screened in Thai primary care, the resulting data are held in separate information systems and are rarely combined to identify people with multiple risks. Identifying a subgroup with co-occurring risks, and the social and environmental factors associated with belonging to it, could show how existing screening data might be used to target integrated prevention at the subdistrict level.
This study used data from 12,115 community-dwelling older adults in 39 subdistricts of Maha Sarakham Province to (1) estimate the prevalence of depressive symptoms, malnutrition risk and fall risk and the extent to which they co-occur beyond chance; (2) identify latent classes of older adults defined by these conditions; (3) examine the demographic, socioeconomic, health, behavioural and home-environment factors associated with class membership, accounting for clustering within subdistricts; and (4) examine concurrently measured external correlates of the classes (self-rated health relative to peers, self-reported ability to look after oneself and difficulty eating) as partial evidence of criterion-related validity. We hypothesised that a distinct subgroup with co-occurring depressive symptoms, malnutrition risk and mobility-related fall risk would be identifiable and that membership would be socially patterned.
2. Materials and Methods
2.1. Study Design and Setting
Maha Sarakham is a predominantly agricultural province in which 190,402 residents (20.32%) were aged 60 years or older in 2025, meeting the definition of a fully aged society [2]. Care for older people in the province is provided through subdistrict health promoting hospitals, local administrative organisations (LAOs), village health volunteers and trained community caregivers under the Older Persons Act and the national long-term care programme [17,18]. The study is reported in accordance with the STROBE statement for cross-sectional studies [19]; the completed checklist is provided as Supplementary File S2.
2.2. Data Source
Data were collected between October and December 2025 through face-to-face interviews at participants’ homes. In each subdistrict, 7–12 interviewers were nominated by the subdistrict health promoting hospital and trained by the research team in October 2025 in the study procedures, administration of the questionnaire, anthropometric measurement and use of the electronic data-collection form. The validated paper questionnaire was converted into an online form (Google Forms), on which interviewers recorded responses directly during the interview; this avoided paper forms and repeated data entry. The research team supplied measuring equipment, including digital weighing scales and measuring tapes. Identifying information was removed before the dataset was released for this analysis.
2.3. Sampling and Sample Size
Forty subdistricts, each corresponding to one LAO, were selected purposively from the research network on the basis of data-system readiness—an established older-adult database and ongoing systematic community health activities. The sites were distributed across 12 of the province’s 13 districts and ranged from rural subdistrict administrative organisations to the provincial municipality (Talat subdistrict, Mueang District). The target sample size for each subdistrict was calculated with Yamane’s formula [20], n = N/(1 + Ne2) with e = 0.05, using the number of residents aged ≥60 years registered with the Department of Provincial Administration on 30 April 2025 (60,478 in total), giving a planned sample of 12,039 (240–383 per subdistrict) (Table S1). One subdistrict (Khwao, Mueang District; planned n = 354) was not surveyed. In the remaining 39 subdistricts, 12,115 older adults from 527 villages were interviewed, 103.7% of the planned 11,685; the target was exceeded in 27 subdistricts (by up to 44.2%, in Ku Santarat; 478 interviews beyond the targets in total), met exactly in seven and 93.2–99.7% reached in the other five. The overall sampling fraction was 21.1% (range 4.0% in the municipality to 48.5%). The study protocol specified the calculated sample size as the minimum number of participants required in each subdistrict rather than as a fixed quota. Within each subdistrict, older adults were selected at random from the registry of older residents; interviewers then confirmed eligibility at the home visit and invited each selected person to participate. Because the calculated number was a minimum, data collection was not stopped once it had been reached: in 27 subdistricts, interviewers continued to invite older residents of the same subdistrict who met the eligibility criteria during the scheduled data-collection period, using the same consent procedure and questionnaire, which yielded 478 interviews beyond the minimum. The order in which these additional residents were approached was not documented, so we cannot confirm that they were selected at random, and they may have been more accessible to interviewers than other residents. In total, at least 12,125 older adults were invited to participate, against a required minimum of 11,685 in the 39 surveyed subdistricts: 12,115 were interviewed and 10 declined (their subdistricts were not recorded), a participation rate of 99.9% among those whose invitation was recorded. Interviewers and local coordinators reported no older adults who could not be contacted, who were found ineligible at the visit or who were replaced by another resident; however, these events were not recorded systematically on the data-collection form, so their numbers may be underestimated, and the participation rate should be regarded as an upper bound. Within-subdistrict selection should therefore be regarded as approximating, rather than strictly following, simple random sampling with a fixed sample size. The participant flow is shown in Figure 1.
Because selection of subdistricts was purposive and sampling fractions differed markedly between subdistricts, we treated subdistricts as clusters in all inferential analyses and report estimates weighted to the registered older population of the study subdistricts as a sensitivity check (Section 2.8). The target population for inference is therefore the registered older population of the 39 study subdistricts, not the province or rural Northeast Thailand as a whole. Cluster-robust inference treats the subdistricts as clusters from a hypothetical population of similar subdistricts; it accounts for within-subdistrict correlation but does not correct for their purposive selection.
2.4. Participants
Eligible participants were aged 60 years or older on the date of interview, had lived in the study area for at least six months, were able to communicate and provide information themselves (or with an authorised assistant) and gave informed consent. Older adults with severe dementia or neurological disorders that prevented an interview, those who declined or could not consent, and those who were acutely ill or hospitalised during data collection were excluded. People who met an exclusion criterion at the home visit were not interviewed (Figure 1). All 12,115 interviewed participants had complete data for the variables analysed, and no records were excluded from the analysis.
2.5. Survey Instrument
The interviewer-administered questionnaire (“Health and well-being interview for people aged 60 years and over”) comprised three parts: (1) socioeconomic characteristics (17 items); (2) health, in five sections—health screening and medical history (7 items), health behaviours according to the Thai “3A–2S–1F” framework (healthy eating, physical activity, emotional management, smoking cessation, alcohol avoidance, and oral and dental health care) (23 items), depression screening with the 2Q and 9Q (11 items), the full Mini Nutritional Assessment (MNA; 18 items including anthropometry) and a fall-risk assessment based on the Morse Fall Scale (6 items); and (3) the home and surrounding environment (15 items). Standardised instruments were used in their official Thai versions: the 9Q of the Department of Mental Health [21], the MNA (validated in Thai older adults [22]) and the health-behaviour assessment developed by the Health Education Division, Department of Health Service Support [23]. The home-environment checklist was developed by the project team from fall-prevention literature, including evidence from rural Thailand on the association between the living environment and fall risk [24]. The content validity of the complete questionnaire, including the home-environment checklist, was assessed by five experts using the index of item–objective congruence (IOC) [25]; the IOC for the questionnaire as a whole was 0.991. Item-level and scale-level content validity indices (I-CVI and S-CVI) were not calculated. Before data collection, the questionnaire was tried out with 34 older adults in Kham Riang Subdistrict, Kantharawichai District, an area outside the study sites; Cronbach’s α for the questionnaire as a whole was 0.897. Separate IOC and reliability coefficients for the home-environment checklist are not available. Weight, height, mid-arm circumference and calf circumference were measured by the trained interviewers using a digital weighing scale and a measuring tape supplied by the research team.
2.6. Measures
2.6.1. Latent Class Indicators
Depressive symptoms: The 9Q assesses nine symptoms over the preceding two weeks, each scored 0 (never) to 3 (every day), giving a total of 0–27. Although the national protocol administers the 9Q after a positive 2-question screen (2Q), in this survey the 9Q was administered to every respondent. The 2Q was not used in the analysis because its dichotomous format provides limited discrimination. 9Q totals were categorised using the Department of Mental Health cut-offs as no (0–6), mild (7–12) and moderate-to-severe (≥13) depressive symptoms; depressive symptoms were defined as a score ≥7.
Nutritional status: The MNA Short-Form (MNA-SF) score (items A–F: reduced food intake, weight loss, mobility, acute illness or psychological stress, neuropsychological problems and body mass index; 0–14 points) was categorised as normal (12–14), at risk of malnutrition (8–11) or malnourished (0–7) [26]; malnutrition risk was defined as MNA-SF ≤11. Calf circumference (MNA item R; <31 cm vs ≥31 cm) was used as a separate indicator of low muscle mass. The MNA cut-off of 31 cm is lower than the sex-specific cut-offs recommended for Asian populations (34 cm for men and 33 cm for women) [27]. Calf circumference was recorded on the electronic form only as the MNA item score (<31 cm vs ≥31 cm), not in centimetres, so the Asian cut-offs could not be applied. These indicators are not locally independent by construction: in the MNA-SF, item C (mobility) overlaps with gait impairment and item E (neuropsychological problems, asked in the Thai version as memory problems) partly overlaps with depressive symptoms, and calf circumference is the alternative to body mass index in item F. The consequences of this overlap were examined in SA1, SA7 and SA10.
Fall risk: The questionnaire included six Morse Fall Scale items [28]: fall in the previous three months, more than one medical diagnosis, ambulatory aid, intravenous therapy, gait and mental status. Because the scale was designed for hospital inpatients, the main analysis used two items relevant to community-dwelling older adults: a fall in the previous three months (item 1) and gait impairment or use of a walking aid (item 3 or item 5 scored above zero); fall risk was defined as either. Because gait impairment or walking-aid use was far more common than a recent fall, this composite mainly reflects mobility-related fall risk rather than fall history. The total Morse score (<25, 25–44, ≥45) was used in a sensitivity analysis.
2.6.2. Covariates
Covariates were specified a priori within a social-determinants framework and grouped into four blocks. (i) Demographic: age group (60–69, 70–79, ≥80 years) and sex. (ii) Socioeconomic and social: marital status (married; widowed; single, divorced or separated), education (no schooling or primary vs secondary or higher), main occupation (agriculture; not working; other), personal monthly income (≤1,000; 1,001–3,000; 3,001–5,000; >5,000 baht), self-reported insufficiency of monthly income, level of current household debt (none, low, moderate, high), living alone, having no main family caregiver, holding a community role (e.g., village head, village health volunteer, village committee member, local sage) and participation in an elderly school, community welfare fund, religious activity or community club. (iii) Health and behaviour: number of 14 self-reported physician-diagnosed chronic conditions (diabetes, hypertension, chronic obstructive pulmonary disease, cancer, cardiovascular disease, dyslipidaemia, stroke, kidney disease, liver disease, genetic disease, metabolic syndrome, thyroid disease, gout and musculoskeletal disorders; categorised 0, 1, ≥2), polypharmacy (>3 medications per day, the threshold used in MNA item H [29]; this is lower than the commonly used threshold of ≥5 medications [30] and therefore identifies a broader group) and five health behaviours from the 3A–2S–1F assessment. Items are rated for the past week on a five-point frequency scale (every day, 5–6, 3–4, 1–2 days, never) and scored 1–5 with 5 representing the most favourable behaviour; we defined vigorous physical activity on ≥3 days, consumption of at least five handfuls (400 g) of fruit and vegetables on ≥5 days, any smoking, any alcohol use and tooth-brushing with fluoride toothpaste at least twice daily every day. (iv) Home environment: a home hazard score counting 11 hazards observed or reported—structurally unsound house, door thresholds, uneven floor levels, sleeping on the floor, toilet outside the house, squat toilet, no bathroom grab bar, a built-in cement water tank in the bathroom (a bending, syncope and drowning hazard), hazardous walkway around the house, clutter of unused items and hazardous materials—and cooking with charcoal. The hazard score is a simple count rather than a validated scale, and two items were very common (no grab bar, 83.7%; door thresholds, 66.9%); a nine-item score excluding them was used in a sensitivity analysis. Body mass index was not used as a covariate because it is a component of the MNA-SF.
2.6.3. Concurrent External Correlates
To examine criterion-related validity, class-specific prevalences were estimated for three MNA items that were not used to define the classes and were measured at the same interview: self-rated health worse than that of peers (MNA item P; question 16 of the Thai questionnaire), not being able to look after oneself (item G; question 7) and needing help or having difficulty eating (item N; question 14). In the standard MNA, item G asks whether the person lives independently (not in a nursing home or hospital); the Thai version asks whether the person is able to look after himself or herself (not in the care of a nursing home or hospital), so responses may reflect perceived self-care ability as well as place of residence. This item is therefore not a measure of dependence in activities of daily living, which were not assessed. Because these items come from the same instrument as the nutritional indicators, and item N is related in content to nutritional status, their associations with class membership are subject to shared-method variance and are described as concurrent external correlates rather than distal outcomes.
2.7. Data Management and Quality Control
The raw dataset was not modified; all cleaning and derivation steps were scripted and logged. There were no missing values or duplicate records. Body mass index was recomputed from weight and height because the stored value was inconsistent with them; the MNA body-mass-index item score agreed with the recomputed value in all records. Coding of marital status and of five home-environment items was verified with the data owner; for two environment items (bathroom grab bar and walkway hazard), the value labels initially supplied were reversed. The reversal was first suspected from internal-consistency checks (e.g., a lower reported prevalence of walkway hazards on soil or stone surfaces than on concrete walkways), and the correct coding (e.g., grab bar: 1 = present, 2 = absent) was then re-confirmed by the data owner against the questionnaire before analysis; no values were changed on the basis of the plausibility checks alone. Community role and social participation were derived from free-text fields where these conflicted with the coded item (109 and 88 records, respectively). Inconsistencies that could not be resolved (e.g., personal income exceeding household income in 344 records) were retained, as the affected variables were not central to the analysis.
2.8. Statistical Analysis
2.8.1. Descriptive Analysis and Co-Occurrence
Participant characteristics were summarised as n (%) or mean (SD), overall and by the number of conditions present (depressive symptoms, 9Q ≥7; malnutrition risk, MNA-SF ≤11; fall risk, a fall in the previous 3 months or gait impairment). Because participants were nested within 39 subdistricts, prevalence estimates are reported with 95% confidence intervals (CIs) based on Taylor-linearised cluster-robust standard errors on the logit scale; design effects and intraclass correlation coefficients (ICCs, one-way ANOVA estimator) quantify clustering. Estimates weighted to the older population of the study subdistricts (weight = registered population/sample size per subdistrict) are also presented. Pairwise associations between the three conditions were estimated with logistic regression adjusted for age group and sex and, additionally, for the third condition, with cluster-robust standard errors. Co-occurrence beyond chance was assessed by comparing the observed frequency of each combination with that expected under statistical independence (product of the marginal prevalences); 95% CIs for the observed-to-expected (O/E) ratios were obtained from 2,000 subdistrict-level cluster bootstrap replicates. Observed-to-expected ratios are displayed in Figure 2B. Because expectations under independence ignore the pairwise associations between the conditions, a large O/E ratio for the triad can arise from pairwise associations alone. We therefore also fitted hierarchical log-linear (Poisson) models to the 2 × 2 × 2 table and compared the observed frequency of the triad with that expected under the homogeneous-association model, which contains all pairwise terms but no three-way term; the three-way interaction was expressed as a ratio of odds ratios [31], with 95% CIs from 2,000 subdistrict cluster-bootstrap replicates. Because the likelihood-ratio test assumes independent observations, the three-way term was tested with a Wald test using the cluster-bootstrap standard error and with a Rao–Scott first-order corrected likelihood-ratio test, in which the likelihood-ratio statistic is divided by the design effect of the three-way coefficient (cluster-bootstrap variance divided by model-based variance) [32]; the unadjusted likelihood-ratio test is reported for comparison. The analysis was repeated with age group, sex and their interactions with each condition included. To examine how closely a simple count of conditions reproduced the latent classification, the number of conditions was cross-tabulated with modal class assignment, and the agreement of a rule of two or more conditions with complex multidomain membership was summarised with sensitivity, specificity and predictive values, using posterior class probabilities as fractional membership (modal assignment as a secondary comparison). Because the latent classes were derived from the same indicators, these quantities measure agreement with the latent classification, not diagnostic accuracy against an independent reference standard.
2.8.2. Latent Class Analysis
Latent class analysis (LCA) was used to identify subgroups with distinct patterns of the three conditions. The primary model used five indicators: 9Q category (three levels), MNA-SF category (three levels), low calf circumference, a recent fall and gait impairment. Retaining polytomous categories rather than binary indicators increased the information available for model identification (72 response patterns). Models with one to six classes were estimated by maximum likelihood with the expectation–maximisation algorithm, using 500 random starting values per model; the 10 best solutions were iterated to convergence (relative change in log-likelihood <10-9) and replication of the best log-likelihood was checked to avoid local maxima; the selected model was then re-estimated with 1,000 random starting values, of which the 20 best were iterated to convergence.
The number of classes was selected on the basis of the Bayesian information criterion (BIC), with the Akaike information criterion (AIC), sample-size-adjusted BIC (SABIC), the parametric bootstrap likelihood ratio test (BLRT; 100 bootstrap samples) comparing K−1 with K classes, the likelihood-ratio chi-square (L2), relative entropy, average posterior probabilities (AvePP), the size of the smallest class and substantive interpretability considered jointly [13,33]. Because the BIC can be conservative and L2 is sensitive to large samples, no single index was used alone. The local independence assumption was examined with bivariate residuals (BVR; Pearson X2/df), with values >3.84 indicating residual association.
2.8.3. Accounting for the Multilevel Structure
To account for the nesting of participants within subdistricts, nonparametric multilevel LCA [34] was fitted, in which subdistricts belong to M latent clusters that differ in class proportions while item parameters are held equal. Following Lukočienė et al. [35], K was first chosen from single-level models, M was then chosen using the BIC based on the number of level-2 units (n = 39), and K was re-examined given M. Because the multilevel solutions replicated poorly and substantially altered the class structure (see Results), the single-level model was retained as the primary model; clustering was accounted for in all subsequent inference by cluster-robust (sandwich) standard errors or cluster bootstrap with subdistricts as clusters, and the multilevel model is reported as a sensitivity analysis. Between-subdistrict heterogeneity in class prevalence was described with subdistrict-level class proportions weighted by the Bolck–Croon–Hagenaars (BCH) method [36].
2.8.4. Factors Associated with Class Membership and External Correlates
Associations between covariates and latent class membership were estimated with the bias-adjusted maximum-likelihood three-step approach [37], which corrects for classification error when regressing modal class assignment on covariates, using multinomial logistic regression with the robust class as reference. Covariate blocks were entered sequentially (Model 1, demographic; Model 2, + socioeconomic and social; Model 3, + health and behaviour; Model 4, + home environment); Model 4 is presented as the main model. Because Model 4 adjusts each covariate for all others, including factors that may lie on pathways from upstream determinants (e.g., chronic conditions and polypharmacy for income and debt), its aORs are conditional associations and should not be interpreted as total effects [38]; estimates for socioeconomic factors before adjustment for health and behavioural factors are shown for Model 2 (Table S5). Results are reported as adjusted odds ratios (aORs) with 95% CIs based on cluster-robust standard errors. Because there were only 39 clusters of unequal size, we additionally computed leave-one-subdistrict-out jackknife (CR3-type) standard errors for all Model 4 coefficients and used t-distribution critical values with 38 degrees of freedom as a small-sample correction [39] (Table S9); interpretation focused on the magnitude and precision of estimates rather than on P values. Multicollinearity was assessed with variance inflation factors (VIFs). The urban municipality comprised a single subdistrict and therefore could not be modelled as a covariate with cluster-robust standard errors; its influence was examined by exclusion. Class-specific prevalences of the external correlates were estimated with the bias-adjusted maximum-likelihood three-step approach for distal outcomes [40], with 95% CIs and differences from the robust class obtained from 1,000 cluster bootstrap replicates.
2.8.5. Sensitivity Analyses
The robustness of the class solution was examined by (SA1–SA2) removing calf circumference; (SA3) adding multimorbidity and polypharmacy as indicators; (SA4) applying design weights; (SA5) excluding the urban municipality; (SA6) replacing the fall indicators with Morse Fall Scale categories; (SA7) redefining nutritional risk using the four MNA-SF items that exclude mobility and neuropsychological problems, which overlap conceptually with the fall and depression indicators; (SA8) a four-class solution; (SA9) the nonparametric multilevel model; and (SA10) relaxing the local dependence between the MNA-SF and calf circumference by combining them into a single six-category item. Classes in each three-class specification were matched to those of the main model by maximal agreement of modal assignments, unless this conflicted with the item-response profiles (SA3), in which case the class with the highest combined probability of depressive symptoms and gait impairment was matched to the complex multidomain class. Agreement was summarised as percentage agreement and Cohen’s κ, and the item-response probabilities of all sensitivity solutions are reported (Table S8). Associations with covariates were additionally re-estimated with the nine-item home hazard score and after omitting tooth-brushing (Table S10). Sensitivity analyses are labelled SA1–SA10 to distinguish them from the supplementary tables.
2.8.6. Software
Analyses were performed in Python (versions 3.10–3.11) using NumPy, SciPy, pandas and statsmodels (version 0.15.0). LCA, multilevel LCA, the BLRT, BVRs and the three-step estimators were implemented in purpose-written code. To verify this code, the primary single-level solution was cross-checked against StepMix (version 3.0.0) [41], which yielded identical modal class assignments for all participants, and the bias-adjusted three-step coefficients of Model 4 were compared with those of StepMix’s ML-corrected three-step estimator (Table S7D). All steps from data cleaning and variable derivation to class enumeration, three-step estimation and sensitivity analyses were scripted with fixed random seeds. Because the scripts are tied to the structure of a dataset that is not publicly available, they are not deposited in a public repository; they are available from the corresponding author on reasonable request, together with the data under the conditions given in the Data availability statement.
2.9. Ethical Considerations
The study, including data collection and the present analysis, was approved by the Human Research Ethics Committee of the Maha Sarakham Provincial Public Health Office (certificate no. 17/2568, 30 September 2025), before interviewer training and data collection began. Before the interview, participants were informed of the purpose of the survey, that their information would be kept confidential and used only for research and academic purposes, that participation would not affect them, and that they could decline to answer or stop at any time without giving a reason. Verbal informed consent was obtained by the interviewer before the interview began and was confirmed by the interviewer on the first page of the online data-collection form; the remaining questions could not be accessed until consent had been confirmed. The analytic dataset contained no names, addresses or telephone numbers. The 9Q, MNA and fall-risk items were administered as part of a population health survey. Interviewers recorded item responses on the electronic form without calculating scores, and scores were derived by the research team after data collection had been completed; individual screening results were therefore not available at the time of the interview. Individual feedback, referral and follow-up of participants with positive screening results were outside the scope of the approved protocol, and because identifying information was removed before the dataset was released for analysis, the research team could not re-contact participants. In the analysed data, 1,017 participants (8.4%) had a 9Q score ≥7 and 571 (4.7%) reported thoughts of self-harm (9Q item 9 >0); only aggregated results are reported. The absence of real-time scoring and of a referral pathway is acknowledged as a limitation.
3. Results
3.1. Participant Characteristics
A total of 12,115 older adults from 527 villages in 39 subdistricts were included (median 311 participants per subdistrict; range 240–424). The mean age was 69.6 years (SD 7.1); 56.3% were aged 60–69, 33.7% 70–79 and 10.0% ≥80 years, and 58.8% were women (Table 1). Most participants had primary education or less (87.7%) and were engaged in agriculture (78.7%); 63.8% were married and 28.8% widowed. Personal monthly income was ≤1,000 baht for 30.1%, 41.9% reported insufficient income and 76.6% had household debt. Overall, 15.7% had two or more chronic conditions and 30.8% reported polypharmacy.
3.2. Prevalence and Co-Occurrence of the Three Conditions
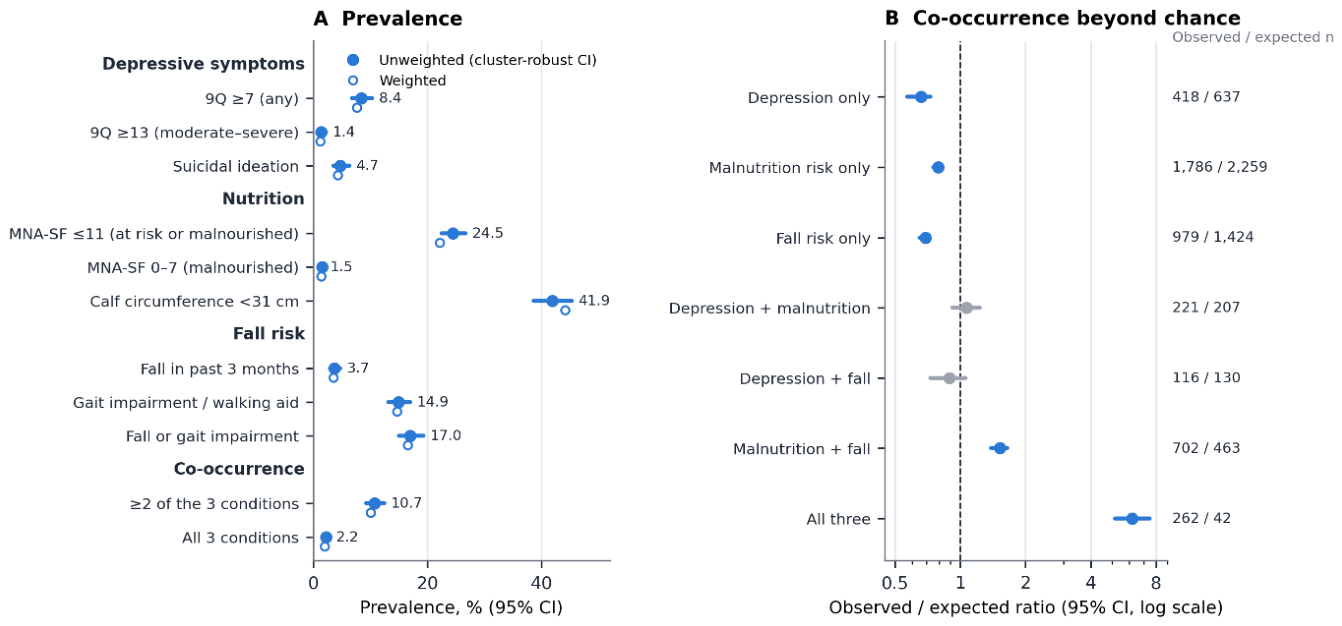
The prevalence of depressive symptoms (9Q ≥7) was 8.4% (95% CI 6.8–10.3), including 1.4% (0.9–2.2) with moderate-to-severe symptoms; 4.7% (3.5–6.3) reported thoughts of self-harm. Malnutrition risk (MNA-SF ≤11) was present in 24.5% (22.5–26.7), of whom most were at risk rather than malnourished (malnourished 1.5% [1.2–1.8]), and 41.9% (38.6–45.3) had a calf circumference <31 cm. A fall in the previous 3 months was reported by 3.7% (2.9–4.7), gait impairment or walking-aid use by 14.9% (13.1–17.0), and either by 17.0% (15.0–19.3) (Figure 2A). Clustering within subdistricts was modest in terms of ICCs (0.002–0.044) but, given the large cluster sizes, yielded design effects of up to 14.5. Weighted estimates were similar to unweighted estimates (Table S2).
Two or more conditions co-occurred in 10.7% (9.3–12.4) and all three in 2.2% (1.7–2.8) of participants. The conditions were mutually associated: after adjustment for age, sex and the third condition, the aOR was 2.64 (2.19–3.18) for depressive symptoms and malnutrition risk, 2.74 (2.13–3.53) for depressive symptoms and fall risk, and 2.58 (2.23–2.98) for malnutrition risk and fall risk. The combination of all three conditions was observed in 262 participants, compared with 42 expected under independence (O/E 6.18, 95% CI 5.17–7.47), whereas single conditions occurred less often than expected (O/E 0.66–0.79) (Figure 2B). The excess of the triple combination relative to independence persisted when the MNA-SF items overlapping with mobility and mood were removed (O/E 5.85). However, most of this excess was attributable to the pairwise associations: under a log-linear model including all pairwise associations but no three-way term, 246.9 triads were expected (O/E 1.06, 95% CI 1.01–1.12). The three-way interaction was small (ratio of odds ratios 1.39, 95% CI 1.04–1.89; cluster-bootstrap Wald P = 0.030; Rao–Scott-corrected likelihood-ratio χ² = 4.77, df = 1, P = 0.029) and similar after adjustment for age group and sex (O/E 1.07; ratio of odds ratios 1.43, 95% CI 1.06–1.98; bootstrap Wald P = 0.024; Rao–Scott P = 0.022) (Table S7A). The design effect of the three-way coefficient was close to 1 (1.05 unadjusted, 1.12 adjusted), much smaller than the design effects of the prevalence estimates, so correcting for clustering changed these P values little.
Figure 2.
Prevalence and co-occurrence of depressive symptoms, malnutrition risk and fall risk (N = 12,115). (A) Prevalence with 95% CIs from cluster-robust standard errors (39 subdistricts); open circles show estimates weighted to the registered older population. (B) Ratio of observed to expected frequency of each combination under independence, with 95% CIs from 2,000 subdistrict cluster-bootstrap replicates (log scale); grey = CI includes 1. Numbers at right are observed/expected counts.
Figure 2.
Prevalence and co-occurrence of depressive symptoms, malnutrition risk and fall risk (N = 12,115). (A) Prevalence with 95% CIs from cluster-robust standard errors (39 subdistricts); open circles show estimates weighted to the registered older population. (B) Ratio of observed to expected frequency of each combination under independence, with 95% CIs from 2,000 subdistrict cluster-bootstrap replicates (log scale); grey = CI includes 1. Numbers at right are observed/expected counts.
3.3. Latent Class Enumeration
Fit statistics for models with one to six classes are shown in Table 2. The BIC was lowest for the three-class model (51,509.7), which also had the highest relative entropy (0.818). AIC continued to decrease slightly beyond three classes, whereas SABIC was virtually identical for three and four classes (51,436.6 and 51,436.5) and increased thereafter, and the BLRT was significant up to six classes (P <0.01 to P = 0.03), but models with four or more classes had lower entropy (0.69–0.74), lower minimum AvePP (0.45–0.67), smaller classes (1.0–3.3%) and poorer replication of the best log-likelihood. The three-class model was therefore selected; its best log-likelihood was replicated in all 10 final-stage solutions during enumeration (Table 2) and in all 20 final-stage solutions when the selected model was re-estimated with 1,000 random starting values. The three-class model did not reproduce all observed response patterns (L2 = 139.6, df = 48); BVRs indicated residual association of calf circumference with the 9Q (BVR 6.23) and MNA-SF (BVR 6.49) categories, whereas all other BVRs were <3.1 (Table S3).
3.4. Latent Class Profiles
The three classes were labelled according to their item-response probabilities (Figure 3A; Table S4). The robust class (77.3%) had low probabilities of all indicators (depressive symptoms 5.1%, malnutrition risk 4.9%, recent fall 1.9%, gait impairment 8.5%), although 35.7% had a calf circumference <31 cm. The nutritional-risk class (16.2%) was defined by malnutrition risk (100%, almost entirely in the at-risk range) and low calf circumference (63.4%), with modestly elevated depressive symptoms (11.2%) and gait impairment (20.5%) and few falls (3.3%). The complex multidomain class (6.5% model-estimated; 565 participants, 4.7%, by modal assignment) was characterised mainly by gait impairment (78.2%) and malnutrition risk (70.2%, including 21.2% malnourished), with elevated probabilities of depressive symptoms (40.9%, including 9.7% moderate-to-severe) and a recent fall (26.8%). Because these probabilities are well below 1, only about one-quarter of the class was expected to have all three conditions (24.1% model-implied; 26.0% posterior-weighted), although 46.4% of participants modally assigned to the class did (Table S7B). Average posterior probabilities were high for the robust class (0.984) and moderate for the nutritional-risk (0.740) and complex multidomain (0.775) classes. The classification-error matrix indicated that only 55.8% of complex-multidomain members would be assigned modally to that class, 25.9% to the nutritional-risk class and 18.3% to the robust class (Table S3). Modal assignment is therefore unsuitable for identifying individual members of this class; all class-specific estimates used bias-adjusted three-step estimators that take classification error into account.
3.5. Factors Associated with Class Membership
In the fully adjusted model (Figure 4), membership of the complex multidomain class relative to the robust class was associated with older age (70–79 years: aOR 1.70, 95% CI 1.22–2.36; ≥80 years: 4.39, 2.68–7.18), not working (4.23, 2.59–6.90), insufficient income (1.97, 1.28–3.04), high household debt (2.45, 1.29–4.65), one chronic condition (2.25, 1.61–3.16) and two or more chronic conditions (3.54, 2.23–5.64), polypharmacy (2.45, 1.73–3.47), smoking (1.91, 1.07–3.41) and a higher home hazard score (1.44 per additional hazard, 1.29–1.61). Twice-daily tooth-brushing (0.21, 0.13–0.33), adequate fruit and vegetable intake (0.68, 0.49–0.94) and cooking with charcoal (0.55, 0.38–0.79) were inversely associated. Estimates for having no family caregiver (2.00, 0.99–4.04) and alcohol use (1.54, 0.97–2.46) were imprecise. Before adjustment for health and behavioural factors (Model 2), the aORs for insufficient income (2.70) and high household debt (3.20) were larger (Table S5).
Membership of the nutritional-risk class was associated with older age (70–79 years: 1.90, 1.63–2.20; ≥80 years: 4.22, 3.27–5.44), female sex (1.29, 1.09–1.54), being single, divorced or separated (1.56, 1.21–2.00), not working (1.42, 1.08–1.85), personal income ≤1,000 baht (1.38, 1.03–1.85), polypharmacy (1.43, 1.18–1.73), smoking (1.74, 1.39–2.18) and the home hazard score (1.09, 1.03–1.16), and inversely with social participation (0.78, 0.62–0.99), fruit and vegetable intake (0.74, 0.59–0.93), tooth-brushing (0.63, 0.47–0.83) and two or more chronic conditions (0.70, 0.54–0.92). Associations were consistent in direction across the sequential models (Table S5), and no VIF exceeded 2.4. With jackknife standard errors and t(38) critical values (Table S9), all associations with the complex multidomain class listed above retained CIs excluding 1, although the lower limit for smoking was close to 1 (1.005–3.647); for the nutritional-risk class, the CIs for personal income ≤1,000 baht (0.999–1.902) and social participation (0.611–1.006) included 1. Results were similar with the nine-item home hazard score (complex multidomain 1.51, 1.33–1.72; nutritional risk 1.11, 1.04–1.19), and omitting tooth-brushing changed the other complex-class aORs by no more than 21% (largest changes: age ≥80 years, 4.39 to 5.29; fruit and vegetable intake, 0.68 to 0.55) and the nutritional-risk aORs by no more than 4% (Table S10). The bias-adjusted three-step coefficients agreed with those from StepMix (maximum absolute difference <0.01 on the log-odds scale; Table S7D).
3.6. Concurrent External Correlates
The classes differed in concurrently measured characteristics not used to define them (Figure 3B; Table S4). Self-rated health worse than peers was reported by 1.8% (1.3–2.4) of the robust class, 5.4% (3.6–7.3) of the nutritional-risk class and 38.6% (32.3–46.8) of the complex multidomain class; the corresponding figures were 12.0%, 14.7% and 29.1% for not being able to look after oneself (MNA item G) and 2.3%, 5.1% and 39.7% for difficulty eating without help. Relative to the robust class, the complex multidomain class had 36.8 (30.6–45.0), 17.2 (10.9–23.8) and 37.5 (30.3–45.0) percentage-point higher prevalences of these outcomes, respectively.
3.7. Between-Subdistrict Heterogeneity and Sensitivity Analyses
Class prevalence varied considerably across subdistricts: the BCH-corrected proportion of the complex multidomain class ranged from 0% to 24.0% (interquartile range 2.8–8.8%) and that of the nutritional-risk class from 0.3% to 34.0%. Nonparametric multilevel models fitted the data better than single-level models (BIC based on 39 subdistricts favoured M = 5 latent subdistrict clusters for K = 3), but their best solutions replicated poorly (2–12 of 60 starts) and shifted the class structure (robust 53.2%, nutritional risk 33.3%, complex multidomain 13.5%; κ = 0.24 versus the main model) (SA9; Table S6).
Modal class assignment was essentially unchanged by design weighting (SA4; one of 12,115 participants reassigned, κ = 0.9998) and unchanged by exclusion of the urban municipality (SA5; κ = 1.000), and was highly consistent when Morse Fall Scale categories replaced the fall indicators (SA6; κ = 0.946) (Table S6). The different class sizes under design weighting reflect the reweighting of subdistricts with different class compositions rather than reclassification of individuals. Agreement was moderate when the MNA-SF items overlapping with mobility and mood were removed (SA7; κ = 0.655) and fair when calf circumference was removed (SA1; κ = 0.441), when the MNA-SF and calf circumference were combined into a joint item (SA10; κ = 0.403) or when multimorbidity and polypharmacy were added as indicators (SA3; κ = 0.227). Across three-class single-level specifications, a large robust class (73–84%) was consistently identified, and one class had higher probabilities of depressive symptoms, malnutrition risk, recent falls and gait impairment than the robust class in every specification (Table S8). Its size and composition, however, depended on the indicators used. In specifications with at least moderate agreement with the main model (SA4–SA7; κ = 0.655–1.000), it comprised 5.0–8.5% and had a profile similar to that of the main complex multidomain class. When calf circumference was removed (SA1) or combined with the MNA-SF (SA10), it became a smaller and more severe class (1.9% and 0.9%; depressive symptoms 56.3% and 81.6%, malnutrition risk 100%, gait impairment 88.7% and 86.6%) whose expected membership consisted mainly of main-model complex multidomain members (77% and 87%) but which contained only 23% and 12% of that class’s expected members; most of the others moved to a broader intermediate class, and many main-model nutritional-risk members moved to the robust class (Table S8). When multimorbidity and polypharmacy were added (SA3), a multimorbidity–polypharmacy class (15.1%) with low probabilities of the three conditions emerged, and the class most similar to the complex multidomain class (11.7%) combined main-model complex and nutritional-risk members and had lower probabilities of depressive symptoms (31.0%) and gait impairment (58.5%). In the four-class solutions (SA2, SA8), the class with the highest probabilities of depressive symptoms and gait impairment and with malnutrition risk in all members comprised 1.0% and 3.3%. The size of this class is therefore uncertain: the main estimate of 6.5% is conditional on the indicator set, closely agreeing specifications gave 5.0–8.5%, and the range across all three-class specifications was 0.9–11.7%. The size and definition of the intermediate nutritional-risk class likewise depended on how nutrition and muscle mass were operationalised.
Of the 1,301 participants with two or more conditions, 470 (36.1%) were modally assigned to the complex multidomain class, 780 (60.0%) to the nutritional-risk class and 51 (3.9%) to the robust class. Using posterior probabilities as fractional membership, the two-or-more-conditions rule flagged 10.7% of participants; its agreement with complex multidomain membership corresponded to a sensitivity of 72.2%, specificity of 93.5%, positive predictive value of 43.5% and negative predictive value of 98.0%. Requiring all three conditions increased the positive predictive value to 78.0% but reduced sensitivity to 26.0% (Table S7C). Because the classes were derived from the same indicators, and every member of the nutritional-risk class has at least one condition by construction, these figures describe agreement with the latent classification rather than diagnostic accuracy.
4. Discussion
4.1. Principal Findings
In this survey of 12,115 community-dwelling older adults in 39 subdistricts of Maha Sarakham Province, depressive symptoms, malnutrition risk and fall risk were common and mutually associated: all three conditions co-occurred 6.2 times more frequently than expected under independence, although this excess was largely accounted for by the pairwise associations between them, with only a small additional three-way excess. Latent class analysis identified three subgroups—a robust majority (77.3%), a nutritional-risk class (16.2%) and a complex multidomain class (6.5%) characterised mainly by gait impairment and malnutrition risk, with elevated probabilities of depressive symptoms and recent falls, whose size was sensitive to indicator specification. Membership of the complex multidomain class was socially patterned—associated with not working, insufficient income and high household debt—as well as with multimorbidity, polypharmacy, smoking and home hazards, and this class more often reported worse health than peers, inability to look after oneself and difficulty eating unaided. These findings are cross-sectional and describe associations rather than causal effects. Our hypothesis was only partly supported: a distinct class with elevated probabilities of all three conditions was identified, but only about one-quarter of its members were expected to have all three (24.1% model-implied; 26.0% posterior-weighted), so the class is better described as a multidomain risk profile dominated by mobility impairment and malnutrition risk than as a group defined by the full triad.
4.2. Comparison with Previous Studies
The prevalence estimates were lower than most previous Thai and regional reports. Depressive symptoms (8.4%) were less common than the 18.5% reported in a rural Thai community study [5] and the subgroup estimate of 17.7% (five studies) for rural Southeast Asia in a meta-analysis of rural older adults in Asia [6]; malnutrition risk on the MNA-SF (24.5%) was lower than the pooled Thai estimate of 37.8% [4]; and only 3.7% reported a fall in the previous three months, compared with 34.5% over six months in another rural Maha Sarakham sample [7]. Differences in cut-offs and settings explain part of this gap, but the difference in fall history is not explained by the recall period alone: a three-month prevalence of 3.7% corresponds to roughly 7% over six months if falls occur evenly over time, still less than one-quarter of the earlier estimate. Falls without injury are often forgotten [42], and interviews were conducted face to face by interviewers nominated by subdistrict health promoting hospitals, often local health personnel, which may have encouraged socially desirable responses about mood and falls; interviewer effects on sensitive items are well documented [43]. Interviewer identifiers were not available in the released dataset, so interviewer effects could not be separated from subdistrict effects, and the between-subdistrict variation in prevalence (ICCs up to 0.044; complex-class prevalence 0–24%) may partly reflect them. For these reasons fall history was combined with observed gait impairment or walking-aid use (14.9%), and the resulting indicator should be interpreted as mobility-related fall risk rather than fall occurrence.
The co-occurrence pattern is consistent with the view of depression, malnutrition and falls as geriatric syndromes that share risk factors and pathways [8]. The mutual associations we observed (adjusted odds ratios 2.6–2.7 for each pair) are of similar magnitude to those reported for malnutrition and depression [9] and for depression, malnutrition and falls [10], although evidence on depression and falls has been inconsistent across reviews [11]. The class structure resembled that reported in a latent class analysis of intrinsic capacity among community-dwelling older adults in China, in which 79.4% were relatively healthy and 7.8% had concurrent declines in locomotion, psychological function, cognition and vitality [14]. This convergence across different instruments is consistent with the existence of a small multidomain subgroup, but in our data the size of this class ranged from 0.9% to 11.7% across specifications, and the intermediate nutritional-risk class also depended on how nutrition and muscle mass were measured (Table S6 and Table S8); the similarity in size should therefore not be over-interpreted.
Two further points bear on the interpretation of the classes. First, the indicators were categorised from continuous scores, and the robust and nutritional-risk classes differed mainly in the level of the MNA-SF; these classes may represent different severities along a single nutritional dimension (quantitative classes) rather than qualitatively distinct subgroups, a distinction that LCA of categorised indicators cannot resolve [44]. Factor mixture or continuous latent-variable models of the item-level scores would help to establish whether the complex multidomain class is a qualitatively distinct configuration or the upper tail of a continuum. Second, calf circumference behaved differently from the other indicators. With the 31 cm cut-off it clearly separated the robust class (35.7% below the cut-off) from both at-risk classes (63.4% and 62.4%) but did not distinguish the nutritional-risk from the complex multidomain class. The substantial change in the solution when it was removed (SA1; κ = 0.441) is therefore more plausibly explained by its residual local dependence with the MNA-SF and 9Q categories (BVRs 6.49 and 6.23; Table S3) than by a lack of discriminating information. Calf circumference shares the anthropometric content of the MNA-SF, in which it substitutes for body mass index, and was associated with depressive symptoms beyond what the classes explained; when it was removed or merged with the MNA-SF (SA10), participants were re-partitioned: many main-model nutritional-risk members were assigned to the robust class, and the complex multidomain class divided between a broader intermediate class and a smaller, more severe multidomain class (Table S8). Because calf circumference was recorded only as the MNA item score, we could not examine whether the higher Asian cut-offs [27], which would classify more older adults as having low muscle mass, alter the class structure. Together with the structural overlap between MNA-SF items and the gait and depression indicators, these findings indicate that the class boundaries, and particularly class sizes, are partly determined by measurement choices.
4.3. Factors Associated with the Complex Multidomain Class
Socioeconomic disadvantage was a prominent correlate of the complex multidomain class. Not working, insufficient income and high household debt were each associated with roughly two- to four-fold odds of membership after adjustment for age, health and behaviours (Figure 4). Because this model also adjusted for chronic conditions, polypharmacy and behaviours, which may lie on pathways from socioeconomic disadvantage to these syndromes, the aORs describe conditional associations rather than total effects [38]; estimates before adjustment for health and behavioural factors were somewhat larger (Model 2, Table S5). In an agrarian population in which most older adults continue to farm, withdrawal from work may be both a consequence of declining capacity and a pathway to financial strain; the cross-sectional design does not allow these directions to be separated. Multimorbidity and polypharmacy were also strongly associated with the complex class, underlining the overlap between geriatric syndromes and chronic disease management [8].
Several behavioural and environmental associations merit cautious interpretation. Twice-daily tooth-brushing was strongly and inversely associated with both at-risk classes. Because 89.7% of participants reported this behaviour, the minority who did not are likely to be distinguished by limited capacity for self-care, and the association probably reflects reverse causation, reduced functional capacity or socially desirable reporting rather than a protective effect of brushing itself. Oral health remains relevant to nutrition, as tooth loss is associated with malnutrition risk in older adults [45], but these data do not support oral health promotion as a specific lever for preventing membership of the at-risk classes. Each additional home hazard was associated with 44% higher odds of complex multidomain membership, consistent with evidence linking the home environment to falls in rural Thailand [7,24]. The inverse associations of cooking with charcoal and, for the nutritional-risk class, of having two or more chronic conditions are unlikely to be protective: continuing to cook probably marks preserved functional capacity, and people with cardiometabolic conditions may have higher body weight and more regular contact with health services. These associations should be regarded as hypotheses.
4.4. Policy Implications for Community-Based Care of Older People
The findings have four implications for the organisation of community-based care in Maha Sarakham and similar provinces. First, screening results should be interpreted together rather than condition by condition. Depressive symptoms, nutritional status and fall risk are already assessed in routine screening of older people, but the results are recorded and followed up separately. A simple rule that flags older adults with two or more of these conditions would flag 10.7% of this sample, including everyone with the full triad. In our data the rule agreed only partly with latent class membership: it flagged an estimated 72% of complex multidomain members and left 94% of non-members unflagged, but only 44% of those flagged were expected members, whereas nearly half (47.5%) were expected members of the nutritional-risk class (Table S7C). Because the latent classes were derived from the same screening indicators, these figures reflect agreement with the latent classification rather than diagnostic accuracy. Such a rule may therefore be useful for prompting a fuller integrated assessment rather than as a case-finding tool, and its validity against clinical outcomes such as incident dependency, falls and hospitalisation should be evaluated prospectively before adoption. This approach is consistent with the WHO ICOPE framework, which calls for integrated, person-centred assessment and care plans covering mobility, vitality and psychological capacity [12].
Second, the complex multidomain class represents a preventive target that falls between existing programmes. Thailand’s community-based long-term care programme focuses on older people who are already dependent [16,18], yet most members of the complex multidomain class did not report being unable to look after themselves (29.1% did, compared with 12.0% of the robust class; MNA item G). Because this item is crude, depends on self-perception and was also endorsed by 12% of the robust class, it cannot establish functional independence, and activities of daily living were not assessed; the finding suggests, but does not demonstrate, that many members of this class are not yet dependent. Extending care-manager review to these individuals, with medication review for polypharmacy, nutritional support, follow-up of depressive symptoms and fall-prevention exercise, could delay their transition to dependency; this requires evaluation in intervention studies.
Third, local administrative organisations have levers that match the correlates identified. Under the Older Persons Act, they are responsible for social welfare and elderly quality-of-life activities [17]. The associations with insufficient income, household debt and home hazards suggest that welfare assessment, financial counselling and home-modification budgets could be directed preferentially to older adults with co-occurring conditions, rather than distributed uniformly. The gap between observed hazards and older adults’ own risk perception reported in Maha Sarakham [7] indicates that home assessments should be conducted by trained staff rather than relying on self-report.
Fourth, resource allocation should be informed by local data. The prevalence of the complex multidomain class ranged from 0% to 24% across subdistricts, implying that uniform per-capita allocation would under-serve some communities. Part of this variation may reflect differences in interviewers and measurement, so linking routine screening data from primary care and local government databases and standardising assessment procedures are prerequisites for using such data to target resources.
4.5. Strengths and Limitations
The strengths of this study include a large sample drawn from 39 subdistricts, standardised instruments, anthropometric measurements taken by trained interviewers, a complete dataset, and a latent class approach that followed current recommendations, including bias-adjusted three-step estimation, cluster-robust inference and ten sensitivity analyses.
Several limitations should be considered. First, the cross-sectional design precludes causal inference and temporal ordering. Second, subdistricts were selected purposively on the basis of data-system readiness, and sampling fractions varied widely; inference is therefore limited to the older population of the study subdistricts, and the results should not be generalised to the province or to rural Northeast Thailand without caution. Third, falls were self-reported over only three months, and the Morse Fall Scale was designed for inpatients [28]; fall risk was therefore represented by component items rather than the total score. Fourth, the calf circumference cut-off of 31 cm in the MNA is not specific to Asian populations, for whom sex-specific cut-offs of 34 cm for men and 33 cm for women are recommended [27]; because calf circumference was recorded only as the MNA item score, these cut-offs could not be examined, and this indicator also showed residual local dependence with the MNA-SF and depression categories. Fifth, the MNA-SF overlaps by construction with the gait and depression indicators, the size of both the intermediate and the complex multidomain classes was sensitive to indicator specification, and classification of individuals into the complex class was uncertain (55.8% correctly assigned by modal assignment). Sixth, multilevel models could not be estimated stably, and interviewer identifiers were not available, so between-subdistrict variation may partly reflect interviewer effects and socially desirable reporting. Seventh, the external correlates came from the same MNA instrument and interview as the indicators, item G reflects self-reported ability to look after oneself rather than assessed functional dependence, and the home-environment checklist was developed for this study, included very common items, and its content validity and reliability were assessed only as part of the whole questionnaire (IOC 0.991; Cronbach’s α 0.897). Eighth, screening scores were derived only after data collection, so participants who screened positive for depressive symptoms or suicidal ideation were not referred through the study; community surveys that include mental-health screening should incorporate real-time scoring and a predefined referral pathway. In addition, the numbers of older adults who could not be contacted, were ineligible or were replaced were not recorded systematically, and the additional participants recruited beyond the minimum sample may not have been selected at random. Finally, people with severe dementia were excluded and cognition and activities of daily living were not assessed, so the burden of co-occurring conditions is likely underestimated.
5. Conclusions
Depressive symptoms, malnutrition risk and fall risk were mutually associated among older adults in the study subdistricts, and a small subgroup—an estimated 6.5%, or 5.0–8.5% in closely agreeing specifications, although its size ranged from 0.9% to 11.7% across indicator specifications—was characterised by mobility impairment and malnutrition risk with elevated depressive symptoms and falls, together with socioeconomic disadvantage, multimorbidity, polypharmacy and home hazards, and already reported poorer health and more difficulty with self-care and eating. Considering existing screening results together, and linking older adults with multiple risks to coordinated health, social welfare and home-modification support delivered by primary care and local government, may offer a practical route to preventing dependency. Longitudinal and intervention studies are needed to confirm these associations, to evaluate the validity of count-based screening rules against clinical outcomes and to test such integrated approaches.
Supplementary Materials
The following supporting information can be downloaded at: Preprints.org, Table S1: Study subdistricts, registered older population, planned and achieved sample; Table S2: Prevalence of the three conditions and their indicators: unweighted and weighted estimates, design effects and intraclass correlations; Table S3: Diagnostics of the selected three-class model: (A) bivariate residuals; (B) classification-error matrix; Table S4: Item-response probabilities and concurrent external correlates by latent class; Table S5: Sequential three-step models (Models 1–3): adjusted odds ratios (95% CI) for class membership relative to the robust class; Table S6: Sensitivity analyses SA1–SA10: model fit, class sizes and agreement with the main model; Table S7: Additional analyses: (A) log-linear models of the three-way interaction; (B) number of conditions by modal class assignment; (C) agreement of count-based rules with complex multidomain class membership; (D) cross-check of the bias-adjusted three-step estimates against StepMix; Table S8: Item-response probabilities of the sensitivity solutions (SA1–SA10); Table S9: Leave-one-subdistrict-out jackknife (CR3-type) standard errors and t(38)-based 95% confidence intervals for the fully adjusted model (Model 4); Table S10: Fully adjusted model re-estimated with the nine-item home hazard score and after omitting tooth-brushing; File S1: Verbal informed consent script (original Thai and English translation); File S2: STROBE checklist for cross-sectional studies.
Author Contributions
Conceptualization, N.T., R.K. and D.H.; Methodology, N.T., R.K. and K.T.; Software, N.T. and R.K.; Validation, R.K. and K.T.; Formal Analysis, R.K.; Investigation, N.T., N.C. and C.T.; Resources, N.C.; Data Curation, R.K. and C.T.; Writing—Original Draft Preparation, N.T. and R.K.; Writing—Review and Editing, N.T., R.K., N.C., K.T., C.T. and D.H.; Visualization, R.K.; Supervision, N.T.; Project Administration, N.T.; Funding Acquisition, N.T. All authors have read and agreed to the published version of the manuscript.
Funding
This research project was financially supported by Mahasarakham University (Grant no. 6911029). Data collection was additionally supported by the Thai Health Promotion Foundation (ThaiHealth), Office of Healthy Community Promotion, through the project Network Collaboration to Drive Maha Sarakham toward a Healthy Province (Project no. 68-00185). The funders had no role in the design of the present analysis, the interpretation of the findings, the writing of the manuscript or the decision to submit it for publication.
Institutional Review Board Statement
The study was conducted in accordance with the Declaration of Helsinki, and approved by the Human Research Ethics Committee of the Maha Sarakham Provincial Public Health Office (certificate no. 17/2568; date of approval: 30 September 2025).
Informed Consent Statement
Verbal informed consent was obtained from all participants before the interview. Verbal rather than written consent was used because the study was a minimal-risk, interviewer-administered household survey and most participants had limited formal education (87.7% had primary education or less); this procedure was approved by the Human Research Ethics Committee of the Maha Sarakham Provincial Public Health Office (certificate no. 17/2568). The interviewer presented a standard information statement on the first page of the electronic data-collection form and recorded each participant’s decision in a required consent item that preceded all interview questions. The consent script, in the original Thai with an English translation, is provided as Supplementary File S1.
Data Availability Statement
The de-identified data supporting the findings of this study are not publicly available because they were collected under a community health programme and contain information that could compromise participant privacy. They are available from the corresponding author on reasonable request, subject to permission from the project Network Collaboration to Drive Maha Sarakham toward a Healthy Province and approval from the Human Research Ethics Committee of the Maha Sarakham Provincial Public Health Office. The analysis scripts are likewise not deposited in a public repository and are available from the corresponding author on reasonable request.
Acknowledgments
The authors thank the local administrative organisations and subdistrict health promoting hospitals of the 39 participating subdistricts in Maha Sarakham Province for coordinating the fieldwork, and the interviewers who collected the data with care. We are deeply grateful to the older adults who gave their time to take part in the survey. We also thank the Office of Healthy Community Promotion, Thai Health Promotion Foundation (ThaiHealth), for supporting the survey, and the Faculty of Public Health, Mahasarakham University, for institutional and administrative support.
Conflicts of Interest
The authors declare that they have no known competing financial interests or personal relationships that could have appeared to influence the work reported in this paper.
Abbreviations
The following abbreviations are used in this manuscript:
| 2Q | 2-question depression screening |
| 9Q | 9-question depression rating scale (Thai) |
| AIC | Akaike information criterion |
| ANOVA | analysis of variance |
| aOR | adjusted odds ratio |
| AvePP | average posterior probability |
| BCH | Bolck–Croon–Hagenaars method |
| BIC | Bayesian information criterion |
| BLRT | bootstrap likelihood ratio test |
| BMI | body mass index |
| BVR | bivariate residual |
| CI | confidence interval |
| CR3 | jackknife cluster-robust variance estimator |
| CVI | content validity index |
| ICC | intraclass correlation coefficient |
| ICOPE | Integrated Care for Older People |
| IOC | index of item–objective congruence |
| L2 | likelihood-ratio chi-square statistic |
| LAO | local administrative organisation |
| LCA | latent class analysis |
| LL | log-likelihood |
| ML | maximum likelihood |
| MNA | Mini Nutritional Assessment |
| MNA-SF | Mini Nutritional Assessment Short-Form |
| O/E | observed-to-expected ratio |
| SA | sensitivity analysis |
| SABIC | sample-size-adjusted Bayesian information criterion |
| SD | standard deviation |
| STROBE | Strengthening the Reporting of Observational Studies in Epidemiology |
| THB | Thai baht |
| VIF | variance inflation factor |
| WHO | World Health Organization |
References
- Department of Health; Ministry of Public Health. Annual Report on Elderly Health in Thailand 2024; (In Thai). Department of Health: Nonthaburi, Thailand, 2025. [Google Scholar]
- Department of Older Persons; Ministry of Social Development and Human Security. Older Persons Situation in Maha Sarakham Province 2025; (In Thai). Department of Older Persons: Bangkok, Thailand, 2025. [Google Scholar]
- World Health Organization. Falls. Fact Sheet. 26 April 2021. Available online: https://www.who.int/news-room/fact-sheets/detail/falls (accessed on 3 October 2026).
- Chuansangeam, M.; Wuthikraikun, C.; Supapueng, O.; Muangpaisan, W. Prevalence and risk for malnutrition in older Thai people: a systematic review and meta-analysis. Asia Pac. J. Clin. Nutr. 2022, 31, 128–141. [Google Scholar] [CrossRef] [PubMed]
- Charoensakulchai, S.; Usawachoke, S.; Kongbangpor, W.; Thanavirun, P.; Mitsiriswat, A.; Pinijnai, O.; et al. Prevalence and associated factors influencing depression in older adults living in rural Thailand: a cross-sectional study. Geriatr. Gerontol. Int. 2019, 19, 1248–1253. [Google Scholar] [CrossRef] [PubMed]
- Li, T.; He, J.; Mao, Y.; Li, H. Prevalence of depression among rural older adults in Asia: a meta-analysis of observational studies. Front. Public Health 2026, 14, 1902088. [Google Scholar] [CrossRef] [PubMed]
- Nonsa-ard, R.; Khodseewong, S.; Wongprachum, K.; Bourneow, C.; Aneknan, P.; Glangkarn, S.; Porock, D. Preventive behaviors associated with fall incidence among older adults living in rural communities of Thailand: a cross-sectional study. BMC Geriatr. 2026, 26, 1117. [Google Scholar] [CrossRef] [PubMed]
- Inouye, S.K.; Studenski, S.; Tinetti, M.E.; Kuchel, G.A. Geriatric syndromes: clinical, research, and policy implications of a core geriatric concept. J. Am. Geriatr. Soc. 2007, 55, 780–791. [Google Scholar] [CrossRef] [PubMed]
- Hu, W.; Mao, H.; Guan, S.; Jin, J.; Xu, D. Systematic review and meta-analysis of the association between malnutrition and risk of depression in the elderly. Alpha Psychiatry 2024, 25, 183–189. [Google Scholar] [CrossRef] [PubMed]
- Xu, Q.; Ou, X.; Li, J. The risk of falls among the aging population: a systematic review and meta-analysis. Front. Public Health 2022, 10, 902599. [Google Scholar] [CrossRef] [PubMed]
- Gambaro, E.; Gramaglia, C.; Azzolina, D.; et al. The complex associations between late life depression, fear of falling and risk of falls. A systematic review and meta-analysis. Ageing Res. Rev. 2022, 73, 101532. [Google Scholar] [CrossRef] [PubMed]
- World Health Organization. Integrated Care for Older People: Guidelines on Community-Level Interventions to Manage Declines in Intrinsic Capacity; World Health Organization: Geneva, Switzerland, 2017; Available online: https://www.who.int/publications/i/item/9789241550109 (accessed on 6 October 2026).
- Nylund-Gibson, K.; Choi, A.Y. Ten frequently asked questions about latent class analysis. Transl. Issues Psychol. Sci. 2018, 4, 440–461. [Google Scholar] [CrossRef]
- Yu, J.; Si, H.; Jin, Y.; Qiao, X.; Ji, L.; Bian, Y.; Liu, Q.; Wang, W.; Wang, C. Patterns of intrinsic capacity among community-dwelling older adults: identification by latent class analysis and association with one-year adverse outcomes. Geriatr. Nurs. 2022, 45, 223–229. [Google Scholar] [CrossRef] [PubMed]
- Wang, Z.; Jiang, H.; Peng, Y.; Luo, J.; Yan, W. Latent class analysis of intrinsic capacity among rural older adults in China and its influencing factors. Front. Public Health 2026, 13, 1708977. [Google Scholar] [CrossRef] [PubMed]
- Chanprasert, P. Long-term care policy and implementation in Thailand. In Coping with Rapid Population Ageing in Asia; Komazawa, O., Saito, Y., Eds.; Economic Research Institute for ASEAN and East Asia (ERIA): Jakarta, Indonesia, 2021; pp. 36–44. [Google Scholar]
- Department of Older Persons; Ministry of Social Development and Human Security. Implementation of the Older Persons Act and Local Elderly Welfare; (In Thai). Department of Older Persons: Bangkok, Thailand, 2022. [Google Scholar]
- National Health Security Office. Guidelines for Long-Term Care for Dependent Older Persons under the Universal Coverage Scheme; (In Thai). National Health Security Office: Bangkok, Thailand, 2020. [Google Scholar]
- von Elm, E.; Altman, D.G.; Egger, M.; Pocock, S.J.; Gøtzsche, P.C.; Vandenbroucke, J.P. The Strengthening the Reporting of Observational Studies in Epidemiology (STROBE) statement: guidelines for reporting observational studies. Lancet 2007, 370, 1453–1457. [Google Scholar] [CrossRef] [PubMed]
- Yamane, T. Statistics: An Introductory Analysis, 2nd ed.; Harper and Row: New York, NY, USA, 1967. [Google Scholar]
- Kongsuk, T.; Arunpongpaisal, S.; Janthong, S.; Prukkanone, B.; Sukhawaha, S.; Leejongpermpoon, J. Criterion-related validity of the 9 Questions Depression Rating Scale revised for Thai central dialect. J. Psychiatr. Assoc. Thail. 2018, 63, 321–334. [Google Scholar]
- Pengsorn, N.; Muangpaisan, W.; Assantachai, P.; Chalermsri, C. Comparison of nutritional status screening by the Mini Nutritional Assessment (MNA®) and the Nutrition Alert Form (NAF) in elderly patients at a geriatric clinic, Siriraj Hospital. J. Med. Assoc. Thai. 2018, 101, 869–874. [Google Scholar]
- Health Education Division; Department of Health Service Support; Ministry of Public Health. Guidelines for Assessing Health Behaviours of the Population According to the 3A–2S Principles and the Prevention of Emerging Diseases; Health Education Division: Nonthaburi, Thailand, 2024; Available online: https://hed.hss.moph.go.th (accessed on 6 October 2026).
- Iamtrakul, P.; Chayphong, S.; Jomnonkwao, S.; Ratanavaraha, V. The association of falls risk in older adults and their living environment: a case study of rural area, Thailand. Sustainability 2021, 13, 13756. [Google Scholar] [CrossRef]
- Rovinelli, R.J.; Hambleton, R.K. On the use of content specialists in the assessment of criterion-referenced test item validity. Tijdschr. Onderwijsres. 1977, 2, 49–60. [Google Scholar]
- Kaiser, M.J.; Bauer, J.M.; Ramsch, C.; et al. Validation of the Mini Nutritional Assessment short-form (MNA-SF): a practical tool for identification of nutritional status. J. Nutr. Health Aging 2009, 13, 782–788. [Google Scholar] [CrossRef] [PubMed]
- Chen, L.K.; Woo, J.; Assantachai, P.; et al. Asian Working Group for Sarcopenia: 2019 consensus update on sarcopenia diagnosis and treatment. J. Am. Med. Dir. Assoc. 2020, 21, 300–307.e2. [Google Scholar] [CrossRef] [PubMed]
- Morse, J.M.; Morse, R.M.; Tylko, S.J. Development of a scale to identify the fall-prone patient. Can. J. Aging 1989, 8, 366–377. [Google Scholar] [CrossRef]
- Vellas, B.; Guigoz, Y.; Garry, P.J.; Nourhashemi, F.; Bennahum, D.; Lauque, S.; Albarede, J.L. The Mini Nutritional Assessment (MNA) and its use in grading the nutritional state of elderly patients. Nutrition 1999, 15, 116–122. [Google Scholar] [CrossRef] [PubMed]
- Masnoon, N.; Shakib, S.; Kalisch-Ellett, L.; Caughey, G.E. What is polypharmacy? A systematic review of definitions. BMC Geriatr. 2017, 17, 230. [Google Scholar] [CrossRef] [PubMed]
- Agresti, A. Categorical Data Analysis, 3rd ed.; Wiley: Hoboken, NJ, USA, 2013. [Google Scholar]
- Rao, J.N.K.; Scott, A.J. On chi-squared tests for multiway contingency tables with cell proportions estimated from survey data. Ann. Stat. 1984, 12, 46–60. [Google Scholar] [CrossRef]
- Nylund, K.L.; Asparouhov, T.; Muthén, B.O. Deciding on the number of classes in latent class analysis and growth mixture modeling: a Monte Carlo simulation study. Struct. Equ. Model. 2007, 14, 535–569. [Google Scholar] [CrossRef]
- Vermunt, J.K. Multilevel latent class models. Sociol. Methodol. 2003, 33, 213–239. [Google Scholar] [CrossRef]
- Lukočienė, O.; Varriale, R.; Vermunt, J.K. The simultaneous decision(s) about the number of lower- and higher-level classes in multilevel latent class analysis. Sociol. Methodol. 2010, 40, 247–283. [Google Scholar] [CrossRef]
- Bolck, A.; Croon, M.; Hagenaars, J. Estimating latent structure models with categorical variables: one-step versus three-step estimators. Polit. Anal. 2004, 12, 3–27. [Google Scholar] [CrossRef]
- Vermunt, J.K. Latent class modeling with covariates: two improved three-step approaches. Polit. Anal. 2010, 18, 450–469. [Google Scholar] [CrossRef]
- Westreich, D.; Greenland, S. The table 2 fallacy: presenting and interpreting confounder and modifier coefficients. Am. J. Epidemiol. 2013, 177, 292–298. [Google Scholar] [CrossRef] [PubMed]
- MacKinnon, J.G.; Nielsen, M.Ø.; Webb, M.D. Cluster-robust inference: a guide to empirical practice. J. Econom. 2023, 232, 272–299. [Google Scholar] [CrossRef]
- Bakk, Z.; Tekle, F.B.; Vermunt, J.K. Estimating the association between latent class membership and external variables using bias-adjusted three-step approaches. Sociol. Methodol. 2013, 43, 272–311. [Google Scholar] [CrossRef]
- Morin, S.; Legault, R.; Laliberté, F.; Bakk, Z.; Giguère, C.-É.; de la Sablonnière, R.; et al. StepMix: a Python package for pseudo-likelihood estimation of generalized mixture models with external variables. J. Stat. Softw. 2025, 113, 1–39. [Google Scholar] [CrossRef]
- Cummings, S.R.; Nevitt, M.C.; Kidd, S. Forgetting falls: the limited accuracy of recall of falls in the elderly. J. Am. Geriatr. Soc. 1988, 36, 613–616. [Google Scholar] [CrossRef] [PubMed]
- West, B.T.; Blom, A.G. Explaining interviewer effects: a research synthesis. J. Surv. Stat. Methodol. 2017, 5, 175–211. [Google Scholar] [CrossRef]
- Lubke, G.H.; Muthén, B. Investigating population heterogeneity with factor mixture models. Psychol. Methods 2005, 10, 21–39. [Google Scholar] [CrossRef] [PubMed]
- Zelig, R.; Goldstein, S.; Touger-Decker, R.; et al. Tooth loss and nutritional status in older adults: a systematic review and meta-analysis. JDR Clin. Trans. Res. 2022, 7, 4–15. [Google Scholar] [CrossRef] [PubMed]
Figure 1.
Flow of subdistricts and participants.
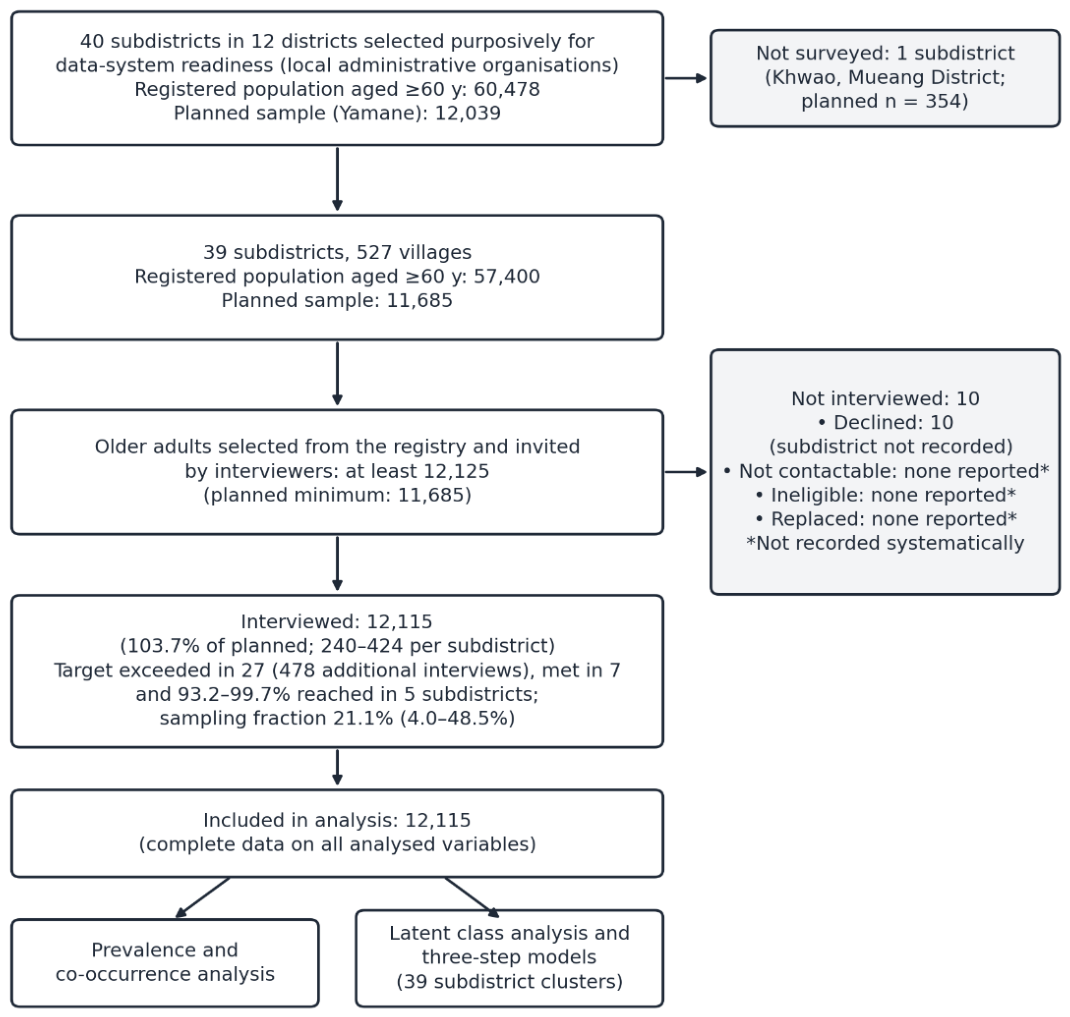
Figure 3.
Latent class profiles and external correlates. (A) Probability of each indicator in the three latent classes (class sizes in legend; malnutrition risk = MNA-SF ≤11, depressive symptoms = 9Q ≥7). (B) Prevalence of concurrently measured external correlates not used to define the classes (MNA items P, G and N), estimated with the bias-adjusted maximum-likelihood three-step approach; 95% CIs from 1,000 cluster-bootstrap replicates.
Figure 3.
Latent class profiles and external correlates. (A) Probability of each indicator in the three latent classes (class sizes in legend; malnutrition risk = MNA-SF ≤11, depressive symptoms = 9Q ≥7). (B) Prevalence of concurrently measured external correlates not used to define the classes (MNA items P, G and N), estimated with the bias-adjusted maximum-likelihood three-step approach; 95% CIs from 1,000 cluster-bootstrap replicates.
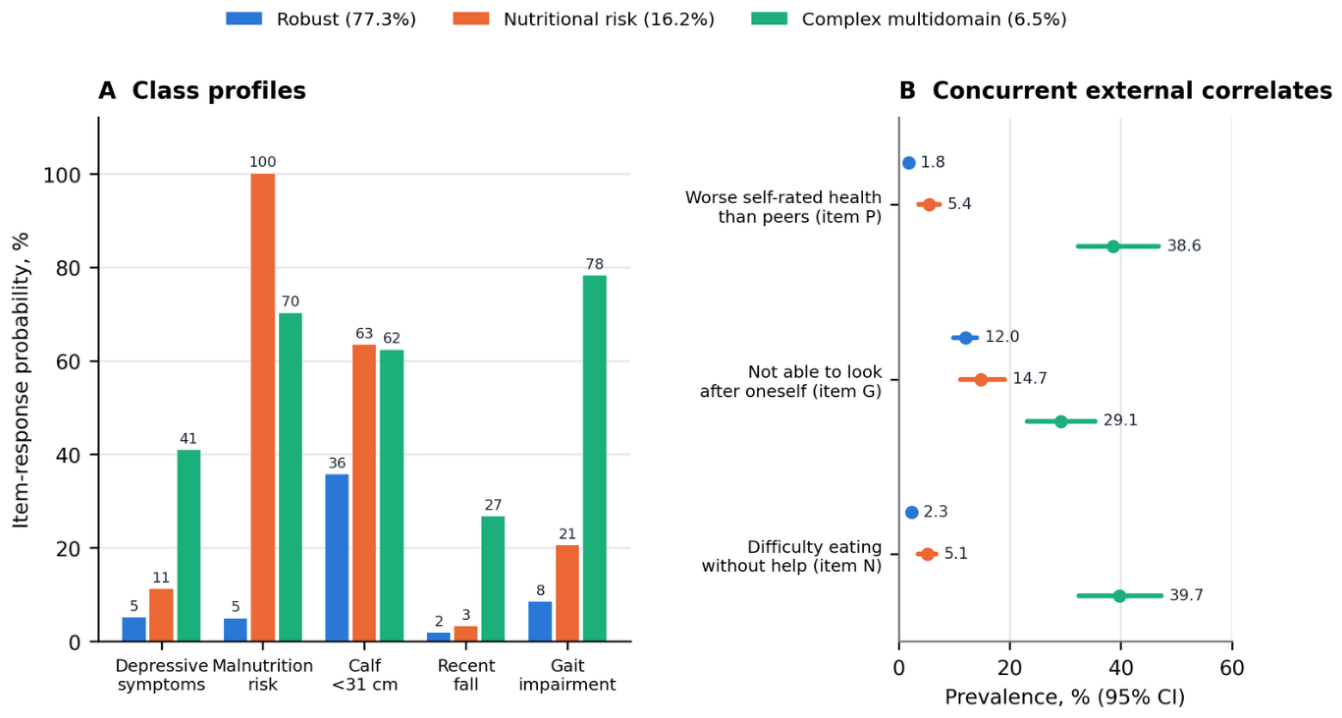
Figure 4.
Factors associated with membership of the nutritional-risk (A) and complex multidomain (B) classes relative to the robust class. Adjusted odds ratios from the bias-adjusted three-step multinomial model with all covariates entered simultaneously; 95% CIs from cluster-robust standard errors (39 subdistricts). Coloured estimates have CIs excluding 1.
Figure 4.
Factors associated with membership of the nutritional-risk (A) and complex multidomain (B) classes relative to the robust class. Adjusted odds ratios from the bias-adjusted three-step multinomial model with all covariates entered simultaneously; 95% CIs from cluster-robust standard errors (39 subdistricts). Coloured estimates have CIs excluding 1.
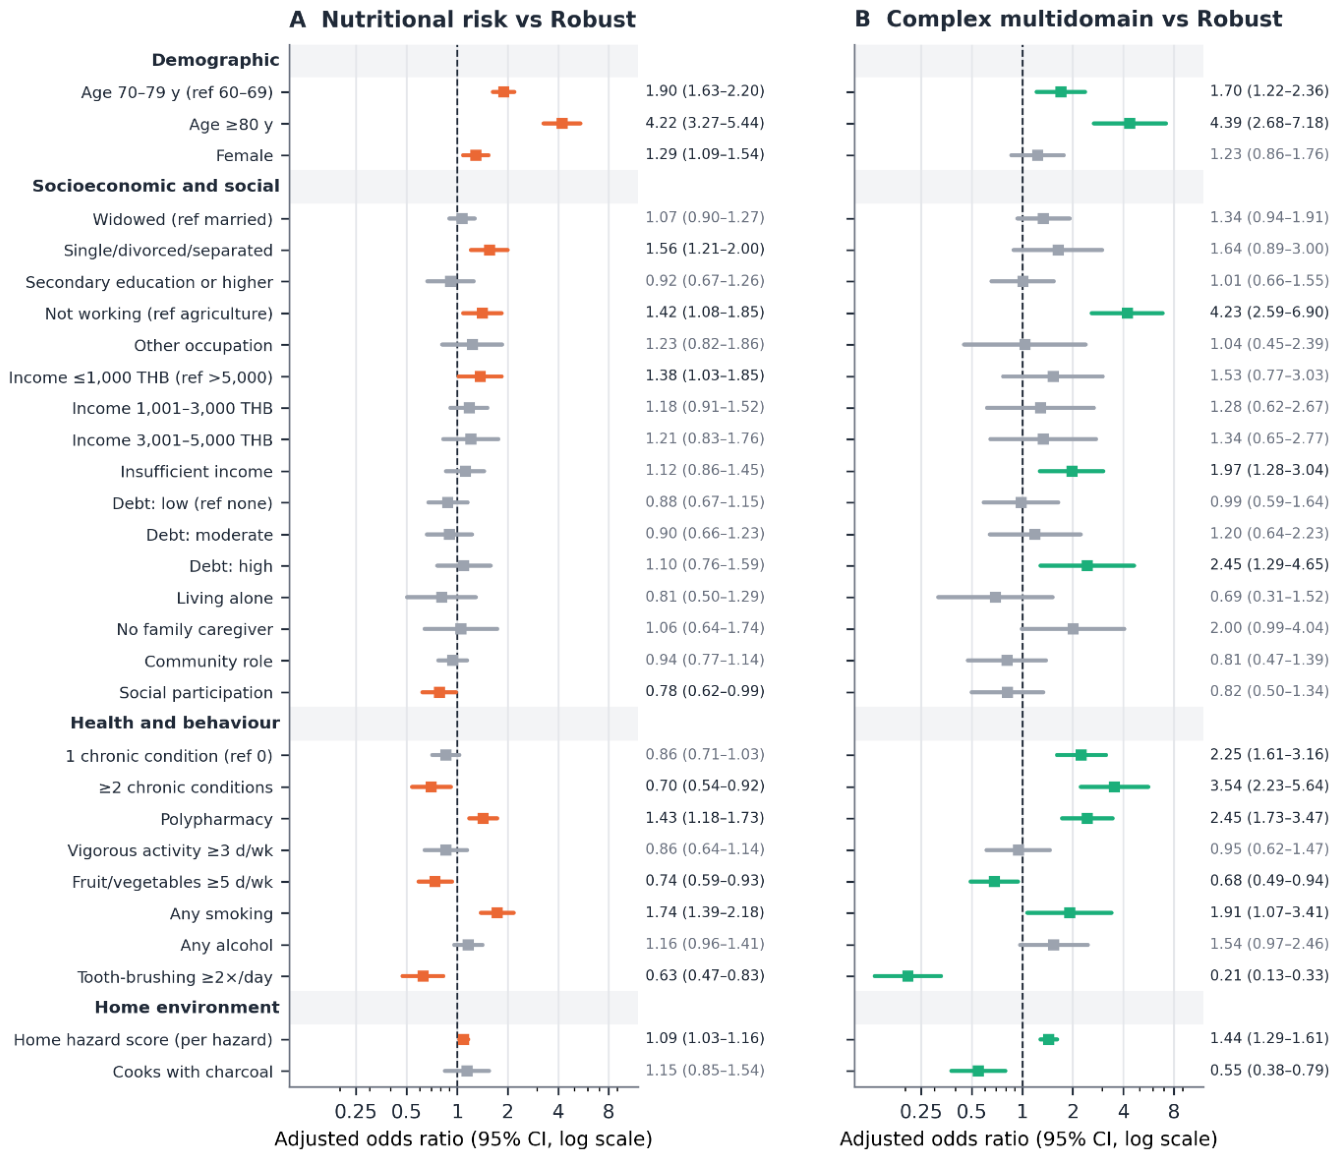

Table 1.
Characteristics of participants, overall and by number of co-occurring conditions (depressive symptoms, malnutrition risk, fall risk), N = 12,115.
Table 1.
Characteristics of participants, overall and by number of co-occurring conditions (depressive symptoms, malnutrition risk, fall risk), N = 12,115.
| Characteristic | Overall (n=12,115) | 0 conditions (n=7,631) | 1 condition (n=3,183) | 2 conditions (n=1,039) | 3 conditions (n=262) | p | Cramér's V |
| Demographic | |||||||
| Age, years, mean (SD) | 69.6 (7.1) | 68.3 (6.3) | 70.8 (7.4) | 74.1 (8.4) | 74.0 (8.4) | <0.001 | ε²=0.059 |
| Age group, n (%) | <0.001 | 0.187 | |||||
| 60–69 | 6,822 (56.3) | 4,853 (63.6) | 1,537 (48.3) | 345 (33.2) | 87 (33.2) | ||
| 70–79 | 4,081 (33.7) | 2,354 (30.8) | 1,208 (38.0) | 412 (39.7) | 107 (40.8) | ||
| ≥80 | 1,212 (10.0) | 424 (5.6) | 438 (13.8) | 282 (27.1) | 68 (26.0) | ||
| Female, n (%) | 7,123 (58.8) | 4,324 (56.7) | 1,954 (61.4) | 672 (64.7) | 173 (66.0) | <0.001 | 0.060 |
| Marital status, n (%) | <0.001 | 0.076 | |||||
| Married | 7,734 (63.8) | 5,189 (68.0) | 1,896 (59.6) | 537 (51.7) | 112 (42.7) | ||
| Widowed | 3,488 (28.8) | 1,928 (25.3) | 1,033 (32.5) | 402 (38.7) | 125 (47.7) | ||
| Divorced/separated | 273 (2.3) | 169 (2.2) | 72 (2.3) | 28 (2.7) | 4 (1.5) | ||
| Single | 620 (5.1) | 345 (4.5) | 182 (5.7) | 72 (6.9) | 21 (8.0) | ||
| Education, n (%) | <0.001 | 0.087 | |||||
| No schooling | 231 (1.9) | 86 (1.1) | 72 (2.3) | 52 (5.0) | 21 (8.0) | ||
| Primary | 10,395 (85.8) | 6,481 (84.9) | 2,784 (87.5) | 910 (87.6) | 220 (84.0) | ||
| Secondary or higher | 1,489 (12.3) | 1,064 (13.9) | 327 (10.3) | 77 (7.4) | 21 (8.0) | ||
| Main occupation, n (%) | <0.001 | 0.186 | |||||
| Agriculture | 9,531 (78.7) | 6,396 (83.8) | 2,385 (74.9) | 632 (60.8) | 118 (45.0) | ||
| Not working | 1,840 (15.2) | 714 (9.4) | 627 (19.7) | 364 (35.0) | 135 (51.5) | ||
| Other | 744 (6.1) | 521 (6.8) | 171 (5.4) | 43 (4.1) | 9 (3.4) | ||
| Economic | |||||||
| Personal income, THB/month, n (%) | <0.001 | 0.087 | |||||
| ≤1,000 | 3,649 (30.1) | 2,015 (26.4) | 1,073 (33.7) | 436 (42.0) | 125 (47.7) | ||
| 1,001–3,000 | 4,113 (33.9) | 2,532 (33.2) | 1,122 (35.2) | 366 (35.2) | 93 (35.5) | ||
| 3,001–5,000 | 2,288 (18.9) | 1,577 (20.7) | 563 (17.7) | 125 (12.0) | 23 (8.8) | ||
| >5,000 | 2,065 (17.0) | 1,507 (19.7) | 425 (13.4) | 112 (10.8) | 21 (8.0) | ||
| Insufficient income, n (%) | 5,077 (41.9) | 2,934 (38.4) | 1,420 (44.6) | 545 (52.5) | 178 (67.9) | <0.001 | 0.118 |
| Household debt, n (%) | <0.001 | 0.038 | |||||
| No debt | 2,835 (23.4) | 1,688 (22.1) | 794 (24.9) | 286 (27.5) | 67 (25.6) | ||
| Low | 4,273 (35.3) | 2,781 (36.4) | 1,068 (33.6) | 347 (33.4) | 77 (29.4) | ||
| Moderate | 4,255 (35.1) | 2,738 (35.9) | 1,099 (34.5) | 330 (31.8) | 88 (33.6) | ||
| High | 752 (6.2) | 424 (5.6) | 222 (7.0) | 76 (7.3) | 30 (11.5) | ||
| Main income source, n (%) | <0.001 | 0.102 | |||||
| Own work | 3,906 (32.2) | 2,851 (37.4) | 847 (26.6) | 178 (17.1) | 30 (11.5) | ||
| Children | 435 (3.6) | 283 (3.7) | 112 (3.5) | 30 (2.9) | 10 (3.8) | ||
| State welfare | 5,043 (41.6) | 3,031 (39.7) | 1,422 (44.7) | 480 (46.2) | 110 (42.0) | ||
| Other | 2,731 (22.5) | 1,466 (19.2) | 802 (25.2) | 351 (33.8) | 112 (42.7) | ||
| Social | |||||||
| Living arrangement, n (%) | <0.001 | 0.081 | |||||
| Alone | 643 (5.3) | 387 (5.1) | 163 (5.1) | 71 (6.8) | 22 (8.4) | ||
| Spouse | 6,446 (53.2) | 4,421 (57.9) | 1,536 (48.3) | 396 (38.1) | 93 (35.5) | ||
| Children/grandchildren | 4,789 (39.5) | 2,696 (35.3) | 1,407 (44.2) | 544 (52.4) | 142 (54.2) | ||
| Relatives | 237 (2.0) | 127 (1.7) | 77 (2.4) | 28 (2.7) | 5 (1.9) | ||
| Main family caregiver, n (%) | <0.001 | 0.093 | |||||
| Spouse | 5,351 (44.2) | 3,705 (48.6) | 1,255 (39.4) | 316 (30.4) | 75 (28.6) | ||
| Child/grandchild | 6,270 (51.8) | 3,648 (47.8) | 1,804 (56.7) | 651 (62.7) | 167 (63.7) | ||
| No caregiver | 494 (4.1) | 278 (3.6) | 124 (3.9) | 72 (6.9) | 20 (7.6) | ||
| Holds a community role, n (%) | 3,316 (27.4) | 2,279 (29.9) | 786 (24.7) | 201 (19.3) | 50 (19.1) | <0.001 | 0.080 |
| Participates in elderly school/club/religious group, n (%) | 5,821 (48.0) | 3,894 (51.0) | 1,433 (45.0) | 405 (39.0) | 89 (34.0) | <0.001 | 0.088 |
| Health | |||||||
| Number of chronic conditions, n (%) | <0.001 | 0.103 | |||||
| 0 | 6,756 (55.8) | 4,555 (59.7) | 1,667 (52.4) | 451 (43.4) | 83 (31.7) | ||
| 1 | 3,458 (28.5) | 2,089 (27.4) | 943 (29.6) | 341 (32.8) | 85 (32.4) | ||
| ≥2 | 1,901 (15.7) | 987 (12.9) | 573 (18.0) | 247 (23.8) | 94 (35.9) | ||
| Hypertension | 3,434 (28.3) | 1,992 (26.1) | 959 (30.1) | 368 (35.4) | 115 (43.9) | <0.001 | 0.082 |
| Diabetes | 2,536 (20.9) | 1,458 (19.1) | 727 (22.8) | 272 (26.2) | 79 (30.2) | <0.001 | 0.066 |
| Dyslipidaemia | 720 (5.9) | 404 (5.3) | 219 (6.9) | 70 (6.7) | 27 (10.3) | <0.001 | 0.041 |
| Stroke | 191 (1.6) | 60 (0.8) | 54 (1.7) | 47 (4.5) | 30 (11.5) | <0.001 | 0.145 |
| Polypharmacy (>3 drugs/day), n (%) | 3,734 (30.8) | 2,023 (26.5) | 1,101 (34.6) | 468 (45.0) | 142 (54.2) | <0.001 | 0.145 |
| BMI, kg/m² (Asian cut-offs), n (%) | <0.001 | 0.227 | |||||
| <18.5 | 842 (7.0) | 0 (0.0) | 585 (18.4) | 206 (19.8) | 51 (19.5) | ||
| 18.5–22.9 | 5,195 (42.9) | 3,067 (40.2) | 1,477 (46.4) | 532 (51.2) | 119 (45.4) | ||
| 23.0–24.9 | 2,959 (24.4) | 2,272 (29.8) | 508 (16.0) | 142 (13.7) | 37 (14.1) | ||
| ≥25.0 | 3,119 (25.7) | 2,292 (30.0) | 613 (19.3) | 159 (15.3) | 55 (21.0) | ||
| Ever attended community health screening, n (%) | 11,708 (96.6) | 7,404 (97.0) | 3,066 (96.3) | 988 (95.1) | 250 (95.4) | 0.004 | 0.033 |
| Health behaviours (past week) | |||||||
| Vigorous activity ≥3 days, n (%) | 3,702 (30.6) | 2,476 (32.4) | 935 (29.4) | 228 (21.9) | 63 (24.0) | <0.001 | 0.068 |
| Muscle-strengthening ≥3 days, n (%) | 3,904 (32.2) | 2,576 (33.8) | 985 (30.9) | 269 (25.9) | 74 (28.2) | <0.001 | 0.051 |
| ≥5 portions fruit/vegetables on ≥5 days, n (%) | 7,249 (59.8) | 4,846 (63.5) | 1,745 (54.8) | 543 (52.3) | 115 (43.9) | <0.001 | 0.103 |
| Any smoking, n (%) | 1,286 (10.6) | 746 (9.8) | 388 (12.2) | 112 (10.8) | 40 (15.3) | <0.001 | 0.041 |
| Any alcohol, n (%) | 1,906 (15.7) | 1,219 (16.0) | 502 (15.8) | 144 (13.9) | 41 (15.6) | 0.378 | 0.016 |
| Tooth-brushing ≥2 times daily every day, n (%) | 10,867 (89.7) | 7,093 (92.9) | 2,770 (87.0) | 827 (79.6) | 177 (67.6) | <0.001 | 0.174 |
| Home environment | |||||||
| House structurally unsound, n (%) | 1,300 (10.7) | 586 (7.7) | 422 (13.3) | 200 (19.2) | 92 (35.1) | <0.001 | 0.167 |
| Door thresholds, n (%) | 8,102 (66.9) | 5,073 (66.5) | 2,136 (67.1) | 703 (67.7) | 190 (72.5) | 0.197 | 0.020 |
| Uneven floor levels, n (%) | 6,236 (51.5) | 3,725 (48.8) | 1,707 (53.6) | 621 (59.8) | 183 (69.8) | <0.001 | 0.087 |
| Sleeps on the floor, n (%) | 5,625 (46.4) | 3,454 (45.3) | 1,540 (48.4) | 503 (48.4) | 128 (48.9) | 0.010 | 0.031 |
| Toilet outside the house, n (%) | 3,221 (26.6) | 1,927 (25.3) | 915 (28.7) | 304 (29.3) | 75 (28.6) | <0.001 | 0.040 |
| Squat toilet, n (%) | 5,528 (45.6) | 3,345 (43.8) | 1,569 (49.3) | 494 (47.5) | 120 (45.8) | <0.001 | 0.049 |
| No bathroom grab bar, n (%) | 10,144 (83.7) | 6,416 (84.1) | 2,665 (83.7) | 862 (83.0) | 201 (76.7) | 0.014 | 0.030 |
| Built-in cement water tank in bathroom, n (%) | 5,471 (45.2) | 3,410 (44.7) | 1,450 (45.6) | 483 (46.5) | 128 (48.9) | 0.380 | 0.016 |
| Clutter of unused items, n (%) | 3,575 (29.5) | 1,967 (25.8) | 1,045 (32.8) | 418 (40.2) | 145 (55.3) | <0.001 | 0.131 |
| Hazardous walkway around house, n (%) | 1,891 (15.6) | 935 (12.3) | 598 (18.8) | 252 (24.3) | 106 (40.5) | <0.001 | 0.150 |
| Hazardous materials, n (%) | 2,789 (23.0) | 1,520 (19.9) | 808 (25.4) | 318 (30.6) | 143 (54.6) | <0.001 | 0.139 |
| Home hazard score (0–11), mean (SD) | 4.4 (2.0) | 4.2 (1.9) | 4.7 (2.0) | 5.0 (2.1) | 5.8 (2.2) | <0.001 | ε²=0.022 |
| Cooks with charcoal, n (%) | 7,726 (63.8) | 4,872 (63.8) | 2,093 (65.8) | 620 (59.7) | 141 (53.8) | <0.001 | 0.045 |
| Area | |||||||
| Urban municipality (Talat, Mueang), n (%) | 357 (2.9) | 292 (3.8) | 48 (1.5) | 12 (1.2) | 5 (1.9) | <0.001 | 0.068 |
Note: Values are n (%) unless stated otherwise; percentages are column percentages. Columns group participants by the number of the three conditions present (0–3): depressive symptoms (9Q ≥7), malnutrition risk (MNA-SF ≤11) and fall risk (fall in the past 3 months or gait impairment/walking aid; Morse items 1, 3 and 5). “1 condition” includes participants with any one of the three conditions, “2 conditions” those with any two, and “3 conditions” those with all three; the columns are mutually exclusive. The frequency of each specific combination is shown in Figure 2B. p values: Pearson χ² (categorical) or Kruskal–Wallis (continuous), not adjusted for clustering within subdistricts (design effects 2–14; Table S2) and shown for descriptive purposes only; effect sizes: Cramér's V or ε². Health-behaviour items (3A–2S–1F, Department of Health Service Support) coded 1–5, 5 = most favourable. Home hazard score = count of the 11 home hazards shown. BMI is a component of the MNA-SF (item F) and was therefore not used as a predictor of latent class membership.
Table 2.
Fit statistics for latent class models with 1–6 classes (N = 12,115).
| Classes | LL | Parameters | AIC | BIC | SABIC | Entropy | Min AvePP | Smallest class, % | L² (df) | LL replicated | BLRT p |
| 1 | -26,655.0 | 7 | 53,324.1 | 53,375.9 | 53,353.6 | — | — | 100.0 | 2,156.2 (64) | 1/1 | — |
| 2 | -25,772.4 | 15 | 51,574.7 | 51,685.7 | 51,638.1 | 0.710 | 0.840 | 14.6 | 390.9 (56) | 10/10 | <0.01 |
| 3 | -25,646.7 | 23 | 51,339.4 | 51,509.7 | 51,436.6 | 0.818 | 0.740 | 6.5 | 139.6 (48) | 10/10 | <0.01 |
| 4 | -25,621.8 | 31 | 51,305.6 | 51,535.1 | 51,436.5 | 0.738 | 0.627 | 3.3 | 89.8 (40) | 9/10 | <0.01 |
| 5 | -25,604.5 | 39 | 51,287.1 | 51,575.8 | 51,451.8 | 0.690 | 0.668 | 2.4 | 55.3 (32) | 6/10 | <0.01 |
| 6 | -25,593.4 | 47 | 51,280.7 | 51,628.6 | 51,479.3 | 0.721 | 0.454 | 1.0 | 32.9 (24) | 1/10 | 0.03 |
Note: LL = log-likelihood; AIC = Akaike information criterion; BIC = Bayesian information criterion; SABIC = sample-size-adjusted BIC; AvePP = average posterior probability of the assigned class; L² = likelihood-ratio chi-square against the saturated model; BLRT = parametric bootstrap likelihood ratio test of K−1 vs K classes (100 bootstrap samples). LL replicated = number of the best final-stage solutions (from 500 random starts) reaching the maximum log-likelihood. Indicators: 9Q (3 levels), MNA-SF (3 levels), calf circumference <31 cm, fall in past 3 months, gait impairment/walking aid. Bold row = selected model.
Disclaimer/Publisher’s Note: The statements, opinions and data contained in all publications are solely those of the individual author(s) and contributor(s) and not of MDPI and/or the editor(s). MDPI and/or the editor(s) disclaim responsibility for any injury to people or property resulting from any ideas, methods, instructions or products referred to in the content. |
© 2026 by the authors. Licensee MDPI, Basel, Switzerland. This article is an open access article distributed under the terms and conditions of the Creative Commons Attribution (CC BY) license.
Copyright: This open access article is published under a Creative Commons CC BY 4.0 license, which permit the free download, distribution, and reuse, provided that the author and preprint are cited in any reuse.