

Submitted:
14 October 2026
Posted:
15 October 2026
You are already at the latest version
Abstract
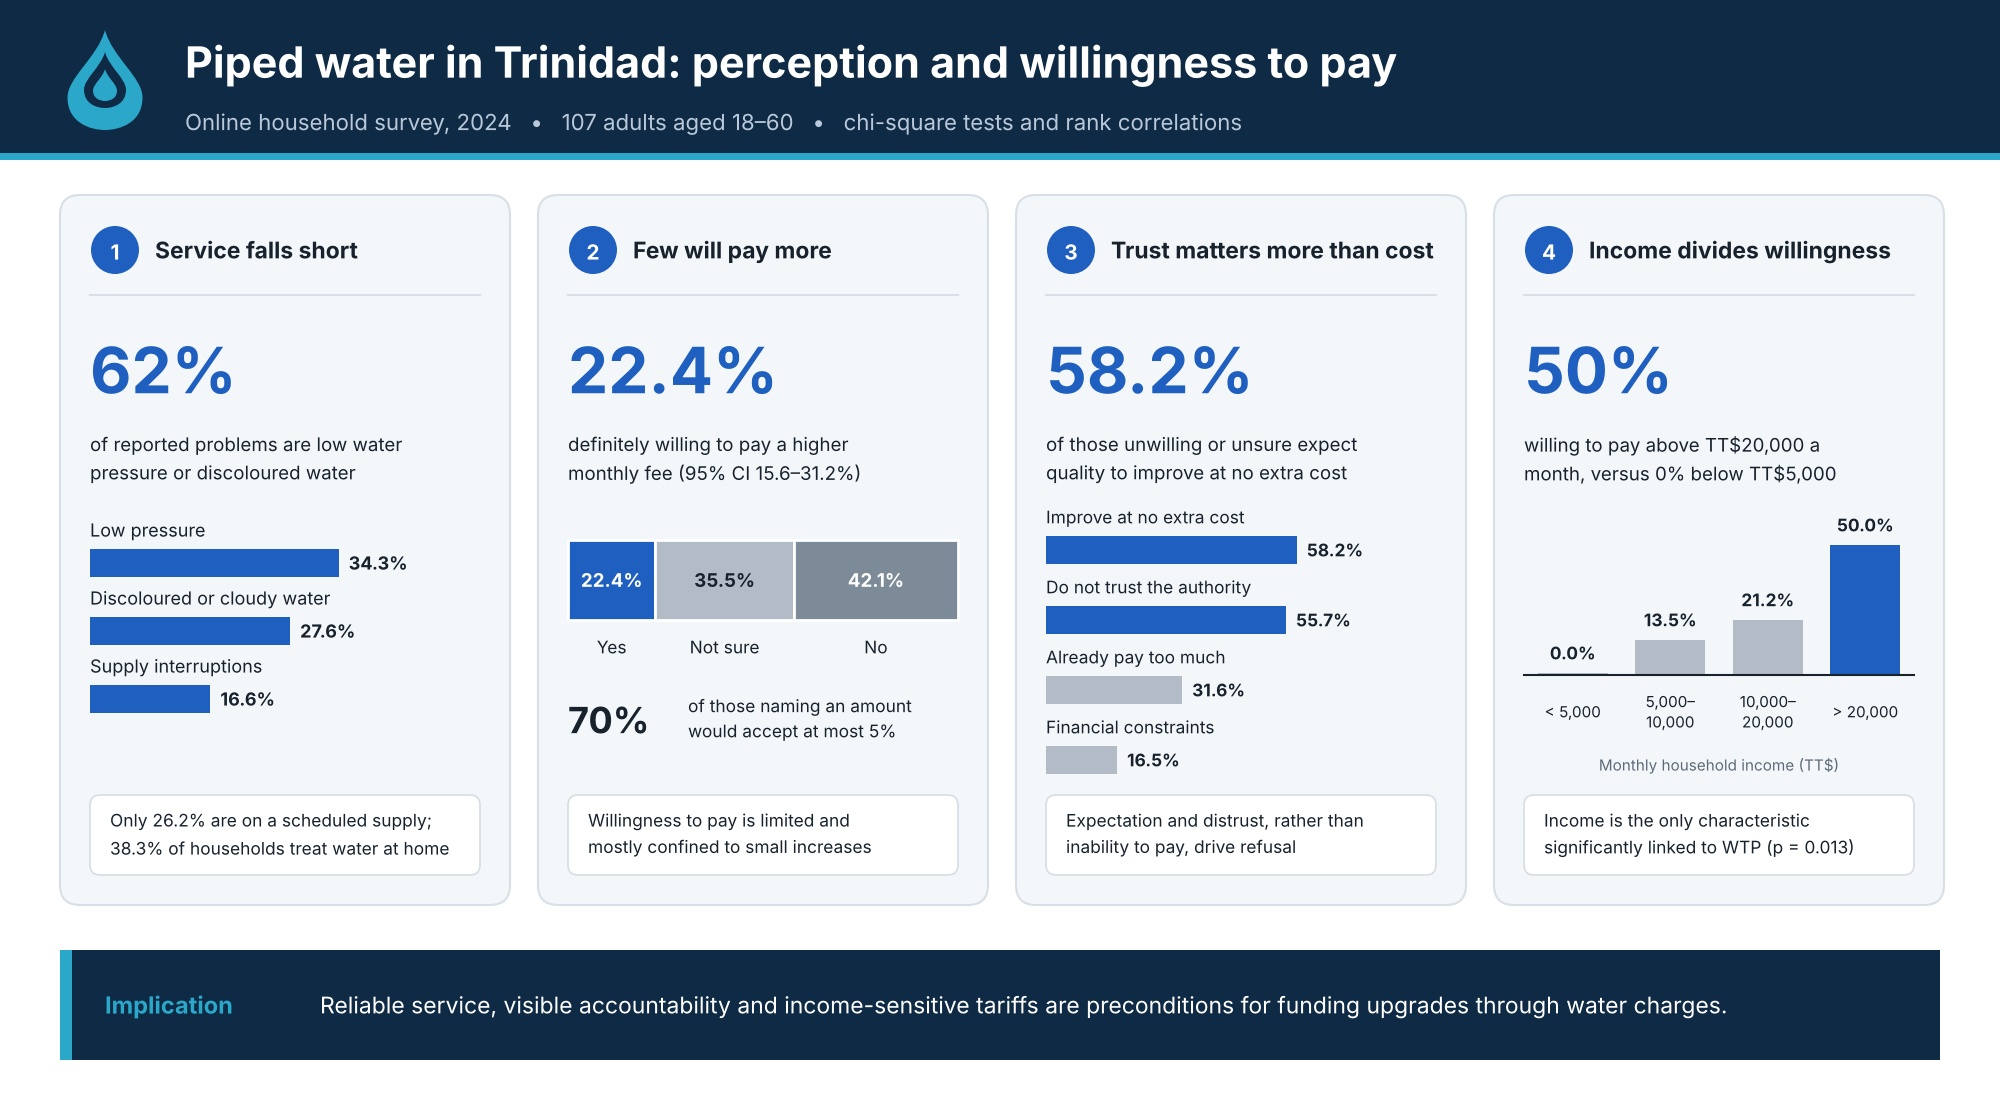
Piped water is the main source of household water in Trinidad, yet service problems are widely reported while the national utility is under financial strain. Additionally, very little survey evidence exists on how consumers rate the service or whether they would pay more for improvements. This study used an online questionnaire, distributed through email, social media and mobile messaging, to which 107 adults aged 18–60 responded; perceptions, coping behaviour and willingness to pay (WTP) were examined with descriptive statistics, chi-square tests and rank correlations. Only 26.2% of respondents were on a scheduled supply. Low pressure (34.3% of reported problems), discoloured water (27.6%) and supply interruptions (16.6%) were the most frequently reported problems, while odour was rarely cited (3.9%). Satisfaction with water quality was moderate (44.9% satisfied, 41.1% neutral, 14.0% dissatisfied), and 38.3% of households treated water at home. Only 22.4% (95% CI 15.6–31.2%) were definitely willing to pay a higher monthly fee, 35.5% were unsure and 42.1% were not; among those indicating an amount, 70.0% would accept an increase of no more than 5%. The main reasons for declining were the belief that quality should improve at no extra cost (58.2%) and lack of trust in the water authority (55.7%), rather than inability to pay (16.5%). WTP rose with household income, from 0% in the lowest band to 50.0% above TT$20,000 per month, but was not significantly associated with residence, household size, satisfaction or home treatment. Willingness to pay for better piped water is therefore limited, conditional on trust in the provider and concentrated among higher-income households, so visible service improvements, transparent accountability and income-sensitive tariff design appear to be preconditions for price-based funding of upgrades.
Keywords:
willingness to pay
; piped water supply
; consumer perception
; water utility
; trinidad
; small island developing states
1. Introduction
1.1. Background and Context
Reliable, safe piped water is a basic requirement for public health and economic activity. Access to safe drinking water is monitored globally by the WHO/UNICEF Joint Monitoring Programme (WHO & UNICEF, 2023), the United Nations General Assembly has recognised safe and clean drinking water as a human right (United Nations General Assembly, 2010), and the links between water supply and health are well established (Hunter et al., 2010). Beyond health, the quality of the service people receive at the tap shapes their daily routines and their trust in public institutions. Water security and service delivery in the Caribbean have been reviewed at the regional level (Cashman, 2014), and benchmarking of state-owned water utilities in several Caribbean countries has examined service quality, financial performance, tariff affordability and governance (World Bank, 2020).
In Trinidad, pipe-borne water supplied by the Water and Sewerage Authority (WASA) is the primary source for households, businesses and agriculture. The island receives substantial rainfall, but inefficient distribution, ageing infrastructure and non-revenue water losses mean that supply is uneven and service quality is inconsistent. Households respond by relying on alternatives such as rainwater harvesting, trucked water and point-of-use treatment, which impose private costs and tend to favour wealthier households. Because upgrading treatment and distribution infrastructure is costly, and because the utility faces operational and financial constraints, policymakers must decide not only what to improve but also who should pay and how. Answering these questions requires evidence on how consumers experience the existing service and on what they would be prepared to contribute.
1.2. Consumer Perceptions of Water Quality and Service
Consumers form judgements about piped water from a mix of direct sensory experience, the information they receive and their trust in the supplier. Cross-national work in the United Kingdom and Portugal found that estimates of water quality were influenced mostly by satisfaction with organoleptic properties, especially flavour, together with risk perception and contextual cues from the supply system, while risk perception was itself influenced by organoleptic properties, external information, past health problems and trust in water suppliers (Doria et al., 2009; Doria, 2010). Trust and confidence in suppliers have accordingly become a recurring theme in the literature on consumer attitudes to drinking water (Fife-Schaw et al., 2008). However, perceptions also do not necessarily track measured quality. A community-based study in Newfoundland, Canada, found no association between public satisfaction with drinking water and the actual quality of the supplies concerned (Ochoo et al., 2017). Perceptions nonetheless matter in their own right because they drive behavior as households that doubt their tap water may buy bottled water, install filters or boil water, and may withdraw support for the utility and its investment plans. Understanding which aspects of service consumers notice, and how they rate them, is therefore a prerequisite for prioritising improvements.
Evidence from Trinidad itself points to the importance of trust. A survey of public perception of treated wastewater reuse found that perceptions were shaped mainly by public mistrust of the local water authorities to deliver safe and good-quality water, together with limited knowledge of treatment processes and perceived health risks, and the authors recommended that efforts to build trust and acceptance be strengthened through improved services and public awareness programmes (Peters & Goberdhan, 2016). Although that study addressed a different question, it suggests that consumers’ attitudes towards any new initiative of the water utility, including price changes, are likely to be conditioned by their confidence in the utility’s performance.
Safe drinking water is a public-health requirement, and international guidance sets out the health-based framework within which drinking-water quality is assessed (WHO, 2022). Consumers, however, respond to the risks they perceive, which may differ from measured quality, and perceived risk can shape both the use of alternatives to tap water and support for improvement (Doria et al., 2009). Contingent valuation studies in middle-income settings have shown that households place a measurable value on safer drinking water. For example, in Parral, Mexico, households’ WTP for safe drinking water was estimated using a survey approach (Vasquez et al., 2009). Where perceived risk is high, demand for improvement may therefore be strong, but this demand will translate into support for price-based funding only if consumers believe that the improvements will materialise.
1.3. Willingness to Pay
Willingness to pay (WTP) is the usual measure of consumers’ valuation of an improved service. In stated-preference surveys, households are asked whether they would accept a higher charge, or how much more they would pay, for a described improvement. The best-known approach, contingent valuation, elicits values by asking people directly in a survey (Hanemann, 1994), and it has been the subject of considerable debate among economists (Portney, 1994). In developing-country settings, contingent valuation surveys have been used to estimate households’ WTP for water services since at least the early 1990s (Whittington et al., 1990), and practical guidance exists on administering such surveys where literacy, language and survey experience differ from those in industrialised countries (Whittington, 1998). Reviews of household water demand in developing countries show that a better understanding of how households use and value water is needed to manage and expand water systems more effectively (Nauges & Whittington, 2010). Because stated responses are hypothetical, they are best read as indicators of attitudes and relative support rather than as forecasts of actual payment.
Income is the characteristic most consistently associated with WTP for improved water services. A ten-country study of tap water quality found that WTP increased with income, education, environmental concern, and health and taste concerns (Beaumais et al., 2014), and work in Mexico City reported that wealthier households were willing to pay higher amounts to avoid deterioration of service, while poorer households were primarily concerned with securing reliable service (De Oca et al., 2003). The latter finding links WTP to reliability, where supply is intermittent or pressure is low, the improvement that matters most to households may be continuity rather than water quality as such, and the capacity to pay for it differs by income. Other characteristics, including household size, education and place of residence, are commonly examined as well, since larger households use more water and urban and rural consumers may face different service problems, but whether they influence WTP appears to depend on context. Much of the evidence comes from other regions, and its applicability to Trinidad has not been established.
1.4. Pricing, Trust and Governance
WTP depends not only on ability to pay but also on whether consumers believe that additional payments will translate into better service. Mycoo (2011) analysed Trinidad’s flat water charge, which is based on property values, and concluded that it is economically inefficient, that its equity objective is compromised in practice, and that good water pricing and governance are needed; the same author has traced the shifting paradigms in Trinidad’s water-provisioning policies (Mycoo, 2005). Benchmarking of Caribbean utilities treats governance and tariff affordability as central issues (World Bank, 2020). Because WTP varies with income, tariff design involves trade-offs between equity, economic efficiency and cost recovery (Nauges & Whittington, 2017), and equity-based tariff structures that reflect the income distribution have been proposed as a means of raising revenue while targeting subsidies on lower-income households (De Oca et al., 2003). Where confidence in the provider is low, however, even well-designed pricing reforms may meet resistance, which makes it important to measure not only how much consumers would pay but also why some are unwilling to do so.
1.5. Research Gap, Aim and Objectives
Most published evidence on perception and WTP comes from outside the Caribbean, and survey evidence from Trinidad that links consumers’ experience of the service to their willingness to fund improvements remains limited. The aim of this study was to investigate consumer perceptions of piped water supply in Trinidad and to evaluate the factors associated with willingness to pay for improvements. The objectives were to (i) assess perceptions of supply and quality; (ii) identify the problems, perceived causes and household impacts reported; (iii) estimate WTP and the size of acceptable increases; and (iv) examine how WTP varies with demographic, geographic and experiential characteristics.
2. Methods
2.1. Study Design and Setting
A cross-sectional household survey was used to examine consumers’ perceptions of piped water supply in Trinidad and their willingness to pay for improvements. A cross-sectional design was chosen because the aim was to describe perceptions and attitudes at a single point in time and to examine their association with respondent characteristics, rather than to follow households over time. Respondents classified their own community as urban or rural, a distinction explained in the questionnaire with relevant localized examples.
2.2. Questionnaire Design
A structured questionnaire was built in Google Forms. It covered six groups of items: (i) respondent characteristics (gender, age group, education, urban or rural residence, household size and monthly household income bracket); (ii) supply arrangements (whether the household was on a scheduled supply and, if so, the days of delivery); (iii) perceived quality of the piped water and satisfaction with it; (iv) problems experienced, their perceived causes and their impacts on the household; (v) home water treatment, concern about pollution, the importance of six improvement attributes and preferred improvement strategies; and (vi) WTP for improved water quality, including the acceptable increase as a percentage of the current bill and, for those who were unwilling or unsure, the reasons. Ordinal items used a five-point Likert scale (1–5), with 1 the most favourable, most important or highest-concern response.
2.3. Data Collection and Sample Size
The questionnaire was distributed online through email, social media and mobile messaging during 2024. Respondents were recruited by non-probability (convenience) sampling, and participation was voluntary. Responses were exported to Excel and then imported into SPSS Statistics for cleaning and analysis.
The required sample size for estimating a proportion was calculated with Cochran’s formula (Cochran, 1977):
where z is the standard normal value for the chosen confidence level (z = 1.96 for 95% confidence), p is the expected proportion (p = 0.5, which gives maximum variability) and e is the acceptable margin of error (e = 0.05). Substituting these values gives
The 107 responses obtained correspond to a margin of error of
that is, ±9.5% at 95% confidence, and then only if the sample were random. Results should therefore be read as indicative rather than population estimates.
2.4. Data Analysis
Descriptive statistics (frequencies, percentages, means and standard deviations) were computed for all items, and 95% confidence intervals for proportions are Wilson intervals. Multi-response items (problems, causes, impacts, reasons, treatment methods and improvement strategies) are reported as shares of mentions or of respondents answering, as stated in the text. WTP was recorded as yes, not sure or no.
Associations between WTP and respondent characteristics (income, residence, household size, satisfaction with water quality and home treatment) were tested using Pearson’s chi-square test, Cramér’s V as a measure of effect size, Fisher’s exact test for 2 × 2 comparisons, and Spearman’s rank correlation for ordered categories (α = 0.05). Because some cells had expected counts below five, asymptotic p-values are approximate. Also note the income association a Monte Carlo permutation test gave the same conclusion (p = 0.013). Therefore no multivariable model was fitted.
3. Results
3.1. Respondent Profile
The sample (N = 107) was young, with 61.7% aged 18–30 and none older than 60 (Table 1). It was balanced by gender (51.4% male, 44.9% female, 3.7% other) and well educated: 43.9% held secondary qualifications and 35.5% a bachelor’s degree, with the remaining 20.6% reporting primary-level or postgraduate qualifications. Urban residents made up 54.2% and rural residents 39.3%; 6.5% were unsure how to classify their community. Half of households (50.5%) had three or four members, and 65.4% reported monthly household incomes of TT$5000–20,000.
3.2. Supply and Perceived Quality
Only 28 respondents (26.2%) reported being on a scheduled supply; the 30 respondents who answered the follow-up item received water on about 4.2 days a week on average, most often on Sundays (66.7%) and least often on Fridays (50.0%). Overall quality was rated moderately (mean 2.56, SD 0.92; 1 = excellent): “good” was the most common rating, followed by “fair”, and fewer than one in six respondents rated quality poor or very poor. For satisfaction with water quality, 4 respondents (3.7%) were very satisfied, 44 (41.1%) satisfied, 44 (41.1%) neutral, 10 (9.3%) dissatisfied and 5 (4.7%) very dissatisfied (mean 2.70, SD 0.87).
Respondents reported 181 problem mentions (Figure 1). Low pressure and discoloured or cloudy water dominated, while pungent odour was rarely cited. Pressure and interruptions together accounted for 50.8% of mentions, against 27.6% for appearance and 17.7% for taste and smell combined. Respondents attributed problems mainly to institutional and infrastructure factors (64.8% of 273 mentions): poor management by the water authority (20.1%), old or damaged pipelines (19.4%), inadequate treatment facilities (12.8%) and pipeline breakage or construction works (12.5%). High demand relative to supply (17.9%), seasonal or drought conditions (9.2%) and industrial or agricultural pollution (6.2%) were mentioned less often.
3.3. Household Impacts and Improvement Priorities
Of 223 impact mentions, the most common were a higher cost of living from buying bottled or filtered water (26.5%), inability to wash clothes (23.8%), inability to shower or maintain hygiene (12.6%), increased health concerns (12.1%), inability to cook (11.2%) and damage to appliances (7.2%). In total, 41 respondents (38.3%; 95% CI 29.7–47.8%) used additional treatment at home and a further 15 (14.0%) planned to install it. Among the 69 respondents who listed methods, filters (71.0%), boiling (29.0%) and rainwater harvesting (26.1%) were the most common; distillation (7.2%), chemical disinfection (4.3%) and reverse osmosis (1.4%) were rare.
Concern about pollution and water quality in Trinidad was substantial: 56 respondents (52.3%) gave one of the two highest concern ratings (mean 2.47, SD 1.28). When asked what matters most when paying for an improved supply, all six attributes were rated highly and differed little (Table 2); reduced turbidity ranked first and better taste last. Preferred improvement strategies were upgrading or replacing old infrastructure (22.5%), increasing storage and supply resources (18.1%), improving management and efficiency of local authorities (16.5%), advanced treatment technologies (15.7%), stricter pollution controls (13.6%) and public awareness of conservation (13.4%).
3.4. Willingness to Pay
Only 24 respondents (22.4%; 95% CI 15.6–31.2%) were willing to pay a higher monthly fee for improved water quality; 38 (35.5%; 27.1–44.9%) were not sure and 45 (42.1%; 33.1–51.5%) were unwilling. Of the 60 respondents who indicated a reasonable additional amount, 70.0% chose up to 5% of the current bill, 21.7% up to 10%, about 7% up to 20% and about 2% more than 20%.
Referring to Figure 2, among those unwilling or unsure, the leading reasons were the belief that quality should improve without extra cost (58.2%) and lack of trust that the water authority would deliver real improvements (55.7%). Already paying too much (31.6%) and financial constraints (16.5%) were less common, and 11.4% were satisfied with current quality.
WTP differed significantly by household income (χ2(6) = 16.16, p = 0.013, Cramér’s V = 0.27; Table 3, Figure 3). No respondent in the lowest income band said yes, whereas half of those above TT$20,000 did; the latter group was almost six times as likely to answer yes as all other respondents (12/24 vs. 12/83; odds ratio 5.9, Fisher’s exact p < 0.001), and income band was positively correlated with a yes response (Spearman ρ = 0.36, p < 0.001).
WTP was not significantly associated with residence (χ2(4) = 4.28, p = 0.37), household size (χ2(6) = 6.96, p = 0.33), satisfaction with water quality (χ2(8) = 7.32, p = 0.50; ρ = 0.06, p = 0.53) or home treatment (χ2(4) = 0.90, p = 0.93). Rural respondents were, if anything, less likely than urban respondents to say yes (16.7% vs. 25.9%; Fisher’s exact p = 0.33), and no respondent in households of more than six people said yes (0/10), although households of five or more did not differ significantly from smaller ones (17.2% vs. 24.4%; p = 0.60).
4. Discussion
This study examined how consumers in Trinidad perceive their piped water supply and what they would be willing to pay to improve it. Satisfaction was moderate, the most frequently reported problems concerned pressure, interruptions and discolouration, and only a minority of respondents were definitely willing to pay more. The sections below interpret these findings in relation to the existing literature, consider their implications and set out the limitations of the study.
4.1. Perceptions of Supply and Quality
Perceptions are moderate, and reliability matters as much as quality. Satisfaction was neither uniformly low nor high: 44.9% were satisfied, 41.1% neutral and 14.0% dissatisfied, and most respondents were not on a supply schedule. The problems reported were as much about delivery as about water quality: low pressure and interruptions made up just over half of all problem mentions, and discolouration was the leading quality complaint, while odour was seldom raised. This is broadly consistent with literature showing that perceptions of water quality rest heavily on sensory properties and on contextual cues from the supply system (Doria et al., 2009; Doria, 2010), but it does not support a picture of widespread dissatisfaction with water quality. Peters and Goberdhan (2016) reported that most participants in their Trinidad survey, conducted in 2014, were dissatisfied with the current water service, a considerably higher level than found here; differences in sampling, timing and the wording of the question may account for this, and the comparison should be treated cautiously. Respondents rated pressure as a frequent problem yet ranked it below turbidity, contaminant removal and interruptions when asked what they would pay for, suggesting that visible water quality and supply continuity are the attributes consumers most readily associate with value.
4.2. Household Costs and Coping
Households already bear private costs. More than a third of respondents treated water at home and a further 14.0% planned to, and the single most common household impact was the extra expense of bottled or filtered water. These costs mean that a tariff increase would be layered on top of existing outlays, which may partly explain the reluctance to pay more observed here, and they fall hardest on lower-income households.
4.3. Willingness to Pay
Willingness to pay is limited and trust-dependent. Fewer than one in four respondents were definitely willing to pay more, and those who were favoured modest increases of up to 5% of the current bill. The reasons given for declining point to expectation and trust rather than affordability: 58.2% felt quality should improve at no extra cost and 55.7% doubted that the authority would deliver, whereas only 16.5% cited financial constraints. This echoes the view that WTP reflects confidence in institutional performance as much as ability to pay (Fife-Schaw et al., 2008; Doria et al., 2009; Peters & Goberdhan, 2016), and it implies that proposals for price increases without demonstrated service gains are likely to meet resistance. The 35.5% who were unsure may be persuadable if improvements are visible and credibly tied to revenue.
Income, not location or household size, separated those willing to pay. The strong income gradient agrees with the wider literature (Beaumais et al., 2014; De Oca et al., 2003). By contrast, the expectation that rural consumers, who may face greater reliability problems, and larger households, which use more water, would be more willing to pay was not borne out; if anything, the observed direction was the opposite, though neither difference was statistically significant. With only 107 respondents, many sparse cells and no adjustment for confounding (income, household size and residence are likely correlated), a modest effect cannot be ruled out. The absence of an association between satisfaction and WTP also suggests that willingness to pay is shaped less by personal experience of poor quality than by income and by attitudes towards the provider.
4.4. Implications for Policy and Practice
Three implications follow, offered as hypotheses for policy testing rather than firm recommendations. First, because trust is the main barrier, utilities may need to demonstrate measurable improvements (pressure, continuity, clarity) and publish performance information before seeking price-based funding. Second, the income gradient, together with the burden of existing private costs, supports tariff structures that protect lower-income households, such as tiered or usage-based tariffs with a lifeline block, as proposed for other settings (De Oca et al., 2003). Third, respondents’ own improvement priorities (infrastructure renewal, supply resources and better management) offer a basis for sequencing capital works and public communication.
4.5. Limitations and Future Research
The sample was a small, non-random, online convenience sample, strongly skewed to ages 18–30 and excluding anyone older than 60, so results cannot be generalised to all Trinidadian households and likely over-represent connected, younger and better-educated people. Perceptions and WTP were self-reported and hypothetical, and stated intentions to pay often overstate actual payment; the WTP item did not use a bid design, so monetary WTP was not estimated. Income was collected in broad bands and no multivariable analysis was performed. Several items allowed multiple responses, and perceived quality was not compared with measured water quality. Finally, supply region and WASA service area were not recorded, preventing regional analysis. Future work should use probability sampling, include older and lower-income households, apply contingent valuation or choice experiments, and fit multivariable models (for example ordered logistic regression) to separate the effects of income, household size and location.
5. Conclusions
This survey of 107 Trinidadian consumers found moderate satisfaction with piped water, with supply pressure, interruptions and discoloured water the principal problems and a substantial minority bearing the cost of home treatment. Willingness to pay for improvement was limited: 22.4% were definitely willing, most of those favoured increases of 5% or less, and refusal was driven mainly by expectations of free improvement and distrust of the authority rather than affordability. Income was the only characteristic significantly associated with willingness to pay. Improving reliability and building credible accountability are likely to be prerequisites for price-based funding of upgrades, and tariff design should protect lower-income households.
Author Contributions
Prashant Birbal: Methodology, Formal Analysis, Investigation, Data Curation, Writing (Original Draft). Nicholas Salamat: Methodology, Formal Analysis, Investigation, Data Curation, Writing (Original Draft). Hazi Azamathulla: Conceptualization, Writing (Review and Editing), Supervision. Michelle Shah: Data Curation, Writing (Review and Editing). Vipinkumar Yadav: Software, Validation, Formal Analysis, Writing (Review and Editing).
Funding
This research received no external funding.
Institutional Review Board Statement
Not applicable.
Informed Consent Statement
Informed consent was obtained from all subjects involved in the study. Before completing the online questionnaire, respondents were informed of the purpose of the survey and that participation was voluntary, and they gave their consent electronically by proceeding to complete it.
Data Availability Statement
The data will be made available upon request from the corresponding authors.
Acknowledgments
The authors thank all the respondents who took the time to complete the survey, and those who helped to distribute the questionnaire.
Conflicts of Interest
The authors declare no conflicts of interest.
References
- Beaumais, O.; Briand, A.; Millock, K.; Nauges, C. What Are Households Willing to Pay for Better Tap Water Quality? A Cross-Country Valuation Study (Nota di Lavoro 24.2014); Fondazione Eni Enrico Mattei: Milan, Italy, 2014. [Google Scholar]
- Cashman, A. Water security and services in the Caribbean. Water 2014, 6, 1187–1203. [Google Scholar] [CrossRef]
- Cochran, W.G. Sampling Techniques, 3rd ed.; Wiley: New York, NY, USA, 1977. [Google Scholar]
- De Oca, G.S.M.; Bateman, I.J.; Tinch, R.; Moffatt, P.G. Assessing the Willingness to Pay for Maintained and Improved Water Supplies in Mexico City (Working Paper); Centre for Social and Economic Research on the Global Environment (CSERGE), University of East Anglia: Norwich, UK, 2003. [Google Scholar]
- Doria, M. de F. Factors influencing public perception of drinking water quality. Water Policy 2010, 12, 1–19. [Google Scholar] [CrossRef]
- Doria, M. de F.; Pidgeon, N.; Hunter, P.R. Perceptions of drinking water quality and risk and its effect on behaviour: A cross-national study. Sci. Total Environ. 2009, 407, 5455–5464. [Google Scholar] [CrossRef] [PubMed]
- Fife-Schaw, C.; Barnett, J.; Chenoweth, J.; Morrison, G.M.; Lundéhn, C. Consumer trust and confidence: Some recent ideas in the literature. Water Sci. Technol. Water Supply 2008, 8, 43–48. [Google Scholar] [CrossRef]
- Hanemann, W.M. Valuing the environment through contingent valuation. J. Econ. Perspect. 1994, 8, 19–43. [Google Scholar] [CrossRef]
- Hunter, P.R.; Macdonald, A.M.; Carter, R.C. Water supply and health. PLoS Med. 2010, 7, e1000361. [Google Scholar] [CrossRef] [PubMed]
- Mycoo, M. Shifting paradigms in water provisioning policies: A Trinidad case study. Int. J. Water Resour. Dev. 2005, 21, 509–523. [Google Scholar] [CrossRef]
- Mycoo, M. Conflicting objectives of Trinidad’s water pricing policy: A need for good water pricing and governance. Int. J. Water Resour. Dev. 2011, 27, 723–736. [Google Scholar] [CrossRef]
- Nauges, C.; Whittington, D. Estimation of water demand in developing countries: An overview. World Bank. Res. Obs. 2010, 25, 263–294. [Google Scholar] [CrossRef]
- Nauges, C.; Whittington, D. Evaluating the performance of alternative municipal water tariff designs: Quantifying the trade-offs between equity, economic efficiency, and cost recovery. World Dev. 2017, 91, 125–143. [Google Scholar] [CrossRef]
- Ochoo, B.; Valcour, J.; Sarkar, A. Association between perceptions of public drinking water quality and actual drinking water quality: A community-based exploratory study in Newfoundland (Canada). Environ. Res. 2017, 159, 435–443. [Google Scholar] [CrossRef] [PubMed]
- Peters, E.J.; Goberdhan, L. Potential consumers’ perception of treated wastewater reuse in Trinidad. West Indian J. Eng. 2016, 38, 33–43. [Google Scholar]
- Portney, P.R. The contingent valuation debate: Why economists should care. J. Econ. Perspect. 1994, 8, 3–17. [Google Scholar] [CrossRef]
- United Nations General Assembly. The Human Right to Water and Sanitation (Resolution 64/292); United Nations: New York, NY, USA, 2010. [Google Scholar]
- Vasquez, W.F.; Mozumder, P.; Hernandez-Arce, J.; Berrens, R.P. Willingness to pay for safe drinking water: Evidence from Parral, Mexico. J. Environ. Manag. 2009, 90, 3391–3400. [Google Scholar] [CrossRef] [PubMed]
- Whittington, D. Administering contingent valuation surveys in developing countries. World Dev. 1998, 26, 21–30. [Google Scholar] [CrossRef]
- Whittington, D.; Briscoe, J.; Mu, X.; Barron, W. Estimating the willingness to pay for water services in developing countries: A case study of the use of contingent valuation surveys in southern Haiti. Econ. Dev. Cult. Change 1990, 38, 293–311. [Google Scholar] [CrossRef]
- WHO. Guidelines for Drinking-Water Quality: Fourth Edition Incorporating the First and Second Addenda; World Health Organization: Geneva, Switzerland, 2022. [Google Scholar]
- WHO; UNICEF. Progress on Household Drinking Water, Sanitation and Hygiene 2000–2022: Special Focus on Gender; World Health Organization and United Nations Children’s Fund: Geneva, Switzerland, 2023. [Google Scholar]
- World Bank. A Benchmark for the Performance of State-Owned Water Utilities in the Caribbean; World Bank: Washington, DC, USA, 2020. [Google Scholar]
Figure 1.
Problems reported with piped water supply.
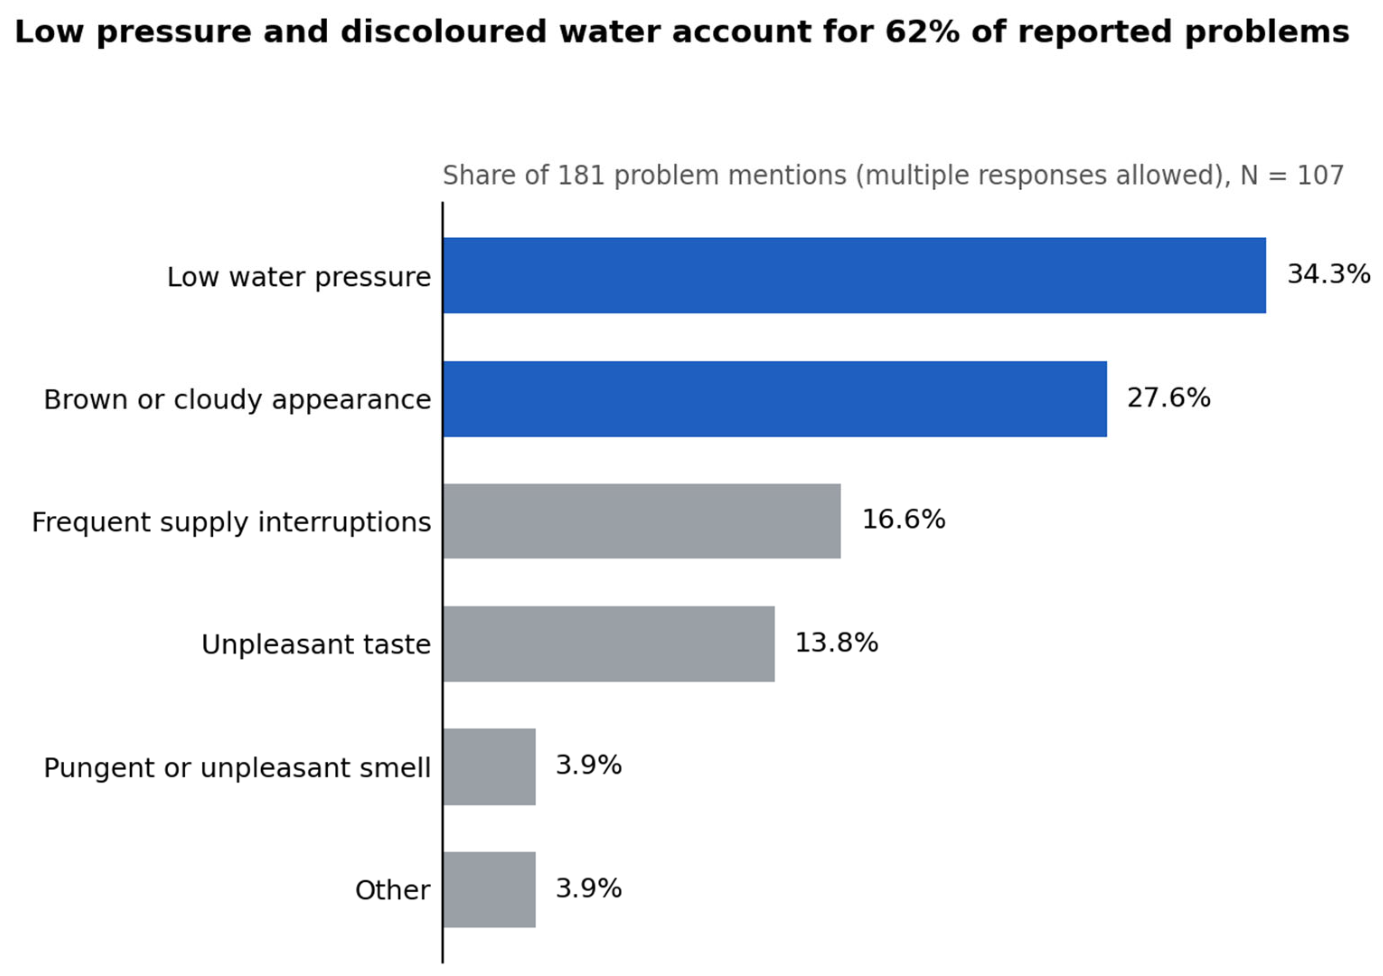
Figure 2.
Reasons for being unwilling or unsure about paying a higher monthly fee.
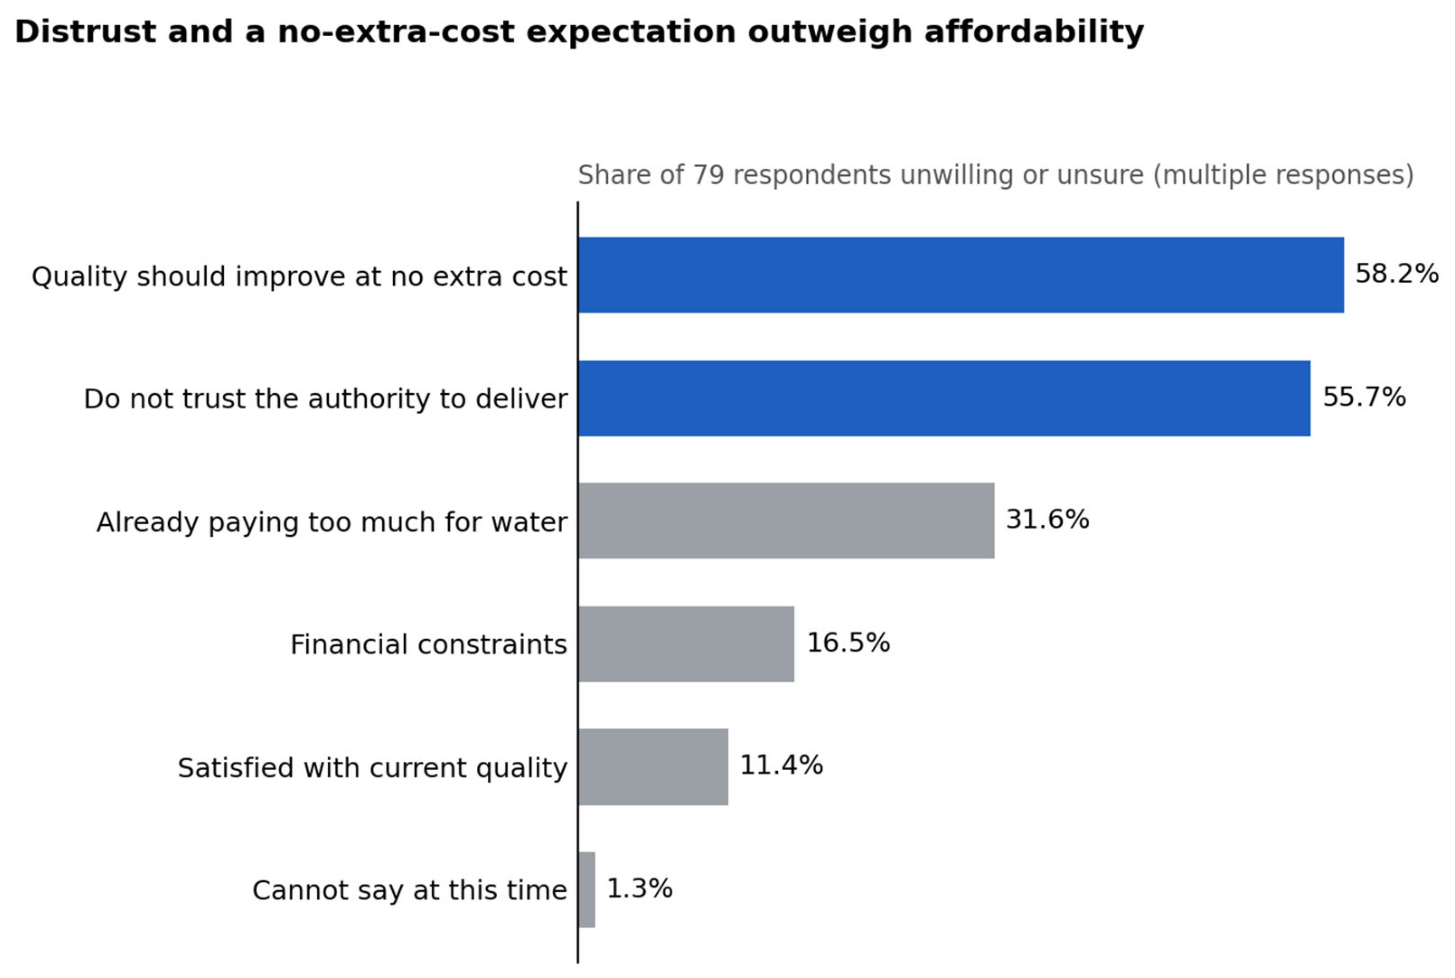
Figure 3.
Share willing to pay a higher monthly fee, by household income band.
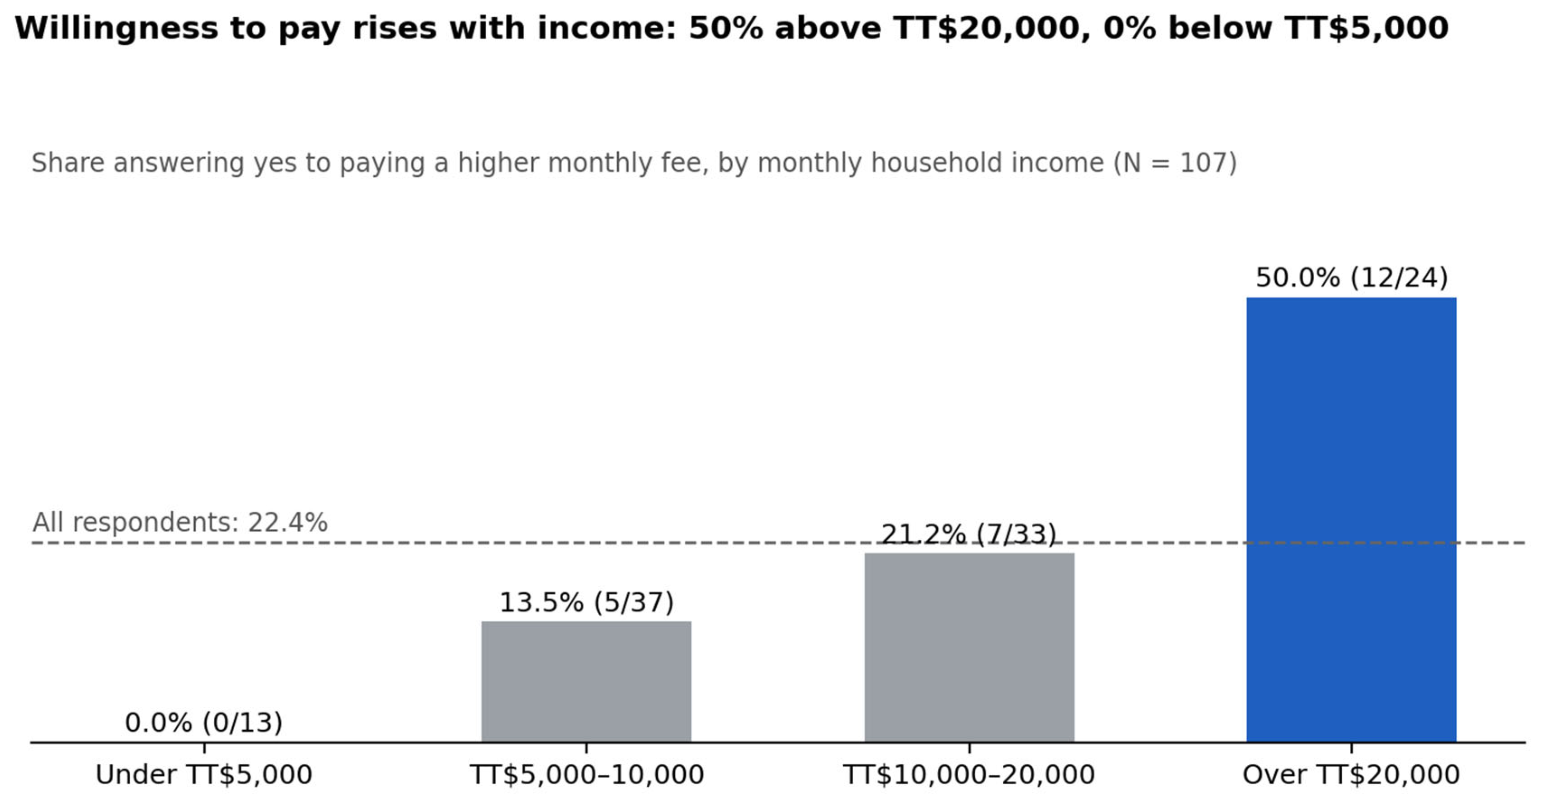

Table 1.
Respondent characteristics (N = 107).
| Characteristic | Category | n | % |
|---|---|---|---|
| Gender | Male | 55 | 51.4 |
| Female | 48 | 44.9 | |
| Other | 4 | 3.7 | |
| Age (years) | 18–30 | 66 | 61.7 |
| 31–39 | 16 | 15.0 | |
| 40–49 | 17 | 15.9 | |
| 50–60 | 8 | 7.5 | |
| Residence | Urban | 58 | 54.2 |
| Rural | 42 | 39.3 | |
| Not sure | 7 | 6.5 | |
| Household size | 1–2 | 24 | 22.4 |
| 3–4 | 54 | 50.5 | |
| 5–6 | 19 | 17.8 | |
| More than 6 | 10 | 9.3 | |
| Monthly household income (TT$) | Less than 5000 | 13 | 12.1 |
| 5000–10,000 | 37 | 34.6 | |
| 10,000–20,000 | 33 | 30.8 | |
| More than 20,000 | 24 | 22.4 |
Table 2.
Ordinal survey items (N = 107; 1 = most favourable, most important or highest concern).
| Item | Mean | SD |
|---|---|---|
| Overall quality of piped water | 2.56 | 0.92 |
| Satisfaction with water quality | 2.70 | 0.87 |
| Concern about pollution and water quality | 2.47 | 1.28 |
| Importance: reduced turbidity (clearer water) | 1.76 | 1.31 |
| Importance: fewer supply interruptions | 1.79 | 1.21 |
| Importance: removal of contaminants | 1.81 | 1.33 |
| Importance: better smell | 1.89 | 1.29 |
| Importance: higher water pressure | 1.96 | 1.27 |
| Importance: better taste | 2.03 | 1.39 |
Table 3.
Willingness to pay a higher monthly fee, by respondent characteristic (row percentages).
| Characteristic | Category | n | Yes, n (%) | Not Sure, n (%) | No, n (%) | Test |
|---|---|---|---|---|---|---|
| Household income (TT$) | <5000 | 13 | 0 (0.0) | 6 (46.2) | 7 (53.8) | χ2(6) = 16.16, p = 0.013 |
| 5000–10,000 | 37 | 5 (13.5) | 15 (40.5) | 17 (45.9) | ||
| 10,000–20,000 | 33 | 7 (21.2) | 11 (33.3) | 15 (45.5) | ||
| >20,000 | 24 | 12 (50.0) | 6 (25.0) | 6 (25.0) | ||
| Residence | Urban | 58 | 15 (25.9) | 17 (29.3) | 26 (44.8) | χ2(4) = 4.28, p = 0.369 |
| Rural | 42 | 7 (16.7) | 17 (40.5) | 18 (42.9) | ||
| Not sure | 7 | 2 (28.6) | 4 (57.1) | 1 (14.3) | ||
| Household size | 1–2 | 24 | 9 (37.5) | 7 (29.2) | 8 (33.3) | χ2(6) = 6.96, p = 0.325 |
| 3–4 | 54 | 10 (18.5) | 21 (38.9) | 23 (42.6) | ||
| 5–6 | 19 | 5 (26.3) | 6 (31.6) | 8 (42.1) | ||
| >6 | 10 | 0 (0.0) | 4 (40.0) | 6 (60.0) | ||
| Satisfaction with quality | Very satisfied | 4 | 0 (0.0) | 1 (25.0) | 3 (75.0) | χ2(8) = 7.32, p = 0.503 |
| Satisfied | 44 | 10 (22.7) | 17 (38.6) | 17 (38.6) | ||
| Neutral | 44 | 10 (22.7) | 18 (40.9) | 16 (36.4) | ||
| Dissatisfied | 10 | 2 (20.0) | 2 (20.0) | 6 (60.0) | ||
| Very dissatisfied | 5 | 2 (40.0) | 0 (0.0) | 3 (60.0) | ||
| Home treatment | Yes | 41 | 9 (22.0) | 14 (34.1) | 18 (43.9) | χ2(4) = 0.90, p = 0.925 |
| No | 51 | 11 (21.6) | 20 (39.2) | 20 (39.2) | ||
| Planning to install | 15 | 4 (26.7) | 4 (26.7) | 7 (46.7) |
Disclaimer/Publisher’s Note: The statements, opinions and data contained in all publications are solely those of the individual author(s) and contributor(s) and not of MDPI and/or the editor(s). MDPI and/or the editor(s) disclaim responsibility for any injury to people or property resulting from any ideas, methods, instructions or products referred to in the content. |
© 2026 by the authors. Licensee MDPI, Basel, Switzerland. This article is an open access article distributed under the terms and conditions of the Creative Commons Attribution (CC BY) license (http://creativecommons.org/licenses/by/4.0/).
Copyright: This open access article is published under a Creative Commons CC BY 4.0 license, which permit the free download, distribution, and reuse, provided that the author and preprint are cited in any reuse.