

Submitted:
15 October 2026
Posted:
15 October 2026
You are already at the latest version
Abstract
Estimating organic carbon fluxes in data-limited tropical island catchments is constrained by sparse discharge records and concentration measurements. For the Changhua River, Hainan Island, we compared three calendar-month runoff-coefficient models based on the mean, median, and geomet-ric mean with a linear model incorporating current- and previous-month precipitation. Models were fitted to monthly records from 2011–2023 and evaluated against all 12 months of 2024. Holdout root mean square errors were 42.669, 39.544, 38.382, and 31.801 mm, respectively. The dual-precipitation model performed best, with a Nash–Sutcliffe efficiency of 0.763 and a percentage bias of −10.220%. Its fixed parameters were applied to September–November 2025 precipitation. The resulting monthly equivalent runoff coefficients were transferred to Ningyuan and Lingshui using their precipitation and drainage areas. Estimated runoff volumes were multiplied by equally weighted mean concentrations from three October–November surveys. Conditional dissolved or-ganic carbon exports were 2763.373, 730.024, and 655.773 t C for Changhua, Ningyuan, and Lingshui, respectively; corresponding particulate organic carbon exports were 571.135, 201.645, and 441.045 t C. These estimates depend on unverified catchment transferability and concentration rep-resentativeness, particularly for unsampled September. They apply to a limited observation period and do not establish annual carbon budgets or carbon sequestration.
Keywords:
data-limited catchments
; monthly runoff reconstruction
; runoff coefficient
; hydrological regionalization
; dissolved organic carbon
; particulate organic carbon
; tropical island rivers
1. Introduction
Rivers connect terrestrial ecosystems, inland waters, and the ocean through carbon transport and transformation. An observation-constrained multi-model assessment estimated global riverine carbon export to the ocean at 1.02 ± 0.22 Pg C yr⁻¹ (2σ), including approximately 0.30 Pg C yr⁻¹ of dissolved organic carbon (DOC) and 0.18 Pg C yr⁻¹ of particulate organic carbon (POC) [1]. Microbial metabolism, sediment storage, and atmospheric exchange within river networks modify the amount and composition of carbon delivered downstream [2,3]. Quantifying regional DOC and POC export therefore requires hydrological information and representative concentration measurements. Global budgets provide context but cannot replace catchment-specific observations, particularly in poorly monitored tropical island rivers.
Steep terrain, short transport pathways, and intense rainfall can make mountainous island rivers important conduits of terrestrial organic carbon to coastal waters [4,5]. A recent satellite-constrained assessment identified high-standing islands as disproportionately important contributors to global POC export [6]. Observations in Taiwan and Puerto Rico show that tropical cyclones and extreme rainstorms can mobilize substantial sediment and organic carbon over short periods [7,8,9]. These pulses make flux estimates sensitive to event coverage and limit the representativeness of routine samples for annual export. The climatic significance of POC export also depends on particle sources, oxidation, and subsequent preservation [3,10]. Riverine export should thus be distinguished from permanent carbon burial or a net carbon sink.
DOC and POC respond differently to hydrological conditions. DOC export reflects soil leaching, flow-path activation, riparian connectivity, and in-channel processing, whereas particulate transport is closely associated with erosion and sediment mobilization [11,12,13,14]. Recent studies have examined these relationships at complementary scales. Event-scale modeling in a small flash-flood catchment indicated that storm intensity can alter the flow paths supplying DOC [15]. Monitoring of 13 events in a subtropical karst catchment revealed variable DOC responses [16], while high-frequency observations in Alaska showed seasonal and flow-related changes in exported carbon forms [17]. A two-year study also identified contrasting DOC export patterns across hydrological regimes [18]. These findings highlight the need to integrate discharge and concentration over a defined period. Sparse surveys can characterize sampled concentrations but cannot resolve concentration–discharge relationships or quantify event contributions. Monthly runoff models therefore support estimates at monthly resolution rather than reconstructing storm-scale carbon transport.
Hainan’s river systems are strongly influenced by tropical monsoons and cyclones. Studies of the Wanquan River documented rainfall-related changes in organic carbon sources and export [19], while Changhua River observations identified spatial and seasonal variability in DOC and POC [20]. More recently, research in the Wenchang Zhuxi River Basin revealed seasonal and spatial heterogeneity in dissolved organic matter, with contributions from soils and human activities [21]. At the national scale, increasing DOC export from China further highlights the influence of changing runoff and catchment conditions [22]. These findings motivate monitoring of the neighboring Changhua, Ningyuan, and Lingshui catchments in southern Hainan. In the present study, sparse concentration surveys and limited discharge records constrain the linkage between water-quality observations and period-integrated carbon export.
Runoff estimation in ungauged catchments commonly relies on regionalization or the transfer of information from hydrologically similar gauged donor basins [23,24]. Transferability depends on climatic and physiographic characteristics; spatial proximity alone does not establish equivalent hydrological responses [25,26]. A 2024 WaterGAP3 assessment showed that regionalization choices introduce spatially and temporally variable runoff uncertainty and emphasized the combined use of climatic and physiographic descriptors [27]. Predictive performance in a donor catchment must therefore be distinguished from transferability to target catchments. When only monthly records and a single donor basin are available, transparent models with few parameters provide a practical basis for comparison. Calendar-month runoff-coefficient summaries offer simple baselines, while current- and previous-month precipitation allow antecedent rainfall effects to be assessed statistically. Comparing these alternatives under a common training and evaluation design can assess the support for monthly reconstruction without implying independent validation of target-catchment runoff.
This study combines simplified monthly runoff reconstruction with conditional organic carbon flux estimation for the Changhua, Ningyuan, and Lingshui rivers. Four models were fitted to Changhua monthly records from 2011–2023 and evaluated against the 12 months of 2024: runoff-coefficient models based on the calendar-month mean, median, and geometric mean, and a linear model incorporating current- and previous-month precipitation. The objectives were to compare temporal predictive performance; estimate September–November 2025 runoff from monthly precipitation, catchment areas, and transferred Changhua equivalent runoff coefficients; and combine these volumes with DOC and POC observations from three October–November surveys. Because the 2024 records had informed earlier analyses, this evaluation constitutes a temporal holdout comparison rather than an untouched external test. The three survey means are equally weighted and applied to the estimation period, including unsampled September. The resulting fluxes are conditional on runoff reconstruction, catchment transferability, and concentration representativeness. They apply only to September–November 2025 and do not establish annual carbon budgets or carbon-sink effects.
2. Materials and Methods
2.1. Study Area and Catchment Characteristics
The Changhua, Ningyuan, and Lingshui rivers are located on Hainan Island, China, within 18°25′–19°25′ N and 108°45′–110°10′ E (Figure 1). Hainan’s central uplands grade outward through mountains, hills, terraces, and plains. The three rivers originate in the central mountains and drain radially toward the coast, forming characteristic tropical island river systems. The region has a tropical maritime monsoon climate, with warm temperatures, abundant rainfall, and distinct dry and wet seasons. Forest and cropland dominate land cover; vegetation cover is generally high, and ecosystem structure is relatively stable. Rainfall is limited during the dry season from November to April, whereas the wet season from May to October accounts for 70%–80% of annual precipitation. The Changhua, Ningyuan, and Lingshui drainage areas are 5594.84, 1155.36, and 1264.88 km², respectively.
2.2. Water Sampling, Laboratory Analysis, and Quality Control
Water-quality sampling was conducted in the lower reaches of each river. Whole-catchment areas were used to approximate the areas contributing to the sampling sections; differences between actual contributing areas and whole-catchment areas at estuarine sampling locations have not been quantified. Changhua and Ningyuan were sampled on 20 October, 5 November, and 18 November 2025, and Lingshui on 21 October, 6 November, and 19 November. These surveys are designated T1, T2, and T3. Three sampling points were established at each section. Statistics for each variable were calculated from valid bottle samples, and bottle counts were not treated as independent sampling dates.
River water was collected in precleaned polyethylene bottles, transported below 4 °C, and filtered in the laboratory within 12 h of collection. Separate aliquots were prepared for SSC, POC, and DOC analyses. All glass-fiber filters were precombusted at 450 °C for 4 h. pH was measured with a handheld water-quality meter. Means and sample standard deviations were calculated from valid bottle records. The holding-time requirements for filtration within 12 h of collection and DOC analysis within 24 h of filtration were applied separately.
DOC aliquots were filtered through 0.45 μm glass-fiber filters and analyzed with an Analytik Jena multi N/C 3100 total organic carbon/total nitrogen analyzer (Germany). Filtrates were stored below 4 °C in the dark and analyzed within 24 h of filtration. Separate POC aliquots were filtered through 0.7 μm glass-fiber filters. The retained particles were rinsed with 1% dilute hydrochloric acid to remove inorganic carbon, and the filters were dried at 60 °C to constant mass. Whole filters were combusted at 1100 °C in the HT 1300 solid module coupled to the multi N/C 3100. POC concentrations were calculated by subtracting the corresponding blank carbon mass and dividing by the filtered water volume. SSC was determined gravimetrically by filtering a known water volume through a 0.45 μm glass-fiber filter, drying the filter at 105 °C to constant mass, and dividing the increase in filter mass by the water volume. Each batch included field blanks and parallel bottle samples, and concentrations were corrected with the corresponding batch blank.

Table 1.
Catchment means from the three water-quality surveys conducted in 2025. POC is expressed in μg L⁻¹ and was divided by 1000 to obtain mg L⁻¹ for flux calculations. Valid sample counts and dispersion are reported in Table 4. DOC, dissolved organic carbon; POC, particulate organic carbon; SSC, suspended sediment concentration.
| Sampling date (2025) | Catchment | pH | SSC (mg L⁻¹) | POC (μg L⁻¹) | DOC (mg L⁻¹) |
|---|---|---|---|---|---|
| 10.20 | Changhua River | 7.283 | 28.619 | 606.767 | 2.208 |
| 10.20 | Ningyuan River | 7.027 | 49.174 | 970.317 | 2.248 |
| 10.21 | Lingshui River | 7.055 | 27.792 | 1029.567 | 1.941 |
| 11.05 | Changhua River | 7.800 | 13.579 | 320.375 | 2.275 |
| 11.05 | Ningyuan River | 7.600 | 16.019 | 393.765 | 2.340 |
| 11.06 | Lingshui River | 7.300 | 33.918 | 1096.848 | 1.908 |
| 11.18 | Changhua River | 8.380 | 11.781 | 321.345 | 1.558 |
| 11.18 | Ningyuan River | 8.035 | 16.137 | 394.223 | 1.778 |
| 11.19 | Lingshui River | 7.555 | 82.954 | 1467.738 | 1.495 |
2.3. Hydrometeorological and Public Spatial Data
Catchment boundaries were extracted from the complete level-5 catchment vectors in GRNWRZ V2.0 in the WGS 1984 coordinate system [28]. Changhua hydrological data comprised a long-term measured discharge series aggregated to monthly resolution.
Precipitation data were obtained from Shouzhang Peng’s Chinese 1 km monthly gridded precipitation dataset, using the updated 1901–2025 product [29] supplied by the National Earth System Science Data Center (https://www.geodata.cn). The dataset construction method is described by Peng et al. [30]. Supplementary records covered January and August–December of each year from 2013–2025. The original precipitation values, expressed in 0.1 mm, were multiplied by 0.1 to obtain mm.
Gridded precipitation was processed in ArcGIS 10.5 and Python 2.7. The complete GRNWRZ V2.0 level-5 catchment boundaries defined the zones, and the zonal MEAN statistic was used without additional area weighting. The supplementary precipitation table covers January and August–December of each year from 2013 to 2025, comprising 78 year–month combinations and 234 values for the three catchments.
Table 2 distinguishes observational records from precipitation inputs. A, B, and C denote the Changhua, Ningyuan, and Lingshui rivers, respectively.
2.4. Overall Framework and Levels of Inference
The workflow comprised conversion of historical hydrological units, fitting and temporal holdout evaluation of four models, estimation of Changhua runoff for the target period, transfer of equivalent runoff coefficients, and calculation of DOC and POC fluxes. Measured concentrations, historical hydrological summaries, model predictions, and transferred estimates are reported separately. Flux estimates are conditional on the assumptions used to estimate runoff volumes and aggregate concentrations (Figure 2).
2.5. Changhua Monthly Runoff Models and Temporal Holdout Evaluation
2.5.1. Monthly Discharge Aggregation and Runoff Depth
Equations (1) – (3) convert within-month sums of daily mean discharge into runoff volume, runoff depth, and runoff coefficient. Monthly runoff volume is calculated by summing daily volumes. Runoff depth is R = V/(A × 1000), where V is in m³, A is in km², and R is in mm. The Changhua catchment area was consistently set to 5594.841 km² for these calculations. The runoff coefficient is α = R/P, where P is monthly precipitation in mm. In Equation (1), q denotes daily mean discharge (m³ s⁻¹), summed over days d in month m of year y; 86400 is the number of seconds per day.
The Changhua record comprises 168 months from 2011–2024. The 156 months from 2011–2023 were used to construct three calendar-month runoff-coefficient baselines, with 13 coefficients for each calendar month. January 2011 was excluded from the dual-precipitation model because December 2010 precipitation was unavailable, leaving 155 fitting records. To ensure comparability, training errors for all four models were evaluated over these same 155 months. All 12 months of 2024 constituted the common temporal holdout set.
2.5.2. Candidate Models and Training Design
The first three models summarize historical runoff coefficients for each calendar month using the arithmetic mean, median, or geometric mean. The resulting coefficient is multiplied by target-month precipitation to predict runoff depth. The geometric mean is calculated as the exponential of the mean logarithm of positive coefficients and therefore requires all included coefficients to be positive. Zero values were not replaced with arbitrary small constants, and coefficients were not capped at a prescribed upper limit.
The dual-precipitation model uses runoff depth as the response variable and current- and previous-month precipitation as predictors. The model was fitted by ordinary least squares with an intercept, using a single parameter set for all calendar months. For January, the lagged input is December precipitation from the preceding year.
Parameters were estimated exclusively from the relevant 2011–2023 training records; 2024 observations were excluded from fitting. The training errors in Table A1 are within-sample errors evaluated over the common 155-month set. Leave-one-year-out cross-validation was not repeated for the complete monthly series, and earlier cross-validation results based on four calendar months were excluded from that table.
With the training parameters fixed, runoff depth was predicted for January–December 2024, using December 2023 precipitation as the lagged input for January 2024. The same 2011–2023 parameter set was then applied to September–November 2025 without refitting to include 2024 observations. The 2024 evaluation covers only one complete year; assessing temporal stability requires longer independent records.
Historical runoff coefficients were recalculated after harmonizing catchment areas and precipitation units, rather than adopting derived series affected by abrupt changes from earlier area-label errors. Monthly coefficients greater than 1 were retained. Storage release or regulation can decouple monthly runoff from contemporaneous precipitation, although local explanations require additional evidence.
2.5.3. Performance Metrics and the 2024 Holdout
Model performance was evaluated using root mean square error (RMSE), mean absolute error (MAE), percentage bias (PBIAS), and Nash–Sutcliffe efficiency (NSE), following the definitions and interpretations discussed by Gupta et al. [31] and Moriasi et al. [32]. RMSE and MAE are expressed in mm. PBIAS was calculated as prediction minus observation, so positive values indicate overall overestimation. This sign convention is opposite to the observation-minus-prediction convention used by Moriasi et al. [32]. NSE uses the observed mean as the reference, with values approaching 1 indicating lower overall error. It is defined as 1 minus the ratio of the residual sum of squares to the sum of squared deviations from the observed mean and is distinct from the squared Pearson correlation between predictions and observations.
Here, n denotes the number of months evaluated, R is observed runoff depth, is predicted runoff depth, and is the observed mean for the evaluation period. Training and 2024 holdout results are reported separately. Models were compared using 2024 RMSE, with PBIAS and NSE providing complementary information. No single metric independently validates predictions for the target year or other catchments.
For the 2025 application, the dual-precipitation model predicts runoff depth from current- and previous-month Changhua precipitation. The predicted depth is divided by current-month precipitation to obtain an equivalent runoff coefficient. This monthly model output incorporates the intercept and lagged term and is distinct from a fixed long-term mean coefficient.
2.6. Coefficient Transfer and Runoff Estimation for the Target Period
The Changhua, Ningyuan, and Lingshui catchments occupy similar latitudes and share tropical monsoon climates and vegetation types. These characteristics provided a preliminary basis for selecting Changhua as the donor catchment. Its monthly equivalent runoff coefficients were combined with contemporaneous precipitation and drainage areas for Ningyuan and Lingshui to estimate runoff volumes. These volumes were then combined with each river’s DOC and POC concentrations. Qualitative similarities in climate and vegetation do not establish equal runoff coefficients; the transfer assumption requires independent hydrological observations and quantitative comparisons of catchment attributes.
In Equation (10), X denotes a target catchment and P is its monthly precipitation (mm). In Equation (11), A is the catchment area in km²; multiplying runoff depth in mm by area in km² and then by 10³ gives volume in m³. The Ningyuan and Lingshui areas are 1155.36 and 1264.88 km², respectively. Only the Changhua equivalent coefficient is shared; precipitation inputs are specific to each catchment. No uncalibrated area exponent, soil correction, or reservoir adjustment was applied.
Table 3 presents September–November 2025 precipitation and runoff estimates for the three catchments. December precipitation is included only as background in the precipitation figures and is excluded from flux calculations. August 2025 Changhua precipitation provides the lagged input for September. T1 denotes the October survey, and T2 and T3 denote the November surveys. Monthly precipitation characterizes background conditions but cannot reconstruct sampling-day discharge or the rising and falling limbs of individual events (Figure 3).
2.7. Water-Quality Statistics and Conditional Organic Carbon Export
DOC concentrations were calculated from bottle measurements using the updated blank-correction formulas for each survey. POC concentrations were calculated by dividing blank-corrected filter carbon mass by filtered water volume and converting the result to mg L⁻¹. SSC and pH statistics were based on bottle-level measurements. Sample standard deviations (SD) were calculated with n − 1 in the denominator. Missing measurements were excluded from n, and neither SD nor the coefficient of variation (CV) was calculated when n = 1. No between-group significance tests were performed.
CV quantifies relative dispersion among bottle samples. Here, n denotes the number of valid bottles for a given catchment, survey, and variable. Parallel bottles are not independent monthly or annual replicates.
All concentrations were converted to mg L⁻¹ before flux calculations. DOC and POC are operationally defined by filtration thresholds of 0.45 and 0.7 μm, respectively. Their fluxes are reported separately and are not combined into a complete total organic carbon flux. Bottle-level CV describes within-survey dispersion rather than complete analytical uncertainty or recovery.
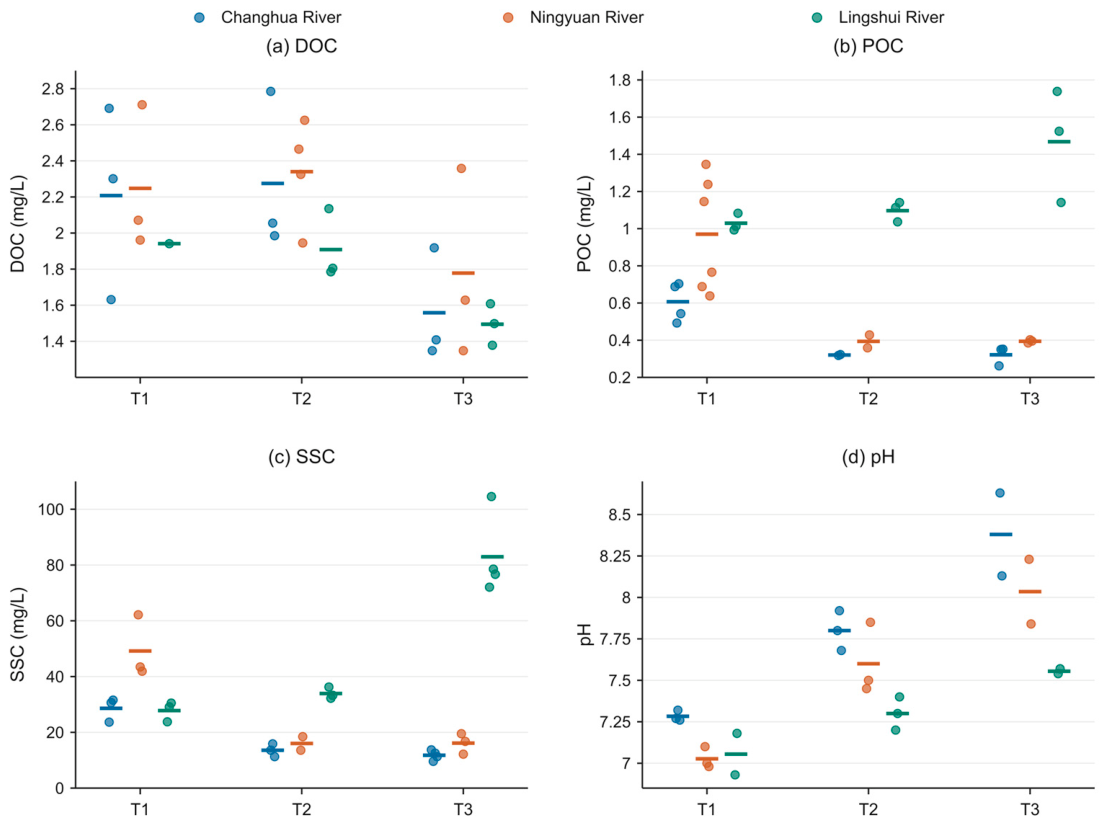
DOC concentrations for T1, T2, and T3 were corrected using batch blanks of 0.449, 0.285, and 0.392 mg L⁻¹, respectively. For each valid T3 POC filter record, 43.19 μg of blank carbon mass was subtracted before division by the filtered water volume. Figure 5 shows bottle-level observations and survey means; Table 1 and Table 4 summarize the data, and Appendix A describes blank corrections and valid sample counts.
For each river, representative DOC and POC concentrations were calculated as the arithmetic means of the T1, T2, and T3 survey means, assigning a weight of 1/3 to each survey rather than weighting by bottle count. Representative DOC concentrations were 2.013556, 2.121889, and 1.781333 mg L⁻¹ for Changhua, Ningyuan, and Lingshui, respectively; corresponding POC concentrations were 0.416162, 0.586102, and 1.198051 mg L⁻¹. Calculations used unrounded values; the displayed numerical precision does not imply equivalent measurement accuracy.
In Equation (13), V denotes estimated monthly runoff volume (m³), C̄is the representative river concentration defined above (mg L⁻¹), and L is organic carbon mass (t C). Applying the same concentration to the September, October, and November volumes and summing the resulting masses is equivalent to multiplying that concentration by the cumulative three-month volume. Here, flux denotes cumulative export over the estimation period rather than an instantaneous mass transport rate.
No field survey of carbon concentrations was conducted in September 2025. Equally weighted means from the three October–November surveys were applied to cumulative September–November runoff, excluding December. No event-enhancement multiplier was applied to POC, and the concentration assumptions were not extrapolated to the full year.
T1 represents a single survey, and parallel bottles cannot characterize the monthly concentration distribution. T2 and T3 represent two November surveys; their minimum and maximum values do not bound concentrations over the entire month.
Screening estimates of DOC and POC export are reported separately for September–November. They are not summed as total organic carbon, and no annual flux, area-normalized yield, or carbon-sink effect is inferred.
2.8. Uncertainty, Traceability, and Confidentiality
Uncertainty was classified into hydrological prediction, catchment transfer, concentration measurement, and temporal concentration representativeness (Table 6). Changhua prediction residuals and within-survey bottle dispersion can be quantified. However, measured discharge is unavailable for the target catchments, and within-month concentration variability is insufficiently characterized. These gaps preclude verifiable probabilistic flux intervals.
Averaging estimates across the three rivers cannot eliminate correlated transfer errors arising from the shared donor model. Field-bottle relationships, DOC blanks, and valid POC records have been specified, but bottle-level SD does not capture complete analytical uncertainty. Quantitative quality control (QC) and temporal representativeness require separate assessments. No percentage contributions or definitive ranking are assigned to the four uncertainty sources. Numerical inputs should be verified before scenario ranges are expanded; otherwise, apparent dominance may reflect arbitrary choices of those ranges.
Original workbooks and calculation-source records were retained. Sampling and monthly summary data are neither publicly released nor available on request, and daily discharge data are not provided. The study-area map shows approximate sampling locations only. These restrictions limit independent recalculation from the original records; reproducibility from public data is therefore not claimed.
Internal records document input worksheets, temporal identifiers, unit conversions, calendar-month statistics, linear model parameters, predictions, and aggregated concentrations. Missing values were not replaced with zero. Table A1 summarizes model performance, and Table 3 and Table 5 report runoff volumes and carbon fluxes. Training and temporal holdout errors are reported separately. The analysis was not preregistered.
3. Results
3.1. Precipitation Records, Units, and Spatial Differences
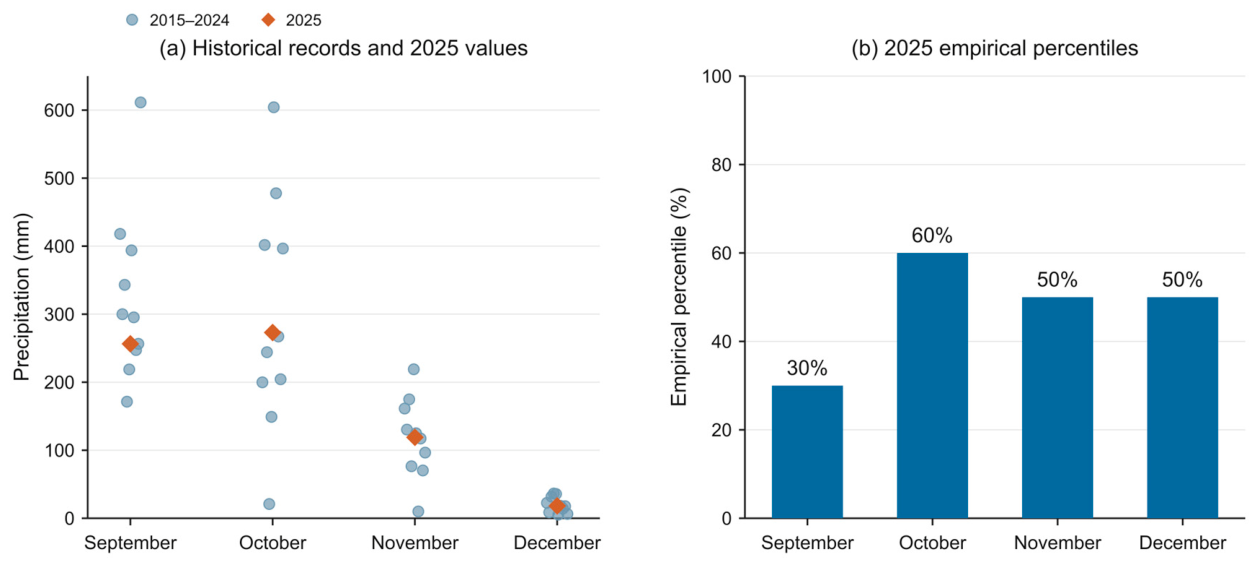
Precipitation in Changhua during September, October, November, and December 2025 was 256.42, 273.01, 118.97, and 18.16 mm, respectively. Corresponding values were 269.86, 323.87, 174.03, and 27.53 mm for Ningyuan and 281.59, 319.60, 157.46, and 28.24 mm for Lingshui. In all three catchments, December precipitation was lower than in September–November. Ningyuan and Lingshui received more precipitation than Changhua in each month.
Cumulative September–November precipitation was 648.40, 767.76, and 758.66 mm for Changhua, Ningyuan, and Lingshui, respectively. December precipitation in Figure 3 and Figure 4 is provided for context and is excluded from cumulative runoff and organic carbon export. The four-month precipitation background and three-month flux estimation period are distinguished throughout.
For Changhua during 2015–2024, mean precipitation for September, October, November, and December was 325.55, 296.56, 118.07, and 19.68 mm, respectively; corresponding medians were 297.67, 255.65, 121.07, and 17.96 mm. Units were verified for both earlier and later records, and all statistics were calculated using harmonized units.
Mean Changhua runoff depths for the same four months during 2015–2024 were 100.88, 101.23, 36.52, and 23.67 mm. These values provide historical context; the ten-year, four-month subset does not replace the complete monthly training series for 2011–2023. Calendar-month coefficients were recalculated from the training records, retaining individual coefficients greater than 1.
Figure 4.
Historical monthly precipitation in Changhua during 2015–2024 and corresponding values for 2025. (a) Individual historical records and target-year values in mm. (b) Empirical percentiles of 2025 precipitation relative to the corresponding historical calendar months.
Figure 4.
Historical monthly precipitation in Changhua during 2015–2024 and corresponding values for 2025. (a) Individual historical records and target-year values in mm. (b) Empirical percentiles of 2025 precipitation relative to the corresponding historical calendar months.
3.2. Model Performance in the 2024 Temporal Holdout
In the 12-month 2024 holdout, RMSE values for the mean, median, geometric-mean, and dual-precipitation models were 42.669, 39.544, 38.382, and 31.801 mm, respectively. Corresponding MAE values were 31.073, 28.150, 27.609, and 25.983 mm, and NSE values were 0.574, 0.634, 0.655, and 0.763 (Table A1). The dual-precipitation model reduced RMSE by 25.47%, 19.58%, and 17.15% relative to the mean, median, and geometric-mean baselines, respectively.
PBIAS values for the four models in 2024 were 21.354%, −15.313%, −19.874%, and −10.220%, respectively. The mean-coefficient model overestimated cumulative runoff, whereas the other three models underestimated it. The dual-precipitation model had the smallest absolute PBIAS. These values describe cumulative bias across the annual evaluation set and do not imply the same direction of bias in every month.
For the common 155-month training evaluation set, fitting RMSE values were 57.633, 48.009, 47.131, and 43.517 mm for the four models. The dual-precipitation model had a training NSE of 0.314, compared with 0.763 in the 2024 holdout. NSE depends on both prediction error and observed variability within the evaluation period; this difference does not demonstrate greater reliability in future years.
The fitted intercept was 15.424920 mm, and the coefficients for current- and previous-month precipitation were 0.174156 and 0.111815, respectively (Equation (5)). These parameters were retained for the 2025 estimates, which used the training-derived model and target-month precipitation inputs. Although the 2024 error was lower, the evaluation covered only 12 months and had informed earlier analyses. Assessing generalizability requires additional years that have not been used in model comparisons.
3.3. September–November 2025 Runoff Estimates
Estimated Changhua runoff depths for September, October, and November 2025 were 86.980, 91.643, and 66.671 mm, respectively, corresponding to equivalent coefficients of approximately 0.339, 0.336, and 0.560. Transferring these coefficients with catchment-specific precipitation yielded runoff depths of 91.541, 108.714, and 97.526 mm for Ningyuan and 95.521, 107.279, and 88.244 mm for Lingshui (Table 3).
Estimated cumulative September–November runoff volumes were 1.3724 × 10⁹, 3.440 × 10⁸, and 3.681 × 10⁸ m³ for Changhua, Ningyuan, and Lingshui, respectively. Changhua’s larger volume reflects its larger drainage area. Differences in monthly runoff depth between the target catchments arise from their precipitation inputs combined with the shared equivalent coefficient. Because measured discharge is unavailable for Ningyuan and Lingshui, these transferred estimates lack independent verification.
3.4. Descriptive Water-Quality Statistics and Data Checks
Across the nine catchment-by-survey groups, mean DOC concentrations ranged from 1.495 to 2.340 mg L⁻¹, and the 26 blank-corrected bottle concentrations ranged from 1.348 to 2.785 mg L⁻¹. Mean POC concentrations ranged from 0.320 to 1.468 mg L⁻¹. The T3 POC means were 0.321, 0.394, and 1.468 mg L⁻¹ for the three rivers, each with n = 3. Mean SSC ranged from 11.781 to 82.954 mg L⁻¹, and mean pH ranged from 7.027 to 8.380.
Mean DOC concentrations in Changhua during T1, T2, and T3 were 2.208, 2.275, and 1.558 mg L⁻¹, respectively. Corresponding means were 2.248, 2.340, and 1.778 mg L⁻¹ in Ningyuan and 1.941, 1.908, and 1.495 mg L⁻¹ in Lingshui. Decreases from T1 to T3 were 29.4%, 20.9%, and 23.0%, respectively. These values describe differences among survey dates and are not directly attributed to dilution or changes in leaching.
The descriptive CVs of the three survey means were 19.66%, 14.20%, and 13.97% for DOC in Changhua, Ningyuan, and Lingshui, respectively. Within-survey bottle CVs, where calculable, ranged from 7.70% to 29.33%. These statistics describe variability at different sampling levels; they do not establish DOC stability or show that the observed changes exceed complete methodological uncertainty.
Mean SSC decreased from 28.619 mg L⁻¹ in T1 to 11.781 mg L⁻¹ in T3 in Changhua and from 49.174 to 16.137 mg L⁻¹ in Ningyuan, but increased from 27.792 to 82.954 mg L⁻¹ in Lingshui. T3 included 4, 3, and 4 SSC records for the three rivers and two pH records per river. T3 mean pH values for Ningyuan and Lingshui were recalculated from bottle-level measurements as 8.035 and 7.555, rather than adopting the rounded summaries of 8.04 and 7.55. Mean pH increased across successive surveys in all three rivers; no significance tests were performed.
Figure 5.
Water-quality observations from the three surveys. Points denote valid field-bottle records, and horizontal marks indicate group means. The T3 DOC blank was 0.392 mg L⁻¹. Each valid T3 POC record was corrected by subtracting 43.19 μg of carbon; Ningyuan records correspond to worksheet rows 5, 7, and 9, with three bottles per river. Lingshui DOC in T1 has only one valid record.
3.5. Conditional September–November 2025 Organic Carbon Fluxes
Using the concentration aggregation and runoff-volume conversions described in Section 2.7, estimated cumulative DOC export for September–November 2025 was 2763.373, 730.024, and 655.773 t C for Changhua, Ningyuan, and Lingshui, respectively. Corresponding POC exports were 571.135, 201.645, and 441.045 t C (Table 5). The reporting period and units are consistent between the table and abstract.
Under the shared assumptions, Changhua had the largest estimated DOC and POC exports. Estimated POC export from Lingshui exceeded that from Ningyuan because of its higher representative POC concentration. These differences depend jointly on drainage area, precipitation, modeled runoff volume, and concentration inputs; they do not establish statistically significant differences in actual riverine export.
The estimates use equally weighted survey mean concentrations rather than monthly flow-weighted concentrations. Because no concentrations were measured in September, that month’s estimated export depends particularly on the representativeness assumption. December and other months are excluded, and the estimates are not extrapolated to annual export.
Table 6 summarizes quantifiable components and evidence gaps. It neither provides comparable flux uncertainty intervals nor ranks the contributions of the uncertainty sources.
4. Discussion
4.1. Model Comparison and Antecedent Precipitation
The dual-precipitation model outperformed the three calendar-month coefficient baselines in terms of 2024 RMSE, MAE, and absolute PBIAS. Unlike a single calendar-month statistic, it represents variation in runoff depth using both current- and previous-month precipitation. However, the comparison did not include an otherwise equivalent regression using current-month precipitation alone. The improvement cannot therefore be attributed entirely to the lagged term, nor does it identify groundwater recharge or reservoir regulation mechanisms.
After harmonization of units and catchment area, prediction errors can be expressed in physical units of runoff depth. Nevertheless, the lack of daily record quality information and independent discharge observations in the target catchments precludes full validation of hydrological applicability. Precipitation representativeness, groundwater, storage, and regulation may influence performance, but the errors cannot be assigned directly to unobserved processes.
The mean, median, and geometric-mean models can yield markedly different coefficients in low-precipitation months when runoff depth is decoupled from contemporaneous rainfall. Logarithmic aggregation reduces the relative influence of large positive coefficients in the geometric mean. Its 2024 RMSE was lower than those of the arithmetic-mean and median models, although its negative bias remained substantial. Differences in prediction error do not substitute for checks of extreme historical months and data quality.
4.2. A Single Donor Catchment and Spatial Transfer Limitations
Changhua equivalent runoff coefficients were transferred to Ningyuan and Lingshui using their catchment-specific drainage areas and precipitation. Similarities in climate, latitude, and vegetation provide a qualitative rationale for donor selection, but catchment similarity and coefficient transferability require quantitative testing. Regionalization studies emphasize donor selection, catchment attributes, and spatial validation [24,25].
Catchment-specific precipitation accounts for spatial differences in the 2025 inputs but not for differences in infiltration, evapotranspiration, storage, reservoirs, or abstraction. Approximating the area upstream of a sampling section with the whole drainage area directly affects estimated runoff volume and carbon export. Future work should verify section locations and evaluate this assumption against measured discharge in the target catchments.
Because both target catchments use coefficients derived from the Changhua model, their errors may be correlated. Estimates for three rivers do not constitute independent validation, and averaging them cannot remove shared parameter bias. Cross-catchment comparisons are therefore conditional on the common assumptions.
Differences in reservoir operation, water abstraction, soils, and land cover require local evidence. Previous work demonstrates that engineering regulation can affect carbon transport [33], but findings from Yellow River regulation cannot justify numerical corrections for Ningyuan or Lingshui.
4.3. Interpretation of Concentration Records and Quality Checks
T3 mean POC concentrations were 0.321, 0.394, and 1.468 mg L⁻¹ in Changhua, Ningyuan, and Lingshui, respectively. The higher concentration in Lingshui is consistent with its greater estimated POC export. However, the available sample sizes and measured variables cannot distinguish erosion, resuspension, or changes in particle sources. The concentration differences cannot therefore be attributed directly to a specific transport mechanism.
Storms can concentrate particulate carbon transport in tropical rivers [7,19], supporting the need for future event monitoring. However, the three surveys conducted here, without continuous discharge and concentration records, cannot establish whether local particulate export was missed or quantify any resulting underestimation.
POC and SSC can be compared only within a given catchment and survey. Group means derived from different filtration procedures and bottle counts are not strictly paired bottle-level observations. Although the POC records were harmonized, bottle-level pairing with SSC and evidence of particle sources are unavailable. Group means therefore cannot establish particle sources or bottle-level particulate carbon mass fractions.
Suspended matter may include aquatic autochthonous particles, soil-derived material, and particles stored in the riverbed. Without chlorophyll a, C/N ratios, or isotopic evidence, the dominant source cannot be identified.
All T3 mean DOC concentrations were lower than their T1 counterparts, whereas T2 means in Changhua and Ningyuan were slightly higher than T1 means. Bottle-level CV reached 29.33%. Harmonizing blanks and field-bottle definitions does not permit these changes to be attributed to groundwater inputs, rainfall dilution, leaching, or in-channel degradation. Testing these mechanisms requires simultaneous discharge measurements and source indicators [13,14].
DOC batch blanks affect survey means and, when multiplied by runoff volume, flux estimates. Consistent correction procedures are therefore necessary for comparisons among rivers. The T1, T2, and T3 blanks were 0.449, 0.285, and 0.392 mg L⁻¹, respectively. Blank correction, bottle-level dispersion, and temporal representativeness are distinct sources of error and must be assessed separately.
Similar DOC concentrations do not imply similar fluxes because cumulative export also depends on runoff volume. Changhua’s greater estimated DOC export reflects the combined effects of runoff volume and concentration, rather than concentration rankings alone. These conditional estimates do not establish the actual ranking of estuarine exports.
Previous studies in Changhua and Wanquan covered different seasons or events and incorporated hydrological information [19,20]. The three surveys reported here cannot validate or refute their process-level conclusions. Regional comparisons require consistent filtration thresholds, concentration units, and temporal coverage.
4.4. Value and Scope of Conditional Flux Estimation
This study combines a testable historical runoff model with short-term water-quality observations to produce flux estimates that can be updated using explicit calculation rules for a defined period. Beyond concentration measurements, the calculation incorporates catchment-specific precipitation and drainage area into runoff-volume estimates. It provides preliminary magnitudes and conditional comparisons for data-limited catchments while identifying priorities for additional observations.
Data quality must be distinguished from probabilistic uncertainty. Complete carbon budgets require representative discharge and concentration observations [34]. Resolving unit inconsistencies does not resolve model error or limitations in temporal representativeness.
Flux is linearly proportional to concentration and runoff volume. With one input held constant, a relative change in the other produces an equal relative change in flux; changes in both inputs also introduce a product term. This relationship is algebraic and does not constitute an observation-based confidence interval. Arbitrary input ranges cannot replace uncertainty estimates supported by independent data.
Gridded precipitation, monthly hydrological summaries, and water-quality tables each support a different level of inference. They do not resolve sampling-day hydrological conditions, event responses, annual carbon budgets, or carbon sources.
The study compares simplified models over a common training period and explicitly links their runoff estimates to organic carbon export under transparent assumptions about catchment transfer and concentration aggregation. Its scope is short-term conditional estimation at monthly resolution using a single donor catchment. It neither develops satellite retrieval algorithms for DOC or POC nor establishes complete annual carbon budgets.
Further evaluation requires additional years not used in model comparisons, independent discharge observations in the target catchments, and simultaneous measurements of event hydrology and carbon concentrations. These observations would help distinguish temporal parameter stability, spatial transferability, and concentration sampling error. Similar trends generated by shared parameters across the three rivers do not constitute successful validation.
4.5. Monitoring Priorities and Study Limitations
The immediate monitoring priorities are independent discharge observations, event-scale concentration measurements, and quantitative QC records. Harmonizing water-quality data sources and blank calculations supports descriptive statistics for the survey periods, but these data remain insufficient for complete monthly or annual carbon budgets.
Field-bottle relationships, batch blanks, and the principal DOC and POC processing procedures have been specified. DOC filtrates were stored below 4 °C in the dark and analyzed within 24 h of filtration. POC was combusted at 1100 °C using the HT 1300 solid module. Detection-limit and recovery records are unavailable; bottle-level CV therefore does not quantify complete analytical uncertainty.
Continuous water-level records do not directly provide discharge. Rating curves should span low, medium, and high stages and be reassessed after channel changes. Given the safety risks of manual discharge measurements during typhoons, pressure-based water-level loggers, noncontact radar, bank-based image velocimetry, and automatic samplers may be used in combination. Event sampling should be triggered by water level and its rate of rise rather than accumulated rainfall alone, because antecedent conditions can produce different runoff responses to the same rainfall. Redundant loggers or telemetry alerts can reduce data gaps caused by equipment or power failure.
Monitoring should prioritize coverage of different flow conditions rather than simply increasing fixed-date sampling frequency. At least one complete hydrological year should be monitored, with automatic sampling or frequent surveys during the typhoon season where safe. Event measurements should include rainfall, discharge, SSC, POC, DOC, and field QC to assess particulate erosion and dissolved-component flow-path responses separately. Event-scale responses and mechanisms underlying concentration stability should be tested only when simultaneous concentration–discharge observations cover a sufficient flow range.
Under limited resources, stratified monitoring can combine fixed monthly surveys for seasonal continuity, intensified automatic sampling during heavy rainfall, and continuous low-cost measurements of turbidity and conductivity. More costly dissolved organic matter (DOM) spectroscopy or isotope analyses can be restricted to representative event subsets. This approach separates sampling frequency from analytical cost, improving coverage of unevenly distributed loads while retaining source information. All sensor proxies require calibration and validation against independent field samples; randomly dividing observations from the same event can overestimate predictive performance.
The principal limitations are the lack of independent checks on daily discharge completeness; approximate matching of drainage areas between the hydrological station and sampling sections; no independent discharge observations for Ningyuan or Lingshui and no measured 2025 runoff for any of the three rivers; only three October–November concentration surveys, whose mean was also applied to September; incomplete detection-limit, recovery, and spatial-processing records; and a 2024 evaluation limited to 12 months that had informed earlier analyses.
These limitations do not imply a uniform direction of bias. Approximate contributing areas, precipitation representativeness, record selection, and blank correction affect different calculation steps. The estimates cannot be characterized collectively as conservative, and unconstrained scenario ranges do not support a ranking of uncertainty contributions.
The three coefficient baselines used 156 monthly records from 2011–2023 to derive calendar-month statistics. The dual-precipitation model used 155 records with complete lagged inputs. All models were evaluated over the common 155-month training set and the 12-month 2024 holdout. This design evaluates temporal prediction in Changhua but does not validate spatial transfer to the two target catchments.
The estimates represent organic carbon passing the representative sampling sections during the target period, with whole-catchment areas used to approximate contributing areas. They exclude riverine CO₂ evasion, in-channel DOC degradation, POC settling, and coastal burial and therefore do not constitute catchment carbon balances or estimates of permanent marine burial. Assessing carbon-sink effects additionally requires information on gas exchange, particle sources, and coastal preservation.
Sampling and monthly summary data are neither publicly released nor available on request. The manuscript provides summary statistics and calculation methods, while the map shows approximate sampling locations without precise coordinates or specific station names.
Future monitoring should measure discharge and concentration simultaneously at the same sections and document missing values, gap filling, blank corrections, and valid sample selection to establish independently verifiable time series. Existing parameters and summaries can support updated estimates but cannot replace missing original records.
The conclusions are limited to temporal holdout performance of the four models, conditional September–November runoff volumes and DOC and POC fluxes, and descriptive water-quality observations from the three surveys. Each level of evidence is interpreted separately; December values in the background figures and other historical periods are excluded from flux conclusions.
Uncertainty at each calculation step should be updated as independent observations become available. Numerical precision is retained to permit arithmetic checks, but interpretation should reflect observational coverage and model applicability rather than the number of decimal places.
5. Conclusions
(1) Using Changhua records from 2011–2023 for fitting and all 12 months of 2024 for evaluation, the mean, median, geometric-mean, and dual-precipitation models yielded RMSE values of 42.669, 39.544, 38.382, and 31.801 mm, respectively. The dual-precipitation model had the lowest error, with NSE = 0.763 and PBIAS = −10.220%, and was used for conditional estimation during the target period.
(2) Applying the fixed 2011–2023 parameters to 2025 precipitation yielded an estimated cumulative September–November runoff volume of 1.3724 × 10⁹ m³ for Changhua. Transferring its monthly equivalent coefficients with catchment-specific precipitation and drainage area yielded volumes of 3.440 × 10⁸ and 3.681 × 10⁸ m³ for Ningyuan and Lingshui, respectively. The target-catchment estimates lack independent discharge validation.
(3) The nine DOC group means ranged from 1.495 to 2.340 mg L⁻¹, with decreases of 20.9%–29.4% from T1 to T3. T3 mean DOC concentrations were 1.558, 1.778, and 1.495 mg L⁻¹ for the three rivers. The nine POC group means ranged from 0.320 to 1.468 mg L⁻¹; corresponding T3 means were 0.321, 0.394, and 1.468 mg L⁻¹, each based on three bottles. Counts and SDs for SSC, pH, and carbon concentrations were calculated from valid bottle measurements, without inferring population-level significance or source mechanisms.
(4) Using equally weighted means from the three surveys, estimated cumulative DOC export for September–November 2025 was 2763.373, 730.024, and 655.773 t C for Changhua, Ningyuan, and Lingshui, respectively; corresponding POC export was 571.135, 201.645, and 441.045 t C. Catchment hydrological similarity and temporal concentration representativeness constrain these estimates, which cannot be extrapolated to annual export or carbon-sink effects.
Author Contributions
Conceptualization, P.S. and Y.Z.; methodology, W.Y. and L.G.; investigation, T.L. and X.B.; writing—original draft preparation, M.D.and G.S.; writing—review and editing, M.D.; supervision, L.G. All authors have read and agreed to the published version of the manuscript.
Funding
This research was supported by the Project of Sanya Yazhou Bay Science and Technology City (No. SKJC-JYRC-2024-07), Key Research and Development Project of Hainan Province (No. ZDYF2026GXJS025), Guangzhou City Supplementary Project for Basic and Applied Basic Research (No. 2025MGMS-HBZ-009), National Natural Science Foundation of China (Grant No. 42576253), Geological Investigation Programs of China Geological Survey (Grant No. DD202603303202) .
Data Availability Statement
The original contributions presented in this study are included in the article. Further inquiries can be directed to the corresponding authors.
Acknowledgments
The authors acknowledge data support from the National Earth System Science Data Center (https://www.geodata.cn).
Conflicts of Interest
The authors declare no conflict of interest.
References
- Liu, M.; Raymond, P.A.; Lauerwald, R.; Zhang, Q.; Trapp-Müller, G.; Davis, K.L.; et al. Global riverine land-to-ocean carbon export constrained by observations and multi-model assessment. Nat. Geosci. 2024, 17, 896–904. [Google Scholar] [CrossRef]
- Battin, T.J.; Lauerwald, R.; Bernhardt, E.S.; Bertuzzo, E.; Gener, L.G.; Hall, R.O.; et al. River ecosystem metabolism and carbon biogeochemistry in a changing world. Nature 2023, 613, 449–459. [Google Scholar] [CrossRef]
- Regnier, P.; Resplandy, L.; Najjar, R.G.; Ciais, P. The land-to-ocean loops of the global carbon cycle. Nature 2022, 603, 401–410. [Google Scholar] [CrossRef]
- Lyons, W.B.; Nezat, C.A.; Carey, A.E.; Hicks, D.M. Organic carbon fluxes to the ocean from high-standing islands. Geology 2002, 30, 443–446. [Google Scholar] [CrossRef]
- Milliman, J.D.; Syvitski, J.P.M. Geomorphic/tectonic control of sediment discharge to the ocean: the importance of small mountainous rivers. J. Geol. 1992, 100, 525–544. [Google Scholar] [CrossRef]
- Tian, S.; Li, D.; Regnier, P.; Dean, J.F.; Syvitski, J.; Feng, M.; et al. Rapid changes in global river particulate organic carbon flux. Nat. Geosci. 2026, 19, 931–937. [Google Scholar] [CrossRef]
- Clark, K.E.; Stallard, R.F.; Murphy, S.F.; Scholl, M.A.; González, G.; Plante, A.F.; McDowell, W.H. Extreme rainstorms drive exceptional organic carbon export from forested humid-tropical rivers in Puerto Rico. Nat. Commun. 2022, 13, 2058. [Google Scholar] [CrossRef]
- Goldsmith, S.T.; Carey, A.E.; Lyons, W.B.; Kao, S.-J.; Lee, T.-Y.; Chen, J. Extreme storm events, landscape denudation, and carbon sequestration: Typhoon Mindulle, Choshui River, Taiwan. Geology 2008, 36, 483–486. [Google Scholar] [CrossRef]
- Hilton, R.G.; Galy, A.; Hovius, N.; Chen, M.-C.; Horng, M.-J.; Chen, H. Tropical-cyclone-driven erosion of the terrestrial biosphere from mountains. Nat. Geosci. 2008, 1, 759–762. [Google Scholar] [CrossRef]
- Repasch, M.; Scheingross, J.S.; Hovius, N.; Lupker, M.; Wittmann, H.; Haghipour, N.; et al. Fluvial organic carbon cycling regulated by sediment transit time and mineral protection. Nat. Geosci. 2021, 14, 842–848. [Google Scholar] [CrossRef]
- Moatar, F.; Abbott, B.W.; Minaudo, C.; Curie, F.; Pinay, G. Elemental properties, hydrology, and biology interact to shape concentration–discharge curves for carbon, nutrients, sediment, and major ions. Water Resour. Res. 2017, 53, 1270–1287. [Google Scholar] [CrossRef]
- Raymond, P.A.; Saiers, J.E. Event controlled DOC export from forested watersheds. Biogeochemistry 2010, 100, 197–209. [Google Scholar] [CrossRef]
- Raymond, P.A.; Saiers, J.E.; Sobczak, W.V. Hydrological and biogeochemical controls on watershed dissolved organic matter transport: pulse–shunt concept. Ecology 2016, 97, 5–16. [Google Scholar] [CrossRef]
- Wen, H.; Perdrial, J.; Abbott, B.W.; Bernal, S.; Dupas, R.; Godsey, S.E.; et al. Temperature controls production but hydrology regulates export of dissolved organic carbon at the catchment scale. Hydrol. Earth Syst. Sci. 2020, 24, 945–966. [Google Scholar] [CrossRef]
- Wu, Y.; Su, H.; Cheng, L.; Qin, S.; Zou, K.; Liu, Y.; Zhou, J.; Liu, P.; Zhang, L. Exploring hydrological controls on dissolved organic carbon export dynamics in a typical flash flood catchment using a process-based model. Sci. Total Environ. 2024, 921, 171139. [Google Scholar] [CrossRef]
- Qin, C.; Li, S.-L.; Wu, Y.; Bass, A.M.; Luo, W.; Ding, H.; Yue, F.-J.; Zhang, P. High sensitivity of dissolved organic carbon transport during hydrological events in a small subtropical karst catchment. Sci. Total Environ. 2024, 946, 174090. [Google Scholar] [CrossRef]
- Delbecq, C.; Fellman, J.B.; Bellmore, J.R.; Whitney, E.J.; Hood, E.; Fitzgerald, K.; Falke, J.A. Seasonal patterns in riverine carbon form and export from a temperate forested watershed in Southeast Alaska. Biogeochemistry 2024, 167, 1353–1369. [Google Scholar] [CrossRef]
- Li, X.; Wang, J.; Yin, W.; et al. Hydrologic regime determines catchment-scale dissolved carbon export patterns. Water Resour. Res. 2025, 61, e2024WR038221. [Google Scholar] [CrossRef]
- Wu, Y.; Bao, H.-Y.; Unger, D.; Herbeck, L.S.; Zhu, Z.-Y.; Zhang, J.; Jennerjahn, T.C. Biogeochemical behavior of organic carbon in a small tropical river and estuary, Hainan, China. Cont. Shelf Res. 2013, 57, 32–43. [Google Scholar] [CrossRef]
- Zhang, Q.; Tao, Z.; Ma, Z.; Gao, Q.; Deng, H.; Xu, P.; et al. Hydro-ecological controls on riverine organic carbon dynamics in the tropical monsoon region. Sci. Rep. 2019, 9, 11871. [Google Scholar] [CrossRef]
- Dou, S.; Liu, Y.; Wang, W.; Wang, H.; Ning, Z.; Chen, M. Spatiotemporal variation characteristics and source analysis of dissolved organic matter in Wenchang Zhuxi River Basin. Chin. J. Trop. Crops (In Chinese) 2026, 47, 1341–1354. [Google Scholar] [CrossRef]
- Yan, Y.; Lauerwald, R.; Wang, X.; Regnier, P.; Ciais, P.; Ran, L.; et al. Increasing riverine export of dissolved organic carbon from China. Glob. Chang. Biol. 2023, 29, 5014–5032. [Google Scholar] [CrossRef]
- Blöschl, G.; Sivapalan, M.; Wagener, T.; Viglione, A.; Savenije, H. (Eds.) Runoff Prediction in Ungauged Basins: Synthesis across Processes, Places and Scales; Cambridge University Press: Cambridge, UK, 2013. [Google Scholar] [CrossRef]
- Hrachowitz, M.; Savenije, H.H.G.; Blöschl, G.; McDonnell, J.J.; Sivapalan, M.; Pomeroy, J.W.; et al. A decade of Predictions in Ungauged Basins (PUB)—a review. Hydrol. Sci. J. 2013, 58, 1198–1255. [Google Scholar] [CrossRef]
- Oudin, L.; Andréassian, V.; Perrin, C.; Michel, C.; Le Moine, N. Spatial proximity, physical similarity, regression and ungaged catchments: a comparison of regionalization approaches based on 913 French catchments. Water Resour. Res. 2008, 44, W03413. [Google Scholar] [CrossRef]
- Wagener, T.; Wheater, H.S. Parameter estimation and regionalization for continuous rainfall–runoff models including uncertainty. J. Hydrol. 2006, 320, 132–154. [Google Scholar] [CrossRef]
- Kupzig, J.; Kupzig, N.; Flörke, M. Regionalization in global hydrological models and its impact on runoff simulations: a case study using WaterGAP3 (v 1.0.0). Geosci. Model Dev. 2024, 17, 6819–6846. [Google Scholar] [CrossRef]
- Yan, D.; Li, C.; Zhang, X.; Wang, J.; Feng, J.; Dong, B.; et al. A data set of global river networks and corresponding water resources zones divisions v2. Sci. Data 2022, 9, 770. [Google Scholar] [CrossRef]
- Peng, S. Chinese 1 km Monthly Precipitation Dataset, 1901–2025; National Earth System Science Data Center, 2026. Updated. 14 July 2026. (accessed on 23 September 2026). [CrossRef]
- Peng, S.; Ding, Y.; Liu, W.; Li, Z. 1 km monthly temperature and precipitation dataset for China from 1901 to 2017. Earth Syst. Sci. Data 2019, 11, 1931–1946. [Google Scholar] [CrossRef]
- Gupta, H.V.; Kling, H.; Yilmaz, K.K.; Martinez, G.F. Decomposition of the mean squared error and NSE performance criteria: implications for improving hydrological modelling. J. Hydrol. 2009, 377, 80–91. [Google Scholar] [CrossRef]
- Moriasi, D.N.; Arnold, J.G.; Van Liew, M.W.; Bingner, R.L.; Harmel, R.D.; Veith, T.L. Model evaluation guidelines for systematic quantification of accuracy in watershed simulations. Trans. ASABE 2007, 50, 885–900. [Google Scholar] [CrossRef]
- Yan, S.; Lu, T.; Wu, X.; Bi, N.; Wang, H. Mechanisms by which Yellow River water–sediment regulation affects changes in particulate organic carbon flux to the sea. Period. Ocean Univ. China (Nat. Sci.) (In Chinese) 2026, 56, 103–113. [Google Scholar] [CrossRef]
- Dean, J.F.; Battin, T.J. Future directions for river carbon biogeochemistry observations. Nat. Water 2024, 2, 219–222. [Google Scholar] [CrossRef]
Figure 1.
Study area, approximate sampling locations, and location of the hydrological station.
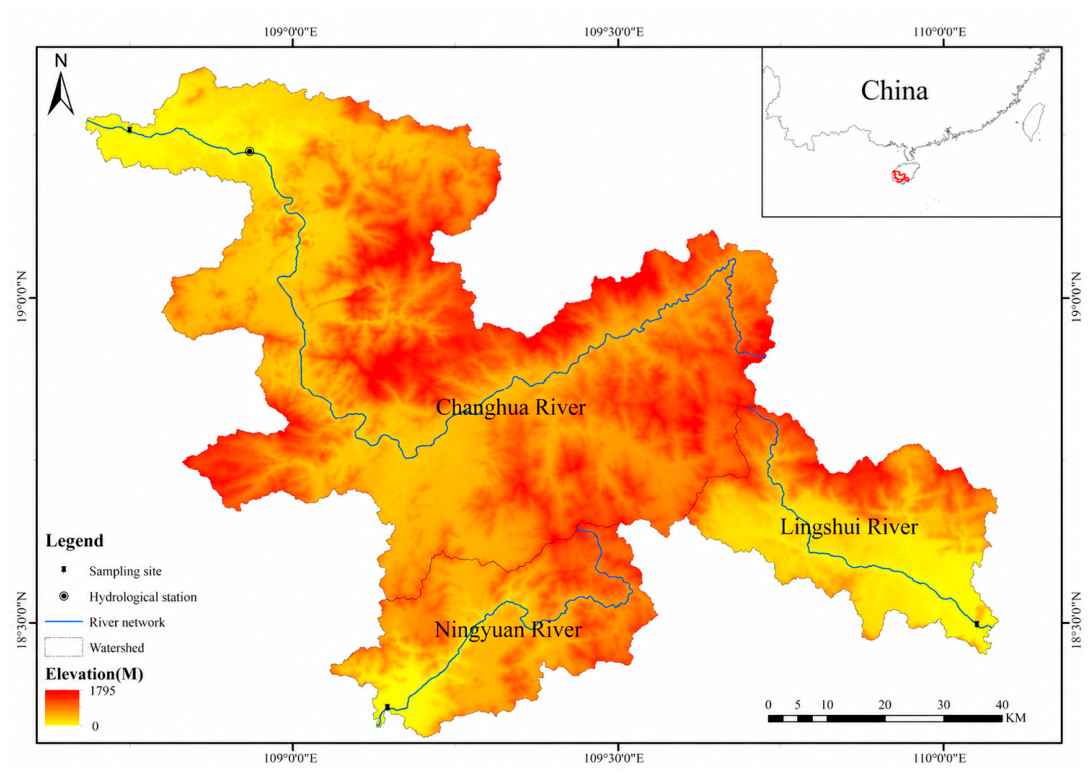
Figure 2.
Framework for monthly runoff reconstruction and conditional organic carbon flux estimation. A, B, and C denote the Changhua, Ningyuan, and Lingshui rivers, respectively.
Figure 2.
Framework for monthly runoff reconstruction and conditional organic carbon flux estimation. A, B, and C denote the Changhua, Ningyuan, and Lingshui rivers, respectively.
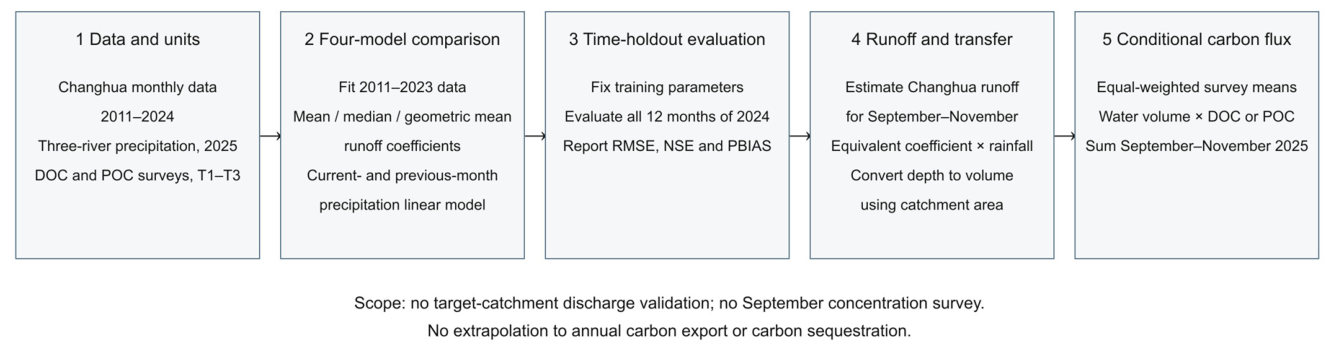
Figure 3.
September–December 2025 precipitation in the three catchments, converted from 0.1 mm to mm. T1 denotes the October survey, and T2 and T3 denote the November surveys. Monthly totals do not describe hydrological conditions on the sampling dates.
Figure 3.
September–December 2025 precipitation in the three catchments, converted from 0.1 mm to mm. T1 denotes the October survey, and T2 and T3 denote the November surveys. Monthly totals do not describe hydrological conditions on the sampling dates.
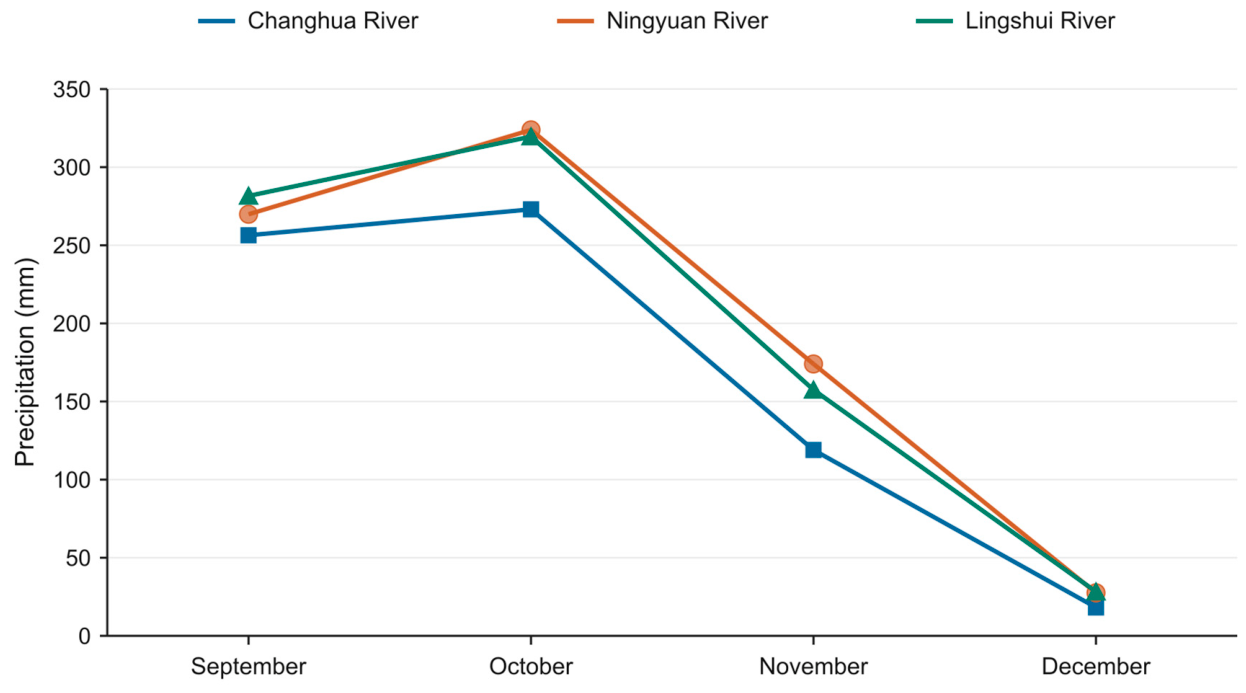
Table 2.
Data sources, temporal resolution, and catchment attributes used in this study.
| Data or attribute | A: Changhua River | B: Ningyuan River | C: Lingshui River | Source and status |
|---|---|---|---|---|
| Catchment area (km²) | 5594.841 | 1155.36 | 1264.88 | Whole-catchment area approximates the area contributing to section A; areas for B and C are taken from project records. |
| Monthly precipitation | Complete monthly series for 2011–2024; supplementary January and August–December records for 2013–2025. | January and August–December 2013–2025 | January and August–December 2013–2025 | Peng gridded data; original values × 0.1 to obtain mm; supplied by the National Earth System Science Data Center (https://www.geodata.cn) [29]. |
| Historical hydrology | January–December 2011–2024, 168 months | None | None | Within-month sums of daily mean discharge recorded at the hydrological station |
| DOC bottles, T1/T2/T3 | 3 / 3 / 3 | 3 / 4 / 3 | 1 / 3 / 3 | Recalculated from current bottle records |
| SSC bottles, T1/T2/T3 | 3 / 3 / 4 | 3 / 2 / 3 | 3 / 3 / 4 | Recalculated from current bottle records |
| pH bottles, T1/T2/T3 | 3 / 3 / 2 | 3 / 3 / 2 | 2 / 3 / 2 | Recalculated from current bottle records |
| POC counts, T1/T2/T3 | 4 / 6 /3 | 2 / 2 / 3 | 3 / 3 / 3 | Recalculated from current bottle records |
| Spatial data and imagery | Study-area map provided | Study-area map provided | Study-area map provided | GRNWRZ V2.0 level-5 boundaries; the original spatial processing was not independently verified |
Table 3.
Precipitation and estimated runoff for September–November 2025 in the three catchments. December precipitation is shown only for context in Figure 3 and Figure 4 and is excluded from cumulative runoff volumes and carbon fluxes.
| Catchment | Month | 2025 precipitation (mm) | Estimated runoff depth (mm) | Estimated runoff volume (m³) |
| Changhua River | 9 | 256.42 | 86.980 | 486,640,293 |
| Changhua River | 10 | 273.01 | 91.643 | 512,728,262 |
| Changhua River | 11 | 118.97 | 66.671 | 373,016,148 |
| Ningyuan River | 9 | 269.86 | 91.541 | 105,762,456 |
| Ningyuan River | 10 | 323.87 | 108.714 | 125,603,942 |
| Ningyuan River | 11 | 174.03 | 97.526 | 112,678,025 |
| Lingshui River | 9 | 281.59 | 95.521 | 120,822,806 |
| Lingshui River | 10 | 319.60 | 107.279 | 135,695,489 |
| Lingshui River | 11 | 157.46 | 88.244 | 111,617,599 |
Table 4.
Water-quality statistics for the three surveys, expressed as mean ± sample SD, with the valid bottle count n in parentheses. DOC, POC, and SSC are expressed in mg L⁻¹; pH is dimensionless. Missing measurements are excluded from n, and SD is not calculated for a single bottle. All T3 POC groups contain three bottles.
| Catchment | Survey | DOC (mg L⁻¹) | POC (mg L⁻¹) | SSC (mg L⁻¹) | pH | Notes |
| Changhua River | T1 | 2.208±0.536 (n=3) |
0.607±0.105 (n=4) |
28.619±4.325 (n=3) |
7.283±0.032 (n=3) |
Bottle-level statistics |
| Changhua River | T2 | 2.275±0.443 (n=3) |
0.320±0.003 (n=2) |
13.579±2.298 (n=3) |
7.800±0.120 (n=3) |
Bottle-level statistics |
| Changhua River | T3 | 1.558±0.313 (n=3) |
0.321±0.051 (n=3) |
11.781±1.770 (n=4) |
8.380±0.354 (n=2) |
Bottle-level statistics |
| Ningyuan River | T1 | 2.248±0.405 (n=3) |
0.970±0.308 (n=6) |
49.174±11.266 (n=3) |
7.027±0.064 (n=3) |
Bottle-level statistics |
| Ningyuan River | T2 | 2.340±0.290 (n=4) |
0.394±0.049 (n=2) |
16.019±3.442 (n=2) |
7.600±0.218 (n=3) |
Bottle-level statistics |
| Ningyuan River | T3 | 1.778±0.521 (n=3) |
0.394±0.009 (n=3) |
16.137±3.705 (n=3) |
8.035±0.276 (n=2) |
Bottle-level statistics |
| Lingshui River | T1 | 1.941 (n=1) |
1.030±0.047 (n=3) |
27.792±3.542 (n=3) |
7.055±0.177 (n=2) |
One valid DOC bottle; SD not estimated |
| Lingshui River | T2 | 1.908±0.197 (n=3) |
1.097±0.054 (n=3) |
33.918±2.096 (n=3) |
7.300±0.100 (n=3) |
Bottle-level statistics |
| Lingshui River | T3 | 1.495±0.115 (n=3) |
1.468±0.303 (n=3) |
82.954±14.654 (n=4) |
7.555±0.021 (n=2) |
Bottle-level statistics |
Table 5.
Conditional estimates of cumulative DOC and POC export for September–November 2025 (t C), using the equally weighted mean concentration from three surveys for each river.
Table 5.
Conditional estimates of cumulative DOC and POC export for September–November 2025 (t C), using the equally weighted mean concentration from three surveys for each river.
| Catchment | DOC export (t C) | POC export (t C) | Scope and interpretation |
| Changhua River | 2763.373 | 571.135 | Screening estimate for September–November 2025 |
| Ningyuan River | 730.024 | 201.645 | Estimate transferred using Changhua equivalent runoff coefficients |
| Lingshui River | 655.773 | 441.045 | Estimate transferred using Changhua equivalent runoff coefficients |
Table 6.
Quantifiable components and evidence gaps for four sources of uncertainty.
| Uncertainty source | Quantifiable component in this study | Additional evidence required |
| Changhua prediction | Fitting error over the 155-month training set and holdout error for the 12 months of 2024 | Daily record quality, differences between sections, and additional years not used in the analysis |
| Ningyuan/Lingshui transfer | Catchment-specific precipitation and runoff volumes estimated using transferred equivalent coefficients | Independent target-catchment discharge and quantitative similarity tests |
| Concentration measurement | Bottle-level SD for DOC, SSC, and pH, and bottle-level POC statistics | Quantitative QC records and complete analytical uncertainty |
| Temporal representativeness | Three survey windows in 2025 | Simultaneous discharge observations, event coverage, and monthly concentration representativeness |
Disclaimer/Publisher’s Note: The statements, opinions and data contained in all publications are solely those of the individual author(s) and contributor(s) and not of MDPI and/or the editor(s). MDPI and/or the editor(s) disclaim responsibility for any injury to people or property resulting from any ideas, methods, instructions or products referred to in the content. |
© 2026 by the authors. Licensee MDPI, Basel, Switzerland. This article is an open access article distributed under the terms and conditions of the Creative Commons Attribution (CC BY) license (http://creativecommons.org/licenses/by/4.0/).
Copyright: This open access article is published under a Creative Commons CC BY 4.0 license, which permit the free download, distribution, and reuse, provided that the author and preprint are cited in any reuse.