

Submitted:
14 October 2026
Posted:
14 October 2026
You are already at the latest version
Abstract
Background/Objectives: Long-term evidence on microbiome-targeted nutraceuticals in inflammatory bowel disease (IBD) is limited; we evaluated two regimens over 12 months. Methods: In this single-center, double-blind, nonrandomized, two-arm pilot trial, patients with ulcerative colitis (UC) or Crohn’s disease (CD) on stable standard-of-care therapy received fructooligosaccharides, galactooligosaccharides, yeast β-glucan, and minerals, alone (Suppl) or with silymarin (Suppl Plus), and were assessed at baseline, 6, and 12 months. The primary outcome was remission or mild activity at 12 months (UC, Mayo endoscopic subscore; CD, Simple Endoscopic Score for Crohn’s Disease). Secondary outcomes included fecal calprotectin, C-reactive protein (CRP), 16S rRNA gene profiles, and fecal nuclear magnetic resonance metabolomics. Registration: Brazilian Registry of Clinical Trials, RBR-7hvd26h. Results: Of 87 participants enrolled, 75 completed follow-up (UC, n=50; CD, n=25); four died. In UC, remission or mild activity increased from 44.0% to 82.0% (p<0.001), and median calprotectin declined from 406 to 286 µg/g (p=0.046); CRP was unchanged. In CD, it remained 88.0% (p=1.000), without calprotectin change (p=0.968). Remission did not differ between arms (UC, p=1.000; CD, p=0.593). Among completers, gastrointestinal adverse effects were self-limited; flatulence increased from 2.7% to 16.0% (p=0.009). Genus-level α-diversity increased, and Dorea and Blautia were enriched in UC at 6 months; community structure did not differ between arms. In UC, fecal xanthine (+139%), 4-pyridoxate (+130%), and nicotinate (+105%) increased. Conclusions: In this nonrandomized, single-center pilot without placebo, 12-month supplementation was associated with increased remission and reduced fecal calprotectin in UC; silymarin conferred no significant advantage. Randomized, placebo-controlled, multicenter trials are warranted.
Keywords:
inflammatory bowel disease
; ulcerative colitis
; Crohn’s disease
; prebiotics
; silymarin
; gastrointestinal microbiome
; 16S rRNA sequencing
; metabolomics
; fecal calprotectin
; clinical trial
1. Introduction
Inflammatory Bowel Disease (IBD), encompassing Ulcerative Colitis (UC) and Crohn’s Disease (CD), is a chronic relapsing disorder of the gastrointestinal tract driven by a complex interplay between genetic susceptibility, dysregulated immunity, and an altered intestinal microbiota. Over the past decade, abundant evidence has underscored the central role of the gut microbiota in initiating and perpetuating intestinal inflammation, through loss of beneficial taxa, reduced microbial diversity, and disruption of metabolite-mediated mucosal homeostasis [1,2]. This recognition has spurred interest in therapies that restore eubiosis and immune balance by targeting the microbiome.
Among emerging strategies, nutritional modulation of the microbiota has gained prominence. Prebiotic fibers such as fructooligosaccharides (FOS) and galactooligosaccharides (GOS) selectively stimulate growth of commensal genera like Bifidobacterium and Lactobacillus, thereby enhancing production of short-chain fatty acids (SCFAs) – notably butyrate, a key metabolite that fortifies epithelial integrity, induces regulatory T-cells (Tregs), and exerts anti-inflammatory effects [3,4,5]. In parallel, yeast-derived -glucans activate innate immune pathways via pattern recognition receptors (e.g., Dectin-1, toll-like receptor 1 [TLR-1]), leading to “trained” macrophage responses and increased mucosal interleukin-22 (IL-22) production – a cytokine crucial for epithelial repair and homeostasis [6,7]. These complementary mechanisms suggest that combining prebiotics and -glucans could synergistically reinforce intestinal barrier function and immune regulation in IBD.
Preclinical studies indeed have demonstrated that such combinations (prebiotics + -glucan) exert synergistic effects, improving gut histology, metabolic homeostasis, and reducing inflammatory and oxidative markers [8,9]. Further enhancement has been observed with the addition of silymarin – a flavonolignan from Silybum marianum known for antioxidant and hepatoprotective properties – which in experimental models modulated mitochondrial regulators (e.g., peroxisome proliferator-activated receptor gamma coactivator 1-alpha [PGC-1]), suppressed pro-inflammatory cytokines (interleukin-6 [IL-6] and tumor necrosis factor-alpha [TNF-]), and upregulated the anti-inflammatory interleukin-10 (IL-10) [6,10]. These findings support a rationale for an integrative nutraceutical approach combining fermentable fibers and immunomodulatory botanicals to restore gut health in IBD.
However, despite these mechanistic insights, long-term clinical trials evaluating nutraceutical interventions in IBD – especially with integrated clinical, microbiological, and metabolomic outcomes – remain scarce. Notably, a recent randomized trial in overweight adults reported that a similar multi-component nutraceutical regimen led to reduced systemic inflammation, improvements in metabolic and anthropometric parameters, better sleep quality, and a significant increase in Faecalibacterium prausnitzii (a butyrate-producing bacterium inversely associated with disease activity) [11]. Furthermore, such interventions have been associated with a decreased abundance of Proteobacteria (including Escherichia coli), concomitant with a rebalanced hypothalamic–pituitary–adrenal axis and normalization of cortisol/cytokine levels [10,12,13]. These preliminary clinical findings suggest that microbiome-focused nutraceuticals can favorably modulate inflammation and gut microbiota composition in humans. What remains unknown, and is the focus of our study, is whether sustained nutraceutical supplementation can drive clinical status such as remission or mild activity in IBD over an extended period, and how such clinical outcomes correlate with shifts in the gut microbiome and metabolic profile.
1.1. Study Objectives and Interventions
This 12-month prospective double-blind pilot study evaluated the effects of two nutraceutical formulations on disease activity, gut microbiota composition, and fecal metabolomic profiles in patients with UC and CD.
All participants were already using prebiotic supplementation as part of their disease management prior to study enrollment. Upon enrollment, their existing prebiotic regimen was discontinued and replaced with one of two standardized study formulations: (1) a base formulation containing prebiotic fibers (FOS and GOS), yeast -glucans, and minerals [designated as Suppl group], or (2) the same base formulation augmented with silymarin [designated as Suppl Plus group]. The assigned formulations were administered as daily adjunctive therapy specifically aimed at gut microbiota modulation, and participants took them continuously for the entire study duration.
All participants maintained their standard-of-care anti-inflammatory therapy at stable regimens throughout the 12-month follow-up period. To ensure blinding, both nutraceutical formulations were provided in identical capsules, with allocation concealed from participants and study personnel until completion of all analyses.
The primary objective was to assess changes in clinical/endoscopic disease activity status (remission or mild activity) at 12 months. Secondary objectives included evaluation of fecal inflammatory biomarkers (calprotectin), systemic inflammation (C-reactive protein), gut microbiome diversity and composition (16S rRNA sequencing), and fecal metabolomic profiles (proton nuclear magnetic resonance [1H NMR] spectroscopy) at baseline (T0), 6 months (T180), and 12 months (T365). The study design allowed for comprehensive assessment of the relationship between clinical outcomes and microbiome-metabolome changes over the intervention period.
2. Materials and Methods
2.1. Ethics Statement
This study was conducted under a research protocol approved by the Research Ethics Committee of the Federal University of Alagoas (CEP/UFAL; Certificate of Presentation for Ethical Appreciation [CAAE] 86504518.1.0000.5013), originally submitted in 2018 to evaluate fecal microbiota transplantation in IBD. An amendment to this protocol, whose objective is to evaluate the adjunct effect of a supplement in patients with IBD under treatment, was submitted to CEP/UFAL on 23 August 2023 and approved on 3 October 2023 (opinion no. 6.341.456); the protocol was later amended for a subsequent phase of the research program, and its current version (version 5) was approved under opinion no. 8.245.338 on 26 February 2026. The study was conducted in accordance with the Declaration of Helsinki and national regulations (National Health Council [CNS] Resolution 466/12). All participants provided written informed consent before enrollment. The trial was registered in the Brazilian Registry of Clinical Trials (ReBEC) under registration number RBR-7hvd26h (https://ensaiosclinicos.gov.br/rg/RBR-7hvd26h), with Universal Trial Number UTN U1111-1338-7521 (date of registration: 30 April 2026).
The supplementation phase, which started in October 2023 (Section 2.2), was conducted under an amendment to this protocol. Because the protocol had already been approved by CEP/UFAL and the supplement was not considered a medicinal product, the investigators chose not to submit a new protocol or to register the trial prospectively, given the additional time and cost this would have entailed; the trial was registered retrospectively in ReBEC on 30 April 2026, after completion of follow-up. The registry entry, completed after the study, differs from this report in the following respects: (i) for UC, the registry describes the primary outcome as a Mayo score lower than 2, whereas the analysis used the Mayo endoscopic subscore () (Section 2.7); (ii) seven exclusion criteria listed in the registry for the overall research program (gastrointestinal surgery in the previous 6 months, severe anemia, chronic obstructive pulmonary disease, life expectancy of less than 3 months, sleep apnea, American Society of Anesthesiologists score of 3 or more, and inability to undergo endoscopy or colonoscopy) are not among the eligibility criteria reported in Section 2.2, although endoscopic scores for the baseline and 12-month assessments are available for all participants (see Section 2.7 for the timing of these examinations); (iii) the Inflammatory Bowel Disease Questionnaire (IBDQ), listed in the registry with assessments before the intervention and at 6 and 12 months, was administered at the three time points but is not reported, because baseline scores in the systemic or social domain exceeded 35 points, the maximum of these five-item domains, in 35 of the 75 participants, indicating a scoring inconsistency that has not been resolved; and (iv) of the inflammatory markers listed in the registry, C-reactive protein (CRP) and fecal calprotectin are reported, no IL-22 data are available, and TNF- (data available at 12 months only) and IL-10 (5.0 pg/mL, the lowest recorded value, in most samples) were not analyzed; IL-6 (data available at baseline and 6 months; not listed in the registry) was not analyzed either. A consolidated version of the study protocol is provided in the original language (Portuguese; File S1) and in English translation (File S2).
2.2. Study Design and Participants
This was a 12-month, single-center, double-blind, nonrandomized, two-arm pilot trial in patients with inflammatory bowel disease (IBD). Eighty-seven participants were enrolled from the gastroenterology outpatient clinic at a tertiary referral center. Recruitment began in October 2023, after the protocol amendment was approved on 3 October 2023; supplementation started between 16 and 25 October 2023, and the 12-month follow-up ended in October 2024. Two enrolled participants could not be contacted to collect the supplement and did not start the intervention. Of the 85 participants who started supplementation (Suppl, ; Suppl Plus, ), 10 were not included in the analysis: four died during the study (Section 3.14), two asked to withdraw because they could not attend the study visits, two stopped taking the supplement (one of them because of abdominal bloating attributed to it; Section 3.14), one was lost to follow-up, and one was not analyzed because of fecal microbiota transplantation. The final sample comprised 75 participants who completed the 12-month protocol (ulcerative colitis [UC], ; Crohn’s disease [CD], ). One participant with CD (Suppl Plus) was 17 years old at enrollment, below the prespecified minimum age of 18 years; this participant signed a written document agreeing to take part in the study and was retained in the analyses. Participants who were already using prebiotic supplements as part of their routine care were enrolled and their existing prebiotic regimen was replaced with one of two standardized study formulations: Suppl (prebiotic formulation alone) or Suppl Plus (prebiotic formulation plus silymarin). Allocation was performed sequentially based on order of enrollment. The present report concerns the nonrandomized supplementation phase (Suppl vs Suppl Plus) of a broader registered research program on microbiota modulation in IBD (ReBEC RBR-7hvd26h), which also includes a fecal microbiota transplantation phase and a subsequent randomized, placebo-controlled phase reported separately; this accounts for the program-level scope reflected in the public registry entry. The arm sizes analyzed here (Suppl, [UC 24; CD 13]; Suppl Plus, [UC 26; CD 12]) differ by one participant with UC from the allocation listed in the registry entry (Suppl, [UC 23; CD 13]; Suppl Plus, [UC 27; CD 12]); the analyses use the allocation recorded in the study database. Six participants (UC, ; CD, ) had received fecal microbiota transplantation before enrollment, five of them in the Suppl Plus arm. The flow of participants through enrollment, allocation, follow-up and analysis is summarized in Figure 1. A completed TREND (Transparent Reporting of Evaluations with Nonrandomized Designs) checklist is provided in Table S1 [14].
To maintain blinding, both formulations, supplied by Efeom Nutrition S.A., were provided in identical capsules (400 mg each) with matching appearance and packaging. The planned dose was four 400-mg capsules per day; 68 participants took four capsules daily, four took three, and three took two; the reasons for the lower doses are not available, and all participants were analyzed in their allocated arm. The supplements were identified only by lot numbers on the containers (lots 409994, 413101, 417737, 421572, 421767, 410333, 412992, 418413, 421486, and 422093), with participants and all study personnel blinded to which lots contained the base formulation versus the silymarin-enhanced formulation. Throughout the data collection period, clinical assessments, and laboratory analyses, all involved parties knew only the lot numbers. The allocation code linking lot numbers to intervention groups (lots 410333/412992/418413/421486/422093 for Suppl; lots 409994/413101/417737/421572/421767 for Suppl Plus) was maintained sealed by an independent pharmacist and only revealed after completion of all study procedures, analyses, and database lock.
Inclusion criteria: (1) Adults aged 18–75 years; (2) Confirmed diagnosis of ulcerative colitis (UC) or Crohn’s disease (CD) by clinical, endoscopic, and histological criteria; (3) Stable maintenance therapy for at least 3 months before enrollment; (4) Current use of prebiotic supplementation; (5) Ability to provide informed consent.
Exclusion criteria: (1) Antibiotic use within 4 weeks before enrollment; (2) Use of probiotics, synbiotics, or prebiotic supplements other than the routine prebiotic regimen replaced by the study formulation at enrollment; (3) Pregnancy or lactation; (4) Significant hepatic, renal, or cardiac comorbidities; (5) History of bowel resection >40 cm; (6) Active infection or malignancy. At the level of the overall research program, the registry entry lists no use of prebiotics, probiotics, or synbiotics in the 6 months before data collection as an inclusion criterion; in the supplementation phase reported here, participants were already using prebiotic supplements, and this regimen was replaced by the study formulation at enrollment without a washout period. In the study database, a previous colectomy is recorded for nine of the 75 analyzed participants (UC, , both Suppl Plus; CD, [Suppl, 4; Suppl Plus, 3]), described as total in one participant with UC, as partial in three participants with CD, and without further specification in five; one additional participant with CD (Suppl) had intestinal surgery of unspecified type. Neither the length of resected bowel nor the date of surgery is recorded, so adherence to exclusion criterion (5) cannot be confirmed, and a total colectomy exceeds the 40-cm limit. A probiotic is recorded in the medication field for one participant with UC (Suppl), without information on timing. These participants were retained in the analyses.
2.3. Sample Size Justification
Sample size determination followed established frameworks for exploratory pilot studies with multiple planned analyses. Based on methodological guidance [15,16], a minimum of 30 participants per group provides adequate precision to estimate key design parameters for future definitive trials while maintaining feasibility for a single-center 12-month study. This sample size accommodates the planned microbiome analyses, as permutational multivariate analysis of variance (PERMANOVA)-based -diversity comparisons typically require 20–50 samples per group to detect moderate effect sizes with 80% power [17]. For clinical endpoints using paired comparisons (McNemar’s test), this size affords sensitivity to detect clinically relevant changes between baseline and 12 months [18]. A sample size calculation recorded by the investigators in G*Power (version 3.1.9.6) for a repeated-measures analysis of variance (within–between interaction; two arms and three assessments; effect size , , power 0.95, correlation among repeated measures 0.5, nonsphericity correction 0.65) indicated a minimum of 60 participants (30 per arm), and the record states that 75 participants were considered to allow for attrition (87 were enrolled; Section 2.2); the date of the calculation is not documented, and the document that records it cites studies published in 2024, after enrollment had begun. This calculation does not correspond to the analysis of the primary endpoint (the paired comparison of the proportion in remission or mild activity within each disease), for which no sample size calculation was performed; the clinical analyses are therefore exploratory, and the primary objective was to assess feasibility and estimate parameters for future sample size calculations rather than demonstrate treatment efficacy [19].
2.4. Sample Collection
Stool was self-collected at home with standardized kits at T0, T180, and T365 and stored at . Each specimen was split for microbiome and metabolomic analyses. For microbiome analysis, ∼200 mg of stool were used for DNA extraction. For metabolomics, ∼700 mg were homogenized in 1.0 mL ultrapure water (Milli-Q), flash-frozen in liquid nitrogen, and centrifuged at 14,000 rpm for 20 min at to separate solids. The supernatant (∼0.75 mL) was stored at for NMR.
2.5. Gut Microbiota Analysis
DNA extraction and 16S rRNA sequencing. Genomic DNA was extracted using a commercial stool DNA kit per manufacturer instructions. The bacterial 16S rRNA gene (V3–V4) was amplified and sequenced on an Illumina MiSeq. Sequencing targeted only the bacterial 16S rRNA gene; no human DNA was targeted, and no analysis of human genetic material was performed. Raw sequencing reads were not deposited in a public repository because of the restrictions on data sharing described in the Data Availability Statement. Single-end reads (300 bp) were quality-filtered and denoised to generate amplicon sequence variants (ASVs) using DADA2 (v2023.5.0), trimming the first 30 bases and truncating at 250 bp [20]. Raw 16S data (V3/V4) were processed in EncodeTools (v1.1.19; BiomeHub, 2025) [21], and taxonomic assignment of ASVs/oligotypes used the Basic Local Alignment Search Tool (BLAST) against the EncodeRef 16S database (v12.250102; BiomeHub) [22]. Taxa were aggregated to the phylum and genus levels for downstream analyses. Mean relative abundances of the main phyla and genera quoted in Section 3.5 and Section 3.6 were calculated from the study database (they differ by up to 1.2 percentage points from the provider’s means shown in Figure 2 and Figure 3); relative-abundance values inconsistent with the corresponding count values (above 100%, zero despite a nonzero count, or nonzero despite a zero count; 10 genus-level values and 1 phylum-level value) were treated as missing.
Diversity and community structure. Sequencing, sequence processing, and the diversity and differential abundance analyses were performed by the sequencing provider (BiomeHub) with EncodeTools (v1.1.19) and EncodeStats (v1.7.0), in R (v4.3.1) [23] with phyloseq (v1.46.0) [24] and the tidyverse (v2.0.0) [25]. Alpha diversity (Shannon, Inverse Simpson, Richness) was computed on proportion-normalized data. Beta diversity was evaluated primarily at the genus level using Bray–Curtis dissimilarity, with additional distances (Euclidean, Jaccard, unweighted and weighted UniFrac) for sensitivity analyses; visualizations used Principal Coordinates Analysis (PCoA) and Non-metric Multidimensional Scaling (NMDS). Group-level community differences (disease, supplement, time, and interactions) were tested by PERMANOVA with 999 permutations [26].
Differential taxonomic abundance. Given the compositional and sparse nature of 16S counts, complementary approaches were used without rarefaction, employing normalization/modeling suited to amplicon data [24]. MaAsLin2 (v1.14.1) multivariable models were run for associations with time and treatment [27,28], and limma-voom (limma v3.56.2) for repeated-measures differential abundance [29], both with default parameters. Following best-practice benchmarks, taxa were considered significant when replicated across ≥2 tools under false discovery rate (FDR) control [30]. Multiple testing was controlled via Benjamini–Hochberg FDR (threshold ) [31]. Figure 4, Figure 5, Figure 6 and Figure 7 and the estimates quoted in Section 3.11 and Section 3.12 are MaAsLin2 results with FDR ; the text indicates which of them were also detected by limma-voom and therefore met the two-tool criterion. In the sample metadata used by the sequencing provider, the 12-month sample of one participant with UC (Suppl) was labeled as CD; the provider’s analyses by disease (Figure 2A, Figure 3A, and Figure 4, Figure 5, Figure 6 and Figure 7, and the diversity comparisons between UC and CD) therefore included 49 UC and 26 CD samples at 12 months. With the correct label, the 12-month group means shown in Figure 2A and Figure 3A differ by less than 1 percentage point (phyla) and less than 0.5 percentage points (genera); the analyses by disease, including comparisons that do not involve the 12-month samples directly, were not repeated. Analyses by study arm were not affected.
2.6. Metabolomic Analysis
Sample preparation. Frozen fecal supernatants were thawed on ice. For each sample, 300 µL supernatant were mixed with 300 µL 0.1 M phosphate buffer (pH 7.4) in D2O containing 0.1 mM TSP (3-(trimethylsilyl)propionic-2,2,3,3-d4 acid, sodium salt) as the internal chemical-shift reference, then transferred to 5 mm NMR tubes.
Data acquisition and processing.1H NMR spectra were acquired at on a high-field spectrometer (acquisition and processing supported by the Núcleo de Análises e Pesquisa em Ressonância Magnética Nuclear, Instituto de Química e Biotecnologia, Universidade Federal de Alagoas), using a one-dimensional nuclear Overhauser effect spectroscopy (NOESY) pulse sequence with presaturation (noesygppr1d) to suppress water. Each spectrum comprised 64 scans, a 2.0-s relaxation delay (D1), and 16.0-ppm spectral width (centered at ∼4.69 ppm). Time-domain data (64k points) were zero-filled, Fourier-transformed with standard apodization, and phase/baseline corrected. Metabolites were assigned by chemical-shift/coupling matching against reference spectra and databases; where possible, assignments were confirmed with literature values or spike-ins.
Quantification and modeling. Metabolites were quantified by integrating characteristic resonances relative to TSP. Within-subject changes (T0 vs. T180 vs. T365) were assessed using paired tests (paired t-tests or Wilcoxon signed-rank, as appropriate) with FDR adjustment across metabolites. Multivariate modeling (principal component analysis [PCA] for unsupervised overview; partial least squares discriminant analysis [PLS-DA] and orthogonal PLS-DA [OPLS-DA] for supervised discrimination) summarized global metabolic shifts; models were evaluated by cross-validated and . Variables important for discrimination were identified by variable importance in projection (VIP) > 1.0 and loading profiles. Particular attention was given to xanthine, nicotinate (nicotinic acid), and threonine as candidate response biomarkers.
2.7. Statistical Analysis
Analyses were conducted in R (v4.4 and v4.3.1) [23] with phyloseq and the tidyverse [24,25]. Baseline characteristics were summarized descriptively and compared between arms with the Mann–Whitney U test (continuous variables) and Fisher’s exact test (categorical variables) (Table S2).
Alpha diversity. Alpha-diversity endpoints were modeled using linear mixed-effects models with random intercepts for participants and fixed effects for group, time (T0, T180, T365), and their interaction; alpha indices were log-transformed, global effects were tested via F-tests with Satterthwaite degrees-of-freedom, and Holm corrections were applied for multiple comparisons at [32].
Beta diversity. PERMANOVAs (999 permutations) tested effects of disease group, supplement, time, and interactions [26].
Differential abundance. Differential abundance followed the MaAsLin2 and limma-voom pipelines with replication criteria as above [27,28,29,30]. Unless otherwise specified, all p-values are two-tailed, and FDR thresholds for microbiome comparisons were set at 10% [31].
Clinical endpoints and reporting. The primary clinical endpoint was the composite of remission or mild activity at 12 months, classified by disease-specific scoring systems (UC by the Mayo endoscopic subscore; CD by the Simple Endoscopic Score for Crohn’s Disease, SES-CD), operationalized in analyses as UC Mayo endoscopic subscore and CD SES-CD [33,34,35]. Endoscopic scores were obtained from colonoscopy reports. Colonoscopies were not performed at fixed intervals from the study visits: for the baseline assessment, examinations performed before enrollment were used when available, and end-of-study examinations were performed over a range of dates, some of them after the 12-month visit. In the registry entry, the primary outcome for UC is described as a Mayo score lower than 2; the analysis used the Mayo endoscopic subscore (), the only Mayo measure recorded in the study database. Clinical endpoints were analyzed separately for UC and CD because disease activity is assessed with disease-specific instruments (Mayo endoscopic subscore for UC; SES-CD for CD); in microbiome analyses, disease was included as a factor. Remission proportions were summarized with 95% confidence intervals computed by the Wilson score method with continuity correction, and the absolute change in remission between baseline and 12 months with Newcombe’s hybrid score interval for paired proportions [36]. Changes in paired remission status (baseline vs. 12 months) were tested with the exact McNemar test, paired changes in the prevalence of adverse effects with the McNemar test with continuity correction, and differences in adverse effects between UC and CD with Fisher’s exact test. For continuous biomarkers (fecal calprotectin; C-reactive protein, CRP), given non-normality (histograms and Q–Q plots), paired comparisons across time points (baseline vs. 6 months; baseline vs. 12 months; 6 vs. 12 months) used Wilcoxon signed-rank tests with paired=TRUE. Medians and interquartile ranges were reported. Differences between Suppl and Suppl Plus were tested with Fisher’s exact test for categorical outcomes, preferred over tests due to small cell counts, and with the Mann–Whitney U test (normal approximation with continuity correction) for absolute changes (12 months minus baseline) in calprotectin and CRP; differences in remission between arms are presented with Wald 95% confidence intervals. Unless otherwise specified, analyses used two-sided . As the clinical analyses were exploratory, no family-wise multiplicity adjustment was applied; p-values were rounded to three decimal places. Confidence intervals for proportions were reported as “(lower–upper)”. All outputs (counts, percentages, 95% CIs, p-values, and effect sizes) were compiled into tabular summaries, and all code was scripted for reproducibility; the scripts used for the clinical and adverse-event analyses are available from the corresponding author upon reasonable request. Analyses followed a complete-case approach: the 75 participants who completed all three assessments (75 of the 85 who started supplementation) were analyzed, and the 10 who did not complete follow-up were not imputed.
2.8. Use of Generative Artificial Intelligence
Claude (Claude Opus 5.5; Anthropic, San Francisco, CA, USA) was used between September and October 2026 to restructure and shorten the abstract, edit the language, adapt the text and back matter to the journal template, draft the declarations and the cover letter, search the document folders of the study for the ethics, registration, and authorship records cited in the declarations and for the sample size calculation reported in Section 2.3, draft revisions of the Methods, Results, Discussion, and Supplementary Materials (including Table S2), draw the participant flow diagram (Figure 1), redraw Figure 2, Figure 3, Figure 4, Figure 5, Figure 6 and Figure 7 from the result tables delivered by the sequencing provider (English labels and 600-dpi resolution, without changing the plotted values), compute from the provider’s descriptive tables the group-by-time mean relative abundances used to check these figures, recalculate descriptive statistics and confidence intervals from the study database to check them against the text, compute from the database the between-arm comparisons reported in Section 3.4 and Table S2, and derive from the database the participant flow and deaths reported in Section 2.2, Figure 1, and Section 3.14, as well as the data checks reported in Section 2.1, Section 2.2, Section 2.5, Section 3.11, Section 3.12, and Section 4.1 (IBDQ score ranges, availability of cytokine data, inconsistent relative-abundance values, prior fecal microbiota transplantation, previous colectomies and probiotic use, a duplicated microbiome profile, a mislabeled sample in the sequencing provider’s metadata, and the concordance between the two differential abundance tools); values that differed were replaced by the recalculated values after verification. In September 2025, earlier versions of the manuscript and of the analysis code were prepared with the assistance of Claude Sonnet 4 (Anthropic) and ChatGPT (OpenAI; model version not recorded), used to draft text, and of Cursor (version 1.5.11; Anysphere, Inc.), used to write R analysis code; preliminary summaries of the results were drafted with generative AI assistance in October 2024 and April 2025 (tool not recorded). The authors reviewed and edited all outputs and take full responsibility for the content of this publication.
3. Results
Key clinical and laboratory outcomes are summarized in Table 1; baseline characteristics by study arm are shown in Table S2.
3.1. Clinical Remission
Among 75 patients (50 UC; 25 CD), remission was defined as “remission or mild activity” by disease-specific scoring systems (Mayo endoscopic subscore for UC; SES-CD for CD). In ulcerative colitis, the proportion in remission increased from 44.0% (22/50; 95% CI 30.3–58.7) at baseline to 82.0% (41/50; 95% CI 68.1–91.0) at 12 months (McNemar ), yielding an absolute increase of 38 percentage points in the proportion in remission. In Crohn’s disease, remission remained 88.0% (22/25) at both time points (McNemar ), indicating no net change.
3.2. Fecal Calprotectin
Median fecal calprotectin in UC declined from 406 µg/g at baseline to 286 µg/g at 12 months (paired Wilcoxon ), with the largest within-patient reduction occurring between 6 and 12 months (425 → 286 µg/g; ). In CD, calprotectin rose transiently at 6 months (241 → 363 µg/g; ) and returned toward baseline by 12 months (293 µg/g), with no net difference versus baseline at 12 months (); the decline from 6 to 12 months was significant ().
3.3. Serum C-Reactive Protein (CRP)
CRP remained low and unchanged in both groups. In UC, medians were 3.4 → 4.3 → 3.1 mg/L at baseline, 6, and 12 months (, 0.633, 0.467 for 0–6, 0–12, and 6–12 month comparisons, respectively). In CD, medians were 3.4 → 3.5 → 3.0 mg/L (, 0.874, 0.382, respectively). These findings indicate stable systemic inflammation markers throughout the study period.
3.4. Comparison of Supplementation Strategies (Suppl vs Suppl Plus)
At 12 months, remission rates did not differ significantly between regimens. In UC, Suppl 83.3% (20/24) vs Suppl Plus 80.8% (21/26) (Fisher ; difference [Suppl Plus – Suppl] percentage points; 95% CI to 18.7). In CD, Suppl 92.3% (12/13) vs Suppl Plus 83.3% (10/12) (Fisher ; difference percentage points; 95% CI to 16.6). Absolute changes in calprotectin and CRP from baseline to 12 months did not differ significantly between regimens (Mann–Whitney U test; UC, and ; CD, and , for calprotectin and CRP, respectively).
3.5. Phylum-Level Composition and Dynamics
Over 12 months, the gut microbiota in both diseases remained dominated by Firmicutes and Bacteroidetes, followed by Actinobacteria and Proteobacteria. In UC, Firmicutes remained the dominant phylum (59.2% at baseline; 65.3% at 12 months), accompanied by an increase in Actinobacteria (from 7.3% to 11.4%). UC patients also showed a decrease in Proteobacteria (from 8.4% to 3.9%), while Bacteroidetes declined modestly (from 20.8% to 16.6%). CD patients exhibited smaller shifts in the dominant phyla (Firmicutes 59.3% at baseline; 58.6% at 12 months), although Actinobacteria also increased (from 4.5% to 10.6%). Minor phyla (Verrucomicrobia, Fusobacteria, Synergistetes, Elusimicrobia) each constituted <5% of sequences throughout. Both intervention groups showed similar patterns, with Actinobacteria increasing over time and Proteobacteria decreasing (Figure 2A,B).
3.6. Genus-Level Composition and Dynamics
At the genus level, Faecalibacterium, Bacteroides, and Prevotella were the most abundant genera in both diseases at baseline and 6 months; at 12 months, Bifidobacterium ranked among the three most abundant genera in both UC and CD. In UC, mean relative abundances of Bifidobacterium, Blautia, and Eubacterium were higher at 12 months than at baseline, whereas that of Escherichia was lower; Blautia peaked at 6 months, consistent with its decline between 6 and 12 months (Section 3.12). In CD, mean relative abundance of Bifidobacterium was also higher at 12 months and that of Faecalibacterium was lower, although no genus met FDR at 12 months versus baseline (Section 3.12). Low-abundance genera (Hungatella, Dialister, Dorea, Lactobacillus, Clostridium) remained at approximately 3% or less each. Both intervention arms showed similar genus composition trends: Bifidobacterium was more abundant at 12 months than at baseline, and Blautia peaked at 6 months, in both groups. No statistically significant differences were detected between Suppl and Suppl Plus groups (Section 3.12); genus composition by group is shown in Figure 3A,B.
3.7. Phylum-Level Alpha Diversity
Phylum-level alpha diversity remained stable throughout the study. No significant differences were detected between UC and CD at any time point (all ) across multiple indices (Shannon, Simpson, Inverse Simpson, observed richness). Longitudinal changes from baseline to 6 or 12 months were non-significant in both diseases (all ). Suppl and Suppl Plus groups showed equivalent phylum-level diversity at all time points (all ), with no significant group-by-time interactions (Figure S1).
3.8. Genus-Level Alpha Diversity
Genus-level alpha diversity increased significantly over time in both diseases. Shannon diversity rose from baseline to 6 months (mean , ) and remained elevated at 12 months ( vs baseline, ). Observed richness increased by ∼2 genera at 6 months () and remained higher at 12 months (). Simpson and Inverse Simpson indices showed similar patterns (both from 0 to 6 months). These gains were comparable in UC and CD () and did not differ between Suppl and Suppl Plus groups (Shannon at 12 months: estimate , ) (Figures S2 and S3).
3.9. Phylum-Level Beta Diversity
At baseline, UC and CD community compositions were not significantly different (PERMANOVA , ). At 6 months, a transient divergence emerged between diseases (PERMANOVA , ), which was not sustained at 12 months (PERMANOVA , ). Suppl vs Suppl Plus groups showed no significant separation at any time point (PERMANOVA , 0.55, 0.39 at T0, T180, T365; ) (Figures S4 and S5).
3.10. Genus-Level Beta Diversity
Genus-level composition differed between UC and CD at baseline (PERMANOVA , ) and remained distinct at 6 months (, ) and 12 months (, ). The stable (∼3–4%) indicates a small but consistent proportion of variance linked to disease phenotype. No significant genus-level separation was detected between Suppl and Suppl Plus at any time (PERMANOVA , 0.52, 0.30 at T0, T180, T365; 1–1.6%) (Figures S6 and S7).
3.11. Differential Abundance: Phylum Level
In UC, from baseline to 6 months, Firmicutes increased modestly (log2FC , FDR ). By 12 months, Actinobacteria (log2FC ) and Firmicutes () increased, while Proteobacteria decreased (); all . Actinobacteria continued to expand between 6 and 12 months (, FDR ). In CD, no phylum changes reached FDR from baseline to 6 or 12 months. Only from 6 to 12 months did Actinobacteria increase significantly (log2FC , FDR ). No significant phylum-level differences were detected between Suppl and Suppl Plus arms (all FDR ) (Figure 4 and Figure 5). Of these phylum-level changes, only the increase in Actinobacteria in CD from 6 to 12 months was also detected by limma-voom (FDR ).
3.12. Differential Abundance: Genus Level
In UC, several beneficial anaerobes increased from baseline to 6 months in MaAsLin2: Dorea ( log2FC, FDR ), Blautia (, ), Holdemanella (, ), Anaerostipes (, ), and Coprococcus (, ). At 12 months vs baseline, Dorea remained elevated (, ) and Collinsella emerged as significantly higher (, ), while Holdemanella showed borderline significance (, ).
Between 6 and 12 months, some early-enriched genera declined: Blautia (, ), Bacteroides (, ), Escherichia (, ), and Dorea (, ), while Romboutsia (, ) and Collinsella (, ) increased. Of the changes in UC, only the increases in Dorea and Blautia and a decrease in Sutterella (, ) from baseline to 6 months, and the increase in Collinsella from baseline to 12 months, were also detected by limma-voom (FDR ); the others were detected by MaAsLin2 only.
In CD, only Dorea showed a nominally significant increase from baseline to 6 months (, ; MaAsLin2 only). No genera met FDR at 12 months versus baseline. From 6 to 12 months, Bifidobacterium reached single-tool significance in MaAsLin2 (, ) but was not replicated by limma-voom and therefore did not meet the two-tool criterion. No genus was differentially abundant between supplement formulations at FDR (Figure 6 and Figure 7).
3.13. 1H-NMR Metabolomics
High-resolution 1H-NMR analysis revealed metabolic changes after 12 months of supplementation (Table 2). Xanthine increased by +139% in UC () and +193% in CD (). 4-Pyridoxate rose by +130% in UC () and +84% in CD (). Nicotinate increased by +105% in UC () and +57% in CD (). Threonine showed non-significant increases (+106% in UC, +24% in CD; both ). The magnitude of changes was generally greater in UC than CD. No significant differences in metabolomic outcomes were observed between Suppl and Suppl Plus groups.
3.14. Adverse Effects
Abdominal fullness. Prevalence was 22.7% (17/75) at baseline, 28.0% (21/75) at 180 days, and 18.7% (14/75) at 365 days. All paired contrasts were non-significant (baseline vs 180 days ; baseline vs 365 days ; 180 vs 365 days ). No UC–CD differences were detected at any time point (all ).
Flatulence. Prevalence increased from 2.7% (2/75) at baseline to 6.7% (5/75) at 180 days and 16.0% (12/75) at 365 days. The increase from baseline to 365 days was significant (). No UC–CD differences were detected (all ).
In the 75 analyzed participants, all reported gastrointestinal episodes were self-limited and resolved without pharmacologic intervention.
Deaths and discontinuations. Four participants allocated to Suppl died during the study and were not included in the analysis (Figure 1): one of acute myocardial infarction 7 days after starting the supplement, one after a diagnosis of cholangiocarcinoma, one after a diagnosis of advanced pancreatic cancer with metastases, and one of pulmonary embolism in September 2024, before the 12-month assessment. The study database does not record a causality assessment for these events. No deaths were recorded in the Suppl Plus arm. One participant in Suppl Plus stopped taking the supplement because of abdominal bloating attributed to it and was not included in the analysis.
4. Discussion
In this 12-month trial of prebiotic supplementation with or without silymarin in IBD, clinical responses diverged by phenotype: ulcerative colitis (UC) showed increased remission rates at one year, whereas Crohn’s disease (CD) showed no change from baseline. This pattern, consistent with evidence that microbiome-targeted therapies can modulate IBD symptoms [1], may reflect differences in disease biology and microbiota accessibility (colonic-restricted UC versus the often transmural/small-intestinal involvement in CD). Microbiome changes were more pronounced in UC than in CD, suggesting differential responsiveness to prebiotic interventions between these conditions.
Both interventions were associated with microbiota compositional changes over time. By 12 months, Actinobacteria increased in both groups (meeting the two-tool criterion only in CD, from 6 to 12 months), accompanied by expansion of genera such as Bifidobacterium (MaAsLin2 only). At the genus level, several SCFA-producing taxa increased in UC patients (Dorea and Blautia, detected by both tools, and Holdemanella, by MaAsLin2 only), indicating potential changes in butyrate/acetate-generating capacity. Although descriptive analyses suggested some genera showed numerically greater enrichment at 6 months in the Suppl Plus group compared to Suppl alone, no statistically significant differences were detected between the two formulations at any time point (all FDR >0.10). By 12 months, both groups showed similar microbiota profiles, and the addition of silymarin did not confer detectable advantages over the base formulation.
Metabolomic profiling revealed increases in xanthine, nicotinate, and 4-pyridoxate at 12 months versus baseline. These metabolites are involved in purine metabolism, nicotinamide adenine dinucleotide (NAD+)-dependent pathways, and vitamin B6 metabolism, respectively. The observed changes suggest alterations in colonic metabolic activity, though the clinical significance of these findings requires further investigation. No significant differences in metabolite profiles were observed between the two supplement formulations.
Current understanding of diet-microbiota-immunity interactions provides context for these findings. Non-digestible fibers can modify microbial communities and increase SCFA production, which may influence epithelial barrier function and immune responses through G protein-coupled receptor (GPCR) signaling and histone deacetylase (HDAC) inhibition [1]. The expansion of SCFA-producing genera observed in UC patients aligns with this mechanism, although this report does not examine the relationship between these taxa and fecal SCFA concentrations.
The coordinated changes in clinical parameters, microbiota composition, and metabolite profiles in UC patients suggest potential mechanistic links. Previous studies have shown that specific commensals and their metabolites can influence mucosal immune responses [3,4]. The enrichment of genera such as Dorea and Blautia observed here has been associated with SCFA production in other studies, though strain-level variation and individual host factors likely influence functional outcomes. The increases in Holdemanella (MaAsLin2 only) and Collinsella (both tools) involve less-characterized genera whose functional contributions remain to be established.
Human studies in non-IBD populations provide comparative context. A 90-day randomized trial in overweight adults using similar prebiotic formulations reported microbiome shifts including increased Faecalibacterium and decreased Firmicutes:Bacteroidetes ratio, along with changes in inflammatory markers [11]. A 180-day trial found changes in central adiposity indices and metabolic parameters [37]. Additional studies have reported associations between prebiotic supplementation and improvements in sleep quality and cytokine profiles [12,13]. However, direct comparisons are limited by differences in study populations, intervention duration, and outcome measures.
Preclinical data suggest potential mechanisms, though translation to human IBD remains uncertain. Animal studies using similar formulations have shown changes in intestinal architecture, antioxidant enzyme expression, and metabolic parameters [6,7,9,38]. A related multi-component supplement altered colonic structure and suppressed mucin-degrading bacteria in animal models [10]. These findings provide hypothesis-generating insights but require validation in human IBD populations.
Methodological considerations influence interpretation of microbiome findings. Different analytical tools can yield varying results when identifying differentially abundant taxa [30]. We addressed this by using multiple complementary approaches and requiring concordance across methods, though this conservative strategy may have reduced sensitivity to detect smaller effects. The modest effect sizes observed (genus-level PERMANOVA 3–4%) indicate that disease type accounts for a small proportion of overall microbiota variance, with other factors likely playing substantial roles.
This study’s longitudinal design integrating clinical, microbiome, and metabolomic endpoints provides a comprehensive view of responses to prebiotic supplementation in IBD. The findings suggest that prebiotics may be associated with clinical improvements in UC, though the nonrandomized design and absence of placebo control preclude causal conclusions. The most pronounced microbiome changes occurred within six months, after which communities appeared to stabilize, suggesting that initial intervention periods may be critical for establishing new microbial configurations. Future randomized controlled trials are needed to confirm efficacy, determine optimal dosing and duration, and identify baseline predictors of response.
4.1. Limitations
This single-center, 12-month prospective study employed a nonrandomized, two-arm active-comparator design without a placebo control, which increases susceptibility to selection and performance biases and limits causal attribution beyond within-participant change. The active-versus-active contrast also reduces the ability to disentangle specific treatment effects from nonspecific or time-related effects. The sample was modest (UC = 50; CD = 25), constraining power for between-arm comparisons and subgroup analyses; in CD, a marked ceiling effect—remission at 88% at baseline and unchanged at 12 months—further reduced sensitivity to detect additional benefit. Multiple endpoints across several time points were tested with exploratory intent and without family-wise multiplicity control; although microbiome results were controlled at FDR 10%, this still allows a nontrivial false-positive rate. Microbiome profiling based on 16S rRNA V3/V4 inherently limits species/strain resolution and functional attribution, and reliance on a proprietary reference may affect cross-study comparability. Community-level separations were statistically significant but small in magnitude (e.g., genus-level PERMANOVA 3–4%), and a phylum-level divergence evident at 6 months did not persist at 12 months, suggesting modest and potentially transient effects. Finally, the single-center setting may limit generalizability to broader IBD populations and practice contexts. Outcomes were not analyzed by sex; sex was reported only as a baseline characteristic (Table 1). The arms were also imbalanced at baseline in sex and aminosalicylate use (Table S2), which may confound the comparison between formulations. In addition, the per-capsule quantitative composition of the formulations is not reported, which limits reproducibility; seven participants took fewer capsules than planned; one participant with CD was younger than the prespecified minimum age; nine participants had a previous colectomy (one total) and one had a record of probiotic use, so adherence to the exclusion criteria on bowel resection and probiotic use could not be confirmed (Section 2.2); the colonoscopies used for endoscopic scoring were not performed at fixed intervals from the study visits (baseline examinations performed before enrollment were used when available, and some end-of-study examinations were performed after the 12-month visit), which may have led to misclassification of remission status at both time points; 10 of the 85 participants who started supplementation were not analyzed (four deaths, all in the Suppl arm; two withdrawals; two participants who stopped taking the supplement; one loss to follow-up; and one fecal microbiota transplantation), so the complete-case analysis may be biased; and six participants had received fecal microbiota transplantation before enrollment, five of them in the Suppl Plus arm, which may confound the microbiome comparison between formulations. In the study database, the 12-month microbiome profiles of two participants with CD, one in each arm, were identical, consistent with a transcription error; counting this profile once changes the 12-month phylum means for CD quoted in Section 3.5 by less than 1 percentage point (Firmicutes, 57.7% vs. 58.6%) and does not alter the genus-level findings. This error is confined to the database: Figure 2, Figure 3, Figure 4, Figure 5, Figure 6 and Figure 7 and the diversity and differential abundance analyses were derived from the sequencing provider’s count tables, which contain no identical sample profiles. In those tables, however, the 12-month sample of one participant with UC was labeled as CD (Section 2.5), and the analyses by disease were not repeated with the correct label. Most differential abundance changes reported in Section 3.11 and Section 3.12 were detected by MaAsLin2 only and did not meet the two-tool criterion, so they should be regarded as exploratory.
5. Conclusions
This 12-month pilot study of prebiotic supplementation in IBD showed divergent outcomes by disease type. In ulcerative colitis, supplementation was associated with increased clinical remission rates, reduced fecal calprotectin, and changes in microbiome composition including increased genus-level diversity and enrichment of SCFA-producing genera. Metabolomic analyses revealed increases in metabolites involved in redox and NAD+-dependent pathways. In Crohn’s disease, no clinical improvements were observed, and microbiome changes were minimal, possibly due to the high baseline remission rate limiting detection of additional benefits. The addition of silymarin to the base prebiotic formulation did not confer statistically significant advantages over the prebiotics alone for any measured endpoint. These findings suggest that the base formulation may warrant further investigation as a potential adjunctive therapy in UC, while alternative approaches may be needed for CD. Given the nonrandomized design and absence of placebo control, these results should be considered preliminary. Randomized, placebo-controlled trials are needed to establish efficacy, determine optimal dosing and duration, and identify baseline characteristics that predict treatment response. A placebo-controlled trial is currently being conducted to validate these initial observations in ulcerative colitis.
Supplementary Materials
The following supporting information can be downloaded at the website of this paper posted on Preprints.org, Table S1: Transparent Reporting of Evaluations with Nonrandomized Designs (TREND) checklist; Table S2: Baseline characteristics of participants who completed follow-up, by study arm; File S1: Study protocol, consolidated version (Portuguese); File S2: Study protocol, consolidated version (English translation); Figure S1: Estimates of the effect of time and supplementation on diversity indices at the phylum level; Figure S2: Estimates of the effect of time and group on diversity indices at the genus level; Figure S3: Estimates of the effect of time and supplementation on diversity indices at the genus level; Figure S4: Principal coordinates analysis (PCoA) of Bray–Curtis distances at the phylum level, by disease group; Figure S5: PCoA of Bray–Curtis distances at the phylum level, by intervention group; Figure S6: PCoA of Bray–Curtis distances at the genus level, by disease group; Figure S7: PCoA of Bray–Curtis distances at the genus level, by intervention group.
Author Contributions
Conceptualization, J.A.P.M.C. and M.A.F.L.N.; methodology, J.A.P.M.C.; validation, J.A.P.M.C.; formal analysis, J.A.P.M.C.; investigation, J.C.R.J., L.C.L. and J.E.C.M.; resources, J.P.O. and V.N.F.; data curation, J.A.P.M.C. and J.C.R.J.; writing—original draft preparation, J.A.P.M.C., J.C.R.J. and M.A.F.L.N.; writing—review and editing, J.A.P.M.C., J.C.R.J., L.C.L., J.E.C.M., J.P.O., V.N.F. and M.A.F.L.N.; visualization, J.A.P.M.C., J.C.R.J. and M.A.F.L.N.; supervision, J.P.O., V.N.F. and M.A.F.L.N. All authors have read and agreed to the published version of the manuscript.
Funding
This research was funded by Efeom Nutrition S.A., administered through the Fundação Universitária de Desenvolvimento de Extensão e Pesquisa (FUNDEPES), process 23065.027219/2023-00.
Institutional Review Board Statement
The study was conducted in accordance with the Declaration of Helsinki and approved by the Research Ethics Committee of the Federal University of Alagoas (CEP/UFAL; CAAE 86504518.1.0000.5013; amendment approved on 3 October 2023, opinion no. 6.341.456; current protocol version, amended for a subsequent phase of the research program, approved under opinion no. 8.245.338 on 26 February 2026). The trial was registered retrospectively in the Brazilian Registry of Clinical Trials (ReBEC; RBR-7hvd26h; UTN U1111-1338-7521; https://ensaiosclinicos.gov.br/rg/RBR-7hvd26h) on 30 April 2026.
Informed Consent Statement
Written informed consent was obtained from all participants before enrollment.
Data Availability Statement
The clinical and metabolomic data underlying this study contain potentially identifying and sensitive information from patients with inflammatory bowel disease and cannot be made publicly available, in accordance with the conditions of ethics approval granted by the Research Ethics Committee of the Federal University of Alagoas (CEP/UFAL; CAAE 86504518.1.0000.5013), the terms of participants’ informed consent, and the Brazilian General Data Protection Law (Lei Geral de Proteção de Dados, Law No. 13.709/2018). The raw 16S rRNA gene sequencing reads were not deposited in a public repository because the participants’ informed consent restricts the disclosure of study information to professionals in the field. De-identified data, including the sequencing data, are available to qualified researchers upon reasonable request and subject to approval by CEP/UFAL, a non-author institutional body, which may be contacted at cep@ufal.br (tel. +55 82 3214-1041). The scripts used for the clinical and adverse-event analyses are available from the corresponding author upon reasonable request; sequence processing and the microbiome analyses were performed by the sequencing provider (Section 2.5). For peer review, the de-identified data, including the sequencing data, and these scripts can be made available to the editors and reviewers upon request.
Acknowledgments
We thank the patients and their families for their trust and partnership throughout the study. We acknowledge the clinical, nursing, pharmacy, and endoscopy teams at Hospital Universitário Professor Alberto Antunes for participant recruitment, follow-up, safety monitoring, and sample handling. We also thank the administrative teams at the Faculdade de Medicina da Universidade Federal de Alagoas and the Fundação Universitária de Desenvolvimento de Extensão e Pesquisa (FUNDEPES) for institutional support. Acquisition and processing of 1H-NMR spectra were supported by the Núcleo de Análises e Pesquisa em Ressonância Magnética Nuclear, Instituto de Química e Biotecnologia, Universidade Federal de Alagoas (Thiago Aquino, Edmilson Rodrigues, Alessandre Crispim, and Jeferson Santana). We acknowledge BiomeHub for assistance with EncodeTools/EncodeReports and thank our bioinformatics colleagues for supporting workflow reproducibility and figure preparation. During the preparation of this manuscript, the authors used Claude (Claude Opus 5.5 and, in earlier versions, Claude Sonnet 4; Anthropic, San Francisco, CA, USA), ChatGPT (OpenAI; model version not recorded), and Cursor (version 1.5.11; Anysphere, Inc.) for the purposes described in Section 2.8. The authors have reviewed and edited the output and take full responsibility for the content of this publication.
Conflicts of Interest
J.A.P.M.C., J.C.R.J., L.C.L., J.E.C.M., and M.A.F.L.N. received scholarships/grants administered by FUNDEPES with funds provided by Efeom Nutrition S.A., the company that supplied the formulations evaluated in this study. V.N.F. and J.P.O. contributed to the development of the tested nutraceutical formulation, are partners of Efeom Nutrition S.A., and hold patents relating to the formulation, which is protected by Brazilian patent BR 10 2020 016156 3; V.N.F. has been employed by Pesquisa e Desenvolvimento Efeom Nutrição S/A. Apart from the contributions of V.N.F. and J.P.O. described in the Author Contributions, the funder had no role in study design, data collection and analysis, decision to publish, or preparation of the manuscript.
Abbreviations
The following abbreviations are used in this manuscript:
| 1H NMR | proton nuclear magnetic resonance |
| ASV | amplicon sequence variant |
| BLAST | Basic Local Alignment Search Tool |
| CAAE | Certificate of Presentation for Ethical Appreciation |
| CD | Crohn’s disease |
| CEP/UFAL | Research Ethics Committee of the Federal University of Alagoas |
| CI | confidence interval |
| CNS | National Health Council (Brazil) |
| CRP | C-reactive protein |
| FDR | false discovery rate |
| FOS | fructooligosaccharides |
| FUNDEPES | Fundação Universitária de Desenvolvimento de Extensão e Pesquisa |
| GOS | galactooligosaccharides |
| GPCR | G protein-coupled receptor |
| HDAC | histone deacetylase |
| IBD | inflammatory bowel disease |
| IBDQ | Inflammatory Bowel Disease Questionnaire |
| IL | interleukin |
| IQR | interquartile range |
| NAD+ | nicotinamide adenine dinucleotide |
| NMDS | non-metric multidimensional scaling |
| NOESY | nuclear Overhauser effect spectroscopy |
| OPLS-DA | orthogonal partial least squares discriminant analysis |
| PCA | principal component analysis |
| PCoA | principal coordinates analysis |
| PERMANOVA | permutational multivariate analysis of variance |
| PGC-1 | peroxisome proliferator-activated receptor gamma coactivator 1-alpha |
| PLS-DA | partial least squares discriminant analysis |
| ReBEC | Brazilian Registry of Clinical Trials |
| SCFA | short-chain fatty acid |
| SES-CD | Simple Endoscopic Score for Crohn’s Disease |
| TLR | toll-like receptor |
| TNF- | tumor necrosis factor-alpha |
| TREND | Transparent Reporting of Evaluations with Nonrandomized Designs |
| TSP | 3-(trimethylsilyl)propionic-2,2,3,3-d4 acid, sodium salt |
| UC | ulcerative colitis |
| UTN | Universal Trial Number |
| VIP | variable importance in projection |
References
- Gill, P.A.; Inniss, S.; Kumagai, T.; Rahman, F.Z.; Smith, A.M. The role of diet and gut microbiota in regulating gastrointestinal and inflammatory disease. Front. Immunol. 2022, 13, 866059. [Google Scholar] [CrossRef] [PubMed]
- Suez, J.; Zmora, N.; Zilberman-Schapira, G.; Mor, U.; Dori-Bachash, M.; Bashiardes, S.; Zur, M.; Regev-Lehavi, D.; Ben-Zeev Brik, R.; Federici, S.; et al. Post-antibiotic gut mucosal microbiome reconstitution is impaired by probiotics and improved by autologous FMT. Cell 2018, 174, 1406–1423.e16. [Google Scholar] [CrossRef] [PubMed]
- Atarashi, K.; Tanoue, T.; Shima, T.; Imaoka, A.; Kuwahara, T.; Momose, Y.; Cheng, G.; Yamasaki, S.; Saito, T.; Ohba, Y.; et al. Induction of colonic regulatory T cells by indigenous Clostridium species. Science 2011, 331, 337–341. [Google Scholar] [CrossRef] [PubMed]
- Arpaia, N.; Campbell, C.; Fan, X.; Dikiy, S.; van der Veeken, J.; deRoos, P.; Liu, H.; Cross, J.R.; Pfeffer, K.; Coffer, P.J.; et al. Metabolites produced by commensal bacteria promote peripheral regulatory T-cell generation. Nature 2013, 504, 451–455. [Google Scholar] [CrossRef] [PubMed]
- Geva-Zatorsky, N.; Sefik, E.; Kua, L.; Pasman, L.; Tan, T.G.; Ortiz-Lopez, A.; Yanortsang, T.B.; Yang, L.; Jupp, R.; Mathis, D.; et al. Mining the human gut microbiota for immunomodulatory organisms. Cell 2017, 168, 928–943.e11. [Google Scholar] [CrossRef] [PubMed]
- Santamarina, A.B.; Moraes, R.C.M.; Nehmi Filho, V.; Murata, G.M.; de Freitas, J.A.; de Miranda, D.A.; Cerqueira, A.R.A.; Costa, S.K.P.; Ferreira, A.F.F.; Britto, L.R.; et al. The symbiotic effect of a new nutraceutical with yeast β-glucan, prebiotics, minerals, and Silybum marianum (silymarin) for recovering metabolic homeostasis via Pgc-1α, Il-6, and Il-10 gene expression in a type-2 diabetes obesity model. Antioxidants 2022, 11, 447. [Google Scholar] [CrossRef] [PubMed]
- Nehmi-Filho, V.; de Freitas, J.A.; Franco, L.A.M.; Fonseca, J.V.S.; Martins, R.C.R.; Santamarina, A.B.; Murata, G.M.; Sabino, E.C.; Souza, E.; Ferreira, M.T.; et al. Novel nutraceutical (silymarin, yeast β-glucan, prebiotics, and minerals) shifts gut microbiota and restores large intestine histology of diet-induced metabolic syndrome mice. J. Funct. Foods 2023, 107, 105671. [Google Scholar] [CrossRef]
- Nehmi, V.A.; Murata, G.M.; de Moraes, R.C.M.; Lima, G.C.A.; De Miranda, D.A.; Radloff, K.; Costa, R.G.F.; de Jesus, J.C.R.; De Freitas, J.A.; Viana, N.I.; et al. A novel supplement with yeast β-glucan, prebiotic, minerals and Silybum marianum synergistically modulates metabolic and inflammatory pathways and improves steatosis in obese mice. J. Integr. Med. 2021, 19, 439–450. [Google Scholar] [CrossRef] [PubMed]
- Nucci, R.A.B.; Nehmi Filho, V.A.; Jacob-Filho, W.; Otoch, J.P.; Pessoa, A.F.M. Role of nutritional supplements on gut-muscle axis across age: a mini-review. Cell. Physiol. Biochem. 2023, 57, 161–168. [Google Scholar] [CrossRef] [PubMed]
- Freitas, J.A.; Nehmi Filho, V.; Santamarina, A.B.; Murata, G.M.; Franco, L.A.M.; Fonseca, J.V.; Martins, R.C.; Souza, G.A.; Benicio, G.; Sabbag, I.M.; et al. Nutraceutical supplement slim reshaped colon histomorphology and reduces Mucispirillum schaedleri in obese mice. Front. Microbiol. 2025, 16, 1494994. [Google Scholar] [CrossRef] [PubMed]
- Santamarina, A.B.; Nehmi Filho, V.; de Freitas, J.A.; Franco, L.A.M.; Martins, R.C.; Fonseca, J.V.; Orellana Turri, J.A.; Hufnagel, M.T.; Demarque, D.P.; da Silva, B.F.R.B.; et al. Nutraceutical blends promote weight loss, inflammation reduction, and better sleep: the role of Faecalibacterium prausnitzii in overweight adults—a double-blind trial. Mol. Nutr. Food Res. 2025, 69, e202400806. [Google Scholar] [CrossRef] [PubMed]
- Santamarina, A.B.; de Freitas, J.A.; Franco, L.A.M.; Nehmi-Filho, V.; Fonseca, J.V.; Martins, R.C.; Turri, J.A.; da Silva, B.F.R.B.; Fugi, B.E.I.; da Fonseca, S.S.; et al. Nutraceutical blends predict enhanced health via microbiota reshaping improving cytokines and life quality: A Brazilian double-blind randomized trial. Sci. Rep. 2024, 14, 11127. [Google Scholar] [CrossRef] [PubMed]
- Santamarina, A.B.; Nehmi Filho, V.; de Freitas, J.A.; da Silva, B.F.R.B.; Gusmão, A.F.; Olivieri, E.H.R.; de Souza, E.; da Silva, S.L.; de Miranda, D.A.; Demarque, D.P.; et al. Nutraceutical composition (yeast β-glucan, prebiotics, minerals, and silymarin) predicts improvement of sleep quality and metabolic parameters: a randomized pilot study. Clin. Nutr. ESPEN 2024, 63, 476–490. [Google Scholar] [CrossRef] [PubMed]
- Des Jarlais, D.C.; Lyles, C.; Crepaz, N.; TREND Group. Improving the reporting quality of nonrandomized evaluations of behavioral and public health interventions: the TREND statement. Am. J. Public Health 2004, 94, 361–366. [Google Scholar] [CrossRef] [PubMed]
- Julious, S.A. Sample size of 12 per group rule of thumb for a pilot study. Pharm. Stat. 2005, 4, 287–291. [Google Scholar] [CrossRef]
- Teare, M.D.; Dimairo, M.; Shephard, N.; Hayman, A.; Whitehead, A.; Walters, S.J. Sample size requirements to estimate key design parameters from external pilot randomised controlled trials: a simulation study. Trials 2014, 15, 264. [Google Scholar] [CrossRef] [PubMed]
- Kelly, B.J.; Gross, R.; Bittinger, K.; Sherrill-Mix, S.; Lewis, J.D.; Collman, R.G.; Bushman, F.D.; Li, H. Power and sample-size estimation for microbiome studies using pairwise distances and PERMANOVA. Bioinformatics 2015, 31, 2461–2468. [Google Scholar] [CrossRef] [PubMed]
- Whitehead, A.L.; Julious, S.A.; Cooper, C.L.; Campbell, M.J. Estimating the sample size for a pilot randomised trial to minimise the overall trial sample size for the external pilot and main trial for a continuous outcome variable. Stat. Methods Med. Res. 2016, 25, 1057–1073. [Google Scholar] [CrossRef] [PubMed]
- Eldridge, S.M.; Chan, C.L.; Campbell, M.J.; Bond, C.M.; Hopewell, S.; Thabane, L.; Lancaster, G.A. CONSORT 2010 statement: extension to randomised pilot and feasibility trials. Pilot Feasibility Stud. 2016, 2, 64. [Google Scholar] [CrossRef] [PubMed]
- Callahan, B.J.; McMurdie, P.J.; Rosen, M.J.; Han, A.W.; Johnson, A.J.A.; Holmes, S.P. DADA2: High-resolution sample inference from Illumina amplicon data. Nat. Methods 2016, 13, 581–583. [Google Scholar] [CrossRef] [PubMed]
- BiomeHub. EncodeTools (Version 1.1.19) [Computer software], 2025. Available online: https://www.biome-hub.com (accessed on 21 September 2025).
- Altschul, S.F.; Gish, W.; Miller, W.; Myers, E.W.; Lipman, D.J. Basic local alignment search tool. J. Mol. Biol. 1990, 215, 403–410. [Google Scholar] [CrossRef] [PubMed]
- R Core Team. R: A Language and Environment for Statistical Computing; R Foundation for Statistical Computing: Vienna, Austria; 2024, Available online: https://www.R-project.org/.
- McMurdie, P.J.; Holmes, S. phyloseq: an R package for reproducible interactive analysis and graphics of microbiome census data. PLoS ONE 2013, 8, e61217. [Google Scholar] [CrossRef] [PubMed]
- Wickham, H.; Averick, M.; Bryan, J.; Chang, W.; McGowan, L.D.; François, R.; Grolemund, G.; Hayes, A.; Henry, L.; Hester, J.; et al. Welcome to the tidyverse. J. Open Source Softw. 2019, 4, 1686. [Google Scholar] [CrossRef]
- Anderson, M.J. Permutational multivariate analysis of variance (PERMANOVA). In Wiley StatsRef: Statistics Reference Online; Wiley, 2017; pp. 1–15. [Google Scholar] [CrossRef]
- Mallick, H.; Rahnavard, A.; McIver, L.J.; Ma, S.; Zhang, Y.; Nguyen, L.H.; Tickle, T.L.; Weingart, G.; Ren, B.; Schwager, E.H.; et al. Multivariable association discovery in population-scale meta-omics studies. PLoS Comput. Biol. 2021, 17, e1009442. [Google Scholar] [CrossRef] [PubMed]
- Paulson, J.N.; Stine, O.C.; Bravo, H.C.; Pop, M. Differential abundance analysis for microbial marker-gene surveys. Nat. Methods 2013, 10, 1200–1202. [Google Scholar] [CrossRef] [PubMed]
- Ritchie, M.E.; Phipson, B.; Wu, D.; Hu, Y.; Law, C.W.; Shi, W.; Smyth, G.K. limma powers differential expression analyses for RNA-sequencing and microarray studies. Nucleic Acids Res. 2015, 43, e47. [Google Scholar] [CrossRef] [PubMed]
- Nearing, J.T.; Douglas, G.M.; Hayes, M.G.; MacDonald, J.; Desai, D.K.; Allward, N.; Jones, C.M.A.; Wright, R.J.; Dhanani, A.S.; Comeau, A.M.; et al. Microbiome differential abundance methods produce different results across 38 datasets. Nat. Commun. 2022, 13, 342. [Google Scholar] [CrossRef] [PubMed]
- Benjamini, Y.; Hochberg, Y. Controlling the false discovery rate: a practical and powerful approach to multiple testing. J. R. Stat. Soc. Ser. B (Methodol.) 1995, 57, 289–300. [Google Scholar] [CrossRef]
- Kuznetsova, A.; Brockhoff, P.B.; Christensen, R.H. lmerTest Package: Tests in Linear Mixed Effects Models. J. Stat. Softw. 2017, 82, 1–26. [Google Scholar] [CrossRef]
- Rubin, D.T.; Ananthakrishnan, A.N.; Siegel, C.A.; Sauer, B.G.; Long, M.D. ACG clinical guideline: ulcerative colitis in adults. Am. J. Gastroenterol. 2019, 114, 384–413. [Google Scholar] [CrossRef] [PubMed]
- Sandborn, W.J.; Sands, B.E.; Uddin, S.; Qasim Khan, R.M.; Sagar Mukherjee, R. Clinical Trial Design in Ulcerative Colitis: Interpreting Evolving Endpoints Based on Post Hoc Analyses of the Vedolizumab Phase 3 Trials GEMINI 1 and VISIBLE 1. Crohns Colitis 360 2024, 6, otad076. [Google Scholar] [CrossRef] [PubMed]
- Jain, A.V.; Gopal, S.; Shetty, A.J.; Shenoy, S.; Tantry, B.V.; Unnikrishnan, B.; Holla, R.; Anand, R. Predictive accuracy of fecal calprotectin in assessing clinical activity and disease severity in patients with ulcerative colitis and Crohn’s disease. BMC Gastroenterol. 2025, 25, 429. [Google Scholar] [CrossRef] [PubMed]
- Newcombe, R.G. Improved confidence intervals for the difference between binomial proportions based on paired data. Stat. Med. 1998, 17, 2635–2650. [Google Scholar] [CrossRef]
- Nehmi-Filho, V.; Santamarina, A.B.; de Freitas, J.A.; Trarbach, E.B.; de Oliveira, D.R.; Palace-Berl, F.; de Souza, E.; de Miranda, D.A.; Escamilla-Garcia, A.; Otoch, J.P.; et al. Novel nutraceutical supplements with yeast β-glucan, prebiotics, minerals, and Silybum marianum (silymarin) ameliorate obesity-related metabolic and clinical parameters: A double-blind randomized trial. Front. Endocrinol. 2023, 13, 1089938. [Google Scholar] [CrossRef] [PubMed]
- Nucci, R.A.B.; Nehmi-Filho, V.A.; Bastos, M.F.; de Freitas, J.A.; Otoch, J.P.; Pessoa, A.F.M.; Jacob-Filho, W. Modulation of small-intestine morphology in mice by a novel supplement containing Silybum marianum, yeast β-glucan, prebiotics, and minerals. J. Health Allied Sci. NU 2024, 14, 426–430. [Google Scholar] [CrossRef]
Figure 1.
Participant flow diagram (TREND-compatible) for the 12-month, single-center, double-blind, nonrandomized, two-arm pilot trial in patients with inflammatory bowel disease. The diagram shows enrollment, participants who did not start the intervention, sequential nonrandomized allocation to the Suppl and Suppl Plus arms, participants not analyzed in each arm during the 12-month follow-up, and the final sample analyzed at baseline, 6 months, and 12 months (ulcerative colitis [UC], ; Crohn’s disease [CD], ). Abbreviations in the diagram: CD, Crohn’s disease; FOS, fructooligosaccharides; GOS, galactooligosaccharides; IBD, inflammatory bowel disease; T0, baseline; T180, 6 months; T365, 12 months; UC, ulcerative colitis. The diagram label “Adults with IBD” reflects the eligibility criterion; one enrolled participant was 17 years old (Section 2.2). The number of individuals assessed for eligibility is not reported separately from the number enrolled (); all counts in the diagram are those recorded in the study database.
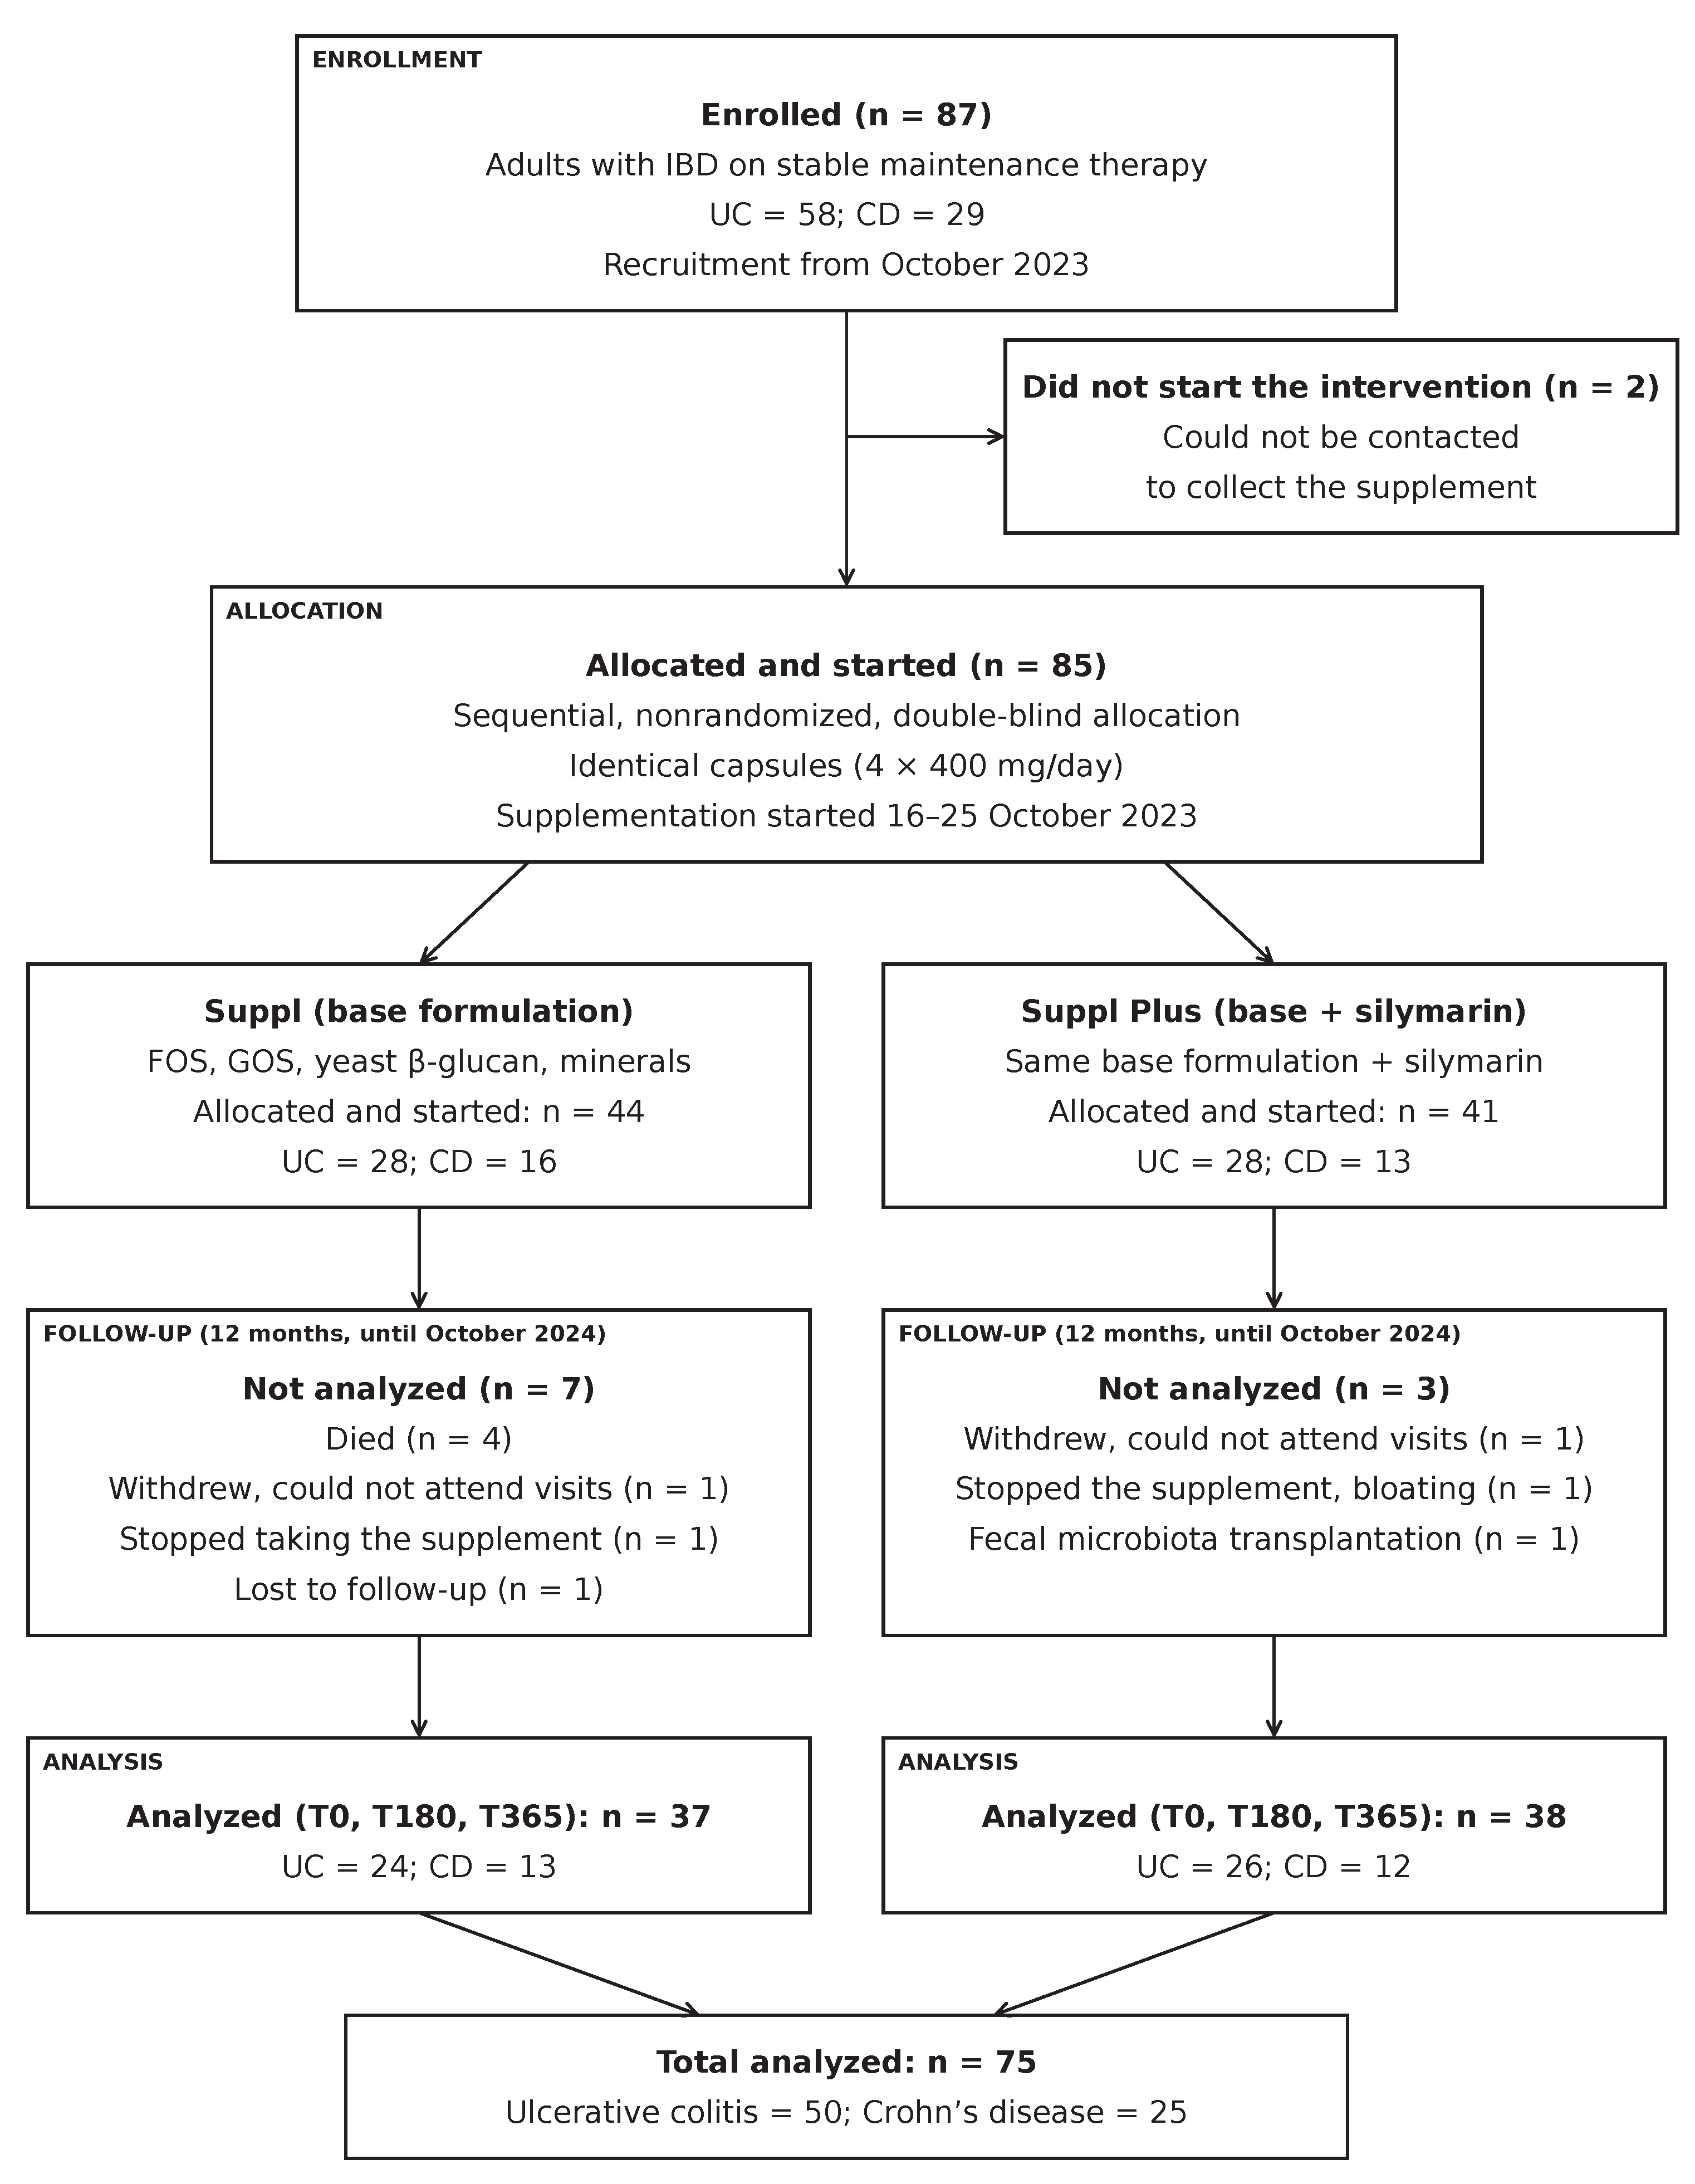
Figure 2.
Average percentage abundance of bacterial phyla in UC vs CD groups (A) and in Suppl vs Suppl Plus interventions (B) at baseline, 6 months, and 12 months. Means as computed by the sequencing provider. In panel A, the 12-month bars include 49 UC and 26 CD samples because the 12-month sample of one participant with UC was labeled as CD in the provider’s sample metadata (Section 2.5).
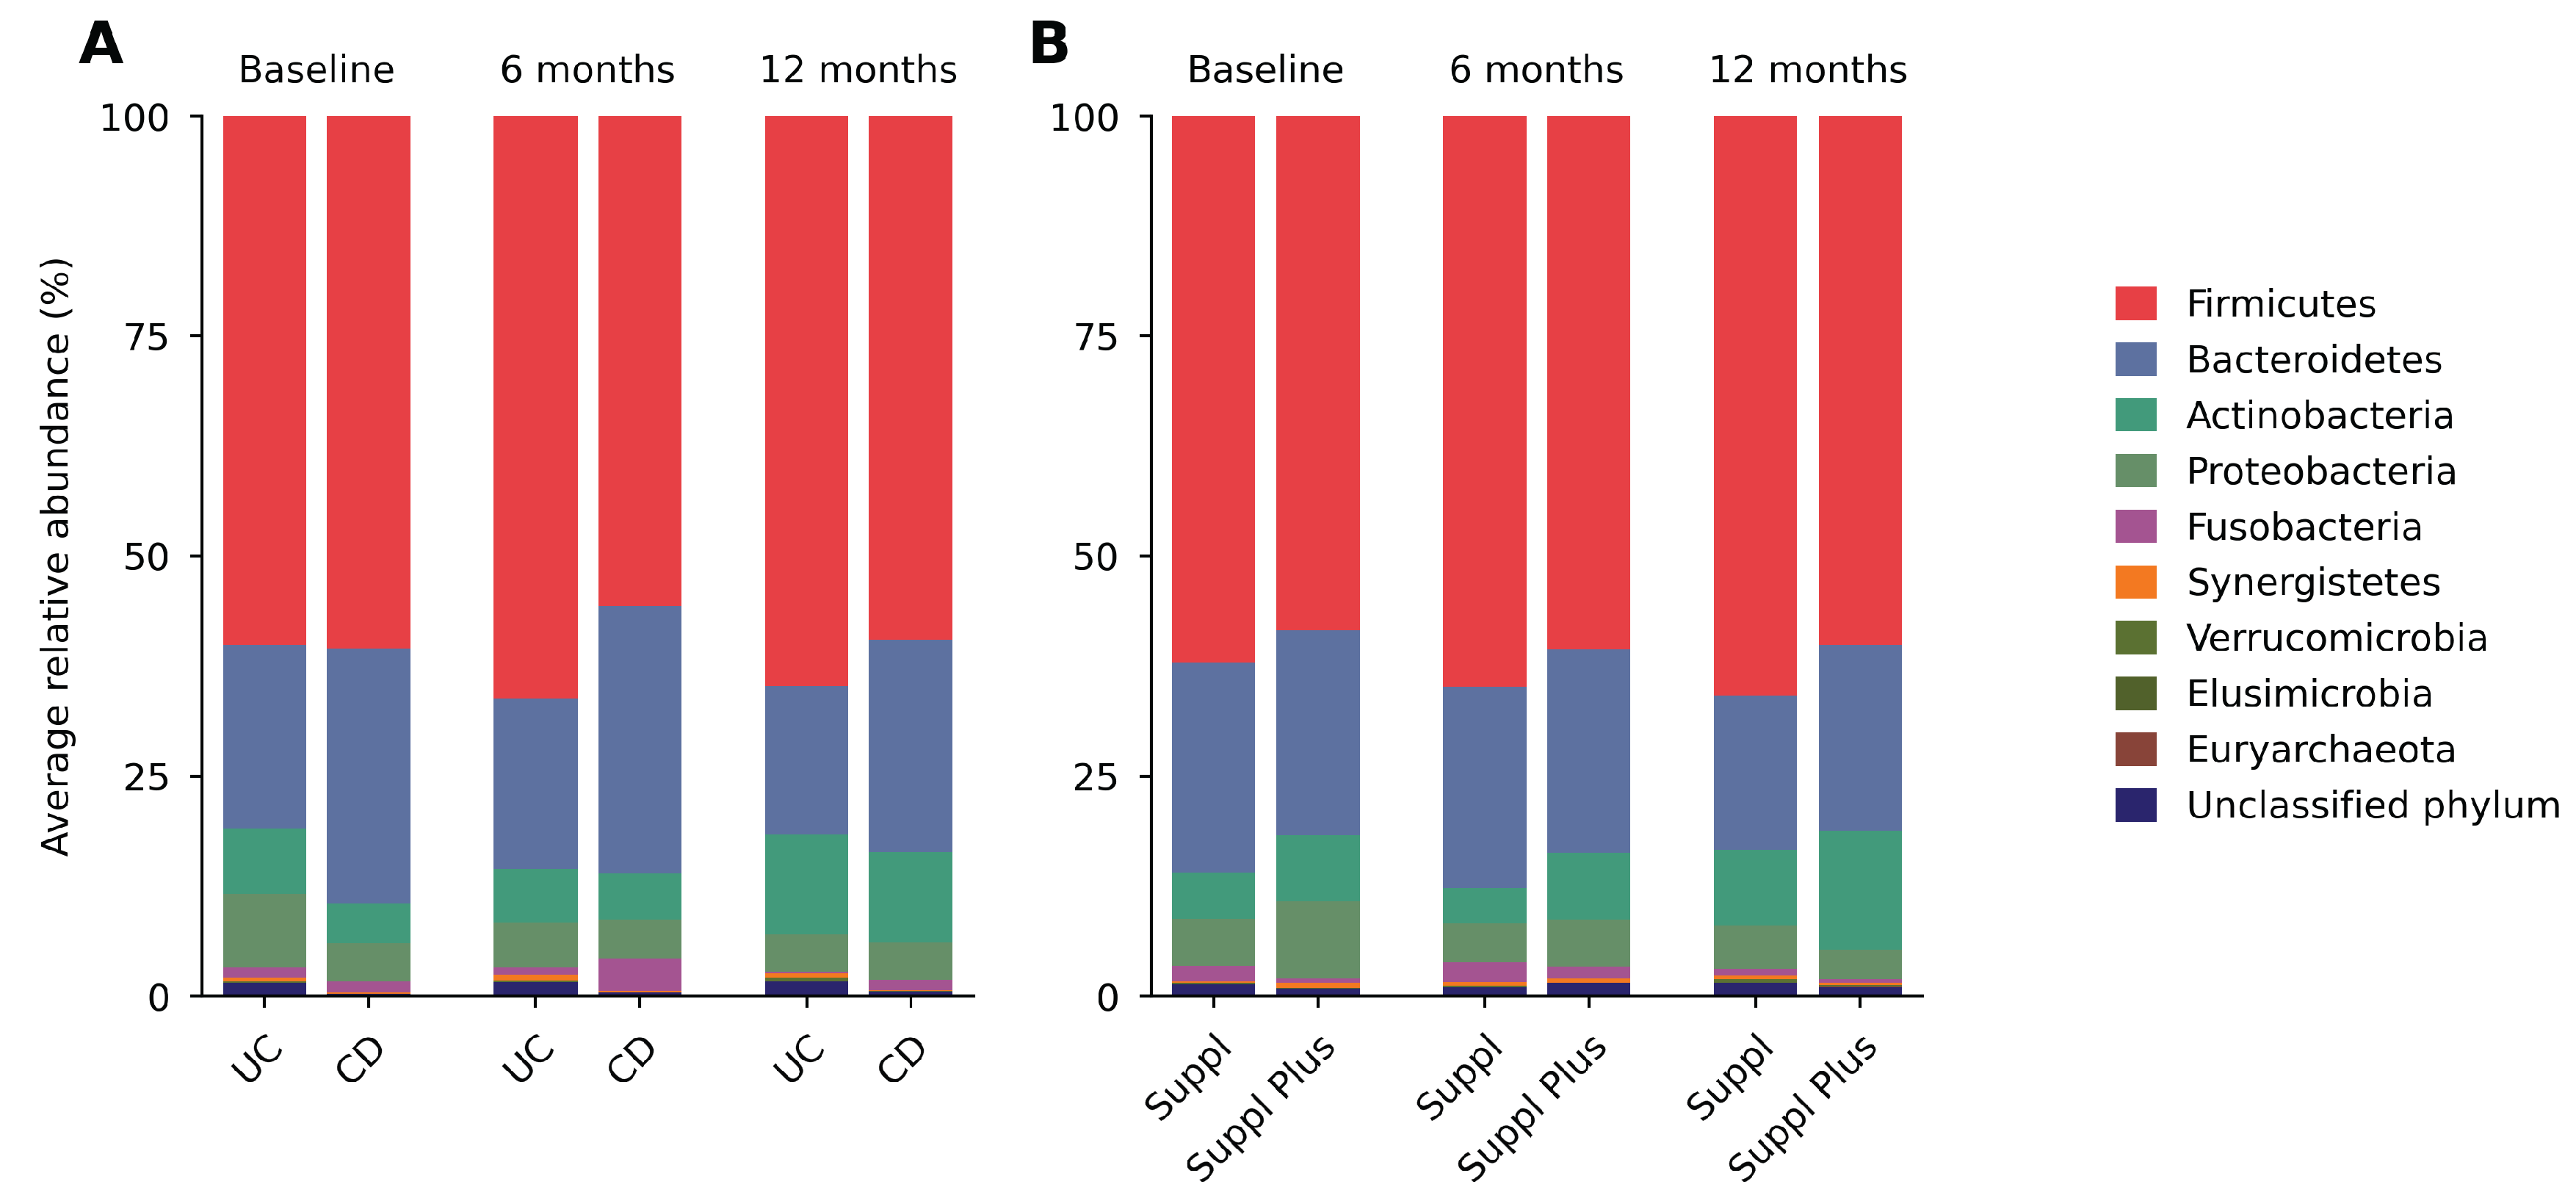
Figure 3.
Average percentage abundance of bacterial genera in UC vs CD groups (A) and in Suppl vs Suppl Plus groups (B) at baseline, 6 months, and 12 months. Means as computed by the sequencing provider. In panel A, the 12-month bars include 49 UC and 26 CD samples because the 12-month sample of one participant with UC was labeled as CD in the provider’s sample metadata (Section 2.5). Genera outside the 20 most abundant are grouped as “Other taxa”.
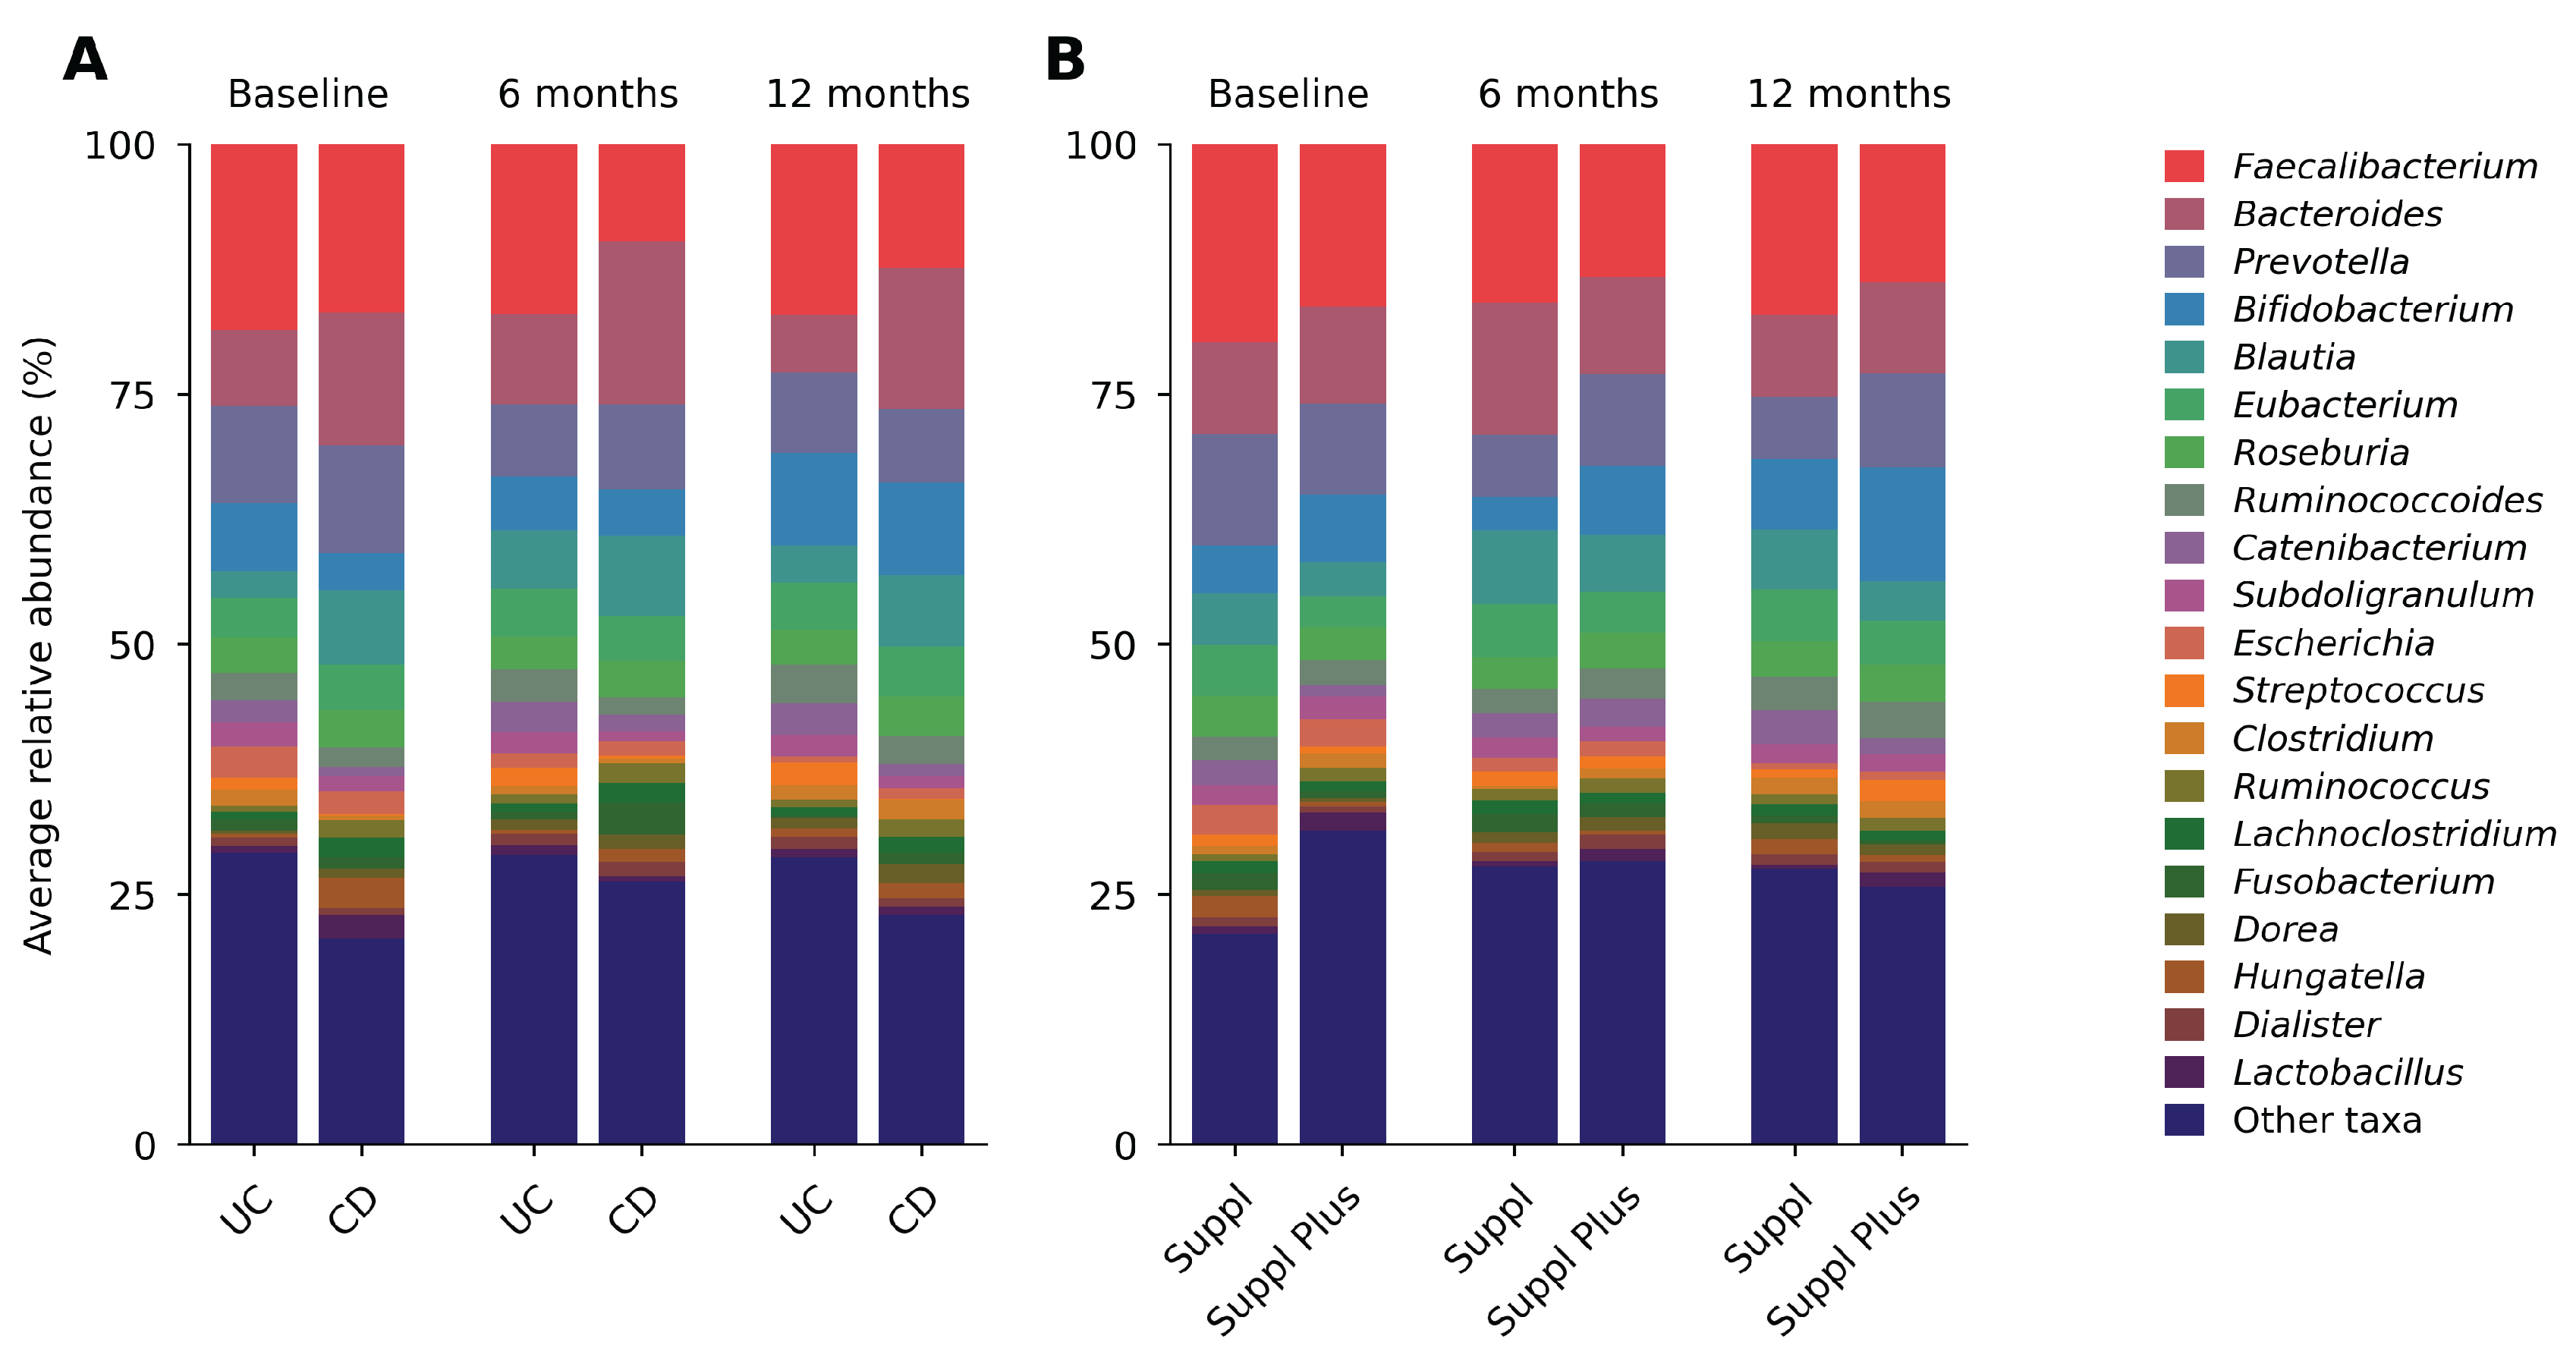
Figure 4.
Differential abundance of phyla in UC over time. Volcano plots of MaAsLin2 estimates at (A) 6 months vs baseline, (B) 12 months vs baseline, and (C) 12 months vs 6 months; purple points denote MaAsLin2 false discovery rate (FDR) , and up to five of these taxa (those with the smallest p values) are labeled in each panel. The analyses include 49 UC samples at 12 months (Section 2.5).
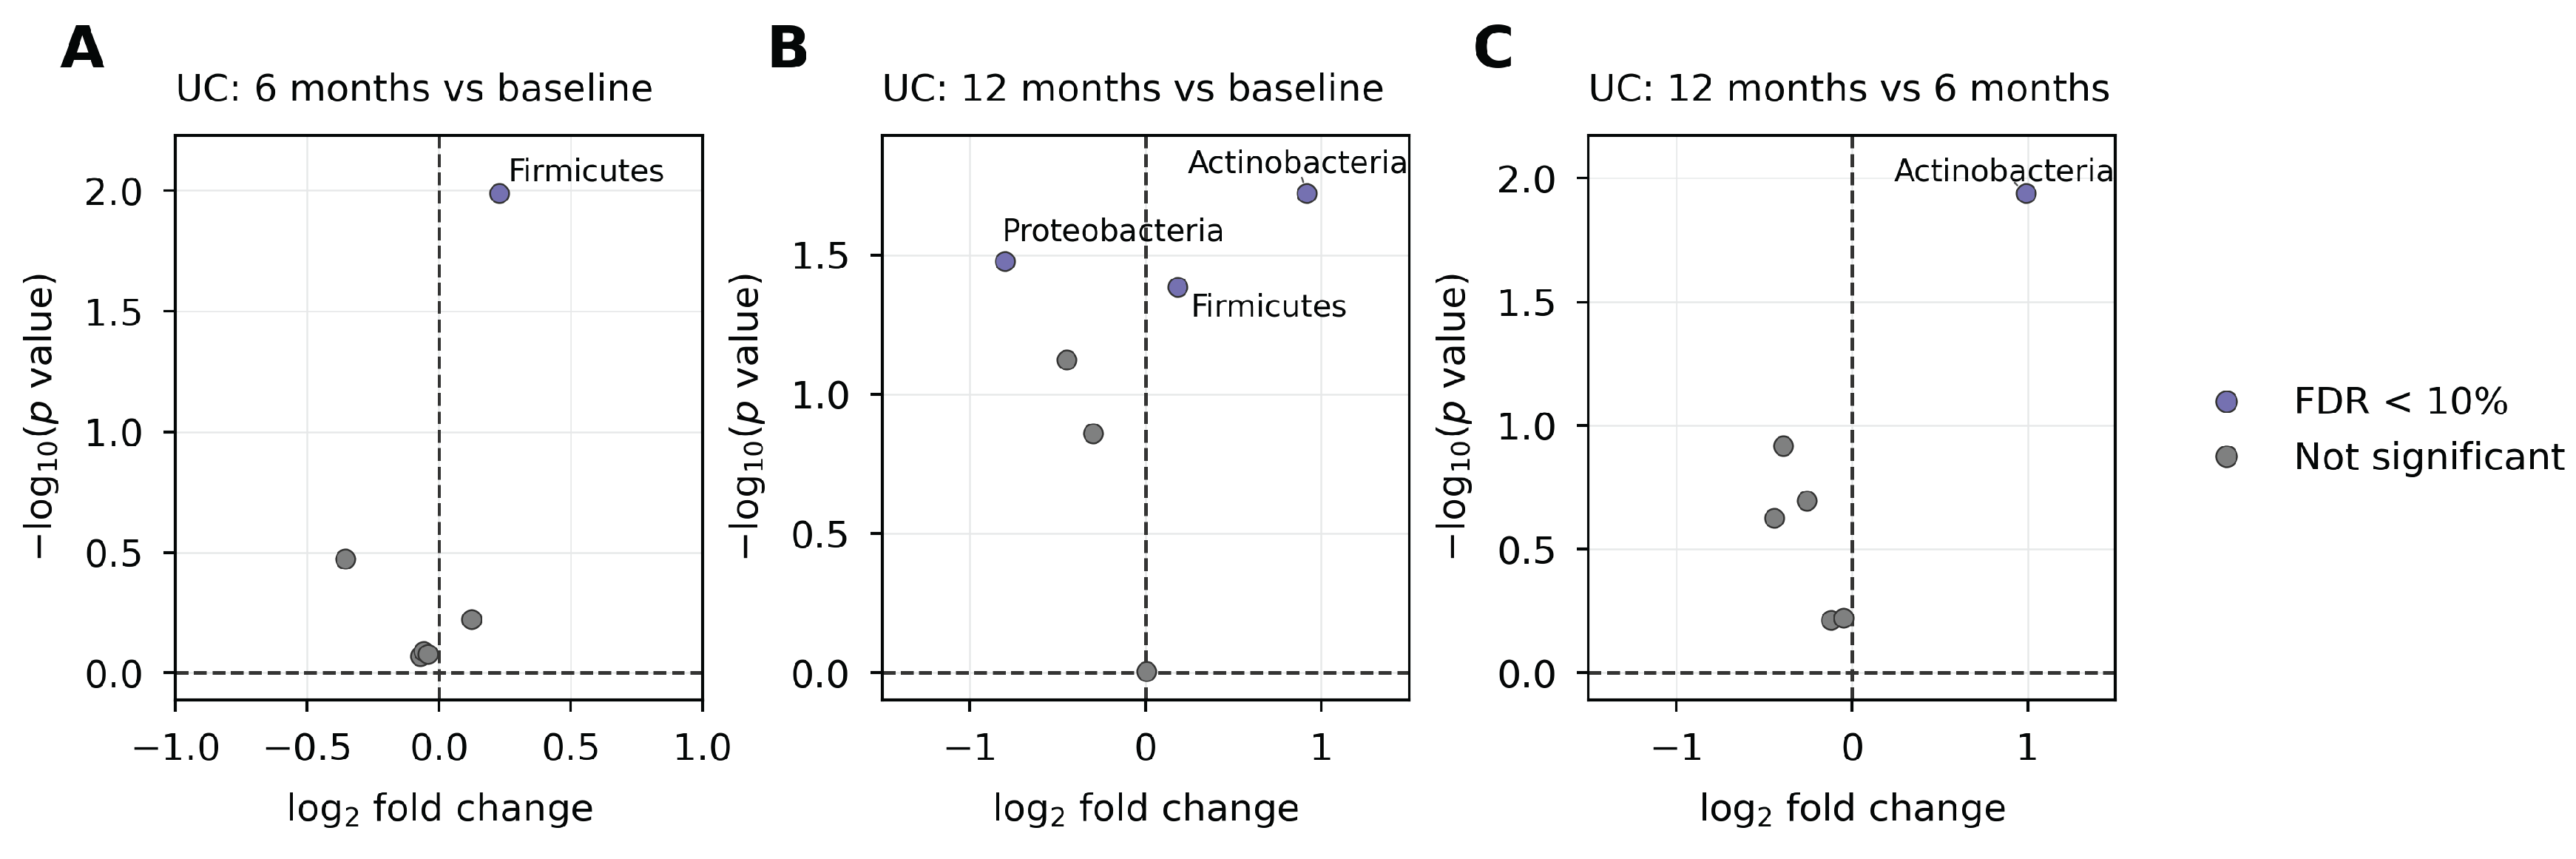
Figure 5.
Differential abundance of phyla in CD over time. Volcano plots of MaAsLin2 estimates at (A) 6 months vs baseline, (B) 12 months vs baseline, and (C) 12 months vs 6 months; purple points denote MaAsLin2 FDR , and up to five of these taxa (those with the smallest p values) are labeled in each panel. The analyses include 26 CD samples at 12 months, one of them from a participant with UC (Section 2.5).
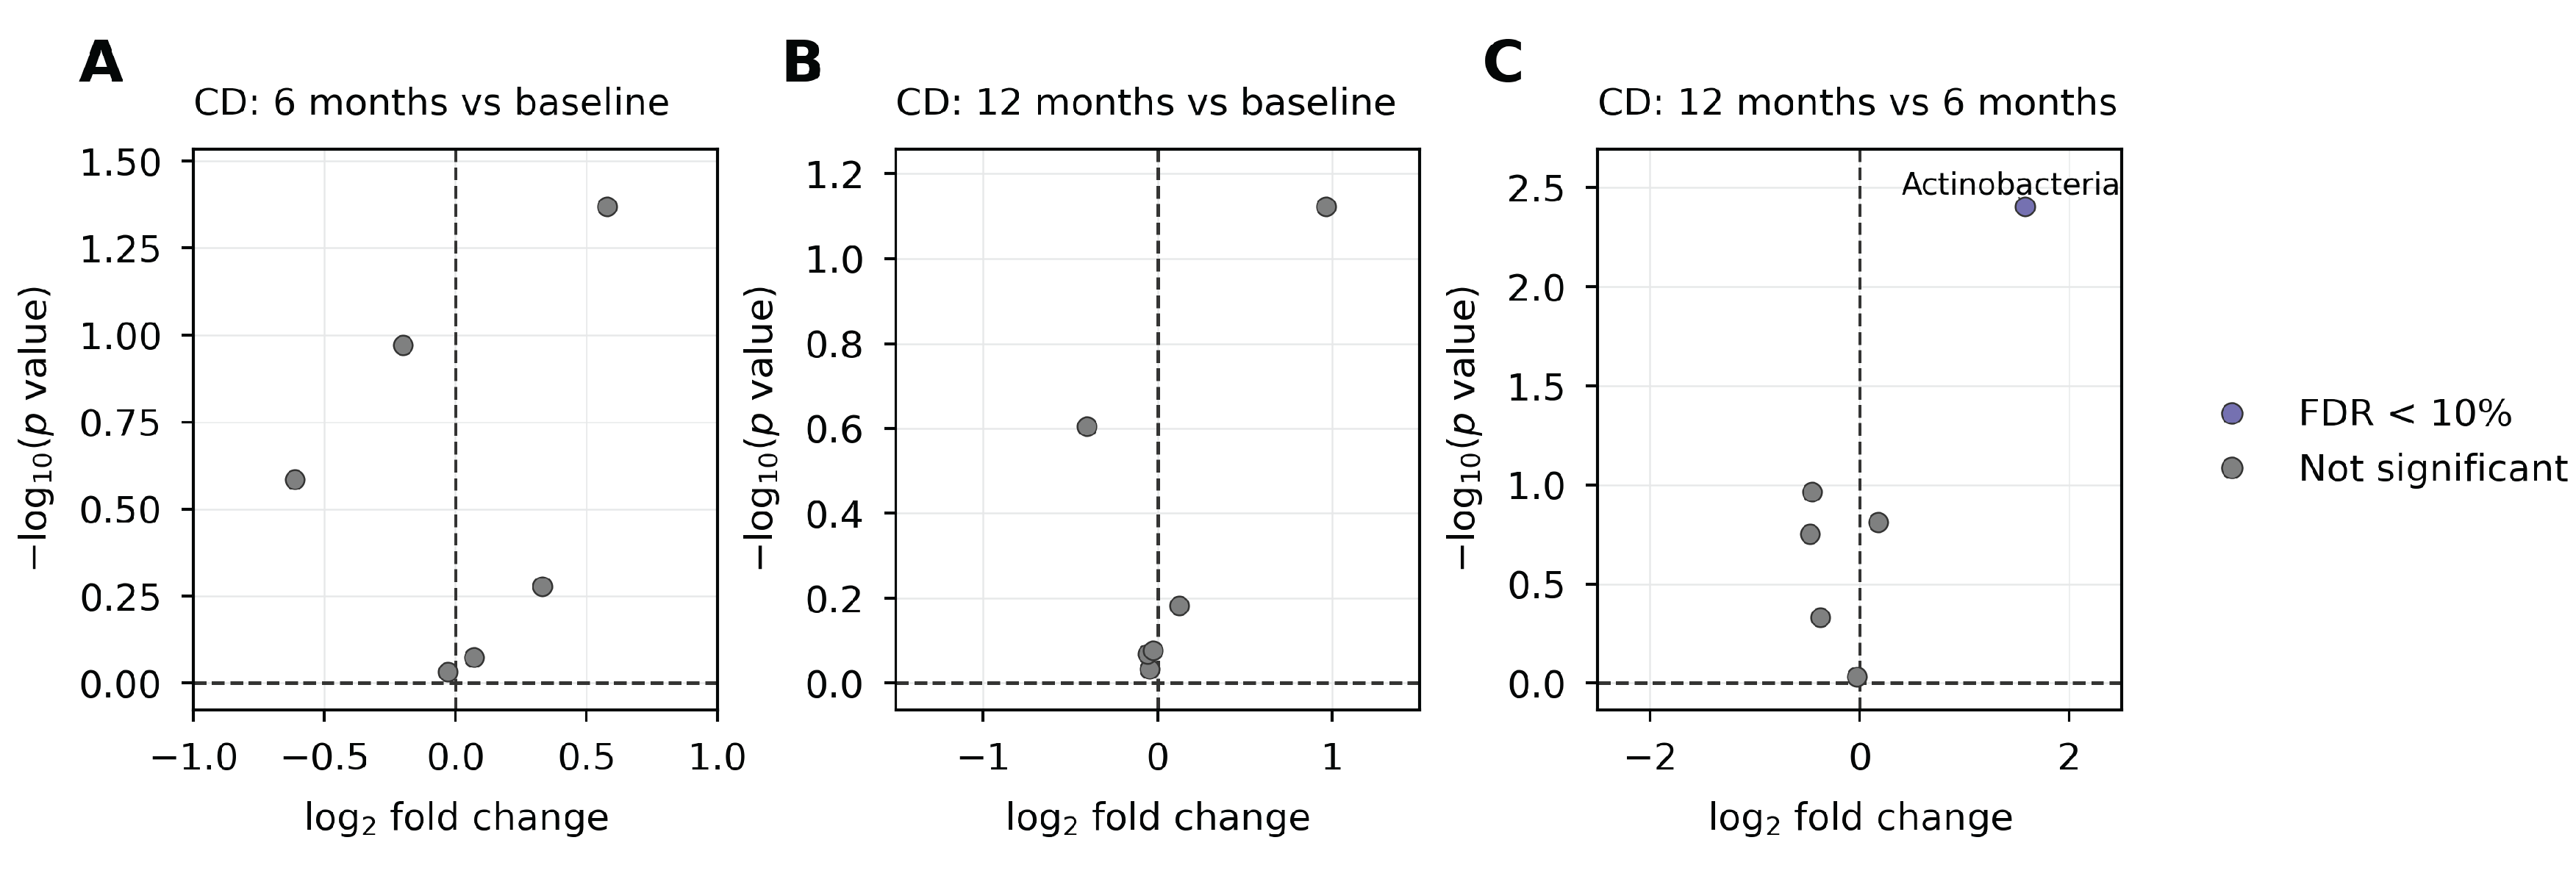
Figure 6.
Differential abundance of genera in UC over time. Volcano plots of MaAsLin2 estimates at (A) 6 months vs baseline, (B) 12 months vs baseline, and (C) 12 months vs 6 months; purple points denote MaAsLin2 FDR , and up to five of these taxa (those with the smallest p values) are labeled in each panel. The analyses include 49 UC samples at 12 months (Section 2.5). Taxa with FDR that are not labeled: (A) Eubacterium, Sutterella, Barnesiella, and Clostridium; (C) Collinsella and Barnesiella.
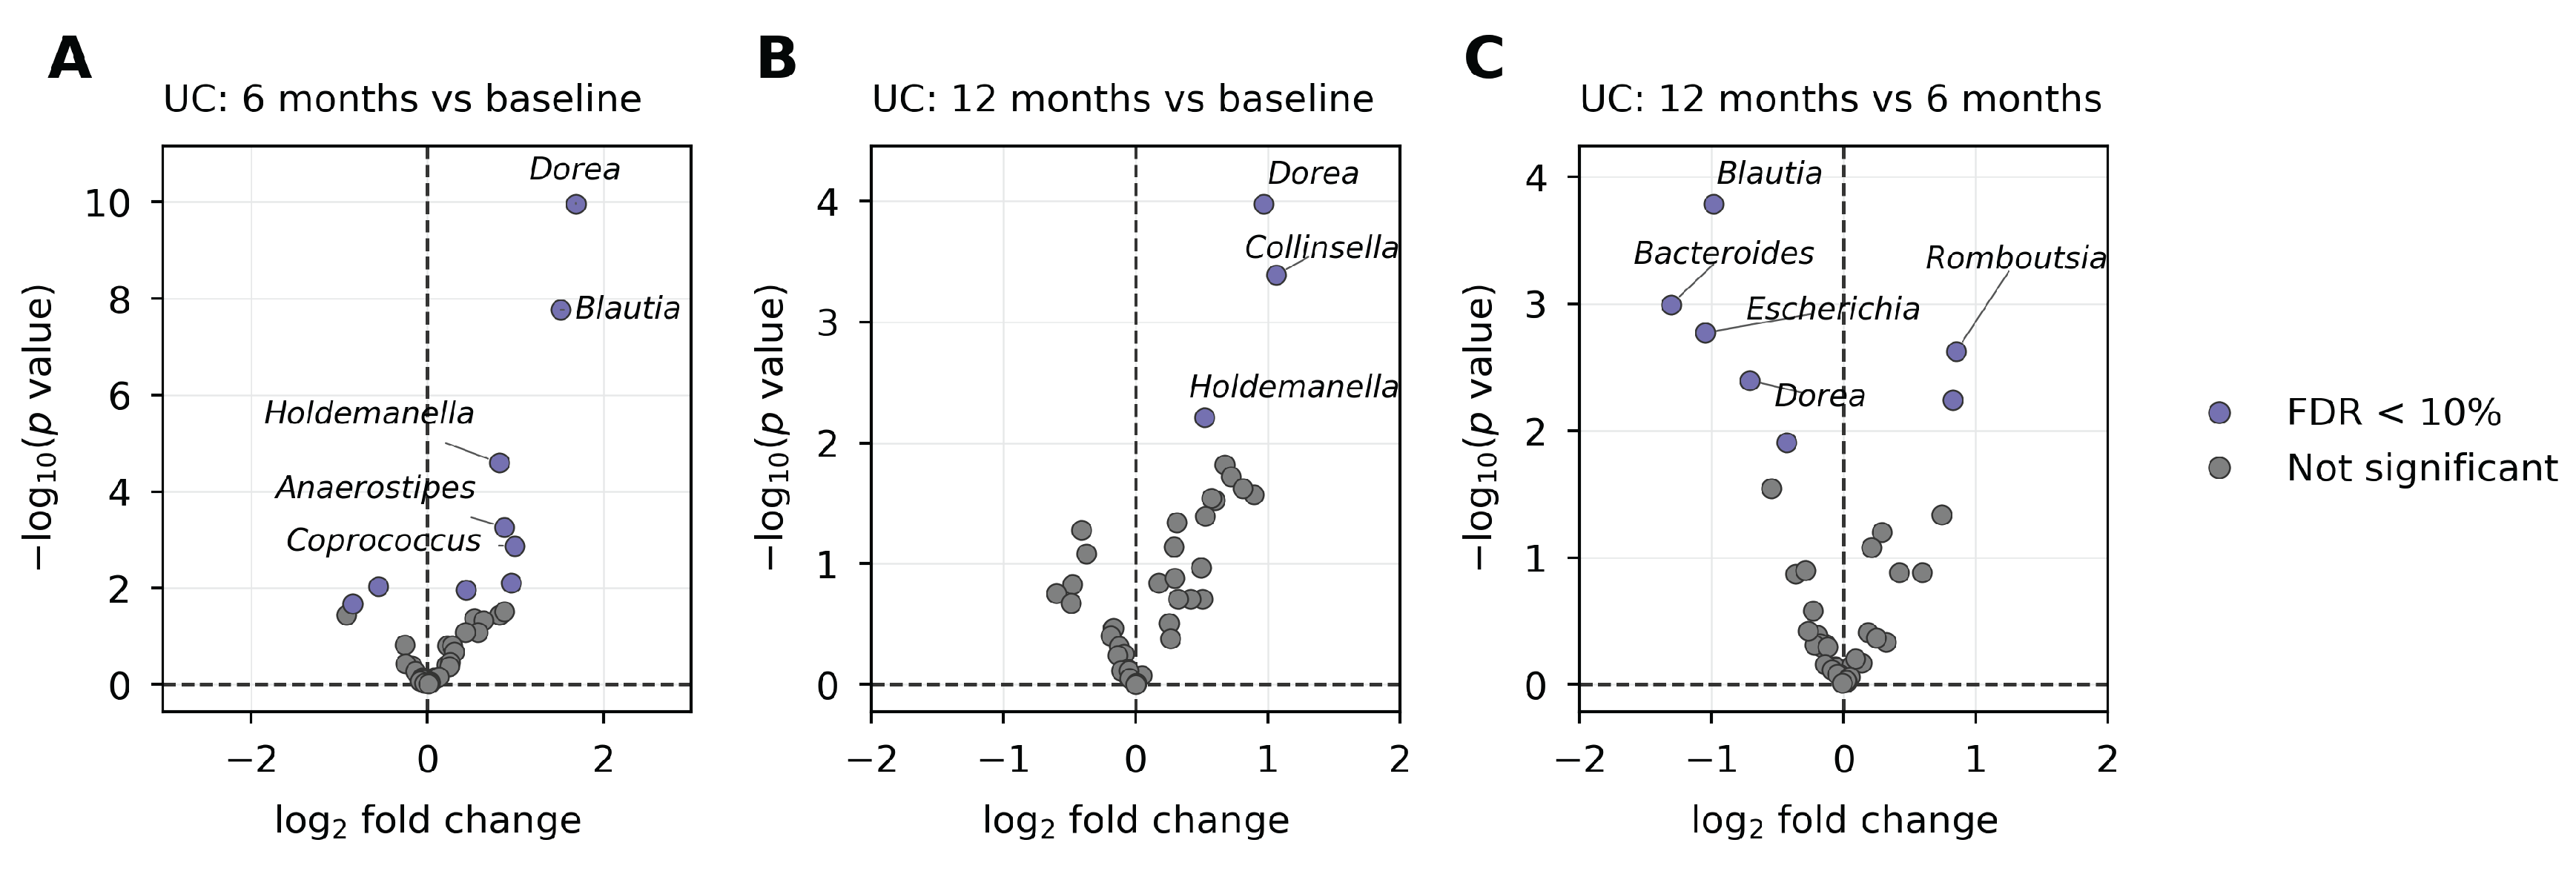
Figure 7.
Differential abundance of genera in CD over time. Volcano plots of MaAsLin2 estimates at (A) 6 months vs baseline, (B) 12 months vs baseline, and (C) 12 months vs 6 months; purple points denote MaAsLin2 FDR , and up to five of these taxa (those with the smallest p values) are labeled in each panel. The analyses include 26 CD samples at 12 months, one of them from a participant with UC (Section 2.5).
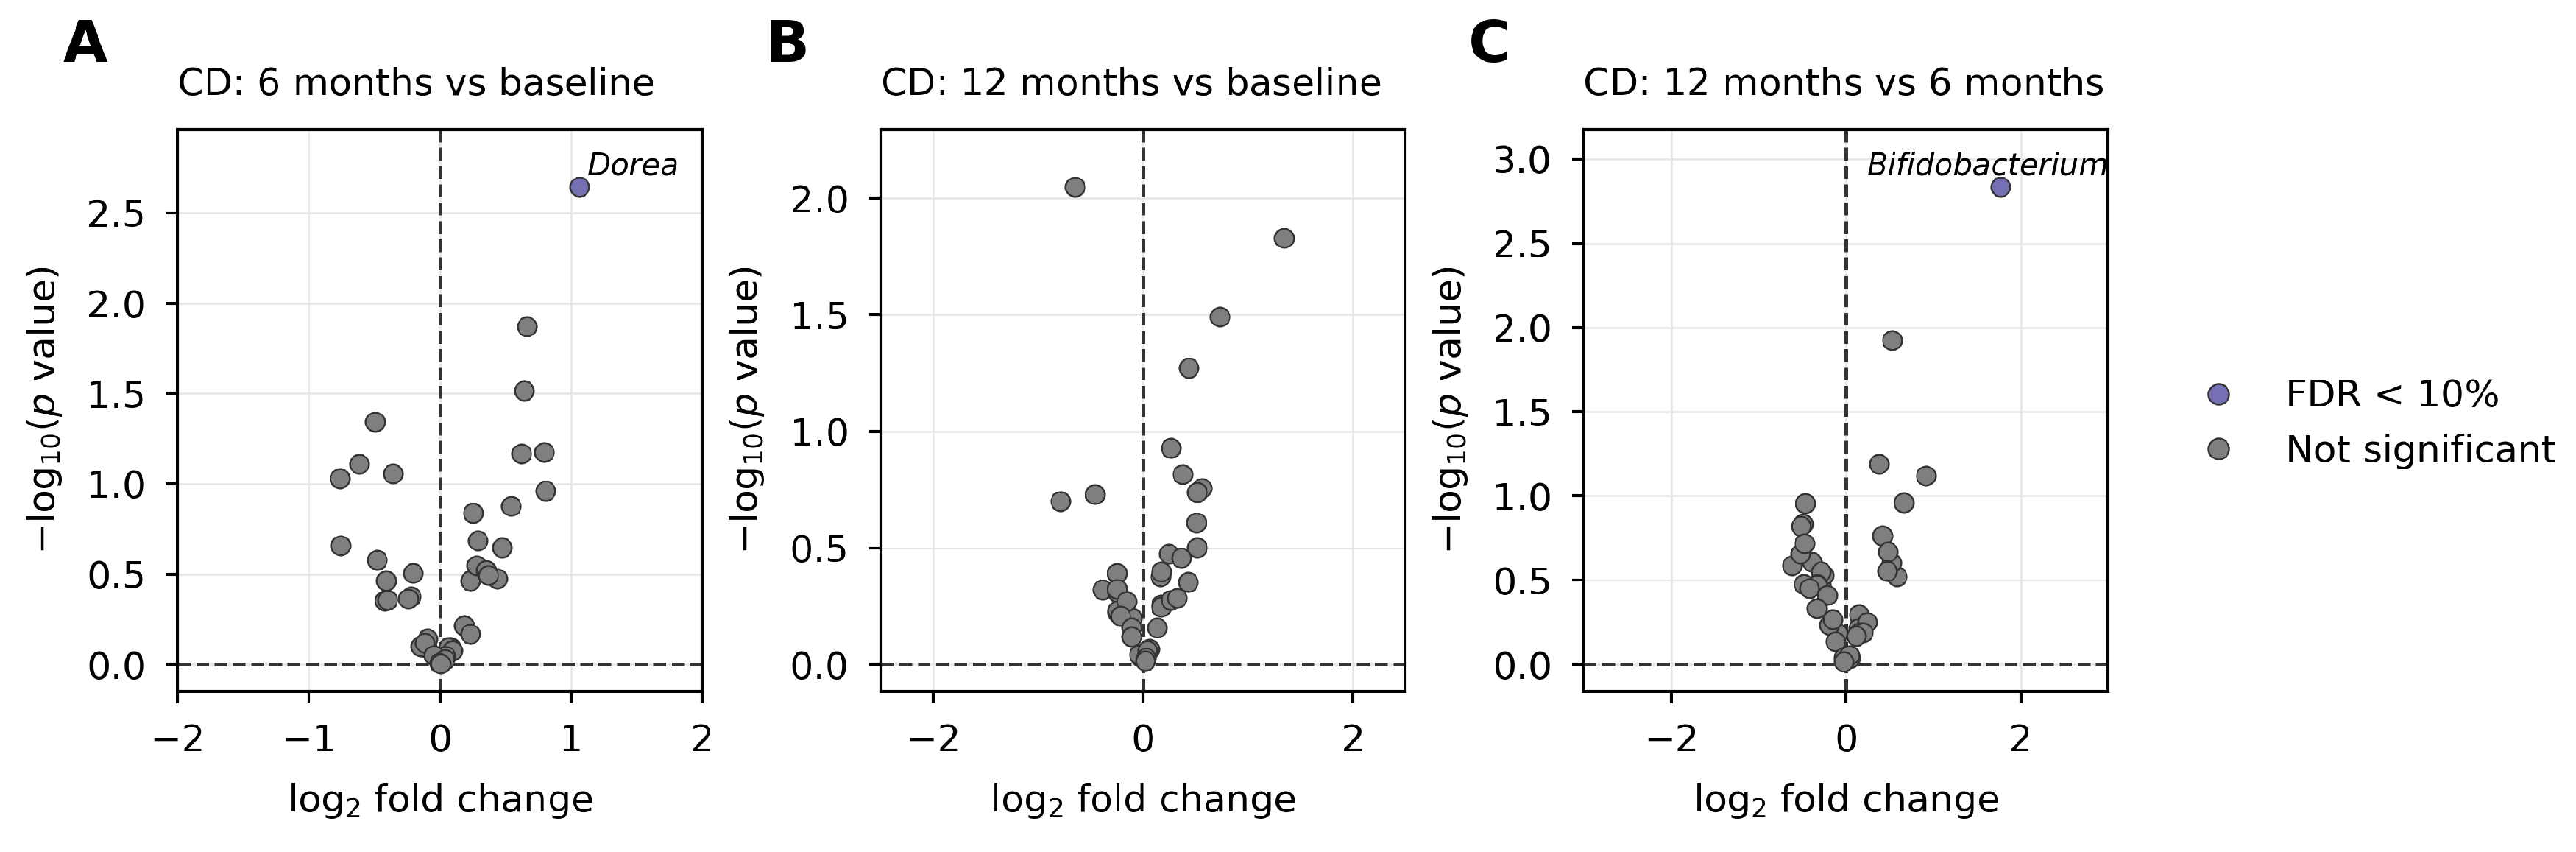

Table 1.
Clinical and laboratory results of the study after 12 months of follow-up.
| Variable | Ulcerative Colitis (n=50) | Crohn’s Disease (n=25) |
|---|---|---|
| REMISSION OR MILD ACTIVITY | ||
| Baseline, n (%) | 22 (44.0) | 22 (88.0) |
| 95% CI baseline | (30.3–58.7) | (67.7–96.8) |
| 12 months, n (%) | 41 (82.0) | 22 (88.0) |
| 95% CI 12 months | (68.1–91.0) | (67.7–96.8) |
| Absolute change in remission, % (95% CI) | 38.0 (19.7–52.9) | 0.0 (–20.5) |
| McNemar p | 1.000 | |
| FECAL CALPROTECTIN (µg/g) | ||
| Baseline, median (IQR) | 406 (90–799) | 241 (120–637) |
| 6 months, median (IQR) | 425 (166–786) | 363 (232–643) |
| 12 months, median (IQR) | 286 (98–521) | 293 (137–518) |
| p (baseline vs 12m) | 0.046 | 0.968 |
| p (6m vs 12m) | 0.007 | 0.019 |
| Within-patient change, median % (IQR) | (–75.6) | (–94.2) |
| C-REACTIVE PROTEIN (mg/L) | ||
| Baseline, median (IQR) | 3.4 (1.8–8.4) | 3.4 (1.2–10.4) |
| 6 months, median (IQR) | 4.3 (1.2–9.8) | 3.5 (1.5–9.5) |
| 12 months, median (IQR) | 3.1 (1.5–6.9) | 3.0 (1.3–10.7) |
| p (baseline vs 6m) | 0.655 | 0.518 |
| p (baseline vs 12m) | 0.633 | 0.874 |
| p (6m vs 12m) | 0.467 | 0.382 |
| Within-patient change, median % (IQR) | (–98.6) | (–106.9) |
| SUPPLEMENTATION STRATEGY COMPARISON | ||
| Suppl, n (%) | 20/24 (83.3) | 12/13 (92.3) |
| Suppl Plus, n (%) | 21/26 (80.8) | 10/12 (83.3) |
| Difference %, (95% CI) | (–18.7) | (–16.6) |
| Fisher p | 1.000 | 0.593 |
| DEMOGRAPHIC CHARACTERISTICS | ||
| Age, years, median (IQR) | 44 (33–59) | 43 (30–58) |
| Female sex, n (%) | 30 (60.0) | 16 (64.0) |
| Disease duration, years, median (IQR) | 8 (6–14) | 10 (6–16) |
Abbreviations: CI, confidence interval; IQR, interquartile range; CD, Crohn’s disease; UC, ulcerative colitis; 6m, 6 months; 12m, 12 months. Note: “Suppl” corresponds to the base formulation; “Suppl Plus” corresponds to base formulation plus silymarin.
Table 2.
Main metabolites identified and their respective functions.
| Metabolite | Function | UC (%) | p-value | CD (%) | p-value |
|---|---|---|---|---|---|
| Xanthine | Redox metabolism | +139% | +193% | ||
| 4-Pyridoxate | B6 metabolism / anti-inflammatory | +130% | 0.00038 | +84% | 0.021 |
| Nicotinate | NAD+ precursor | +105% | 0.0018 | +57% | 0.0094 |
| Threonine | Mucin synthesis | +106% | 0.38 (ns) | +24% | 0.22 (ns) |
Notes: Percent changes () are relative to baseline at 12 months. “ns” = not significant. UC, ulcerative colitis; CD, Crohn’s disease; NAD+, nicotinamide adenine dinucleotide.
Disclaimer/Publisher’s Note: The statements, opinions and data contained in all publications are solely those of the individual author(s) and contributor(s) and not of MDPI and/or the editor(s). MDPI and/or the editor(s) disclaim responsibility for any injury to people or property resulting from any ideas, methods, instructions or products referred to in the content. |
© 2026 by the authors. Licensee MDPI, Basel, Switzerland. This article is an open access article distributed under the terms and conditions of the Creative Commons Attribution (CC BY) license (http://creativecommons.org/licenses/by/4.0/).
Copyright: This open access article is published under a Creative Commons CC BY 4.0 license, which permit the free download, distribution, and reuse, provided that the author and preprint are cited in any reuse.