
Submitted:
13 October 2026
Posted:
14 October 2026
You are already at the latest version
Abstract
A recent paper by Nikolaidis and colleagues provides the first bottom-up calculation of the energetic cost of building 1 kg of wet human skeletal muscle, estimating a central value of 14,570 kJ/kg (3,481 kcal/kg). The paper's most striking finding is that common applied surpluses of 300–500 kcal/day are nearly tenfold higher than the calculated tissue-specific requirement. This commentary accepts the paper's calculation as a valuable reference point and asks two questions that the paper leaves open: (1) What determines the protein deposition efficiency, and (2) Where does the surplus go? The mass-balance framework suggests that protein deposition efficiency is not a free parameter but a consequence of myonuclear capacity, which scales with surface area. And the surplus does not disappear – it goes to fat mass, because muscle accretion is geometrically constrained while fat accretion is not. The commentary proposes a two-panel figure to illustrate both points. The framework is not a critique of the paper; it is a refinement that connects the calculation to the geometry of tissue accretion.
Keywords:
muscle energetics
; protein deposition efficiency
; myonuclear domain
; mass balance
; geometric constraint
; energy surplus
Key Points
- -
- A recent paper by Nikolaidis and colleagues provides the first bottom-up calculation of the energetic cost of building 1 kg of wet human skeletal muscle. The central estimate is 14,570 kJ/kg (3,481 kcal/kg), or approximately 41 kcal/day over an 84-day accretion period.
- -
- The paper’s most striking finding is that common applied surpluses of 300–500 kcal/day are nearly tenfold higher than the calculated tissue-specific requirement.
- -
- The dominant uncertainty in the calculation is the protein deposition efficiency (kP), which varies from 42% to 52%. The mass-balance framework suggests it is not a free parameter – it is constrained by myonuclear capacity, which scales with surface area.
- -
- The 84-day accretion period is treated as an empirical input. The geometric framework suggests it is a consequence of Torricelli-type deceleration: muscle growth slows as mass increases.
- -
- The paper notes the tenfold discrepancy but does not specify where the surplus goes. The mass-balance framework provides the answer: it goes to fat, because muscle accretion is geometrically constrained while fat accretion is not.
- -
- The framework does not reject the paper’s calculation. It contextualizes it. The calculation specifies the cost of building muscle. The framework specifies the constraints on how fast muscle can be built – and where the surplus goes when it cannot.
- -
- A two-panel figure illustrates the geometric baseline of muscle accretion and the partitioning of the surplus between muscle and fat.
1. Introduction
A recent paper by Nikolaidis and colleagues provides the first bottom-up calculation of the energetic cost of building 1 kg of wet human skeletal muscle [1]. The calculation is decomposed into five components: stored tissue energy, biochemical synthesis cost, physiological deposition cost, resting maintenance during accretion, and diet-induced thermogenesis. The central estimate is 14,570 kJ/kg (3,481 kcal/kg), or approximately 41 kcal/day if the tissue is accrued over 84 days – a time frame consistent with typical resistance-training interventions.
The paper’s most striking finding is that common applied surpluses of 300–500 kcal/day are nearly tenfold higher than the calculated tissue-specific requirement [1]. The paper acknowledges this discrepancy and offers several plausible explanations: training expenditure, uncertainty in maintenance-energy estimation, dietary adherence, adaptive changes in energy expenditure, glycogen restoration, recovery demands, and tolerance for some fat gain.
This commentary accepts the paper’s calculation as a valuable reference point. It does not dispute the numbers. It asks two questions that the paper leaves open.
First, what determines the protein deposition efficiency (kP)? The paper treats kP as a free input, noting that it dominates the physiological estimate and remains the main uncertainty in the model. The mass-balance framework suggests that kP is not free – it is constrained by myonuclear capacity, which scales with surface area [2].
Second, where does the surplus go? The paper notes that applied surpluses are almost tenfold higher than the calculated requirement but does not specify the fate of the excess. The mass-balance framework suggests that the excess goes to fat mass, because muscle accretion is geometrically constrained while fat accretion is not [3,4].
The commentary is not a critique of the paper. It is a refinement that connects the calculation to the geometry of tissue accretion.
2. What the Paper Does Well
Before considering the open questions, it is worth stating what the paper does well – because the commentary’s suggestions are refinements, not corrections.
It distinguishes levels of energetic accounting. The paper explicitly separates stored tissue energy, biochemical synthesis cost, physiological deposition cost, resting maintenance, and diet-induced thermogenesis [1]. This is a genuine advance. Earlier discussions of the “energy cost of muscle” often conflated these levels, making it impossible to compare estimates from different sources.
It is transparent about assumptions. The paper states its reference composition, its energy parameters, and its deposition efficiencies. It provides sensitivity ranges. It acknowledges the limitations of its data sources – particularly the reliance on infant and animal data for kP [1].
It provides a practical reference point. The estimate of 14,570 kJ/kg is not a universal constant, as the paper explicitly notes. It is a reference point against which claims about muscle accretion can be evaluated [1].
It identifies the tenfold discrepancy. This is the paper’s most important empirical finding. It is not a new observation – practitioners have long noted that large surpluses lead to fat gain – but the paper quantifies the discrepancy explicitly and shows that it cannot be attributed to the energetic cost of muscle alone [1]. The paper’s own cited studies confirm this: higher or faster energy surpluses can increase fat mass without proportional gains in skeletal muscle [5].
The commentary builds on these strengths. It does not replace them.
3. The Dominant Uncertainty: kP and Its Geometric Basis
The paper identifies protein deposition efficiency (kP) as the parameter that dominates the physiological estimate and remains the main uncertainty in the model. The central value is 46%, with a range of 42% to 52% [1]. The data come primarily from infants and growing animals, because no direct measurements exist for adult human skeletal muscle accretion.
The paper treats kP as a free input. But is it?
In the mass-balance framework, protein synthesis capacity is limited by the transcriptional machinery – the myonuclei – which are distributed near the sarcolemma. Nuclear number N adheres to the relationship N = aVb, where V is cytoplasmic volume and b < 1 [2]. In adult humans, N scales linearly to cell surface [2]. This means that the transcriptional capacity available per unit of cytoplasm declines as the fiber grows.
The consequence is direct. The protein deposition efficiency is not a molecular constant. It is a whole-system coefficient that reflects the balance between synthesis capacity (surface-limited) and maintenance requirements (volume-limited). As the muscle fiber grows, the ratio of surface to volume falls, and the efficiency of further deposition declines. The parameter kP is not a free input. It is a function of fiber size.
What this means for the paper. The paper’s use of a fixed kP (46%) is a reasonable approximation for a single kilogram of muscle. But the same calculation applied to a larger muscle would yield a different effective kP, because the geometric constraints change. The 42–52% range reported in the paper may reflect not just measurement uncertainty but biological variation in fiber size and myonuclear density.
A testable prediction. If kP is geometrically constrained, then individuals with larger muscle fibers (e.g., experienced lifters) should show lower effective kP than individuals with smaller fibers (e.g., novices), at matched training stimuli. This is testable with muscle biopsies and stable-isotope measurements of protein synthesis.
4. The Assumed Accretion Time: 84 Days and Its Geometric Basis
The paper assumes that 1 kg of wet muscle is accrued over approximately 84 days, citing Morton et al. [1]. This is a reasonable empirical estimate. But it is treated as a fixed input, not as a consequence of anything.
The mass-balance framework suggests that the accretion time is not fixed. It is a consequence of Torricelli-type deceleration. Muscle growth is surface-limited: synthesis capacity scales with M2/3, while maintenance scales with M [3]. As mass increases, net growth decelerates. The 84-day period is not a biological constant. It is the time required for a specific muscle to traverse a specific range of its growth curve.
What this means for the paper. The 41 kcal/day figure is calculated by dividing the total cost by 84 days. But the actual daily cost is not constant. It is higher at the beginning of the accretion period and lower at the end, because growth is faster when the muscle is smaller. The 41 kcal/day is an average, not a rate. The distinction matters when the estimate is compared with daily surplus recommendations.
A testable prediction. If accretion follows a geometric baseline, then the daily energy cost should decline over the intervention period. The early weeks should require more energy per day than the later weeks. This is testable with frequent body-composition measurements and paired energy-balance assessments.
5. Where Does the Surplus Go?
The paper’s most striking finding is that common surpluses of 300–500 kcal/day are nearly tenfold higher than the calculated tissue-specific requirement of 41 kcal/day [1]. The paper acknowledges this and suggests several explanations. But it does not specify where the surplus goes.
The mass-balance framework provides an answer. The surplus does not disappear. It goes to mass. And since muscle accretion is geometrically constrained – the rate is limited by surface-to-volume ratio and myonuclear capacity – the surplus cannot go to muscle beyond the constrained rate. It goes to fat.
This is not an assumption. It is a consequence of the framework’s compartmental logic. Different tissues have different clearance coefficients and different geometric constraints. Muscle is constrained: its accretion is surface-limited and myonuclear-limited. Fat is not constrained in the same way: its storage capacity is not surface-limited to the same degree, and it can expand without the same myonuclear bottleneck. When the surplus arrives, it is partitioned between compartments according to their capacities to accept it. Muscle can accept only a small fraction. Fat accepts the rest.
The empirical confirmation. The paper’s own cited studies confirm this. Garthe et al. [5] found that higher energy surpluses increased fat mass without proportional gains in skeletal muscle. This is exactly what the framework predicts. The surplus is not a muscle-building signal. It is a mass signal, and most of the mass goes to the compartment with the fewest geometric constraints.
What this means for practice. The practical message is not that athletes should add 41 kcal/day. The paper explicitly rejects this interpretation. The message is that the common surplus recommendation – 300–500 kcal/day – is not a recommendation for muscle accretion. It is a recommendation for weight gain, of which some fraction is muscle and some fraction is fat. The paper’s calculation quantifies the muscle fraction. The framework quantifies the rest.
A testable prediction. Under a 300–500 kcal/day surplus, the ratio of fat mass gain to lean mass gain should be approximately tenfold higher than the ratio predicted by the tissue-specific energetic requirement alone. This is testable with body-composition measurements in overfeeding studies.
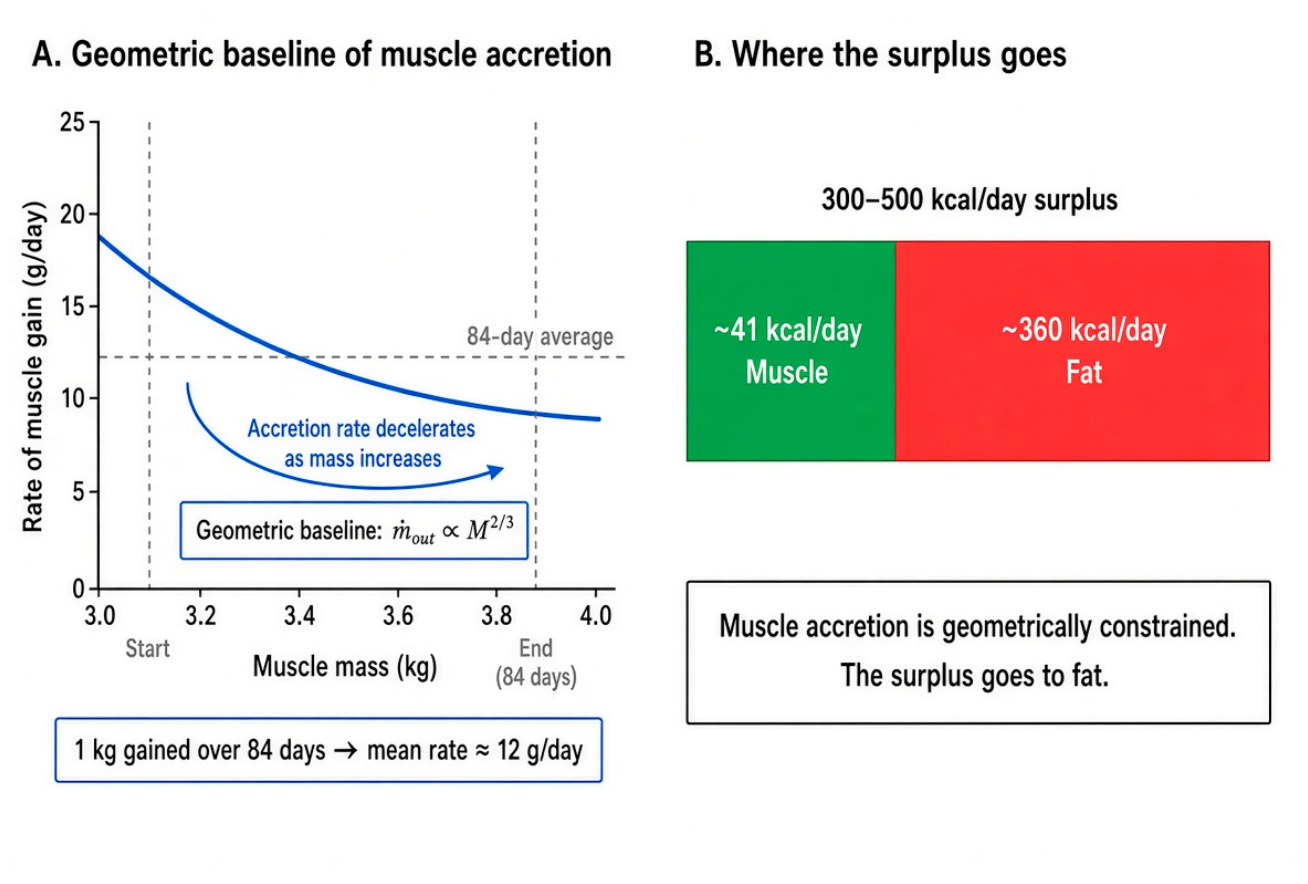
Figure 1 illustrates both the geometric baseline of muscle accretion and the partitioning of the surplus. Panel A shows that muscle growth decelerates as mass increases. Panel B shows that the surplus cannot go to muscle beyond the constrained rate.
6. What the Paper Does Not Do
The paper does not do several things, and it is worth being explicit about them – not as criticism, but as a map of what remains.
It does not model the geometric constraints on accretion. The 84-day period is an input, not an output. A geometric model would derive it from the surface-to-volume ratio and the myonuclear capacity of the muscle.
It does not partition the surplus. The paper notes the tenfold discrepancy but does not specify the fate of the excess. A mass-balance model would partition it between fat and lean compartments according to their clearance coefficients.
It does not account for individual variation. The calculation is for a generic kilogram of muscle. It does not address why some individuals gain muscle faster than others, or why some gain more fat at the same surplus. The geometric framework attributes this variation to differences in myonuclear density, fiber size, and compartment-specific clearance.
It does not connect to the broader framework. The paper is a standalone calculation. The mass-balance framework situates it within a larger theory of tissue accretion that applies to muscle, fat, tumor, and other mass reservoirs [3,4,6].
None of these omissions are flaws. They are boundaries. The paper is a calculation; the framework is a theory. The calculation is a valuable input to the theory.
7. Predictions
If the mass-balance framework is correct for muscle accretion, five predictions follow.
Prediction 1: The effective kP declines as fiber size increases. Individuals with larger muscle fibers should show lower protein deposition efficiency at matched training stimuli. This is testable with muscle biopsies and stable-isotope measurements.
Prediction 2: The daily energy cost of accretion declines over the intervention period. The early weeks should require more energy per day than the later weeks, because growth is faster when the muscle is smaller. This is testable with frequent body-composition measurements.
Prediction 3: The 84-day accretion period is not a constant. It should vary with initial muscle mass, training stimulus, and individual myonuclear capacity. This is testable with meta-analysis of training studies.
Prediction 4: Under a 300–500 kcal/day surplus, the fat-to-lean gain ratio is approximately tenfold higher than the tissue-specific prediction. This is testable with overfeeding studies and body-composition measurements.
Prediction 5: The geometric model predicts accretion trajectories more accurately than a constant-rate model. The model form is based on surface-to-volume scaling, not curve-fitting. This is testable with existing training data.
8. Conclusion
The paper by Nikolaidis and colleagues is a valuable contribution. It provides the first bottom-up calculation of the energetic cost of building 1 kg of wet human skeletal muscle. Its central estimate of 14,570 kJ/kg is a reference point against which claims about muscle accretion can be evaluated. Its identification of the tenfold discrepancy between applied surpluses and tissue-specific requirements is an important empirical finding.
The mass-balance framework does not dispute the calculation. It asks two questions that the paper leaves open. First, what determines the protein deposition efficiency? The framework suggests it is not a free parameter but a consequence of myonuclear capacity, which scales with surface area. Second, where does the surplus go? The framework suggests it goes to fat mass, because muscle accretion is more geometrically constrained than fat accretion.
These are not criticisms. They are refinements. The paper specifies the cost. The framework specifies the constraints. Together, they provide a more complete picture of what happens when a resistance-trained athlete eats a surplus.
Author Contributions
This is a single-authored paper.
Funding
This research did not receive any specific grant from funding agencies in the public, commercial, or not-for-profit sectors.
Ethics Approval and Consent to Participate
Not applicable.
Consent for Publication
Not applicable.
Availability of Data
All data generated or analyzed during this study are contained in the sources cited.
Acknowledgments
I thank Michalis G. Nikolaidis and colleagues for the careful calculation that prompted this commentary. I also thank colleagues for discussions on muscle energetics, myonuclear domain, and the geometric constraints on tissue accretion.
Conflicts of Interest
The author declares no conflict of interest.
References
- Nikolaidis, M.G.; Paschalis, V.; Margaritelis, N.V. The energetic cost of building human skeletal muscle: a quantitative bottom-up accounting model. bioRxiv 2026. [Google Scholar] [CrossRef]
- Hansson, K.A.; Eftestøl, E.; Bruusgaard JCet, a.l. Myonuclear content regulates cell size with similar scaling properties in mice and humans. Nat. Commun. 2020, 11(1), 6288. [Google Scholar] [CrossRef] [PubMed] [PubMed Central]
- Manninen, A.H. Muscle Mass Is Geometry: Why Hypertrophy and Atrophy Decelerate for the Same Reason. Preprints 2026, 2026100231. [Google Scholar] [CrossRef]
- Manninen, A.H. Beyond the Allometric Baseline: Modulating Compartment-Specific Mass Clearance to Maximize Visceral Fat Loss. Preprints 2026, 2026100447. [Google Scholar] [CrossRef]
- Garthe, I.; Raastad, T.; Refsnes, P.E.; Sundgot-Borgen, J. Effect of nutritional intervention on body composition and performance in elite athletes. Eur. J. Sport Sci. 2013, 13(3), 295–303. [Google Scholar] [CrossRef] [PubMed]
- Manninen, A.H. Mass Balance over Energy Balance: Why Direct Mass Accounting Offers a More Precise and Mechanistically Faithful Framework for Human Body Weight Regulation. Preprints 2026, 2026040690. [Google Scholar] [CrossRef]
Figure 1.
The geometric baseline and the partitioning of the surplus. (A) Muscle growth is surface-limited: synthesis capacity scales with M2/3, while maintenance scales with M. As mass increases, net growth decelerates. The 84-day accretion period is not a biological constant – it is a consequence of the geometry. (B) Under a 300–500 kcal/day surplus, approximately 41 kcal/day can be directed to muscle. The remainder – approximately 360 kcal/day – is stored as fat. The surplus is not a muscle-building signal. It is a mass signal, and most of the mass goes to the compartment with the fewest geometric constraints.
Disclaimer/Publisher’s Note: The statements, opinions and data contained in all publications are solely those of the individual author(s) and contributor(s) and not of MDPI and/or the editor(s). MDPI and/or the editor(s) disclaim responsibility for any injury to people or property resulting from any ideas, methods, instructions or products referred to in the content. |
© 2026 by the authors. Licensee MDPI, Basel, Switzerland. This article is an open access article distributed under the terms and conditions of the Creative Commons Attribution (CC BY) license (http://creativecommons.org/licenses/by/4.0/).
Copyright: This open access article is published under a Creative Commons CC BY 4.0 license, which permit the free download, distribution, and reuse, provided that the author and preprint are cited in any reuse.