

Submitted:
13 October 2026
Posted:
14 October 2026
You are already at the latest version
Abstract
Neonatal infections remain a major clinical challenge, particularly in preterm infants. This single-center retrospective observational study compared clinical, maternal, perinatal, laboratory, microbiological, antimicrobial resistance, and therapeutic characteristics between 10 preterm and 42 term neonates treated for suspected neonatal infection between January 2024 and April 2026. Microbiological support for infection was identified in 48/52 neonates (92.3%). Most inflammatory indices did not differ significantly between groups. Among neonates with available procalcitonin measurements (n = 14), concentrations were higher in preterm than in term neonates (p = 0.008); however, this finding should be considered exploratory because of the limited sample size. ESBL-producing Enterobacterales were more frequently identified in preterm than in term neonates (57.1% vs. 14.8%, p = 0.037), although based on small numbers. Meropenem use was more frequent in preterm neonates (30.0% vs. 2.4%, p = 0.019), and antimicrobial treatment duration was longer (median 7.5 vs. 5.0 days, p = 0.041). These findings suggest differences in antimicrobial resistance and treatment patterns between preterm and term neonates and support continued local microbiological surveillance and antimicrobial stewardship.
Keywords:
neonatal infection
; preterm infants
; procalcitonin
; antimicrobial resistance
; ESBL-producing Enterobacterales
; antimicrobial stewardship
1. Introduction
According to UNICEF, approximately 2.3 million neonates die each year, and infections are among the leading causes of these deaths, together with prematurity and birth-related complications. Neonatal infections represent one of the leading causes of mortality during the neonatal period and contribute substantially to the global burden of pediatric infectious diseases [1,2]. Despite major advances in prenatal care, neonatal intensive care, microbiological diagnostics, and antimicrobial therapy, neonatal sepsis remains associated with high mortality and an increased risk of long-term neurological and neurodevelopmental sequelae, particularly among preterm infants and neonates with low birth weight [2,3]. Early diagnosis remains challenging because clinical manifestations are often nonspecific and overlap with those of other neonatal conditions. Rapid recognition of infection and prompt initiation of appropriate antimicrobial therapy are essential to reduce mortality and complications [3,4].
Prematurity is one of the most important risk factors for the development of neonatal infections and their severe clinical course. The increased vulnerability of preterm infants is attributable to both the functional immaturity of the immune system and the frequent need for invasive medical procedures and prolonged hospitalization [5,6,7]. Compared with term neonates, preterm infants exhibit impaired neutrophil and monocyte function, reduced phagocytic activity, decreased production of proinflammatory cytokines, and lower levels of maternally derived immunoglobulins transferred transplacentally. Furthermore, the incomplete development of the skin and mucosal barriers facilitates the invasion of pathogenic microorganisms. These characteristics increase susceptibility to invasive infections and limit the ability of the host to regulate the inflammatory response [5,7,8]. The risk of infection is further increased by the use of mechanical ventilation, central vascular catheters, parenteral nutrition, and prolonged hospitalization in neonatal intensive care units (NICUs) [5,6]. Numerous studies have demonstrated that both the incidence of neonatal sepsis and the associated mortality increase progressively with decreasing gestational age and birth weight, with extremely preterm infants representing the group at the highest risk of severe infections and colonization with multidrug-resistant microorganisms [5,6,9].
The development of neonatal infections is influenced by a complex interaction between maternal, obstetric, and neonatal factors [10,11]. Prolonged rupture of membranes, chorioamnionitis, intrapartum fever, maternal colonization with pathogenic microorganisms, and urinary tract infections during pregnancy are the principal risk factors for early-onset neonatal infections because they facilitate the vertical transmission of pathogens [10,11,12]. The likelihood of developing neonatal sepsis increases significantly when the duration of membrane rupture exceeds 18 h, particularly in preterm infants [10,13]. Maternal conditions such as gestational diabetes mellitus and pregnancy-associated hypertension, as well as placental inflammatory processes, may be associated with neonatal infection risk, although the strength and underlying mechanisms of these associations may vary [13,14]. Assessment of these risk factors is essential for both infection risk stratification and the implementation of preventive and therapeutic strategies during the perinatal period [13,14]. The integration of maternal and obstetric factors with the clinical and microbiological findings of the newborn provides a more comprehensive understanding of the mechanisms involved in the development of neonatal infections and may facilitate the identification of high-risk groups [11,13].
The neonatal inflammatory response results from the activation of innate immune mechanisms following exposure to pathogenic microorganisms [15,16]. Neutrophils and monocytes are the first effector cells involved in limiting infection through phagocytosis, the production of reactive oxygen species, and the release of inflammatory mediators [15,16]. Their activation induces the release of proinflammatory cytokines, including interleukin-6 (IL-6) and tumor necrosis factor-alpha (TNF-α). IL-6 plays a major role in stimulating hepatic C-reactive protein (CRP) synthesis, whereas procalcitonin (PCT) production is induced during systemic inflammatory responses, particularly those associated with bacterial infection [17,18,19]. In preterm infants, immune system immaturity results in an inflammatory response that differs from that of term neonates, characterized by reduced cytokine production, impaired neutrophil and monocyte function, and incomplete regulation of the immune response [15,16]. These characteristics explain the variability of the biological response and the challenges associated with interpreting inflammatory biomarkers according to gestational age [20,21].
CRP and PCT are frequently used in the evaluation of suspected neonatal infection, although their diagnostic performance and clinical utility vary according to the timing of measurement and the clinical context [19,23].
In recent years, increasing attention has been directed toward complete blood count-derived indices, including the neutrophil-to-lymphocyte ratio, platelet-to-lymphocyte ratio, and monocyte-to-lymphocyte ratio, which are considered readily available markers of the systemic inflammatory response [24]. In the present study, CRP, PCT, and complete blood count parameters were evaluated because they are routinely available in clinical practice and may provide clinically relevant information in the assessment of neonates with suspected infection. Other inflammatory biomarkers, including IL-6 and presepsin, have also been investigated for the diagnosis of neonatal infection, with studies reporting promising diagnostic performance. However, further clinical validation is needed to establish their optimal role in routine neonatal care [22,25,26].
The increasing prevalence of antimicrobial resistance represents one of the major challenges in modern neonatology [27,28]. Neonates admitted to NICUs are frequently exposed to empirical antibiotic therapy [27,29]. Prolonged or inappropriate antibiotic use promotes the selection of multidrug-resistant microorganisms and disrupts the developing neonatal microbiota [27,28]. Antimicrobial stewardship programs aim to optimize antibiotic use through appropriate empirical treatment selection, early reassessment based on microbiological findings, and adjustment of therapy according to the antimicrobial susceptibility profile of the causative pathogen [27,28]. The effectiveness of these programs depends on a thorough understanding of the local epidemiology and antimicrobial resistance patterns [28].
Previous studies have examined various aspects of neonatal infection, including epidemiology, diagnostic biomarkers, microbiological characteristics, and antimicrobial management [2,3,4,13,27]. An integrated assessment of maternal and perinatal factors, inflammatory biomarkers, microbiological findings, antimicrobial resistance, and treatment patterns may provide additional insight into the clinical differences between preterm and term neonates. The present study included neonates treated for suspected neonatal infection who underwent microbiological sampling before antibiotic initiation, irrespective of culture results. This approach enabled an integrated description of clinical, laboratory, microbiological, and treatment-related characteristics in preterm and term neonates.
The aim of this study was to compare the clinical characteristics, maternal and perinatal risk factors, inflammatory profiles, microbiological findings, antimicrobial resistance patterns, and therapeutic management of preterm and term neonates treated for suspected neonatal infection. In addition, the study included an exploratory comparison according to NICU admission status and evaluated associations between gestational age, inflammatory biomarkers, antimicrobial therapy, and length of hospital stay.
2. Materials and Methods
2.1. Study Design
This was a single-center, retrospective, observational, comparative study. The study included preterm and term neonates admitted to the Neonatology Department of the Târgu Mureș County Emergency Clinical Hospital between January 2024 and April 2026 who were evaluated for suspected neonatal infection and received antibiotic therapy according to the attending neonatologist’s clinical judgment. The diagnosis was based on the overall clinical assessment, inflammatory biomarker profile, and microbiological investigation results, when available.
Clinical, laboratory, microbiological, and therapeutic data were extracted by one investigator and independently verified by a second investigator to ensure data accuracy. The primary objective was to compare clinical, maternal, perinatal, laboratory, microbiological, antimicrobial resistance, and therapeutic characteristics between preterm and term neonates evaluated for suspected neonatal infection. Secondary objectives were to compare clinical and laboratory characteristics according to NICU admission status and to explore correlations between gestational age, inflammatory markers, duration of antimicrobial therapy, and length of hospital stay. The study was reported in accordance with the Strengthening the Reporting of Observational Studies in Epidemiology (STROBE) guidelines for observational studies.
2.2. Study Population
The study included neonates admitted to the Neonatology Department and the Neonatal Intensive Care Unit (NICU) of the Târgu Mureș County Emergency Clinical Hospital between January 2024 and April 2026 who were evaluated and treated for suspected neonatal infection. Relevant microbiological specimens were collected from all enrolled neonates before the initiation of antimicrobial therapy, in accordance with the institutional protocol.
Patients were identified retrospectively through the microbiology laboratory records and the laboratory information system. Clinical, laboratory, microbiological, and therapeutic data were extracted from the electronic medical records and the hospital database. No prospective sample size calculation was performed; all eligible neonates identified during the predefined study period were included.
For comparative analyses, patients were classified into two groups according to gestational age:
- Group 1: preterm neonates, defined as gestational age < 37 completed weeks.
- Group 2: term neonates, defined as gestational age from 37 + 0 to 41 + 6 weeks.
Inclusion Criteria
Patients were eligible for inclusion if they fulfilled all of the following criteria:
- neonatal age (≤28 days of life);
- admission to the Târgu Mureș County Emergency Clinical Hospital during the study period;
- evaluation and treatment for suspected neonatal infection;
- collection of a microbiological specimen before initiation of antimicrobial therapy;
- initiation of antimicrobial treatment by the attending physician.
Clinical suspicion of neonatal infection was based on the documented clinical assessment and laboratory findings. For culture-positive cases, the microbiological finding was considered supportive of infection only when accompanied by clinical and/or hematological and/or biochemical abnormalities compatible with infection and initiation of antimicrobial treatment by the attending physician. The simultaneous presence of all clinical and laboratory abnormalities was not required, as these findings could occur in different combinations.
Culture-negative neonates were also eligible when clinical and/or hematological and/or biochemical abnormalities supported the clinical suspicion of infection and antimicrobial treatment was initiated by the attending physician.
Exclusion Criteria
The following were excluded:
- microbiological specimens considered contaminated according to the microbiology laboratory criteria;
- microbiological isolates considered to represent colonization rather than infection when clinical, hematological, and/or biochemical findings did not support infection.
2.3. Data Collection
Data were collected retrospectively from the electronic medical records, the hospital information system, and the database of the Department of Medical Laboratory of the Târgu Mureș County Emergency Clinical Hospital. For each patient, data were collected on maternal and perinatal characteristics, neonatal characteristics, clinical findings, laboratory investigations, microbiological findings, and antimicrobial therapy.
2.3.1. Maternal and Perinatal Characteristics
Maternal demographic and obstetric data were collected, including maternal age, place of residence, gravidity, parity, and type of pregnancy (singleton or twin). Information regarding prenatal care, mode of delivery, prolonged rupture of membranes and its duration, amniotic fluid appearance, maternal infections diagnosed during pregnancy, and major pregnancy-related complications, including gestational diabetes mellitus, gestational hypertension, and preeclampsia, was also recorded.
2.3.2. Neonatal and Clinical Characteristics
Neonatal demographic and anthropometric characteristics were recorded, including sex, gestational age, birth weight, birth length, and head circumference. Immediate postnatal adaptation was assessed using the Apgar score at 1 and 5 min and the need for postnatal stabilization. Information regarding admission to the neonatal intensive care unit (NICU), length of hospital stay, antimicrobial therapy, number of antibiotics administered, duration of antibiotic treatment, and clinical outcome at discharge was also collected.
2.3.3. Laboratory Investigations
The results of the first complete blood count obtained at hospital admission were analyzed, including hemoglobin, hematocrit, red blood cell count, white blood cell count, platelet count, and differential leukocyte count, comprising neutrophils, lymphocytes, monocytes, eosinophils, basophils, and immature granulocytes, expressed as both percentages and absolute counts.
Serum concentrations of C-reactive protein (CRP), procalcitonin (PCT), and the available biochemical parameters, including blood glucose, urea, creatinine, albumin, aspartate aminotransferase (AST), alanine aminotransferase (ALT), total bilirubin, and direct bilirubin, were recorded.
The following derived inflammatory indices were calculated using the absolute values obtained from the first complete blood count performed at admission: neutrophil-to-lymphocyte ratio (NLR), platelet-to-lymphocyte ratio (PLR), monocyte-to-lymphocyte ratio (MLR), and neutrophil-to-platelet ratio (NPR).
2.3.4. Microbiological Investigations
For each patient, the type of clinical specimen, microbiological culture results, and identified microorganisms were recorded. Isolates were classified as Gram-positive bacteria, Gram-negative bacteria, or fungi. Culture growth was categorized as scant, moderate, or heavy, and antimicrobial susceptibility testing results were classified as susceptible (S), susceptible with increased exposure (I), or resistant (R), in accordance with the European Committee on Antimicrobial Susceptibility Testing (EUCAST) guidelines applicable during the study period.
For patient-level analyses, each neonate was counted once. When more than one clinically relevant microorganism was isolated from the same infectious episode, the neonate was classified according to the overall microbiological finding. For microorganism-specific analyses, all clinically relevant microorganisms were reported. One term neonate had a polymicrobial infection with both Staphylococcus aureus and Serratia marcescens isolated from the same clinical specimen; therefore, microorganism-specific analyses included 49 isolates from 48 neonates with microbiologically supported infection.
For specimens collected from non-sterile sites (e.g., ear secretions, conjunctival secretions, and tracheal aspirates), microbiological findings were considered clinically relevant only when a potentially pathogenic microorganism was isolated in association with clinical and/or hematological and/or biochemical abnormalities compatible with infection and antimicrobial treatment initiated by the attending physician. The simultaneous presence of all clinical and laboratory abnormalities was not required. Isolates considered to represent colonization or contamination, or those not supported by compatible clinical and/or laboratory findings, were not classified as microbiological support for infection.
The main antimicrobial resistance phenotypes were also recorded, including extended-spectrum beta-lactamase-producing Enterobacterales (ESBL), carbapenemase-producing Enterobacterales (CPE), and multidrug-resistant (MDR) microorganisms, whenever identified.
To evaluate antimicrobial management, the antibiotics administered, the number of antibiotics prescribed, and the duration of antibiotic therapy were recorded.
2.4. Definitions
To ensure consistent interpretation of the collected data, the following operational definitions were applied.
Preterm birth was defined as delivery before 37 completed weeks of gestation. Term birth was defined as delivery from 37 + 0 to 41 + 6 weeks of gestation.
Suspected neonatal infection was defined as a clinical condition in which the attending neonatologist initiated antimicrobial treatment based on clinical findings and/or hematological and/or biochemical abnormalities compatible with infection, with microbiological specimens collected before initiation of antimicrobial therapy.
Microbiological support for infection was defined as the isolation of a potentially pathogenic microorganism from a clinically relevant specimen in a neonate with clinical and/or hematological and/or biochemical abnormalities compatible with infection and for whom antimicrobial treatment was initiated by the attending physician.
For specimens obtained from non-sterile sites, a positive culture alone was not considered sufficient evidence of infection. The microbiological finding was considered supportive only when interpreted in conjunction with compatible clinical and/or laboratory abnormalities and antimicrobial treatment. Isolates considered to represent colonization or contamination were not classified as microbiological support for infection.
Neonates with negative cultures were retained in the study when clinical and/or hematological and/or biochemical abnormalities supported the clinical suspicion of infection and antimicrobial treatment had been initiated after microbiological specimen collection. Prolonged rupture of membranes was defined as rupture lasting more than 18 h before delivery.
Documented prenatal care was defined as the presence of documented antenatal follow-up during pregnancy in the maternal medical record. This variable was recorded as a binary outcome (yes/no) according to the available medical documentation. Need for postnatal stabilization was defined as any medical intervention required immediately after birth to facilitate neonatal adaptation, including tactile stimulation, airway suctioning, supplemental oxygen, positive-pressure ventilation, endotracheal intubation, chest compressions, or other stabilization procedures documented in the medical record.
NICU admission was defined as admission or transfer to the neonatal intensive care unit for continuous monitoring or specialized treatment. Length of hospital stay was calculated from the date of admission to the date of discharge or death.
A favorable outcome was defined as discharge in stable clinical condition without transfer to another acute care facility.
Multidrug resistance was defined as acquired non-susceptibility to at least one antimicrobial agent in three or more antimicrobial categories, according to the criteria proposed by Magiorakos et al. [31].
Antimicrobial susceptibility profiles were evaluated only for isolates with available microbiological identification. The EUCAST category “susceptible with increased exposure” (I) was interpreted according to the applicable EUCAST recommendations and was not classified as resistant for the descriptive susceptibility categories used in this study.
2.5. Laboratory Investigations
Hematological, biochemical, immunochemical, and microbiological analyses were performed in the Department of Medical Laboratory of the Târgu Mureș County Emergency Clinical Hospital using automated laboratory systems and routine methods implemented in clinical practice, in accordance with the manufacturers’ instructions and the laboratory’s internal quality control procedures.
For statistical analysis, the results of the first laboratory investigations performed at hospital admission were used. Complete blood counts with differential leukocyte counts were performed using the Sysmex XN-1000 hematology analyzer. Biochemical analyses, including blood glucose, urea, creatinine, serum albumin, aspartate aminotransferase (AST), alanine aminotransferase (ALT), total bilirubin, and direct bilirubin, as well as C-reactive protein (CRP) and procalcitonin (PCT) measurements, were performed using the cobas pro integrated solutions platform.
The following derived inflammatory indices were calculated using the absolute values obtained from the complete blood count performed at admission: neutrophil-to-lymphocyte ratio (NLR), platelet-to-lymphocyte ratio (PLR), monocyte-to-lymphocyte ratio (MLR), and neutrophil-to-platelet ratio (NPR).
White blood cell and platelet counts were expressed as ×109/L, red blood cell counts as ×1012/L, hemoglobin as g/dL, hematocrit as percentage (%), C-reactive protein as mg/L, and procalcitonin as ng/mL.
Microbiological specimens were processed according to the laboratory’s standard operating procedures. Blood cultures were processed using the BacT/ALERT VIRTUO automated blood culture system. Other microbiological specimens were processed using routine culture methods and the automated WASPLab system, where applicable. Microorganism identification and antimicrobial susceptibility testing were performed using the VITEK 2 Compact 30 automated system. Interpretation of antimicrobial susceptibility results was carried out in accordance with the European Committee on Antimicrobial Susceptibility Testing (EUCAST) guidelines applicable during the study period. Susceptibility results were categorized as susceptible (S), susceptible with increased exposure (I), or resistant (R). Culture growth was classified as scant, moderate, or heavy. The main antimicrobial resistance phenotypes were also recorded, including extended-spectrum beta-lactamase-producing Enterobacterales (ESBL), carbapenemase-producing Enterobacterales (CPE), and multidrug-resistant (MDR) microorganisms.
2.6. Statistical Analysis
Statistical analyses were performed using jamovi (Version 2.7; The jamovi Project, Sydney, Australia). The distribution of continuous variables was assessed using the Shapiro–Wilk test together with visual inspection of histograms and Q–Q plots. Given the relatively small sample size and the non-normal distribution of most continuous variables, nonparametric statistical methods were applied. Accordingly, continuous variables were summarized as medians and interquartile ranges (IQR), whereas categorical variables were expressed as counts and percentages. Differences between preterm and term neonates were assessed using the Mann–Whitney U test for continuous variables and Fisher’s exact test for categorical variables. The Fisher–Freeman–Halton exact test was applied to contingency tables with more than two categories and small expected frequencies. For 2 × 2 contingency tables containing at least one zero cell, odds ratios and their 95% confidence intervals were estimated using the Haldane–Anscombe continuity correction. Correlations between continuous variables were evaluated using Spearman’s rank correlation coefficient and visualized using a correlation heatmap. Graphs and all other figures were created using Microsoft Excel (Microsoft Corporation, Redmond, WA, USA).
Statistical analyses were predefined according to the primary and secondary objectives of the study. The primary analysis compared clinical, maternal, perinatal, laboratory, microbiological, antimicrobial resistance, and therapeutic characteristics between preterm and term neonates. Secondary outcomes included neonatal intensive care unit (NICU) admission, duration of antimicrobial therapy, and length of hospital stay. Additional exploratory analyses evaluated factors associated with NICU admission and correlations between gestational age, inflammatory biomarkers, duration of antimicrobial therapy, and length of hospital stay.
Missing data were handled using an available-case analysis approach without statistical imputation. The number of available observations differed between variables because laboratory investigations were performed according to clinical indications rather than according to a predefined research protocol. Consequently, each statistical analysis included all available observations for the respective variable, and only patients with complete data for the variables included in that specific analysis were retained. No formal adjustment for multiple comparisons was performed. Given the number of comparisons and the exploratory nature of the study, nominal p values, particularly those close to 0.05, were interpreted cautiously and considered hypothesis-generating. All statistical tests were two-sided, and a p value < 0.05 was considered statistically significant. Because of the limited sample size, multivariable regression analyses were not performed, as the number of observations was insufficient to obtain reliable estimates.
Tables and graphical representations were prepared using Microsoft Excel (Microsoft Corporation, Redmond, WA, USA).
2.7. Ethics
The study was conducted in accordance with the principles of the Declaration of Helsinki and the national legislation governing biomedical research and the protection of personal data. The study protocol was approved by the Ethics Committee of the Târgu Mureș County Emergency Clinical Hospital (Approval No. 20158/07.09.2026).
This retrospective observational study was based exclusively on the analysis of existing clinical, laboratory, and microbiological data extracted from electronic medical records and institutional databases. No additional interventions were performed, and no biological specimens were collected specifically for research purposes.
All data were anonymized before analysis and processed confidentially in accordance with the provisions of Regulation (EU) 2016/679 on the protection of personal data (General Data Protection Regulation, GDPR). Given the retrospective design of the study and the exclusive use of anonymized data, the requirement for obtaining individual informed consent was waived by the Ethics Committee.
3. Results
Fifty-two neonates treated for suspected neonatal infection met the inclusion criteria and were included in the final analysis. Of these, 48 (92.3%) had microbiologically supported infection, defined by the isolation of a potentially pathogenic microorganism from a clinically relevant specimen, whereas 4 (7.7%) had negative microbiological cultures but presented with clinical manifestations and inflammatory biomarker abnormalities consistent with neonatal infection. These neonates received antimicrobial therapy based on the attending neonatologist’s clinical judgment.
3.1. Characteristics of the Study Cohort
The study cohort comprised 10 preterm neonates and 42 term neonates. The patient selection process is presented in Figure 1. Baseline demographic and clinical characteristics are summarized in Table 1. The subsequent analyses are presented according to gestational age.
As defined by the study groups, preterm neonates had a lower gestational age than term neonates. Preterm neonates also had significantly lower birth weight, birth length, and head circumference than term neonates (all p ≤ 0.003). They also had lower Apgar scores at 1 min (7.0 vs. 9.0, p = 0.014) and 5 min (9.0 vs. 10.0, p = 0.016). No significant differences were observed in sex distribution or in the need for postnatal stabilization (both p = 1.000).
A higher proportion of preterm neonates required NICU admission compared with term neonates (60.0% vs. 23.8%), although this difference did not reach statistical significance (p = 0.052). Length of hospital stay (p = 0.401) and discharge outcome (p = 0.192) did not differ significantly between groups; one death occurred in the preterm group.
3.2. Maternal and Perinatal Characteristics

Table 2.
Maternal and perinatal characteristics of the study cohort according to gestational age.
| Variable | Preterm Neonates (n = 10) | Term Neonates (n = 42) | p Value | Effect Size |
|---|---|---|---|---|
| Maternal characteristics | ||||
| Maternal age (years), median (IQR) | 25.0 (21.2 to 28.5) | 27.0 (22.2 to 30.8) | 0.457 | rrb = −0.134 |
| Gravidity, median (IQR) | 2.0 (1.0 to 3.0) | 2.0 (1.0 to 4.0) | 0.517 | rrb = −0.108 |
| Parity, median (IQR) | 1.0 (1.0 to 2.0) | 2.0 (1.0 to 3.0) | 0.170 | rrb = −0.272 |
| Rural residence, n (%) | 5 (50.0) | 29 (69.0) | 0.283 | OR = 0.45 (95% CI 0.11 to 1.86) |
| Maternal infection during pregnancy, n (%) | 5 (50.0) | 25 (59.5) | 0.725 | OR = 0.68 (95% CI 0.17 to 2.73) |
| Gestational diabetes mellitus, n (%) | 1 (10.0) | 1 (2.4) | 0.351 | OR = 4.56 (95% CI 0.26 to 80.4) |
| Gestational hypertension or preeclampsia, n (%) | 1 (10.0) | 4 (9.5) | 1.000 | OR = 1.06 (95% CI 0.10 to 11.2) |
| Pregnancy and delivery characteristics | ||||
| Twin pregnancy, n (%) | 3 (30.0) | 2 (4.8) | 0.043 | OR = 8.57 (95% CI 1.20 to 61.3) |
| Documented antenatal care, n (%) | 8 (80.0) | 25 (59.5) | 0.293 | OR = 2.72 (95% CI 0.52 to 14.3) |
| Prolonged rupture of membranes (>18 h), n (%) | 7 (70.0) | 12 (28.6) | 0.026 | OR = 5.83 (95% CI 1.24 to 27.4) |
| Duration of membrane rupture (hours), median (IQR) | 19.0 (1.0 to 96.0) | 6.0 (0.5 to 18.0) | 0.283 | rrb = −0.214 |
| Cesarean delivery, n (%) | 3 (30.0) | 8 (19.0) | 0.424 | OR = 1.82 (95% CI 0.40 to 8.31) |
| Amniotic fluid appearance, n (%) (available data: preterm n = 8; term n = 39) | 1.000† | Cramer’s V = 0.13 | ||
| Clear | 6 (75.0) | 24 (61.5) | ||
| Green | 2 (25.0) | 11 (28.2) | ||
| Meconium stained | 0 (0.0) | 3 (7.7) | ||
| Foul smelling | 0 (0.0) | 1 (2.6) |
Note. Data are presented as median (interquartile range, IQR) for continuous variables and as number (percentage) for categorical variables. Continuous variables were compared using the Mann–Whitney U test, and categorical variables using Fisher’s exact test. The Fisher–Freeman–Halton exact test was used for comparisons involving categorical variables with more than two categories. Effect sizes for continuous variables are expressed as the rank-biserial correlation (rrb). Effect sizes for binary categorical variables are expressed as odds ratios (ORs) with 95% confidence intervals (95% CIs). Cramér’s V is reported as the measure of association for categorical variables with more than two categories. Values of rrb of approximately 0.10, 0.30, and ≥0.50 indicate small, moderate, and large effect sizes, respectively. Values of Cramér’s V of approximately 0.10, 0.30, and ≥0.50 indicate small, moderate, and large associations, respectively. An OR > 1 indicates higher odds among preterm neonates, whereas an OR < 1 indicates lower odds compared with term neonates. Data on amniotic fluid appearance were available for 8 preterm and 39 term neonates. Percentages for this variable were calculated using the number of available observations in each group.
Twin pregnancy was observed more frequently among preterm than term neonates (30.0% vs. 4.8%, p = 0.043; OR = 8.57, 95% CI 1.20 to 61.3). Prolonged rupture of membranes exceeding 18 h was also observed more frequently among preterm neonates (70.0% vs. 28.6%, p = 0.026; OR = 5.83, 95% CI 1.24 to 27.4). No statistically significant differences were observed for the other maternal and perinatal characteristics evaluated.
3.3. Laboratory Findings
3.3.1. Hematological Parameters and Inflammatory Biomarkers
Table 3.
Hematological parameters and inflammatory biomarkers according to gestational age.
| Parameter | Preterm Neonates | Term Neonates | p Value | Effect Size |
|---|---|---|---|---|
| White blood cell count, ×109/L | 10.19 (7.43 to 14.87) | 12.94 (10.38 to 17.00) | 0.112 | rrb = −0.330 |
| Neutrophils, % | 59.40 (48.35 to 67.88) | 53.00 (44.30 to 66.20) | 0.755 | rrb = 0.068 |
| Absolute neutrophil count, ×109/L | 6.06 (3.70 to 8.31) | 7.32 (4.49 to 10.50) | 0.392 | rrb = −0.179 |
| Lymphocytes, % | 27.65 (21.55 to 37.05) | 30.70 (23.00 to 43.00) | 0.585 | rrb = −0.116 |
| Absolute lymphocyte count, ×109/L | 2.82 (2.22 to 3.94) | 4.33 (3.38 to 5.44) | 0.027 | rrb = −0.458 |
| Monocytes, % | 9.50 (5.58 to 14.38) | 9.25 (7.55 to 10.45) | 0.612 | rrb = 0.108 |
| Absolute monocyte count, ×109/L | 1.04 (0.62 to 1.30) | 1.24 (0.87 to 1.71) | 0.329 | rrb = −0.202 |
| Eosinophils, % | 2.85 (0.80 to 5.95) | 2.80 (1.10 to 5.20) | 0.953 | rrb = −0.015 |
| Basophils, % | 0.30 (0.23 to 0.63) | 0.40 (0.20 to 0.80) | 0.624 | rrb = −0.102 |
| Immature granulocytes, % | 1.25 (0.68 to 2.60) | 1.50 (0.80 to 2.20) | 1.000 | rrb = 0.003 |
| Absolute immature granulocyte count, ×109/L | 0.11 (0.07 to 0.26) | 0.18 (0.10 to 0.38) | 0.449 | rrb = −0.159 |
| Hemoglobin, g/dL | 14.15 (12.73 to 17.00) | 18.50 (17.15 to 20.13) | 0.001 | rrb = −0.662 |
| Hematocrit, % | 40.00 (36.35 to 47.15) | 52.65 (48.73 to 56.50) | 0.002 | rrb = −0.638 |
| Red blood cell count, ×1012/L | 4.02 (3.45 to 4.99) | 5.26 (4.81 to 5.58) | 0.003 | rrb = −0.613 |
| Platelet count, ×109/L | 274.00 (160.50 to 337.50) | 272.00 (214.00 to 304.00) | 0.812 | rrb = −0.051 |
| C-reactive protein (mg/L), n = 10 vs. n = 41 | 22.85 (3.75 to 51.38) | 5.20 (2.10 to 11.90) | 0.090 | rrb = 0.351 |
| Procalcitonin (ng/mL), median (IQR), n = 6 vs. n = 8 | 18.31 (11.99 to 31.45) | 0.74 (0.58 to 1.77) | 0.008 | rrb = 0.875 |
| Neutrophil-to-platelet ratio, NPR | 0.026 (0.016 to 0.043) | 0.025 (0.020 to 0.040) | 0.931 | rrb = −0.021 |
| Neutrophil-to-lymphocyte ratio, NLR | 2.15 (1.31 to 3.30) | 1.60 (1.05 to 3.01) | 0.585 | rrb = 0.116 |
| Platelet-to-lymphocyte ratio, PLR | 81.87 (60.26 to 105.16) | 60.39 (47.09 to 75.65) | 0.212 | rrb = 0.260 |
| Monocyte-to-lymphocyte ratio, MLR | 0.263 (0.170 to 0.669) | 0.283 (0.197 to 0.433) | 0.932 | rrb = 0.020 |
Note. Data are presented as median (interquartile range, IQR). Continuous variables were compared using the two-sided Mann–Whitney U test. Effect sizes are expressed as the rank-biserial correlation (rrb). Positive rrb values indicate higher ranks among preterm neonates, whereas negative rrb values indicate higher ranks among term neonates. Data were analyzed using an available-case approach. Sample sizes differed across variables because of missing values. Denominators for variables with incomplete data are reported in the corresponding row.
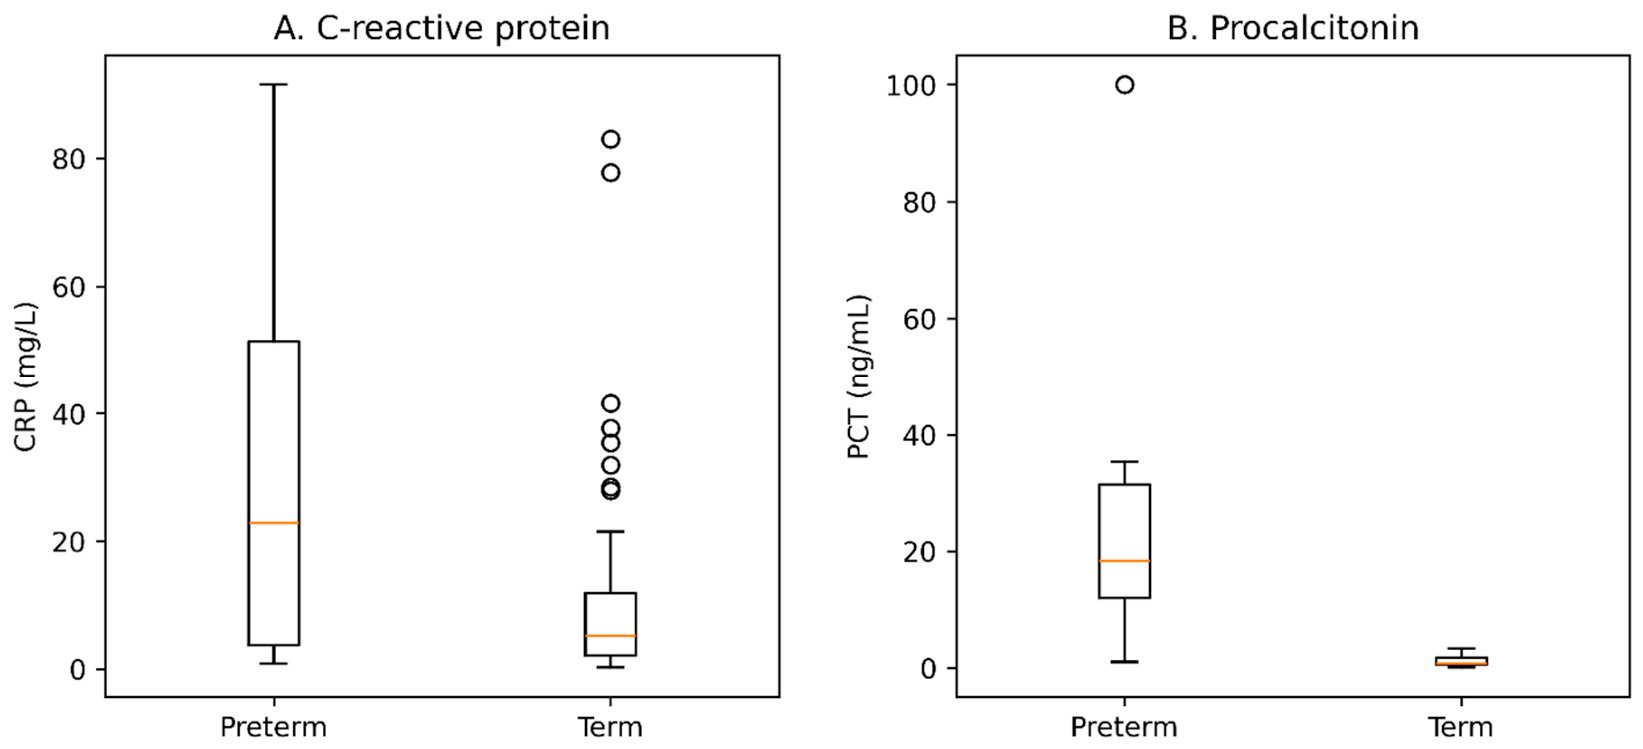
Preterm neonates had lower absolute lymphocyte counts (p = 0.027), hemoglobin concentrations (p = 0.001), hematocrit values (p = 0.002), and red blood cell counts (p = 0.003) than term neonates. No statistically significant differences were observed for the remaining hematological parameters or the derived inflammatory indices. CRP concentrations did not differ significantly between groups (p = 0.090). Among neonates with available PCT measurements (n = 14), PCT concentrations were higher in preterm than in term neonates (p = 0.008); however, this comparison was based on a small subgroup.
Figure 2.
Distribution of inflammatory biomarkers according to gestational age. Note. Panel (A) shows the distribution of C-reactive protein (CRP) concentrations, whereas Panel (B) shows the distribution of procalcitonin (PCT) concentrations according to gestational age. CRP concentrations were available for 51 neonates (10 preterm and 41 term neonates), whereas PCT measurements were available for 14 neonates (6 preterm and 8 term neonates). CRP concentrations did not differ significantly between preterm and term neonates (p = 0.090). In the small subgroup with available PCT measurements (n = 14), PCT concentrations were higher in preterm than in term neonates (p = 0.008). Individual values showed substantial variability, particularly for PCT in the preterm group.
3.3.2. Biochemical Parameters
Table 4.
Biochemical parameters of the study cohort according to gestational age.
| Parameter | Preterm Neonates (n = 10) | Term Neonates (n = 42) | p Value | Effect Size |
|---|---|---|---|---|
| Metabolic and nutritional status | ||||
| Blood glucose (mg/dL) | 80.0 (50.2 to 93.3) | 64.7 (47.2 to 75.6) | 0.493 | rrb = 0.120 |
| Albumin (g/dL) | 3.95 (3.30 to 4.09) | 3.95 (3.48 to 4.02) | 0.869 | rrb = 0.040 |
| Renal function | ||||
| Urea (mg/dL) | 25.7 (21.9 to 51.4) | 21.7 (16.5 to 26.5) | 0.144 | rrb = 0.300 |
| Creatinine (mg/dL) | 0.70 (0.60 to 0.82) | 0.62 (0.45 to 0.86) | 0.430 | rrb = 0.160 |
| Liver function | ||||
| Aspartate aminotransferase (AST) (U/L) | 54.0 (35.3 to 71.8) | 60.0 (51.0 to 85.7) | 0.303 | rrb = −0.210 |
| Alanine aminotransferase (ALT) (U/L) | 13.7 (9.7 to 26.7) | 21.0 (16.2 to 26.2) | 0.163 | rrb = −0.280 |
| Total bilirubin (mg/dL) | 5.13 (2.94 to 7.00) | 5.37 (3.16 to 8.31) | 0.857 | rrb = −0.040 |
| Direct bilirubin (mg/dL) | 0.48 (0.38 to 0.88) | 0.41 (0.34 to 0.56) | 0.224 | rrb = 0.240 |
Note. Data are presented as median (interquartile range, IQR). Continuous variables were compared using the two-sided Mann–Whitney U test. Effect sizes are expressed as the rank-biserial correlation (rrb). Positive rrb values indicate higher ranks among preterm neonates, whereas negative rrb values indicate higher ranks among term neonates. Data were analyzed using an available-case approach. Sample sizes differed across variables because of missing values. Denominators for variables with incomplete data are reported in the corresponding row.
No statistically significant differences were observed between preterm and term neonates for blood glucose, albumin, urea, creatinine, aspartate aminotransferase (AST), alanine aminotransferase (ALT), total bilirubin, or direct bilirubin concentrations (all p > 0.05).
3.4. Microbiological Findings
3.4.1. Clinical Specimens and Microorganism Classification
Table 5.
Distribution of clinical specimen types and microbiological findings according to gestational age.
Table 5.
Distribution of clinical specimen types and microbiological findings according to gestational age.
| Variable | Preterm Neonates (n = 10) | Term Neonates (n = 42) | p Value | Effect Size |
|---|---|---|---|---|
| Clinical specimen type, n (%) | ||||
| Blood culture | 5 (50.0) | 8 (19.0) | 0.097 | OR = 4.11 (95% CI 0.75 to 23.09) |
| Urine culture | 0 (0.0) | 2 (4.8) | 1.000 | OR = 0.78 (95% CI 0.03 to 17.67) |
| Tracheal aspirate | 0 (0.0) | 1 (2.4) | 1.000 | OR = 1.33 (95% CI 0.05 to 35.01) |
| Conjunctival secretion | 1 (10.0) | 2 (4.8) | 0.481 | OR = 2.22 (95% CI 0.18 to 27.28) |
| Ear secretion | 4 (40.0) | 32 (76.2) | 0.052 | OR = 0.22 (95% CI 0.04 to 1.12) |
| Microbiological findings, n (%) | ||||
| Gram-negative only | 9 (90.0) | 27 (64.3) | 0.147 | OR = 5.00 (95% CI 0.56 to 44.58) |
| Gram-positive only | 0 (0.0) | 9 (21.4) | 0.184 | OR = 0.20 (95% CI 0.01 to 3.82) |
| Mixed Gram-positive and Gram-negative | 0 (0.0) | 1 (2.4) | 1.000 | OR = 0.78 (95% CI 0.03 to 19.22) |
| Fungal isolates | 0 (0.0) | 1 (2.4) | 1.000 | OR = 0.78 (95% CI 0.03 to 19.22) |
| Negative cultures | 1 (10.0) | 3 (7.1) | 1.000 | OR = 1.44 (95% CI 0.13 to 16.02) |
Note. Data are presented as number (percentage). Because more than one microbiological specimen could be collected from the same neonate, percentages for specimen types may exceed 100%. Microbiological findings were classified at the patient level. One term neonate had a polymicrobial infection with both Staphylococcus aureus and Serratia marcescens isolated from the same clinical specimen and was therefore classified as “Mixed Gram-positive and Gram-negative”. Four neonates had negative microbiological cultures despite clinical suspicion of infection and are presented separately. Comparisons between groups were performed using Fisher’s exact test. Effect sizes are expressed as odds ratios (ORs) with 95% confidence intervals (95% CIs). An OR > 1 indicates higher odds among preterm neonates, whereas an OR < 1 indicates lower odds compared with term neonates.
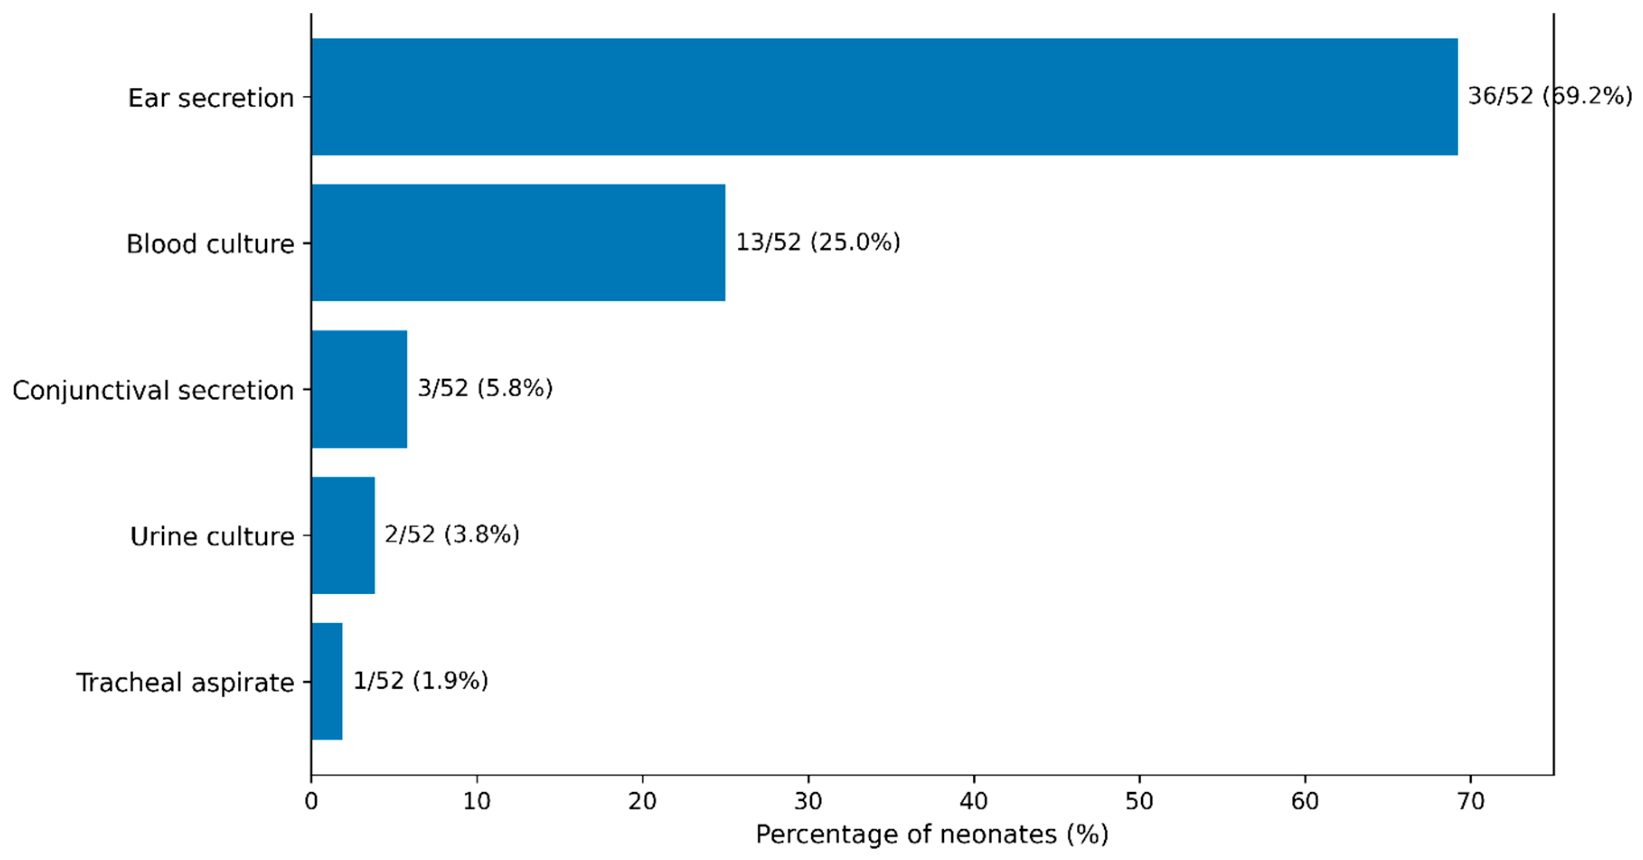
The distribution of clinical specimen types did not differ significantly between preterm and term neonates. Blood cultures, representing specimens obtained from a normally sterile site, were collected from 13 of 52 neonates (25.0%) and were more frequently obtained from preterm than term neonates (50.0% vs. 19.0%, p = 0.097). Ear secretion specimens, obtained from a non-sterile site, represented the most frequently collected specimen type (36/52, 69.2%) and were more common among term than preterm neonates (76.2% vs. 40.0%, p = 0.052). Neither difference reached statistical significance. Urine cultures, tracheal aspirates, and conjunctival secretion specimens were collected only occasionally in both groups.
Positive cultures from non-sterile sites were interpreted as microbiological support for infection only in the presence of compatible clinical and/or hematological and/or biochemical abnormalities and antimicrobial treatment, as defined in the Methods, and were not considered equivalent to blood-culture-confirmed invasive infection.
Regarding microbiological findings, Gram-negative-only infections predominated in both groups (90.0% vs. 64.3%, p = 0.147). Gram-positive-only infections were observed exclusively among term neonates (21.4%), while one term neonate presented with a mixed Gram-positive and Gram-negative infection and one additional term neonate had a fungal infection. Four neonates had negative microbiological cultures despite clinical suspicion of infection. No statistically significant differences in microbiological findings were observed according to gestational age.
Figure 3.
Distribution of microbiological specimen types collected from the study cohort (n = 52). Note. Ear secretion specimens were collected from 36 neonates (69.2%), blood cultures from 13 (25.0%), conjunctival secretions from 3 (5.8%), urine cultures from 2 (3.8%), and tracheal aspirates from 1 (1.9%). Because multiple specimen types could be collected from the same neonate, percentages may exceed 100%.
3.4.2. Distribution of Isolated Microorganisms
Table 6.
(A). Distribution of microorganisms identified among neonates with microbiologically supported infection according to gestational age. (B). Culture growth intensity according to gestational age among neonates with microbiologically supported infection.
Table 6.
(A). Distribution of microorganisms identified among neonates with microbiologically supported infection according to gestational age. (B). Culture growth intensity according to gestational age among neonates with microbiologically supported infection.
| (A) | |||||
| Microorganism | Total Neonates (n = 48) | Preterm Neonates (n = 9) | Term Neonates (n = 39) | p Value | Effect Size |
| Gram-negative bacteria | |||||
| Escherichia coli | 28 (58.3) | 5 (55.6) | 23 (59.0) | 1.000 | OR = 0.87 (95% CI 0.19 to 4.02) |
| Klebsiella pneumoniae | 4 (8.3) | 2 (22.2) | 2 (5.1) | 0.155 | OR = 5.29 (95% CI 0.61 to 45.79) |
| Enterobacter spp. | 1 (2.1) | 0 (0.0) | 1 (2.6) | 1.000 | OR = 1.38 (95% CI 0.05 to 37.19) |
| Acinetobacter baumannii | 1 (2.1) | 1 (11.1) | 0 (0.0) | 0.188 | OR = 10.64 (95% CI 0.39 to 286.85) |
| Burkholderia cepacia | 1 (2.1) | 1 (11.1) | 0 (0.0) | 0.188 | OR = 10.64 (95% CI 0.39 to 286.85) |
| Serratia marcescens | 1 (2.1) | 0 (0.0) | 1 (2.6) | 1.000 | OR = 1.38 (95% CI 0.05 to 37.19) |
| Gram-positive bacteria | |||||
| Streptococcus agalactiae | 8 (16.7) | 0 (0.0) | 8 (20.5) | 0.322 | OR = 0.21 (95% CI 0.01 to 3.95) |
| Staphylococcus aureus | 2 (4.2) | 0 (0.0) | 2 (5.1) | 1.000 | OR = 0.78 (95% CI 0.03 to 19.22) |
| Streptococcus pyogenes | 1 (2.1) | 0 (0.0) | 1 (2.6) | 1.000 | OR = 1.38 (95% CI 0.05 to 37.19) |
| Fungi | |||||
| Candida spp. | 1 (2.1) | 0 (0.0) | 1 (2.6) | 1.000 | OR = 1.38 (95% CI 0.05 to 37.19) |
| Note. Data are presented as number (percentage). Percentages were calculated using the number of neonates with microbiologically supported infection as the denominator (total, n = 48; preterm, n = 9; term, n = 39). Four neonates with negative microbiological cultures were excluded from this analysis. One term neonate had a polymicrobial infection, with both Staphylococcus aureus and Serratia marcescens isolated from the same clinical specimen; therefore, microorganism categories were not mutually exclusive and the total number of microorganisms identified (n = 49) exceeded the number of neonates with microbiologically supported infection (n = 48). Comparisons between preterm and term neonates were performed using Fisher’s exact test. Effect sizes are expressed as odds ratios (ORs) with 95% confidence intervals (95% CIs). An OR > 1 indicates higher odds among preterm neonates, whereas an OR < 1 indicates lower odds compared with term neonates. | |||||
| (B) | |||||
| Variable | Neonates with Microbiologically Supported Infection (n = 48) | Preterm Neonates (n = 9) | Term Neonates (n = 39) | p Value | |
| Scant growth, n (%) | 3 (6.3) | 0 (0.0) | 3 (7.7) | ||
| Moderate growth, n (%) | 15 (31.3) | 2 (22.2) | 13 (33.3) | ||
| Heavy growth, n (%) | 30 (62.5) | 7 (77.8) | 23 (59.0) | ||
| 0.841 | |||||
Note. Data are presented as number (percentage). Percentages were calculated using cases with microbiologically supported infection as the denominator (n = 48). Culture growth was classified as scant, moderate, or heavy according to routine microbiological laboratory reporting. The overall comparison was performed using the Fisher–Freeman–Halton exact test.
Figure 4.
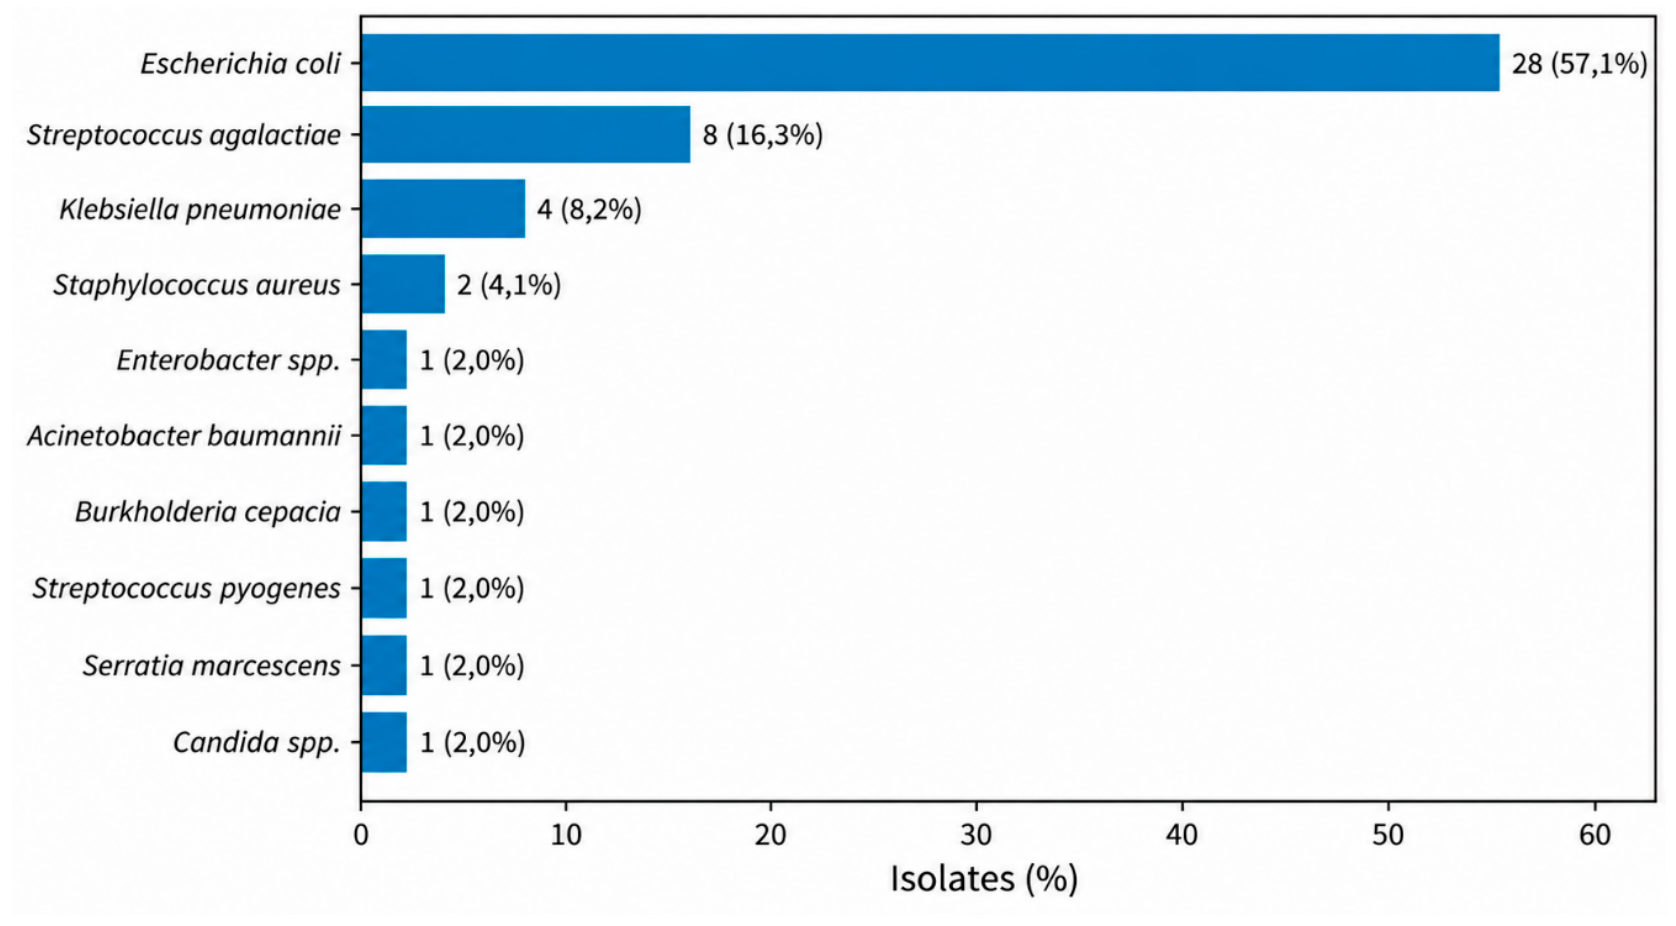
Distribution of microorganisms isolated from microbiologically supported infections. Note. The figure shows the distribution of 49 microorganisms isolated from 48 neonates with microbiologically supported infection. Escherichia coli was the predominant pathogen, accounting for 28 of 49 isolates (57.1%), followed by Streptococcus agalactiae (8/49, 16.3%) and Klebsiella pneumoniae (4/49, 8.2%). All remaining microorganisms each accounted for fewer than 5% of the total isolates. One term neonate had a polymicrobial infection, yielding both Staphylococcus aureus and Serratia marcescens; therefore, the total number of isolates exceeded the number of neonates with microbiologically supported infection.
3.4.3. Antimicrobial Resistance
Table 7.
Antimicrobial resistance phenotypes and antimicrobial susceptibility profiles of bacterial isolates according to gestational age.
Table 7.
Antimicrobial resistance phenotypes and antimicrobial susceptibility profiles of bacterial isolates according to gestational age.
| Variable | Total | Preterm Neonates | Term Neonates | p Value | Effect Size |
|---|---|---|---|---|---|
| Resistance phenotypes among Enterobacterales | |||||
| ESBL-producing Enterobacterales, n (%) | 8/34 (23.5) | 4/7 (57.1) | 4/27 (14.8) | 0.037 | OR = 7.67 (95% CI 1.22 to 48.05) |
| Carbapenemase-producing Enterobacterales (CPE, OXA-48), n (%) | 1/34 (2.9) | 1/7 (14.3) | 0/27 (0.0) | 0.206 | OR = 9.00 (95% CI 0.27 to 300.47) * |
| Resistance phenotypes and susceptibility profiles among bacterial isolates | |||||
| Multidrug-resistant (MDR) isolates, n (%) | 1/48 (2.1) | 1/9 (11.1) | 0/39 (0.0) | 0.188 | OR = 10.64 (95% CI 0.39 to 286.85) |
| Fully susceptible isolates, n (%) | 33/48 (68.8) | 5/9 (55.6) | 28/39 (71.8) | 0.432 | OR = 0.49 (95% CI 0.11 to 2.26) |
| Isolates with mixed susceptibility profile, n (%) | 13/48 (27.1) | 3/9 (33.3) | 10/39 (25.6) | 0.687 | OR = 1.45 (95% CI 0.31 to 6.86) |
| Isolates resistant to all antimicrobial agents tested, n (%) | 2/48 (4.2) | 1/9 (11.1) | 1/39 (2.6) | 0.343 | OR = 4.75 (95% CI 0.27 to 84.41) |
Note. Data are presented as number/total number (percentage). Percentages for ESBL-producing Enterobacterales and carbapenemase-producing Enterobacterales (CPE) were calculated using Enterobacterales isolates as the denominator. Percentages for multidrug-resistant (MDR) isolates and antimicrobial susceptibility profiles were calculated using the 48 bacterial isolates with antimicrobial susceptibility results; the single Candida isolate was not included in these antibacterial susceptibility categories. Comparisons between groups were performed using Fisher’s exact test. Effect sizes are expressed as odds ratios (ORs) with 95% confidence intervals (95% CIs). An OR greater than 1 indicates higher odds among preterm neonates, whereas an OR less than 1 indicates lower odds compared with term neonates. The odds ratio and 95% confidence interval for carbapenemase-producing Enterobacterales (CPE) were estimated using the Haldane–Anscombe continuity correction because one comparison group contained no events.
Most bacterial isolates with antimicrobial susceptibility results remained fully susceptible to the tested antimicrobial agents (33/48, 68.8%), whereas isolates with mixed susceptibility profiles and isolates resistant to all antimicrobial agents tested accounted for 13/48 (27.1%) and 2/48 (4.2%), respectively.
3.5. Antimicrobial Therapy
The antimicrobial agents administered during hospitalization are summarized in Table 8. Amikacin was the most frequently prescribed antimicrobial agent (82.7%), followed by ampicillin/sulbactam (67.3%). The use of most antimicrobial agents did not differ significantly between preterm and term neonates. Meropenem was administered significantly more often to preterm neonates than to term neonates (30.0% vs. 2.4%, p = 0.019; OR = 16.08, 95% CI 1.12 to 943.65). Given the small number of exposed neonates and the very wide confidence interval, this finding should be interpreted cautiously. The median number of antimicrobial agents administered did not differ between groups. However, the duration of antimicrobial treatment was longer in preterm neonates than in term neonates (7.5 [5.0–10.8] vs. 5.0 [4.0–7.0] days, p = 0.041; rrb = 0.430).
3.6. Secondary Analyses
3.6.1. Exploratory Comparison According to NICU Admission Status
An exploratory analysis was performed to compare clinical and laboratory characteristics between neonates admitted to the NICU and those not requiring NICU admission. The results are presented in Table 9.
Neonates admitted to the NICU had significantly lower birth weight and lower Apgar scores at both 1 and 5 min compared with neonates who did not require intensive care. They also had significantly lower white blood cell and platelet counts. The duration of antimicrobial therapy and the length of hospital stay were significantly longer in the NICU group. Preterm birth was more frequent among neonates admitted to the NICU, although the difference did not reach statistical significance (p = 0.052). CRP, NLR, PLR, and MLR did not differ significantly according to NICU admission status. No significant differences were observed for gestational age, maternal infection, or prolonged rupture of membranes.
3.6.2. Correlation Analyses
Figure 5.
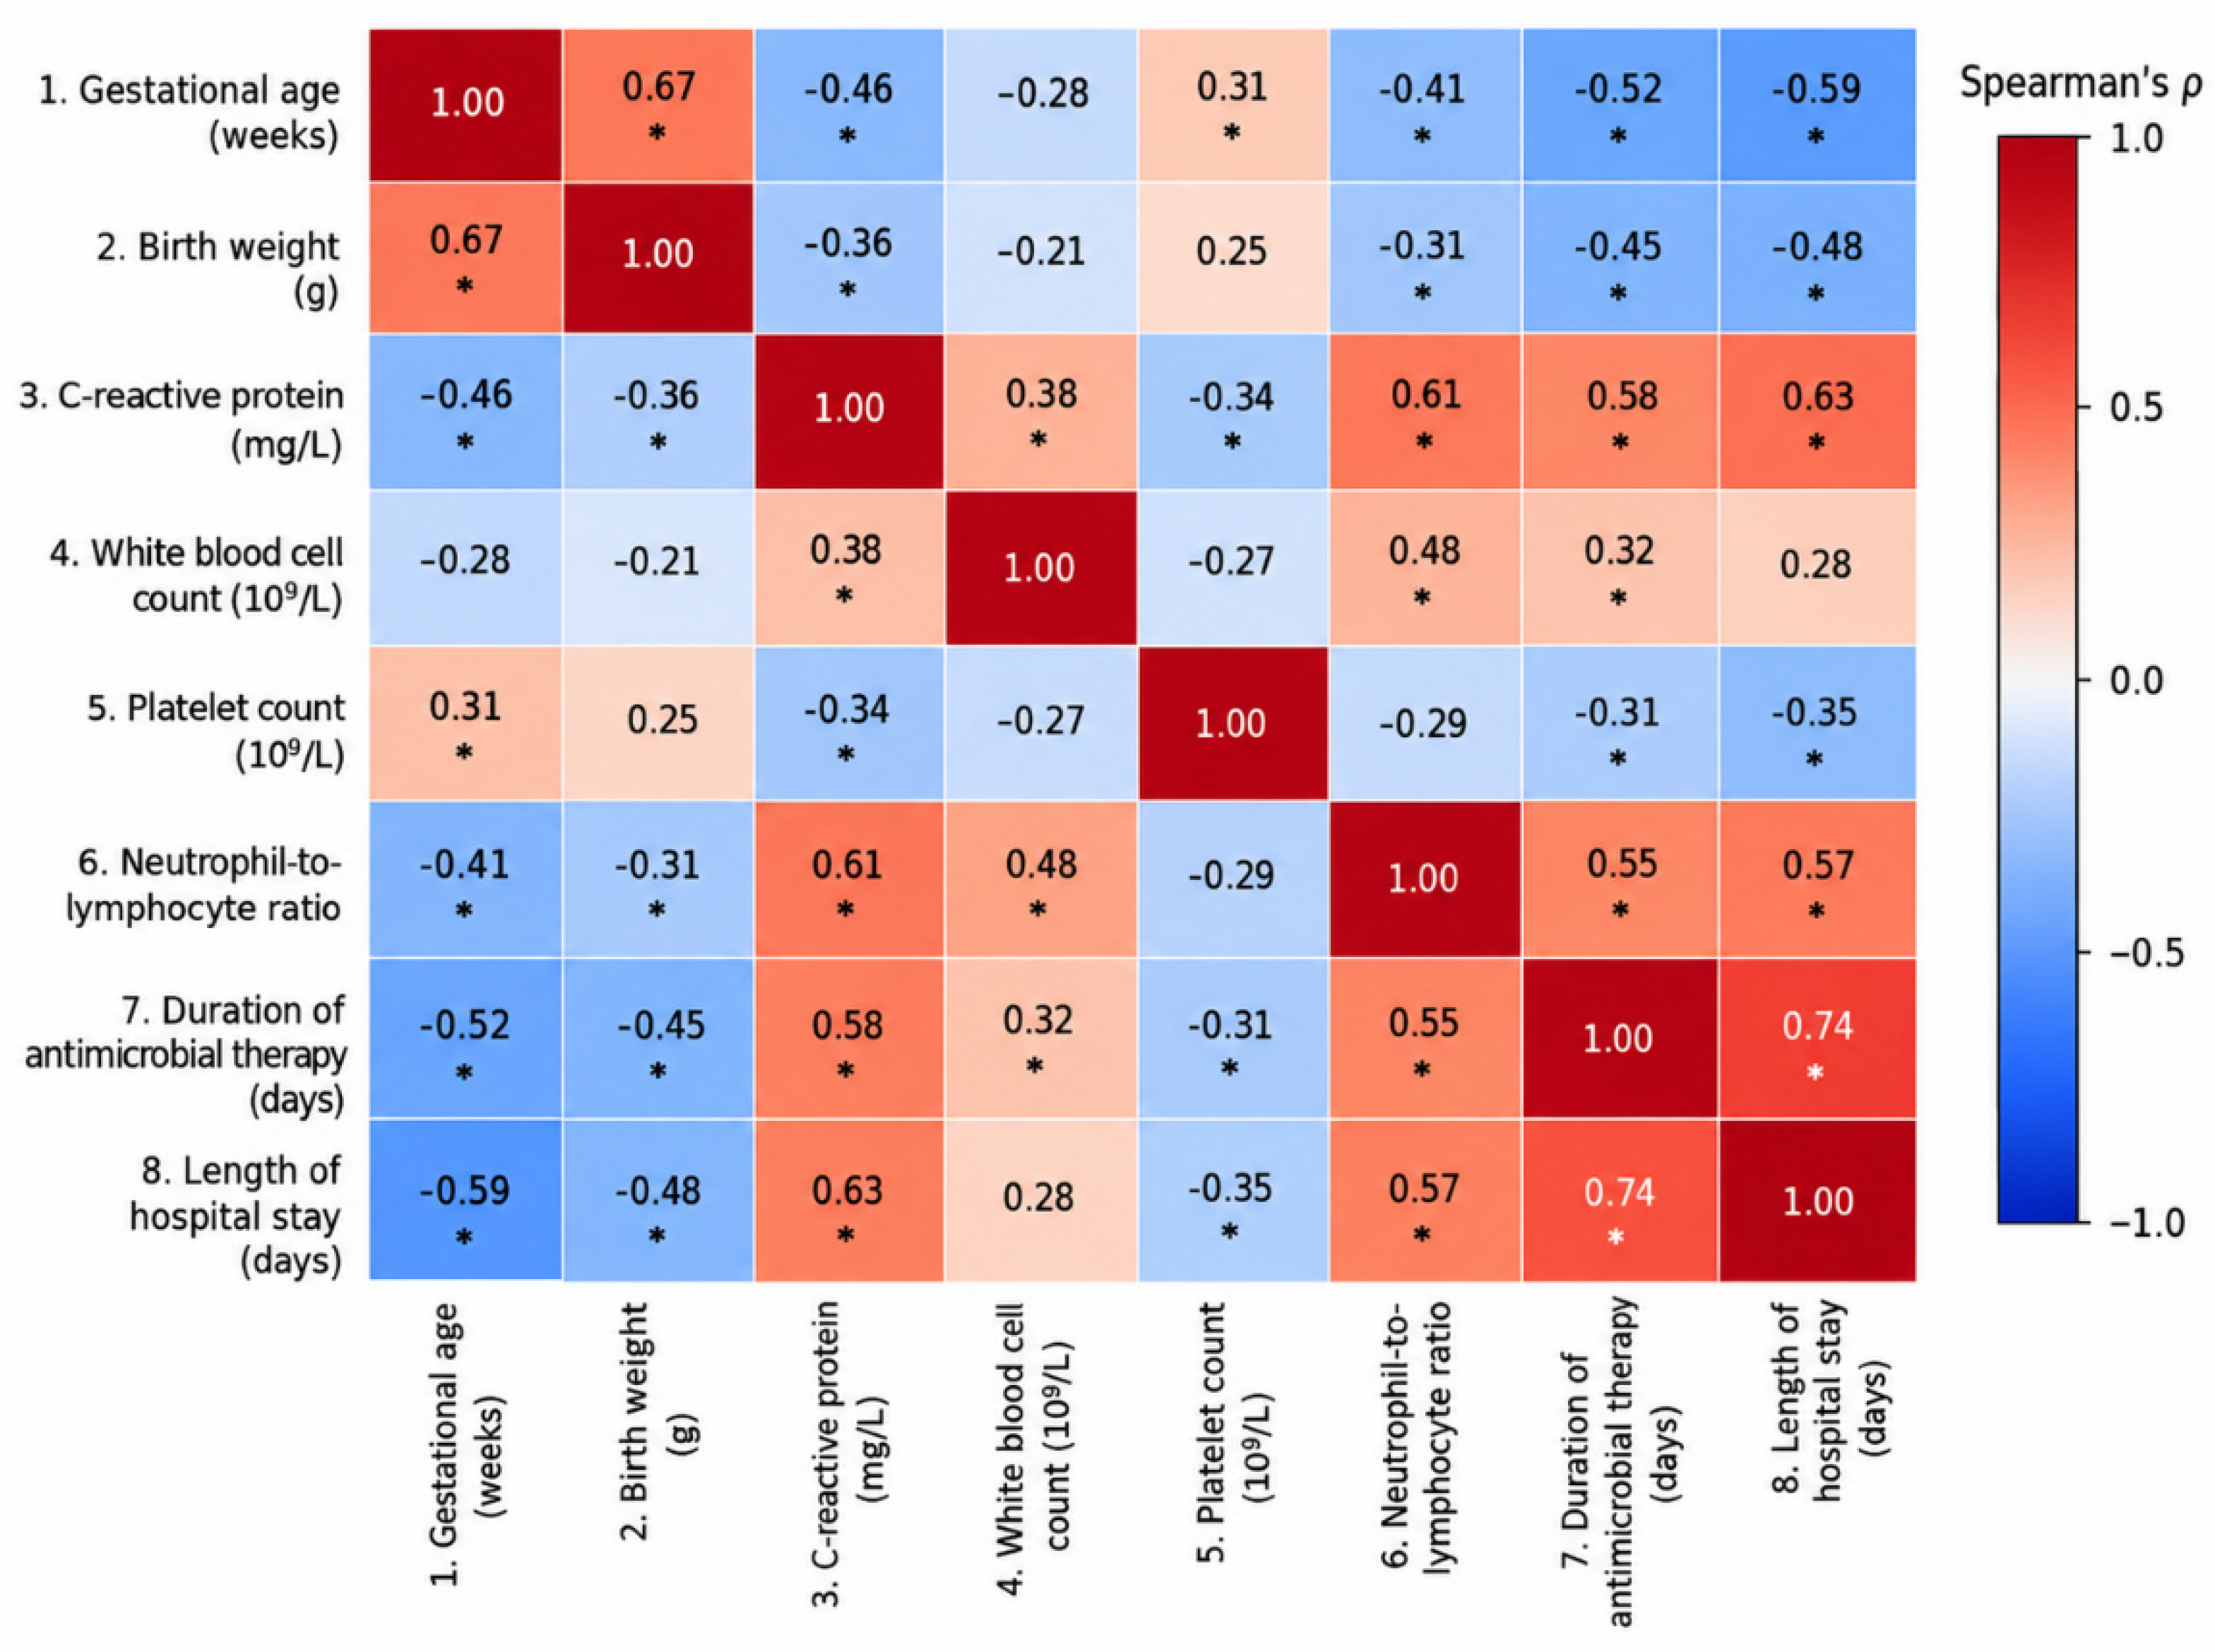
Spearman correlation heatmap of gestational age, laboratory parameters, antimicrobial treatment duration, and length of hospital stay. Note. Spearman’s rank correlation coefficients (ρ) are displayed within each cell. Positive correlations are represented by warmer colors (red), whereas negative correlations are represented by cooler colors (blue). Statistically significant correlations (p < 0.05) are indicated by an asterisk (*). CRP, C-reactive protein; WBC, white blood cell count; NLR, neutrophil-to-lymphocyte ratio. Correlations were calculated using available observations for each pair of variables. The analyses were exploratory, and no adjustment for multiple comparisons was performed.
4. Discussion
The present study compared maternal and perinatal characteristics, neonatal clinical features, inflammatory and microbiological profiles, and antibiotic treatment patterns between preterm and term neonates evaluated and treated for suspected neonatal infection. Of the 52 patients included, 48 (92.3%) had microbiological findings considered clinically relevant.
Compared with term neonates, preterm neonates had lower anthropometric measurements and Apgar scores, as well as higher frequencies of twin pregnancies and prolonged rupture of membranes. Procalcitonin concentrations were significantly higher in the preterm group, although this finding requires confirmation in studies involving larger patient populations.
From a microbiological and therapeutic perspective, the preterm group had a higher proportion of extended-spectrum β-lactamase (ESBL)-producing Enterobacterales isolates, more frequent meropenem use, and longer durations of antibiotic treatment.
In the analysis stratified by neonatal intensive care unit (NICU) admission, neonates admitted to the NICU had lower birth weights, lower Apgar scores, lower leukocyte and platelet counts, and longer durations of antibiotic treatment and hospitalization.
4.1. Clinical, Maternal, and Perinatal Characteristics
Preterm neonates had significantly lower birth weights, lengths, head circumferences, and Apgar scores than term neonates, reflecting differences in gestational maturity. These findings are consistent with the literature, which associates prematurity and low birth weight with physiological immaturity, difficulties in postnatal adaptation, and increased neonatal morbidity and mortality [5,6,7,8,9].
Although the proportion of preterm neonates admitted to the NICU was higher than that of term neonates (60.0% vs. 23.8%), the difference did not reach the conventional threshold for statistical significance (p = 0.052). Neonates admitted to the NICU had lower birth weights and Apgar scores, as well as longer durations of antibiotic treatment and hospitalization. Because these analyses were not adjusted for potential confounding factors, the findings do not allow independent predictors of NICU admission to be identified. The only death recorded in the cohort occurred in the preterm group; however, a single event does not permit meaningful statistical conclusions.
Twin pregnancy and prolonged rupture of membranes were more frequent in the preterm group. This distribution is consistent with studies associating these obstetric characteristics with preterm birth. Rupture of membranes may facilitate ascending microbial transmission and intra-amniotic inflammation, mechanisms implicated in the pathogenesis of early-onset neonatal infections [10,12]. Rupture of membranes lasting more than 18 h, chorioamnionitis, and intrapartum maternal fever have been identified as important risk factors for neonatal infection [10,13].
Maternal infection during pregnancy, gestational diabetes, gestational hypertension, preeclampsia, mode of delivery, and amniotic fluid appearance did not differ significantly between the two groups. This finding may be influenced by the small sample size, which limits the ability to detect moderate differences, and by the heterogeneity of certain clinical categories, such as maternal infection.
In this context, recent advances in the prevention of neonatal infections emphasize the importance of early identification of perinatal risk factors and the administration of intrapartum antibiotic prophylaxis when clinically indicated. Two strategies are recommended for preventing early-onset neonatal group B streptococcal infection: universal antenatal screening followed by intrapartum antibiotic prophylaxis for women who test positive, or prophylaxis based on risk factors identified during labor [32]. The former strategy is associated with a lower risk of early-onset neonatal group B streptococcal infection than an approach based exclusively on risk factors [33].
Furthermore, integrating maternal and perinatal characteristics with the neonate’s clinical condition enables individualized assessment of the risk of early-onset neonatal sepsis. Use of a sepsis risk calculator may reduce unnecessary antibiotic exposure in neonates born at 34 weeks of gestation or later, without a demonstrated increase in the adverse outcomes assessed. These findings cannot be automatically extrapolated to neonates born at earlier gestational ages, for whom individualized clinical assessment remains essential [34].
4.2. Hematological Parameters and Inflammatory Biomarkers
The study identified no statistically significant differences between preterm and term neonates in total leukocyte count, most differential leukocyte parameters, platelet count, or complete blood count-derived inflammatory indices. The absolute lymphocyte count was lower in preterm neonates (p = 0.027), whereas the lymphocyte percentage did not differ significantly. Given the number of exploratory comparisons and the absence of adjustment for multiple testing, this isolated finding should be interpreted cautiously.
Hemoglobin concentration, hematocrit, and red blood cell count were significantly lower in preterm neonates. These differences may reflect hematological immaturity or the influence of other perinatal and postnatal factors and should not be interpreted as markers of infection or inflammatory severity. Because information on postnatal age at sampling, transfusion history, blood loss, hydration status, and timing of umbilical cord clamping was not systematically available, the underlying mechanisms cannot be established from the present data.
The findings must be interpreted in the context of the study population. The two groups did not represent a comparison between infected and healthy neonates, as all patients were evaluated and treated for suspected infection. Accordingly, the analysis examined differences between preterm and term neonates within a clinically selected population and did not permit assessment of the biomarkers’ ability to distinguish infection from its absence.
C-reactive protein (CRP) concentrations were higher in preterm neonates, although the difference did not reach statistical significance (p = 0.090), with substantial interindividual variability observed in both groups. Interpretation of this biomarker is influenced by the kinetics of the inflammatory response, as CRP concentrations rise after a delay following the onset of an infectious stimulus. Consequently, values obtained early in the course of infection may remain low despite the presence of infection, whereas serial measurements may provide additional information compared with a single determination [21,25]. In our study, the first available value at admission was used, thereby standardizing the selection of results without eliminating potential differences in the interval between infection onset and sample collection. Therefore, the absence of a statistically significant difference between groups should be interpreted in light of the small preterm subgroup and the temporal and biological variability of CRP.
Procalcitonin (PCT) concentrations were significantly higher in preterm neonates (p = 0.008). However, interpretation of this biomarker is particularly challenging during the neonatal period because PCT undergoes a physiological increase during the first 24–48 h of life and is influenced by postnatal age at sampling [18,19]. In our study, PCT measurements were available for only 14 neonates, including 6 preterm and 8 term neonates, and exact postnatal age at the time of measurement was not consistently available.
The neutrophil-to-lymphocyte ratio (NLR), platelet-to-lymphocyte ratio (PLR), monocyte-to-lymphocyte ratio (MLR), and neutrophil-to-platelet ratio (NPR) did not differ significantly according to gestational age. These indices can be readily calculated from a complete blood count without additional laboratory testing; however, their values may be influenced by postnatal age, perinatal stress, corticosteroid administration, and other neonatal conditions. A recent study suggested that NLR and PLR may have diagnostic value in late-onset neonatal sepsis [24]. Nevertheless, their performance does not appear sufficiently consistent to support their independent use for diagnosis, and our findings support their interpretation as complementary parameters within a broader clinical and laboratory assessment.
In addition to biomarkers currently used in neonatal practice, recent literature highlights the diagnostic potential of interleukin-6 (IL-6), presepsin, and serum amyloid A. Although the reported findings are promising, study heterogeneity and differences in sepsis definitions limit the clinical applicability of these biomarkers [35]. Predictive models combining clinical and laboratory parameters, including machine learning approaches, are also being investigated, but their clinical implementation requires further validation [36].
In the exploratory analysis stratified by NICU admission, neonates admitted to intensive care had significantly lower median leukocyte counts (10.24 vs. 13.97 × 10⁹/L; p = 0.009) and platelet counts (213 vs. 293 × 109/L; p = 0.009) than those managed outside the NICU. These differences should not be interpreted as evidence of clinically defined leukopenia or thrombocytopenia. CRP, NLR, PLR, and MLR did not differ significantly between the two groups. In the absence of adjustment for potential confounders, these findings do not establish independent associations between hematological parameters and NICU admission.
4.3. Microbiological Profile
Among cases with microbiologically supported infection, Gram-negative bacteria were the only organisms isolated from all 9 preterm neonates and from 27 of the 39 term neonates. In the term group, a mixed infection involving Staphylococcus aureus and Serratia marcescens was also identified; thus, at least one Gram-negative organism was present in 28 of the 39 patients with clinically relevant microbiological findings. Gram-negative predominance has also been reported in other neonatal populations. The multicenter NeoSEAP study, published in 2025, reported that Gram-negative bacteria accounted for 78.4% of pathogens identified in blood cultures, with Klebsiella spp. and Acinetobacter spp. being the most frequently identified organisms [37]. Differences in the predominant species highlight the variability of neonatal epidemiology; however, comparisons with our study are limited by differences in the sources of microbiological specimens.
Escherichia coli was the predominant microorganism, accounting for 28 of the 49 clinically relevant isolates (57.1%), with a similar distribution between preterm and term neonates. This finding is consistent with the important role of E. coli in neonatal infections, particularly early-onset sepsis [2,3,4]. Nevertheless, the etiological distribution may vary according to the type of infection, timing of onset, and characteristics of the study population. In contrast to our findings, a retrospective study of blood culture-confirmed neonatal sepsis reported a predominance of coagulase-negative staphylococci in the context of late-onset infections, frequently associated with vascular catheters [38].
Streptococcus agalactiae, the second most frequently identified microorganism in our study, was isolated exclusively from term neonates. Vertical intrapartum transmission is a possible explanation, but the available data do not allow the mode of transmission to be established. The absence of this microorganism in preterm neonates should be interpreted in the context of the small subgroup with positive microbiological findings (n = 9). Furthermore, Klebsiella pneumoniae was proportionally more frequent in preterm neonates (22.2% vs. 5.1%), although the difference was not statistically significant. Acinetobacter baumannii, Burkholderia cepacia, and the carbapenemase-producing isolate were identified only in this group. In the absence of complete information on invasive device use and the duration of hospitalization before specimen collection, the factors underlying these distributions cannot be established.
Systematic monitoring of isolated microorganisms and their antimicrobial susceptibility profiles is an important component of neonatal infection surveillance. The NeoSEAP study demonstrated both the predominance of Gram-negative bacteria and high rates of nonsusceptibility to commonly used antibiotics, with variation across microorganisms [37]. Furthermore, a study based on an Australian surveillance network, published in 2025, demonstrated the value of standardized monitoring of catheter-associated bloodstream infections in neonatal intensive care units, including the reporting of incidence according to the duration of device exposure [39]. These approaches enable the assessment of epidemiological trends and may inform local infection prevention and control measures. Our study provides a description of clinically relevant isolates but does not allow estimation of the incidence of healthcare-associated infections or identification of changes in epidemiological patterns over time.
Molecular methods may complement conventional microbiological diagnosis by enabling rapid detection of microbial genetic material. A 2025 Cochrane review highlighted limitations in the diagnostic accuracy of these tests for confirming or excluding neonatal sepsis [40]. Metagenomic next-generation sequencing enables the detection of a broad range of microorganisms; however, the risk of contamination and the difficulty of distinguishing the detection of microbial genetic material from active infection limit the interpretation of results [41]. Furthermore, molecular identification of genetic determinants of antimicrobial resistance does not always correspond to the phenotypic susceptibility profile. Therefore, these methods should be integrated with clinical findings, conventional microbiological cultures, and phenotypic antimicrobial susceptibility testing rather than replacing them in routine clinical practice [42].
The sources of microbiological specimens represent an important limitation in interpreting our findings. Ear discharge specimens were collected from 36 of the 52 neonates (69.2%), whereas blood cultures were available for only 13 patients (25.0%). Unlike blood cultures, bacterial isolation from a nonsterile site does not, in itself, confirm an invasive infection. Distinguishing colonization from localized infection requires correlation of microbiological findings with clinical manifestations and specimen collection characteristics. Consequently, the distribution of microorganisms in our cohort cannot be considered representative of the etiology of blood culture-confirmed neonatal sepsis.
Positive microbiological findings were recorded in 48 of the 52 patients (92.3%). This proportion reflects the retrospective selection of cases from laboratory records and the inclusion of specimens obtained from multiple anatomical sites; it does not represent the rate of confirmed bacteremia. The four neonates with negative microbiological findings were retained in the cohort because clinical suspicion of infection warranted antibiotic treatment. Specimen collection quality may affect blood culture sensitivity. In a study published in 2024, Rueda et al. found that 35% of the culture bottles analyzed contained blood volumes below 0.9 mL, although no significant differences in blood volumes were identified between the diagnostic categories investigated [43]. In our study, the lack of systematic information on inoculated blood volume and antibiotic administration before specimen collection prevents an explanation of the negative findings. These cases therefore remain episodes treated for suspected infection without microbiological confirmation.
4.4. Antimicrobial Resistance and Antibiotic Treatment
One of the important findings of our study was the higher proportion of extended-spectrum β-lactamase (ESBL)-producing Enterobacterales isolates in preterm neonates (57.1%; 4/7) compared with term neonates (14.8%; 4/27; p = 0.037). However, the small number of isolates and the wide confidence interval around the estimated effect (OR = 7.67; 95% CI: 1.22–48.05) indicate considerable uncertainty. This observation is consistent with findings from a study of neonatal Escherichia coli infections, in which multidrug-resistant ESBL-producing strains were more frequent in preterm neonates and in hospital-acquired late-onset infections. Maternal exposure to cephalosporins during the antepartum period and parenteral nutrition administered for more than one week were independently associated with the isolation of ESBL-producing E. coli [30]. In our cohort, the absence of systematic information on previous antibiotic exposure and therapeutic interventions precludes establishing an independent association between prematurity and the presence of ESBL-producing microorganisms.
One multidrug-resistant (MDR) isolate and one carbapenemase-producing Enterobacterales (CPE) isolate harboring an OXA-48 carbapenemase were identified exclusively in preterm neonates, without statistically significant differences between groups. Although the number of cases is insufficient to draw firm epidemiological conclusions, the identification of these microorganisms highlights the need for antimicrobial resistance monitoring and measures to prevent their transmission in healthcare settings.
Meropenem was administered more frequently to preterm than to term neonates (30.0% vs. 2.4%; p = 0.019), although only four patients received this antibiotic, including three preterm and one term neonate. The very wide confidence interval around the estimated effect (OR = 16.08; 95% CI: 1.12–943.65) reflects the limited precision of the estimate. The observed difference may be influenced by microbiological characteristics and clinical complexity, without demonstrating a causal relationship between prematurity, meropenem administration, and antimicrobial resistance.
Amikacin and the ampicillin–sulbactam combination were the most frequently prescribed antibiotics, while the median number of antibiotics administered per patient was identical in both groups (2). The duration of antibiotic treatment was longer in preterm neonates, with a median of 7.5 days compared with 5 days in term neonates. In the secondary analysis, patients admitted to the NICU had longer median durations of antibiotic treatment (9 vs. 5 days) and hospitalization (16.5 vs. 7 days) than those managed outside intensive care. These differences may reflect the severity and complexity of clinical care; however, the observational nature of the study and the absence of multivariable analysis preclude assessment of the independent contribution of each factor.
These findings support the relevance of antimicrobial stewardship programs tailored to local epidemiology. A meta-analysis published in 2024, including more than 350,000 neonates, demonstrated reductions in antibiotic initiation and treatment duration, including courses exceeding five days, without an increase in sepsis-related mortality or the need to restart treatment [28]. Recent reviews emphasize the importance of strategies to optimize antibiotic prescribing during the perinatal period and in neonatal intensive care units by integrating clinical assessment, microbiological findings, and local antimicrobial resistance profiles [44,45].
In local clinical practice, these principles could be implemented through appropriate collection of microbiological specimens before initiating antibiotic treatment, systematic reassessment of the indication for treatment, and de-escalation based on clinical progression and microbiological results. The NICE guideline recommends reassessing empirical antibiotic treatment at 36 h in suspected early-onset infection and at 48 h in suspected late-onset infection, taking into account blood culture results, clinical condition, and trends in inflammatory markers [46]. Nevertheless, evidence regarding optimal strategies for discontinuing empirical treatment must be interpreted in relation to the characteristics of the neonatal population [47]. In the context of our findings, periodic surveillance of antimicrobial susceptibility and audits of carbapenem use could contribute to individualized antibiotic treatment, without the higher proportion of ESBL-producing isolates in preterm neonates justifying universal empirical meropenem administration.
4.5. Clinical Implications
The findings of the present study support the importance of an integrated assessment of neonates with suspected infection, combining perinatal and clinical characteristics with hematological parameters, inflammatory biomarkers, and microbiological investigations. Differences identified in the exploratory analysis of NICU admission suggest that these data may contribute to assessing case complexity, although they do not allow independent predictors of the need for intensive care to be identified.
The observed differences in meropenem use and antibiotic treatment duration may reflect microbiological characteristics and clinical complexity. However, the observational nature of the study and the lack of adjustment for potential confounders prevent determination of the independent contribution of these factors to therapeutic decisions.
Periodic monitoring of isolated microorganisms and antimicrobial resistance profiles may contribute to updating treatment protocols and optimizing empirical antibiotic selection, thereby promoting the judicious use of broad-spectrum antibiotics in neonatal care.
4.6. Strengths and Limitations of the Study
The principal strength of this study is its multidimensional approach, integrating maternal and perinatal information, neonatal clinical data, inflammatory biomarkers, microbiological findings, antimicrobial resistance profiles, and treatment characteristics. The inclusion of neonates with microbiological findings considered clinically relevant, alongside those treated for suspected infection despite negative cultures, reflects current clinical practice. Comparisons according to gestational age and the additional assessment of patients admitted to the NICU allowed the cohort to be characterized from complementary perspectives.
The retrospective, single-center design represents an important methodological limitation because of its reliance on information available in medical records and the limited generalizability of the findings to other neonatal populations. The small sample size (n = 52), including only 10 preterm neonates, reduced statistical power and precluded reliable multivariable analyses. The imprecision of certain estimates is also reflected in the wide confidence intervals.
The analysis of inflammatory biomarkers was based exclusively on the initial available measurements, without examining changes over time through serial testing. Procalcitonin was measured in only 14 neonates, and exact postnatal age at specimen collection was not systematically recorded. These limitations complicate the interpretation of the observed differences, given the physiological variations in PCT during the early neonatal period.
Incomplete documentation of infection onset, invasive device use, mechanical ventilation, and parenteral nutrition prevented reliable differentiation between early- and late-onset infections, as well as assessment of the independent effects of potential confounders. Furthermore, the absence of adjustment for multiple comparisons increases the likelihood of identifying statistically significant associations by chance. Consequently, nominal p-values, particularly those close to the conventional significance threshold, should not be considered conclusive evidence without confirmation in further studies.
Another limitation concerns the sources of microbiological specimens, which were predominantly ear discharge samples and are not equivalent to specimens obtained from sterile sites. Therefore, the distribution of isolated microorganisms cannot be extrapolated to the etiology of blood culture-confirmed neonatal sepsis. Although the clinical relevance of isolates from nonsterile sites was assessed using predefined clinical and laboratory criteria, misclassification of colonization as infection, or vice versa, cannot be completely excluded. In addition, the study did not assess infection recurrence, hospital readmissions, or long-term neurodevelopmental outcomes.
Retrospective patient selection from microbiology laboratory records and electronic medical records may introduce selection bias by favoring cases with positive microbiological findings. This mechanism may partly explain the high proportion of positive cultures and limits the applicability of the findings to the broader population of neonates receiving empirical antibiotic treatment for suspected infection, particularly in units where blood culture is the primary microbiological investigation.
Despite these limitations, the study provides relevant information on local characteristics of suspected neonatal infection and its management. Future prospective multicenter studies involving larger and more balanced samples should incorporate serial biomarker measurements, standardized specimen collection timing, and separate classification of early- and late-onset infections. Such an approach would facilitate investigation of the relationships among gestational maturity, inflammatory response, microbiological profiles, antimicrobial resistance, and treatment requirements.
5. Conclusions
This retrospective single-center study identified several differences between preterm and term neonates treated for suspected neonatal infection. Preterm neonates had lower anthropometric measurements and Apgar scores and were more frequently born after twin pregnancies and prolonged rupture of membranes. Most routinely evaluated inflammatory indices did not differ significantly according to gestational age, although procalcitonin concentrations were higher among preterm neonates in the small subgroup with available measurements. The absence of significant differences should be interpreted in the context of a clinically selected cohort in which all neonates were treated for suspected infection.
ESBL-producing Enterobacterales were more frequently identified among preterm neonates, who also received meropenem more frequently and had a longer duration of antibiotic therapy. In exploratory unadjusted analyses, NICU admission was associated with lower birth weight, lower Apgar scores, lower white blood cell and platelet counts, and longer treatment and hospitalization.
These findings should be interpreted in light of the small sample size, the predominance of non-blood microbiological specimens, incomplete availability of some biomarkers, and the absence of multivariable adjustment. Larger prospective studies distinguishing early-onset from late-onset infection are required. Nevertheless, the findings support continued antimicrobial stewardship and local surveillance of ESBL-producing Enterobacterales, particularly among preterm neonates.
Author Contributions
Conceptualization, A.P. and A.B.; methodology, A.P. and A.B.; validation, A.P., A.S., I.B.K. and A.B.; formal analysis, A.P. and I.B.K.; investigation, A.P. and A.S.; resources, A.P. and A.S.; data curation, A.P. and I.B.K.; writing—original draft preparation, A.P.; writing—review and editing, A.P., A.S., I.B.K. and A.B.; visualization, A.P. and I.B.K.; supervision, A.B.; project administration, A.P. and A.B. All authors have read and agreed to the published version of the manuscript.
Funding
This research received no external funding.
Institutional Review Board Statement
The study was conducted in accordance with the Declaration of Helsinki and approved by the Ethics Committee of Târgu Mureș County Emergency Clinical Hospital (approval No. 20158, dated 7 September 2026).
Informed Consent Statement
Patient consent was waived due to the retrospective nature of the study and the use of anonymized data, in accordance with the approval of the Ethics Committee.
Data Availability Statement
The data generated and analyzed during this study are not publicly available due to patient confidentiality and data protection requirements. Further information regarding the data may be obtained from the corresponding author upon reasonable request, subject to institutional approval and applicable data protection regulations.
Acknowledgments
During the preparation of this manuscript, the authors used ChatGPT (OpenAI) for language editing and assistance with improving the clarity and structure of the manuscript. The authors have reviewed and edited the output and take full responsibility for the content of this publication.
Conflicts of Interest
The authors declare no conflicts of interest.
Abbreviations
The following abbreviations are used in this manuscript:
| ALT | Alanine aminotransferase |
| AST | Aspartate aminotransferase |
| CI | Confidence interval |
| CPE | Carbapenemase-producing Enterobacterales |
| CRP | C-reactive protein |
| ESBL | Extended-spectrum beta-lactamase |
| EUCAST | European Committee on Antimicrobial Susceptibility Testing |
| GDPR | General Data Protection Regulation |
| IQR | Interquartile range |
| MDR | Multidrug-resistant |
| MLR | Monocyte-to-lymphocyte ratio |
| NICU | Neonatal intensive care unit |
| NLR | Neutrophil-to-lymphocyte ratio |
| NPR | Neutrophil-to-platelet ratio |
| OR | Odds ratio |
| PCT | Procalcitonin |
| PLR | Platelet-to-lymphocyte ratio |
| PLT | Platelet count |
| rrb | Rank-biserial correlation |
| STROBE | Strengthening the Reporting of Observational Studies in Epidemiology |
| TNF-α | Tumor necrosis factor-alpha |
| WBC | White blood cell count |
References
- United Nations Inter-agency Group for Child Mortality Estimation (UN IGME). Levels and Trends in Child Mortality 2025; United Nations Children’s Fund: New York, NY, USA, 2025; UNICEF Global. [Google Scholar]
- Li, J.; Shen, L.; Qian, K. Global, regional, and national incidence and mortality of neonatal sepsis and other neonatal infections, 1990 to 2019. Front. Public Health 2023, 11, 1139832. [Google Scholar] [CrossRef] [PubMed]
- Kariniotaki, C.; Thomou, C.; Gkentzi, D.; Panteris, E.; Dimitriou, G.; Hatzidaki, E. Neonatal sepsis: A comprehensive review. Antibiotics 2025, 14, 6. [Google Scholar] [CrossRef] [PubMed]
- Lee, C.Y.; Zven, S.E.; Sathya, S.A.; Abukhalaf, D.; Sahoo, S.; Samal, P.; Prescott, S.M. Using molecular methods to diagnose, classify, and treat neonatal sepsis: A scoping review. Front. Pediatr. 2025, 13, 1625449. [Google Scholar] [CrossRef] [PubMed]
- Collins, A.; Weitkamp, J.H.; Wynn, J.L. Why are preterm newborns at increased risk of infection? Arch. Dis. Child. Fetal Neonatal Ed. 2018, 103, F391–F394. [Google Scholar] [CrossRef] [PubMed]
- Raturi, A.; Chandran, S. Neonatal sepsis: Aetiology, pathophysiology, diagnostic advances and management strategies. Clin. Med. Insights Pediatr. 2024, 18, 11795565241281337. [Google Scholar] [CrossRef] [PubMed]
- Sharma, A.A.; Jen, R.; Butler, A.; Lavoie, P.M. The developing human preterm neonatal immune system: A case for more research in this area. Clin. Immunol. 2012, 145, 61–68. [Google Scholar] [CrossRef] [PubMed]
- Melville, J.M.; Moss, T.J.M. The immune consequences of preterm birth. Front. Neurosci. 2013, 7, 79. [Google Scholar] [CrossRef] [PubMed]
- McGuire, W.; Clerihew, L.; Fowlie, P.W. Infection in the preterm infant. BMJ 2004, 329, 1277–1280. [Google Scholar] [CrossRef] [PubMed]
- Guo, L.; Han, W.; Su, Y.; Wang, N.; Chen, X.; Ma, J.; Liang, J.; Hao, L.; Ren, C. Perinatal risk factors for neonatal early-onset sepsis: A meta-analysis of observational studies. J. Matern. Fetal Neonatal Med. 2023, 36, 2259049. [Google Scholar] [CrossRef] [PubMed]
- Glaser, M.A.; Hughes, L.M.; Jnah, A.; Newberry, D. Neonatal sepsis: A review of pathophysiology and current management strategies. Adv. Neonatal Care 2021, 21, 49–60. [Google Scholar] [CrossRef] [PubMed]
- Beck, C.; Gallagher, K.; Taylor, L.A.; Goldstein, J.A.; Mithal, L.B.; Gernand, A.D. Chorioamnionitis and risk for maternal and neonatal sepsis: A systematic review and meta-analysis. Obstet. Gynecol. 2021, 137, 1007–1022. [Google Scholar] [CrossRef] [PubMed]
- Vulcănescu, A.; Siminel, M.-A.; Dinescu, S.-N.; Boldeanu, M.-V.; Dijmărescu, A.-L.; Manolea, M.-M.; Văduva, C.-C. Systematic review: Maternal risk factors, socioeconomic influences, neonatal biomarkers and management of early-onset sepsis in late preterm and term newborns: A focus on European and Eastern European contexts. Life 2025, 15, 292. [Google Scholar] [CrossRef] [PubMed]
- Lee, H.Y.; Hsu, Y.L.; Lee, W.Y.; Huang, K.H.; Tsai, M.L.; Chen, C.L.; et al. Maternal infections, antibiotics, steroid use, and diabetes mellitus increase risk of early-onset sepsis in preterm neonates: A nationwide population-based study. Pathogens 2025, 14, 89. [Google Scholar] [CrossRef] [PubMed]
- Mussap, M.; Noto, A.; Cibecchini, F.; Fanos, V. The importance of biomarkers in neonatology. Semin. Fetal Neonatal Med. 2013, 18, 56–64. [Google Scholar] [CrossRef] [PubMed]
- Ng, P.C.; Lam, H.S. Biomarkers for late-onset neonatal sepsis: Cytokines and beyond. Clin. Perinatol. 2010, 37, 599–610. [Google Scholar] [CrossRef] [PubMed]
- Kumar, D.; Kumar, D.; Sharma, N.; Saraswat, P.; Alim, M.; Sharma, I.K.; Kumar, A. Diagnostic performance of biomarkers tumor necrosis factor-α, interleukin-6, and procalcitonin in neonatal sepsis: A case-control study. J. Interferon Cytokine Res. 2026, 46, 70–75. [Google Scholar] [CrossRef] [PubMed]
- Chiesa, C.; Pellegrini, G.; Panero, A.; Osborn, J.F.; Signore, F.; Assumma, M.; et al. C-reactive protein, interleukin-6, and procalcitonin in the immediate postnatal period: Influence of illness severity, risk status, antenatal and perinatal complications, and infection. Clin. Chem. 2003, 49, 60–68. [Google Scholar] [CrossRef] [PubMed]
- Morad, E.A.; Rabie, R.A.; Almalky, M.A.; Gebriel, M.G. Evaluation of procalcitonin, C-reactive protein, and interleukin-6 as early markers for diagnosis of neonatal sepsis. Int. J. Microbiol. 2020, 2020, 8889086. [Google Scholar] [CrossRef] [PubMed]
- Go, H.; Nagano, N.; Katayama, D.; Akimoto, T.; Imaizumi, T.; Aoki, R.; et al. Diagnostic accuracy of biomarkers for early-onset neonatal bacterial infections: Evaluation of serum procalcitonin reference curves. Diagnostics 2020, 10, 839. [Google Scholar] [CrossRef] [PubMed]
- Franz, A.R.; Kron, M.; Pohlandt, F.; Steinbach, G. Comparison of procalcitonin with interleukin-8, C-reactive protein and differential white blood cell count for the early diagnosis of bacterial infections in newborn infants. Pediatr. Infect. Dis. J. 1999, 18, 666–671. [Google Scholar] [CrossRef] [PubMed]
- Poggi, C.; Lucenteforte, E.; Petri, D.; De Masi, S.; Dani, C. Presepsin for the diagnosis of neonatal early-onset sepsis: A systematic review and meta-analysis. JAMA Pediatr. 2022, 176, 750–758. [Google Scholar] [CrossRef] [PubMed]
- Huang, C.; Chen, J.; Zhan, X.; Li, L.; An, S.; Cai, G.; et al. Clinical value of laboratory biomarkers for the diagnosis and early identification of culture-positive sepsis in neonates. J. Inflamm. Res. 2023, 16, 5111–5124. [Google Scholar] [CrossRef] [PubMed]
- Yin, Q.; Yin, J.; Shen, L.; Zhou, Q.; Xu, W. The early diagnostic value of neutrophil-to-lymphocyte ratio and platelet-to-lymphocyte ratio in neonatal late-onset sepsis. Front. Pediatr. 2025, 13, 1483522. [Google Scholar] [CrossRef] [PubMed]
- Sharma, D.; Farahbakhsh, N.; Shastri, S.; Sharma, P. Biomarkers for diagnosis of neonatal sepsis: A literature review. J. Matern. Fetal Neonatal Med. 2018, 31, 1646–1659. [Google Scholar] [CrossRef] [PubMed]
- Khassawneh, M.; Hayajneh, W.A.; Kofahi, H.; Khader, Y.; Amarin, Z.; Daoud, A. Diagnostic markers for neonatal sepsis: Comparing C-reactive protein, interleukin-6 and immunoglobulin M. Scand. J. Immunol. 2007, 65, 171–175. [Google Scholar] [CrossRef] [PubMed]
- Flannery, D.D.; Coggins, S.A.; Medoro, A.K. Antibiotic stewardship in the neonatal intensive care unit. J. Intensive Care Med. 2025, 40, 862–875. [Google Scholar] [CrossRef] [PubMed]
- Mascarenhas, D.; Ho, M.S.P.; Ting, J.; Shah, P.S. Antimicrobial stewardship programs in neonates: A meta-analysis. Pediatrics 2024, 153, e2023065091. [Google Scholar] [CrossRef] [PubMed]
- Prusakov, P.; Goff, D.A.; Wozniak, P.S.; Cassim, A.; Scipion, C.E.A.; Urzúa, S.; et al. A global point prevalence survey of antimicrobial use in neonatal intensive care units: The no-more-antibiotics and resistance (NO-MAS-R) study. eClinicalMedicine 2021, 32, 100727. [Google Scholar] [CrossRef] [PubMed]
- Zhu, M.; Wang, L.; Zhuge, Z.; Li, W.; Zheng, Y.; Mai, J.; Lin, Z.; Lin, J. Risk factors associated with multi-drug resistance in neonatal sepsis caused by Escherichia coli. Infect. Drug Resist. 2023, 16, 2097–2106. [Google Scholar] [CrossRef] [PubMed]
- Magiorakos, A.P.; Srinivasan, A.; Carey, R.B.; Carmeli, Y.; Falagas, M.E.; Giske, C.G.; et al. Multidrug-resistant, extensively drug-resistant and pandrug-resistant bacteria: An international expert proposal for interim standard definitions for acquired resistance. Clin. Microbiol. Infect. 2012, 18, 268–281. [Google Scholar] [CrossRef] [PubMed]
- World Health Organization. WHO Recommendation on Screening of Pregnant Women for Intrapartum Antibiotic Prophylaxis for the Prevention of Early Onset Group B Streptococcus Disease in Newborns; World Health Organization: Geneva, Switzerland, 2024. [Google Scholar]
- Panneflek, T.J.R.; Hasperhoven, G.F.; Chimwaza, Y.; Allen, C.; Lavin, T.; Te Pas, A.B.; et al. Intrapartum antibiotic prophylaxis to prevent Group B streptococcal infections in newborn infants: A systematic review and meta-analysis comparing various strategies. eClinicalMedicine 2024, 74, 102748. [Google Scholar] [CrossRef] [PubMed]
- van der Weijden, B.M.; Janssen, S.W.C.M.; van der Weide, M.C.; Cornelisse-van Vugt, R.J.P.M.; Ten Tusscher, G.W.; Lutterman, C.A.M.; et al. Safety and effectiveness of the early-onset sepsis calculator to reduce antibiotic exposure in at-risk newborns: A cluster-randomised controlled trial. eClinicalMedicine 2025, 87, 103419. [Google Scholar] [CrossRef] [PubMed]
- van Leeuwen, L.M.; Fourie, E.; van den Brink, G.; Bekker, V.; van Houten, M.A. Diagnostic value of maternal, cord blood and neonatal biomarkers for early-onset sepsis: A systematic review and meta-analysis. Clin. Microbiol. Infect. 2024, 30, 850–857. [Google Scholar] [CrossRef] [PubMed]
- Stocker, M.; Fillistorf, L.; Carra, G.; Giannoni, E. Early detection of neonatal sepsis and reduction of overall antibiotic exposure: Towards precision medicine. Arch. Pediatr. 2024, 31, 480–483. [Google Scholar] [CrossRef] [PubMed]
- Dickson, B.F.R.; et al. Pathogen distribution and antimicrobial resistance among neonatal bloodstream infections in Southeast Asia: Results from NeoSEAP, a multicentre retrospective study. Lancet Reg. Health West. Pac. 2025, 62, 101617. [Google Scholar] [CrossRef] [PubMed]
- Rubio-Mora, E.; Bloise-Sánchez, I.; Quiles-Melero, I.; Cacho-Calvo, J.; Cendejas-Bueno, E. Neonatal sepsis: Epidemiology and comparison between preterm and term newborns. Enferm. Infecc. Microbiol. Clin. 2025, 43, 197–204. [Google Scholar] [CrossRef]
- Liu, Z.R.; Bull, A.L.; Phuong, L.K.; Malloy, M.J.; Friedman, N.D.; Worth, L.J. Central- and peripheral-line-associated bloodstream infections in Victorian neonatal intensive care units: Findings from a comprehensive Victorian surveillance network, 2008–2024. J. Hosp. Infect. 2025, 161, 83–91. [Google Scholar] [CrossRef] [PubMed]
- Dierikx, T.H.; Visser, D.H.; de Meij, T.; Versalovic, J.; Leeflang, M.M.G.; Cooper, C.; Pammi, M. Molecular assays for the diagnosis of sepsis in neonates: A diagnostic test accuracy review. Cochrane Database Syst. Rev. 2025, 3, CD011926. [Google Scholar] [CrossRef] [PubMed]
- Agudelo-Pérez, S.; Fernández-Sarmiento, J.; Rivera León, D.; Peláez, R.G. Metagenomics by next-generation sequencing (mNGS) in the etiological characterization of neonatal and pediatric sepsis: A systematic review. Front. Pediatr. 2023, 11, 1011723. [Google Scholar] [CrossRef] [PubMed]
- Zou, Z.; Tang, F.; Qiao, L.; Wang, S.; Zhang, H. Integrating sequencing methods with machine learning for antimicrobial susceptibility testing in pediatric infections: Current advances and future insights. Front. Microbiol. 2025, 16, 1528696. [Google Scholar] [CrossRef] [PubMed]
- Rueda, M.S.; Soghier, L.; Campos, J.; et al. Blood volume collected for cultures in infants with suspected neonatal sepsis. J. Perinatol. 2024, 44, 1800–1804. [Google Scholar] [CrossRef] [PubMed]
- Winteler, C.; Ardabili, S.; Hodel, M.; Stocker, M. A systematic review of perinatal antibiotic stewardship—Where we are, where to go? J. Perinatol. 2025, 45, 1411–1422. [Google Scholar] [CrossRef] [PubMed]
- Kharrat, A.; Tabbara, N.; Shah, P.S. Antibiotic stewardship in the neonatal intensive care unit and prevention of antimicrobial resistance. Semin. Fetal Neonatal Med. 2025, 30, 101666. [Google Scholar] [CrossRef] [PubMed]
- National Institute for Health and Care Excellence (NICE). Neonatal Infection: Antibiotics for Prevention and Treatment. NICE Guideline NG195; NICE: London, UK, 2021; Available online: https://www.nice.org.uk/guidance/ng195 (accessed on 10 October 2026).
- Feng, K.; Zhang, T.; Hua, Z. Discontinuation of empirical antibiotics in suspected neonatal early-onset sepsis: A systematic review and meta-analysis. Pediatr. Res. 2026, 99, 871–878. [Google Scholar] [CrossRef] [PubMed]
Figure 1.
Flowchart of patient selection according to the STROBE recommendations.
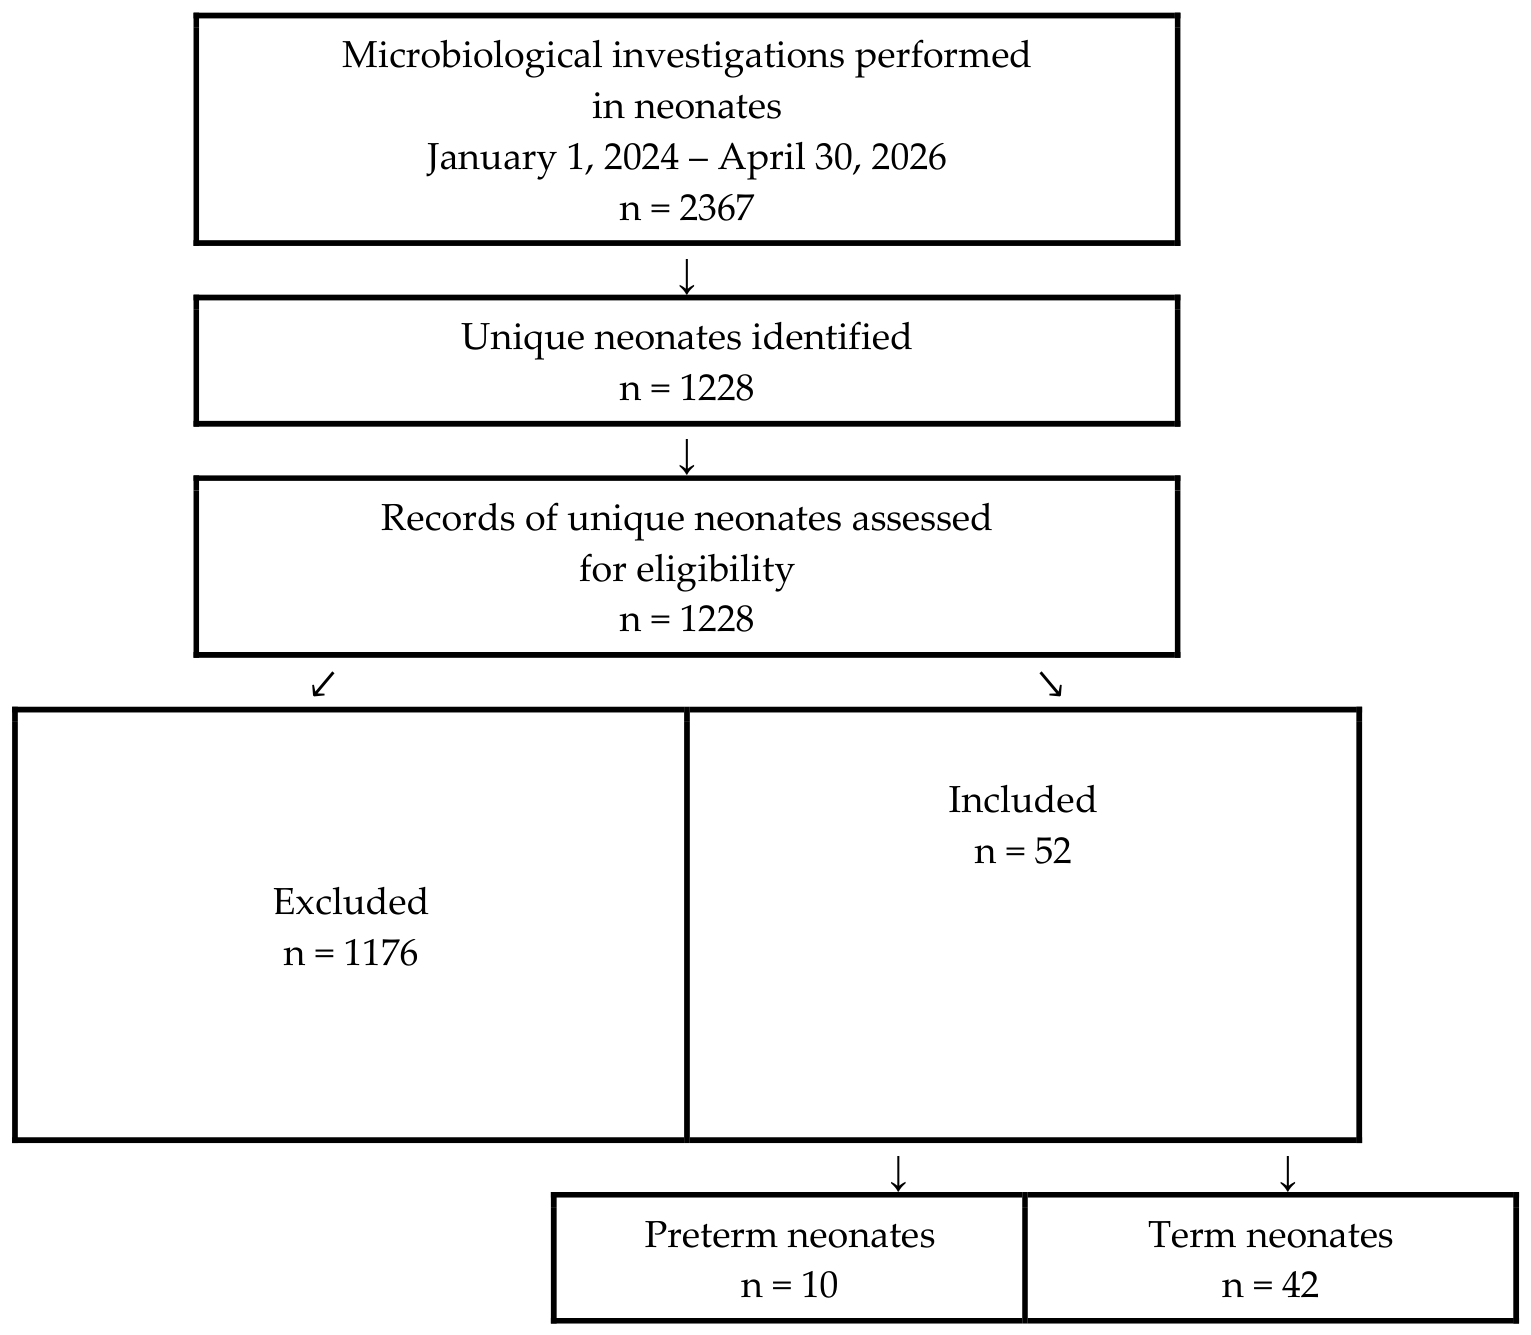
Table 1.
Baseline demographic and clinical characteristics of the study cohort according to gestational age.
Table 1.
Baseline demographic and clinical characteristics of the study cohort according to gestational age.
| Variable | Preterm Neonates (n = 10) | Term Neonates (n = 42) | p Value | Effect Size |
|---|---|---|---|---|
| Sex, n (%) | 1.000 | OR = 1.13 (95% CI 0.28 to 4.59) | ||
| Male | 6 (60.0) | 24 (57.1) | ||
| Female | 4 (40.0) | 18 (42.9) | ||
| Gestational age (weeks), median (IQR) | 32.8 (31.5 to 35.4) | 39.5 (38.1 to 40.4) | — | — |
| Birth weight (g), median (IQR) | 2070 (1885 to 2582.5) | 3205 (2900 to 3635) | <0.001 | rrb = −0.779 |
| Birth length (cm), median (IQR) | 48.0 (48.0 to 51.0) | 54.0 (52.0 to 55.0) | 0.003 | rrb = −0.646 |
| Head circumference (cm), median (IQR) | 31.0 (29.0 to 32.0) | 33.8 (33.0 to 34.0) | <0.001 | rrb = −0.794 |
| Apgar score at 1 min, median (IQR) | 7.0 (6.0 to 8.0) | 9.0 (8.0 to 10.0) | 0.014 | rrb = −0.515 |
| Apgar score at 5 min, median (IQR) | 9.0 (7.8 to 9.0) | 10.0 (9.0 to 10.0) | 0.016 | rrb = −0.500 |
| Need for postnatal stabilization, n (%) | 9 (90.0) | 38 (90.5) | 1.000 | OR = 0.95 (95% CI 0.09 to 9.53) |
| Neonatal intensive care unit (NICU) admission, n (%) | 6 (60.0) | 10 (23.8) | 0.052 | OR = 4.63 (95% CI 0.90 to 27.23) |
| Length of hospital stay (days), median (IQR) | 11.0 (6.2 to 19.0) | 7.5 (6.0 to 11.0) | 0.401 | rrb = 0.174 |
| Discharge outcome, n (%) | 0.192 | OR = 9.33 (95% CI 0.29 to 300.02) | ||
| Favorable outcome | 9 (90.0) | 42 (100.0) | ||
| Death | 1 (10.0) | 0 (0.0) |
Note. Data are presented as median (interquartile range, IQR) for continuous variables and as number (percentage) for categorical variables. Continuous variables were compared using the two-sided Mann–Whitney U test, whereas categorical variables were compared using Fisher’s exact test. Effect sizes for continuous variables are reported as rank-biserial correlations (rrb), calculated using preterm neonates as the reference group. Positive rrb values indicate higher ranks among preterm neonates, whereas negative rrb values indicate higher ranks among term neonates. Effect magnitude should be interpreted using the absolute value of rrb. Values of approximately 0.10, 0.30, and ≥0.50 indicate small, moderate, and large effects, respectively. Effect sizes for categorical variables are expressed as odds ratios (ORs) with 95% confidence intervals (95% CIs). An OR > 1 indicates higher odds among preterm neonates, whereas an OR < 1 indicates lower odds compared with term neonates. Gestational age is presented descriptively and was not subjected to inferential between-group testing because gestational age was used to define the preterm and term groups.
Table 8.
Antimicrobial therapy administered to preterm and term neonates.
| Antimicrobial Agents | Total (n = 52) | Preterm Neonates (n = 10) | Term Neonates (n = 42) | p Value | Effect Size |
|---|---|---|---|---|---|
| Penicillins | |||||
| Ampicillin/sulbactam | 35 (67.3) | 6 (60.0) | 29 (69.0) | 0.711 | OR = 0.67 (95% CI 0.16 to 2.75) |
| Penicillin G | 2 (3.8) | 0 (0.0) | 2 (4.8) | 1.000 | OR = 0.78 (95% CI 0.03 to 19.22) |
| Amoxicillin/clavulanate | 5 (9.6) | 0 (0.0) | 5 (11.9) | 0.569 | OR = 0.34 (95% CI 0.02 to 6.54) |
| Aminoglycosides | |||||
| Amikacin | 43 (82.7) | 8 (80.0) | 35 (83.3) | 1.000 | OR = 0.80 (95% CI 0.14 to 4.66) |
| Gentamicin | 2 (3.8) | 0 (0.0) | 2 (4.8) | 1.000 | OR = 0.78 (95% CI 0.03 to 19.22) |
| Netilmicin | 1 (1.9) | 0 (0.0) | 1 (2.4) | 1.000 | OR = 1.33 (95% CI 0.05 to 35.01) |
| Cephalosporins | |||||
| Cefuroxime | 5 (9.6) | 1 (10.0) | 4 (9.5) | 1.000 | OR = 1.06 (95% CI 0.10 to 11.17) |
| Ceftriaxone | 1 (1.9) | 0 (0.0) | 1 (2.4) | 1.000 | OR = 1.33 (95% CI 0.05 to 35.01) |
| Ceftazidime | 1 (1.9) | 0 (0.0) | 1 (2.4) | 1.000 | OR = 1.33 (95% CI 0.05 to 35.01) |
| Carbapenems | |||||
| Meropenem | 4 (7.7) | 3 (30.0) | 1 (2.4) | 0.019 | OR = 16.08 (95% CI 1.12 to 943.65) |
| Antifungal agent | |||||
| Fluconazole | 5 (9.6) | 1 (10.0) | 4 (9.5) | 1.000 | OR = 1.06 (95% CI 0.10 to 11.17) |
| Treatment characteristics | |||||
| Number of antimicrobial agents per patient, median (IQR) | 2 (2 to 2) | 2 (2 to 2) | 2 (2 to 2) | 1.000 | rrb = 0.000 |
| Antimicrobial treatment duration (days), median (IQR) | 5 (4 to 7) | 7.5 (5.0 to 10.8) | 5.0 (4.0 to 7.0) | 0.041 | rrb = 0.430 |
Note. Data are presented as number (percentage) or median (interquartile range, IQR), as appropriate. Comparisons between preterm and term neonates were performed using Fisher’s exact test for categorical variables and the Mann–Whitney U test for continuous variables. Effect sizes for categorical variables are expressed as odds ratios (ORs) with 95% confidence intervals (95% CIs), whereas effect sizes for continuous variables are expressed as the rank-biserial correlation (rrb). Positive rrb values indicate higher values among preterm neonates, whereas negative values indicate higher values among term neonates. An OR > 1 indicates higher odds among preterm neonates, whereas an OR < 1 indicates lower odds compared with term neonates. Values of rrb of approximately 0.10, 0.30, and ≥0.50 indicate small, moderate, and large effect sizes, respectively.
Table 9.
Exploratory comparison of clinical and laboratory characteristics according to NICU admission status.
Table 9.
Exploratory comparison of clinical and laboratory characteristics according to NICU admission status.
| Variable | NICU (n = 16) | Non-NICU (n = 36) | p Value | Effect Size |
|---|---|---|---|---|
| Perinatal characteristics | ||||
| Preterm birth, n (%) | 6 (37.5) | 4 (11.1) | 0.052 | OR = 4.63 (95% CI 0.90 to 27.23) |
| Gestational age (weeks), median (IQR) | 37.5 (35.0 to 40.0) | 39.3 (37.9 to 40.0) | 0.118 | rrb = −0.320 |
| Birth weight (g), median (IQR) | 2620 (2125 to 3125) | 3195 (2938 to 3663) | 0.005 | rrb = −0.560 |
| Apgar score at 1 min, median (IQR) | 7 (5.5 to 9.0) | 9 (8.0 to 10.0) | <0.001 | rrb = −0.710 |
| Apgar score at 5 min, median (IQR) | 8 (7.0 to 9.0) | 10 (9.0 to 10.0) | <0.001 | rrb = −0.690 |
| Maternal infection, n (%) | 11 (68.8) | 19 (52.8) | 0.368 | OR = 1.97 (95% CI 0.56 to 6.97) |
| Prolonged rupture of membranes (>18 h), n (%) | 4 (25.0) | 15 (41.7) | 0.353 | OR = 0.47 (95% CI 0.13 to 1.74) |
| Inflammatory and hematological markers | ||||
| C-reactive protein (mg/L), median (IQR) | 15.95 (1.53 to 41.93) | 5.20 (2.12 to 10.45) | 0.190 | rrb = 0.270 |
| White blood cell count (×109/L), median (IQR) | 10.24 (7.84 to 12.70) | 13.97 (10.65 to 17.12) | 0.009 | rrb = −0.520 |
| Platelet count (×109/L), median (IQR) | 213 (171.5 to 261.0) | 293 (253.8 to 322.3) | 0.009 | rrb = −0.520 |
| Neutrophil-to-lymphocyte ratio (NLR), median (IQR) | 1.86 (1.06 to 3.45) | 1.66 (1.18 to 2.94) | 0.725 | rrb = 0.070 |
| Platelet-to-lymphocyte ratio (PLR), median (IQR) | 65.84 (45.18 to 106.63) | 62.23 (48.22 to 79.16) | 0.888 | rrb = 0.030 |
| Monocyte-to-lymphocyte ratio (MLR), median (IQR) | 0.27 (0.16 to 0.45) | 0.29 (0.20 to 0.43) | 0.705 | rrb = −0.080 |
| Treatment and outcomes | ||||
| Duration of antimicrobial therapy (days), median (IQR) | 9.0 (6.5 to 10.3) | 5.0 (3.0 to 5.0) | <0.001 | rrb = 0.780 |
| Length of hospital stay (days), median (IQR) | 16.5 (12.0 to 28.0) | 7.0 (6.0 to 8.0) | <0.001 | rrb = 0.860 |
Note. Data are presented as number (percentage) for categorical variables and median (interquartile range, IQR) for continuous variables. Comparisons between neonates admitted to the neonatal intensive care unit (NICU) and those managed outside the NICU were performed using Fisher’s exact test for categorical variables and the Mann–Whitney U test for continuous variables. Effect sizes for categorical variables are expressed as odds ratios (ORs) with 95% confidence intervals (95% CIs), whereas effect sizes for continuous variables are expressed as rank-biserial correlations (rrb). Positive rrb values indicate higher ranks among neonates admitted to the NICU, whereas negative values indicate higher ranks among non-NICU neonates. The magnitude of the effect should be interpreted using the absolute value of the rank-biserial correlation. Values of approximately 0.10, 0.30, and ≥0.50 indicate small, moderate, and large effect sizes, respectively. An OR > 1 indicates higher odds of NICU admission, whereas an OR < 1 indicates lower odds of NICU admission.
Disclaimer/Publisher’s Note: The statements, opinions and data contained in all publications are solely those of the individual author(s) and contributor(s) and not of MDPI and/or the editor(s). MDPI and/or the editor(s) disclaim responsibility for any injury to people or property resulting from any ideas, methods, instructions or products referred to in the content. |
© 2026 by the authors. Licensee MDPI, Basel, Switzerland. This article is an open access article distributed under the terms and conditions of the Creative Commons Attribution (CC BY) license (http://creativecommons.org/licenses/by/4.0/).
Copyright: This open access article is published under a Creative Commons CC BY 4.0 license, which permit the free download, distribution, and reuse, provided that the author and preprint are cited in any reuse.