Preprint
Article

This version is not peer-reviewed.

Alcaligenes faecalis A12C Modulates Hepatic and Renal Injury Response Associated with Sepsis: Experimental Study In Vivo

Submitted:

10 October 2026

Posted:

13 October 2026

You are already at the latest version

Abstract

Sepsis is characterized by a dysregulated host response to infection; this can lead to multiorgan dysfunction where liver and kidneys play a key role. This study evaluated whether long-term oral administration of A12C modulates hepatic and renal homeostasis under basal conditions and during polymicrobial sepsis. Forty-five male Sprague–Dawley rats were allocated to healthy control (SAN), healthy A12C-treated (STO), septic control (IC), or septic A12C-treated (IA) groups. A12C was administered in drinking water at 6×10⁸ CFU/mL for 30 days, and sepsis was induced by caecal ligation and puncture (CLP). Gene expression, protein abundance, antioxidant enzyme activities, and histopathological alterations were evaluated in liver and kidney. Under basal conditions, A12C reduced hepatic Tlr4 and Tgfb1 expression and TLR4, ICAM-1, and SOD2 protein abundance, whereas renal Tnf and Icam1 expression and SOD and GRd activities increased. During sepsis, A12C-treated rats showed lower hepatic expression of Tnf, Il6, Ccl2, Icam1, and Nos2, together with increased SOD1 protein abundance. In kidney, A12C reduced Tlr4, Il6 and Icam1 expression and increase CAT, GPx, and GRd activities. Reduced expression of several inflammatory and endothelial mediators was detected in both organs and a marked enhancement of renal antioxidant defences during sepsis. The present results support the potential of A12C to improve the host response to sepsis and limit sepsis-associated organ dysfunction, possibly through a preconditioning-like mechanism.

Keywords: 
;  ;  ;  ;  ;  ;  

1. Introduction

Sepsis is a life-threatening syndrome of organ dysfunction caused by a dysregulated host-response to an infection [1]. The World Health Organization recognize sepsis as a threat for global health, and this is a major challenge for healthcare systems worldwide [2]. Sepsis remains a leading cause of death in critically ill patients. Mortality as high as 46.4%, results in an estimated annual healthcare cost of approximately 15.3 billion euros per country. However, substantial economic burden varies markedly among countries [3,4].
Although any organ system can be affected in sepsis, for practical reasons, six organ systems are often clinically evaluated and have been the most widely studied: cardiovascular, respiratory, renal, neurological, haematological and hepatic systems [5]. The liver and kidneys are particularly relevant target organs in sepsis because of their central roles in immune–metabolic homeostasis, detoxification, and clearance of circulating pathogens and inflammatory mediators [6,7]. Both organs are highly susceptible to inflammation, oxidative stress, endothelial and microcirculatory dysfunction in sepsis, contributing to hepatic and kidney injury and ultimately multiorgan failure [8]. During sepsis, not only infection itself, but also hyper-activity of the inflammatory response, microcirculatory failure, and therapy adverse effects are responsible for liver and kidney injury [9,10]. Gut microbiota plays an important role in sepsis, dysbiosis can impair intestinal barrier integrity promoting bacterial translocation and exacerbate systemic inflammation. Conversely, restoration of microbial balance has been associated with reduced inflammation and improved outcomes in experimental sepsis [11,12]. Prevention and management of organ dysfunction in sepsis encompass three therapeutic approaches, the elimination of the underlying infection, haemodynamic stabilization to ensure adequate microcirculatory perfusion and targeting of immunomodulatory therapies at some of the many pathways involved in cellular dysfunction and the sepsis response, that is the subject of ongoing research [5].
Consequently, a large number of studies focus on the various mechanisms that underpin sepsis at the pathological and immunological levels and on possible interventions targeting them.
A. faecalis subsp. faecalis (A12C) is a bacterial strain with probiotic properties that has shown favourable safety profile and the ability to interact with the host without causing adverse effects [13]. Previous studies from our group have demonstrated its capacity to colonize the gastrointestinal tract and modulate the host response to infection, thus providing increased resistance and improved survival in experimental models of sepsis. Although the mechanisms underlying these protective effects remain unclear, the curdlan-like β-glucan produced by A12C has been proposed as one of the bacterial components potentially involved in its immunomodulatory activity [14].
Objectives:
This study aimed to determine whether 30-day oral A. faecalis subsp. faecalis A12C administration modulates basal hepatic and renal homeostasis and modifies the inflammatory and antioxidant responses to CLP-induced polymicrobial sepsis.

2. Materials and Methods

2.1. Primary Reagents:

Tween® 20 GEN for Biochemistry (TWEN-20B-100; Labkem, Spain); SDS Solution 20% for molecular biology (A0675,1000; PanReac AppliChem, Spain); Tris (USP, BP, Ph. Eur.) pure, pharma grade (141940.1211; PanReac AppliChem, Spain); Glycerol USP, BP, Ph. Eur.) pure, pharma grade (141339.1211; PanReac AppliChem, Spain); Bromophenol blue IND ACS (BRPH-B0D; Labkem, Spain); Propan-2-ol ≥99.5%, HPLC grade (P/7507/17; Fisher Chemical, UK); Methanol, Optima™ LC/MS Grade (A456-212; Fisher Chemical, UK); 2-Mercaptoethanol (M3148-100ML; Sigma-Aldrich, Germany); EDTA (131026.1210; PanReac AppliChem, Spain); Skim milk powder (70166; Sigma-Aldrich, St. Louis, MO, USA); Potassium phosphate dibasic (P3786-100G; Sigma-Aldrich, Germany); Potassium phosphate monobasic (P0662-500G; Sigma-Aldrich, Germany); di-Sodium hydrogen phosphate anhydrous (131679.1211; PanReac AppliChem, Spain); Sodium di-hydrogen phosphate 1-hydrate (131965.1211; PanReac AppliChem, Spain); Guaiacol (G5502; Sigma-Aldrich, St. Louis, MO, USA); Bovine serum albumin Fraction V (BSA Fraction V; PanReac AppliChem, Barcelona, Spain); Xanthine (X7375-10G; Sigma-Aldrich, Germany); Sodium azide, ReagentPlus®, ≥99.5% (S2002-25G; Sigma-Aldrich, Germany); Xanthine oxidase from bovine milk, ≥0.4 units/mg protein (X1875; Sigma-Aldrich, Germany); Reduced glutathione (GSH; G4251-5G; Sigma-Aldrich, Germany); Oxidized glutathione (GSSG; G4376; Sigma-Aldrich, Germany); Glutathione reductase from baker’s yeast (S. cerevisiae), ammonium sulfate suspension, 100–300 units/mg protein (biuret) (G3664; Sigma-Aldrich, Germany); β-Nicotinamide adenine dinucleotide 2′-phosphate reduced tetrasodium salt hydrate, ≥97% (HPLC) (N7505; Sigma-Aldrich, Germany); Cytochrome c from equine heart, ≥95% (SDS-PAGE) (C2506-50MG; Sigma-Aldrich, Germany); Hydrogen peroxide solution, 30% (w/w) in H₂O, contains stabilizer (H1009; Sigma-Aldrich, St. Louis, MO, USA).

2.2. Animals

In accordance with the European Commission guidelines (Directive 2010/63/EU) and Spanish legislation (RD 53/2013) on the protection of animals used in scientific research, this study was approved by the Local Animal Ethics Committee at the Hospital Universitario Dr. Negrín (HUGCDN) in Las Palmas de Gran Canaria, Spain with code CEEBA-HUGCDN 001/2025.
A total number of 45 twelve-week-old male Sprague-Dawley ® rats were included in the study. Animals were maintained under semi-barrier conditions at the HUGCDN animal facility and housed in pairs following a 21-day acclimatization period. Environmental enrichment consisted of red PVC tubes, nesting material, and tissue paper. Rats were fed a standard maintenance diet (Teklad® Global 14% Protein Rodent Maintenance Diet, Harlan, Barcelona, Spain) and had ad libitum access to drinking water (Fonteide®, Santa Cruz de Tenerife, Spain). Cages changes were carried out twice a week. Animal rooms were maintained under a 12:12-h light/dark cycle at a temperature of 21 ± 1 °C and a 55 ± 5%, relative humidity, with 15 air exchanges per hour.
Only male rats were included in the study to minimize variability associated with sex-dependent hormonal fluctuations, particularly those related to the oestrous cycle, which may influence inflammatory, immune, and metabolic responses during sepsis. This approach was intended to reduce biological variability and facilitate the interpretation of treatment-related effects.

2.3. Experimental Design

The study was conducted in two experimental stages at different times. In the first stage, 18 Sprague-Dawley rats were manually randomized into two healthy groups: control group (SAN; n = 9), with no bacterial administration and healthy treated group (STO; n = 9) with A12C administration for 30 days in drinking water. The samples were collected during euthanasia on the day 30. In the second stage, 27 Sprague-Dawley rats were randomly divided in two groups: septic group (IC; n = 13), without bacterial administration and septic treated group (IA; n = 14) with A12C administration in drinking water. CLP surgery was performed on day 30 after the experiment beginning and samples were collected at euthanasia 20-h after CLP.
Predefined exclusion criteria included, complications related to anaesthesia or surgical procedures, technical failure during caecal ligation and puncture (CLP), the presence of pre-existing clinical abnormalities before the experimental procedure, insufficient or compromised biological samples, and technical failure preventing reliable biochemical, molecular, or histological analyses. No animals met these exclusion criteria during the study.

2.4. Preparation and Administration of A12C.

The bacteria corresponding to strain number 31431 deposited in the Spanish Type Culture Collection (CECT), (Universitat de València, Valencia, Spain) Alcaligenes faecalis subsp. faecalis A12C was used. Fresh bacterial suspension was administered in the drinking water at a dose of 6 x 10⁸ CFU/mL. Water was changed every two days throughout the experiment, following the instructions previously described by our group [13,14,15]. A patent application related to the A12C strain and its potential applications has been filed with the application number P202631159 in the Spanish Patent and Trademark Office (OEPM; Oficina Española de Patentes y Marcas).

2.5. Sepsis Model

For the sepsis induction a moderate-severity CLP protocol was used [16]. Before CLP protocol anaesthetics were administered, medetomidine hydrochloride (Domtor® 1 mg/mL solution for injection; Ecuphar Veterinaria S.L.U., Barcelona, Spain) / fentanyl (Fentanest® 0.05 mg/mL injectable solution; Kern Pharma, S.L., Terrassa, Barcelona, Spain) at a dose of 0.3/0.3 mg/kg subcutaneously. The surgical plane of anaesthesia was confirmed in all animals before the procedure. To prevent temperature loss, a heating blanket preheated to 37°C was used in the operating theatre. Briefly, after a laparotomy, the cecum was ligated at its midpoint without blocking the ileocecal valve, ligated portion was then perforated twice and faeces were extruded, the cecum was repositioned in the abdomen, and laparotomy incision was closed using a 4-0 absorbable monofilament suture (Monosyn® B. Braun, Melsungen, Germany). Animals received subcutaneously 5 mL of prewarmed (37ºC) saline solution per 100 g of body weight, for fluid resuscitation. Postoperative analgesia was evaluated in accordance with Acred et al. [17], described in Table 1 and treated subcutaneously with buprenorphine (Buprex® 0.3 mg/mL injectable solution; EUMEDICA Pharmaceuticals GmbH, Lörrach, Germany) 0.05 mg/kg, if necessary, over the next 20h.

2.6. Sample Collection

At the euthanasia on day 30 in the healthy groups (SAN and STO) or 20 h after CLP in the septic groups (IC and IA), the left lateral liver lobe and the left kidney were collected. Immediately after excision, tissues were gently rinsed with sterile 0.9% sodium chloride solution (Sodium Chloride 0.9% B. Braun, B. Braun Melsungen AG, Melsungen, Germany) to remove residual blood, placed in appropriately labelled sterile 2.0-mL cryovials (Cryovial®, T311-3, Simport Scientific Inc., Canada) and snap-frozen in liquid nitrogen. Samples were subsequently stored at −80 °C until further processing and biochemical and molecular analyses. For histological analyses tissue samples from animals were immediately fixed in 4% formalin after extraction for 24 h.

2.7. Histological Evaluation:

Tissues fixed in 4% formalin were embedded in paraffin and sectioned at 4 µm for histological study. Slides were stained with haematoxylin and eosin for liver evaluation and periodic acid–Schiff staining (PAS) for kidney, examined by light microscopy. Slides were evaluated by two pathologists blinded to experimental groups. The presence or absence of bacteria within the vessels was assessed. Additionally, evaluations were conducted for parenchymal disarray, interstitial swelling, white blood cells infiltration, tissue damage, and interstitial bleeding. Histological indicators for renal damage included: tubular dilation, tubular atrophy, tubular cast formation, brush border loss, or thickening of the tubular basement membrane [18]. Hepatic sections were examined for spotty necrosis, capsular inflammation, portal inflammation, ballooning degeneration, and steatosis of the liver [19].

2.8. RNA Quantification by RT-qPCR

To assess immune-inflammatory response and oxidative stress associated with sepsis, mRNA expression levels of the following genes were analysed: Gpx1, Nos2 (iNOS), Tgfb1, Rela (NF-κB p65), Nlrp3, Icam1, Tlr4, Ccl2, Il6, Il1b, Tnf and Il10. Stable Gapdh expression across groups was verified before its use as a reference gene. Mean Ct values differed by less than 0.5 cycles, supporting its use as an endogenous control for normalization. Primer sequences are detailed in Table 2. For RNA extraction from liver and kidney, TRIzolTM reagent (InvitrogenTM, Thermo Fisher Scientific, Waltham, MA, USA) was used following manufacturer’s instructions. RNA was reverse transcribed with the SensiFAST cDNA Synthesis kit (Bioline, Meridian Bioscience, London, UK). Finally, cDNA was used for qPCR analysis using the SensiIFASTTM SYBR® No-ROX Kit (Bioline, Meridian Bioscience, London, UK) on a LightCycler® 480 Real-Time PCR System (Roche Diagnostics, Mannheim, Germany). Amplification was performed for 40 cycles. Relative gene expression was calculated using the 2^−ΔΔCt method. Results were expressed as fold change relative to the control group. Values reported as 0 in the qPCR analysis corresponded to samples in which no detectable amplification was observed after 40 amplification cycles.

2.9. Immunoblotting Measurement of Protein Abundance.

Protein isolation was made using TRIzolTM reagent following the user guide instructions. For protein quantification, PierceTM BCA Protein Assay Kit (Thermo Fisher Scientific, Waltham, MA, USA) was used. A total amount of 15 µg of protein was loaded with loading buffer containing β-mercaptoethanol onto 7,5%, 12% or 15% acrylamide gels depending on the protein’s molecular weight. Electrophoresis procedure was made with PowerPacTM Basic Power Supply (Bio-Rad Laboratories, Hercules, CA, USA). Proteins were transferred using semi-dry membranes Trans-Blot® Turbo™ Midi Nitrocellulose Transfer Packs (1704159; Bio-Rad Laboratories, Hercules, CA, USA) with Trans-Blot® TurboTM Transfer System (Bio-Rad Laboratories, Hercules, CA, USA). RevertTM 700 Total Protein Stain kit was used to confirm successful transfer and normalise protein loading (LI-COR Biosciences, Lincoln, NE, USA). Membranes were visualised using Odyssey® Infrared Imaging System, Model 9120 (LI-COR Biosciences, Lincoln, NE, USA) at 700 nm channel following the manufacturer’s instructions. After destaining, membranes were blocked for 1 hour at room temperature with 5% skim milk diluted in TBS. Incubation with primary antibodies (listed in Table 3), was made overnight at 4°C in 1% bovine serum albumin in TBS-T. Finally, membranes were incubated for 1 hour at room temperature with IRDye® 680RD Goat anti-rabbit secondary antibody (926-68071) (LI-COR Biosciences, Lincoln, NE, USA) or IRDye® 800 CW Goat anti-Mouse IgG Secondary Antibody (926-32210) (LI-COR Biosciences, Lincoln, NE, USA), both 1:10000 diluted in TBS-T, protected from light. Membranes were then washed three times with TBS-T prior and rinsed in TBS before to imaging. Finally, Band density was quantified using Odyssey® Infrared Imaging System, Model 9120 processing the images with ImageStudio software version 6.2.0.

2.10. Enzymatic Activity:

Liver and kidney enzymatic activities of catalase (CAT), superoxide dismutase (SOD), Glutathione peroxidase (GPx) and Glutathione reductase (GRd) were quantified at 37 °C using a Shimadzu UV-2011 spectrophotometer (Shimadzu Corporation, Kyoto, Japan). CAT activity (mK/mg protein) was determined by monitoring the rate of hydrogen peroxide (H2O2) decomposition at 240 nm in quartz cuvettes, following Aebi’s spectrophotometric method [20]. SOD activity (pKat/mg protein) was measured by the reduction of cytochrome C by superoxide anion generated by the xanthine oxidase/xanthine system at 550 nm [21]. GPx activity (nmol/s/mg protein) was measured using an adaptation of the spectrophotometric method [22] using H₂O₂ and reduced glutathione (GSH) as substrates, and glutathione reductase (GRd) and reduced nicotinamide adenine dinucleotide phosphate (NADPH) as enzymatic and non-enzymatic indicators, respectively, which was read at 339 nm. GRd activity (nmol/min/mg protein) was measured by a modification of Bergmeyer et al. method [23], which required oxidised glutathione as a substrate and read at 339 nm.

2.11. Statistical Analysis and Artwork.

Results obtained were analysed using Rstudio software version 2026.01.2+418. Comparisons were prespecified within each experimental stage (SAN vs STO and IC vs IA). For two-groups comparisons, prior to performing comparative analyses, Shapiro-wilk and Levene’s test were used for parametric assumptions of data. When data did not meet the assumption of normality or homoscedasticity (p < 0.05), and given the reduced sample size of the study, non-parametric statistical tests were applied. Differences between groups were assessed using the two-sided Mann-Whitney U test. These results were expressed as median and interquartile range (IQR). Graphical representations were generated using RStudio software and subsequently edited for final layout and presentation using Inkscape software version 1.4.3 (0d15f75, 2025-12-25).

3. Results

3.1. Histological Evaluation:

Histological examination identified tissue alterations in both septic groups (IC and IA), whereas these lesions were not observed in both healthy groups (SAN and STO). Septic animals presented renal variable degrees of tubular injury, including tubular atrophy with cast formation, loss of the brush border, and thickening of the tubular basement membrane, however no inflammatory cell infiltration, interstitial oedema, and haemorrhagic changes were observed. Similarly, hepatic sections from septic animals exhibited histopathological alterations characterized by hepatocyte degeneration, inflammatory infiltrates, and subcapsular bacteria presence only in IC group, with no focal necrosis. In contrast, kidney and liver architecture was largely preserved in healthy animals, with no evident signs of these pathological alterations (Figure 1).

3.2. mRNA Liver Expression.

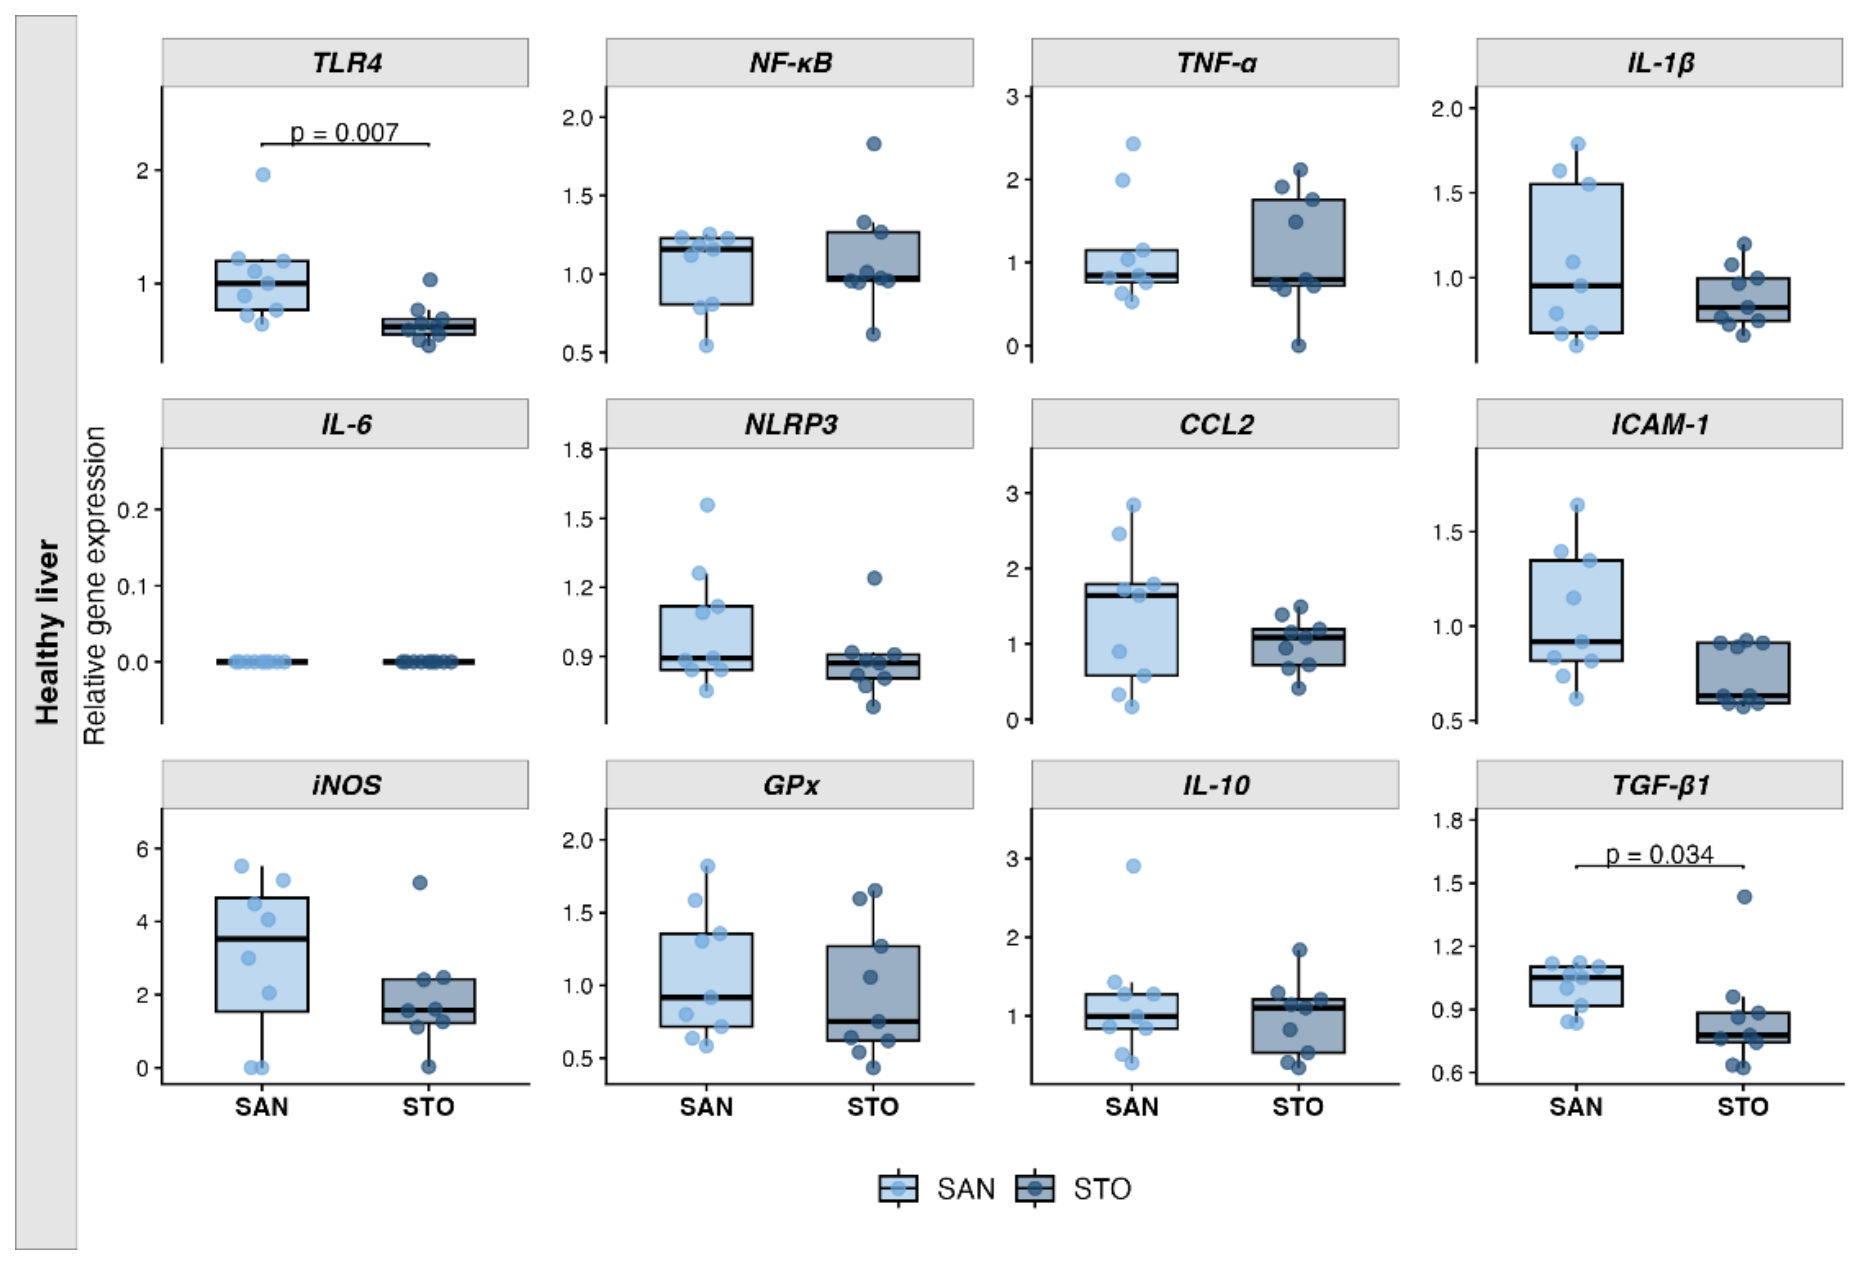
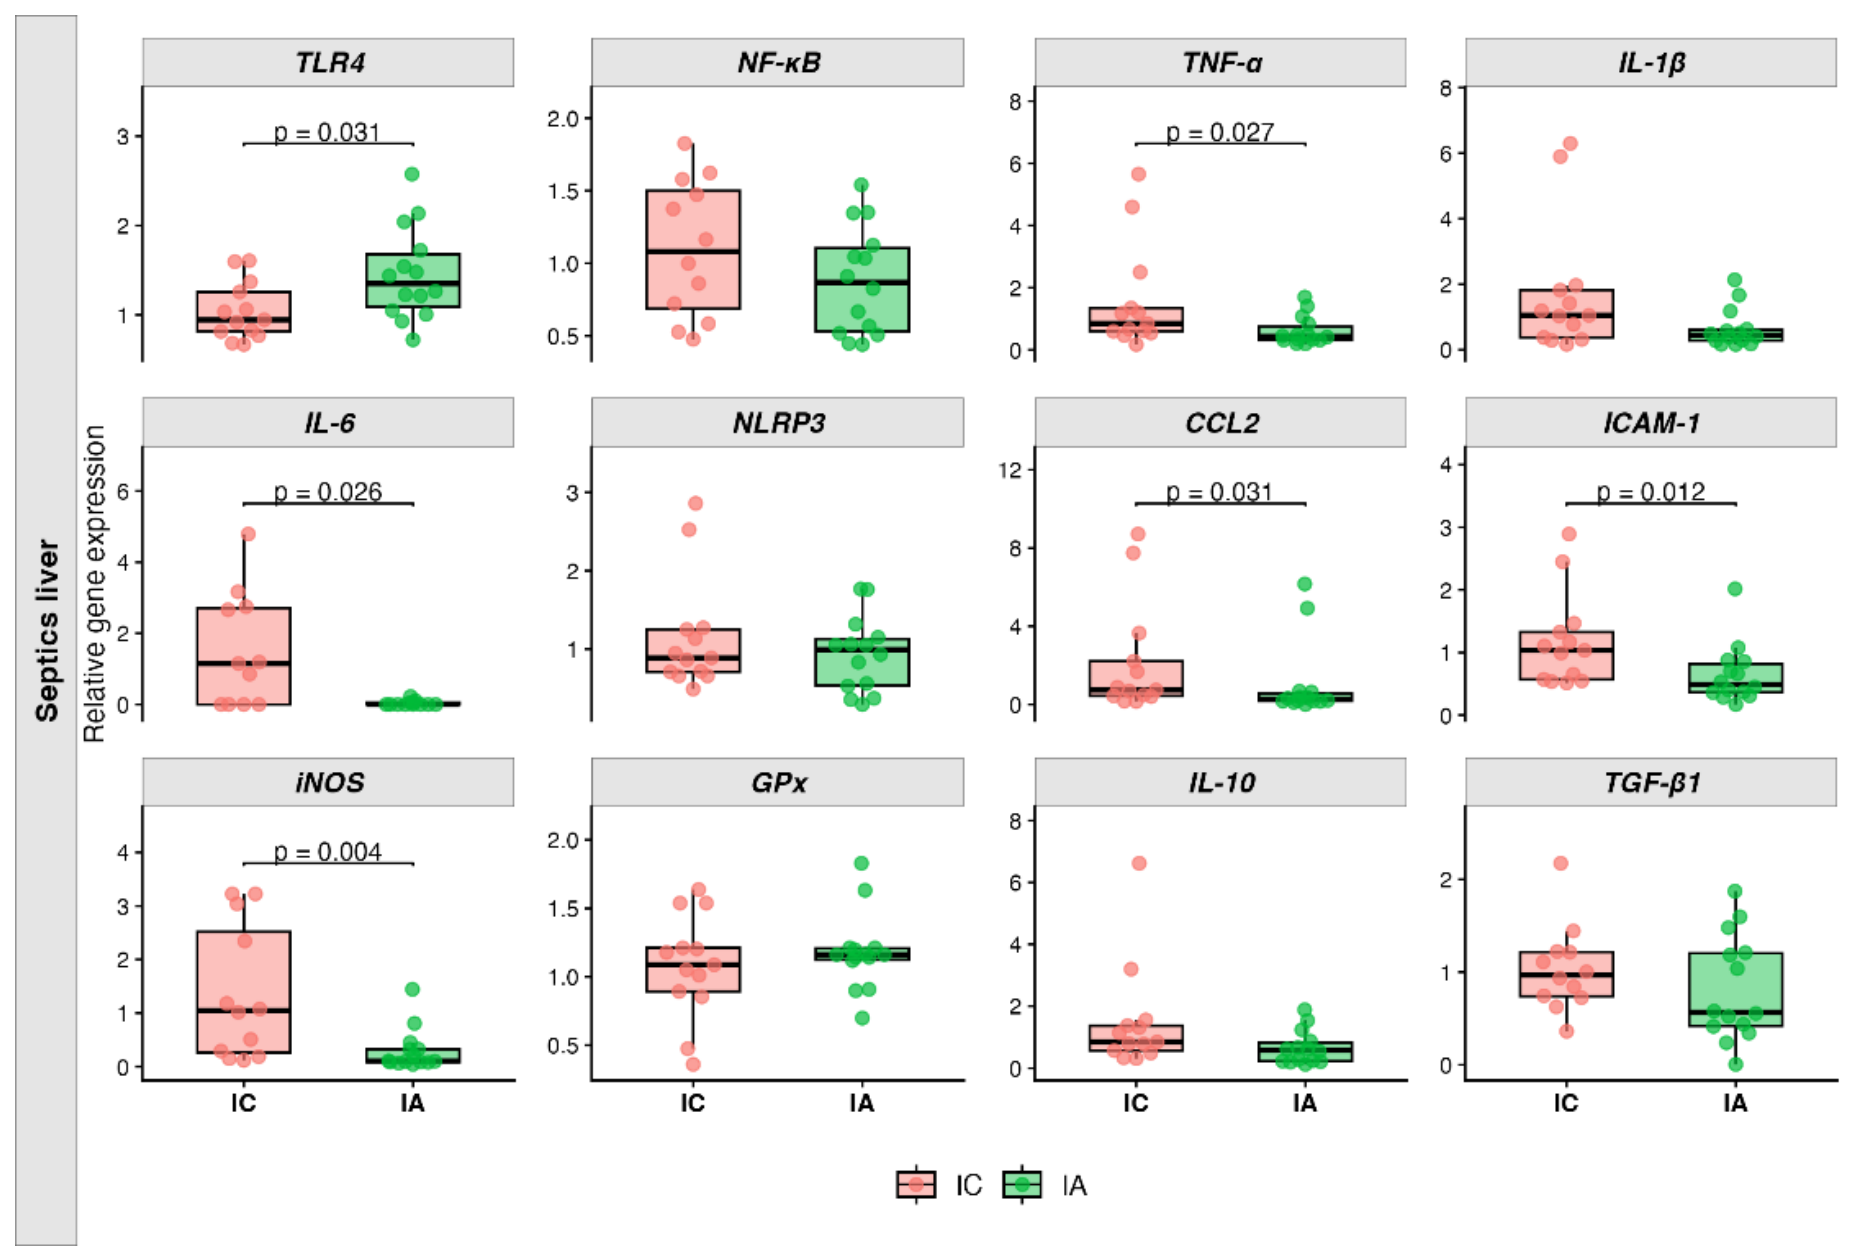
Gene expression results in healthy rats showed a significant decrease in liver expression of Tlr4 (p = 0.007) and Tgfb1 (p = 0.034) genes in A12C-treated rats (STO) compared with control (SAN) (Figure 2). Additionally, the STO group showed a tendency toward reduced Icam1 expression (p = 0.063) (Table A1). On the other hand, the animals that underwent CLP showed a different response to A12C treatment. mRNA relative expression of Tlr4 was higher in septic A12C-treated group (IA) (p = 0.031) however, Icam1 (p = 0.012) and Ccl2 (p = 0.031) were downregulated in IA group compared with septic non-treated group (IC) (Figure 3). With regard to cytokines expression in liver during sepsis, IA group present a significant downregulation of Il6 (p = 0.026) and Tnf (p = 0.027) (Figure 3) and a downward trend in Il10 (p = 0.055) and Il1b (p = 0.094) when compared with IC group (Table A2). For oxidative stress genes there was a significant reduction of Nos2 (p = 0.004) in IA group vs IC group, with no significant change in Gpx gene expression (Figure 3). All the data is summarized in Apendix A, Table A1 and Table A2.

3.3. Liver Protein Expression Analysis

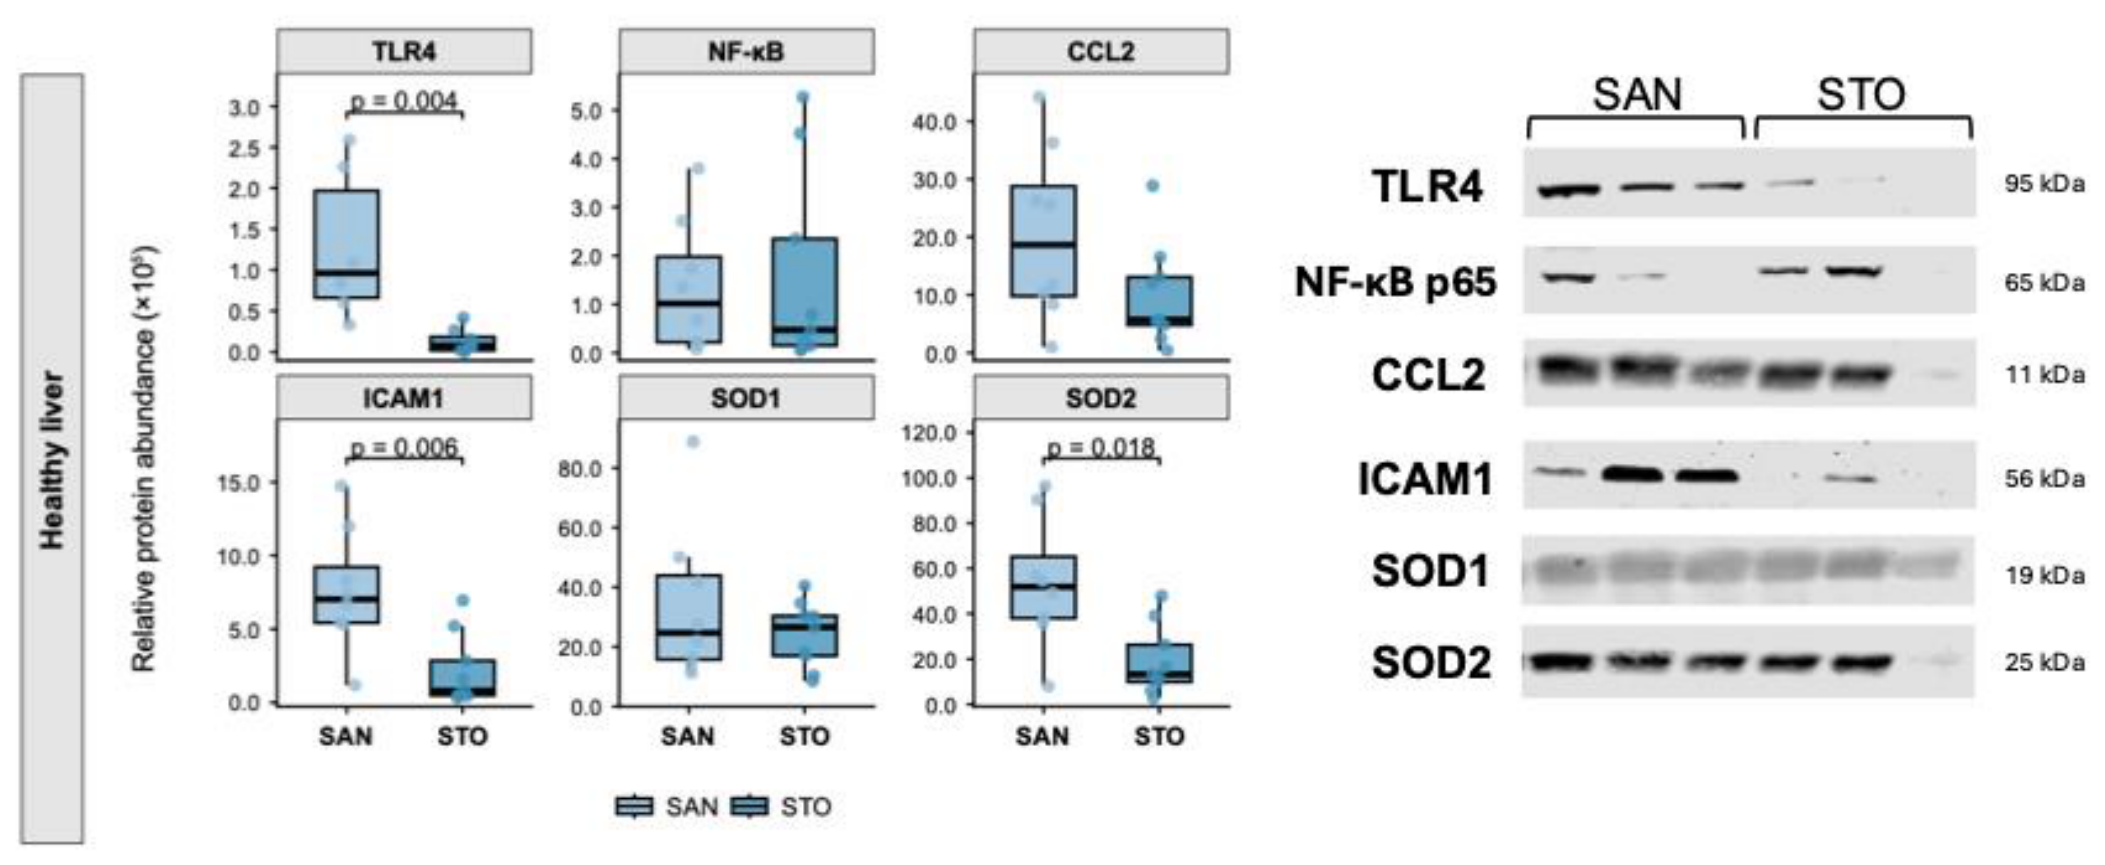
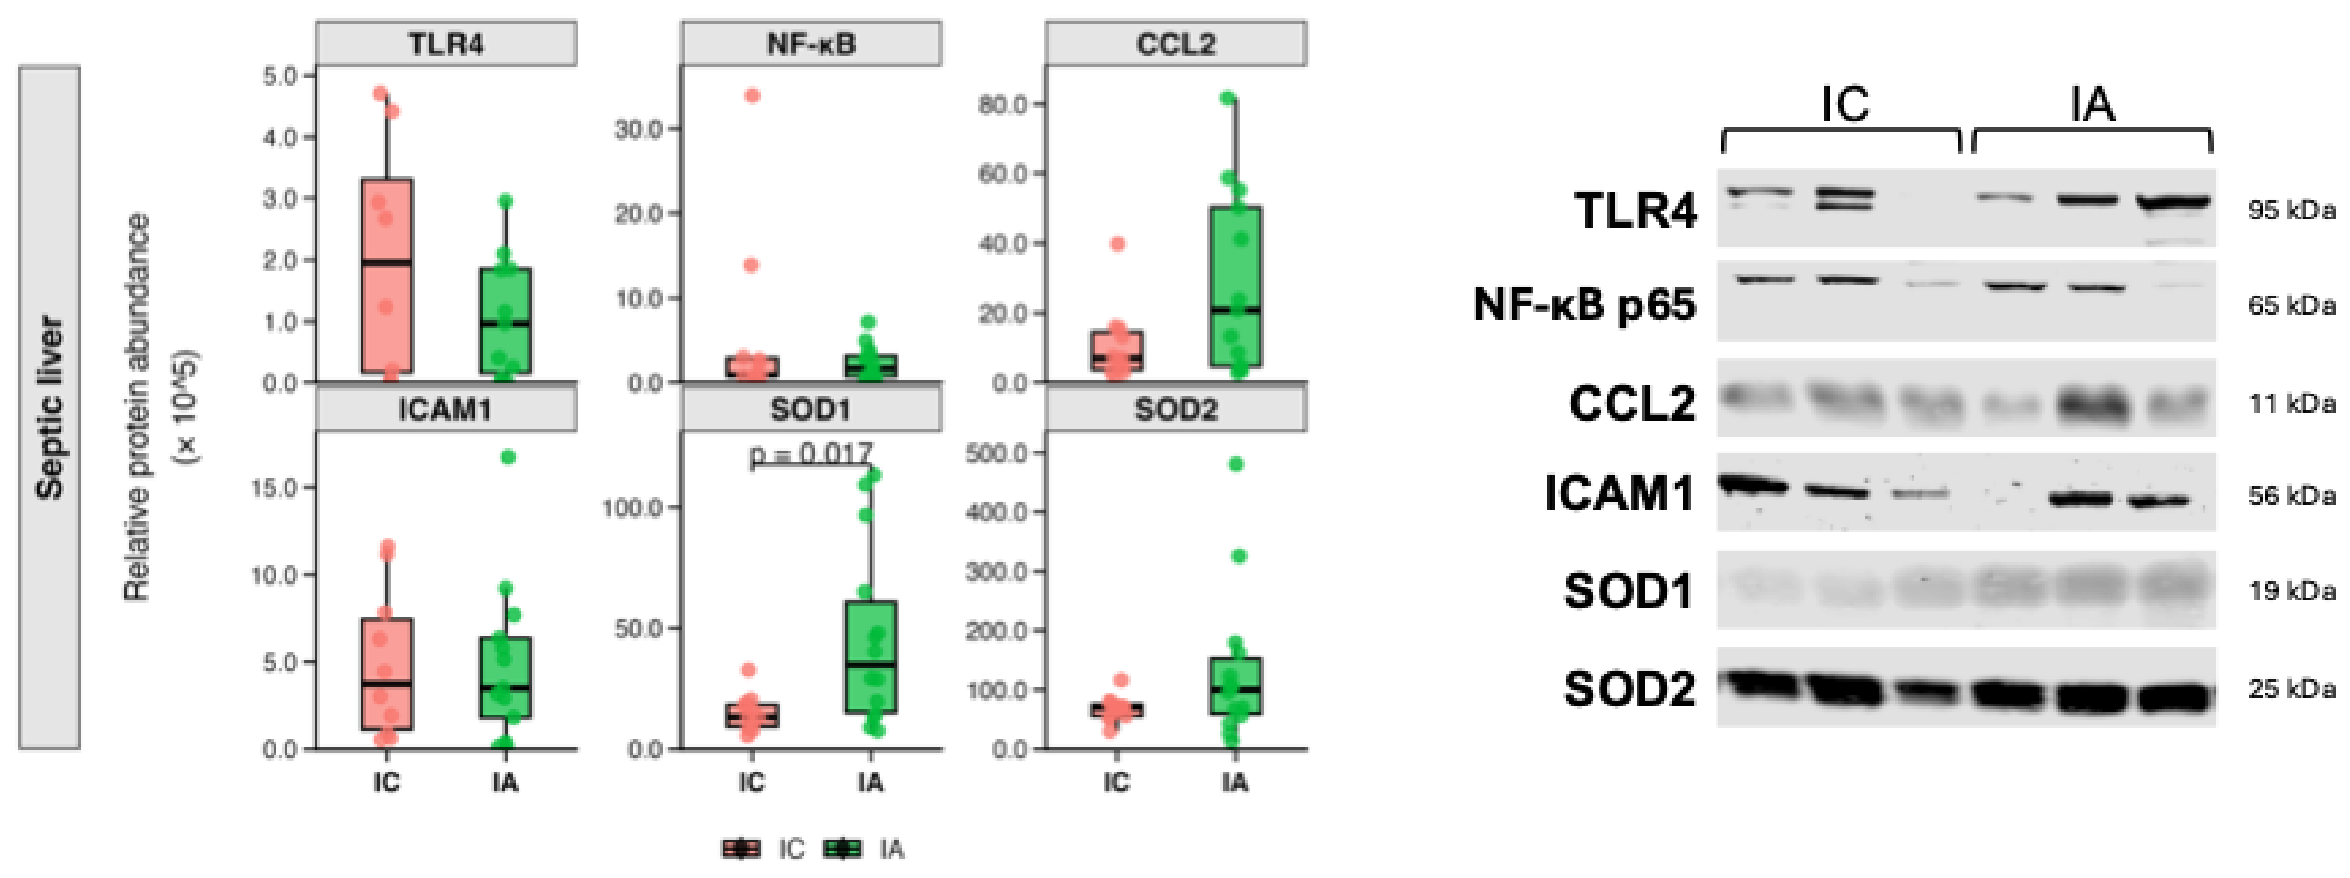
Proteins studied in liver using Western blot technique were TLR4, NF-κB p65, CCL2, ICAM1, SOD1 and SOD2. In the comparison between healthy groups (SAN vs STO), it was observed a significant lower protein expression of TLR4 (p = 0.004), ICAM1 (p = 0.006) and SOD2 (p = 0.018) in A12C-treated group (STO) (Figure 4), no significant differences were found in the other proteins studied (Table A5). By contrast, the expression of these proteins did not follow the same pattern in septic animals (IC vs IA). The main significant difference was observed in a higher expression of SOD1 (p = 0.017) in septic A12C-treated animals (IA) (Figure 5). All the data is summarized in Apendix A, Table A5 and Table A6.

3.4. Liver Enzymatic Activity

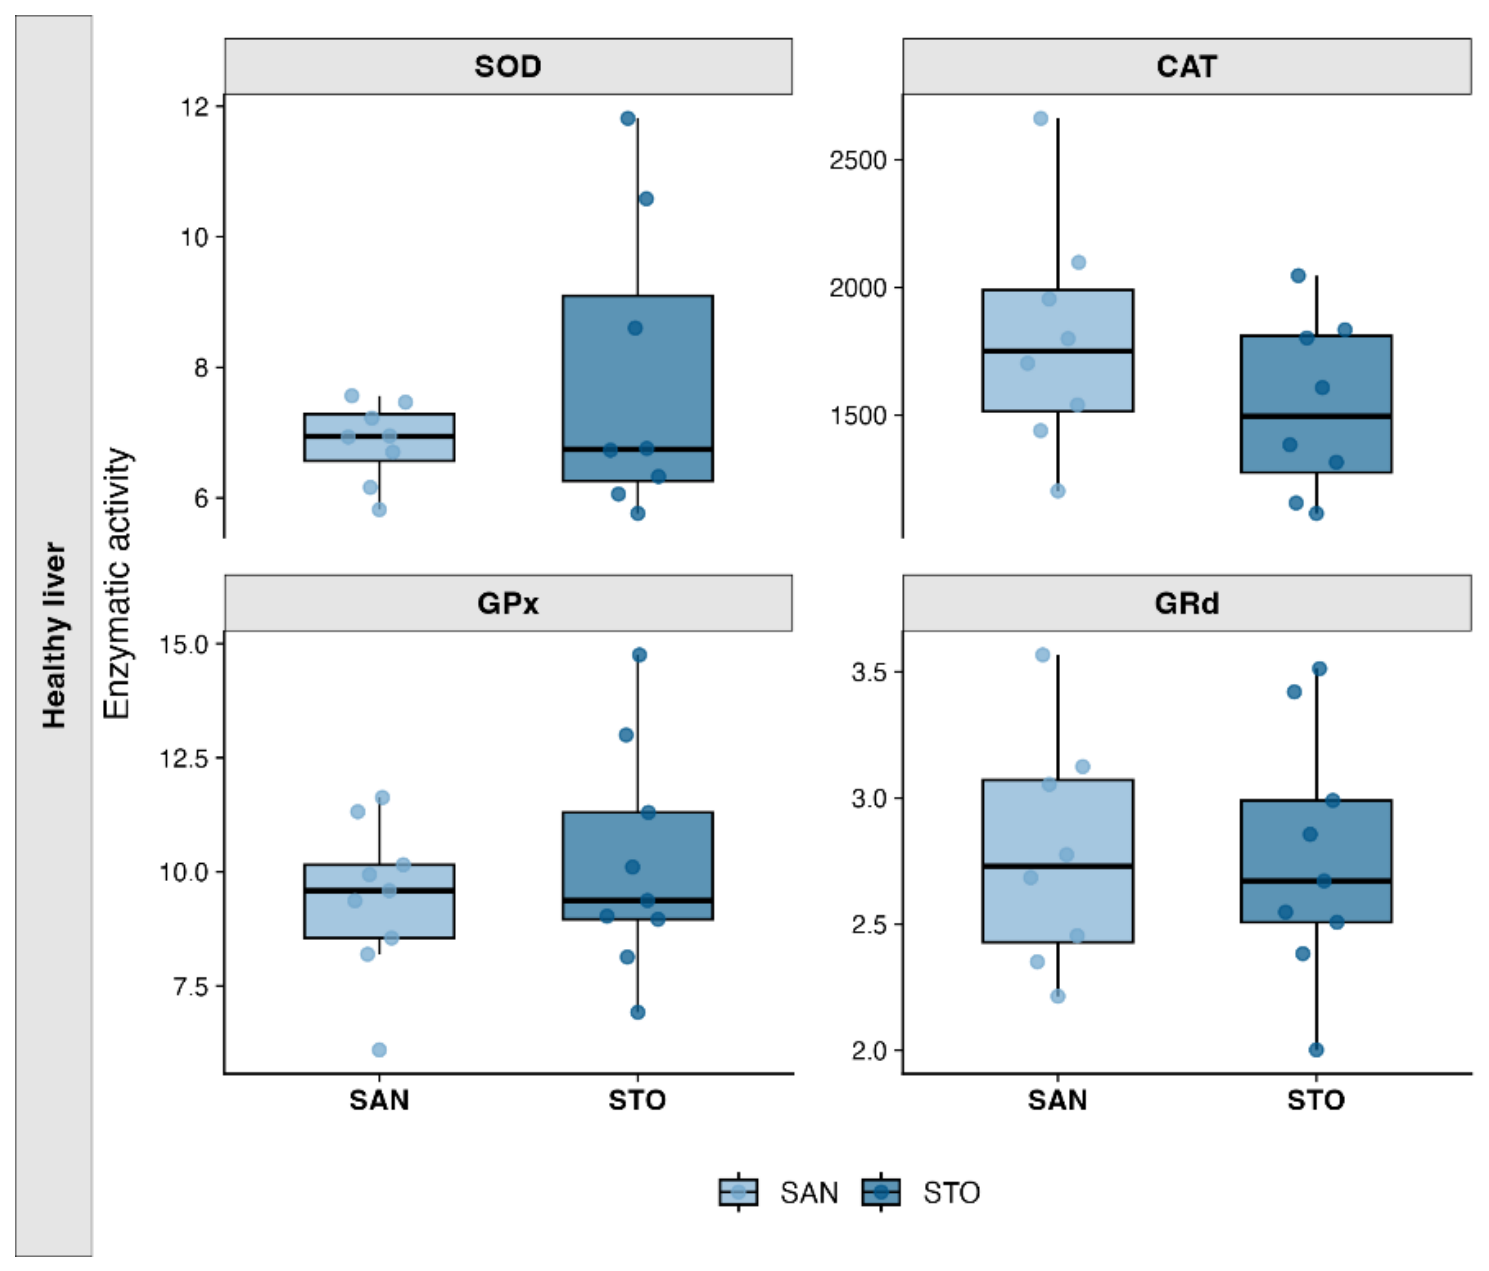
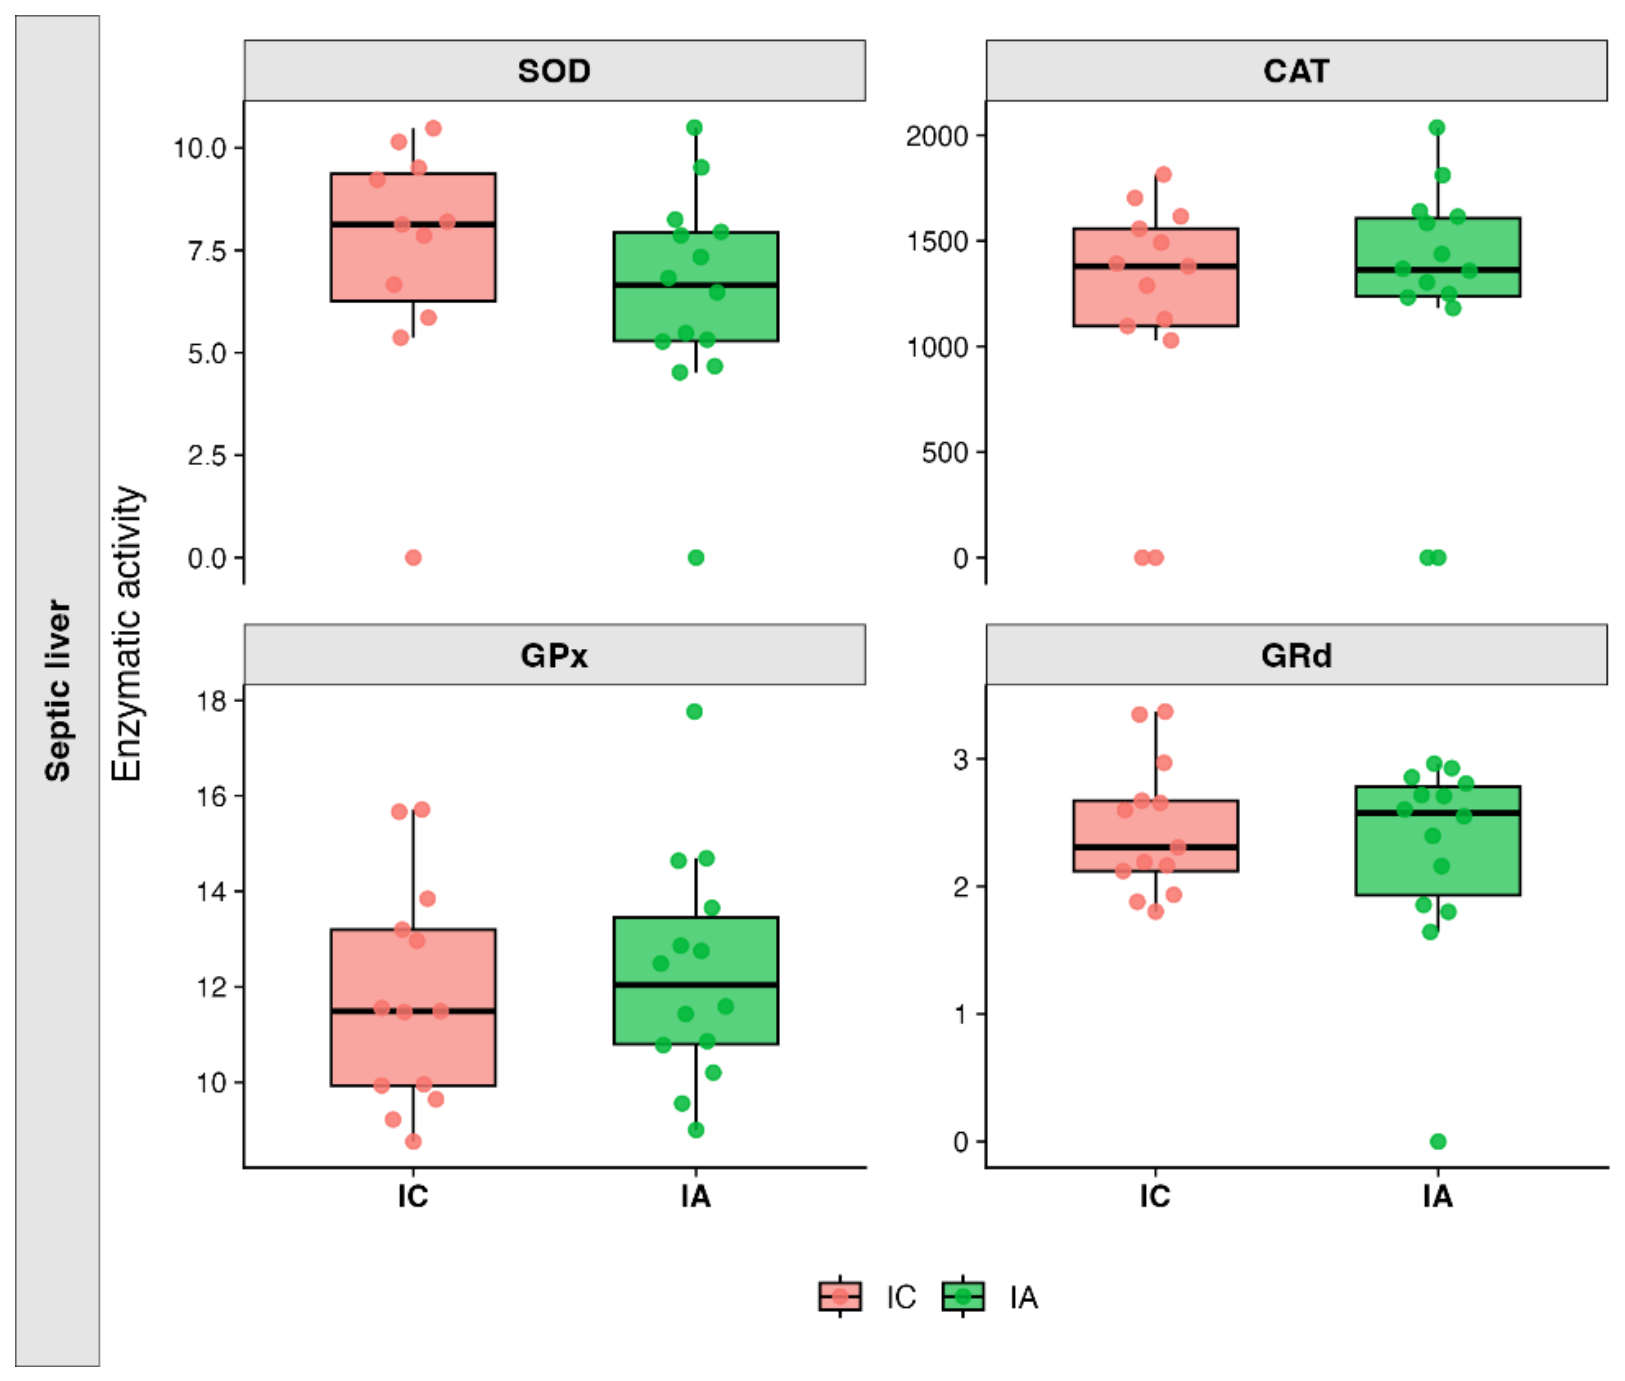
The enzymes studied in liver were SOD, CAT, GPx and GRd. There were no significant changes in liver in either the healthy groups (Figure 6) or the septic groups (Figure 7). All hepatic enzymatic activity data are showed in Apendix A Table A9 and Table A10.

3.5. mRNA Kidney Expression.

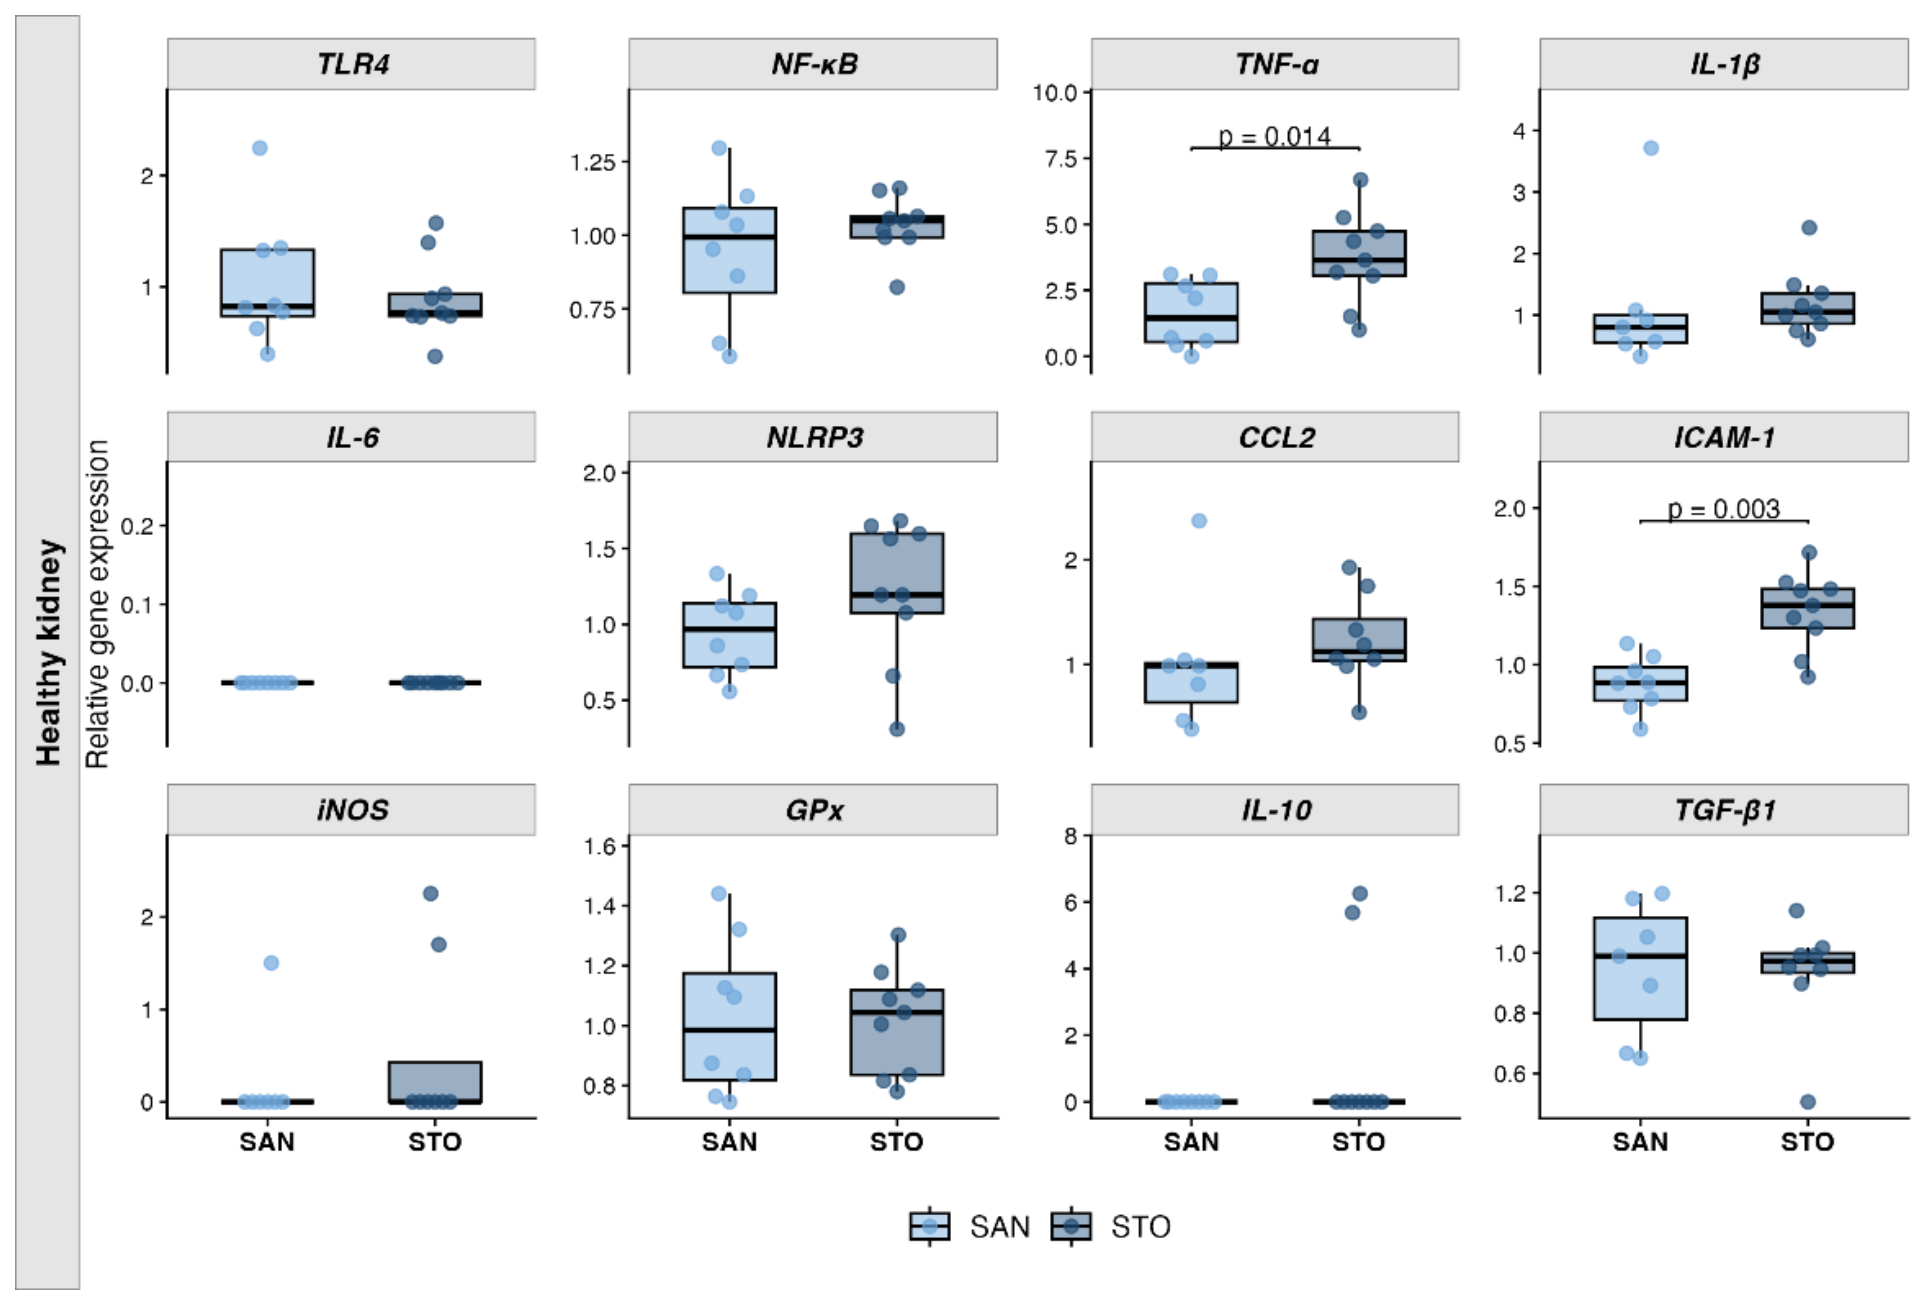
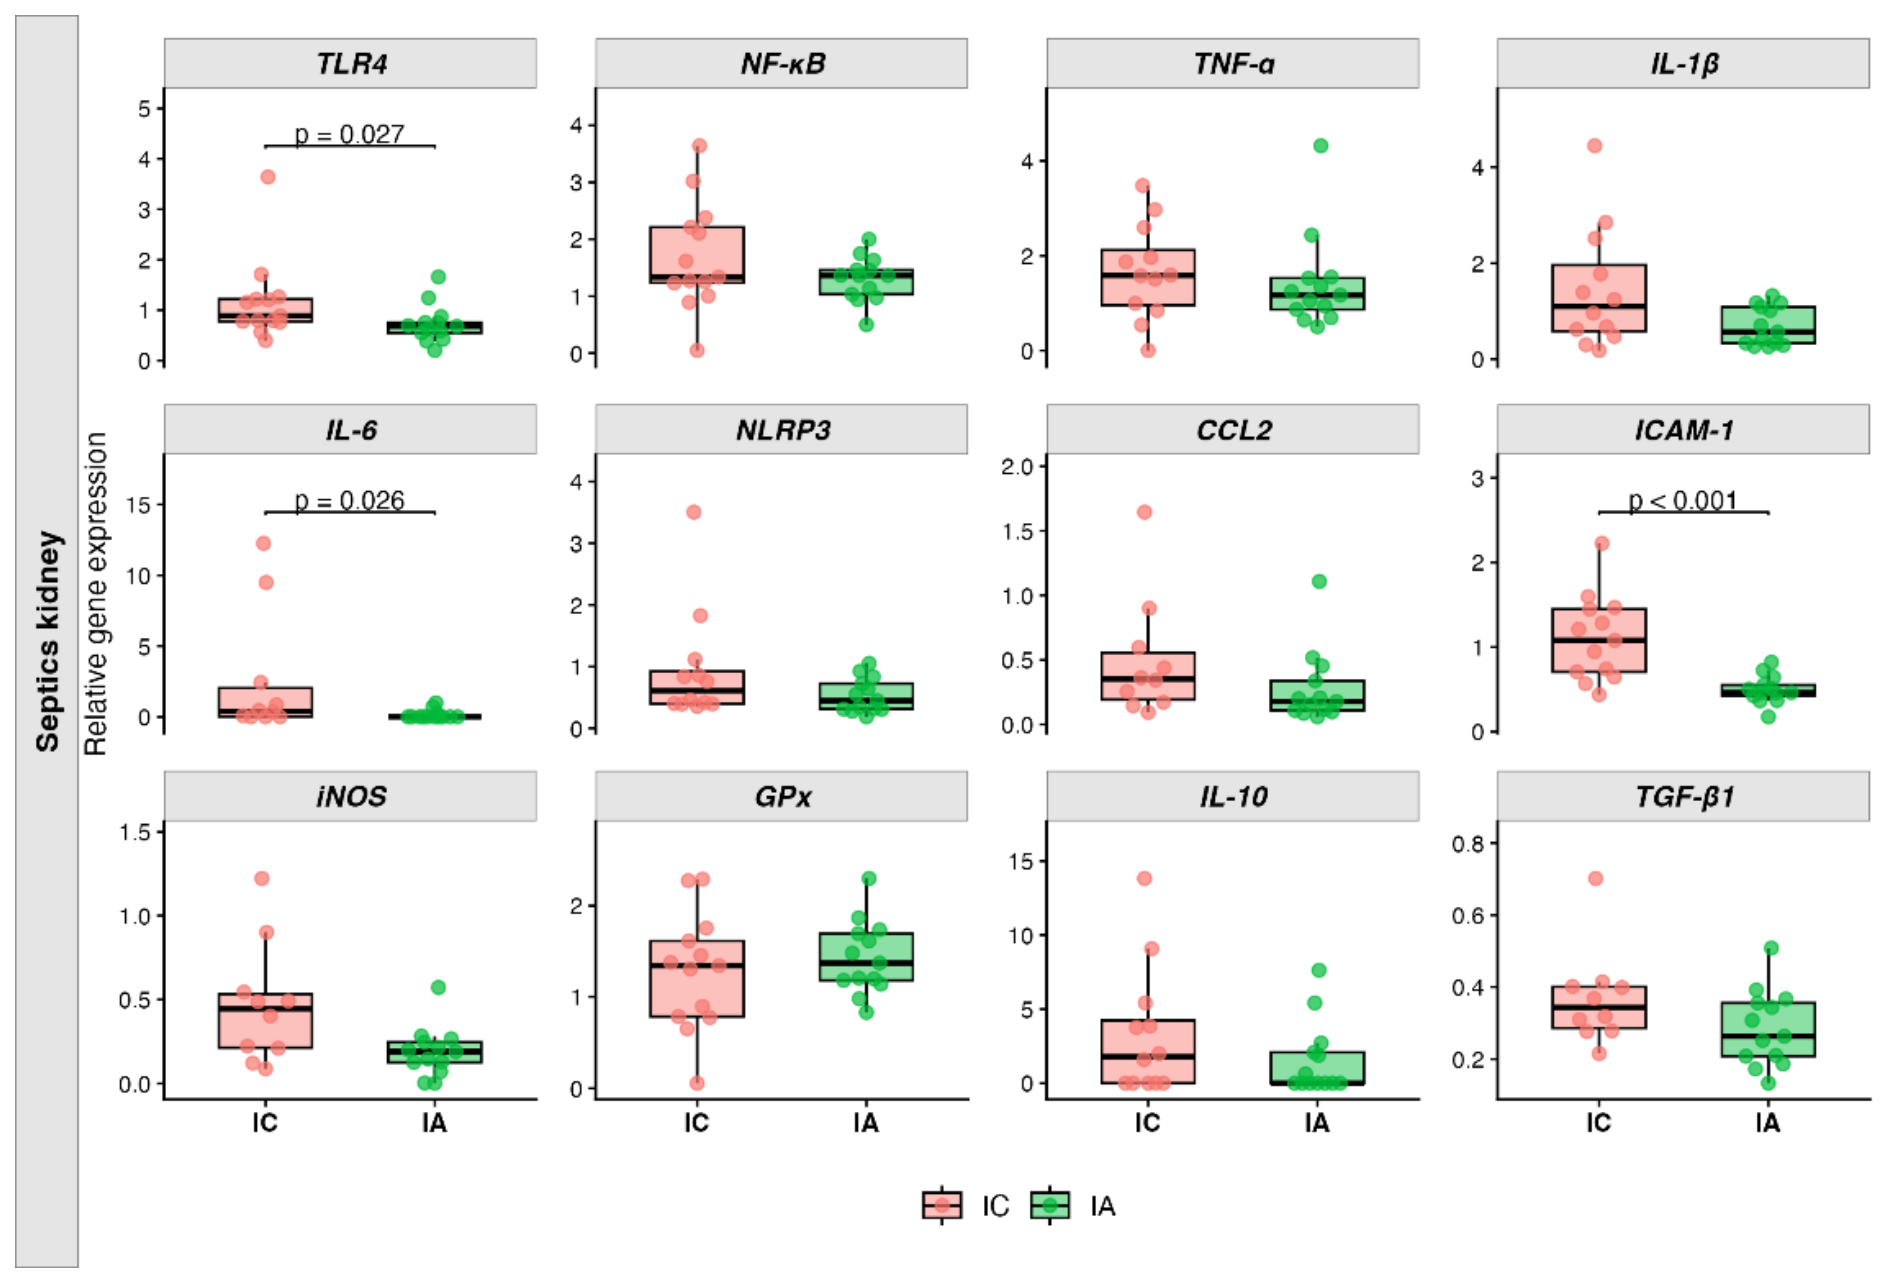
Renal mRNA expression of Icam1 (p = 0.003) and Tnf (p = 0.014) was significantly higher in healthy A12C-treated rats (STO) than in control rats (SAN). No other changes were observed in mRNA expression of healthy animals (Figure 8). On the other hand, septic animals kidney expression presents a different response. In IA group there was a lower expression in some innate immune and inflammatory signalling genes like Tlr4 (p = 0.027) and Icam1 (p < 0.001) (Figure 9). Cytokines expression in kidney was similar to liver expression, all of them showed a decrease with significant results in Il6 (p = 0.026) (Figure 9). Finally, there is a trend towards lower expression of Tgfb1 (p = 0.067) and Nos2 (p = 0.051) in IA compared to IC group (Table A4). All the data is summarized in Apendix A, Table A3 and Table A4.

3.6. Kidney Protein Expression Analysis

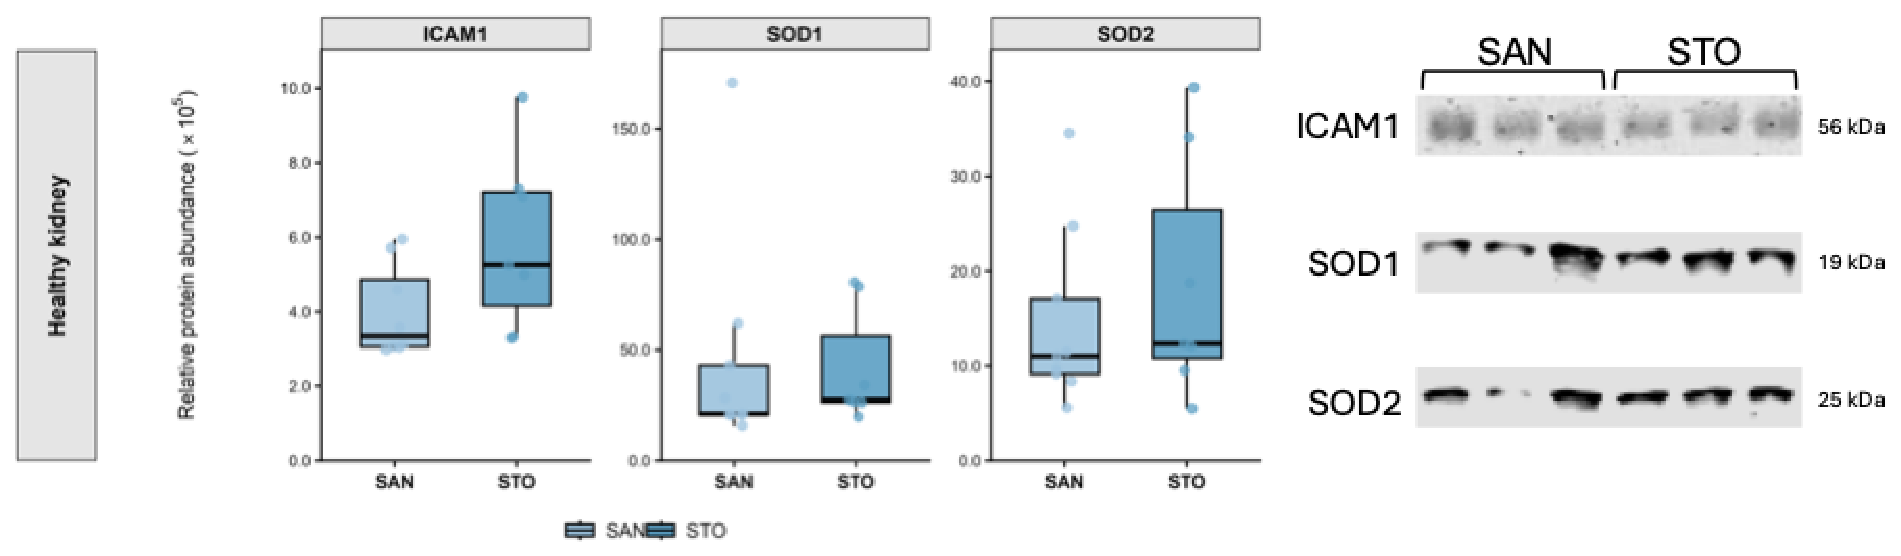
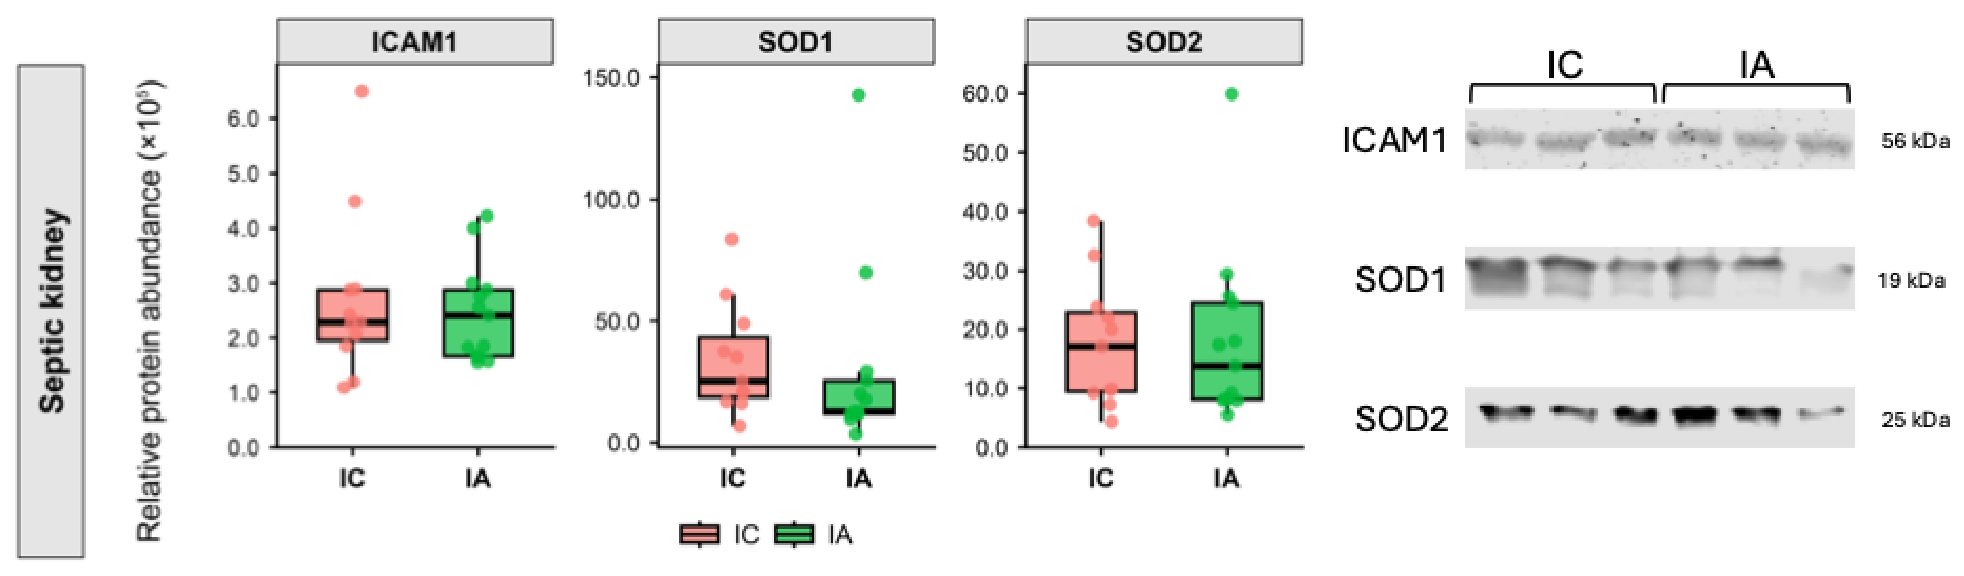
Proteins studied in kidney using Western blot technique were ICAM1, SOD1 and SOD2 with no significant changes between groups (Figure 10 and Figure 11). Although there were no significant changes, ICAM1 expression was marginally higher (p = 0.073) in healthy A12C-treated group (STO) compared with healthy group (SAN) in accordance with the significant results obtained in gene expression for Icam1 (Apendix A, Table A7). There were no statisticals changes in the septic groups (Apendix A, Table A8).

3.7. Kidney Enzymatic Activity

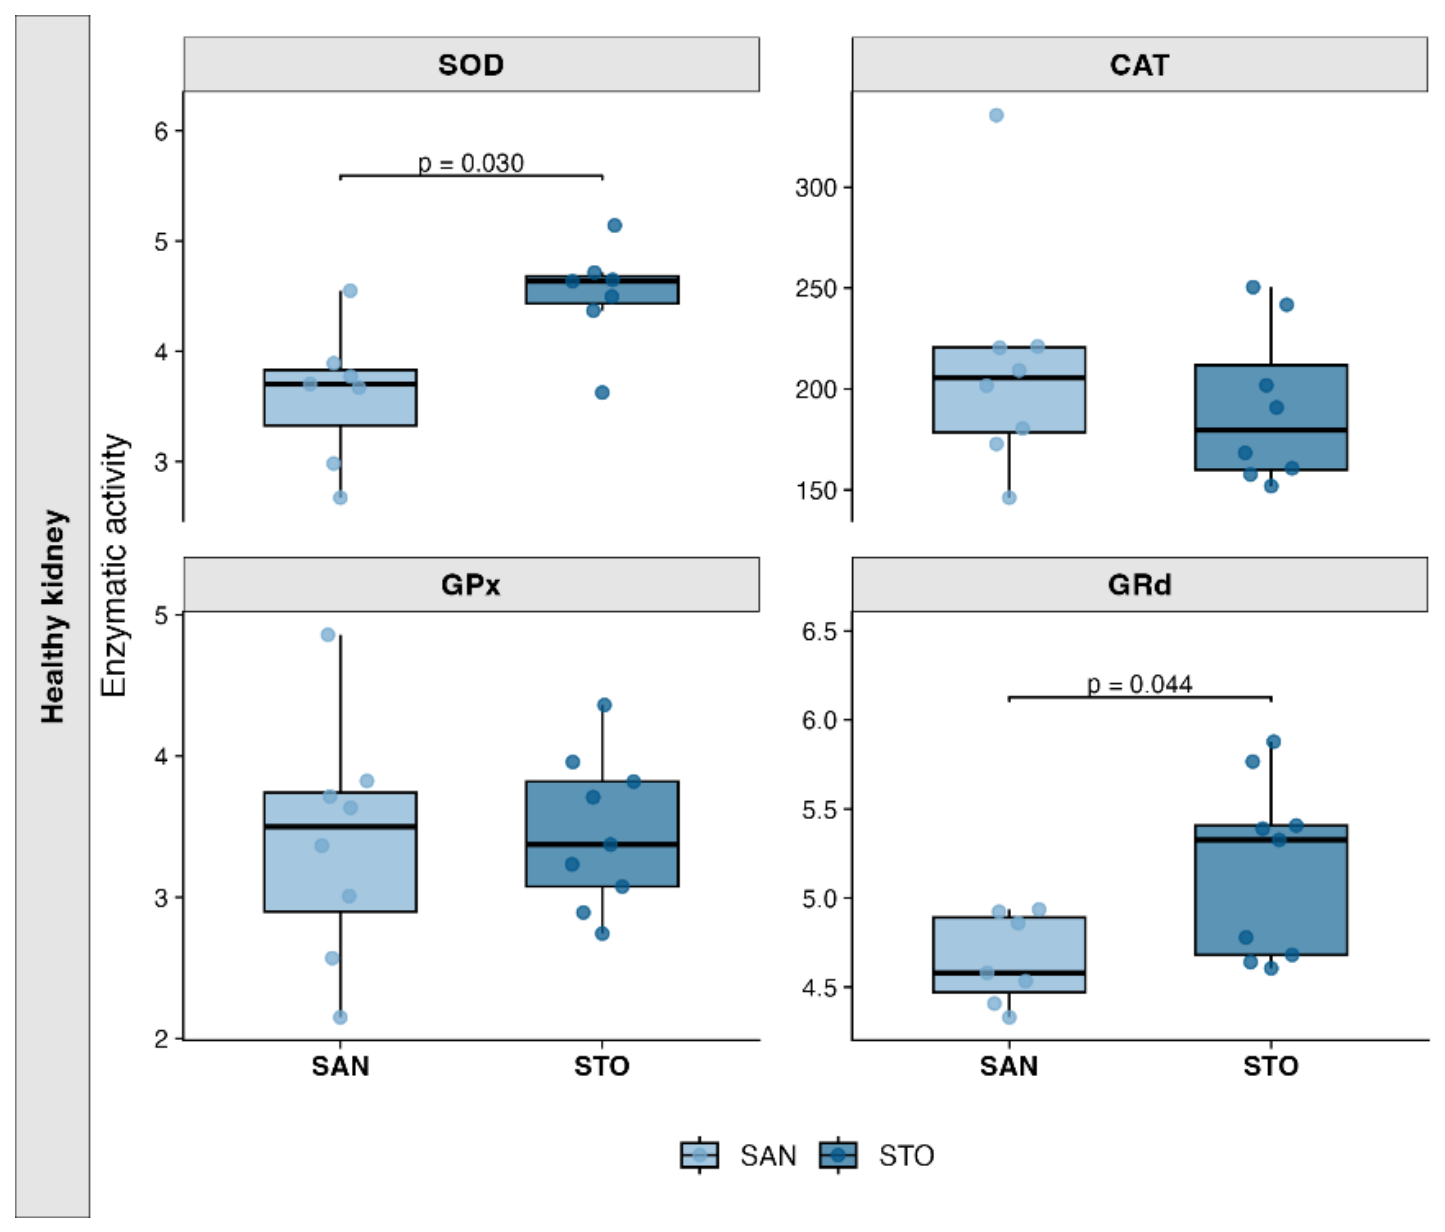
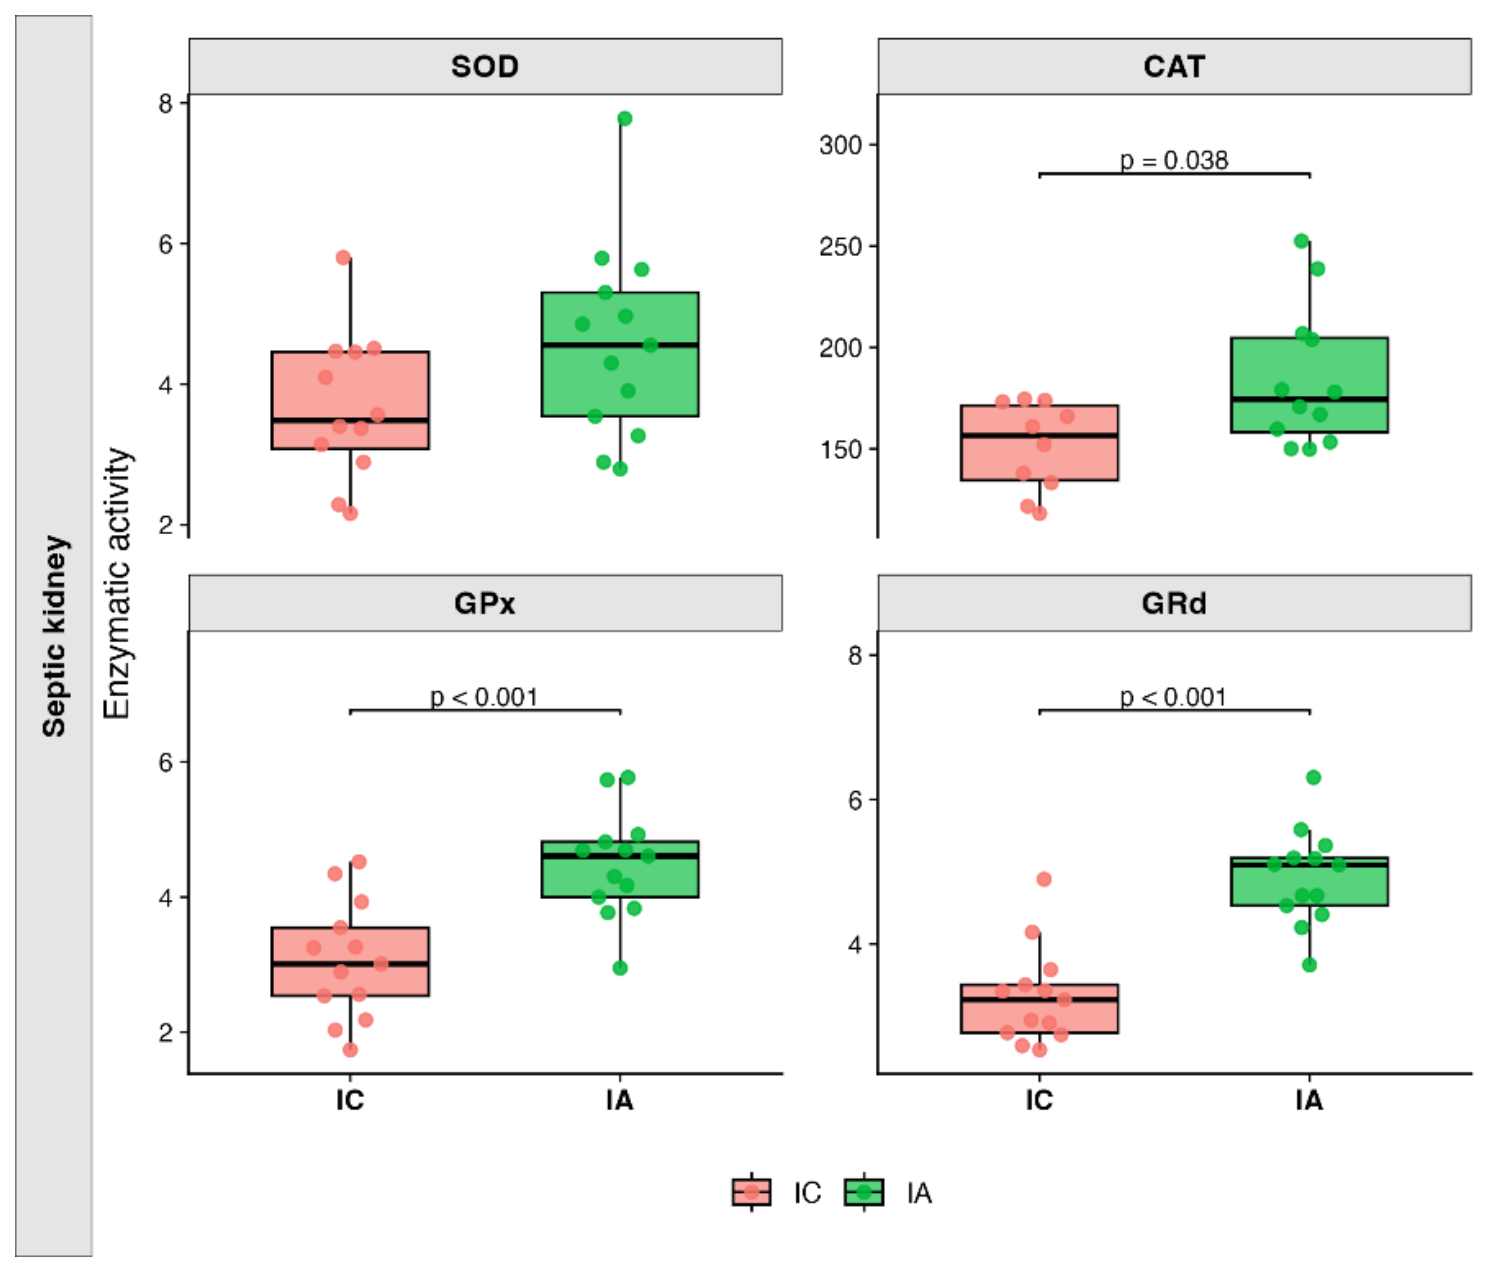
The enzymes studied were SOD, CAT, GPx and GRd. Kidney measurements shown differences between treated and non-treated animals (Apendix A, Table A11 and Table A12). In healthy groups, the oral administration of A12C (STO) leaded to a significant increase in SOD (p = 0.030) and GRd (p = 0.044) enzymes (Figure 12). Furthermore, regarding septic groups, there was also an increase in all the studied enzymes in septic A12C treated group (IA) compared with the septic non-treated group (IC), with significant results in CAT (p = 0.038), GPx (p < 0.001) and GRd (p < 0.001) as shown in Figure 13.

4. Discussion

Liver is a vital organ that regulates the host’s metabolic and immune activity, on the other hand kidney is a major clearance organ of the body and is responsible for the elimination of many xenobiotics and drugs [24,25]. These are vital functions for the body’s response to infections. The present study evaluated whether long-term oral administration of A12C could modulate hepatic and renal responses before and during polymicrobial sepsis induced by CLP. Taken together, the results indicate that A12C led to an organ and condition-dependent modulation in inflammatory signalling, with functional changes in enzymatic activity and mechanisms related to oxidative stress in heathy A12C-trated group (STO) and septic A12C- treated group (IA) when compared with non-treated groups, SAN and IC groups respectively. The observed pattern is compatible with A12C acts as a biological preconditioning stimulus rather than exclusively reversing alterations once sepsis has developed. Results are compatible with a reduction in the inflammatory response and a more pronounced functional antioxidant response. This interpretation is consistent with previous work showing that prolonged A12C administration (30 days) improves host resistance in septic rats and proposing that curdlan-like β-glucan produced by the strain may contribute to innate immune training [14].
Regarding basal effects of A12C in healthy animals, the treatment had the capacity to significantly reduce Tlr4 gene expression and TLR-4 protein expression (STO < SAN) in liver. The role of TLR-4 receptor has been extensively studied in sepsis pathophysiology. Toll like receptors (TLRs) are a class of pattern recognition receptors (PRRs) than are activated by pathogen-associated molecular patterns (PAMPs) and damage-associated molecular patterns (DAMPs) [26]. Specifically, TLR-4 binds to lipopolysaccharide protein (LPS-protein) complex which leads to its activation as it is regarded as a fundamental step in the activation of innate immune system [27]. These host responses are extremely important to contain and eliminate microbe dissemination. However, if the response is dysregulated and excessive, it can cause collateral damage like cytokine storm with potential septicaemic shock [28]. This TLR-4 reduction should not necessarily be interpreted as immunosuppression. Prolonged exposure to microbial structures can induce a state of functional reprogramming in innate immune cells, involving altered receptor sensitivity and a modified response to subsequent challenges. LPS are among the best characterised microbial compounds capable of inducing trained immunity through sustained metabolic and epigenetic changes in myeloid progenitors and mature innate immune cells. Prolonged or intense exposure usually leads to LPS tolerance, characterised by reduced cytokine production, decreased TLR4 expression and reduced interaction between TLR4 and MyD88 [29] with the consequent reduction in this inflammatory pathway. This mechanism could explain part of our findings, following long-term administration of A12C. In line with this, intercellular adhesion molecule 1 (ICAM-1/CD54) is one of the mediators involved in leukocyte-endothelial interaction. Leucocytes with CD18 complex may bind to ICAM-1 and promote adhesion and migration of these cells toward chemotactic agents [30]. As it is observed in the results, the protein expression of ICAM-1 is also downregulated in healthy treated animal, which is compatible with a reduction in the immune or endothelial activation. In contrast Sawa et al., 2008 demonstrated that LPS stimulation in a cell culture produces a higher expression of ICAM-1 activation at 24h. However, the results of the present study are consistent with the literature as various authors have reported that prolonged stimulation with LPS produce an immune tolerance with cytokine reduction [28,32,33]. On the other hand, curdlan β-glucan produced by A12C may also be involved. β-glucans are primarily recognised by Dectin-1 and can induce functional reprogramming of monocytes and macrophages. Cheng et al., 2024 demonstrated that the final effect depends on the structure of the β-glucan and its combination with TLR receptor ligands: some stimuli enhance the inflammatory response, whilst others reduce the subsequent production of TNF-α and IL-6. Considering that TNF-α and IL-6 can stimulate ICAM-1, a regulatory response induced by the combination of A12C LPS and β-glucans could indirectly contribute to their reduction in the liver of the healthy treated animals. In addition, the reduction of ICAM-1 expression may offer protection against severe inflammatory processes [30,35] as observed in previous studies on A12C administration [14]. On the other hand, the reduced hepatic expression of SOD2 detected by Western blot in healthy treated animals with A12C was not accompanied by changes in total SOD enzyme activity, nor in CAT, GPx and GRd activities. No differences were observed in gene expression of Nos2 or Gpx either. Taken together, these results indicate that the reduction in SOD2 protein did not result in a detectable alteration in the liver’s overall antioxidant capacity, nor does it appear to form part of a generalised oxidative stress response. The apparent discrepancy between SOD2 abundance and total SOD activity can be explained by the fact that the Western blot specifically assesses the amount of the mitochondrial SOD2 isoform, whilst the enzymatic assay determines the combined activity of the different isoforms. Therefore, this reduction can be supported by the parallel lower basal expression of TLR-4 and ICAM-1, a lower immune and endothelial stimulation could downregulate the basal expression of this protein [36]. Furthermore, SOD2 activity does not depend solely on its abundance, but also on post-translational modifications [37]. However, given that NF-κB p65 (Rela), Tnf, Il6 and Nos2 showed no significant differences, the result cannot be attributed to a generalised modulation of inflammatory pathways.
A different response it was observed in the kidney compared with the liver of treated animals in basal conditions. As mentioned in the results, there was a significant increase in gene expression of Tnf and Icam1 measured in the kidney of healthy treated animals. In contrast, previous studies have shown no differences in the serum quantification of TNF-α by ELISA in healthy treated animals with A12C compared with non-treated animals [14], these previous results need to be interpreted with caution because there were no significant differences because, in both groups, TNF-α levels remained below the detection limit. It is well established that TNF-α can induce ICAM-1 expression [38] in different tissues including the kidney [39] due to an inflammatory response. The results of the present study are consistent with the reviewed literature considering that there was also a marginally significant increase in the protein expression of ICAM-1 measured by Western Blot (Table 10). However, the absence of significant changes in healthy kidney gene expression of Tlr4, Rela, Il1β, Il6, Nlrp3, Ccl2 and Nos2 argues against the development of a broad pro-inflammatory response, being the hypothesis most consistent with renal immunomodulation. Moreover, unchanged Gpx and Tgfb1 expression suggests that this molecular pattern was not accompanied by an evident antioxidant compensatory response or profibrotic signalling response to organ damage. These findings are compatible with low-grade immune priming than with renal inflammatory injury.
Previous work has demonstrated that oral administration of A12C at 6 × 10^8 CFU/mL in drinking water is safe in male Sprague Dawley rats and shows a good capacity to colonize the gut microbiota. In addition, A12C administration may modulate circulating cytokine concentrations and has been associated with reduced bacterial dissemination and increased survival in a caecal ligation and puncture (CLP) model of sepsis [13,14,15]. It is still unclear how this potential probiotic act with the microbiota directly and with the host immune system indirectly.
Concerning hepatic profile to CLP, several studies examining the response to sepsis under the influence of different treatments have shown that some of these treatments can reduce the expression of various genes and proteins associated with inflammation. Liang et al., 2022 observed how metformin reduced the expression of genes such as Tnf, Ccl2 and Il6, in a CLP model in Sprague Dawley rats. Similar results were obtained by other authors when deferoxamine and melatonin were administered or when faecal transplantation was administered with lower concentrations of TNF-α and IL-6 measured by ELISA, as well as a reduction in the enzymes associated with liver damage (ALT and AST) [11,40,41]. These studies conclude with an increase in the survival in treated animals with a downregulated inflammatory response. In the present study, the gene expression results in liver reveals a significant decrease in inflammations immune factors in septic treated animals (IA). The main reduction was in Icam1, Tnf, Ccl2, and Il6 (Figure 3). In addition, Il1b and Il10 showed a trend toward lower values in septic treated animals (Table 5) being compatible with the hypothesis of immunomodulatory rather than immunosuppressive or anti-inflammatory activity, as IL-10 is considered an anti-inflammatory cytokine. In line with the literature reviewed this state provides individuals with protection against inflammatory processes such as sepsis. Furthermore, in previous studies was documented a significant reduction in alanine aminotransferase (ALT), a significant increase survival at 48h and a better clinical condition in treated animals with A12C [13,14] thus, demonstrating the possible protective effect resulting from a immunomodulate response. About ICAM-1, different experiments have reported a protective effect against sepsis when compares ICAM-1 knockout animals with wild type animals, showing minor abnormalities in weight loss, body temperature, lower mortality [35,42] and reduction in proinflammatory cytokines [30]. Liang et al., 2022 established a positive correlation between the presence of bacteria belonging to the Escherichia shigella group and an increase in inflammatory cytokines such as TNF-α, IL-6, CCL2, CXCL1, and CCL4. These results further support the immunomodulatory capacity of the strain tested in this study; previous results showed that administration of A12C reduces the total bacterial load of E. coli in faeces whilst increasing the load of A12C [13]. In contrast with these results there was a significant increase in Tlr4 gene expression, whereas TLR4 protein abundance remained unchanged. This apparent discrepancy between transcriptional and protein responses should not necessarily be interpreted as a contradiction, since mRNA abundance is not always directly translated into proportional changes in protein abundance. Protein levels depend not only on transcription but also on translation efficiency, protein turnover and degradation, temporal delays between transcriptional induction and protein accumulation as well as the local availability of resources for protein biosynthesis [43]. Large-scale analyses of mammalian immune responses have demonstrated substantial post-transcriptional regulation and different kinetics between mRNA and protein abundance following inflammatory stimulation [44,45]. Recent studies indicate that TLR4 activity depends not only on receptor abundance but also on post-translational regulation of the TLR4–MyD88 signalling complex and on negative regulators such as IRAK-M and A20, which can attenuate NF-κB-dependent responses without necessarily reducing total TLR4 protein [46,47]. Acetylation of the TIR domains of TLR4, Mal and MyD88 enhances NF-κB p65 activation and pro-inflammatory macrophage polarization, and increased TLR4-TIR acetylation was also detected in monocytes from septic patients [48]. All of this demonstrates that the TLR4 mediated immune response undergoes significant post-transcriptional and post-translational changes, which need to be studied in order to clarify the A12C mechanism of action. Finally, experimental CLP studies have shown that reduced hepatic iNOS expression can occur in parallel with lower inflammatory signalling and reduced liver nitrosative stress, supporting the possibility that the lower Nos2 expression here observed, contributes to a less pronounced septic inflammatory response [49]
In septic kidney, treatment induced a distinct anti-inflammatory and antioxidant response. The significant reduction in Tlr4 and Il6 gene expression (Figure 5) is consistent with attenuation of innate inflammatory signalling, as TLR4-dependent pathways are major contributors to inflammation, endothelial dysfunction and tubular injury during sepsis-associated acute kidney injury [50,51]. In parallel, the marked reduction in Icam1 expression may indicate decreased renal endothelial activation and leukocyte recruitment, both of which contribute to microvascular dysfunction during septic kidney injury. However, ICAM-1 protein abundance remained unchanged, suggesting that transcriptional regulation had not detectable changes in total protein levels at the 20-h endpoint. Treatment also markedly enhanced renal antioxidant capacity, as shown by increased CAT, GPx and GRd activities, whereas total SOD activity and SOD1/SOD2 protein abundance remained unchanged. Oxidative stress and mitochondrial dysfunction are key mechanisms of sepsis-associated kidney injury, and reinforcement of peroxide detoxification and the glutathione redox system may therefore contribute to renal protection [52,53]. In particular, the simultaneous increase in GPx and GRd suggests enhanced glutathione-dependent peroxide removal and GSH recycling. Interestingly, this increase occurred without changes in GPx gene expression, indicating that the antioxidant effect may involve regulation of enzymatic activity rather than transcriptional induction. Overall, these findings suggest that treatment attenuates selected inflammatory and endothelial responses while strengthening renal antioxidant defences during sepsis.
The overall pattern observed in healthy and septic animals suggests that long-term A12C administration does not induce a uniform pro- or anti-inflammatory state, but rather a context-dependent immunomodulatory response. Thus, probiotic administration appears to modify basal immune and redox homeostasis in an organ-specific manner rather than producing constitutive systemic inflammation. One possible explanation is the induction of a form of innate immune reprogramming. Trained immunity describes long-lasting functional changes in innate immune cells generated after an initial microbial stimulus through metabolic and epigenetic reprogramming, leading to an altered response with distinct trained phenotypes, to a subsequent challenge [29,34,54]. This mechanism is particularly relevant for A12C hypothesis because previous work with the same strain proposed a curdlan-like β-glucan as a potential innate immune trainer and showed improved host resistance to infection following long-term administration [14]. Reviews specifically addressing probiotics and trained immunity propose that microbiota-derived ligands and metabolites can continuously condition circulating innate immune cells and their progenitors, thereby influencing systemic responsiveness to subsequent infection [55].
This study provides a robust, multi-faceted evaluation of Alcaligenes faecalis A12C as an immunomodulatory probiotic in an in vivo Sprague-Dawley rat model of CLP-induced polymicrobial sepsis. A primary strength lies in its integrative experimental architecture, combining complementary methodologies across transcriptional profiling (RT-qPCR), normalized protein abundance (Western Blotting), functional enzymatic spectrophotometry (CAT, SOD, GPx, GRd), and histopathological tissue scoring. By evaluating both hepatic and renal target tissues under basal conditions and post-septic challenge, this multi-level approach demonstrates that long-term A12C administration induces organ-specific immune preconditioning rather than constitutive immunosuppression. Under baseline conditions, A12C selectively modulates innate immune signaling without inducing structural or inflammatory tissue injury. Following septic challenge, this preconditioned state translates into a significant attenuation of pro-inflammatory gene cascades (Tlr4, Icam1, Ccl2, Il6, Tnf) alongside markedly enhanced renal peroxide detoxification and glutathione recycling capacity (CAT, GPx, GRd activity). The convergence of transcriptional, translational, functional, and histological evidence provides high mechanistic robustness, reinforcing the therapeutic potential of A12C-mediated immune preconditioning against sepsis-induced acute organ injury.
Therefore, several limitations should be considered. First, tissues were evaluated at a single 20-h endpoint after CLP, which does not permit the characterization of the temporal evolution of inflammatory and antioxidant responses. Second, although the observed phenotype is compatible with innate immune reprogramming, trained immunity was not directly demonstrated. Epigenetic modifications associated with trained immunity or tolerance, including histone modifications, metabolic reprogramming, dectin-1-dependent signalling and changes in bone-marrow haematopoietic progenitors were not assessed. Therefore, the involvement of trained immunity should remain a mechanistic hypothesis.
Third, several signalling molecules were evaluated as total protein abundance, and consequently changes in receptor activation, phosphorylation, nuclear translocation, ubiquitination or cellular localization could not be determined. This is particularly relevant for TLR4 and NF-κβ signalling. Fourth, analyses were performed using whole-liver and whole-kidney homogenates, which does not permit the identification of the specific cell populations responsible for the observed changes and potentially masking opposing responses among hepatocytes, Kupffer cells, endothelial cells, tubular epithelial cells and infiltrating immune populations.
Fifth, the present study was conducted exclusively in male animals; therefore, the observed effects cannot be directly extrapolated to females. Sex-dependent differences in immune, endocrine, metabolic, and inflammatory responses, together with the cyclical fluctuations in ovarian hormones associated with the estrous cycle, may substantially modulate host responses to sepsis and to probiotic-mediated immunomodulation. Consequently, studies including female animals and accounting for the stage of the estrous cycle will be necessary to determine the reproducibility and sex-specificity of the observed effects.
Finally, although modulation of the intestinal microbiota represents a plausible mechanism of probiotic action, gut microbial composition, intestinal permeability, bacterial translocation and microbiota-derived metabolites were not characterized. Consequently, the present study cannot determine whether the systemic effects of A12C result from direct interaction of the probiotic or its bacterial components with the host immune system, indirect modification of the intestinal microbiota, or both mechanisms. Future studies combining microbiome and metabolomic analyses with characterization of Dectin-1 signalling, innate immune-cell function, haematopoietic progenitors and epigenetic marks would be required to establish the mechanisms responsible for the observed immunomodulatory phenotype.

5. Conclusions

Long-term A12C administration modulated inflammatory and antioxidant homeostasis in liver and kidney. Under basal conditions, treatment induced relatively selective responses, including suppression of hepatic TLR4 signalling-related markers and modulation of renal inflammatory and antioxidant parameters, without evidence of generalized systemic inflammatory activation. Following polymicrobial sepsis, probiotic pretreatment was associated with reduced expression of several inflammatory and endothelial mediators in liver and kidney and with a marked enhancement of renal CAT, GPx and GRd activities. The different responses observed before and after septic challenge suggest that the probiotic may establish a preconditioned immune state rather than exerting a constitutive anti-inflammatory effect.
Considering the previously proposed curdlan-like β-glucan activity of A12C and current evidence demonstrating that β-glucans and other microbial stimuli can induce long-lasting metabolic and epigenetic reprogramming of innate immune cells, the present findings are compatible with a potential trained-immunity-like mechanism. However, the contribution of innate immune training, endotoxin tolerance and microbiota-mediated signalling cannot be distinguished from the present data. Overall, these findings support the potential of A12C as an immunomodulatory intervention capable of modifying the host response to a subsequent severe infectious challenge rather than simply suppressing inflammation.

6. Patents

The bacteria corresponding to strain number 32431 deposited in the Spanish Type Culture Collection (CECT), (Universitat de València, Valencia, Spain) Alcaligenes faecalis subsp. faecalis A12C was used. A patent application related to the A12C strain and its potential applications has been filed with the application number P202631159 in the Spanish Patent and Trademark Office (OEPM; Oficina Española de Patentes y Marcas).

Author Contributions

Conceptualization, J.L.M-B, F.R, D.P.C, J.L.M-B and R.A-A; methodology, R.A-A, G.E-G, C.J.M-B, R.H.C, A.E.dM.yZ, J.L.M-B and J.M-B.; software, R.A-A and G.E-G.; validation, J.L.M-B and J.M-B.; formal analysis, R.A-A and G.E-G.; investigation, R.A-A.; resources, J.L.M-B, F.R, D.P.C and J.M-B.; data curation, R.A-A.; writing—original draft preparation, R.A-A.; writing—review and editing, R.A-A, G.E-G, C.J.M-B, R.H.C, A.E.dM.yZ, J.L.M-B, J.M-B, F.R and D.P.C.; visualization, R.A-A.; supervision J.L.M-B, F.R, D.P.C and J.M-B.; project administration, J.L.M-B and J.M-B.; funding acquisition, J.L.M-B and J.M-B. All authors have read and agreed to the published version of the manuscript.

Funding

This research received no external funding.

Institutional Review Board Statement

The animal study protocol was approved by the Local Animal Ethics Committee of Hospital Universitario de Gran Canaria Dr. Negrín, Las Palmas de Gran Canaria, Spain with protocol code: [CEEBA-HUGCDN 001/2025] Approval date 27 October 2025.

Data Availability Statement

The original contributions presented in this study are included in the article/supplementary material. Further inquiries can be directed to the corresponding author(s).

Acknowledgments

The authors would like to thank the staff of the animal facility at Hospital Universitario de Gran Canaria Dr. Negrín for their assistance with animal care and experimental procedures. We also thank the technical staff who contributed to sample processing and laboratory analyses in the University of Las Palmas de Gran Canaria and University of Illes Balears.

Conflicts of Interest

The authors declare no conflicts of interest. The funders had no role in the design of the study; in the collection, analyses, or interpretation of data; in the writing of the manuscript; or in the decision to publish the results.

Abbreviations

A12C Alcaligenes faecalis subsp. faecalis A12C
AU Arbitrary units
BSA Bovine serum albumin
CAT Catalase
CCL2 C-C motif chemokine ligand 2
CD54 Cluster of differentiation 54
CFU Colony-forming units
CLP Caecal ligation and puncture
Ct Cycle threshold
DAMPs Damage-associated molecular patterns
EDTA Ethylenediaminetetraacetic acid
GAPDH Glyceraldehyde-3-phosphate dehydrogenase
GPx Glutathione peroxidase
GRd Glutathione reductase
GSH Reduced glutathione
GSSG Oxidized glutathione
H₂O₂ Hydrogen peroxide
HUGCDN Hospital Universitario de Gran Canaria Doctor Negrín
IA A12C-treated septic group
IC Septic control group
ICAM-1 Intercellular adhesion molecule 1
IL-1β, Interleukin 1 beta
IL-6 Interleukin 6
IL-10 Interleukin 10
iNOS Inducible nitric oxide synthase
IQR Interquartile range
kDa Kilodalton
LPS Lipopolysaccharide
MCP-1 Monocyte chemoattractant protein 1
MyD88 Myeloid differentiation primary response 88
NADPH Reduced nicotinamide adenine dinucleotide phosphate
NF-κB Nuclear factor kappa B
NLRP3 NLR family pyrin domain containing 3
NOS2 Nitric oxide synthase 2
OEPM Oficina Española de Patentes y Marcas
PAMPs, Pathogen-associated molecular patterns
PAS Periodic acid–Schiff
PRRs, Pattern-recognition receptors
qPCR Quantitative polymerase chain reaction
RELA RELA proto-oncogene, NF-κB subunit
RT-qPCR Reverse transcription quantitative polymerase chain reaction
SAN Healthy control group
SOD Superoxide dismutase
SOD1 Superoxide dismutase 1
SOD2 Superoxide dismutase 2
STO A12C-treated healthy group
TBS Tris-buffered saline;
TBS-T Tris-buffered saline with Tween 20
TGF-β1 Transforming growth factor beta 1
TLR4 Toll-like receptor 4;
TLRs Toll-like receptors
TNF-α Tumour necrosis factor alpha.
ΔCt Difference between the Ct from target gene and the Ct from reference gene
ΔΔCt Difference between the ΔCt from experimental sample and the ΔCt from corresponding control group.

Appendix A

Table A1. Hepatic relative gene expression in control and healthy treated rats.
Gene SAN median [IQR] STO median [IQR] p-value Median trend Rank-biserial r Effect size
Tlr4 1.000
[0.766–1.198]
0.620
[0.549–0.688]
0.007
**
STO < SAN −0.765 L
Rela
(NF-κB p65)
1.158
[0.807–1.228]
0.973
[0.957–1.267]
0.860 STO < SAN +0.062 N
Tnf 0.845
[0.760–1.149]
0.794
[0.719–1.756]
0.860 STO < SAN −0.062 N
Il1b 0.952
[0.675–1.551]
0.824
[0.745–0.997]
0.659 STO < SAN −0.136 S
Il6 0.000
[0.000–0.000]
0.000
[0.000–0.000]
1.000 STO = SAN 0.000 N
Nlrp3 0.892
[0.841–1.117]
0.871
[0.804–0.908]
0.233 STO < SAN −0.346 M
Ccl2/Mcp1 1.643
[0.579–1.792]
1.084
[0.720–1.195]
0.480 STO < SAN −0.210 S
Icam1 0.917
[0.815–1.348]
0.631
[0.591–0.911]
0.063 STO < SAN −0.531 L
Nos2(iNOS) 3.527
[1.538–4.645]
1.582
[1.224–2.425]
0.318 STO < SAN −0.313 M
Gpx 0.917
[0.717–1.356]
0.752
[0.620–1.270]
0.480 STO < SAN −0.210 S
Il10 0.995
[0.840–1.278]
1.104
[0.533–1.211]
0.659 STO > SAN −0.136 S
Tgfb1 1.051
[0.918–1.103]
0.777
[0.743–0.883]
0.034
*
STO < SAN −0.605 L
Data are expressed as median [interquartile range]. SAN, control group; STO, healthy treated group. Differences between groups were assessed using the Mann–Whitney U test. Significant differences between groups are indicated by p-values in bold with *(p < 0.05) or **(p < 0.01). Gapdh was used as the reference gene for normalization. S: small |r| ≈ 0.10; M: moderate |r| ≈ 0.30; L: large |r| ≥ 0.50; N: Negligible.
Table A2. Hepatic relative gene expression in septic and septic treated rats.
Gene IC median [IQR] IA median [IQR] p-value Median trend Rank-biserial r Effect
Tlr4 0.946
[0.815–1.256]
1.352
[1.090–1.677]
0.031
*
IA > IC +0.495 M
Rela 1.081
[0.687–1.499]
0.868
[0.529–1.104]
0.173 IA < IC −0.321 M
Tnf 0.841
[0.592–1.342]
0.424
[0.315–0.748]
0.027
*
IA < IC −0.505 L
Il1b 1.048
[0.374–1.818]
0.443
[0.279–0.611]
0.094 IA < IC −0.385 M
Il6 1.150
[0.000–2.707]
0.000
[0.000–0.052]
0.026
*
IA < IC −0.515 L
Nlrp3 0.886
[0.708–1.249]
0.991
[0.535–1.128]
0.610 IA > IC −0.121 S
Ccl2/Mcp1 0.742
[0.441–2.217]
0.264
[0.175–0.571]
0.031
*
IA < IC −0.495 M
Icam1 1.033
[0.569–1.326]
0.489
[0.363–0.818]
0.012
*
IA < IC −0.571 L
Nos2/iNOS 1.046
[0.264–2.518]
0.103
[0.084–0.325]
0.004
**
IA < IC −0.667 L
Gpx 1.088
[0.893–1.211]
1.162
[1.124–1.208]
0.560 IA > IC +0.137 S
Il10 0.846
[0.565–1.371]
0.578
[0.226–0.821]
0.055 IA < IC −0.440 M
Tgfb1 0.970
[0.740–1.217]
0.568
[0.421–1.204]
0.247 IA < IC −0.274 S
Data are expressed as median [interquartile range]. IC, septic group; IA, septic treated group. Differences between groups were assessed using the Mann–Whitney U test. Significant differences between groups are indicated by p-values in bold with *(p < 0.05), **(p < 0.01) or ***(p < 0.001). Gapdh was used as the reference gene for normalization. S: small |r| < 0.30; M: moderate |r| ≈ 0.30-0.50; L: large |r| ≥ 0.50; N: Negligible.
Table A3. Renal relative gene expression in control and healthy treated rats.
Gene SAN median [IQR] STO median [IQR] p-value Median trend Rank-biserial r Effect size
Tlr4 0.824
[0.738–1.332]
0.765
[0.739–0.935]
0.743 STO < SAN −0.111 S
Rela 0.994
[0.804–1.092]
1.049
[0.993–1.064]
0.531 STO > SAN +0.194 S
Tnf 1.450
[0.545–2.768]
3.641
[3.051–4.747]
0.014
*
STO > SAN +0.722 L
Il1b 0.800
[0.550–0.996]
1.049
[0.858–1.354]
0.204 STO > SAN +0.397 M
Il6 0.000
[0.000–0.000]
0.000
[0.000–0.000]
1.000 STO = SAN 0.000 N
Nlrp3 0.968
[0.718–1.139]
1.194
[1.076–1.598]
0.148 STO > SAN +0.431 M
Ccl2/Mcp1 0.988
[0.637–1.014]
1.123
[1.035–1.436]
0.148 STO > SAN +0.464 M
Icam1 0.885
[0.771–0.984]
1.379
[1.234–1.483]
0.003
**
STO > SAN +0.861 L
Nos2/iNOS 0.000
[0.000–0.000]
0.000
[0.000–0.425]
0.563 STO = SAN +0.143 S
Gpx 0.985
[0.818–1.175]
1.044
[0.836–1.119]
1.000 STO > SAN −0.014 N
Il10 0.000
[0.000–0.000]
0.000
[0.000–0.000]
0.198 STO = SAN +0.222 S
Tgfb1 0.990
[0.779–1.117]
0.973
[0.934–0.999]
0.862 STO < SAN −0.071 N
Data are expressed as median [interquartile range]. SAN, control group; STO, healthy treated group. Differences between groups were assessed using the Mann–Whitney U test. Significant differences between groups are indicated by p-values in bold with *(p < 0.05), **(p < 0.01). Gapdh was used as the reference gene for normalization. S: small |r| < 0.30; M: moderate |r| ≈ 0.30-0.50; L: large |r| ≥ 0.50; N: Negligible.
Table A4. Renal relative gene expression in septic and septic treated rats.
Gene IC median [IQR] IA median [IQR] p-value Median trend Rank-biserial r Effect size
Tlr4 0.891
[0.779–1.217]
0.680
[0.549–0.755]
0.027
*
IA < IC −0.515 L
Rela 1.333
[1.231–2.210]
1.361
[1.031–1.458]
0.473 IA > IC −0.172 S
Tnf 1.584
[0.956–2.121]
1.168
[0.866–1.528]
0.289 IA < IC −0.256 S
Il1b 1.100
[0.582–1.961]
0.566
[0.334–1.088]
0.109 IA < IC −0.385 M
Il6 0.395
[0.020–2.034]
0.000
[0.000–0.000]
0.026
*
IA < IC −0.508 L
Nlrp3 0.610
[0.400–0.923]
0.449
[0.312–0.727]
0.109 IA < IC −0.385 M
Ccl2/Mcp1 0.352
[0.193–0.556]
0.178
[0.109–0.338]
0.145 IA < IC −0.369 M
Icam1 1.079
[0.707–1.449]
0.462
[0.425–0.551]
< 0.001
***
IA < IC −0.787 L
Nos2/iNOS 0.445
[0.213–0.531]
0.189
[0.125–0.246]
0.051 IA < IC −0.492 M
Gpx 1.343
[0.785–1.613]
1.371
[1.181–1.693]
0.479 IA > IC +0.172 S
Il10 1.790
[0.000–4.249]
0.000
[0.000–2.082]
0.356 IA < IC −0.212 S
Tgfb1 0.343
[0.286–0.401]
0.263
[0.208–0.356]
0.067 IA < IC −0.462 M
Data are expressed as median [interquartile range]. IC, septic group; IA, septic treated group. Differences between groups were assessed using the Mann–Whitney U test. Significant differences between groups are indicated by p-values in bold with *(p < 0.05), **(p < 0.01) or ***(p < 0.001). Gapdh was used as the reference gene for normalization. S: small |r| < 0.30; M: moderate |r| ≈ 0.30-0.50; L: large |r| ≥ 0.50; N: Negligible.
Table A5. Hepatic normalized protein expression in healthy control and treated healthy rats.

Protein
SAN median
[IQR]
STO median
[IQR]
p-value Median trend Rank-biserial r Effect size
TLR4 96335
[66129–196782]
7756
[1976–18583]
0.004
**
SAN>STO −0.958 L
NF-κB p65 101625
[22016–198297]
47478
[15274–235234]
0.810 SAN>STO −0.083 N
CCL2 1864667
[980737–2878528]
573000
[479722–1309962]
0.194 SAN>STO −0.389 M
ICAM1 701375
[541711–921811]
79691
[47144–283486]
0.006
**
SAN>STO −0.806 L
SOD1 2471345
[1576044–4394750]
2659959
[1701445–3043333]
0.597 SAN<STO −0.167 S
SOD2 5186429
[3798476–6520345]
1328542
[991967–2631715]
0.018
*
SAN>STO −0.694 L
Hepatic normalized protein abundance in arbitrary units (AU) of TLR4, NF-κB p65, CCL2, ICAM1, SOD1 and SOD2 control (SAN) and healthy treated (STO) rats. Protein abundance was determined by Western blotting and normalized to total protein loading. Data are expressed as median [interquartile range]. Significant differences between groups are indicated by p-values in bold with *(p < 0.05) or **(p < 0.01). S: small |r| < 0.30; M: moderate |r| ≈ 0.30-0.50; L: large |r| ≥ 0.50; N: Negligible.
Table A6. Hepatic normalized protein expression in septic control and treated septic rats.
Protein IC median
[IQR]
IA median
[IQR]
p-value Median trend Rank-biserial r Effect size
TLR4 195194
[17172–330142]
96400
[16183–184781]
0.342 IC > IA −0.273 S
NF-κB p65 89145
[77326–291058]
171035
[70671–319034]
0.763 IC < IA +0.078 N
CCL2 709155
[384318– 1453284]
2083357
[488105– 5023333]
0.093 IC < IA +0.413 M
ICAM1 373366
[114767–744310]
351000
[182661–636954]
0.828 IC > IA −0.062 N
SOD1 1339661
[939234–1839423]
3486846
[1535825–6094068]
0.017
*
IC < IA +0.571 L
SOD2 7084222
[5598879–7580196]
10036116
[5992978–15244155]
0.239 IC < IA +0.286 S
Hepatic normalized protein abundance in arbitrary units (AU) of TLR4, NF-κB p65, CCL2, ICAM1, SOD1 and SOD2 in septic control (IC) and A12C-treated septic (IA) rats. Protein abundance was determined by Western blotting and normalized to total protein loading. Data are expressed as median [interquartile range]. Significant differences between groups are indicated by p-values in bold with *(p < 0.05). S: small |r| < 0.30; M: moderate |r| ≈ 0.30-0.50; L: large |r| ≥ 0.50; N: Negligible.
Table A7. Renal normalized protein expression in healthy control and treated healthy rats.
Protein SAN median
[IQR]
STO median
[IQR]
p-value Median trend Rank-biserial r Effect size
ICAM1 335009
[306014–487553]
526278
[416580–720829]
0.073 SAN < STO +0.571 L
SOD1 2098447
[2061793–4302868]
2738634
[2628145–5637949]
0.525 SAN < STO +0.206 S
SOD2 1102200
[913903–1702966]
1233415
[1079668–2644120]
0.459 SAN < STO +0.238 S
Renal normalized protein abundance in arbitrary units (AU) of ICAM-1, SOD1, and SOD2 in control (SAN) and healthy treated (STO) rats. Protein abundance was determined by Western blotting and normalized to total protein loading. Data are expressed as median [interquartile range]. No significant differences between groups were found. S: small |r| < 0.30; M: moderate |r| ≈ 0.30-0.50; L: large |r| ≥ 0.50; N: Negligible.
Table A8. Renal normalized protein expression in septic control and treated septic rats.
Protein IC median
[IQR]
IA median
[IQR]
p-value Median
trend
Rank-biserial r Effect
size
ICAM1 228503
[195474–288136]
240784
[166321–288241]
0.862 IC < IA −0.049 N
SOD1 2533898
[1873005–4326757]
1282156
[1181363–2553685]
0.132 IC > IA −0.371 M
SOD2 1712960
[946176–2288310]
1384960
[811629–2445171]
0.817 IC > IA −0.063 N
Renal normalized protein abundance in arbitrary units (AU) of ICAM-1, SOD1, and SOD2 in septic control (IC) and A12C-treated septic (IA) rats. Protein abundance was determined by Western blotting and normalized to total protein loading. Data are expressed as median [interquartile range]. No significant differences between groups where found. S: small |r| < 0.30; M: moderate |r| ≈ 0.30-0.50; L: large |r| ≥ 0.50; N: Negligible.
Table A9. Hepatic enzymatic activity in healthy control and treated healthy rats.
Enzyme SAN median [IQR] STO median [IQR] p-value Median trend Rank-biserial r Effect
size
SOD 6.942
[6.568–7.284]
6.745
[6.261–9.097]
0.958 SAN>STO +0.031 N

CAT
1750.681
[1514.194–1990.007]
1495.233
[1275.102–1809.766]
0.270 SAN>STO −0.344 M

GPx
9.588
[8.549–10.154]
9.372
[8.960–11.301]
0.860 SAN>STO +0.062 N

GRd
2.730
[2.429–3.072]
2.672
[2.508–2.991]
0.962 SAN>STO −0.028 N
Antioxidant enzyme activities of superoxide dismutase (SOD; pKat/mg protein), catalase (CAT; mK/mg protein), glutathione peroxidase (GPx; nmol/s/mg protein) and glutathione reductase (GRd; nmol/min/mg protein) in liver samples from control (SAN) and healthy treated (STO) rats. Data are expressed as median [interquartile range]. No significant differences between groups were found. S: small |r| < 0.30; M: moderate |r| ≈ 0.30-0.50; L: large |r| ≥ 0.50; N: Negligible.
Table A10. Hepatic enzymatic activity in septic rats and septic treated rats.
Enzyme IC median [IQR] IA median [IQR] p-value Median trend Rank-biserial r Effect
size
SOD 8.127
[6.259-9.371]
6.650
[5.283-7.930]
0.228 IC>IA −0.292 S
CAT 1379.726
[1096.045-1557.546]
1363.008
[1235.987-1607.270]
0.715 IC>IA +0.088 N
GPx 11.489
[9.935-13.200]
12.039
[10.799-13.457]
0.680 IC<IA +0.099 N
GRd 2.305
[2.120-2.672]
2.575
[1.930-2.783]
0.865 IC<IA −0.044 N
Antioxidant enzyme activities of superoxide dismutase (SOD; pKat/mg protein), catalase (CAT; mK/mg protein), glutathione peroxidase (GPx; nmol/s/mg protein) and glutathione reductase (GRd; nmol/min/mg protein) in liver samples from septic (IC) and septic treated (IA) rats. Data are expressed as median [interquartile range]. No significant differences between groups were found. S: small |r| < 0.30; M: moderate |r| ≈ 0.30-0.50; L: large |r| ≥ 0.50; N: Negligible.
Table A11. Renal enzymatic activity in healthy control and treated healthy rats.
Enzyme SAN median [IQR] STO median [IQR] p-value Median trend Rank-biserial r Effect
size
SOD 3.703
[3.326–3.831]
4.635
[4.432–4.681]
0.030
*
SAN < STO +0.714 L
CAT 205.435
[178.409–220.609]
179.547
[159.860–211.802]
0.495 SAN > STO −0.219 S
GPx 3.500
[2.898–3.742]
3.373
[3.076–3.820]
0.810 SAN > STO +0.083 N
GRd 4.580
[4.471–4.891]
5.326
[4.681–5.407]
0.044
*
SAN < STO +0.619 L
Antioxidant enzyme activities of superoxide dismutase (SOD; pKat/mg protein), catalase (CAT; mK/mg protein), glutathione peroxidase (GPx; nmol/s/mg protein) and glutathione reductase (GRd; nmol/min/mg protein) in kidney samples from control (SAN) and healthy treated (STO) rats. Data are expressed as median [interquartile range]. Significant differences between groups are indicated by p-values in bold with * (p < 0.05). S: small |r| < 0.30; M: moderate |r| ≈ 0.30-0.50; L: large |r| ≥ 0.50; N: Negligible.
Table A12. Renal enzymatic activity in septic rats and septic treated rats.
Enzyme IC median [IQR] IA median [IQR] p-value Median
trend
Rank-biserial r Effect size
SOD 3.485
[3.079-4.460]
4.556
[3.544-5.306]
0.109 IC < IA +0.385 M
CAT 156.527
[134.470-171.382]
174.399
[158.119-204.642]
0.038
*
IC < IA +0.533 L
GPx 3.009
[2.538-3.547]
4.606
[3.999-4.817]
<0.001
***
IC < IA +0.775 L
GRd 3.230
[2.775-3.438]
5.095
[4.533-5.193]
<0.001
***
IC < IA +0.917 L
Antioxidant enzyme activities of superoxide dismutase (SOD; pKat/mg protein), catalase (CAT; mK/mg protein), glutathione peroxidase (GPx; nmol/s/mg protein) and glutathione reductase (GRd; nmol/min/mg protein) in kidney samples from septic (IC) and septic treated (IA) rats. Data are expressed as median [interquartile range]. Significant differences between groups are indicated by p-values in bold with * (p < 0.05) and *** (p < 0.001). S: small |r| < 0.30; M: moderate |r| ≈ 0.30-0.50; L: large |r| ≥ 0.50; N: Negligible.

References

  1. Singer, M.; Deutschman, C.S.; Seymour, C.W.; Shankar-Hari, M.; Annane, D.; Bauer, M.; Bellomo, R.; Bernard, G.R.; Chiche, J.-D.; Coopersmith, C.M.; et al. The Third International Consensus Definitions for Sepsis and Septic Shock (Sepsis-3). JAMA 2016, 315, 801–810. [Google Scholar] [CrossRef] [PubMed]
  2. Reinhart, K.; Daniels, R.; Kissoon, N.; Machado, F.R.; Schachter, R.D.; Finfer, S. Recognizing Sepsis as a Global Health Priority — A WHO Resolution. N. Engl. J. Med. 2017, 377, 414–417. [Google Scholar] [CrossRef] [PubMed]
  3. Rudd, K.E.; Johnson, S.C.; Agesa, K.M.; Shackelford, K.A.; Tsoi, D.; Kievlan, D.R.; Colombara, D. V.; Ikuta, K.S.; Kissoon, N.; Finfer, S.; et al. Global, Regional, and National Sepsis Incidence and Mortality, 1990–2017: Analysis for the Global Burden of Disease Study. The Lancet 2020, 395, 200–211. [Google Scholar] [CrossRef] [PubMed]
  4. van den Berg, M.; van Beuningen, F.E.; ter Maaten, J.C.; Bouma, H.R. Hospital-Related Costs of Sepsis around the World: A Systematic Review Exploring the Economic Burden of Sepsis. J. Crit. Care 2022, 71, 154096. [Google Scholar] [CrossRef] [PubMed]
  5. Lelubre, C.; Vincent, J.-L. Mechanisms and Treatment of Organ Failure in Sepsis. Nat. Rev. Nephrol. 2018, 14, 417–427. [Google Scholar] [CrossRef] [PubMed]
  6. Kim, T.S.; Choi, D.H. Liver Dysfunction in Sepsis. Korean J. Gastroenterol. 2020, 75, 182–187. [Google Scholar] [CrossRef] [PubMed]
  7. Peerapornratana, S.; Manrique-Caballero, C.L.; Gómez, H.; Kellum, J.A. Acute Kidney Injury from Sepsis: Current Concepts, Epidemiology, Pathophysiology, Prevention and Treatment. Kidney Int. 2019, 96, 1083–1099. [Google Scholar] [CrossRef] [PubMed]
  8. Borges, A.; Bento, L. Organ Crosstalk and Dysfunction in Sepsis. Ann. Intensive Care 2024, 14, 147. [Google Scholar] [CrossRef] [PubMed]
  9. Pais, T.; Jorge, S.; Lopes, J.A. Acute Kidney Injury in Sepsis. Int. J. Mol. Sci. 2024, 25. [Google Scholar] [CrossRef] [PubMed]
  10. Woźnica, E.A.; Inglot, M.; Woźnica, R.K.; Łysenko, L. Liver Dysfunction in Sepsis. Adv. Clin. Exp. Med. 2018, 27, 547–551. [Google Scholar] [CrossRef] [PubMed]
  11. Lou, X.; Xue, J.; Shao, R.; Yang, Y.; Ning, D.; Mo, C.; Wang, F.; Chen, G. Fecal Microbiota Transplantation and Short-Chain Fatty Acids Reduce Sepsis Mortality by Remodeling Antibiotic-Induced Gut Microbiota Disturbances. Front. Immunol. 2023, 13. [Google Scholar] [CrossRef] [PubMed]
  12. Mo, C.; Shao, R.; Shi, Z.; Lou, X.; Xue, J.; Ning, D.; Liu, Y.; Jiang, W.; Wei, X.; Xiao, J.; et al. Fecal Microbiota Transplantation Reduces Susceptibility to Post–Antibiotic CLP–Induced Sepsis by Modulating the Gut Microbiota and Its Metabolites. BMC Microbiol. 2026, 26, 311. [Google Scholar] [CrossRef] [PubMed]
  13. Gutiérrez-Falcón, A.I.; Ramos-Nuez, A.M.; de los Monteros y Zayas, A.E.; Castillo, D.F.P.; García-Laorden, M.I.; Chamizo-López, F.J.; Real Valcárcel, F.; Campelo, F.A.; Benítez, A.B.; Salgueiro, P.N.; et al. Probiotic Properties of Alcaligenes Faecalis Isolated from Argyrosomus Regius in Experimental Peritonitis (Rat Model). Probiotics Antimicrob. Proteins 2021, 13, 1326–1337. [Google Scholar] [CrossRef] [PubMed]
  14. Martel-Benítez, C.J.; Alayón-Afonso, R.; Castillo, D.P.; Chamizo-López, F.J.; García-Laorden, M.I.; de los Monteros y Zayas, A.E.; Rivero-Vera, J.C.; Salgueiro, P.N.; Real, F.; Bordes-Benítez, A.; et al. Long-Term Treatment with Alcaligenes Faecalis A12C Improves Host Resistance to Pathogens in Septic Rats: Possible Contribution of Curdlan-Like Immune Trainer. Probiotics Antimicrob. Proteins 2024. [Google Scholar] [CrossRef] [PubMed]
  15. Gutiérrez-Falcón, A.; Padilla, D.; Ramos Sosa, M.J.; Martín Barrasa, J.L.; Acosta-Hernández, B.; Sánchez Henao, A.; García Álvarez, N.; Rosario Medina, I.; Déniz, S.; Real, F. Characterization in Vitro of New Bacterial Strains Showing Potentially Probiotic Crossed Effect against Vibriosis in Relevant Fish Species for Marine Aquaculture. J. Appl. Anim. Res. 2020, 48, 553–558. [Google Scholar] [CrossRef]
  16. Rittirsch, D.; Huber-Lang, M.S.; Flierl, M.A.; Ward, P.A. Immunodesign of Experimental Sepsis by Cecal Ligation and Puncture. Nat. Protoc. 2009, 4, 31–36. [Google Scholar] [CrossRef] [PubMed]
  17. Acred, P.; Hennessey, T.D.; MacArthur-Clark, J.A.; Merrikin, D.J.; Ryan, D.M.; Smulders, H.C.; Troke, P.F.; Wilson, R.G.; Straughan, D.W. Guidelines for the Welfare of Animals in Rodent Protection Tests: A Report from the Rodent Protection Test Working Party. Lab. Anim. 1994, 28, 13–18. [Google Scholar] [CrossRef] [PubMed]
  18. Jia, Y.; Li, Z.; Feng, Y.; Cui, R.; Dong, Y.; Zhang, X.; Xiang, X.; Qu, K.; Liu, C.; Zhang, J. Methane-Rich Saline Ameliorates Sepsis-Induced Acute Kidney Injury through Anti-Inflammation, Antioxidative, and Antiapoptosis Effects by Regulating Endoplasmic Reticulum Stress. Oxid. Med. Cell. Longev. 2018, 2018. [Google Scholar] [CrossRef] [PubMed]
  19. Muftuoglu, M.A.T.; Aktekin, A.; Ozdemir, N.C.; Saglam, A. Liver Injury in Sepsis and Abdominal Compartment Syndrome in Rats. Surg. Today 2006, 36, 519–524. [Google Scholar] [CrossRef] [PubMed]
  20. Aebi, H. Catalase in Vitro. Methods Enzymol. 1984, 105, 121–126. [Google Scholar] [CrossRef] [PubMed]
  21. Flohé, L.; Otting, F. Superoxide Dismutase Assays. Methods Enzymol. 1984, 105, 93–104. [Google Scholar] [CrossRef] [PubMed]
  22. Flohé, L.; Günzler, W.A. Assays of Glutathione Peroxidase. Methods Enzymol. 1984, 105, 114–121. [Google Scholar] [CrossRef] [PubMed]
  23. Bergmeyer, H.Ulrich.; Bergmeyer, J.; Grassl, Marianne. Methods of Enzymatic Analysis; Verlag Chemie, 1983; ISBN 9780895732316. [Google Scholar]
  24. Bajaj, P.; Chowdhury, S.K.; Yucha, R.; Kelly, E.J.; Xiao, G. Emerging Kidney Models to Investigate Metabolism, Transport, and Toxicity of Drugs and Xenobiotics. Drug Metab. Dispos. 2018, 46, 1692–1702. [Google Scholar] [CrossRef] [PubMed]
  25. Liang, H.; Song, H.; Zhang, X.; Song, G.; Wang, Y.; Ding, X.; Duan, X.; Li, L.; Sun, T.; Kan, Q. Metformin Attenuated Sepsis-Related Liver Injury by Modulating Gut Microbiota. Emerg. Microbes Infect. 2022, 11, 815–828. [Google Scholar] [CrossRef] [PubMed]
  26. Shalmani, A.A.; Ghahremani, M.H.; Jeivad, F.; Shadboorestan, A.; Hassanzadeh, G.; Beh-Pajooh, A.; Ganbari-Erdi, M.; Kasirzadeh, S.; Mojtahedzadeh, M.; Sabzevari, O. Monomethyl Fumarate Alleviates Sepsis-Induced Hepatic Dysfunction by Regulating TLR-4/NF-ΚB Signalling Pathway. Life Sci. 2018, 215, 152–158. [Google Scholar] [CrossRef] [PubMed]
  27. Zhang, Guolong; Ghosh, S. Molecular Mechanisms of NF-ΚB Activation Induced by Bacterial Lipopolysaccharide through Toll-like Receptors. J. Endotoxin Res. 2000, 6, 453–457. [Google Scholar] [CrossRef]
  28. Chen, F.; Zou, L.; Williams, B.; Chao, W. Targeting Toll-Like Receptors in Sepsis: From Bench to Clinical Trials. Antioxid. Redox Signal. 2021, 35, 1324–1339. [Google Scholar] [CrossRef] [PubMed]
  29. Brueggeman, J.M.; Zhao, J.; Schank, M.; Yao, Z.Q.; Moorman, J.P. Trained Immunity: An Overview and the Impact on COVID-19. Front. Immunol. 2022, 13, 837524. [Google Scholar] [CrossRef] [PubMed]
  30. Zhao, Y.; Yi, W.; Wan, X.; Wang, J.; Tao, T.; Li, J.; Wang, J.; Deng, X. Blockade of ICAM-1 Improves the Outcome of Polymicrobial Sepsis via Modulating Neutrophil Migration and Reversing Immunosuppression. Mediat. Inflamm. 2014, 2014, 195290. [Google Scholar] [CrossRef] [PubMed]
  31. Sawa, Y.; Ueki, T.; Hata, M.; Iwasawa, K.; Tsuruga, E.; Kojima, H.; Ishikawa, H.; Yoshida, S. LPS-Induced IL-6, IL-8, VCAM-1, and ICAM-1 Expression in Human Lymphatic Endothelium. J. Histochem. Cytochem. 2008, 56, 97–109. [Google Scholar] [CrossRef] [PubMed]
  32. Seeley, J.J.; Ghosh, S. Molecular Mechanisms of Innate Memory and Tolerance to LPS. J. Leukoc. Biol. 2017, 101, 107–119. [Google Scholar] [CrossRef] [PubMed]
  33. Novakovic, B.; Habibi, E.; Wang, S.-Y.; Arts, R.J.W.; Davar, R.; Megchelenbrink, W.; Kim, B.; Kuznetsova, T.; Kox, M.; Zwaag, J.; et al. β-Glucan Reverses the Epigenetic State of LPS-Induced Immunological Tolerance. Cell 2016, 167, 1354–1368.e14. [Google Scholar] [CrossRef] [PubMed]
  34. Cheng, Q.J.; Farrell, K.; Fenn, J.; Ma, Z.; Makanani, S.K.; Siemsen, J. Dectin-1 Ligands Produce Distinct Training Phenotypes in Human Monocytes through Differential Activation of Signaling Networks. Sci. Rep. 2024, 14, 1454. [Google Scholar] [CrossRef] [PubMed]
  35. Hildebrand, F.; Pape, H.-C.; Harwood, P.; Müller, K.; Hoevel, P.; Pütz, C.; Siemann, A.; Krettek, C.; van Griensven, M. Role of Adhesion Molecule ICAM in the Pathogenesis of Polymicrobial Sepsis. Exp. Toxicol. Pathol. 2005, 56, 281–290. [Google Scholar] [CrossRef] [PubMed]
  36. Miao, L.; St Clair, D.K. Regulation of Superoxide Dismutase Genes: Implications in Disease. Free Radic. Biol. Med. 2009, 47, 344–356. [Google Scholar] [CrossRef] [PubMed]
  37. Tao, R.; Vassilopoulos, A.; Parisiadou, L.; Yan, Y.; Gius, D. Regulation of MnSOD Enzymatic Activity by Sirt3 Connects the Mitochondrial Acetylome Signaling Networks to Aging and Carcinogenesis. Antioxid. Redox Signal. 2014, 20, 1646–1654. [Google Scholar] [CrossRef] [PubMed]
  38. Guo, Q.; Jin, Y.; Chen, X.; Ye, X.; Shen, X.; Lin, M.; Zeng, C.; Zhou, T.; Zhang, J. NF-ΚB in Biology and Targeted Therapy: New Insights and Translational Implications. Signal Transduct. Target. Ther. 2024, 9, 53. [Google Scholar] [CrossRef] [PubMed]
  39. Kumar, D. Stress-Dependent NF-ΚB Signaling in Acute Kidney Injury: Linking Inflammation, Autophagy, and Apoptosis. Int. J. Mol. Sci. 2026, 27, 4960. [Google Scholar] [CrossRef] [PubMed]
  40. Zhang, H.; Li, H.; Liu, S.; Zheng, J.; Li, P. Deferoxamine Attenuates Sepsis-Induced Liver Injury by Suppressing Ferroptosis. Immunobiology 2025, 230, 153125. [Google Scholar] [CrossRef] [PubMed]
  41. Benedeto-Stojanov, D.; Ničković, V.P.; Petrović, G.; Rancić, A.; Grgov, I.; Nikolić, G.R.; Marčetić, Z.P.; Popović, M.R.; Lazarević, M.; Mitić, K. V.; et al. Melatonin as a Promising Anti-Inflammatory Agent in an In Vivo Animal Model of Sepsis-Induced Rat Liver Damage. Int. J. Mol. Sci. 2023, 25, 455. [Google Scholar] [CrossRef] [PubMed]
  42. van Griensven, M.; Probst, C.; Müller, K.; Hoevel, P.; Pape, H.-C. LEUKOCYTE-ENDOTHELIAL INTERACTIONS VIA ICAM-1 ARE DETRIMENTAL IN POLYMICROBIAL SEPSIS. Shock 2006, 25, 254–259. [Google Scholar] [CrossRef] [PubMed]
  43. Liu, Y.; Beyer, A.; Aebersold, R. On the Dependency of Cellular Protein Levels on MRNA Abundance. Cell 2016, 165, 535–550. [Google Scholar] [CrossRef] [PubMed]
  44. Jovanovic, M.; Rooney, M.S.; Mertins, P.; Przybylski, D.; Chevrier, N.; Satija, R.; Rodriguez, E.H.; Fields, A.P.; Schwartz, S.; Raychowdhury, R.; et al. Dynamic Profiling of the Protein Life Cycle in Response to Pathogens. Science 2015, 347. [Google Scholar] [CrossRef] [PubMed]
  45. Schwanhäusser, B.; Busse, D.; Li, N.; Dittmar, G.; Schuchhardt, J.; Wolf, J.; Chen, W.; Selbach, M. Global Quantification of Mammalian Gene Expression Control. Nature 2011, 473, 337–342. [Google Scholar] [CrossRef] [PubMed]
  46. Lee, E.-P.; Lin, M.-J.; Wu, H.-P. Time-Serial Expression of Toll-like Receptor 4 Signaling during Polymicrobial Sepsis in Rats. Int. J. Immunopathol. Pharmacol. 2022, 36, 3946320221090021. [Google Scholar] [CrossRef] [PubMed]
  47. Pereira, M.; Gazzinelli, R.T. Regulation of Innate Immune Signaling by IRAK Proteins. Front. Immunol. 2023, 14. [Google Scholar] [CrossRef] [PubMed]
  48. Li, X.; Li, X.; Huang, P.; Zhang, F.; Du, J.K.; Kong, Y.; Shao, Z.; Wu, X.; Fan, W.; Tao, H.; et al. Acetylation of TIR Domains in the TLR4-Mal-MyD88 Complex Regulates Immune Responses in Sepsis. EMBO J. 2024, 43, 9. [Google Scholar] [CrossRef] [PubMed]
  49. Wu, G.-J.; Lin, Y.-W.; Chuang, C.-Y.; Tsai, H.-C.; Chen, R.-M. Liver Nitrosation and Inflammation in Septic Rats Were Suppressed by Propofol via Downregulating TLR4/NF-ΚB-Mediated INOS and IL-6 Gene Expressions. Life Sci. 2018, 195, 25–32. [Google Scholar] [CrossRef] [PubMed]
  50. Aguilar, M.G.; AlHussen, H.A.; Gandhi, P.D.; Kaur, P.; Pothacamuri, M.A.; Talikoti, M.A.H.; Avula, N.; Shekhawat, P.; Silva, A.B.; Kaur, A.; et al. Sepsis-Associated Acute Kidney Injury: Pathophysiology and Treatment Modalities. Cureus 2024. [Google Scholar] [CrossRef] [PubMed]
  51. Liu, A.-B.; Tan, B.; Yang, P.; Tian, N.; Li, J.-K.; Wang, S.-C.; Yang, L.-S.; Ma, L.; Zhang, J.-F. The Role of Inflammatory Response and Metabolic Reprogramming in Sepsis-Associated Acute Kidney Injury: Mechanistic Insights and Therapeutic Potential. Front. Immunol. 2024, 15. [Google Scholar] [CrossRef] [PubMed]
  52. Sahoo, D.K.; Wong, D.; Patani, A.; Paital, B.; Yadav, V.K.; Patel, A.; Jergens, A.E. Exploring the Role of Antioxidants in Sepsis-Associated Oxidative Stress: A Comprehensive Review. Front. Cell. Infect. Microbiol. 2024, 14. [Google Scholar] [CrossRef] [PubMed]
  53. Rashid, H.; Jali, A.; Akhter, M.S.; Abdi, S.A.H. Molecular Mechanisms of Oxidative Stress in Acute Kidney Injury: Targeting the Loci by Resveratrol. Int. J. Mol. Sci. 2023, 25, 3. [Google Scholar] [CrossRef] [PubMed]
  54. Netea, M.G.; Joosten, L.A.B.; Latz, E.; Mills, K.H.G.; Natoli, G.; Stunnenberg, H.G.; O’Neill, L.A.J.; Xavier, R.J. Trained Immunity: A Program of Innate Immune Memory in Health and Disease. Science 2016, 352. [Google Scholar] [CrossRef] [PubMed]
  55. Cortes-Perez, N.G.; de Moreno de LeBlanc, A.; Gomez-Gutierrez, J.G.; LeBlanc, J.G.; Bermúdez-Humarán, L.G. Probiotics and Trained Immunity. Biomolecules 2021, 11. [Google Scholar] [CrossRef] [PubMed]
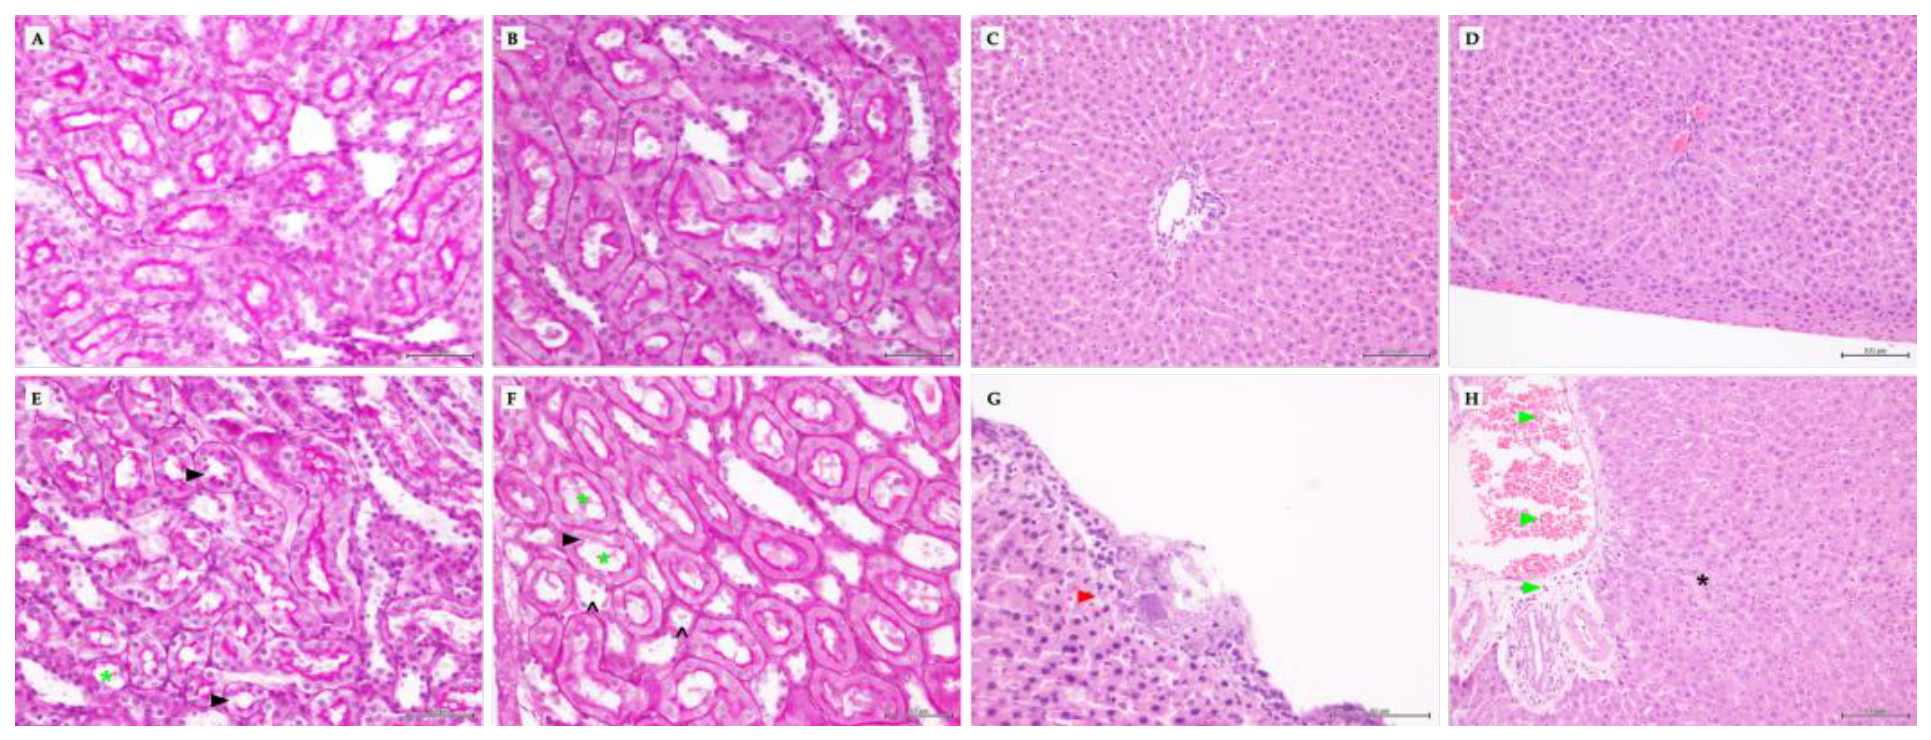
Figure 1. Representative histological images of kidney stained with PAS and liver stained with haematoxylin and eosin from healthy and septic rats. (A, B) Kidney sections from healthy control (SAN) and healthy treated (STO) animals, respectively; (C, D) liver sections from SAN and STO animals, respectively. No evident histopathological alterations were observed in healthy animals. (E, F) Kidney sections from septic control (IC) and septic treated (IA) animals, respectively; (G, H) liver sections from IC and IA animals, respectively. Black arrowheads indicate loss of the brush border; green asterisks indicate tubular atrophy; open arrowheads indicate cast formation; green arrowheads indicate intravascular lymphocyte and perivascular lymphocyte infiltration; the black asterisk indicates an area of hepatocyte degeneration; and the red arrow indicates the presence of subcapsular bacteria (only IC group). Images A, B, E, F, and G were acquired using a 40X objective, whereas images C, D, and H were acquired using a 20X objective. Scale bars are shown in each panel.
Preprints 237675 g001
Figure 2. Liver relative mRNA expression of genes from control rats (SAN) and A12C-treated healthy rats (STO). Data are represented as box-and-whisker plots showing the median and interquartile range, with individual values overlaid. Significant differences between groups are indicated by p-values above the corresponding comparisons.
Preprints 237675 g002
Figure 3. Liver relative mRNA expression of genes from septic rats (IC) and septic A12-treated rats (IA). Data are represented as box-and-whisker plots showing the median and interquartile range, with individual values overlaid. Significant differences between groups are indicated by p-values above the corresponding comparisons.
Preprints 237675 g003
Figure 4. Normalized liver protein abundance in arbitrary units (AU) of TLR4, NF-κB p65, CCL2, ICAM1, SOD1 and SOD2 in control (SAN) and A12C-treated (STO) rats. Proteins were determined by Western blotting and normalized to total protein loading. Significant differences between groups are indicated by p-values above the corresponding comparisons.
Preprints 237675 g004
Figure 5. Normalized liver protein abundance in arbitrary units (AU) of TLR4, NF-κB p65, CCL2, ICAM1, SOD1 and SOD2 in septic control (IC) and A12C-treated septic (IA) rats. Proteins were determined by Western blotting and normalized to total protein loading. Significant differences between groups are indicated by p-values above the corresponding comparisons.
Preprints 237675 g005
Figure 6. Hepatic antioxidant enzymatic activity in healthy rats. Antioxidant enzyme activities of superoxide dismutase (SOD; pKat/mg protein), catalase (CAT; mK/mg protein), glutathione peroxidase (GPx; nmol/s/mg protein) and glutathione reductase (GRd; nmol/min/mg protein) in liver samples from control rats (SAN) and healthy A12C-treated rats (STO).
Preprints 237675 g006
Figure 7. Hepatic antioxidant enzymatic activity in septic rats. Antioxidant enzyme activities of superoxide dismutase (SOD; pKat/mg protein), catalase (CAT; mK/mg protein), glutathione peroxidase (GPx; nmol/s/mg protein) and glutathione reductase (GRd; nmol/min/mg protein) in liver samples from septic rats (IC) and septic A12C-treated rats (IA).
Preprints 237675 g007
Figure 8. Kidney relative mRNA expression of genes from control rats (SAN) and A12C-treated healthy rats (STO). Data are represented as box-and-whisker plots showing the median and interquartile range, with individual values overlaid. Significant differences between groups are indicated by p-values above the corresponding comparisons.
Preprints 237675 g008
Figure 9. Kidney relative mRNA expression of genes from septic rats (IC) and septic A12C-treated rats (IA). Data are represented as box-and-whisker plots showing the median and interquartile range, with individual values overlaid. Significant differences between groups are indicated by p-values above the corresponding comparisons.
Preprints 237675 g009
Figure 10. Kidney normalized protein abundance in arbitrary units (AU) of ICAM-1, SOD1, and SOD2 in control (SAN) and A12C-treated (STO) rats. Protein abundance was determined by Western blotting and normalized to total protein loading.
Preprints 237675 g010
Figure 11. Kidney normalized protein abundance in arbitrary units (AU) of ICAM-1, SOD1, and SOD2 in septic control (IC) and A12C-treated septic (IA) rats. Protein abundance was determined by Western blotting and normalized to total protein loading.
Preprints 237675 g011
Figure 12. Renal antioxidant enzymatic activity in healthy rats. Antioxidant enzyme activities of superoxide dismutase (SOD; pKat/mg protein), catalase (CAT; mK/mg protein), glutathione peroxidase (GPx; nmol/s/mg protein) and glutathione reductase (GRd; nmol/min/mg protein) in kidney samples from healthy rats (IC) and healthy A12C-treated rats (IA). Significant differences between groups are indicated by p-values above the corresponding comparisons.
Preprints 237675 g012
Figure 13. Renal antioxidant enzymatic activity in septic rats. Antioxidant enzyme activities of superoxide dismutase (SOD; pKat/mg protein), catalase (CAT; mK/mg protein), glutathione peroxidase (GPx; nmol/s/mg protein) and glutathione reductase (GRd; nmol/min/mg protein) in kidney samples from septic control rats (IC) and septic A12C-treated rats (IA). Significant differences between groups are indicated by p-values above the corresponding comparisons.
Preprints 237675 g013
Table 1. Criteria for assessing animal welfare and humane end point.
Clinical signs
1. Ruffled fur
2. Weight loss
3. Ocular discharge
4. Lethargy
5. Hunched posture

6. Ataxia
7. Tremor
8. Hypothermia
9. Cyanosis
Conditions Suggested action
1-6 Assessment of analgesia
5+6 (or 7 or 8 or 9) Euthanasia
Adapted from Acred et al. [17].
Table 2. Primer sequences used for quantitative real-time PCR analysis.
Gene Forward primer Reverse primer
Gapdh 5'-GCAAGAGAGAGGCCCTCAG-3' 5'-TGTGAGGGAGATGCTCAGTG-3'
Tlr4 5'-TATAAAACATAAGGAGAGGAGG-3' 5'-ATAGAAAAAGGGAAAGGAAGGA-3'
Rela (NF-κB p65) 5'-ACGATCTGTTTCCCCTCATCT-3' 5'-TGCTTCTCTCCCCAGGAATA-3'
Tnf 5'-CTCACACTCAGATCATCTTC-3' 5'- GAGAACCTGGGAGTAGATAAG -3'
Il1b 5'-TAAGCCAACAAGTGGTATTC-3' 5'-AGGTATAGATTCTTCCCCTTG-3'
Icam1 5'-CCAGCCCCTAATCTGACCT-3' 5'-CTAAAGGCACGGCACTTGT-3'
Nlrp3 5'-GAGCTGGACCTCAGTGACAATGC-3' 5'-ACCAATGCGAGATCCTGACAACAC-3'
Ccl2 5'-GAAGCTGTAGTATTTGTCACC -3' 5'-TTCTAATGTACTTCTGGACCC-3'
Il6 5'-CAGAGTCATTCAGAGCAATAC-3' 5'-CTTTCAAGATGAGTTGGATGG-3'
Nos2 (iNOS) 5'-AGCCGTAACAAAGGAAATAG-3' 5'-ATGCTGGAACATTTCTGATG-3'
Gpx1 5'-TGAGAAGTGCGAGGTGAATG-3' 5'-CGGGGACCAAATGATGTACT-3'
Il10 5'-TCTCCCCTGTGAGAATAAAAG-3' 5'-TAGACACCTTTGTCTTGGAG-3'
Tgfb1 5'-GGAAATCAATGGGATCAGTC-3' 5'-CTGAAGCAGTAGTTGGTATC-3'
Table 3. Primary antibodies used for Western blot analysis.
Protein Host Dilution Supplier Cat.no.
TLR4 Mouse 1:200 Santa Cruz Biotechnology, USA sc-293072
RELA (NF-κB p65) Mouse 1:500 Chemicon®, Merck Millipore, USA MAB3026
ICAM1 Mouse 1:250 Invitrogen™, Thermo Fisher Scientific, USA 11844311
CCL2 Mouse 1:1000 Invitrogen™, Thermo Fisher Scientific, USA 15342290
SOD1 Rabbit 1:1000 Enzo Life Sciences, USA ADI-SOD-100-D
SOD2 Rabbit 1:1000 Enzo Life Sciences, USA ADI-SOD-110-D
Disclaimer/Publisher’s Note: The statements, opinions and data contained in all publications are solely those of the individual author(s) and contributor(s) and not of MDPI and/or the editor(s). MDPI and/or the editor(s) disclaim responsibility for any injury to people or property resulting from any ideas, methods, instructions or products referred to in the content.
Copyright: This open access article is published under a Creative Commons CC BY 4.0 license, which permit the free download, distribution, and reuse, provided that the author and preprint are cited in any reuse.