

Submitted:
10 October 2026
Posted:
13 October 2026
You are already at the latest version
Abstract
Background/Objectives: Fibromyalgia is a chronic, symptom-defined condition whose recognition and management depend on sustained access to care. Recorded utilization during crises may therefore reflect disrupted access, diagnostic recognition, and longitudinal engagement rather than disease burden. Since 2019, Lebanon has experienced overlapping financial deterioration, the COVID-19 pandemic, the Beirut port explosion, and armed conflict. We characterized recorded fibromyalgia utilization and continuity across these six years. Methods: This retrospective cohort study analyzed all outpatient encounters with fibromyalgia as the primary diagnosis in electronic health records of the American University of Beirut Medical Center, January 2019–December 2024. Monthly encounter volume was the primary utilization outcome. Recorded continuity was evaluated as time from each patient’s index encounter to a subsequent fibromyalgia-coded encounter, with 180-day return as the principal measure. Results: We identified 4,969 encounters from 3,237 patients (87.5% female; mean age, 46.7 years). Monthly encounter volume fell around the 2019 financial and banking disruption and remained below the preceding nine-month level (84.3 vs. 66.8 encounters/month; rate ratio, 0.76; 95% CI, 0.61–0.94), with a further exploratory reduction in mid-2024. The 180-day probability of a subsequent encounter declined from 22.8% in the 2019 cohort to 15.6% in 2024 (hazard ratio, 0.59; 95% CI, 0.45–0.76); lower return rates emerged from the 2022 cohort onward. Conclusions: Recorded fibromyalgia utilization and longitudinal engagement changed at different times during Lebanon’s compounding crises. These findings describe recorded care, not disease occurrence: recovering patient numbers may coexist with persistently impaired longitudinal engagement, so aggregate utilization alone incompletely measures recovery for continuity-dependent chronic conditions.
Keywords:
fibromyalgia
; continuity of care
; healthcare utilization
; health-system resilience
; electronic health records
; economic crisis
; armed conflict
; Lebanon
1. Introduction
Fibromyalgia is a chronic condition characterized by widespread pain accompanied by fatigue, sleep disturbance, cognitive symptoms, and variable functional impairment. Its diagnosis is clinical and symptom based, with no laboratory, imaging, or other biomarker that independently establishes the condition [1,2]. This characteristic has important implications for both epidemiology and healthcare delivery. Estimates of fibromyalgia frequency vary substantially according to the diagnostic or classification criteria applied, while recognition in routine practice depends on patients reaching appropriate clinical services and clinicians identifying the characteristic symptom complex [1,2,3,4]. Consequently, the number of fibromyalgia diagnoses or encounters recorded within a healthcare system should not be interpreted as a direct measure of disease occurrence.
Fibromyalgia is also particularly dependent on longitudinal clinical care. Diagnostic recognition may be delayed, and management generally requires repeated assessment, patient education, exercise and other nonpharmacological interventions, with psychological, pharmacological, and multimodal approaches individualized according to symptoms and functional impact [5,6,7]. EULAR recommendations emphasize a graduated, patient-centered strategy beginning with education and nonpharmacological management rather than procedure-based care [7]. Sustained access to care and longitudinal clinical engagement are therefore important components of fibromyalgia management. This distinction becomes particularly relevant when routinely collected health records are used to study populations exposed to major healthcare-system disruption: a reduction in recorded encounters may reflect changes in healthcare seeking, diagnostic recognition, access, coding, continuity, or some combination of these processes, rather than a change in the underlying occurrence of fibromyalgia.
Lebanon provides an unusual setting in which to examine this distinction. Since 2019, its healthcare system has operated through a succession of overlapping disruptions affecting healthcare financing, workforce capacity, medication availability and affordability, and outpatient service delivery. The economic and financial deterioration beginning in 2019 was followed by the COVID-19 pandemic in early 2020 and the Beirut port explosion in August 2020, while subsequent years were characterized by persistent constraints on healthcare resources, substantial medication shortages, loss of purchasing power, and migration of healthcare professionals [8,9,10,11,12]. More recently, armed conflict imposed additional demands on healthcare delivery. In the present study, these events are considered not as causal exposures in themselves but as temporally identifiable components of a prolonged period of healthcare-system strain. Similar disruptions have been observed internationally: a systematic review encompassing 20 countries documented substantial reductions in healthcare utilization during the COVID-19 pandemic, while contemporary health-system resilience frameworks emphasize that acute shocks and prolonged structural stressors may affect service delivery through different mechanisms and over different timescales [13,14].
This setting creates an important health-services question. For a chronic condition such as fibromyalgia, the number of patients appearing in recorded care and the ability to sustain longitudinal clinical contact represent related but distinct dimensions of service performance. Acute disruption may transiently reduce outpatient attendance, whereas prolonged constraints affecting workforce, affordability, referral pathways, and service capacity may be accompanied by changes in longitudinal engagement even after aggregate attendance begins to recover. Electronic health records cannot determine whether changes in recorded fibromyalgia care reflect changes in the underlying population burden of the condition; they can, however, characterize when and how recorded interactions between patients and healthcare services change. Distinguishing recorded institutional reach, defined here as the extent to which patients appear in recorded outpatient care, from recorded continuity, defined as subsequent fibromyalgia-coded contact within the institution, may therefore provide information not captured by encounter volume alone.
Accordingly, this study examined fibromyalgia care at a major academic medical center in Beirut over the six-year period from 2019 through 2024. The primary objectives were to characterize longitudinal changes in fibromyalgia-coded outpatient encounter volume and to evaluate recorded continuity through subsequent fibromyalgia-coded encounters after each patient’s index encounter within the observation window. We further examined whether the temporal patterns of these two dimensions of recorded care aligned with successive periods of healthcare-system disruption. Because the data derive from routinely collected electronic health records (EHRs), the study was designed to evaluate patterns of recorded healthcare utilization and longitudinal engagement rather than fibromyalgia incidence, prevalence, unmet healthcare need, or complete healthcare access.
2. Materials and Methods
2.1. Study Design and Setting
This retrospective longitudinal cohort study used routinely collected EHR data from the American University of Beirut Medical Center (AUBMC), a major academic medical center in Beirut, Lebanon. The study examined outpatient fibromyalgia-coded healthcare activity over the six-year period from January 1, 2019, through December 31, 2024.
The study was designed around two complementary dimensions of recorded healthcare delivery. Recorded institutional reach represented the extent to which patients with fibromyalgia appeared in outpatient care at AUBMC, whereas recorded continuity represented whether patients subsequently returned for fibromyalgia-coded care after their first observed encounter within the study period. The latter should be understood as an EHR-observable measure of longitudinal engagement and not as a complete measure of the broader construct of continuity of care. Neither construct should be interpreted as a direct measure of disease incidence, prevalence, healthcare need, unmet need, or complete healthcare access.
2.2. Data Source and Identification of Fibromyalgia-Coded Encounters
All outpatient encounters recorded in the institutional Epic EHR with fibromyalgia listed as the primary diagnosis between January 1, 2019, and December 31, 2024, were eligible for analysis. The data extract was generated retrospectively, after Institutional Review Board approval, and contained additional encounters recorded after December 31, 2024; these were excluded a priori to preserve six complete calendar years of observation.
Fibromyalgia diagnoses were entered during routine clinical care by treating physicians. The EHR extract did not specify which diagnostic or classification criteria had been applied, and case status could not be independently adjudicated. Accordingly, throughout this study, an EHR record carrying fibromyalgia as the primary diagnosis is termed a fibromyalgia-coded encounter. Neither the presence of such a code nor its first occurrence during the observation window was assumed to establish the date of disease onset or initial clinical diagnosis.
Each encounter record included the visit date, de-identified medical record number, encounter number, clinical department, sex, and age at the time of the encounter. No information was available on socioeconomic status, insurance coverage, residence, clinical severity, treatment, medication use, reason for non-return, encounters occurring outside AUBMC, or encounters in which fibromyalgia was recorded only as a secondary diagnosis.
2.3. Units of Analysis and Index Encounter
Analyses were conducted at two distinct levels. Encounter-level analyses evaluated outpatient healthcare activity over calendar time, whereas patient-level analyses evaluated longitudinal return to recorded care. These analytical levels were kept separate.
For patient-level analyses, each individual was identified through a stable de-identified medical record number and contributed once to the cohort. The index encounter was defined as the patient’s earliest fibromyalgia-coded outpatient encounter observed between January 1, 2019, and December 31, 2024. Because observation began on January 1, 2019, this index encounter does not necessarily represent the patient’s first clinical diagnosis or first-ever fibromyalgia encounter.
The index-encounter cohort and healthcare-system phase were assigned according to the date of this encounter. The entry department was defined as the department responsible for the index encounter. When encounters in more than one department occurred on the same index date, the rheumatology encounter was designated as the entry encounter because rheumatology was the principal specialty managing fibromyalgia within the dataset.
The 31 represented departments were grouped into five prespecified clinical categories: rheumatology; neurology and neurosurgery; primary care and internal medicine; psychiatry; and other specialties. The primary care and internal medicine category included family medicine, internal medicine, geriatrics, and university health and wellness services; the remaining categories were grouped according to their corresponding institutional specialty services.
2.4. Outcomes: Recorded Institutional Reach and Recorded Continuity
The two principal outcomes were selected to represent complementary dimensions of healthcare delivery.
Recorded institutional reach was evaluated primarily through the monthly number of fibromyalgia-coded outpatient encounters. Annual numbers of distinct patients were examined as a complementary patient-level measure of the population appearing in recorded care at AUBMC. These measures quantify recorded institutional contact rather than population access or unmet healthcare need; patients with fibromyalgia who did not attend AUBMC, received care elsewhere, or attended AUBMC without fibromyalgia coded as the primary diagnosis were not observable through this definition.
Recorded continuity was evaluated as return for a subsequent fibromyalgia-coded outpatient encounter after the index encounter. A return was defined as any eligible encounter occurring on a later calendar day in any included department. Additional encounters occurring on the index date were not considered returns.
Time to return was measured from each patient’s index date. Patients without a subsequent eligible encounter were administratively censored on December 31, 2024.
Return was summarized at fixed horizons of 180, 364, and 730 days. The 180-day horizon was designated as the principal fixed-horizon measure of recorded continuity, providing a common and clinically interpretable interval for early longitudinal follow-up across cohorts. The 364- and 730-day horizons were considered supportive measures of longer-term recorded engagement. The 364-day horizon was chosen because the earliest 2024 index encounter occurred on January 2 and the dataset closed on December 31, 2024. Importantly, although Kaplan–Meier estimation permits estimation to this horizon, progressively fewer members of the 2024 cohort contributed information toward the later portion of the survival curve. The 730-day horizon was reported only for cohorts with sufficient potential follow-up to support estimation.
Fixed horizons were used because available follow-up differed systematically according to index date. Using each patient’s entire observed follow-up would necessarily provide earlier cohorts with substantially greater opportunity to experience a return encounter. Kaplan–Meier estimation was therefore used consistently for cohort, subgroup, and healthcare-system-phase estimates to account for administrative censoring.
Follow-up intensity was similarly evaluated within a fixed first-year window among patients with sufficient potential observation rather than as a crude number of visits per person-year. This approach was chosen because outpatient encounters clustered relatively early after the index encounter; crude person-time rates would therefore compare cohorts contributing different proportions of early high-intensity and later low-intensity follow-up.
2.5. Left Truncation and Interpretation of Index Encounters
Counts of index encounters were summarized descriptively but were not used to estimate temporal changes in fibromyalgia incidence. Because the EHR observation window begins on January 1, 2019, patients with established fibromyalgia who had been treated before that date but attended during 2019 necessarily appear as new to the observable dataset. The early portion of the series therefore contains an artificially enlarged pool of index encounters that progressively diminishes as prevalent patients first appear within the observation window.
Conversely, subsequent encounters accumulate as patients already identified within the dataset return for care. These opposing processes make index-encounter counts unsuitable for estimating incidence or changes in diagnostic occurrence.
For this reason, total monthly fibromyalgia-coded encounter volume, rather than the number of index encounters, was selected as the primary measure of recorded institutional reach. Estimation of incident fibromyalgia would require a substantially longer pre-2019 observation period and an appropriate washout interval sufficient to distinguish newly diagnosed from prevalent disease.
2.6. Contextual Measures of Outpatient Activity
To place fibromyalgia-coded activity within broader institutional utilization, annual counts of all outpatient encounters and department-specific outpatient encounters from 2019 through 2024 were obtained from the AUBMC outpatient activity dashboard.
Total outpatient activity was compared descriptively with annual fibromyalgia-coded encounter volume and numbers of distinct fibromyalgia patients. Department-specific denominators were additionally used to express fibromyalgia-coded encounters as annual counts per 10,000 outpatient encounters within the corresponding department group. Because these institutional denominators were available only annually, they could not be incorporated into the monthly interrupted time-series analyses.
2.7. Statistical Analysis
2.7.1. Analysis of Recorded Institutional Reach
Monthly fibromyalgia-coded encounter counts were modeled using Poisson regression including a linear calendar-time term and an offset for the number of days in each month. Because the monthly series showed both overdispersion (Pearson χ²/df = 3.9) and positive serial correlation (lag-1 residual correlation, 0.40; Durbin–Watson statistic, 1.20; Ljung–Box p < 0.001), inference used heteroskedasticity- and autocorrelation-consistent Newey–West standard errors with a four-month lag.
The principal segmented count analysis estimated an immediate level change associated with the prespecified October 2019 interruption month. Interrupted time-series methods can provide useful quasi-experimental estimates when population-level exposures or interventions occur at identifiable time points, but valid interpretation requires adequate characterization of the preinterruption trajectory and appropriate treatment of autocorrelation [17,18].
Only nine monthly observations preceded the October 2019 interruption. Consequently, the study could not reliably estimate a separate preinterruption slope or construct a conventional projected counterfactual based on a well-characterized stable preintervention trend. The primary analysis was therefore deliberately restricted to estimation of a level shift within the available monthly series. It should consequently be interpreted as a model-based level difference associated with the prespecified interruption month rather than as a fully specified interrupted time-series estimate of a causal intervention effect.
Three clinically and temporally plausible monthly cutpoints were examined: September 2019, October 2019, and November 2019, corresponding broadly to the emergence and intensification of financial and banking disruption and the subsequent continuation of restrictions. October 2019 constituted the primary interruption month; the adjacent monthly cutpoints were examined as sensitivity analyses. Specific national events occurring within these months were retained as contextual annotations but were not treated as day-level statistical interruption points.
Model robustness was evaluated using Newey–West lags of three, six, and eight months and maximum-likelihood negative-binomial, quasi-Poisson, and conventional Poisson specifications. An exploratory cutpoint scan was additionally performed by refitting the same level-change model at each eligible monthly cutpoint and ranking the resulting effect estimates. This analysis was explicitly considered exploratory rather than confirmatory and was used to assess whether sustained changes of similar or greater magnitude were present elsewhere in the series. A second sustained reduction identified in mid-2024 was therefore included only in a post hoc two-step sensitivity model and was not incorporated into the prespecified primary model.
Annual trends were examined separately from the monthly series. The yearly number of fibromyalgia-coded encounters and the yearly number of distinct patients seen were each modeled by overdispersed Poisson regression on calendar year. For the analyses expressed as a share of institution-wide activity, the logarithm of total outpatient visits in the same year was entered as an offset; for the analysis of the distinct-patient count itself no offset was applied. Coefficients are reported as the proportional change per year. These models rest on six annual observations and four residual degrees of freedom, so they have little power and the corresponding confidence intervals are correspondingly wide. The absence of a significant annual trend should therefore be read as an uninformative result rather than as evidence that the series was stable.
2.7.2. Analysis of Recorded Continuity
Time from the index encounter to the first subsequent fibromyalgia-coded encounter was analyzed using Kaplan–Meier methods, with overall differences evaluated using log-rank tests. The estimated probability of a subsequent encounter by 180 days was the principal fixed-horizon measure of recorded continuity.
Cox proportional hazards regression was used to estimate hazard ratios (HRs) and 95% confidence intervals for return to recorded care, initially unadjusted and subsequently adjusted for age at the index encounter and sex. HRs below 1 indicate a lower instantaneous rate of returning for a subsequent fibromyalgia-coded encounter. The proportional-hazards assumption was evaluated for each reported Cox model, tested on Kaplan–Meier-transformed time. When evidence against proportionality was present, the HR was interpreted as an average relative effect over the observed follow-up rather than as a constant effect over time, and analyses restricted to the first 365 days were used as sensitivity analyses.
Because reliance on the HR may be problematic when proportional hazards do not hold, restricted mean time without return was additionally calculated as the area under the estimated survival curve to prespecified time horizons [19,20]. It was estimated through 180 days for all cohorts and through 364 days where estimable, with 95% confidence intervals obtained from 2,000 bootstrap resamples. Higher values indicate a longer average period without a subsequent recorded fibromyalgia encounter and therefore lower recorded longitudinal engagement. Estimates at 364 days for later cohorts, particularly 2024, were interpreted cautiously because progressively fewer patients contributed information toward the end of the observation horizon.
Pairwise cohort comparisons were adjusted using the Holm procedure. Healthcare-system phase was also modeled as a time-varying covariate by splitting each patient’s follow-up at phase boundaries, thereby assigning each follow-up interval to the phase in effect during that interval.
Patients younger than 18 years at the index encounter were retained in the primary cohort because they were present in the clinical dataset; all principal analyses were repeated after their exclusion as a sensitivity analysis.
Importantly, recorded institutional reach and recorded continuity were not placed on a common numerical scale or compared formally in effect magnitude. Encounter volume is measured in calendar time at the service level, whereas return is a patient-level time-to-event outcome whose time origin is each individual’s index encounter. Their temporal patterns can therefore be compared descriptively, but their effect estimates are not directly commensurable.
2.7.3. Calendar-Window Analyses and Multiplicity
To complement the primary segmented count analysis, encounter volume was compared across matched calendar windows: January through September, corresponding to the nine months preceding the primary October 2019 interruption, and October through December.
Seasonality was assessed by adding month-of-year indicators to the count model and evaluating them using a quasi-likelihood F test. There was no evidence of seasonality (F₁₁,₅₈ = 0.65; p = 0.78), and no seasonal adjustment was therefore included in the primary model.
Because several families of volume comparisons were examined, including matched calendar windows, national-event windows, and exploratory cutpoint analyses, multiplicity was addressed within each analytical family using both the Holm procedure for family-wise error control and the Benjamini–Hochberg procedure for false-discovery-rate control. A pooled correction across volume comparisons was additionally reported as a sensitivity analysis.
The shorter calendar, event, and healthcare-system-phase windows contained too few monthly observations to support reliable HAC estimation. These comparisons were therefore evaluated using quasi-Poisson models to accommodate overdispersion. Because these models do not account for residual serial correlation, the resulting confidence intervals may be anti-conservative and were interpreted cautiously.
For matched-window encounter counts, confidence intervals were estimated from overdispersed Poisson models of monthly counts. For distinct-patient counts, Poisson intervals were widened using an overdispersion scale of 3.43 estimated from the monthly distinct-patient series. Because the number of distinct patients within a multi-month window is not the sum of monthly distinct-patient counts, these intervals were considered approximate.
2.7.4. Healthcare-System Phases
Six healthcare-system periods were defined a priori from the chronology of major disruptions relevant to healthcare delivery: pre-crisis (January–September 2019); banking and financial disruption (October 2019–February 2020); COVID-19 and sovereign default (March–July 2020); port explosion and subsequent economic deterioration (August 2020–December 2021); prolonged economic contraction (January 2022–September 2023); and armed-conflict period (October 2023–December 2024).
These labels were used exclusively as temporal descriptors of healthcare-system conditions rather than as causal exposures. Five boundaries corresponded to identifiable national events documented in the source literature. The January 2022 boundary did not represent a discrete event but was used to distinguish the preceding period of successive acute disruptions from the subsequent period of sustained economic and healthcare-system constraint. Accordingly, analyses across these periods were intended to assess temporal alignment and should not be interpreted as attributing observed changes in recorded institutional reach or continuity to any particular political, economic, pandemic, disaster-related, or military event.
All analyses were performed in Python using statsmodels and lifelines. Statistical tests were two-sided, with p < 0.05 considered statistically significant before multiplicity adjustment where applicable. Effect estimates are reported with 95% confidence intervals.
2.8. Ethics
The study was approved by the Institutional Review Board of the American University of Beirut (protocol code BIO-2025-0164, approved on 1 July 2025). Data were extracted and analyzed in de-identified form. Patients were represented only by coded medical record numbers, and no individually identifiable information was included in the analytical dataset or reported results.
3. Results
Two dimensions of recorded care are distinguished throughout the Results: recorded institutional reach, comprising the volume of fibromyalgia-coded encounters and the number of distinct patients seen at AUBMC, and recorded continuity, defined as the occurrence of a subsequent fibromyalgia-coded encounter after the index encounter. Figure 1 places these two observable outcomes within the wider sequence of processes linking population disease burden to recorded healthcare activity and identifies which components could and could not be observed in the present dataset.
3.1. Study Population and Recorded Fibromyalgia Care
The analytic dataset comprised 4,969 outpatient encounters carrying fibromyalgia as the primary diagnosis, recorded between January 2, 2019, and December 30, 2024, across 31 clinical departments at AUBMC. These encounters were generated by 3,237 distinct patients identified through de-identified medical record numbers. The original data extract also contained 266 encounters recorded after December 31, 2024; these were excluded to preserve a prespecified six-year observation window comprising the 72 complete calendar months from January 1, 2019, through December 31, 2024.
Patients were predominantly female (2,832/3,237; 87.5%), with a mean age at the index fibromyalgia-coded encounter of 46.7 years (SD, 13.4; range, 12–91 years). Rheumatology accounted for 2,896 encounters (58.3%), the neuroscience outpatient center for 684 (13.8%), and internal medicine outpatient clinics for 513 (10.3%). Twenty-seven patients were younger than 18 years at their index encounter and contributed 38 encounters; exclusion of these patients did not materially alter any principal estimate.
On 21 dates, a patient had more than one fibromyalgia-coded encounter recorded on the same calendar day, most commonly in two different clinics; in 12 instances this occurred on the index date. In accordance with the prespecified definition, same-day encounters did not constitute evidence of subsequent continuity. Across the six-year period, 224 patients (6.9%) had fibromyalgia-coded encounters in more than one of the 31 represented departments. Overall, 966 patients had a subsequent recorded fibromyalgia encounter and 2,271 (70.2%) did not. This crude proportion is reported descriptively and should not be interpreted as a time-standardized continuity estimate because available follow-up differed substantially according to index date.
Patient characteristics at the index encounter remained broadly similar across calendar-year cohorts (Table 1). The proportion of women ranged from 84.7% to 90.8%, and mean age ranged from 45.4 to 47.5 years. Neither age nor sex distribution differed significantly across cohorts (Kruskal–Wallis p = 0.29 for age; χ² p = 0.17 for age categories; χ² p = 0.09 for sex). Thus, the observed temporal changes in recorded fibromyalgia care were not accompanied by major shifts in the measured demographic composition of patients appearing in care.
3.2. Recorded Institutional Reach and Encounter Volume
Annual fibromyalgia-coded encounter volume was highest in 2019 and remained below that level in each subsequent year (Table 2, Panel A). Mean monthly encounter volume was 78.1 in 2019, decreased to 58.0 in 2020, increased to 75.8 in 2021, and subsequently ranged from 64.6 to 70.1 encounters per month (Figure 2).
The encounter series comprised both patients appearing for the first time within the observation window and subsequent fibromyalgia-coded visits. These components behaved differently near the beginning of the dataset because the observation window opened on January 1, 2019. During the first nine months of 2019, total monthly encounter volume showed no detectable trend (−1.0% per month; 95% CI, −3.2% to +1.3%; p = 0.39). In contrast, the number of index encounters declined by 4.0% per month (95% CI, −6.1% to −1.8%; p < 0.001), while subsequent encounters increased by 10.8% per month (95% CI, +2.9% to +19.2%; p = 0.006). The mean monthly number of index encounters declined from 73.3 during the first quarter of 2019 to 40.7 during the fourth quarter and averaged 42.0 per month from 2020 through 2024. Because this decline began before the October 2019 interruption and is consistent with depletion of the prevalent case pool generated by left truncation, it cannot be reliably attributed to subsequent healthcare-system disruptions. Index-encounter counts were therefore not used as an incidence measure.
Matched calendar-window analyses are shown in Table 2, Panels B1 and B2. Compared with January–September 2019, fibromyalgia-coded encounter volume was lower during the corresponding nine-month period in every subsequent year, significantly so in all years except 2021 (−8.6%; 95% CI, −23.7% to +9.5%). The largest reduction occurred in 2020 (−34.4%; 95% CI, −45.8% to −21.1%), whereas the difference narrowed to −14.1% (95% CI, −23.7% to −4.0%) in 2024. After correction for the 10 matched-window comparisons, the 2020 and 2022 January–September differences remained significant under Holm correction, whereas the 2023 and 2024 differences met the Benjamini–Hochberg false-discovery-rate criterion only.
The corresponding number of distinct patients with at least one recorded fibromyalgia encounter, used here as a measure of recorded institutional reach, also declined initially but recovered more substantially than encounter volume. During January–September 2024, 548 distinct patients were seen, 7.6% fewer than during the corresponding period in 2019, compared with a 14.1% reduction in encounters.
Panel B1. January–September matched windows
| Panel B1. Jan–Sep | Encounters | Change vs 2019 (95% CI) | Survives correction | Distinct patients | Change vs 2019 (95% CI) |
| 2019 | 759 | — | — | 593 | — |
| 2020 | 498 | −34.4% (−45.8 to −21.1) | Holm | 390 | −34.2% (−48.1 to −16.7) |
| 2021 | 694 | −8.6% (−23.7 to +9.5) | — | 529 | −10.8% (−28.2 to +10.9) |
| 2022 | 586 | −22.8% (−34.3 to −9.3) | Holm | 473 | −20.2% (−36.2 to −0.2) |
| 2023 | 653 | −14.0% (−22.8 to −4.1) | BH | 544 | −8.3% (−26.1 to +13.8) |
| 2024 | 652 | −14.1% (−23.7 to −4.0) | BH | 548 | −7.6% (−25.5 to +14.6) |
Panel B2. October–December matched windows
| Panel B2. Oct–Dec | Encounters | Change vs 2019 (95% CI) | Survives correction | Distinct patients | Change vs 2019 (95% CI) |
| 2019 | 178 | — | — | 157 | — |
| 2020 | 198 | +11.2% (−23.2 to +61.1) | — | 163 | +3.8% (−30.8 to +55.8) |
| 2021 | 215 | +20.8% (−6.6 to +56.2) | — | 192 | +22.3% (−17.3 to +80.8) |
| 2022 | 225 | +26.4% (−2.0 to +63.1) | — | 196 | +24.8% (−15.4 to +84.2) |
| 2023 | 188 | +5.6% (−20.6 to +40.4) | — | 174 | +10.8% (−25.7 to +65.3) |
| 2024 | 123 | −30.9% (−56.7 to +10.2) | — | 112 | −28.7% (−54.5 to +11.8) |
Distinct patients seen are an institution-level measure of recorded healthcare reach, not a population-based measure of access or disease occurrence.
3.3. Prespecified 2019 Interruption in Recorded Encounter Volume
Mean monthly fibromyalgia-coded encounter volume was 84.3 during the nine months preceding the prespecified October 2019 interruption month and 66.8 during the subsequent 63 months, corresponding to a crude reduction of 20.8%. In the primary segmented count model, the estimated level change was RR 0.76 (95% CI, 0.61–0.94; p = 0.012) (Table 3).
The estimated magnitude of the level change was stable across alternative model specifications. Across six sensitivity analyses varying the heteroskedasticity- and autocorrelation-consistent lag structure and count-model specification, the RR ranged from 0.75 to 0.76, with p values ranging from 0.003 to 0.024. Estimates were also similar when the monthly cutpoint was shifted to September or November 2019 (Table 3).
Because only nine monthly observations preceded the prespecified interruption, these results should be interpreted as an estimated level difference relative to the available pre-interruption period rather than as a fully specified interrupted time series with a well-characterized pre-event slope or causal counterfactual.
3.4. Recorded Institutional Reach Relative to Overall Outpatient Activity
Fibromyalgia-coded activity and institution-wide outpatient attendance showed partially different temporal patterns (Figure 3). Total outpatient volume decreased by 14% between 2019 and its lowest annual level in 2022 and subsequently recovered to approximately 5% below the 2019 value by 2024. Fibromyalgia-coded encounter volume declined by 26% in 2020, compared with a 12% reduction in total outpatient visits, and remained 17.3% below the 2019 level in 2024.
The annual proportion of all outpatient visits represented by fibromyalgia-coded encounters did not show a statistically detectable linear trend (−1.4% per year; 95% CI, −6.2% to +3.7%; p = 0.59; Supplementary Table S1). Likewise, the annual number of distinct fibromyalgia patients seen showed no statistically detectable linear trend over the six-year period (+0.3% per year; p = 0.91). Both tests rest on only six annual observations and therefore have limited power; absence of statistical significance should not be interpreted as evidence of stability.
Between 2019 and 2024, the number of distinct patients with recorded fibromyalgia encounters decreased from 715 to 633 (−11.5%), while the mean number of encounters per patient decreased from 1.31 to 1.22 (−6.6%). Thus, the reduction in total fibromyalgia-coded encounters reflected both fewer patients appearing in recorded care and fewer recorded encounters per patient. Importantly, the number of distinct patients recovered more completely toward its 2019 level than did total encounter volume.
Department-level denominators provided a similar contextual result. The annual ratio of fibromyalgia-coded encounters to total rheumatology encounters ranged from 684 to 804 per 10,000 rheumatology encounters across the six years (Supplementary Table S2), without a clear directional pattern. The absolute reduction in rheumatology-based fibromyalgia activity therefore occurred in parallel with changes in rheumatology attendance overall. No consistent temporal pattern was observed for the corresponding neurology ratio.
3.5. Exploratory Cutpoint Scan and the Mid-2024 Reduction
The exploratory scan across 61 possible monthly cutpoints identified two clusters associated with comparatively large downward level changes (Figure 4). Under the primary model specification, July 2024 produced the largest estimated reduction (RR 0.72), whereas the three autumn 2019 monthly cutpoints ranked second, third, and fifth, with RRs between 0.75 and 0.76. Across the seven specifications examined, the three autumn 2019 cutpoints and the July 2024 cutpoint all remained within the seven highest-ranked downward changes, although their precise ordering varied; the June 2024 cutpoint was less stable, ranging from second to fifteenth.
Because the mid-2024 signal was identified from the observed data rather than prespecified, it was treated as exploratory. In a post hoc two-step sensitivity model incorporating both the 2019 and mid-2024 reductions, the estimated RRs were 0.70 (95% CI, 0.58–0.84) for the 2019 interruption and 0.65 (95% CI, 0.51–0.83) for the mid-2024 step; both p < 0.001.
No individual cutpoint remained statistically significant after correction across all 61 candidate comparisons. Accordingly, the scan should be interpreted as an exploratory assessment of where sustained changes in the series may have occurred rather than as confirmatory testing of independent interruptions. Several candidate cutpoints without an obvious correspondence to the healthcare-system chronology also ranked highly, including positive shifts around late 2020 and early 2021. Conversely, the March 2020, August 2020, and October 2023 cutpoints did not rank among the leading sustained level changes, placing no higher than 28th under any specification.
3.6. Recorded Continuity After the Index Encounter
Recorded continuity differed across successive index-encounter cohorts (Table 4; Figure 5). Because index dates occurred throughout the six-year study period, available follow-up differed substantially by cohort, with median potential observation time decreasing from 2,038 days among patients entering the dataset in 2019 to 216 days among those entering in 2024. Kaplan–Meier estimation and time-to-event models were therefore used to account for administrative censoring, with the 180-day horizon designated as the principal fixed-horizon comparison.
The estimated probability of a subsequent fibromyalgia-coded encounter within 180 days was 22.8% in the 2019 cohort, 21.4% in 2020, 23.3% in 2021, 19.0% in 2022, 16.9% in 2023, and 15.6% in 2024. The absolute difference between the 2019 and 2024 cohorts was therefore 7.2 percentage points. Corresponding Cox HRs relative to 2019 were close to unity for the 2020 and 2021 cohorts but lower from 2022 onward: 0.73 (95% CI, 0.60–0.90) in 2022, 0.65 (95% CI, 0.53–0.81) in 2023, and 0.59 (95% CI, 0.45–0.76) in 2024.
The overall difference among cohorts was significant (log-rank χ² = 31.6; 5 df; p = 7.1 × 10⁻⁶). When cohort year was modeled as an ordinal continuous term, the hazard of a subsequent recorded fibromyalgia encounter decreased by approximately 10% per successive cohort year (HR, 0.90; 95% CI, 0.87–0.94; p < 0.001).
Adjustment for age and sex did not materially alter the cohort estimates. Age at the index encounter was not independently associated with subsequent recorded return (HR, 1.004 per year; p = 0.13), whereas women had a higher overall rate of subsequent fibromyalgia-coded encounters than men (HR, 1.40; 95% CI, 1.13–1.73; p = 0.002).
The proportional-hazards assumption, tested on Kaplan–Meier-transformed time, was not satisfied for the 2021 and 2022 cohort indicators (p = 0.020 and p = 0.004, respectively), although it was satisfied for the continuous cohort-year model (p = 0.40). The cohort-specific HRs should therefore not uniformly be interpreted as constant effects over follow-up. A sensitivity analysis restricted to the first 365 days preserved the overall temporal pattern, although the 2022 estimate was no longer statistically significant (Supplementary Table S3). Pairwise comparisons further suggested that the principal separation occurred between cohorts entering before and after 2022 (Supplementary Table S4).
3.7. Restricted Mean Time Without a Subsequent Recorded Encounter
The restricted mean survival time (RMST) analysis yielded a pattern consistent with the principal fixed-horizon findings without requiring the proportional-hazards assumption (Table 5). RMST is expressed here as the expected number of days without a subsequent recorded fibromyalgia encounter within a fixed horizon; higher values therefore indicate lower recorded longitudinal engagement.
At 180 days, RMST differed little from the 2019 cohort for the 2020–2022 cohorts, whereas patients entering in 2023 and 2024 spent an additional 8.7 days (95% CI, 2.9–14.4) and 10.0 days (95% CI, 3.7–16.3), respectively, without a subsequent recorded encounter.
At the supportive 364-day horizon, the corresponding differences relative to 2019 were +20.5 days (95% CI, 7.2–34.2) for the 2023 cohort and +25.0 days (95% CI, 11.5–39.1) for the 2024 cohort. Estimates for the 2020 and 2021 cohorts did not differ significantly from 2019. Because progressively fewer patients in the later cohorts contributed information toward the end of the 364-day horizon, these longer-horizon estimates should be interpreted more cautiously than the 180-day results. Overall, the RMST findings supported the localization of reduced recorded longitudinal engagement to the later cohorts identified by the Kaplan–Meier and Cox analyses.
3.8. Variation in Recorded Continuity by Sex and Entry Department
Changes in recorded continuity were not uniform across patient subgroups. Among women, the estimated 180-day probability of a subsequent fibromyalgia-coded encounter decreased from 23.9% in the 2019 cohort to 16.5% in the combined 2023–2024 cohorts. Among men, the corresponding probabilities were 14.9% and 14.1%, although the substantially smaller number of male patients limits precision.
Differences were also observed according to the department of the index encounter. The 180-day probability of a subsequent fibromyalgia-coded encounter decreased from 31.7% to 16.3% among patients entering through primary care or internal medicine and from 25.7% to 15.0% among those entering through neurology. The corresponding change among patients entering through rheumatology was smaller, from 19.7% to 17.7% (Supplementary Table S5).
Over the same period, the distribution of index-encounter departments changed. Primary care/internal medicine accounted for 22.5% of index encounters in 2019 and 14.7% in 2024, whereas rheumatology increased from 58.2% to 64.0% (Supplementary Table S6). These subgroup findings are descriptive and should not be interpreted as demonstrating differential causal effects of healthcare-system disruption across specialties.
3.9. Recorded Continuity Across Healthcare-System Phases
When patients were grouped according to the healthcare-system phase in effect at their index encounter, the temporal pattern of recorded continuity remained evident (Table 6).
Relative to the January–September 2019 reference period, no statistically detectable difference was observed among patients whose index encounter occurred during October 2019–February 2020 (HR, 0.97; 95% CI, 0.75–1.26), March–July 2020 (HR, 0.96; 95% CI, 0.72–1.29), or August 2020–December 2021 (HR, 0.97; 95% CI, 0.81–1.16). In contrast, lower rates of subsequent recorded encounters were observed among patients entering during January 2022–September 2023 (HR, 0.70; 95% CI, 0.59–0.85; p < 0.001) and October 2023–December 2024 (HR, 0.61; 95% CI, 0.48–0.78; p < 0.001).
The precision of the earlier phase estimates differed materially because of sample size. The August 2020–December 2021 phase included 757 patients and could exclude reductions larger than approximately 19%, whereas the October 2019–February 2020 and March–July 2020 periods included 201 and 152 patients and could exclude only reductions larger than approximately 25% and 28%, respectively. Absence of statistical significance in these earlier and smaller phases should therefore not be interpreted as evidence of equivalence or unchanged continuity.
An exploratory scan varying the calendar boundary for the apparent change in recorded continuity localized the separation broadly between August 2021 and February 2022 and placed the October 2019 volume interruption 56th of 61 (Supplementary Table S9). Restriction of follow-up to 365 days yielded estimates in the same direction.
Among patients who had a subsequent encounter, the observed interval to that encounter could not be compared naively across phases because later cohorts had progressively shorter maximum follow-up. Within a common 180-day observation window, the median interval among returners was 35 days during the reference period and 46 days during the final phase (p = 0.30). Among patients with a complete year of potential follow-up and a subsequent encounter within 365 days, the corresponding medians were 54 and 88 days. Thus, the principal temporal difference concerned the probability of a recorded subsequent encounter rather than a clearly demonstrated difference in its timing among patients who returned.
A complementary time-varying Cox model, in which each period of patient follow-up was attributed to the healthcare-system phase then in effect, produced a similar pattern. Relative to the reference phase, no statistically detectable reduction was observed before January 2022, whereas lower hazards of subsequent recorded encounter were observed during January 2022–September 2023 (HR, 0.74; 95% CI, 0.60–0.93; p = 0.008) and October 2023–December 2024 (HR, 0.58; 95% CI, 0.45–0.74; p < 0.001).
These findings establish temporal concurrence between lower recorded continuity and the later healthcare-system phases; they do not identify the economic conditions, armed conflict, or any other individual component of those periods as the cause of the observed changes.
3.10. Temporal Dissociation Between Recorded Institutional Reach and Continuity
The calendar pattern of encounter volume differed from that of recorded continuity. Encounter volume showed an early reduction relative to the January–September 2019 baseline and an additional exploratory reduction in mid-2024, whereas the principal reduction in subsequent fibromyalgia-coded encounters emerged among patients entering from 2022 onward.
When monthly encounter volume was compared across the prespecified healthcare-system phases, rates were below the reference period in most phases, with the largest estimated reduction occurring during March–July 2020 (RR, 0.57; 95% CI, 0.45–0.72; Supplementary Table S7). These estimates concern calendar-time utilization, whereas continuity analyses concern patient-level time from the index encounter; their effect estimates therefore represent different quantities and were not compared numerically.
Event-window analyses around 11 prespecified national events identified several short-term reductions in encounter volume (Supplementary Table S8). Within the family of eleven event windows, four signals survived Holm correction: the October 2019 interruption, the March 2020 lockdown and default period, the February 2023 currency devaluation, and the September 2024 escalation. Under the pooled correction applied across all volume comparisons, the February 2023 devaluation met the false-discovery-rate criterion but not the more conservative family-wise criterion. These analyses are supplementary and exploratory and should not be interpreted as independent causal estimates of the effects of individual events.
3.11. Intensity and Persistence of Recorded Follow-Up
Among patients with at least 365 days of potential observation, the mean number of subsequent fibromyalgia-coded encounters during the first year after the index encounter decreased from 0.415 in the 2019 cohort to 0.257 in the 2023 cohort, corresponding to a relative reduction of 38.1%. The 2024 cohort was not included in this analysis because no patient had 365 complete days of potential observation before administrative closure of the dataset. As anticipated from the differing follow-up distributions, a crude person-year rate produced the opposite numerical pattern, rising from 0.151 in the 2019 cohort to 0.313 in the 2024 cohort, and was therefore not used to characterize continuity.
Longitudinal recorded engagement was limited across the cohort as a whole. Of the 3,237 patients, 2,752 (85.0%) had fibromyalgia-coded encounters in only one calendar year, 363 (11.2%) in two years, and 13 (0.4%) in five or more years. Across the entire study period, 2,263 patients (69.9%) had only one fibromyalgia-coded encounter, while 3,013 (93.1%) had such encounters recorded within only one of the 31 represented departments.
These findings characterize recorded longitudinal engagement within AUBMC; they do not exclude follow-up elsewhere, uncoded encounters, or healthcare contacts in which fibromyalgia was not recorded as the primary diagnosis.
4. Discussion
This six-year analysis identified two temporally distinct changes in recorded fibromyalgia care at a major academic medical center in Lebanon. First, recorded institutional reach, reflected by encounter volume and the number of patients appearing in care, contracted early and remained below its 2019 level. Second, recorded continuity, reflected by the probability of a subsequent fibromyalgia-coded encounter, declined later, with lower return rates becoming apparent among patients entering the cohort from 2022 onward. These changes were not synchronous. The measured demographic profile of patients remained broadly similar, and institution-wide outpatient activity recovered more completely than fibromyalgia encounter volume. By 2024, the number of distinct patients receiving recorded fibromyalgia care had recovered closer to its 2019 level than total encounter volume, while encounters per patient had also decreased. Taken together, these findings indicate that recovery in aggregate patient attendance may coexist with reduced longitudinal engagement.
The distinction between recorded institutional reach and continuity is important. Recorded reach describes whether patients appear in the observable institutional healthcare record; recorded continuity describes whether subsequent fibromyalgia-coded contact is sustained within that institution. The two dimensions are related but not interchangeable. Continuity itself is multidimensional, encompassing relational, informational, and management components [21]. The EHR-based endpoint used in the present study captures only one observable component of this broader construct, subsequent recorded contact for fibromyalgia within the same institution, and is therefore most appropriately interpreted as recorded continuity or longitudinal engagement. A healthcare service may again see substantial numbers of patients without necessarily restoring the frequency or persistence of repeated clinical contact. Assessment based exclusively on aggregate attendance could therefore suggest greater recovery than an assessment incorporating patient-level longitudinal engagement.
4.1. Interpretation of Recorded Fibromyalgia Activity
The results should not be interpreted as evidence that the underlying occurrence of fibromyalgia decreased during the study period. Fibromyalgia remains a clinical diagnosis without a confirmatory laboratory or imaging biomarker, and its recognition depends on patients reaching appropriate healthcare professionals, clinicians identifying the syndrome, and sufficient clinical assessment to establish and manage the diagnosis. Diagnostic delay remains well documented, and recent registry evidence indicates that longer diagnostic delay is associated with greater fibromyalgia severity [22]. Accordingly, recorded fibromyalgia activity represents the intersection of underlying illness, symptom burden, healthcare-seeking behavior, access, diagnostic recognition, coding, and service availability rather than a direct measure of disease occurrence.
This distinction is particularly important when routinely collected EHR data are used. The present dataset captures recorded healthcare encounters, not fibromyalgia occurrence in the source population. The problem is further amplified by left truncation: because observation begins in January 2019, early index encounters necessarily include patients with pre-existing fibromyalgia entering the observable dataset for the first time. Neither changes in first observed encounters nor changes in overall encounter volume can therefore establish changes in fibromyalgia incidence or prevalence.
This interpretation also resolves the apparent tension with literature associating fibromyalgia with psychological stress and traumatic experiences. Such associations do not imply that periods of population adversity should produce a measurable increase in EHR-recorded fibromyalgia diagnoses. Disease burden, symptom burden, healthcare seeking, access, diagnostic recognition, coding, and recorded utilization represent different stages between illness and documented care. When healthcare access or service delivery changes, recorded clinical activity may therefore move independently of underlying symptom burden.
4.2. Early Changes in Recorded Reach and Later Erosion of Longitudinal Engagement
The temporal separation between changes in recorded institutional reach and recorded continuity may be the most informative finding of this study. Encounter volume decreased early, whereas no clear reduction in the probability of subsequent fibromyalgia-coded care was detected during the earlier study periods. Lower return rates became apparent primarily among cohorts entering care from 2022 onward and persisted during the later observation period. The findings therefore do not support a simple model in which healthcare-system disruption produces an equivalent and simultaneous change in all dimensions of recorded care.
Large reductions in healthcare utilization during acute disruption are well established. In a systematic review of 81 studies across 20 countries, Moynihan et al. [13] found a median 37% reduction in healthcare utilization during the initial COVID-19 pandemic, with visits decreasing by a median of 42%. Our observation that encounter volume changed substantially over relatively short periods is therefore consistent with broader international evidence demonstrating the sensitivity of healthcare attendance to major system disruption.
Recorded longitudinal engagement appears to represent a different dimension of service performance. In our data, lower return rates emerged later than the initial reduction in encounter volume and persisted among subsequent cohorts. This temporal pattern is compatible with, although it does not demonstrate, a distinction between relatively acute disruption of recorded healthcare contact and a later impairment of longitudinal engagement. One possible explanation is that short-term disruptions temporarily reduce attendance while allowing follow-up to be re-established, whereas prolonged constraints affecting staffing, affordability, medication availability, referral pathways, and healthcare resources may progressively make repeated patient contact more difficult. This interpretation remains hypothetical because the variables necessary to test these mechanisms directly were unavailable.
Importantly, the temporal concurrence between lower longitudinal engagement and the later periods of prolonged economic constraint and armed conflict should not be interpreted as evidence that either condition caused the observed deterioration. These periods overlapped with multiple changes in healthcare financing, workforce availability, medication affordability, service organization, patient circumstances, and other unmeasured factors. In addition, the study lacked a contemporaneous control population. The empirically supported conclusion is therefore narrower but clinically relevant: the reduction in recorded institutional reach preceded the deterioration in recorded longitudinal engagement, and the two dimensions followed different temporal trajectories during a prolonged period of healthcare-system strain.
4.3. Why Longitudinal Engagement Matters in Fibromyalgia
The distinction has particular clinical relevance in fibromyalgia because contemporary management is inherently longitudinal. EULAR recommendations emphasize comprehensive assessment, patient education, nonpharmacological management as the initial strategy, and individualized escalation according to patient needs [7]. The Italian Society for Rheumatology similarly conceptualizes fibromyalgia diagnosis and treatment as a multidimensional process requiring evidence-based and individualized management [23]. Such care is difficult to deliver through isolated encounters alone and depends on opportunities for reassessment, adaptation, reinforcement of nonpharmacological strategies, and modification of treatment according to symptoms and functional status.
Direct evidence linking continuity with clinical outcomes specifically in fibromyalgia remains limited. The broader chronic-disease literature nevertheless supports its potential relevance. A systematic review of 42 studies in patients with diabetes and/or hypertension found greater continuity to be associated with lower hospitalization, emergency department attendance, mortality, disease-related complications, and healthcare expenditure, although heterogeneity in continuity definitions and residual confounding limited causal inference [24]. More broadly, Pereira Gray et al. [25] found greater continuity of physician care to be associated with lower mortality across different countries and healthcare settings.
These findings should not be extrapolated to imply that reduced return to fibromyalgia care necessarily produced worse clinical outcomes in our cohort. Pain severity, functional status, medication use, quality of life, emergency care, and care received outside AUBMC were unavailable. Moreover, some patients may not have required repeated fibromyalgia-specific visits, while others may have continued appropriate management in encounters coded under another primary diagnosis or at another institution. The findings nevertheless reinforce an important methodological point: longitudinal engagement is a distinct dimension of recorded healthcare delivery and cannot be inferred from aggregate encounter counts alone.
4.4. Implications and Priorities for Future Research
The findings suggest that evaluations of healthcare-service recovery should distinguish at least two questions: how many patients are appearing in recorded care, and how consistently is longitudinal engagement sustained after they enter that care? Recovery of the first dimension does not necessarily imply recovery of the second.
Several extensions of the present work could test this framework more rigorously. First, comparator cohorts should be constructed from patients with other chronic rheumatologic or continuity-dependent conditions managed within the same institution. Such analyses could determine whether the observed dissociation between recorded institutional reach and longitudinal engagement is characteristic of fibromyalgia or reflects a broader change in chronic outpatient care.
Second, extending EHR extraction several years before 2019 would permit a genuine washout period, improve identification of newly diagnosed patients, provide a substantially stronger baseline for interrupted time-series analysis, and allow investigation of pre-existing secular trends.
Third, future datasets should capture fibromyalgia in any diagnostic position rather than exclusively as the primary encounter diagnosis and, where possible, incorporate medications, referrals, telemedicine, emergency encounters, clinical outcomes, and healthcare contacts outside the principal specialty. This would help distinguish loss of longitudinal engagement from changes in diagnostic coding or migration of fibromyalgia management into encounters recorded primarily for other conditions.
Fourth, linkage with socioeconomic, geographic, insurance, and healthcare-provider variables would permit direct testing of mechanisms underlying changes in recorded institutional reach and continuity rather than inferring potential mechanisms from temporal associations.
Finally, multicenter studies comparing public and private institutions, urban and non-urban settings, and different chronic diseases are needed to determine whether recorded reach and longitudinal engagement constitute reproducible and independently vulnerable dimensions of healthcare-service performance during prolonged system strain.
4.5. Strengths and Limitations
The principal strength of this study is the availability of six consecutive years of individual-level EHR data from a single institution using a stable recording system throughout a prolonged period of healthcare-system disruption. Stable patient identifiers allowed the analysis to move beyond aggregate utilization and distinguish the number of patients appearing in recorded care from their subsequent longitudinal engagement. That distinction revealed a temporal pattern that would have been obscured by encounter counts alone. The use of fixed-horizon Kaplan–Meier estimates, complementary Cox models, RMST analyses, multiple sensitivity analyses, and explicit treatment of left truncation further strengthened the analytical framework.
Several limitations constrain interpretation. First, this is a single-center study, and its findings cannot be assumed to represent Lebanon as a whole. The EHR captures care delivered within AUBMC and cannot determine whether patients who did not return subsequently received care elsewhere. Clinical severity, socioeconomic circumstances, insurance status, treatment, patient preference, and reasons for non-return were unavailable. Fibromyalgia was identified from the primary diagnosis assigned by treating clinicians without independent confirmation of diagnostic criteria, and changes in coding practice cannot be excluded. Encounters in which fibromyalgia was present but coded only as a secondary diagnosis were not captured.
Second, observation began only nine months before the first prespecified interruption. This is a limited baseline for interrupted time-series inference and precludes reliable characterization of a preceding secular trend or construction of a robust projected counterfactual. Accordingly, the primary October 2019 model should be interpreted as an estimated level difference associated with a prespecified interruption month rather than a definitive causal effect. The early index-encounter cohort also necessarily contains prevalent cases because no pre-2019 washout period was available. Consequently, this study evaluates recorded healthcare utilization and longitudinal engagement, not fibromyalgia incidence or prevalence.
Third, potential follow-up differed substantially across index-encounter cohorts. Survival methods account for administrative censoring under their assumptions, but longer-horizon estimates for the most recent cohorts necessarily rely on progressively smaller numbers of patients remaining under observation. For this reason, the 180-day return probability was designated as the principal fixed-horizon continuity measure, whereas the 364-day analyses should be considered supportive, particularly for the 2024 cohort.
Fourth, institution-wide and departmental denominators were available only annually, preventing monthly normalization of fibromyalgia encounters against overall healthcare activity. The absence of a contemporaneous comparison cohort also limits the ability to determine whether the observed patterns were specific to fibromyalgia or reflected broader changes in chronic outpatient care.
Fifth, successive periods of healthcare-system disruption overlapped substantially. The phase labels used in this study are therefore temporal descriptors rather than causal exposures, and observed differences cannot be attributed independently to financial deterioration, the pandemic, the port explosion, armed conflict, or any other individual event.
Finally, the operational measure used in this study should not be equated with the full construct of continuity of care. Continuity is conceptually multidimensional [21], and considerable heterogeneity exists in how it has been operationalized in outcomes research [26]. A subsequent fibromyalgia-coded encounter within the same institution therefore represents recorded continuity or longitudinal engagement, not necessarily relational, informational, or management continuity in their entirety. This distinction is particularly important because patients classified as not returning may have continued care elsewhere, may have attended AUBMC for encounters coded under another primary diagnosis, or may not have required another fibromyalgia-specific encounter within the measured interval.
5. Conclusions
Across six years of healthcare-system strain, recorded fibromyalgia care at this academic center showed a two-stage pattern. Healthcare reach contracted early, whereas deterioration in recorded continuity emerged later and persisted among subsequent cohorts. By the end of the study period, the number of patients reaching the service had recovered more completely than the frequency with which they returned.
These findings do not indicate that fibromyalgia became less common. Rather, they demonstrate how routinely collected healthcare data can reveal changes in two related but distinct dimensions of system performance: the capacity to reach patients and the capacity to sustain their longitudinal care.
For chronic conditions dependent on repeated clinical contact, recovery in attendance should therefore not automatically be equated with recovery in care. Future research should evaluate reach and continuity separately and determine whether restoration of patient volume is accompanied by restoration of longitudinal clinical engagement.
Supplementary Materials
The following supporting information can be downloaded at the website of this paper posted on Preprints.org. Table S1: Fibromyalgia share of total outpatient visits, by year; Table S2: Fibromyalgia encounters per 10,000 encounters, by department group and year; Table S3: Subsequent recorded encounter restricted to the first 365 days; Table S4: Pairwise log-rank comparisons of subsequent recorded encounter between index-encounter cohorts; Table S5: Subsequent recorded encounter by 180 days, by entry route; Table S6: Entry route at the index encounter, by year; Table S7: Encounter volume by healthcare-system phase; Table S8: Encounter volume and index encounters after eleven national events; Table S9: Exploratory cutpoint scan for a subsequent recorded encounter.
Author Contributions
Conceptualization, Je.N., P.S.P., I.U. and G.V.; methodology, Je.N., G.V. and M.L.G.L.; investigation, G.V., Je.N., Y.V.T., P.V.P. and A.N.; writing—original draft preparation, Je.N., G.V., I.U., Ja.N., M.L.G.L., A.N. and Y.V.T.; writing—review and editing, G.V., Je.N., Ja.N., M.L.G.L., Y.V.T., G.F., P.S.P., P.V.P. and M.A.N.T.; supervision, G.V. and I.U. All authors have read and agreed to the published version of the manuscript and agree to be accountable for all aspects of the work. Je.N., Jessica Nicolas; Ja.N., Jad Nicolas.
Funding
This research received no external funding.
Institutional Review Board Statement
The study was conducted in accordance with the Declaration of Helsinki and approved by the Institutional Review Board of the American University of Beirut (protocol code BIO-2025-0164, approved on 1 July 2025).
Informed Consent Statement
Patient consent was waived because the study used only routinely collected, de-identified electronic health record data. Patients were represented solely by coded medical record numbers, and no individually identifiable information was included in the analytical dataset or in the reported results.
Data Availability Statement
The data analyzed in this study were derived from the electronic health records of the American University of Beirut Medical Center and are not publicly available, because institutional data governance requirements and the risk of patient re-identification preclude open release. All aggregated data supporting the reported findings are presented in the article and in the Supplementary Materials. Further enquiries may be addressed to the corresponding author and are subject to institutional approval.
Acknowledgments
The authors wish to express their sincere gratitude to the Visionary International Board for Research and Analgesia (VIBRA), part of the Fondazione Paolo Procacci, for the valuable scientific discussions that contributed to the development of this article. The Fondazione Paolo Procacci is committed to advancing scientific research, fostering international collaboration and promoting academic excellence in pain medicine and related fields.
Conflicts of Interest
The authors declare no conflicts of interest.
Abbreviations
The following abbreviations are used in this manuscript:
| AUBMC | American University of Beirut Medical Center |
| BH | Benjamini–Hochberg |
| CI | Confidence Interval |
| COVID-19 | Coronavirus disease 2019 |
| df | Degrees of freedom |
| EHR | Electronic Health Record |
| EULAR | European Alliance of Associations for Rheumatology |
| HAC | Heteroskedasticity- and Autocorrelation-Consistent |
| HR | Hazard Ratio |
| NE | Not estimable |
| RECORD | REporting of studies Conducted using Observational Routinely-collected Health Data |
| RMST | Restricted Mean Survival Time |
| RR | Rate Ratio |
| SD | Standard Deviation |
| STROBE | Strengthening the Reporting of Observational Studies in Epidemiology |
References
- Wolfe, F.; Clauw, D.J.; Fitzcharles, M.A.; Goldenberg, D.L.; Häuser, W.; Katz, R.L.; Mease, P.J.; Russell, A.S.; Russell, I.J.; Walitt, B. 2016 Revisions to the 2010/2011 fibromyalgia diagnostic criteria. Semin. Arthritis Rheum. 2016, 46, 319–329. [Google Scholar] [CrossRef] [PubMed]
- Sarzi-Puttini, P.; Giorgi, V.; Marotto, D.; Atzeni, F. Fibromyalgia: an update on clinical characteristics, aetiopathogenesis and treatment. Nat. Rev. Rheumatol. 2020, 16, 645–660. [Google Scholar] [CrossRef] [PubMed]
- Chaaya, M.; Slim, Z.N.; Habib, R.R.; Arayssi, T.; Dana, R.; Hamdan, O.; Assi, M.; Issa, Z.; Uthman, I. High burden of rheumatic diseases in Lebanon: a COPCORD study. Int. J. Rheum. Dis. 2012, 15, 136–143. [Google Scholar] [CrossRef] [PubMed]
- Moukaddem, A.; Chaaya, M.; Slim, Z.F.N.; Jaffa, M.; Sibai, A.M.; Uthman, I. Fibromyalgia: epidemiology and risk factors, a population-based case-control study in Lebanon. Int. J. Rheum. Dis. 2017, 20, 169–176. [Google Scholar] [CrossRef] [PubMed]
- Gendelman, O.; Amital, H.; Bar-On, Y.; Ben-Ami Shor, D.; Amital, D.; Tiosano, S.; Shalev, V.; Chodick, G.; Weitzman, D. Time to diagnosis of fibromyalgia and factors associated with delayed diagnosis in primary care. Best Pract. Res. Clin. Rheumatol. 2018, 32, 489–499. [Google Scholar] [CrossRef] [PubMed]
- Perrot, S.; Choy, E.; Petersel, D.; Ginovker, A.; Kramer, E. Survey of physician experiences and perceptions about the diagnosis and treatment of fibromyalgia. BMC Health Serv. Res. 2012, 12, 356. [Google Scholar] [CrossRef] [PubMed]
- Macfarlane, G.J.; Kronisch, C.; Dean, L.E.; Atzeni, F.; Häuser, W.; Fluss, E.; Choy, E.; Kosek, E.; Amris, K.; Branco, J.; Dinçer, F.; Leino-Arjas, P.; Longley, K.; McCarthy, G.M.; Makri, S.; Perrot, S.; Sarzi-Puttini, P.; Taylor, A.; Jones, G.T. EULAR revised recommendations for the management of fibromyalgia. Ann. Rheum. Dis. 2017, 76, 318–328. [Google Scholar] [CrossRef] [PubMed]
- Al-Hajj, S.; Dhaini, H.R.; Mondello, S.; Kaafarani, H.; Kobeissy, F.; DePalma, R.G. Beirut Ammonium Nitrate Blast: Analysis, Review, and Recommendations. Front. Public Health 2021, 9, 657996. [Google Scholar] [CrossRef] [PubMed]
- Kawa, N.; Abisaab, J.; Abiad, F.; Badr, K.; El-Kak, F.; Alameddine, M.; Balsari, S. The toll of cascading crises on Lebanon’s health workforce. Lancet Glob. Health 2022, 10, e177–e178. [Google Scholar] [CrossRef] [PubMed]
- Abou Hassan, F.F.; Bou Hamdan, M.; Ali, F.; Melhem, N.M. Response to COVID-19 in Lebanon: update, challenges and lessons learned. Epidemiol. Infect. 2023, 151, e23. [Google Scholar] [CrossRef] [PubMed]
- Jaber Chehayeb, R.; Kala, S.; Abou Ghannam, H.; Hasan, G.; Salloum, J. The evolving Lebanese drug crisis: Trends in drug availability and affordability for common outpatient diseases from 2019 to 2023. PLoS Glob. Public Health 2023, 3, e0002538. [Google Scholar] [CrossRef] [PubMed]
- Nemr, E.; Moussallem, M.; Nemr, R.; Kosremelli Asmar, M. Exodus of Lebanese doctors in times of crisis: a qualitative study. Front. Health Serv. 2023, 3, 1240052. [Google Scholar] [CrossRef] [PubMed]
- Moynihan, R.; Sanders, S.; Michaleff, Z.A.; Scott, A.M.; Clark, J.; To, E.J.; Jones, M.; Kitchener, E.; Fox, M.; Johansson, M.; Lang, E.; Duggan, A.; Scott, I.; Albarqouni, L. Impact of COVID-19 pandemic on utilisation of healthcare services: a systematic review. BMJ Open 2021, 11, e045343. [Google Scholar] [CrossRef] [PubMed]
- Witter, S.; Thomas, S.; Topp, S.M.; Barasa, E.; Chopra, M.; Cobos, D.; Blanchet, K.; Teddy, G.; Atun, R.; Ager, A. Health system resilience: a critical review and reconceptualisation. Lancet Glob. Health 2023, 11, e1454–e1458. [Google Scholar] [CrossRef] [PubMed]
- von Elm, E.; Altman, D.G.; Egger, M.; Pocock, S.J.; Gøtzsche, P.C.; Vandenbroucke, J.P.; STROBE Initiative. The Strengthening the Reporting of Observational Studies in Epidemiology (STROBE) statement: guidelines for reporting observational studies. Lancet 2007, 370, 1453–1457. [Google Scholar] [CrossRef] [PubMed]
- Benchimol, E.I.; Smeeth, L.; Guttmann, A.; Harron, K.; Moher, D.; Petersen, I.; Sørensen, H.T.; von Elm, E.; Langan, S.M.; RECORD Working Committee. The REporting of studies Conducted using Observational Routinely-collected health Data (RECORD) statement. PLoS Med. 2015, 12, e1001885. [Google Scholar] [CrossRef] [PubMed]
- Bernal, J.L.; Cummins, S.; Gasparrini, A. Interrupted time series regression for the evaluation of public health interventions: a tutorial. Int. J. Epidemiol. 2017, 46, 348–355. [Google Scholar] [CrossRef] [PubMed]
- Hategeka, C.; Ruton, H.; Karamouzian, M.; Lynd, L.D.; Law, M.R. Use of interrupted time series methods in the evaluation of health system quality improvement interventions: a methodological systematic review. BMJ Glob. Health 2020, 5, e003567. [Google Scholar] [CrossRef] [PubMed]
- Royston, P.; Parmar, M.K. Restricted mean survival time: an alternative to the hazard ratio for the design and analysis of randomized trials with a time-to-event outcome. BMC Med. Res. Methodol. 2013, 13, 152. [Google Scholar] [CrossRef] [PubMed]
- Uno, H.; Claggett, B.; Tian, L.; Inoue, E.; Gallo, P.; Miyata, T.; Schrag, D.; Takeuchi, M.; Uyama, Y.; Zhao, L.; Skali, H.; Solomon, S.; Jacobus, S.; Hughes, M.; Packer, M.; Wei, L.J. Moving beyond the hazard ratio in quantifying the between-group difference in survival analysis. J. Clin. Oncol. 2014, 32, 2380–2385. [Google Scholar] [CrossRef] [PubMed]
- Haggerty, J.L.; Reid, R.J.; Freeman, G.K.; Starfield, B.; Adair, C.E.; McKendry, R. Continuity of care: a multidisciplinary review. BMJ 2003, 327, 1219–1221. [Google Scholar] [CrossRef] [PubMed]
- Salaffi, F.; Farah, S.; Bianchi, B.; Lommano, M.G.; Di Carlo, M. Delay in fibromyalgia diagnosis and its impact on the severity and outcome: a large cohort study. Clin. Exp. Rheumatol. 2024, 42, 1198–1204. [Google Scholar] [CrossRef] [PubMed]
- Ariani, A.; Bazzichi, L.; Sarzi-Puttini, P.; Salaffi, F.; Manara, M.; Prevete, I.; Bortoluzzi, A.; Carrara, G.; Scirè, C.A.; Ughi, N.; Parisi, S. The Italian Society for Rheumatology clinical practice guidelines for the diagnosis and management of fibromyalgia. Best practices based on current scientific evidence. Reumatismo 2021, 73, 89–105. [Google Scholar] [CrossRef] [PubMed]
- Chan, K.S.; Wan, E.Y.; Chin, W.Y.; Cheng, W.H.; Ho, M.K.; Yu, E.Y.; Lam, C.L. Effects of continuity of care on health outcomes among patients with diabetes mellitus and/or hypertension: a systematic review. BMC Fam. Pract. 2021, 22, 145. [Google Scholar] [CrossRef] [PubMed]
- Pereira Gray, D.J.; Sidaway-Lee, K.; White, E.; Thorne, A.; Evans, P.H. Continuity of care with doctors–a matter of life and death? A systematic review of continuity of care and mortality. BMJ Open 2018, 8, e021161. [Google Scholar] [CrossRef] [PubMed]
- van Walraven, C.; Oake, N.; Jennings, A.; Forster, A.J. The association between continuity of care and outcomes: a systematic and critical review. J. Eval. Clin. Pract. 2010, 16, 947–956. [Google Scholar] [CrossRef] [PubMed]
Figure 1.
Conceptual framework: recorded fibromyalgia care and underlying disease burden.
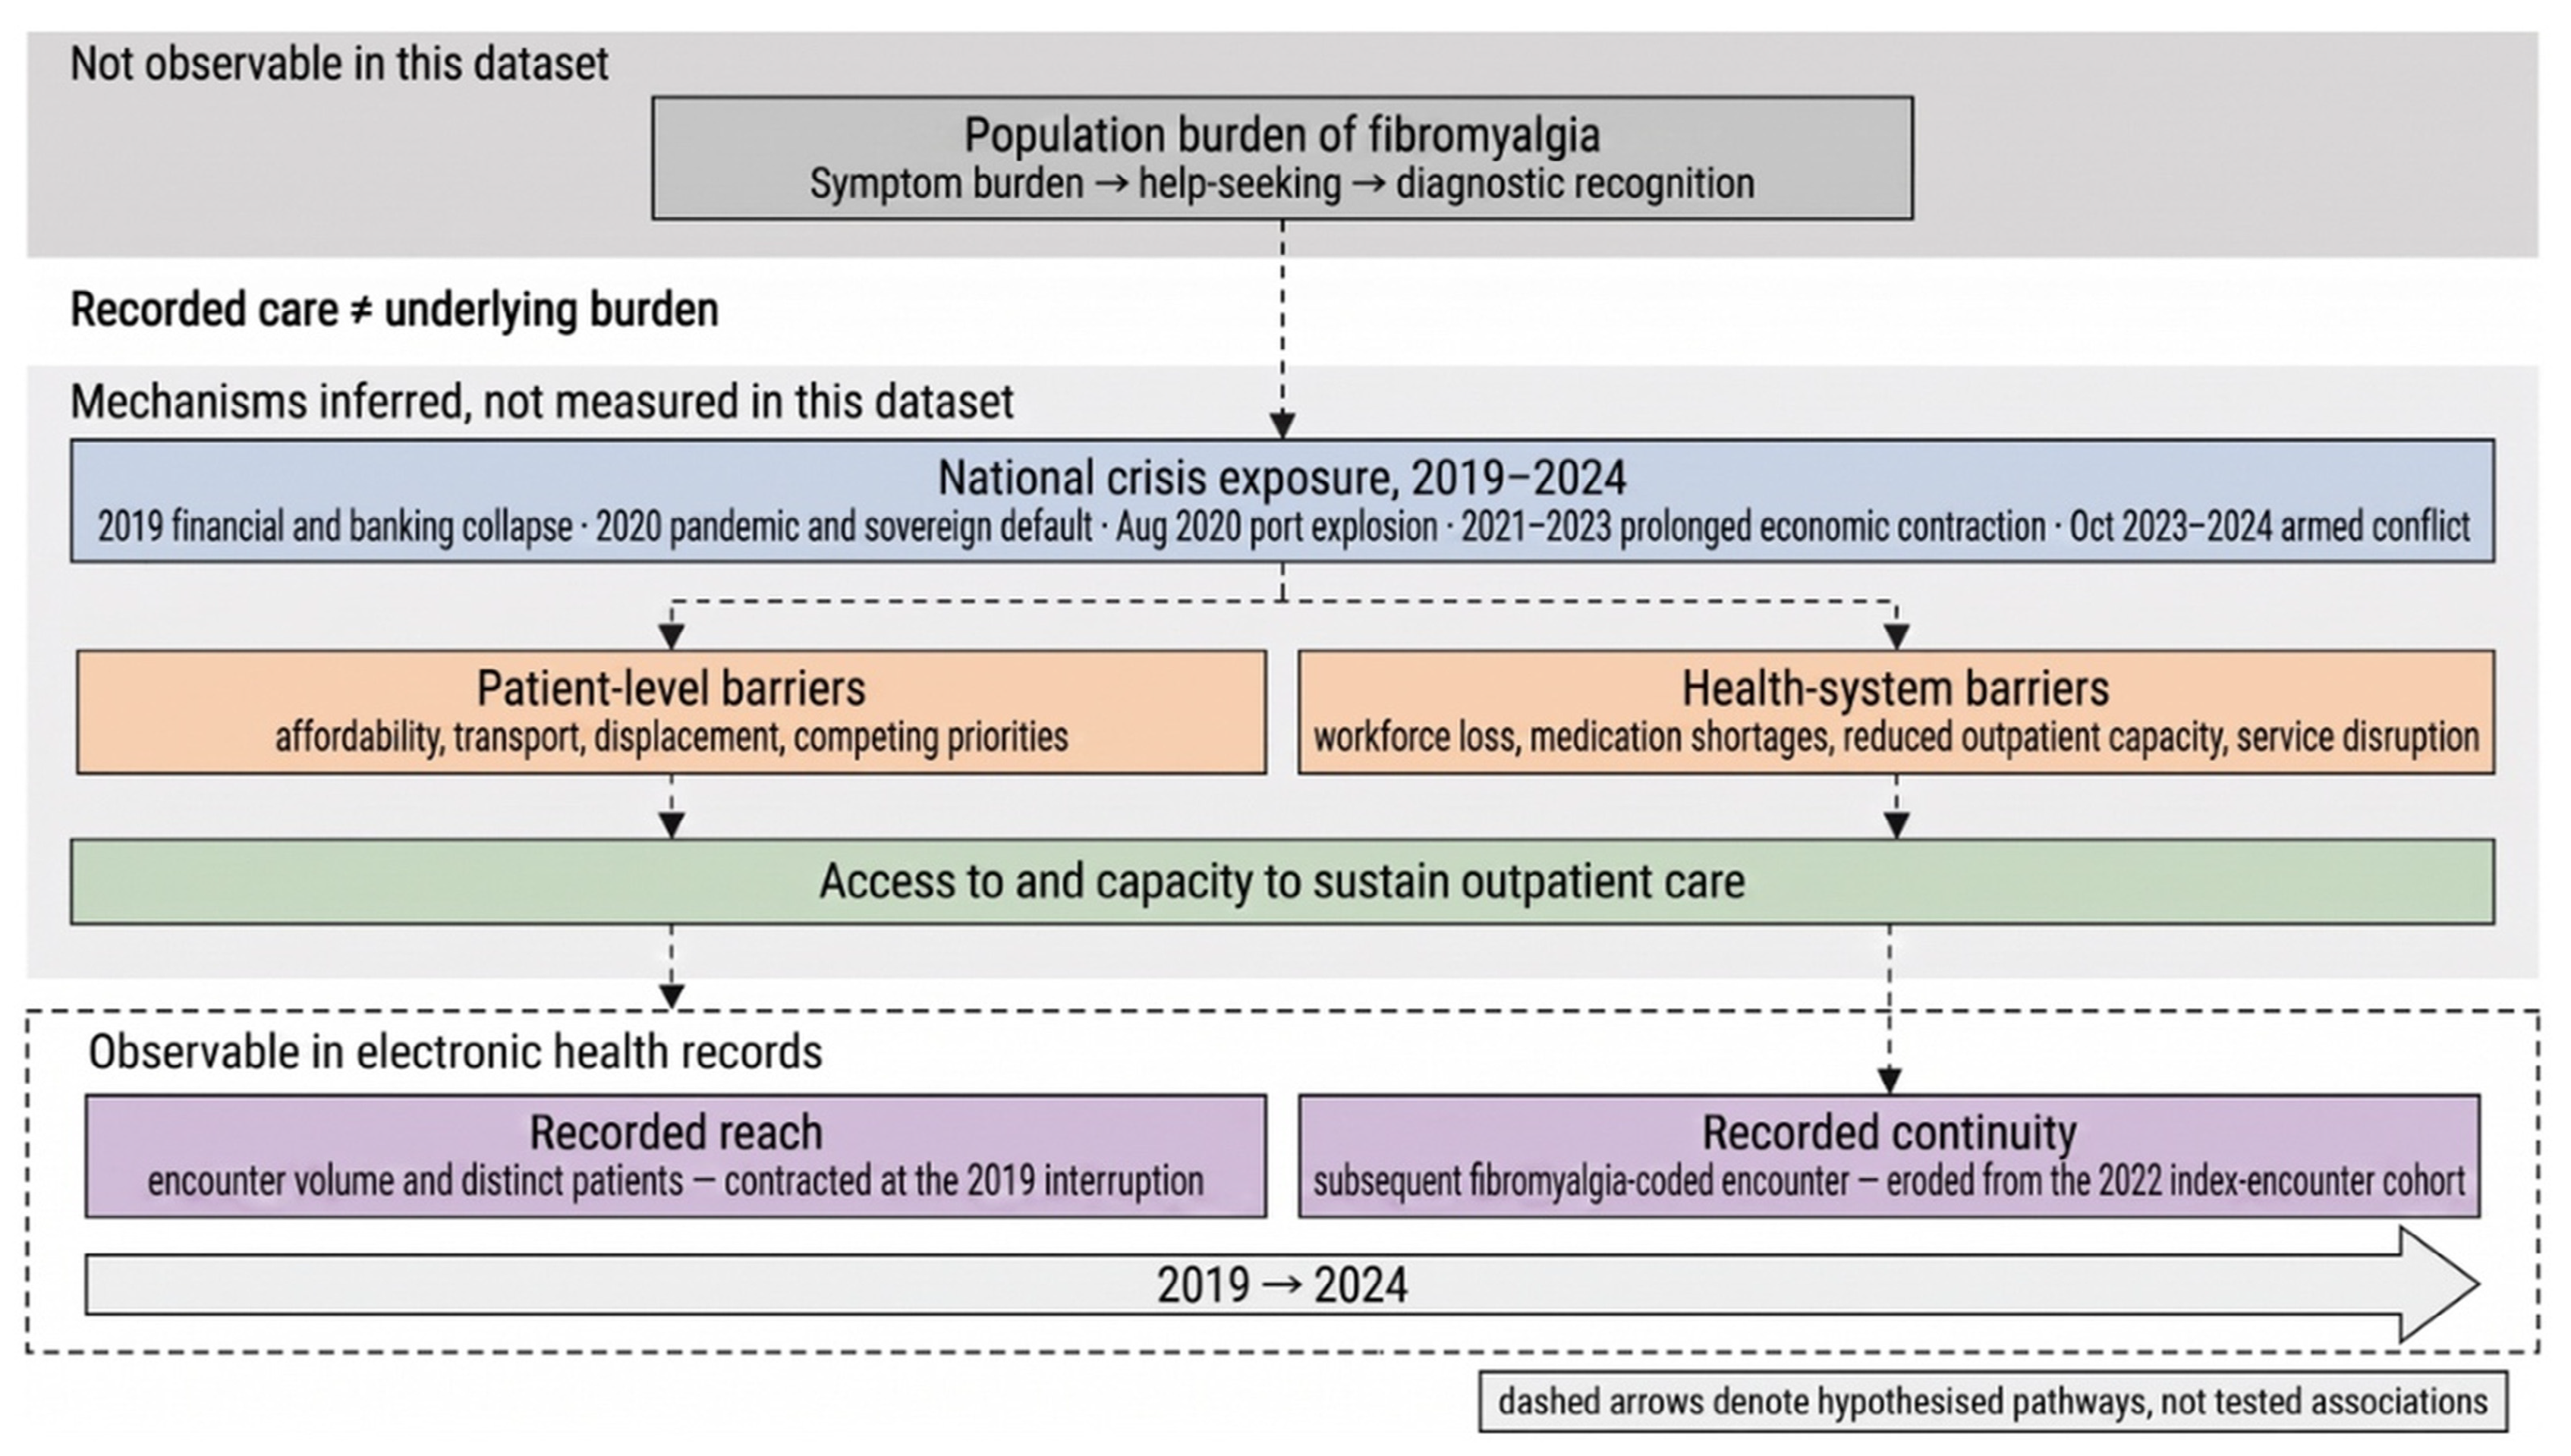
Figure 2.
Monthly volume of fibromyalgia care, January 2019 to December 2024. Three-month moving means of encounters (solid) and index fibromyalgia-coded encounters (dashed), with individual monthly encounter counts shown as points; dotted horizontal lines indicate mean monthly encounter volume before and after the prespecified October 2019 interruption month. The index-encounter series is affected by left truncation in early 2019. The tinted band over 2019 marks the period in which counts of first observed encounters are artifactually elevated by depletion of the prevalent case pool resulting from the extract beginning on January 1, 2019. Numbered markers denote national events positioned in the month in which each occurred: 1, uprising and banking closure (October 2019); 2, first COVID-19 case (February 2020); 3, sovereign default and nationwide lockdown (March 2020); 4, Beirut port explosion (August 2020); 5, prolonged economic contraction/currency instability through 2021–2022; 6, cross-border hostilities begin (October 2023); 7, escalation (September 2024); 8, ceasefire in effect (November 2024). For legibility the figure annotates eight of the eleven national events examined; all eleven, including the February 2023 currency devaluation, are analyzed in Supplementary Table S8. Event annotations are provided for temporal context and should not be interpreted as tested causal interruptions unless explicitly specified.
Figure 2.
Monthly volume of fibromyalgia care, January 2019 to December 2024. Three-month moving means of encounters (solid) and index fibromyalgia-coded encounters (dashed), with individual monthly encounter counts shown as points; dotted horizontal lines indicate mean monthly encounter volume before and after the prespecified October 2019 interruption month. The index-encounter series is affected by left truncation in early 2019. The tinted band over 2019 marks the period in which counts of first observed encounters are artifactually elevated by depletion of the prevalent case pool resulting from the extract beginning on January 1, 2019. Numbered markers denote national events positioned in the month in which each occurred: 1, uprising and banking closure (October 2019); 2, first COVID-19 case (February 2020); 3, sovereign default and nationwide lockdown (March 2020); 4, Beirut port explosion (August 2020); 5, prolonged economic contraction/currency instability through 2021–2022; 6, cross-border hostilities begin (October 2023); 7, escalation (September 2024); 8, ceasefire in effect (November 2024). For legibility the figure annotates eight of the eleven national events examined; all eleven, including the February 2023 currency devaluation, are analyzed in Supplementary Table S8. Event annotations are provided for temporal context and should not be interpreted as tested causal interruptions unless explicitly specified.
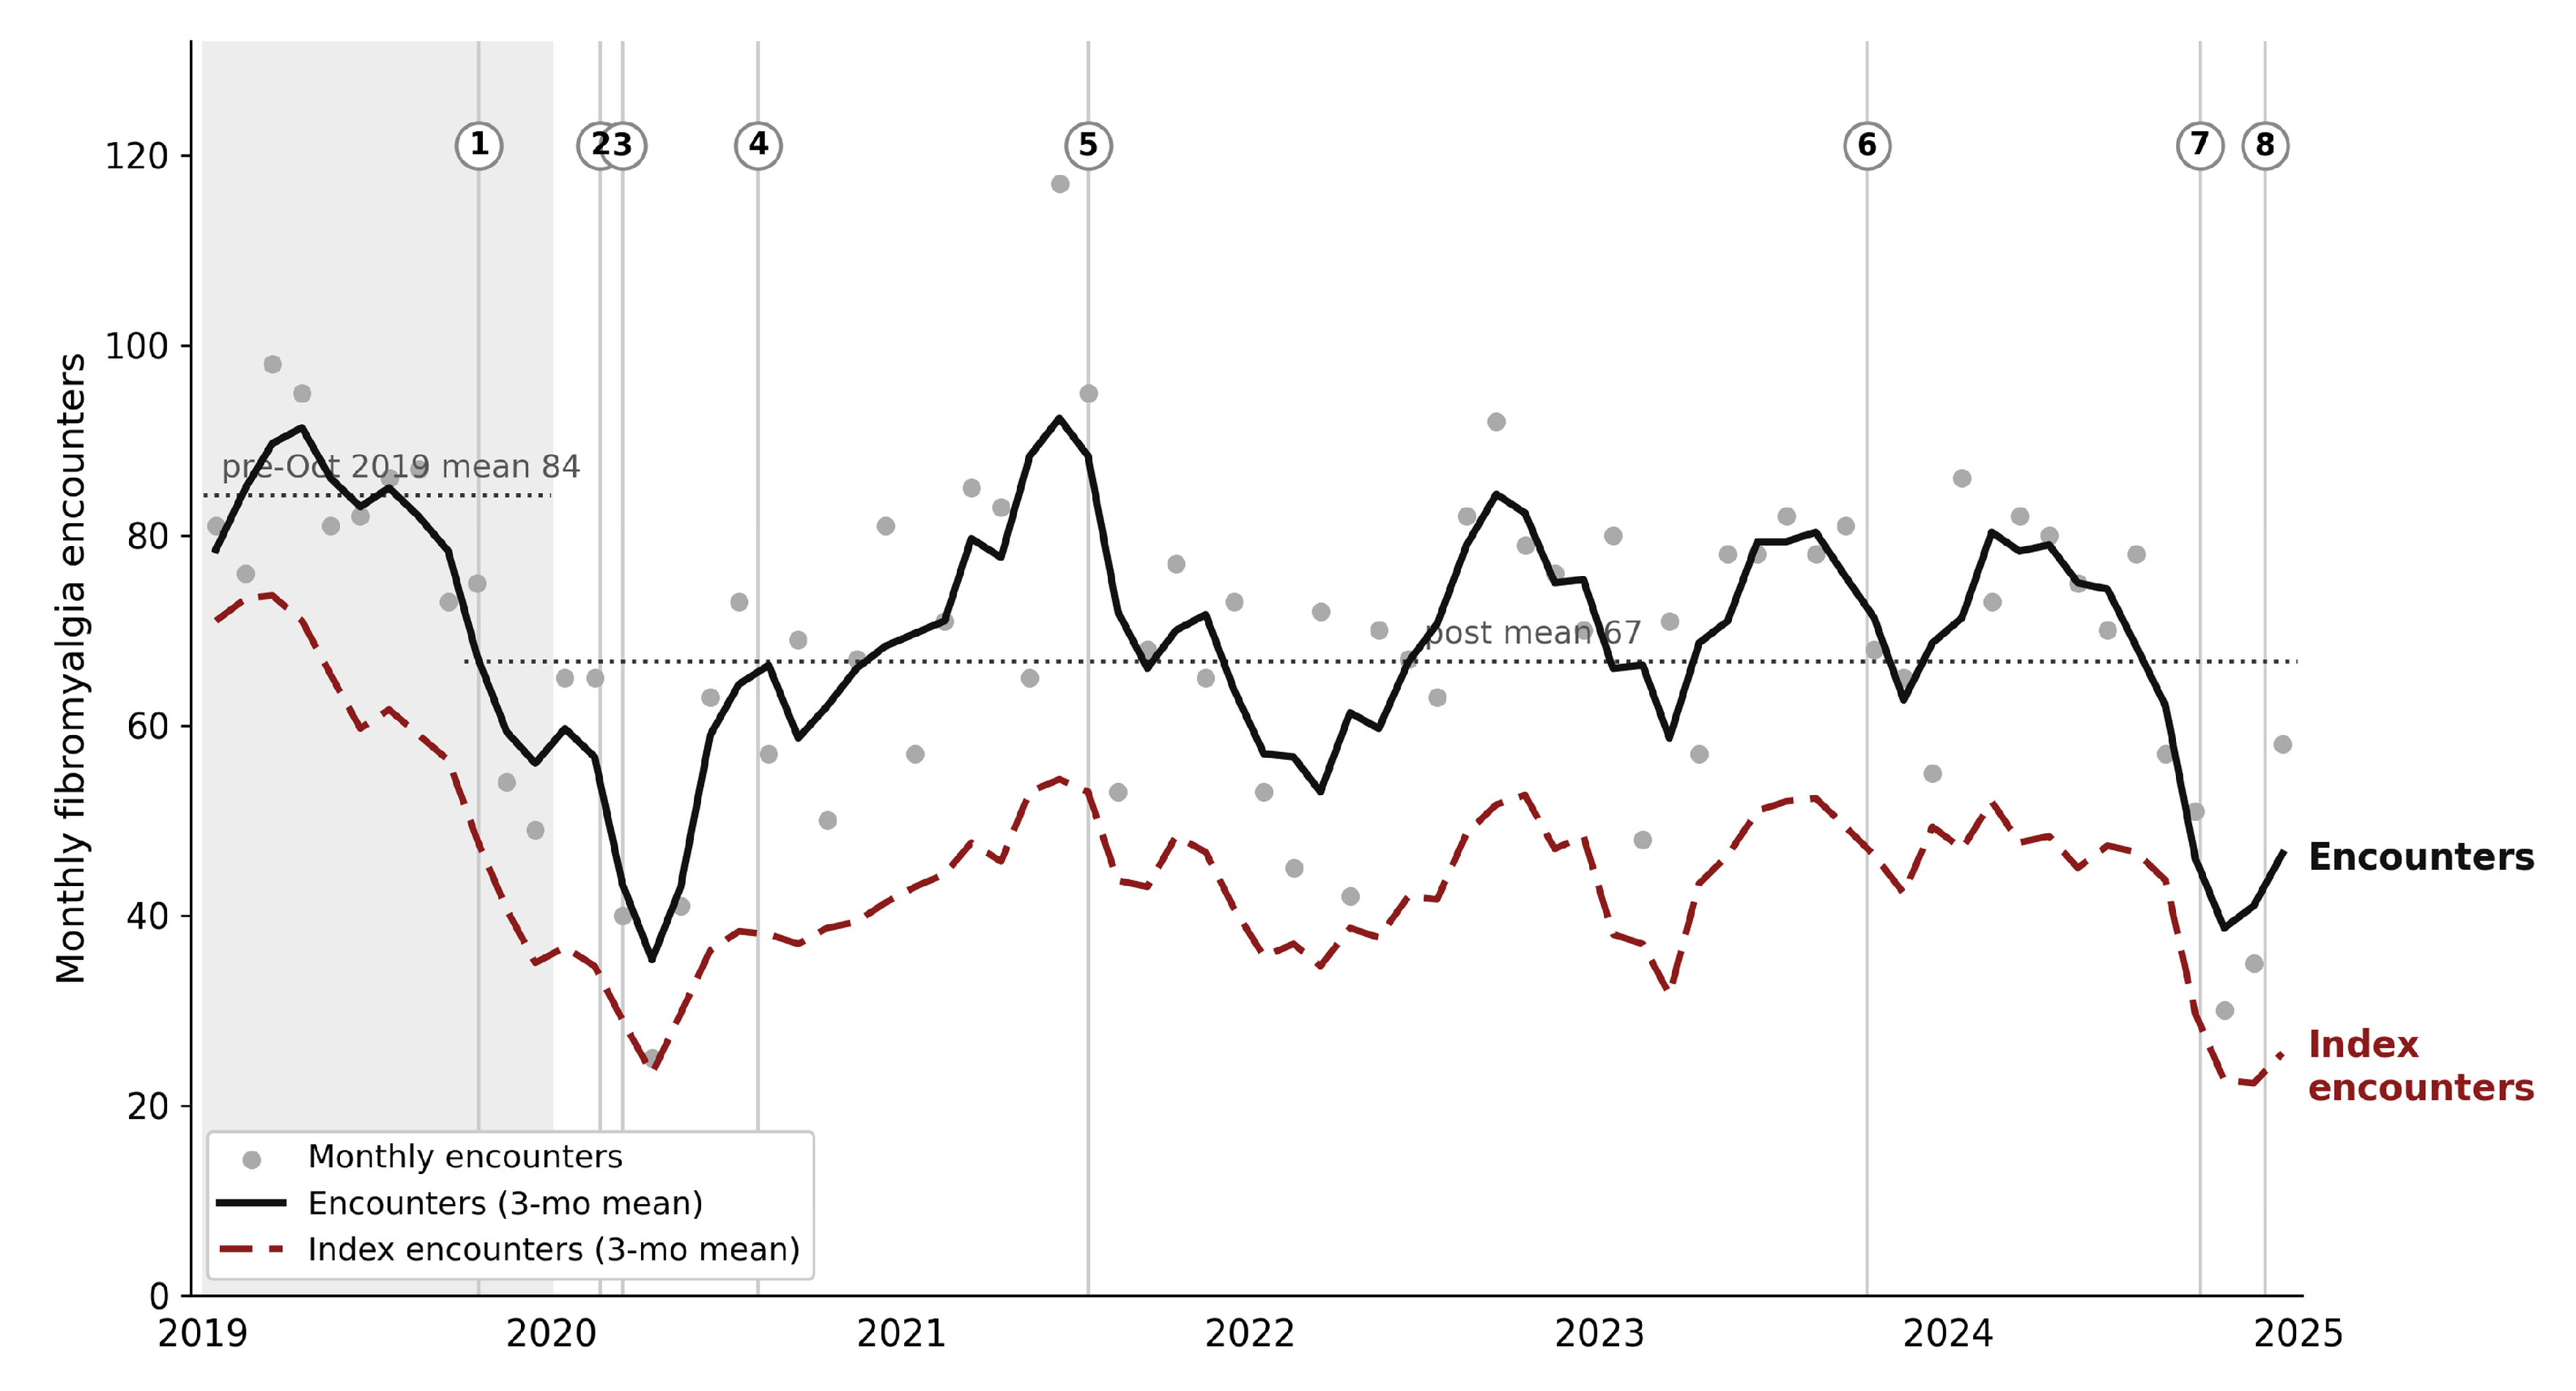
Figure 3.
Recorded fibromyalgia healthcare activity relative to institution-wide outpatient activity, 2019–2024. Total outpatient visits, fibromyalgia encounters, and recorded fibromyalgia institutional reach are each indexed to their 2019 value (2019 = 100); the dotted line marks the 2019 baseline. Total outpatient visits are derived from the institutional outpatient activity dashboard; fibromyalgia-coded encounters and recorded institutional reach are derived from the study extract (Table 2). Fibromyalgia encounter volume fell more sharply than overall outpatient volume in 2020 and recovered less completely. Recorded institutional reach recovered more of its 2019 level than encounter volume, although it remained 11.5% below 2019 in 2024. Both fewer patients and fewer encounters per patient therefore contributed to the observed decline. The fibromyalgia share of outpatient visits and its trend analysis are reported in Supplementary Table S1.
Figure 3.
Recorded fibromyalgia healthcare activity relative to institution-wide outpatient activity, 2019–2024. Total outpatient visits, fibromyalgia encounters, and recorded fibromyalgia institutional reach are each indexed to their 2019 value (2019 = 100); the dotted line marks the 2019 baseline. Total outpatient visits are derived from the institutional outpatient activity dashboard; fibromyalgia-coded encounters and recorded institutional reach are derived from the study extract (Table 2). Fibromyalgia encounter volume fell more sharply than overall outpatient volume in 2020 and recovered less completely. Recorded institutional reach recovered more of its 2019 level than encounter volume, although it remained 11.5% below 2019 in 2024. Both fewer patients and fewer encounters per patient therefore contributed to the observed decline. The fibromyalgia share of outpatient visits and its trend analysis are reported in Supplementary Table S1.
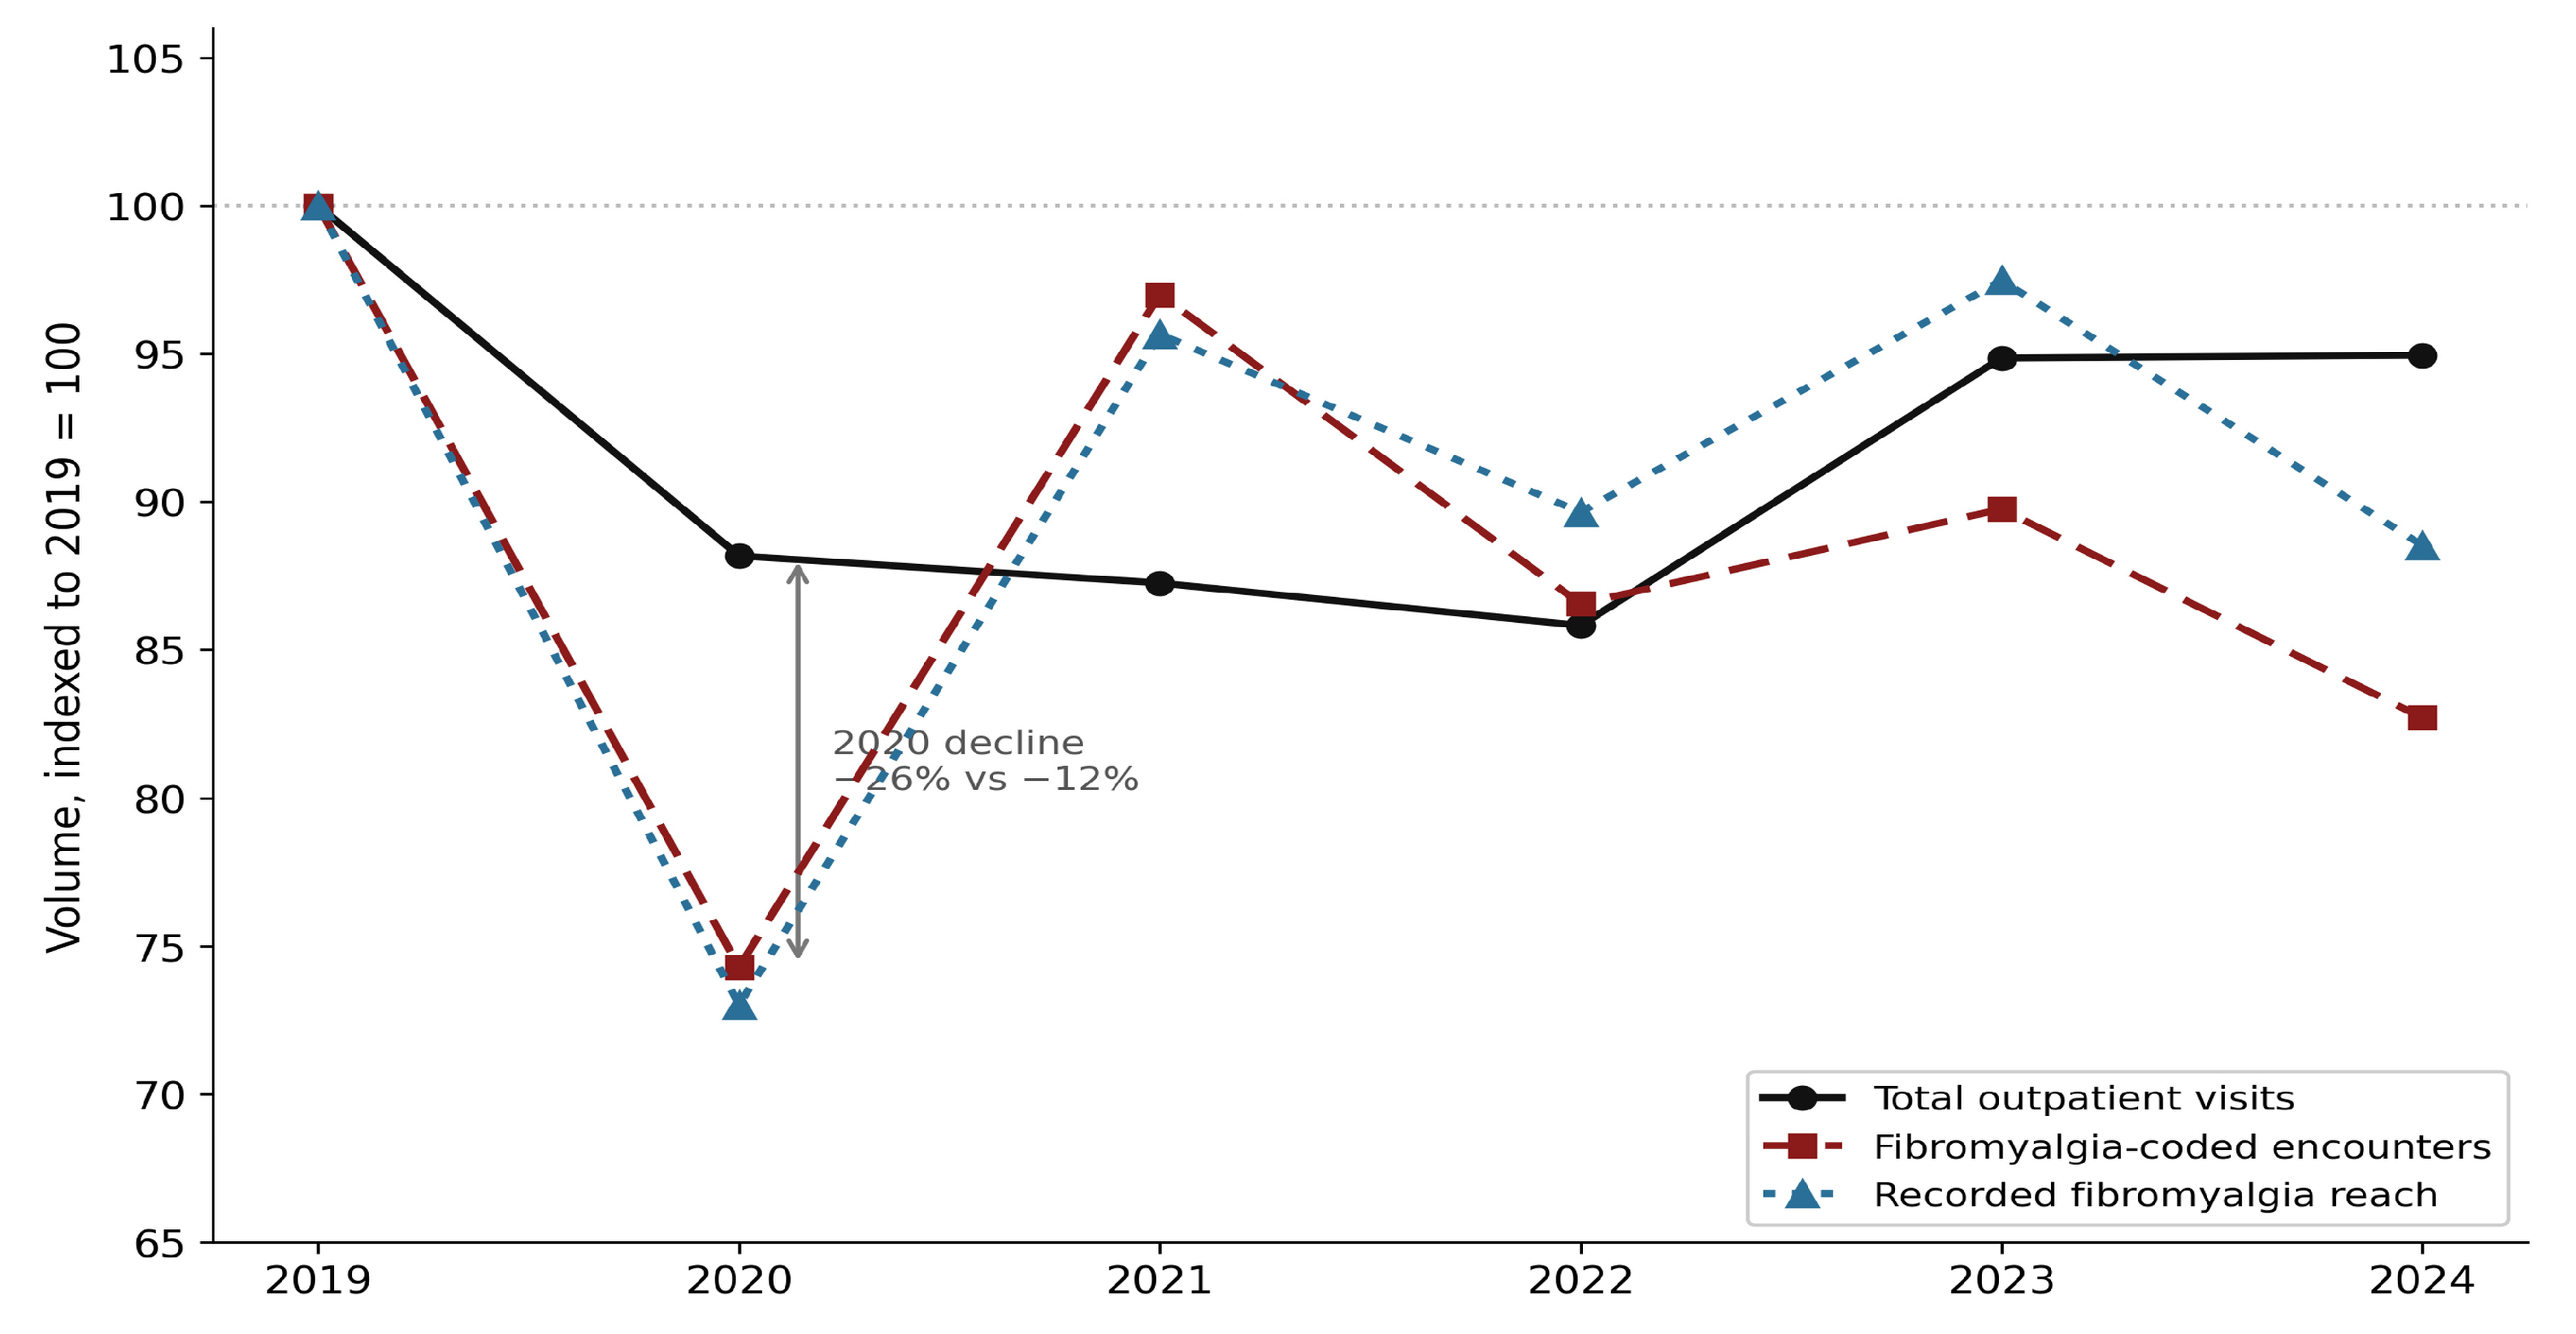
Figure 4.
Exploratory monthly cutpoint scan for sustained changes in fibromyalgia-coded encounter volume. The level-change model was refitted at each of 61 eligible monthly cutpoints; bars show the absolute z statistic, shaded by direction of change. Outlines and triangles identify the three autumn 2019 monthly cutpoints specified in advance, with the filled triangle indicating the primary October 2019 analysis; all remaining cutpoints, including the mid-2024 group, were identified from the observed data and are exploratory. The dashed line marks p = 0.05 before correction for multiple comparisons; no cutpoint remained significant after correction across the 61 comparisons. Cutpoints after July 2024 could not be evaluated. The mid-2024 signal therefore preceded the September 2024 escalation and should not be attributed to that subsequent event.
Figure 4.
Exploratory monthly cutpoint scan for sustained changes in fibromyalgia-coded encounter volume. The level-change model was refitted at each of 61 eligible monthly cutpoints; bars show the absolute z statistic, shaded by direction of change. Outlines and triangles identify the three autumn 2019 monthly cutpoints specified in advance, with the filled triangle indicating the primary October 2019 analysis; all remaining cutpoints, including the mid-2024 group, were identified from the observed data and are exploratory. The dashed line marks p = 0.05 before correction for multiple comparisons; no cutpoint remained significant after correction across the 61 comparisons. Cutpoints after July 2024 could not be evaluated. The mid-2024 signal therefore preceded the September 2024 escalation and should not be attributed to that subsequent event.
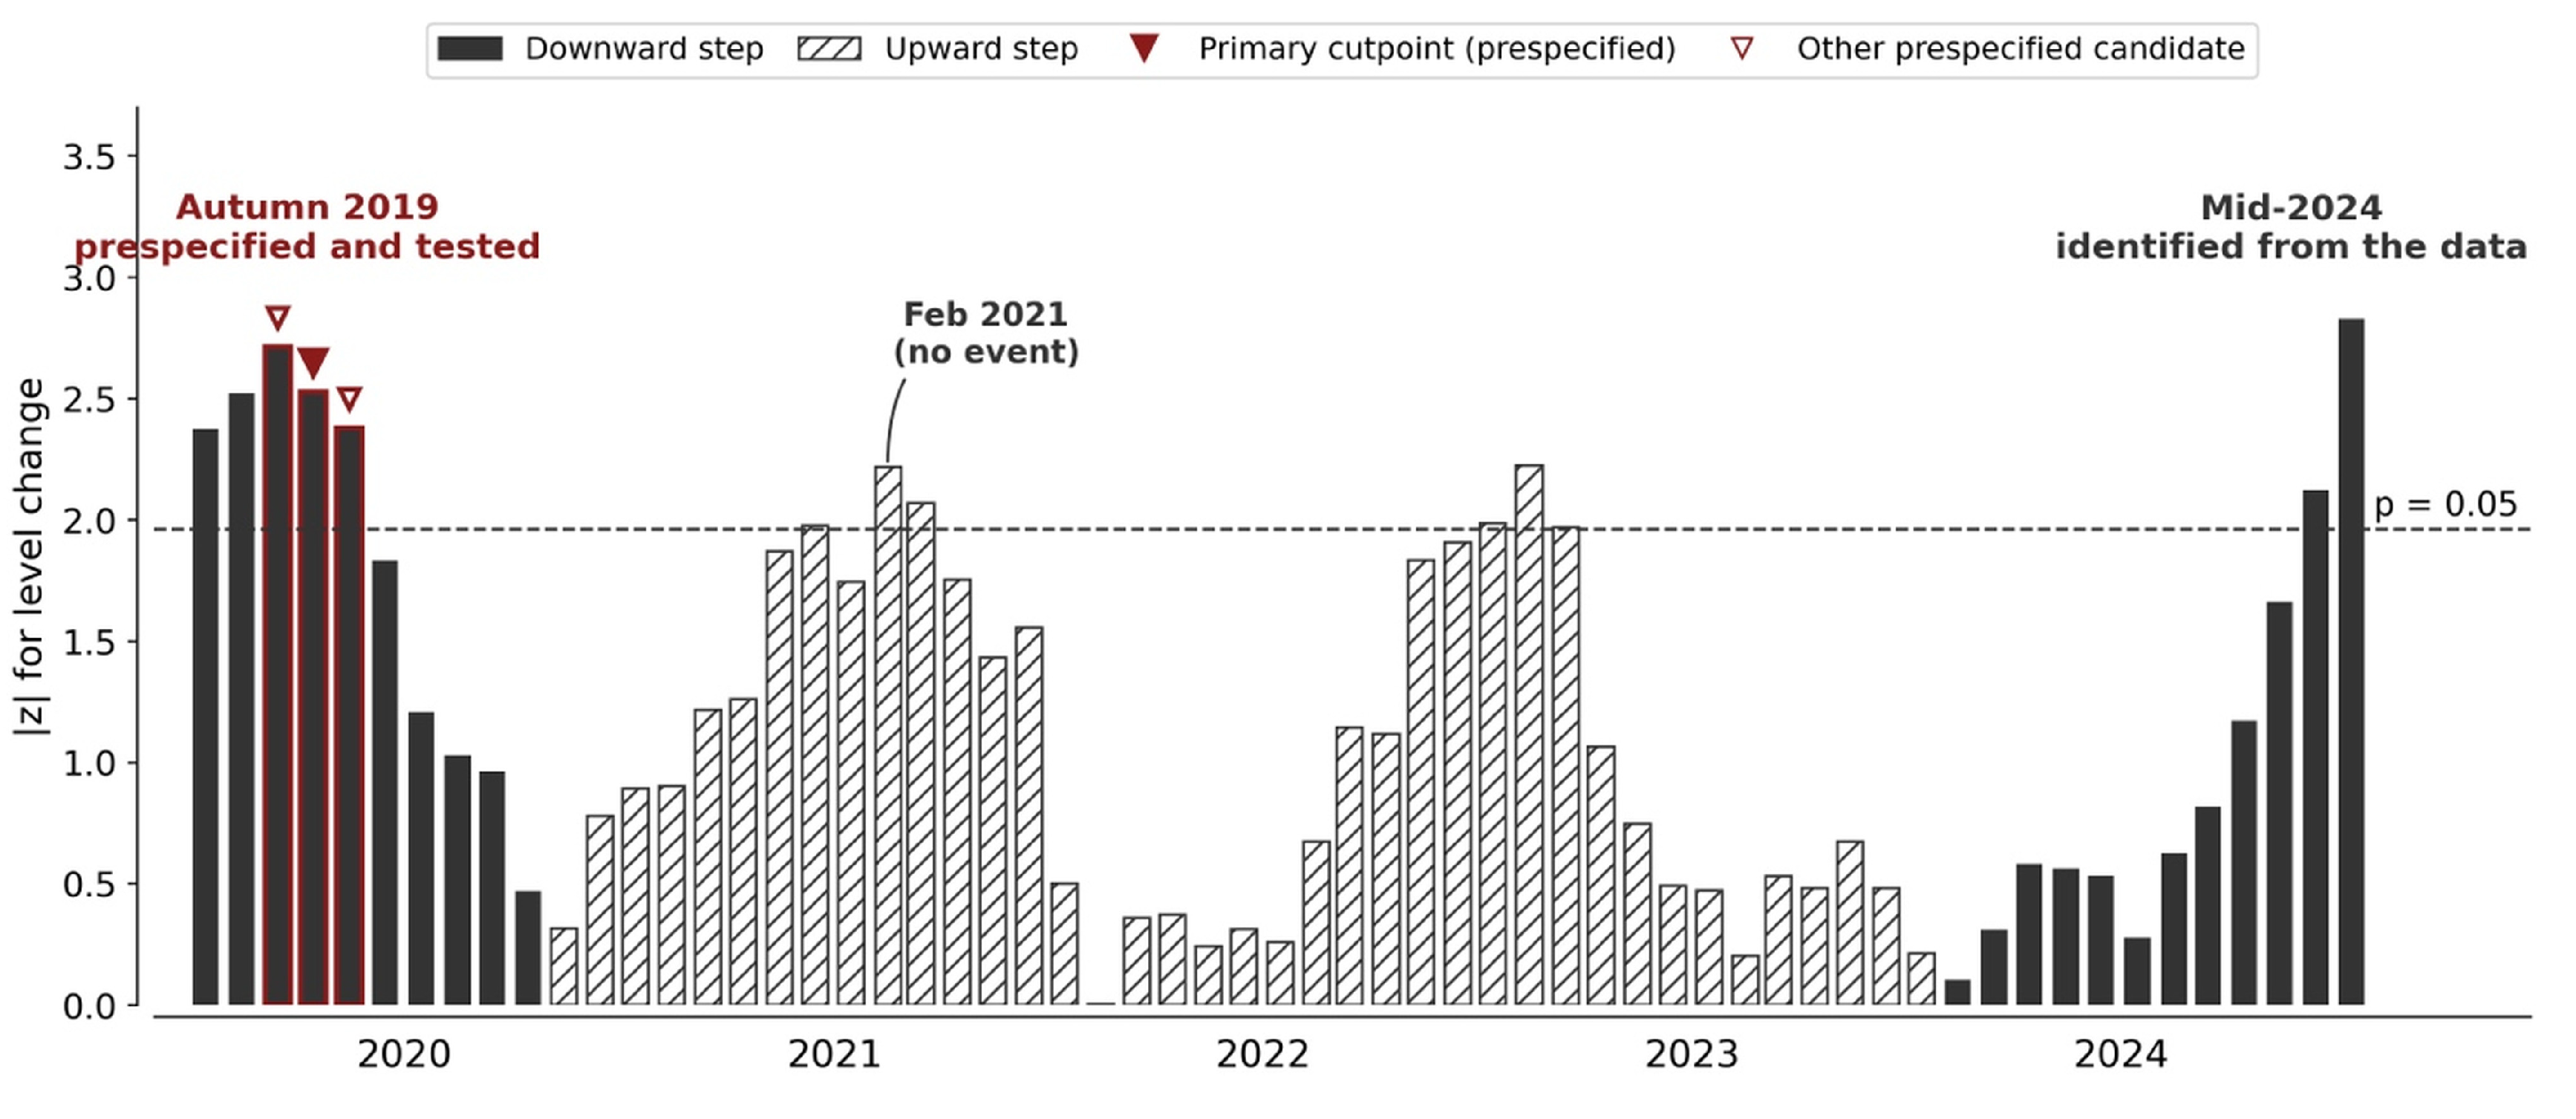
Figure 5.
Kaplan–Meier estimates of time to a subsequent recorded fibromyalgia-coded encounter, by index-encounter cohort. Curves show the cumulative probability of a subsequent recorded encounter, 1 − S(t), with the y-axis labeled accordingly. Dotted lines mark the 180- and 364-day horizons reported in Table 4. The 180-day horizon constitutes the principal fixed-horizon comparison. Curves are shown only over periods supported by observed follow-up; progressively fewer patients from later cohorts contribute information toward longer horizons. Corresponding estimates and hazard ratios are provided in Table 4.
Figure 5.
Kaplan–Meier estimates of time to a subsequent recorded fibromyalgia-coded encounter, by index-encounter cohort. Curves show the cumulative probability of a subsequent recorded encounter, 1 − S(t), with the y-axis labeled accordingly. Dotted lines mark the 180- and 364-day horizons reported in Table 4. The 180-day horizon constitutes the principal fixed-horizon comparison. Curves are shown only over periods supported by observed follow-up; progressively fewer patients from later cohorts contribute information toward longer horizons. Corresponding estimates and hazard ratios are provided in Table 4.
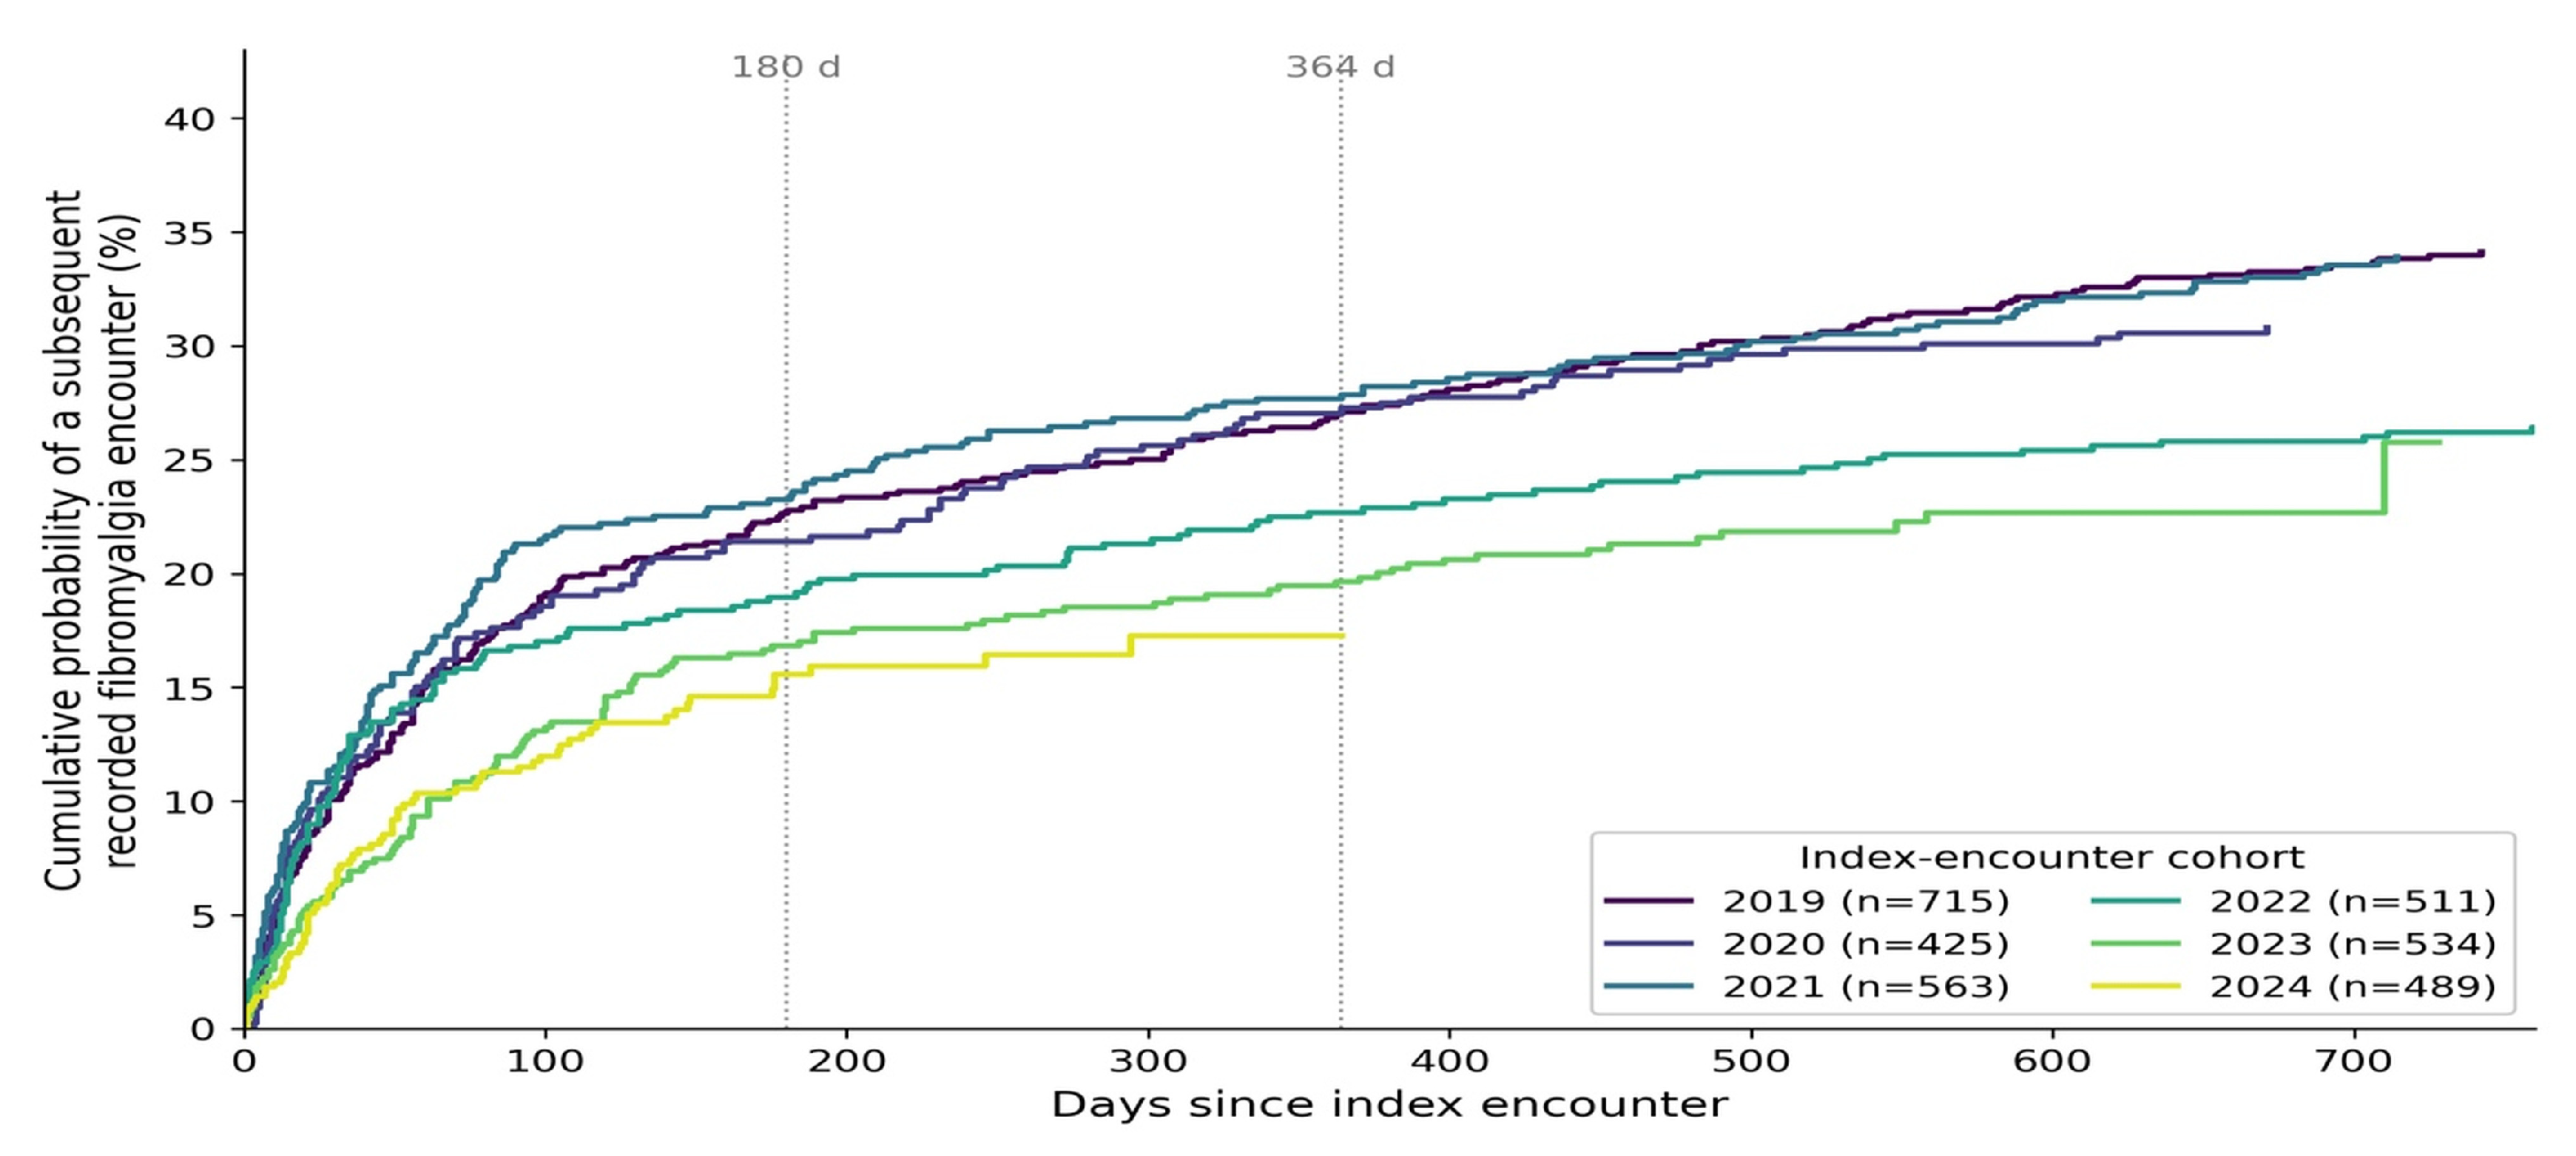

Table 1.
Characteristics of patients at the index fibromyalgia-coded encounter, by calendar-year cohort.
Table 1.
Characteristics of patients at the index fibromyalgia-coded encounter, by calendar-year cohort.
| Index-encounter cohort | Patients | Female, n (%) | Age, mean (SD), y | Age, median, y | Age <30 y, % | Age ≥50 y, % |
|---|---|---|---|---|---|---|
| 2019 | 715 | 628 (87.8) | 47.0 (12.8) | 48 | 9.2 | 43.2 |
| 2020 | 425 | 360 (84.7) | 45.4 (13.8) | 46 | 14.4 | 41.2 |
| 2021 | 563 | 484 (86.0) | 46.6 (12.9) | 47 | 10.8 | 42.3 |
| 2022 | 511 | 445 (87.1) | 46.6 (13.3) | 47 | 10.6 | 44.0 |
| 2023 | 534 | 471 (88.2) | 47.5 (13.9) | 49 | 11.2 | 46.1 |
| 2024 | 489 | 444 (90.8) | 47.0 (14.1) | 47 | 12.5 | 46.2 |
Kruskal–Wallis p=0.29 for age across cohorts; χ² p=0.17 for age in 10-year categories (<30, 30–39, 40–49, 50–59, ≥60 years); χ² p=0.09 for sex.
Table 2.
Recorded institutional reach and fibromyalgia-coded encounter volume. Panel A. Annual recorded activity
Table 2.
Recorded institutional reach and fibromyalgia-coded encounter volume. Panel A. Annual recorded activity
| Year | Fibromyalgia-coded encounters | Distinct patients seen | Patients with index encounter during year |
|---|---|---|---|
| 2019 | 937 | 715 | 715* |
| 2020 | 696 | 522 | 425 |
| 2021 | 909 | 684 | 563 |
| 2022 | 811 | 641 | 511 |
| 2023 | 841 | 697 | 534 |
| 2024 | 775 | 633 | 489 |
| Total | 4,969 | 3,237 | 3,237 |
*The 2019 index-encounter count is inflated by left truncation because patients with pre-existing fibromyalgia who first appeared after the dataset opened are necessarily classified as index encounters.
Table 3.
Estimated change in fibromyalgia-coded encounter volume at the prespecified 2019 interruption.
Table 3.
Estimated change in fibromyalgia-coded encounter volume at the prespecified 2019 interruption.
| Cutpoint | Pre-interruption months | Pre mean/month | Post mean/month | Crude change | RR (95% CI) | p value |
|---|---|---|---|---|---|---|
| Sep 1, 2019 | 8 | 85.8 | 66.9 | −22.0% | 0.75 (0.61–0.92) | 0.007 |
| Oct 1, 2019† | 9 | 84.3 | 66.8 | −20.8% | 0.76 (0.61–0.94) | 0.012 |
| Nov 1, 2019 | 10 | 83.4 | 66.7 | −20.0% | 0.76 (0.60–0.95) | 0.017 |
† Prespecified interruption month used for the primary analysis. RR is the model-based rate ratio for the level change; crude change is the unadjusted difference in mean monthly counts. Dates of individual national events occurring within these months were not modeled with day-level precision.
Table 4.
Recorded continuity after the index fibromyalgia-coded encounter, by calendar-year cohort.
| Index-encounter cohort | Patients | Patients with a subsequent encounter, n | Subsequent encounter by 180 days | By 364 days | By 730 days |
HR (95% CI) | p | Adjusted HR (95% CI) † |
p |
|---|---|---|---|---|---|---|---|---|---|
| 2019 | 715 | 285 | 22.8% | 27.1% | 34.0% | Reference | — | Reference | — |
| 2020 | 425 | 153 | 21.4% | 27.3% | 30.8% | 0.92 (0.76–1.12) | 0.42 | 0.94 (0.77–1.14) | 0.51 |
| 2021 | 563 | 202 | 23.3% | 27.9% | 33.9% | 0.97 (0.80–1.16) | 0.70 | 0.97 (0.81–1.16) | 0.73 |
| 2022 | 511 | 137 | 19.0% | 22.7% | 26.2% | 0.73 (0.60–0.90) | 0.003 | 0.73 (0.60–0.90) | 0.003 |
| 2023 | 534 | 118 | 16.9% | 19.7% | NE | 0.65 (0.53–0.81) | <0.001 | 0.65 (0.52–0.81) | <0.001 |
| 2024 | 489 | 71 | 15.6% | 17.3%‡ | NE | 0.59 (0.45–0.76) | <0.001 | 0.58 (0.44–0.76) | <0.001 |
A subsequent encounter was defined as a fibromyalgia-coded encounter occurring on a later calendar day than the index encounter. Hazard ratios quantify the rate of a subsequent recorded fibromyalgia encounter within AUBMC and not complete healthcare continuity across providers or institutions. †Adjusted for age at the index encounter and sex. NE, not estimable at the specified horizon. ‡The 364-day Kaplan–Meier estimate for the 2024 cohort is supported by progressively fewer patients toward the end of follow-up and should therefore be interpreted as a supportive rather than primary continuity estimate; the survival curve was unchanged from day 294 onward, when 98 patients remained at risk.
Table 5.
Restricted mean time without a subsequent fibromyalgia-coded encounter, by index-encounter cohort.
Table 5.
Restricted mean time without a subsequent fibromyalgia-coded encounter, by index-encounter cohort.
| Index-encounter cohort | RMST to 180 days | Δ vs 2019 (95% CI) | RMST to 364 days | Δ vs 2019 (95% CI) |
|---|---|---|---|---|
| 2019 | 151.0 d | reference | 289.5 d | reference |
| 2020 | 151.1 d | +0.1 (−6.6 to +6.8) | 290.0 d | +0.6 (−15.8 to +16.6) |
| 2021 | 147.6 d | −3.4 (−10.4 to +2.9) | 283.3 d | −6.1 (−21.1 to +8.8) |
| 2022 | 153.2 d | +2.2 (−4.0 to +8.8) | 298.8 d | +9.3 (−5.7 to +23.9) |
| 2023 | 159.7 d | +8.7 (+2.9 to +14.4) | 310.0 d | +20.5 (+7.2 to +34.2) |
| 2024 | 161.0 d | +10.0 (+3.7 to +16.3) | 314.5 d ‡ | +25.0 (+11.5 to +39.1) |
Confidence intervals were obtained from 2,000 bootstrap resamples. ‡The 2024 estimate at 364 days is based on progressively fewer patients toward the end of follow-up and should be interpreted cautiously; the survival curve was unchanged after day 294, when 98 patients remained at risk.
Table 6.
Recorded continuity by healthcare-system phase.
| Phase | Window | Patients | Subsequent encounter by 180 d | HR by phase at index encounter (95% CI) | p | HR by phase in effect (95% CI) |
p |
|---|---|---|---|---|---|---|---|
| Pre-crisis | Jan–Sep 2019 | 593 | 22.9% | Reference | — | Reference | — |
| Banking and financial disruption | Oct 2019–Feb 2020 | 201 | 18.9% | 0.97 (0.75–1.26) | 0.82 | 0.85 (0.62–1.15) | 0.29 |
| COVID-19 and sovereign default |
Mar–Jul 2020 | 152 | 23.7% | 0.96 (0.72–1.29) | 0.79 | 0.81 (0.58–1.13) | 0.21 |
| Port explosion and subsequent economic deterioration |
Aug 2020–Dec 2021 | 757 | 23.1% | 0.97 (0.81–1.16) | 0.73 | 1.04 (0.84–1.30) | 0.71 |
| Prolonged economic contraction |
Jan 2022–Sep 2023 | 918 | 18.0% | 0.70 (0.59–0.85) | <0.001 | 0.74 (0.60–0.93) | 0.008 |
| Armed-conflict period | Oct 2023–Dec 2024 | 616 | 16.1% | 0.61 (0.48–0.78) | <0.001 | 0.58 (0.45–0.74) | <0.001 |
Phase labels identify calendar periods characterized by major healthcare-system conditions and are used for temporal description only. They should not be interpreted as causal exposures or as evidence that any individual crisis caused the observed changes. The outcome is recorded continuity within AUBMC—a subsequent fibromyalgia-coded encounter at this institution—and not complete healthcare-system follow-up. Log-rank across phases: χ² = 30.1, df = 5, p = 1.4 × 10⁻⁵.
Disclaimer/Publisher’s Note: The statements, opinions and data contained in all publications are solely those of the individual author(s) and contributor(s) and not of MDPI and/or the editor(s). MDPI and/or the editor(s) disclaim responsibility for any injury to people or property resulting from any ideas, methods, instructions or products referred to in the content. |
© 2026 by the authors. Licensee MDPI, Basel, Switzerland. This article is an open access article distributed under the terms and conditions of the Creative Commons Attribution (CC BY) license (http://creativecommons.org/licenses/by/4.0/).
Copyright: This open access article is published under a Creative Commons CC BY 4.0 license, which permit the free download, distribution, and reuse, provided that the author and preprint are cited in any reuse.