

Submitted:
11 October 2026
Posted:
12 October 2026
You are already at the latest version
Abstract
Coaches often ask whether a muscle’s weekly sets should be spread over more days. The Weekly Net Stimulus model treats frequency as a major lever: each workout adds a stimulus with diminishing returns per set, and muscle is lost on each day outside a 48-hour post-workout window. I set out that model in testable form and compared it with an alternative fitted to 224 effects from 36 studies. Over about 10 weeks, doubling weekly sets from 6 to 12 added 1.7 percentage points of growth (95% interval 1.1 to 2.4), whereas moving 12 weekly sets from one session to three changed growth by +0.3 points (−1.6 to +2.1). Within studies, more frequent training differed from less frequent by +0.2 points (−1.3 to +1.7; 41 contrasts). Within the model’s recovery limits, once-weekly training at 9 sets gave 0.69 (−0.12 to 1.13) of the three-times-weekly gain, which does not exclude the predicted 0.14. Across all effects the ratio was 0.95 (0.44 to 1.39), which excludes the published model only if growth rises at least as steeply as the 0.4 power of its stimulus and swelling bias is under 1 point. Sessions above the recovery limits did not reduce growth (+1.4%, −0.3 to +3.2), although trials scanning 72 hours or more after training were too few to decide. On a ratio scale, most of the model’s predicted frequency effect comes from a daily loss that is calibrated, not measured. I state one prediction for a 12-month trial and provide a free calculator.
Keywords:
resistance training
; hypertrophy
; training frequency
; training volume
; meta-regression
; strength and conditioning
Introduction
Coaches planning hypertrophy training ask two questions: how many sets should a muscle get each week, and over how many days should those sets be spread? Coaches and athletes want answers that hold over a season or a year, but almost every trial that bears on these questions lasted about 10 weeks.
The meta-analytic evidence is broadly consistent. Pelland, Remmert, Robinson, Hinson, and Zourdos (2026) modelled 220 hypertrophy effects from 35 studies and found that weekly set volume was positively associated with growth, with diminishing returns, while the effect of frequency at a given weekly volume was “compatible with negligible effects”. An earlier pooled analysis of 13 volume-equated frequency trials found an effect-size difference of 0.07 (95% CI −0.02 to 0.17) between higher and lower frequencies (Schoenfeld, Grgic, & Krieger, 2019).
A different view is widely held in applied writing, where frequency is treated as one of the main levers on growth. Its clearest formal version is Beardsley’s Weekly Net Stimulus model, defined as “the sum of the Workout Hypertrophy Stimuli less the Weekly Atrophy Effect” (Beardsley, 2024). The stimulus from each workout rises with diminishing returns per set, along curves taken from dose-response meta-analyses (Beardsley, 2023, 2024). Muscle is lost on every day outside a 48-hour window after each workout, and the rate of loss is set from the statement that “a single workout comprising three sets to failure performed once per week is sufficient to maintain our current hypertrophy” (Beardsley, 2024). The model is meant to apply only to programmes “that do not involve fatigue accumulating” (Beardsley, 2024), and Beardsley (2025) gives “3 sets, 3 times per week”, “5 sets, 2 times per week” and “12 sets, 1 time per week” as examples of what can be recovered from between workouts. I treat these as the model’s recovery limits. Trials that find no frequency effect are attributed to unrecovered volume and to muscle swelling (Beardsley, 2025).
The model has been set out only in articles on Beardsley’s Patreon page, which are freely available but have not been peer reviewed (Beardsley, 2023, 2024, 2025). I cite them because the model is the object of the test, and Supplementary Section S3 reproduces its full parameterisation in case the posts are later edited or removed.
It is hard to test as written. Its parameters come from the literature rather than from fits to trial outcomes, its output is in arbitrary units with no stated scale to measured muscle size, and none of the three articles states a result that would count against it (Beardsley, 2023, 2024, 2025).
Here I put the per-workout model into a form that can be tested against trial outcomes and show where the existing data can and cannot decide. Alongside it I offer an alternative with coefficients estimated from public data, stated assumptions and public code, and I commit in advance to a prediction that a future trial could refute.
Methods
Data
I used the prepared hypertrophy file from the Open Science Framework archive of Pelland et al. (2026; OSF 6z3xu). It holds 220 effects from 35 studies, including 11 effects from non-training control groups in two studies. One eligible trial published after their search, Calzavara and Barroso (2026), was added in the same format, coded from its full text and computed with Pelland et al.’s setup script, giving 224 effects from 36 studies. No study by Barbalho and colleagues, some of whose volume trials have been retracted, is in the file. The file has 37 study identifiers because two studies each appear under two, and the added trial makes 38. Models were clustered on the identifier; clustering on the 36 publications changed no coefficient by more than 0.0001.
Weekly sets were counted as Pelland et al. count them, as fractional sets: 1 for a set that trains the muscle directly and 0.5 for one that trains it indirectly. Sessions per week were counted for the muscle measured. Load, effort, rest and exercise selection varied across trials and were not modelled. Studies ran for 6 to 32 weeks (median 10), only two ran 20 weeks or more (Bickel, Cross, & Bamman, 2011; Radaelli et al., 2015), and no group was measured at more than one time point.
Statistical Model
Effects were log response ratios. I fitted three-level meta-regressions by restricted maximum likelihood, with known sampling variances and random intercepts for study, for group within study and for effect. Pelland et al. fitted Bayesian versions of these models and reported marginal-effect tables rather than coefficients. Refitted to their 220 effects, their separate weekly-volume and frequency models were reproduced: 0.01769 for √(weekly sets + 1) against 0.01768 implied by their tables, and −0.0318 for 1/(frequency + 1) against −0.0319.
The model used here puts weekly sets and sessions into one fit to all 224 effects, with √(weekly sets + 1), an indicator for any training, ln(sessions per week) for training arms, duration and training status. Because the control groups are in the model, every plan’s gain is estimated against no training and no reference frequency is needed. Uncertainty was carried by 200,000 joint draws from the model’s sampling distribution with a fixed seed; the Monte Carlo standard error of the H1 ratio limits was below 0.005.
I used the logarithm of sessions rather than the 1/(frequency + 1) term of Pelland et al. With their term, the frequency effect at one session is fixed at two-thirds of its value at three, so the predicted ratio of once-weekly to three-times-weekly gain cannot fall below about 0.67 when the volume effect is positive. The per-workout model predicts ratios well below that, and a fair test needs a form that can represent them. The Pelland form is reported alongside for the practical questions.
For robustness I used cluster-robust standard errors with the CR2 small-sample correction and Satterthwaite degrees of freedom (Pustejovsky & Tipton, 2018; Tipton, 2015), and refitted with the sampling errors of outcomes from the same participants allowed to correlate at 0.5 to 0.8 (Pustejovsky & Tipton, 2022). Because a pooled frequency coefficient mixes differences within and between studies, and the between-study part is open to confounding (Thompson & Higgins, 2002), I ran two analyses restricted to within-study information. The first split the frequency term into each study’s mean and the deviation from it (Mundlak, 1978). The second was a random-effects meta-analysis of contrasts between arms of the same study that used the same measure and had weekly sets within 10% of each other.
Beyond Ten Weeks
The data contain no time course, so any statement about a year is a scenario. I used three growth curves, each scaled to the dataset’s gain at 10.5 weeks. The decelerating curve is the shape fitted by Roberts et al. (2026) to 3,237 observations from 480 studies, the slow-approach curve follows the whole-body fat-free mass curves of Trexler et al. (2026), and the early-plateau curve stops growth after 10.5 weeks, an extreme version of the plateau discussed by Kataoka et al. (2024). How differences between plans carry forward is also unknown. Under a proportional rule every plan follows the curve and relative differences persist; under a fixed rule the absolute difference reached at about 10 weeks stays constant. Neither rule lets the relative frequency difference grow with time.
Testing the Per-Workout Claims
The recovery limits are stated in sets performed, so these tests used the dataset’s directly counted sets and sessions, with fractional counts as a sensitivity analysis. Each test model contained the volume term, duration and training status plus the term being tested. I tested whether effects from sessions above the limits grew less than effects within them, and whether larger sessions grew less at equal weekly sets.
The model’s central quantitative claim concerns the ratio of once-weekly to three-times-weekly gain at equal weekly sets. At 9 weekly sets its published curve and loss rate give a ratio of 0.14. With its second published curve and a loss rate set by the same maintenance rule (my calculation), the ratio is 0.38; I call this the second-curve version. Comparing these with growth needs a map from net stimulus to measured growth, which the model does not give. Its definitions imply a linear map through zero, because the stimulus is “the amount of muscle growth (expressed in arbitrary units)” (Beardsley, 2024) and maintenance is zero net stimulus, so I used that map first and then a family of power, saturating and intercept maps. I estimated the ratio within the stated limits, across all effects, from the within-study coefficient, and in studies whose final scan was 72 hours or more after training. Because the larger sessions of once-weekly training could leave more swelling at the final scan, I also calculated how large a differential swelling offset would have to be to remove any exclusion.
Use of Generative AI
Generative AI was used in this work. Claude (Anthropic) wrote and ran the analysis code under my direction, and then checked reported numbers against the code outputs and claims against the full texts of cited sources, and assisted in building the calculator under my direction and instructions. I conceived the question, directed the analyses, made all decisions about content and interpretation, and take full responsibility for the article. All code and outputs are deposited (Boutagy, 2026), so every number can be reproduced from the public data.
Results
Weekly Sets and Sessions
The volume coefficient was 0.0171 (95% CI 0.0106 to 0.0237) per unit of √(weekly sets + 1) and the frequency coefficient was +0.0023 (−0.0136 to +0.0183) per unit of ln(sessions). The two were correlated (r = −0.40). Cluster-robust intervals were wider, 0.0072 to 0.0270 for volume and −0.0146 to +0.0193 for frequency, and correlated sampling errors changed neither coefficient materially. The volume coefficient lay between 0.0140 and 0.0214 in every specification fitted. It agrees with an earlier meta-regression of 15 studies, which estimated that each extra weekly set added 0.37% to the gain (Schoenfeld, Ogborn, & Krieger, 2017); the volume term here gives 0.36% per set between 1 and 10 weekly sets. The near-zero frequency term agrees with volume-equated syntheses that share many of these trials (Schoenfeld et al., 2019; Tao et al., 2026). Agreement between analyses of overlapping data is a check of reproducibility rather than independent validation; a more independent comparison is a Bayesian network meta-analysis of 119 studies, using a different method and a partly different pool, which found that all prescriptions comparably promoted hypertrophy (Currier et al., 2023).
Table 1 and Figure 1 give the expected differences for questions coaches commonly ask. Doubling weekly sets from 6 to 12 at two sessions a week added 1.7 percentage points over about 10 weeks. Moving the same weekly sets between one and four days changed the expected gain by 0.1 to 0.6 points, and every interval included zero. The intervals ran from about −2 to +3 points, so the data cannot rule out frequency differences larger than the gain from doubling weekly sets.
The within-study analyses gave the same answer. The within-study frequency coefficient was −0.00005 (95% CI −0.0171 to +0.0170), which for three sessions against one at fixed weekly sets is 0.0 percentage points (−1.9 to +1.9) over about 10 weeks. The 41 contrasts from 16 studies gave a pooled difference, more frequent minus less frequent, of +0.2 percentage points (95% CI −1.3 to +1.7, cluster-robust), with a 95% prediction interval of −4.6 to +5.0 for a new study.
As a scenario, 12 sets a week on two days gave 10.3% growth at 52 weeks (95% interval 3.3 to 17.6) under the decelerating curve with the proportional rule, 6.3% under the plateau and 19.3% under the slow approach, which is an upper bound rather than a central case (Figure 2). The 6-versus-12-set difference was +2.8 points under the decelerating curve, +5.3 under the slow approach and +1.7 under the plateau.
The per-workout claims
With direct counts, available for 203 training effects, 71 effects from 30 groups in 17 studies came from sessions above the stated limits. These effects grew 1.4% more than effects within the limits (95% CI −0.3 to +3.2; cluster-robust −1.3 to +4.2), where the per-workout account predicts a penalty. In the 8 of 83 groups with muscles on both sides of a limit, the within-group difference was +0.5% (−1.7 to +2.8). With fractional counts the difference was −0.08% (−1.7 to +1.5). In the subset scanned 72 hours or more after training, where swelling should matter least, sessions above the limits gave about 2 points less growth (−1.9%, 95% CI −6.9 to +3.4; 17 effects from 3 studies above the limits). That is the predicted direction, but the estimate is too imprecise to separate from zero or from a penalty larger than the whole gain. At equal weekly sets, ln(directly counted sets per session) gave −0.001 (95% CI −0.014 to +0.012), so no penalty for crowding sets into one session was detectable, although the intervals were wide, in line with the per-session analysis of the same data (Remmert, Pelland, Robinson, Hinson, & Zourdos, 2025).
Within the stated limits (132 training effects plus the 11 control effects), once-weekly training gave 0.69 (95% interval −0.12 to 1.13) of the three-times-weekly gain at 9 weekly sets, which excludes neither version of the per-workout model. Across all effects the ratio was 0.95 (0.44 to 1.39), which excludes both versions, the second-curve version narrowly (once-weekly gain minus 0.38 of the three-times-weekly gain: +3.2 points, 95% interval +0.1 to +6.5). This result includes effects from outside the model’s stated domain, so it is secondary to the within-limits result. The within-study coefficient gave 1.00 (0.51 to 1.51). In studies scanned 72 hours or more after training the ratio was 1.00 (0.39 to 1.62), which excludes the published version; the second-curve value sits at the lower edge, and the direct test of the difference does not exclude it (−0.01 to +7.2 points). Figure 3 shows these ratios against the model’s predictions.
Under a power map, the all-effects data exclude the published version only if the power is 0.41 or more, and the second-curve version only if it is 0.84 or more. Within the limits, no map in the family is excluded. In the all-effects data a differential swelling offset of 0.6 percentage points of muscle size in favour of the once-weekly arm would stop the data excluding the published version, and 0.1 points would do the same for the second-curve version.
Refitted in trained participants, in muscle thickness only, in cross-sectional area or volume only, and in studies scanning 72 hours or more after training, the frequency coefficient was +0.0077, +0.0040, −0.0007 and +0.0002, with 95% intervals between −0.039 and +0.038. The near-zero estimate is therefore not produced by one measurement type or by early scans.
Discussion and Conclusions
Across 224 effects, the number of weekly sets a muscle received was clearly related to growth over about 10 weeks; the number of days those sets were spread over was not clearly related to it. The best estimate of the frequency effect is close to zero both across and within studies. That should not be read as proof of no effect. The intervals still allow differences of about 2 percentage points either way at 10 weeks, which is as large as the effect of doubling weekly sets, and the smallest three-against-one difference at 9 sets that the data could detect with 80% power is about 2.6 points.
Within its stated recovery limits the data cannot exclude the per-workout model. Its published version is excluded across all effects only if growth rises at least as steeply as about the 0.4 power of net stimulus (near-linearly for the second-curve version) and swelling bias is smaller than a fraction of a percentage point. Without its loss term, the Weekly Net Stimulus curves give once-weekly to three-times-weekly ratios of 0.46 and 0.69 at 9 sets; the loss term brings them down to 0.14 and 0.38, and a per-session summation of the Pelland volume curve with no loss term gives 0.67. On a ratio scale the daily loss outside 48-hour windows supplies most of the predicted frequency effect, about 60% of the log ratio with either curve. That loss is calibrated from a maintenance dose rather than from any measurement of muscle lost between sessions, so it is the part of the model where a direct test would be most informative. The calibration itself fits the one maintenance study in the data: after 16 weeks of training, young adults doing 3 sets once a week changed mean myofibre area by −2.1% over 32 weeks, while 9 sets once a week produced further gains (Bickel et al., 2011). Two small trials of low-volume once-weekly training, in which 3 to 8 performed quadriceps sets gave 6% to 7% growth over 6 to 10 weeks, point the other way, although single small trials do not decide the question (Ostrowski, Wilson, Weatherby, Murphy, & Lyttle, 1997; Yue, Karsten, Larumbe-Zabala, Seijo, & Naclerio, 2018).
Swelling at the final scan could bias the ratio either way. Most frequency contrasts used ultrasound muscle thickness, often 48 to 72 hours after the last session. More sets in one session could leave more swelling and inflate the once-weekly arm, but in a three-times-weekly arm two earlier sessions sit closer to the final scan, which could inflate the more frequent arm instead. In untrained men echo intensity was still raised after 10 weeks of training, although the authors judged it minor against the gain in muscle area (Damas et al., 2016), and swelling common to both arms pulls any ratio towards 1. The one direct test found that 7, 14 or 21 sets did not change swelling in trained men (Alvarez et al., 2026), but no trial in these data measured swelling in both arms at the final scan. Thickness also tracks MRI-measured growth poorly (Balshaw et al., 2026), and a pooled log response ratio across thickness, area and fibre size is not a single physical quantity (Haun et al., 2019).
Radaelli et al. (2015), the longest volume dose-response trial in the data, suggest that the 10-week shape may not hold over longer periods. There, untrained men trained three times a week for about 24 weeks with 1, 3 or 5 sets per exercise; the model over-predicted the low-volume arms and under-predicted the high-volume arms, three of six arms fell outside the interval for the mean, and all six fell inside the 95% prediction interval. Two longer trials outside the data, both in older adults, are also relevant. In one, a third heavy session a week added nothing over two, while two heavy sessions with a light session between them gave about twice the gain, although the difference was not significant (Stec et al., 2017); this is what a fatigue or recovery account would predict, and the alternative model has no term for it. In the other, six months of training once, twice or three times a week after preparatory training produced no significant main effects on lean leg mass, closer to the plateau curve than the decelerating one (Turpela, Häkkinen, Haff, & Walker, 2017).
Predictions
I commit to one prediction. For 9 fractional sets a week to failure, done as one session of 9 sets or three sessions of 3, the alternative model predicts a once-weekly to three-times-weekly gain ratio of 0.95 (95% interval 0.44 to 1.39), the same at 12 and 52 weeks under the proportional rule. It is refuted by a 95% interval for the average ratio lying wholly below 0.44 or wholly above 1.39, or by a 52-week ratio clearly below the 12-week ratio in the same trial. The published per-workout model is refuted by an interval wholly above 0.14, and the second-curve version by one wholly above 0.38, under the linear map its definitions imply. In a simulated parallel trial of 100 per group with a between-person standard deviation of 6 points in 12-month change, the criterion for the alternative fires 98% of the time if the true ratio is 0.14 and 13% of the time if it is 0.38, while the criterion for the published version fires 95% of the time if the true ratio is 0.38. Because effects vary between groups by about 30% of the expected 10-week gain, the criteria are best applied to pooled estimates from replicated trials or to within-person designs.
The trial closest to this contrast is Calzavara and Barroso (2026), published after the Pelland et al. (2026) search and now included in the data. Eighteen trained men did 9 weekly quadriceps sets to failure at 80% of 1RM for 6 weeks, all in one session or spread over three days. As reported by the authors, vastus lateralis thickness rose 5.2% and 7.4%, and mid-thigh thickness 5.0% and 5.2% (group × time P = 0.215 and 0.987), ratios of about 0.70 and 0.96 (0.72 and 0.93 from the group means entered in the model). Both lie above the per-workout predictions and inside the predicted band. The trial is small and short, the assessor was not blinded, the exact delay between each arm’s last session and the final scan was not reported (participants avoided vigorous activity for 48 hours before each assessment, and the trial was coded on that basis), and because it is now in the data it is not an out-of-sample test. Adding it moved the frequency coefficient from +0.0019 to +0.0023 and changed no conclusion. Heaselgrave, Blacker, Smeuninx, McKendry, and Breen (2019), also in the data, gave trained men 9 weekly biceps sets in one session or 18 or 27 sets over two, with no significant differences between groups, but it has no volume-matched three-session arm.
A test of the prediction would randomise participants to one session of 9 sets or three sessions of 3 sets a week for 12 months, with MRI muscle volume at 0, 12, 26 and 52 weeks, scans at the same delay after the last session in every arm, a repeat scan 7 to 10 days after the final session and an oedema index at each scan. Applying the per-workout ratios to this model’s three-session gain gives once-weekly deficits at 52 weeks of 5.7 to 7.9 points under the decelerating curve. Assuming a between-person standard deviation of 5 to 7 points, detecting a 4-point gap with 90% power needs 34 to 66 per group, whereas a within-person design with each leg trained at a different frequency needs 18 to 30 participants if the standard deviation of the between-leg difference is 3 to 4 points and the true difference is zero.
Practical Applications
For coaches, adding weekly sets gave a clear gain over about 10 weeks, whereas spreading the same sets over more days produced no detectable difference in growth within the ranges these trials studied, although the confidence intervals do not exclude modest effects in either direction. Coaches can reasonably choose frequency for other reasons, such as session length, the athlete’s schedule, or strength, where Pelland et al. (2026) did find a benefit of higher frequency. The data do not show that once-weekly training is as good as more frequent training over a year, and they cannot rule out frequency effects of about 2 percentage points at 10 weeks. The data are equally consistent with spreading sets across the week. A free calculator, deposited with the code (Boutagy, 2026), lets coaches compare two plans for one muscle and shows the per-workout model’s prediction for the same plans.
Limitations
The 52-week results are scenarios that depend on a borrowed growth curve, one of them from a preprint, and on a carry-forward rule that fixes the long-term frequency ratio by assumption. The contrast meta-analysis rests on 16 studies, and the within-study frequency coefficient on the 23 study identifiers with a frequency contrast. Gains against no training rest on 11 control effects from two studies in untrained participants, so absolute gains are less precise than differences between plans. Most participants were young men, and the model concerns muscle size only. The comparison with the per-workout model depends on a map from stimulus to growth that the model does not state, on a loss rate for the second curve that I calculated, and on articles that are not peer reviewed or versioned. The refits are frequentist versions of the authors’ Bayesian models.
Conclusions
Over the roughly 10 weeks that trials cover, adding weekly sets produced a clear gain in muscle size, and spreading the same sets over more days produced no detectable difference, although the data cannot exclude modest effects either way. The per-workout model cannot be excluded within its own recovery limits, and on a ratio scale most of its predicted frequency effect rests on a daily loss that has been calibrated but not measured. Both models now make numerical predictions for the same 12-month trial. A measurement of muscle lost between sessions, and replicated trials of this contrast, would count against one of them.
Supplementary Materials
The following supporting information can be downloaded at the website of this paper posted on Preprints.org.
Funding
The author received no financial support for the research, authorship or publication of this article.
Ethics
Ethics approval was not required. This study analysed published, publicly available summary data and involved no participants.
Data availability
The data are those of Pelland et al. (2026; OSF 6z3xu), with the four effects of Calzavara and Barroso (2026) added. The added rows, the analysis code, all outputs, the supplement and the calculator are deposited on the Open Science Framework (https://doi.org/10.17605/OSF.IO/8456Q).
Conflicts of Interest
The author is director of the Boutagy Fitness Institute, a personal training business that also sells education courses on resistance training, including hypertrophy programming. The author of the Weekly Net Stimulus model also publishes paid educational content on resistance training, so the two work in the same market. The analysis uses only publicly available data, all code is openly deposited, and the calculator is free to use.
Use of generative AI
Generative AI was used in preparing this article. Claude (Anthropic) was used to write and run the analysis code under the author’s direction, and to check reported numbers against the code outputs and claims against the full texts of cited sources, and to assist in building the calculator. The author conceived the question, directed the analyses, made all decisions about content and interpretation, and takes full responsibility for the article.
References
- Alvarez, M., Enes, A., Wadhi, T., Barakat, C., Rauch, J., Barsuhn, A., … De Souza, E. O. (2026). Don’t sweat the swelling: Exercise volume’s transient effects in trained men. International Journal of Sports Medicine. Advance online publication. [CrossRef]
- Balshaw, T. G., Funnell, M. P., McDermott, E. J., Maden-Wilkinson, T. M., James, L. J., & Folland, J. P. (2026). Ultrasound muscle thickness is a poor index of criterion magnetic resonance imaging measures of resistance training-induced muscle growth. Medicine & Science in Sports & Exercise. Advance online publication. [CrossRef]
- Beardsley, C. (2023, November 7). The frequency-volume problem [Online article]. Strength and Conditioning Research (Patreon). Retrieved October 8, 2026, from https://www.patreon.com/SandCResearch/posts/frequency-volume-82752712.
- Beardsley, C. (2024, August 12). Weekly Net Stimulus [Online article]. Strength and Conditioning Research (Patreon). Retrieved October 8, 2026, from https://www.patreon.com/posts/weekly-net-102750269.
- Beardsley, C. (2025, July 7). Weekly volume [Online article]. Strength and Conditioning Research (Patreon). Retrieved October 8, 2026, from https://www.patreon.com/posts/weekly-volume-107900092.
- Bickel, C. S., Cross, J. M., & Bamman, M. M. (2011). Exercise dosing to retain resistance training adaptations in young and older adults. Medicine & Science in Sports & Exercise, 43(7), 1177–1187. [CrossRef]
- Boutagy, A. G. (2026). Open frequency-volume projection model: Code, outputs and calculator [Data and code]. Open Science Framework. [CrossRef]
- Calzavara, J., & Barroso, R. (2026). Effects of weekly set distribution on volume load, lower-body strength, and quadriceps muscle thickness in trained men. Journal of Strength and Conditioning Research. Advance online publication.
- Currier, B. S., McLeod, J. C., Banfield, L., Beyene, J., Welton, N. J., D’Souza, A. C., … Phillips, S. M. (2023). Resistance training prescription for muscle strength and hypertrophy in healthy adults: A systematic review and Bayesian network meta-analysis. British Journal of Sports Medicine, 57(18), 1211–1220. [CrossRef]
- Damas, F., Phillips, S. M., Lixandrão, M. E., Vechin, F. C., Libardi, C. A., Roschel, H., … Ugrinowitsch, C. (2016). Early resistance training-induced increases in muscle cross-sectional area are concomitant with edema-induced muscle swelling. European Journal of Applied Physiology, 116(1), 49–56. [CrossRef]
- Haun, C. T., Vann, C. G., Roberts, B. M., Vigotsky, A. D., Schoenfeld, B. J., & Roberts, M. D. (2019). A critical evaluation of the biological construct skeletal muscle hypertrophy: Size matters but so does the measurement. Frontiers in Physiology, 10, 247. [CrossRef]
- Heaselgrave, S. R., Blacker, J., Smeuninx, B., McKendry, J., & Breen, L. (2019). Dose-response relationship of weekly resistance-training volume and frequency on muscular adaptations in trained men. International Journal of Sports Physiology and Performance, 14(3), 360–368. [CrossRef]
- Kataoka, R., Hammert, W. B., Yamada, Y., Song, J. S., Seffrin, A., Kang, A., … Loenneke, J. P. (2024). The plateau in muscle growth with resistance training: An exploration of possible mechanisms. Sports Medicine, 54, 31–48. [CrossRef]
- Mundlak, Y. (1978). On the pooling of time series and cross section data. Econometrica, 46(1), 69–85. [CrossRef]
- Ostrowski, K. J., Wilson, G. J., Weatherby, R., Murphy, P. W., & Lyttle, A. D. (1997). The effect of weight training volume on hormonal output and muscular size and function. Journal of Strength and Conditioning Research, 11(3), 148–154. [CrossRef]
- Pelland, J. C., Remmert, J. F., Robinson, Z. P., Hinson, S. R., & Zourdos, M. C. (2026). The resistance training dose response: Meta-regressions exploring the effects of weekly volume and frequency on muscle hypertrophy and strength gains. Sports Medicine, 56(2), 481–505. [CrossRef]
- Pustejovsky, J. E., & Tipton, E. (2018). Small-sample methods for cluster-robust variance estimation and hypothesis testing in fixed effects models. Journal of Business & Economic Statistics, 36(4), 672–683. [CrossRef]
- Pustejovsky, J. E., & Tipton, E. (2022). Meta-analysis with robust variance estimation: Expanding the range of working models. Prevention Science, 23(3), 425–438. [CrossRef]
- Radaelli, R., Fleck, S. J., Leite, T., Leite, R. D., Pinto, R. S., Fernandes, L., & Simão, R. (2015). Dose-response of 1, 3, and 5 sets of resistance exercise on strength, local muscular endurance, and hypertrophy. Journal of Strength and Conditioning Research, 29(5), 1349–1358. [CrossRef]
- Remmert, J. F., Pelland, J. C., Robinson, Z. P., Hinson, S. R., & Zourdos, M. C. (2025). Is there too much of a good thing? Meta-regressions of the effect of per-session volume on hypertrophy and strength [Preprint]. SportRxiv. [CrossRef]
- Roberts, B. M., Robinson, Z. P., Pearson, J. R., Lawson, D. J., Remmert, J. F., Scheller, C., … Siedler, M. R. (2026). Modeling the trajectory of skeletal muscle hypertrophy during resistance training: A systematic review and meta-analysis [Preprint]. SportRxiv. [CrossRef]
- Schoenfeld, B. J., Grgic, J., & Krieger, J. W. (2019). How many times per week should a muscle be trained to maximize muscle hypertrophy? A systematic review and meta-analysis of studies examining the effects of resistance training frequency. Journal of Sports Sciences, 37(11), 1286–1295. [CrossRef]
- Schoenfeld, B. J., Ogborn, D., & Krieger, J. W. (2017). Dose-response relationship between weekly resistance training volume and increases in muscle mass: A systematic review and meta-analysis. Journal of Sports Sciences, 35(11), 1073–1082. [CrossRef]
- Stec, M. J., Thalacker-Mercer, A., Mayhew, D. L., Kelly, N. A., Tuggle, S. C., Merritt, E. K., … Bamman, M. M. (2017). Randomized, four-arm, dose-response clinical trial to optimize resistance exercise training for older adults with age-related muscle atrophy. Experimental Gerontology, 99, 98–109. [CrossRef]
- Tao, M., Yin, M., Zhong, Y., Xu, K., Zhu, C., Deng, J., … Li, Y. (2026). Impact of resistance training frequency on physiological and performance adaptations: A systematic review and meta-analysis. International Journal of Sports Science & Coaching, 21(4), 2628–2648. [CrossRef]
- Thompson, S. G., & Higgins, J. P. T. (2002). How should meta-regression analyses be undertaken and interpreted? Statistics in Medicine, 21(11), 1559–1573. [CrossRef]
- Tipton, E. (2015). Small sample adjustments for robust variance estimation with meta-regression. Psychological Methods, 20(3), 375–393. [CrossRef]
- Trexler, E. T., Jagim, A. R., Torres, M., Potter, N. D., Ketterly, J., Kerkow-Provo, Z., & Lane, M. T. (2026). Fat-free mass accretion: Limits, targets, and best practices. Strength and Conditioning Journal, 48(4), 521–539. [CrossRef]
- Turpela, M., Häkkinen, K., Haff, G. G., & Walker, S. (2017). Effects of different strength training frequencies on maximum strength, body composition and functional capacity in healthy older individuals. Experimental Gerontology, 98, 13–21. [CrossRef]
- Yue, F. L., Karsten, B., Larumbe-Zabala, E., Seijo, M., & Naclerio, F. (2018). Comparison of 2 weekly-equalized volume resistance-training routines using different frequencies on body composition and performance in trained males. Applied Physiology, Nutrition, and Metabolism, 43(5), 475–481. [CrossRef]
Figure 1.
Expected difference in muscle size at about 10 weeks for the questions in Table 1, with 95% intervals.
Figure 1.
Expected difference in muscle size at about 10 weeks for the questions in Table 1, with 95% intervals.
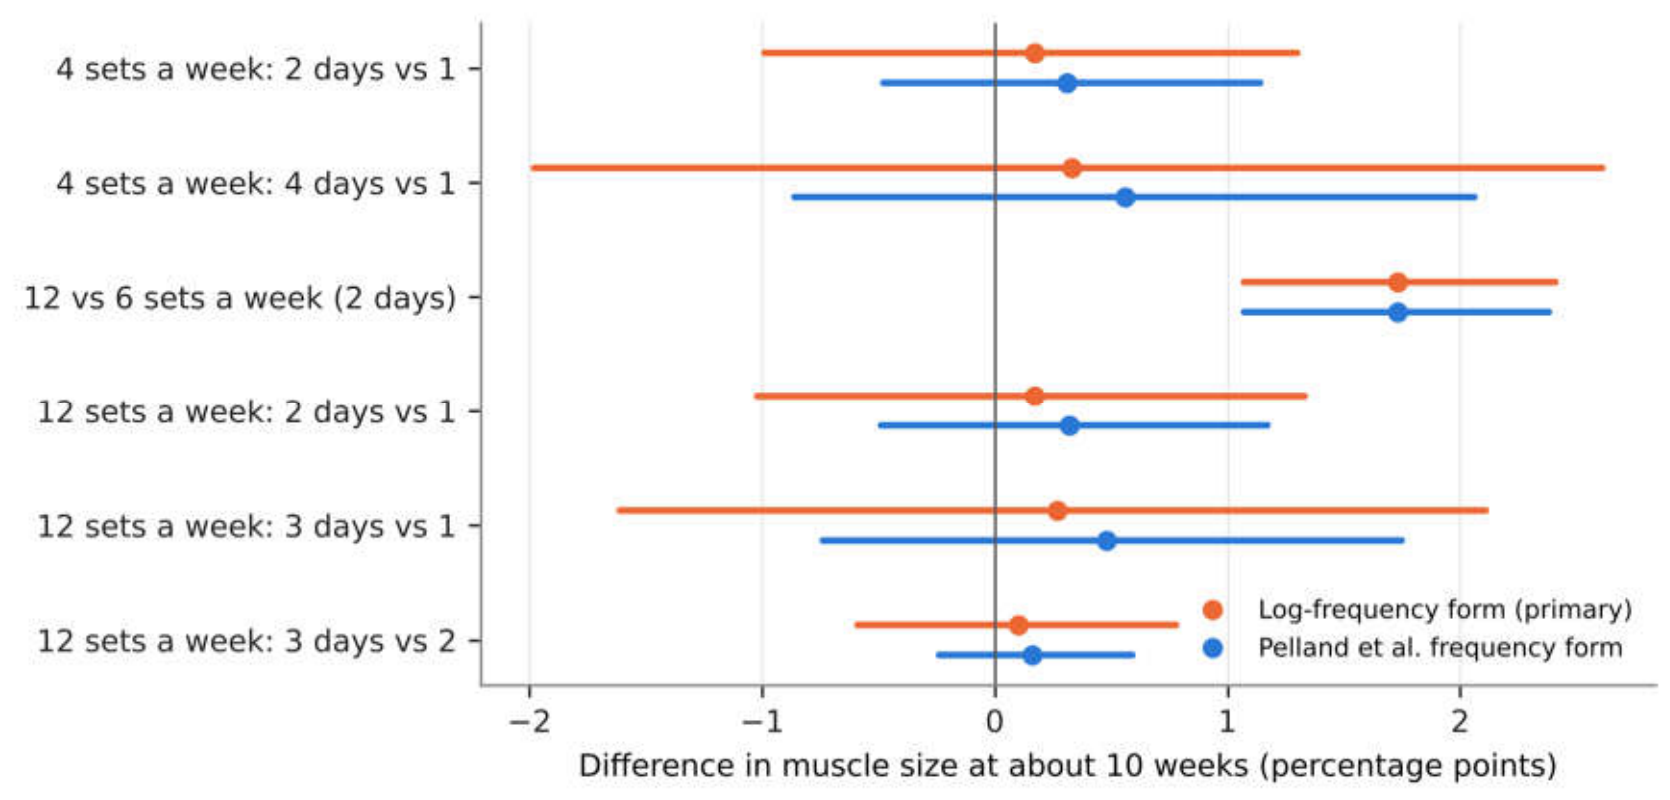
Figure 2.
Scenario: twelve weekly sets at two sessions a week under the three growth curves, with 95% intervals.
Figure 2.
Scenario: twelve weekly sets at two sessions a week under the three growth curves, with 95% intervals.
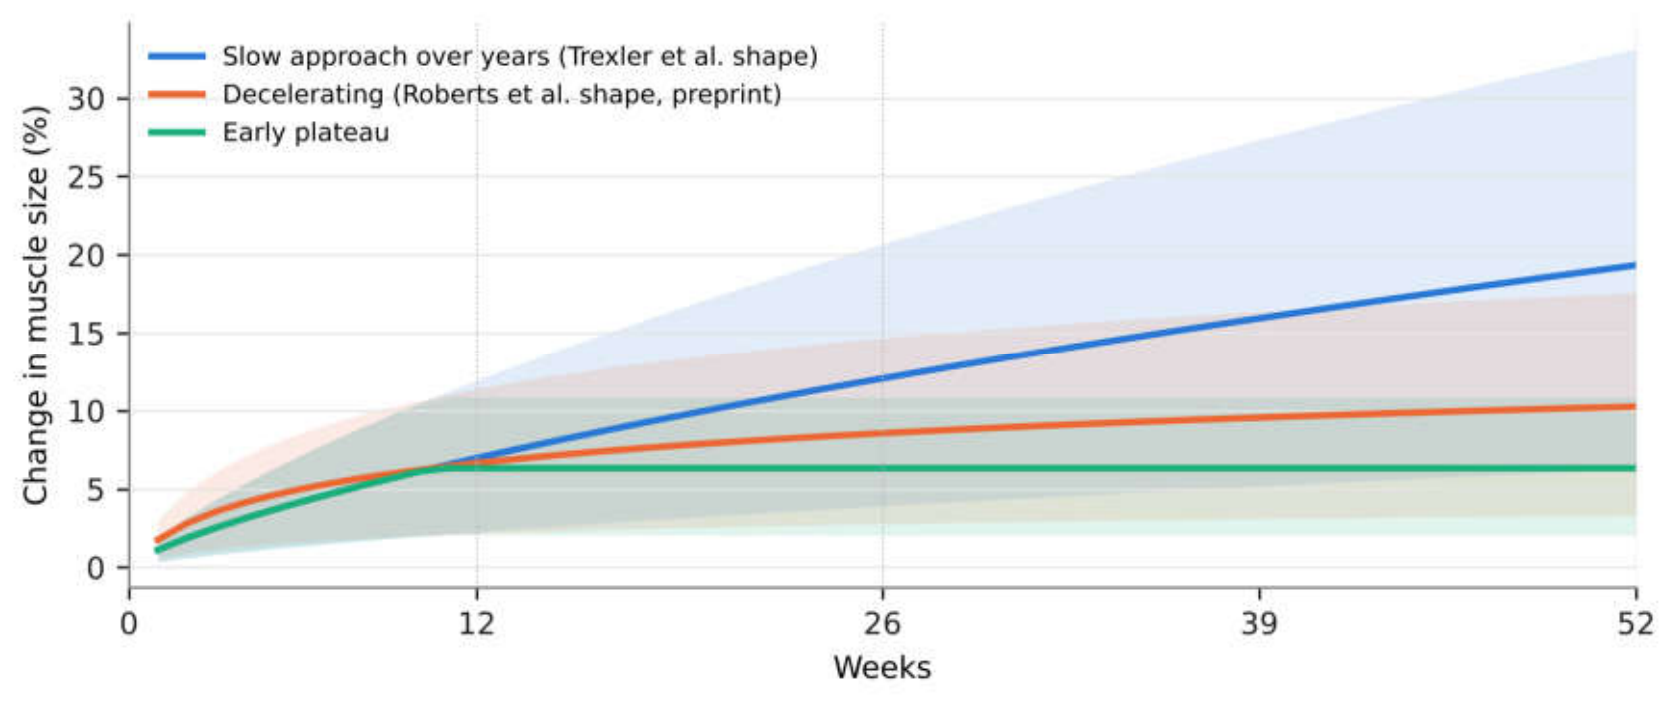
Figure 3.
Once-weekly gain divided by three-times-weekly gain at 9 weekly sets, with 95% intervals: all effects (the committed prediction, shaded band), effects within the per-workout model’s stated limits, studies scanning 72 hours or more after training, and the within-study coefficient. Under the proportional rule the ratios are the same at 10 and 52 weeks. The square and diamond mark the per-workout model’s two predictions under the linear map.
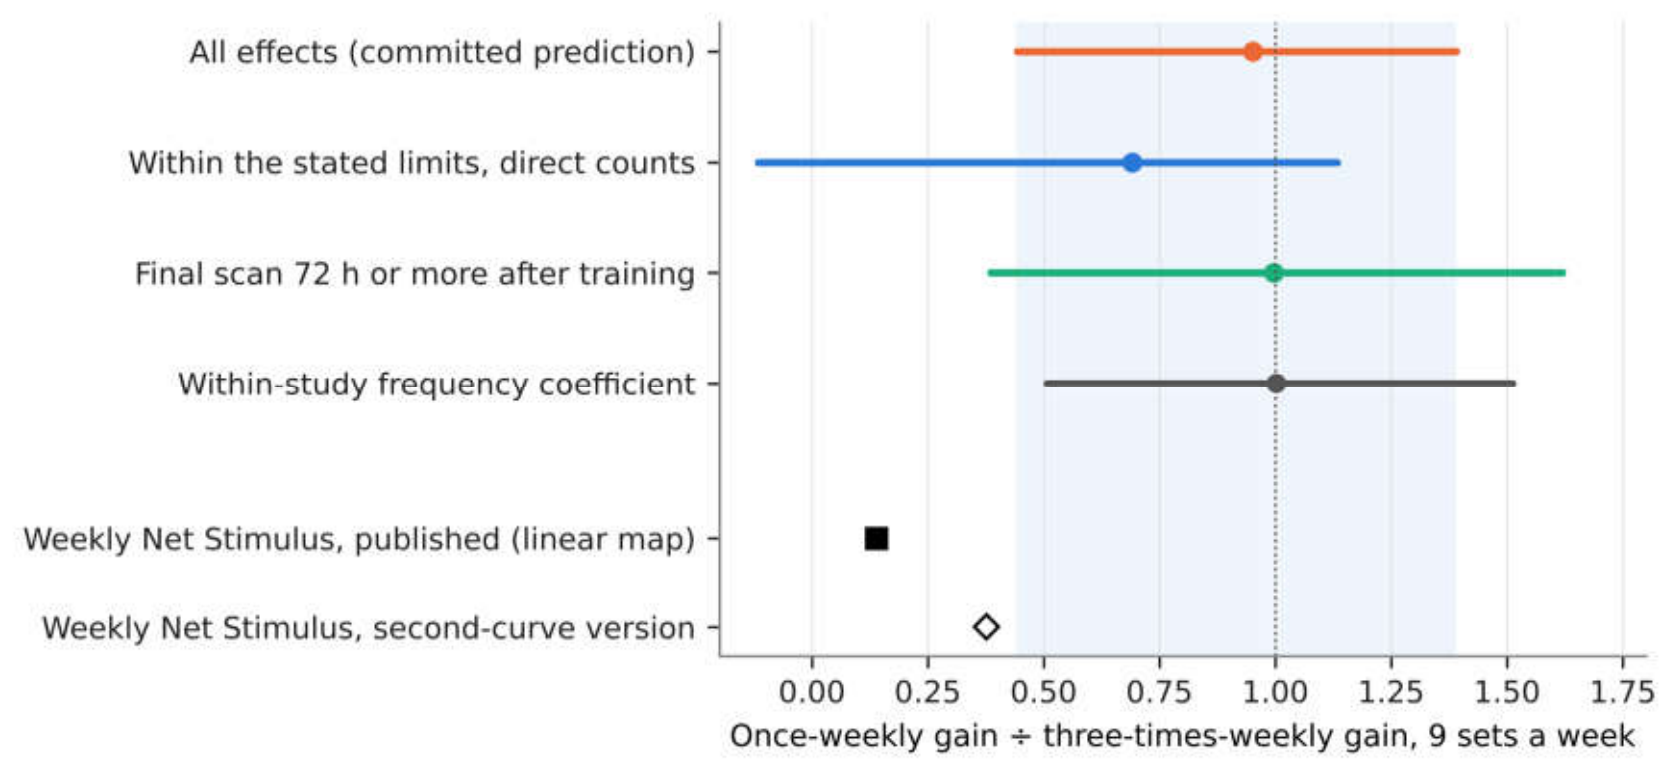

Table 1.
Expected difference in muscle size at about 10 weeks, percentage points, median (95% interval).
Table 1.
Expected difference in muscle size at about 10 weeks, percentage points, median (95% interval).
| Question | Log-frequency form | Pelland et al. form |
|---|---|---|
| 4 sets a week: 2 days instead of 1 | +0.2 (−1.0 to +1.3) | +0.3 (−0.5 to +1.1) |
| 4 sets a week: 4 days instead of 1 | +0.3 (−2.0 to +2.6) | +0.6 (−0.9 to +2.1) |
| 12 instead of 6 sets a week, 2 days | +1.7 (+1.1 to +2.4) | +1.7 (+1.1 to +2.4) |
| 12 sets a week: 2 days instead of 1 | +0.2 (−1.0 to +1.3) | +0.3 (−0.5 to +1.2) |
| 12 sets a week: 3 days instead of 1 | +0.3 (−1.6 to +2.1) | +0.5 (−0.7 to +1.8) |
| 12 sets a week: 3 days instead of 2 | +0.1 (−0.6 to +0.8) | +0.2 (−0.2 to +0.6) |
Disclaimer/Publisher’s Note: The statements, opinions and data contained in all publications are solely those of the individual author(s) and contributor(s) and not of MDPI and/or the editor(s). MDPI and/or the editor(s) disclaim responsibility for any injury to people or property resulting from any ideas, methods, instructions or products referred to in the content. |
© 2026 by the authors. Licensee MDPI, Basel, Switzerland. This article is an open access article distributed under the terms and conditions of the Creative Commons Attribution (CC BY) license (http://creativecommons.org/licenses/by/4.0/).
Copyright: This open access article is published under a Creative Commons CC BY 4.0 license, which permit the free download, distribution, and reuse, provided that the author and preprint are cited in any reuse.