
Submitted:
08 October 2026
Posted:
10 October 2026
You are already at the latest version
Abstract
Background and objective: Uveitis is a group of immune-mediated inflammatory diseases of the eye and remains one of the leading causes of preventable visual loss in working-age adults, with relapsing and treatment-refractory phenotypes closely tied to disturbed peripheral myeloid immune homeostasis. Conventional type 2 dendritic cells (CD1c+ cDC2) sit at the junction between JAK-STAT cytokine signaling and antigen presentation, yet systematic work that quantifies this axis into a reproducible, falsifiable, and explicitly evidence-graded candidate set remains scarce. The present study therefore set out to decode the molecular pattern of the JAK-STAT axis in peripheral blood CD1c+ cDC2 cells from patients with uveitis and, while explicitly annotating the strength of each layer of evidence, to prioritize a candidate-target panel that can guide subsequent wet-laboratory work. Methods: With GEO dataset GSE194060 (28 uveitis and 14 healthy-control samples of sorted CD1c+ cDC2 cells) as the discovery cohort and the 168 genes of KEGG hsa04630 (JAK-STAT signaling) as a fixed molecular axis, we deployed an end-to-end pipeline: differential expression and three-way intersection (expression layer) → cis-instrument inverse-variance weighted (IVW) Mendelian randomization with FinnGen R12 iridocyclitis as the outcome (genetic-association layer) → consensus clustering and immune-microenvironment profiling → candidate locking by the intersection of LASSO, random forest, and SVM-RFE (machine-learning layer) → multi-cohort single-gene diagnostic modeling of STAM2 → aqueous-humor single-cell atlas and cell-cell communication → myeloid pseudotime and computational perturbation → qPCR, DrugReflector active-learning virtual screening, and molecular docking. Each layer was reported against its prespecified thresholds; the primary DrugReflector signature was evaluated by 200 sample-level bootstrap resamples, Mendelian randomization by leave-one-out analysis, and the remaining layers by the sensitivity analyses prespecified for each layer. Results: At the expression level, 3,301 nominally differential genes, the 168 JAK-STAT axis genes, and 3,872 uveitis-associated genes converged on an 18-gene intersection that included IL10 and PDGFB. At the genetic-association level, IVW analysis identified 20 genes at nominal significance (p< 0.05), 8 of which passed Benjamini-Hochberg FDR (q< 0.05); IL10 (q= 0.1246), STAM2 (q= 0.1246), and PDGFB (q= 0.1573) reached nominal significance only, without passing FDR correction, and are reported as nominal associations. The intersection of the three machine-learning algorithms converged on the three transcripts IL10 / PDGFB / STAM2. A STAM2 single-gene diagnostic model reached an AUC of 0.7883 in the training cohort and 0.8056 and 0.8000 in two independent myeloid/monocyte cohorts (a same-study audit cohort yielded 0.6288 and is used for sensitivity analysis only). The aqueous-humor single-cell atlas resolved 37,664 cells, 18 clusters, and 20 cell types; STAM2 myeloid pseudotime identified four differentiation states; and computational perturbation placed STAM2 among the most sensitive nodes (|Z|=5.17). DrugReflector active learning identified a single compound, BRD-K11973162 (probability 0.1591), exceeding the prespecified reversal-probability threshold of 0.10 among 9,597 compounds. In the LPS-stimulated THP-1 myeloid inflammation model, qPCR showed significant up-regulation of all three candidates relative to unstimulated controls (IL10, 1.5365-fold, p=3.17×10⁻³; PDGFB, 1.6592-fold, p=4.76×10⁻⁵; STAM2, 1.8220-fold, p=1.95×10⁻⁵; n=3 per group, n=3+3 total). Conclusion: In uveitis peripheral CD1c+ cDC2 cells, this study delineates a JAK-STAT-centered IL10–PDGFB–STAM2 candidate panel defined by an integrated chain of expression, genetic-association, machine-learning, single-cell, and in vitro evidence, and proposes BRD-K11973162 as the sole computationally prioritized candidate compound under the prespecified reversal-probability threshold. The computational and single-cell results are computational inferences; qPCR provides experimental support at the level of relative mRNA expression in LPS-stimulated THP-1 cells and does not address protein levels, cellular function, or clinical diagnostic performance. The candidate panel and its causal direction still require confirmation in prospective multicenter cohorts and functional experiments.
Keywords:
uveitis
; CD1c+ cDC2
; JAK-STAT signaling
; Mendelian randomization
; machine learning
1. Introduction
Uveitis comprises a group of diseases characterized by immune-mediated intraocular inflammation that can involve the iris, ciliary body, vitreous, and retina, spanning anterior, intermediate, posterior, and panuveitis anatomic subtypes, and is one of the leading causes of preventable visual loss in working-age adults worldwide[1,2]. Its clinical phenotype is highly heterogeneous, and the relapsing-remitting course together with the systemic adverse effects of long-term immunosuppressive therapy imposes a substantial disease burden[3]. Accumulating evidence indicates that uveitis is not an isolated intraocular event but a focal manifestation of disturbed peripheral immune homeostasis[4]; consequently, locating the cellular and molecular nodes that drive persistent inflammation in the most accessible compartment, peripheral blood, carries clear translational value.
Among peripheral immune cells, CD1c+ conventional type 2 dendritic cells (cDC2) occupy the interface between innate and adaptive immunity because of their antigen-presenting capacity and cytokine secretion profile[5]. Through the JAK-STAT pathway, cDC2 integrate type I and type II interferon signals together with the IL-6, IL-10, and common γ-chain cytokine families[6], and their activation state participates in determining whether inflammation is initiated, amplified, or resolved. Aberrant JAK-STAT activation has repeatedly been linked to autoimmune and autoinflammatory eye disease[7], and TYK2, JAK2, and IFNAR signaling are also treatment nodes under investigation in several immune-mediated diseases[8,9]. Yet most studies remain at the level of a single cytokine, a single gene, or a single omics layer, and a systematic framework that simultaneously quantifies expression-layer, genetic-association-layer, and machine-learning-layer evidence along the same molecular axis, while explicitly annotating the strength of each layer, is still lacking. This missing hierarchy of evidence makes it easy to extrapolate from an axis-level finding to a target-level conclusion without justification, and it also makes the falsifiability of candidate targets difficult to assess.
To fill this gap, the present study deployed an end-to-end integrated analysis pipeline. Using the 168 genes of KEGG hsa04630 (JAK-STAT signaling) as a fixed molecular axis, we discovered and progressively delineated the molecular pattern in uveitis peripheral CD1c+ cDC2 cells: differential expression and a three-way intersection characterized expression changes within the axis; cis-instrument Mendelian randomization assessed genetic association[10,11]; consensus clustering and immune-microenvironment profiling characterized patient heterogeneity; three-algorithm machine learning locked a convergent candidate panel on the full set of nominally significant genes; multi-cohort single-gene diagnostic modeling, an aqueous-humor single-cell atlas, myeloid pseudotime, and computational perturbation provided multi-dimensional characterization; and in vitro qPCR validation, active-learning virtual screening, and molecular docking supplied a testable experimental clue. The goal of this study is not to claim a validated causal-diagnostic-therapeutic loop, but to provide an evidence-graded, directly reproducible, and experimentally falsifiable multi-layer candidate framework.
2. Materials and Methods
2.1. Data Source and Pre-Processing
The discovery cohort comprised sorted peripheral blood CD1c+ cDC2 samples from GEO dataset GSE194060 (GPL24676)[12], totaling 42 samples (28 uveitis, 14 healthy controls). Raw counts were normalized by variance-stabilizing transformation (VST) in DESeq2[13] and used for all downstream expression-based analyses; sample metadata included age and sex, and the differential expression model was adjusted for these covariates. The fixed molecular axis was defined as the 168 genes annotated to KEGG pathway hsa04630 (JAK-STAT signaling pathway), retrieved from the KEGG pathway record[14]. The uveitis-associated gene set was the broad permissive set comprising all nominal significant (p<0.05) differentially expressed genes in the discovery cohort.
For the genetic-association layer, GWAS summary statistics for iridocyclitis (H7_IRIDOCYCLITIS) from FinnGen R12 were used as the outcome[15,16,17], cis expression quantitative trait loci (cis-eQTL) of JAK-STAT axis genes were used as exposures, and the 1000 Genomes Phase 3 European population served as the reference panel. The single-cell characterization cohort was GEO dataset GSE229166 (uveitis aqueous-humor single-cell transcriptomics). Diagnostic modeling additionally used two external cohorts, GSE61399 (sorted CD14+ monocytes) and GSE66936 (intermediate monocytes); GSE195501, which originates from the same study as the discovery cohort, served only for internal audit and sensitivity analysis and does not carry independent-validation responsibility.
2.2. Differentially Expressed Analysis
Differential expression analysis was performed on the GSE194060 VST matrix with limma[18], including age and sex as covariates. Nominal significance was defined as two-sided p<0.05, and multiple testing was controlled by the Benjamini-Hochberg method with q values reported. Differentially expressed genes were intersected with the KEGG JAK-STAT axis gene set and the uveitis-associated gene set to obtain the expression-layer candidate set. Visualization used ggplot2 and ComplexHeatmap[19]. Functional enrichment used local GO and KEGG GMT files with a self-implemented hypergeometric test and BH control of the FDR; volcano plots display the full set of tested objects, and significance thresholds control color mapping only and are never used to drop data points.
2.3. MR Analysis
To evaluate the association between JAK-STAT axis genes and iridocyclitis at the genetic-association level, cis genetic variants of each axis gene were used as instruments, and the inverse-variance weighted (IVW) multiplicative random-effects model served as the primary method[20]. Instrument selection followed a prespecified protocol: a cis window of gene body ± 1 Mb, P<5×10⁻⁸, linkage disequilibrium r²<0.1, a 10,000 kb clumping distance, the 1000 Genomes Phase 3 EUR reference panel, and at least three independent instruments retained per gene. Each gene is reported with its number of instruments, per-instrument F statistic, and minimum F value; the prespecified weak-instrument gate was minimum F>30, and genes slightly below that gate but estimable under the sensitivity protocol are annotated and retained rather than silently dropped.
Sensitivity analyses[21] included the MR-Egger regression intercept (horizontal pleiotropy), Cochran's Q test (heterogeneity), MR-Egger and weighted-median estimates (alternative primary estimates), and leave-one-out analysis (single-instrument driving). To avoid misreading a methodological default as evidence of effect, two significance tiers are explicitly distinguished: nominal significance (p<0.05) and Benjamini-Hochberg-corrected q<0.05. Genes that did not pass FDR are reported at the nominal tier (nominal significance rather than FDR-corrected significance) and were never described as "genetically validated", "causally genetic", or a "diagnostic marker".
2.4. Machine Learning for Candidate Panel Construction
The machine-learning layer was fitted on the complete set of 20 nominally significant genes, not only the 8 displayed in the figure, so that the feature space and the statistical results remain consistent. Three complementary algorithms were run in parallel: LASSO logistic regression (glmnet[22], with a 10-fold cross-validation penalty selection and the lambda.1se non-zero-coefficient rule), random forest (randomForest[23], ranking variable importance by mean decrease in accuracy and taking the top 3), and support vector machine-recursive feature elimination (SVM-RFE[24], linear kernel, recursive elimination to k=8). Their intersection defined the machine-learning-layer consensus panel.
This three-method intersection is defined as the machine-learning-layer candidate-panel convergence. It should be noted that a three-method intersection reflects the stability of feature selection and does not by itself carry information on effect size or predictive performance; moreover, the between-group expression FDR q of all three candidate genes is greater than 0.12, so the support for this convergence rests on the nominal and machine-learning-convergence layers and is not taken alone as a diagnostic or causal conclusion. At the functional level, the locked panel was subjected to single-gene GSEA[25,26] against a whole-transcriptome background, reporting the number of BH-significant pathway entries and the minimum adjusted p value; immune-microenvironment correlation was assessed by LM22 CIBERSORT[27] deconvolution, with the overall reconstruction correlation and the number of multiple-testing-significant entries reported as they are, and directional trends never substituted for significance.
2.5. Molecular Subtyping Analysis
To characterize patient heterogeneity within the expression layer, consensus clustering[28] was performed on the uveitis subset (n=28) using the top 2,000 highly variable genes (ranked by median absolute deviation, MAD) after within-gene z-score standardization. The optimal cluster number K was determined by the cumulative distribution function (CDF) curve, silhouette score, and PAC jointly, with ConsensusClusterPlus parameters fixed at clusterAlg=hc, distance=pearson, pItem=0.8, pFeature=0.8, reps=500, seed=20261002, maxK=10. The clustering structure is presented as both a dimensionality-reduction scatter plot (PCA) and a sample-gene heat map, with the variance explained by each principal component reported; PCA is used for visualization only and does not participate in selecting K.
Subgroup functional differences were assessed by preranked GSEA based on limma moderated-t statistics (fgsea engine, eps=0, nPermSimple=10000, BH correction), with redundant terms removed at leading-edge Jaccard >0.5 before representative pathways were shown. Immune-microenvironment profiling used CIBERSORT-style deconvolution of the LM22 signature matrix: fit-QC was run first and the overall reconstruction correlation r reported, then Kruskal-Wallis tests compared immune-cell fractions between the two subgroups, and significance was defined by cross-cell-type BH-corrected q<0.05. All subgroup comparisons were performed within the same cohort and carry no independent-validation responsibility.
2.6. Single-Cell Transcriptomic Analysis
The aqueous-humor single-cell atlas was obtained from GSE229166. After quality control removed low-quality cells, Seurat[29] was used for normalization, highly variable gene selection, principal component analysis, and graph-based clustering, visualized with t-SNE and UMAP; cell-type annotation was based on canonical marker genes and reference annotation sets. Cell-cell communication analysis used CellChat[30] with a ligand-receptor database as background, reporting the number of significant communication edges, ligand-receptor pairs, and signaling pathways. Myeloid pseudotime analysis used Monocle3 trajectory inference[31], computational gene perturbation used scTenifoldKnk simulation[32], and the protein-protein association network was retrieved from the STRING database[33]. All single-cell analyses were performed within the same aqueous-humor microenvironment and are descriptive atlas characterization; the dataset contains no healthy controls and is therefore not used for direct disease-versus-health comparison.
2.7. Therapeutic Agent Estimation and Molecular Docking
Therapeutic candidate discovery used the DrugReflector active-learning framework[34], with the disease transcriptomic signature built from GSE194060 as input. The primary-analysis signature was defined as all differentially expressed genes with limma BH FDR q<0.05 (683 genes), with all other genes set to zero; on this basis, the reversal probability of each of 9,597 compounds against the disease signature was computed (a higher probability indicates that the compound's perturbation profile tends to shift the disease state toward the control state). The reversal-probability threshold was prespecified at 0.10, and any compound exceeding the threshold was treated as a computationally prioritized candidate.
Robustness was assessed in three complementary ways: first, a signature-threshold sensitivity analysis (FDR 0.01, FDR 0.10, and FDR 0.05 plus |logFC|>0.5); second, a negative control using the unfiltered whole-transcriptome signature; and third, 200 sample-level bootstrap resamples (resampling disease/control samples with replacement, recomputing the v-score, and re-predicting) to report the distribution range of the highest reversal probability and the exceedance fraction.
Molecular docking used the three candidate targets (IL10, PDGFB, STAM2) as receptors and the candidate compound together with related approved small molecules as ligands, in a rigid-receptor/flexible-ligand scheme, reporting the lowest binding free energy (kcal/mol)[35]; a binding energy ≤ −7.0 kcal/mol was used as the prioritization display threshold. Docking results are computational predictions of binding conformation only, used to indicate priority, and do not constitute measured affinity or pharmacodynamic evidence.
2.8. Cell Culture, LPS Stimulation, and qPCR Validation
The human monocytic cell line THP-1 was obtained from the Shanghai Institute of Cell Biology (Shanghai, China) and used as a myeloid surrogate for peripheral CD1c+ cDC2 cells. Cells were cultured in RPMI-1640 medium supplemented with 10% fetal bovine serum (FBS) and 1% penicillin–streptomycin, and maintained at 37 °C in a humidified incubator containing 5% CO₂. The medium was refreshed every 2–3 days, and cells were passaged at an appropriate density.
To model myeloid inflammation, THP-1 cells were divided into an unstimulated control group and an LPS-stimulated group; the stimulated group received lipopolysaccharide (LPS), whereas the control group was cultured under otherwise identical conditions. Three independent biological replicates were performed per group, each with three technical replicates. Total RNA was isolated using the TRIzol reagent (TaKaRa, Beijing, China), and its concentration, purity, and integrity were assessed using a NanoDrop spectrophotometer (Thermo Scientific, Waltham, MA, USA). Reverse transcription was performed using HiScript II Q RT SuperMix for qPCR (+gDNA wiper) alongside a gDNA eraser (Vazyme, Shanghai, China). Quantitative real-time PCR was carried out with SYBR Green MasterMix (11203ES50, YEASEN, Shanghai, China) and analyzed through StepOne Software v.2.3 (Applied Biosystems, Carlsbad, CA, USA) to measure the mRNA expression of IL10, PDGFB, and STAM2, using GAPDH as the reference gene. Relative expression was calculated by the 2^(−ΔΔCt) method after GAPDH normalization, with the mean ΔCt of the unstimulated control group as the calibrator. Between-group differences were assessed on the ΔCt scale using a two-sided independent-samples t test, with p<0.05 considered significant. Conclusions from this section refer to relative mRNA levels only and do not imply protein-level or functional evidence.
2.9. Statistical Analysis
Normality of continuous variables was assessed by the Shapiro-Wilk test; approximately normal variables were compared by t test, non-normal variables by Wilcoxon rank-sum test, and both test results are reported together. Multiple comparisons were controlled by the Benjamini-Hochberg method throughout. For Mendelian randomization, weak-instrument bias is reported as the per-gene minimum F value. Robustness of virtual screening was assessed by the three-way combination of 200 bootstrap resamples, leave-one-out analysis, and multi-signature-threshold sensitivity analysis. All statistical tests were two-sided, and p<0.05 defined nominal significance; diagnostic-model AUCs and their confidence intervals were computed with pROC[36]; any uncorrected result is explicitly labelled "nominal" in the Results. Analyses were performed in R 4.x and Python 3.x, and all scripts, source-data tables, and render-audit files are archived with the project.
3. Results
3.1. Identification of JAK-STAT–Associated DEGs for Uveitis Patients
Differential expression analysis of CD1c+ cDC2 cells from 28 uveitis and 14 healthy-control samples in GSE194060 identified 3,301 nominally significant differentially expressed genes (p<0.05). Intersecting these with the 168 genes of KEGG hsa04630 (JAK-STAT signaling) and with the 3,872 uveitis-associated genes defined in the same cohort converged on 18 genes, including CSF2RA, CSF3R, IFNAR1, IFNAR2, IFNGR1, IFNGR2, IL10, IL15, IL21R, IL6ST, IL7, JAK2, JAK3, MTOR, PDGFB, PIAS1, PIK3CD, and PTPN6 (Figure 1A–C). This set was significantly enriched for cytokine-cytokine receptor interaction, the JAK-STAT cascade, and myeloid immune activation (Figure 1D). This layer serves to delimit the candidate space for the subsequent analyses.
3.2. JAK-STAT–Associated Risk Gene Identification for Uveitis Patients
Cis-instrument Mendelian randomization with FinnGen R12 iridocyclitis as the outcome and JAK-STAT axis genes as exposures identified 20 genes at nominal significance (p<0.05), 8 of which passed Benjamini-Hochberg FDR correction (q<0.05) (Figure 2A–I). The figure display is fixed at 8 genes: the three targets defined by the machine-learning-layer convergence (IL10, PDGFB, STAM2) are included first, and the remaining strongest nominal genes are added by primary-analysis p value to satisfy both cross-layer traceability and panel readability. Notably, IL10 (p=0.03165, q=0.1246), STAM2 (p=0.03259, q=0.1246), and PDGFB (p=0.04495, q=0.1573) reached nominal significance only and did not pass FDR in this layer, so their genetic association is interpreted as a nominal association; CCND1, EPOR, TYK2, IL2RB, and IL27RA passed both the nominal and the FDR thresholds. Some genes had few available instruments (IL2RB 3, IL27RA 4, IL10 5); the prespecified weak-instrument gate was minimum F>30, and a few displayed genes including CCND1 (29.77) and STAM2 (29.79) fell slightly below that gate and were retained under the prespecified sensitivity protocol with per-gene annotation in the legend. The expression layer and the genetic-association layer overlap on five genes: CSF3R, IFNGR2, IL10, JAK2, and PDGFB. It should be noted that the displayed subset is fixed by "the three machine-learning-converged targets (IL10/PDGFB/STAM2) plus the strongest nominal genes by primary-analysis p value"; therefore, of the five overlapping genes above, CSF3R, IFNGR2, and JAK2 do not enter the 8-gene displayed subset, and the full 20-gene forest plot is provided in Supplementary Figure S1.
3.3. JAK-STAT–Associated Molecular Subgroup Identification for Uveitis Patients
In the uveitis subset (n=28), consensus clustering on the top 2,000 highly variable genes after within-gene standardization was supported at K=2 by the CDF, silhouette score, and PAC jointly, dividing samples into C1 and C2 (n=9 and n=19) (Figure 3A–D). The first two principal components explained 18.02% and 12.53% of the variance, and the two subgroups separated in low-dimensional space. Preranked GSEA based on moderated-t statistics showed significant differences in inflammatory cytokine signaling and myeloid activation pathways between the subgroups, with the most significant pathway reaching a BH-adjusted p of 1.3966×10⁻¹² (Figure 3E); the full differential expression curve ordered by log2FC retained the true extreme genes and FDR-based coloring (Figure 3F). LM22 CIBERSORT deconvolution yielded an overall mean fit correlation of r=0.4888 and identified four immune-cell types with significant between-group differences (Figure 3G). This subtyping is based on within-cohort structure and is descriptive.
3.4. JAK-STAT–Associated Hub Gene Identification for Uveitis Patients
LASSO, random forest, and SVM-RFE were run in parallel on the complete set of 20 nominally significant genes: LASSO retained seven features at lambda.1se (EPOR, JAK2, CSF3R, IL10, STAM2, IFNGR2, PDGFB) (Figure 4A); random forest ranked IL10, STAM2, and PDGFB as the top 3 by mean decrease in accuracy (Figure 4B); and SVM-RFE at k=8 retained JAK2, CDKN1A, STAM2, PDGFB, EPOR, IFNL1, IL10, PRLR (Figure 4C). The three-way intersection converged on the three transcripts IL10, PDGFB, and STAM2 (Figure 4D) and was mapped to chromosomal positions (Figure 4E). This convergence defines the three central nodes of the candidate panel for the whole paper: the between-group expression p values are 0.032, 0.045, and 0.033, with BH-corrected q all greater than 0.12. GSEA of the locked panel against the whole-transcriptome background yielded 133 BH-significant pathway entries among 15,142 ranked genes, with a minimum adjusted p of 0.0146 (Figure 4F), indicating that the signal reflected by the panel concentrates on cytokine-receptor interaction and immune-regulation processes. Immune-microenvironment correlation yielded an overall reconstruction correlation of r=0.4846, with only the PDGFB/resting-NK association reaching nominal significance after multiple testing and no robust myeloid infiltration association (Figure 4G).
3.5. JAK-STAT–Associated Diagnostic Model Construction for Uveitis Patients
Among the three genes of the candidate panel, STAM2 showed a relatively robust and reproducible discriminative signal across multiple myeloid/monocyte cohorts and was therefore selected as the anchor gene for the diagnostic-modeling template (Figure 5A–G). In the training cohort, the STAM2 single-gene logistic regression model reached an AUC of 0.7883 (95% CI 0.6497–0.9269); in the external CD14+ monocyte cohort GSE61399 (n=17, 8/9) and the intermediate-monocyte cohort GSE66936 (n=9, 5/4), the AUC reached 0.8056 (95% CI 0.588–1.000) and 0.8000 (95% CI 0.408–1.000), respectively (Figure 5D–G). Between-group expression comparison showed significant up-regulation of STAM2 in disease samples (Welch p=0.008865; Wilcoxon p=0.001996) (Figure 5A). It must be reported that the GSE195501 cohort, which originates from the same study as the discovery cohort, yielded an AUC of only 0.6288; it is assigned to internal audit and sensitivity analysis and is not counted as independent-validation evidence. Overall, the diagnostic performance of STAM2 reached the 0.8 range in some external cohorts, but the training cohort itself did not cross the 0.8 threshold and the external cohorts are small, so it does not yet constitute a clinical-grade diagnostic marker.
3.6. Cell Chat and Metabolic Heterogeneity in Aqueous Humor Microenvironment for Uveitis Patients
Quality control and clustering of the GSE229166 aqueous-humor single-cell transcriptome retained 37,664 cells, 15,595 genes, and 23 donors, identifying 18 cell clusters annotated into 20 cell types (Figure 6A–C). Cell-fraction analysis showed that myeloid cells (monocyte/macrophage lineage and dendritic cells) constitute one of the main components of the aqueous-humor immune microenvironment (Figure 6D). CellChat analysis reconstructed 320 significant communication edges, 6,095 ligand-receptor interactions, and 59 signaling pathways, suggesting an active cytokine-chemokine communication network centered on myeloid cells in the aqueous-humor microenvironment (Figure 6E); a metabolic pathway dot plot further showed heterogeneity of inflammation-related metabolic programs (Figure 6F). Because the dataset contains no healthy controls, these results represent an internal descriptive atlas of the uveitis aqueous-humor microenvironment only and cannot be used for direct disease-versus-health comparison.
3.7. JAK-STAT–Associated Hub Gene Molecular Mechanisms in Aqueous Humor Myeloid Cells for Uveitis Patients
Focusing on the myeloid compartment, we constructed a pseudotime trajectory comprising 2,157 cells, converging on four differentiation states, with macrophages inferred as the trajectory start state (Figure 7A–C). The monocle3 trajectory reconstructed 111 significant gene-transition edges, and STAM2 expression varied dynamically along the myeloid differentiation path. To further indicate the position of STAM2 in the myeloid regulatory network, computational gene perturbation (in-silico perturbation) was simulated with scTenifoldKnk; among the reproducible gene set consistent across multiple random seeds, STAM2 ranked in the top 10 perturbation-sensitive genes with an absolute Z of 5.17 (Figure 7D–E). The protein-protein association network displayed STRING scores score≥300 as a high-confidence display layer and score 150–300 only as a density background layer, giving 26 nodes and 125 displayed edges in total, of which 78 are high-confidence display edges and 47 serve only to convey network density (Figure 7F). Enrichment analysis displayed 15 representative terms (3 GO_BP, 3 GO_CC, 6 GO_MF, and 3 KEGG). These perturbation and network results are computational predictions.
3.8. Therapeutic Enrichment Targeting JAK-STAT–Associated Hub Genes for Uveitis Patients
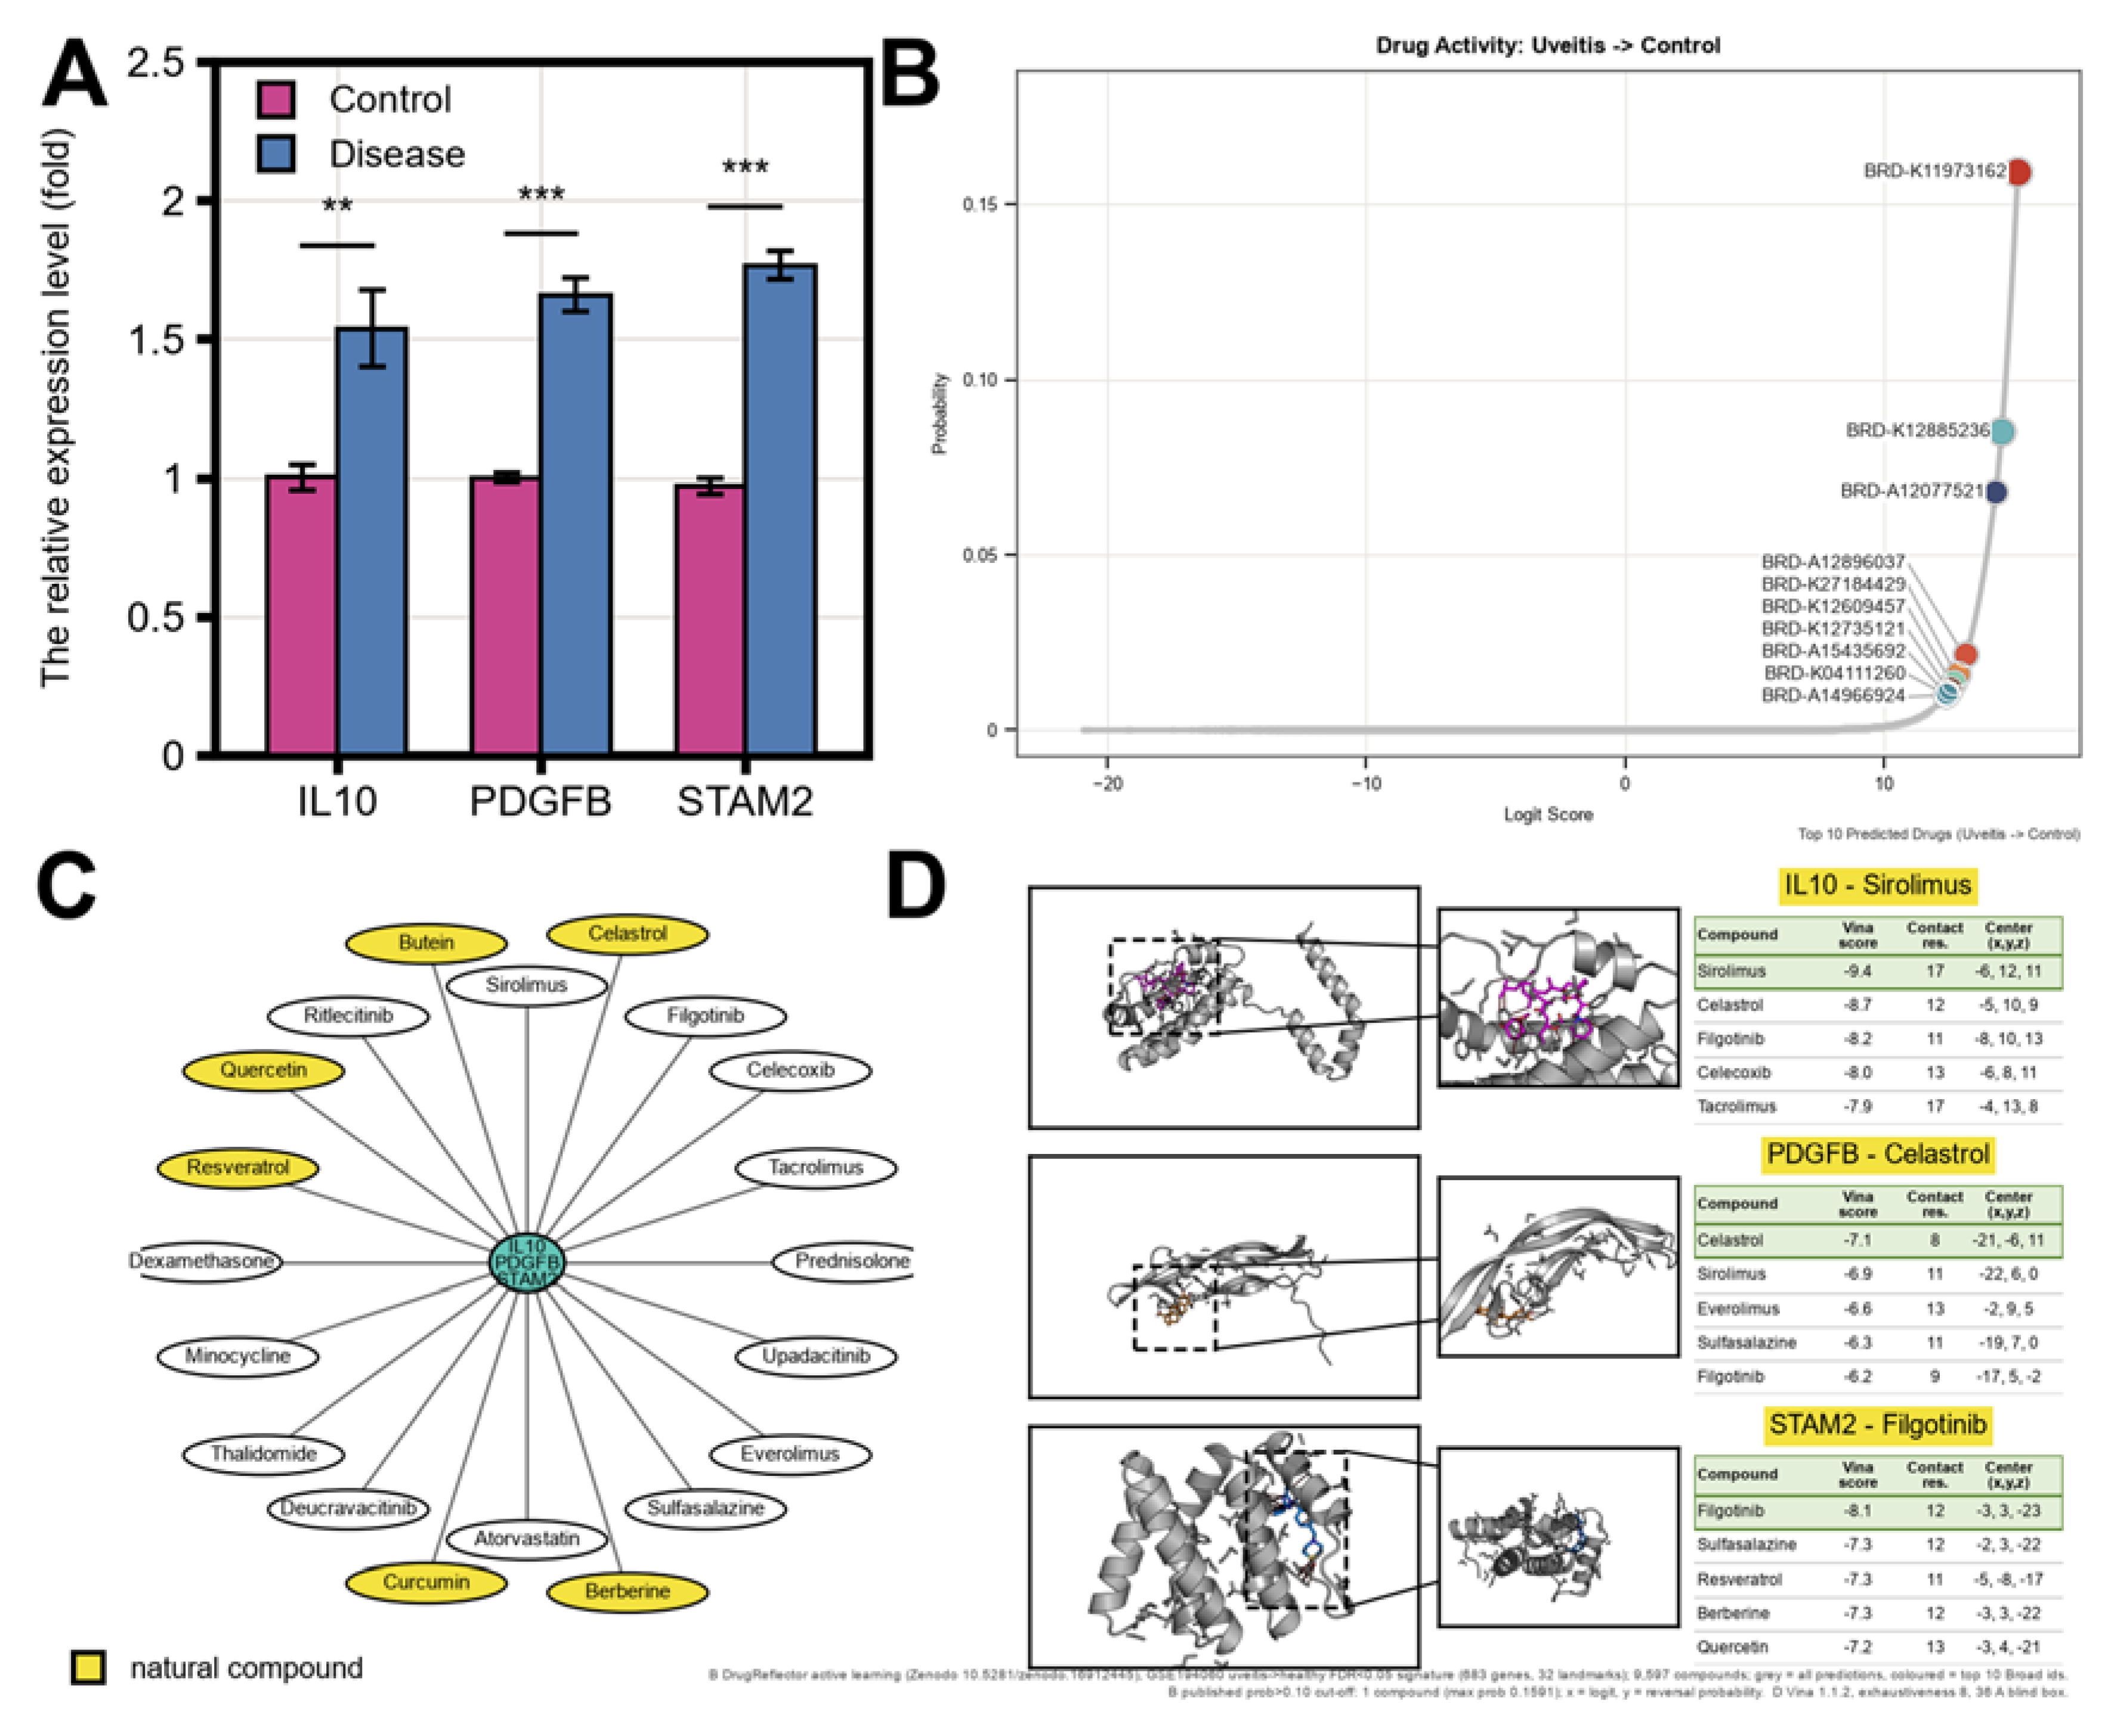
qPCR showed that all three candidate genes were significantly up-regulated in LPS-stimulated THP-1 cells relative to unstimulated controls: IL10 relative expression 1.5365-fold (p=3.17×10⁻³, **), PDGFB 1.6592-fold (p=4.76×10⁻⁵, ***), and STAM2 1.8220-fold (p=1.95×10⁻⁵, ***) (n=3 per group, n=3+3 total, Figure 8A). This result reflects the direction of the three candidates at the relative mRNA level. At the level of computational drug prioritization, DrugReflector active learning used the primary signature built from 683 FDR-significant genes and computed reversal probabilities for 9,597 compounds, identifying the single compound BRD-K11973162 (model logit 15.18; softmax-calibrated reversal probability 0.1591) exceeding the prespecified threshold of 0.10 (Figure 8B). As a sensitivity analysis, the unfiltered whole-transcriptome signature yielded a maximum reversal probability of only 0.0128, with 0/9,597 compounds exceeding the threshold; across 200 sample-level bootstrap resamples, the maximum reversal probability of the primary signature exceeded 0.10 in 200/200 resamples, ranging from 0.1345 to 0.2001. Molecular docking further predicted binding conformations for representative compound-target combinations of the candidate panel, with IL10–Sirolimus (−9.40 kcal/mol), IL10–Celastrol (−8.70 kcal/mol), IL10–Filgotinib (−8.20 kcal/mol), STAM2–Filgotinib (−8.10 kcal/mol), PDGFB–Celastrol (−7.10 kcal/mol), and STAM2–Sulfasalazine/Berberine/Resveratrol (all −7.30 kcal/mol) reaching the binding-energy display threshold of ≤ −7.0 kcal/mol (Figure 8C–D). These drug and docking results are computational prioritization clues.
4. Discussion
Using peripheral-blood CD1c+ cDC2 cells from uveitis patients as the entry point, this study describes a JAK-STAT-related molecular axis composed of IL10, PDGFB, and STAM2 and, through parallel layers of expression, genetic-association, machine-learning, single-cell, and drug-prioritization evidence, defines it as a candidate panel potentially linking cDC2 immune dysregulation to intraocular inflammation in uveitis. Using the 168 genes of the KEGG hsa04630 JAK-STAT pathway as a fixed molecular axis, differential expression and a three-way intersection in GSE194060 converged on 18 candidate genes, cis-instrument Mendelian randomization against FinnGen R12 iridocyclitis yielded 20 nominally significant genes (8 of which passed BH-FDR), and a three-algorithm machine-learning intersection on this complete nominal gene set further converged on IL10, PDGFB, and STAM2 [10,11]. IL10, PDGFB, and STAM2 act as central nodes of this panel, and their altered expression was captured both in the discovery cohort and in independent myeloid/monocyte cohorts, suggesting that cDC2 cells may be an associated node between peripheral immune imbalance and intraocular inflammation in uveitis [3,5,8]. Although JAK-STAT signaling and the IL-10, PDGF, and STAM families have each been extensively recognized in immune regulation, myeloid activation, and cytokine-receptor trafficking, their parallel characterization along one molecular axis within a single disease framework, together with a testable candidate panel, has remained largely unexplored in uveitis [6,37,38].
The expression direction of IL10, PDGFB, and STAM2 in CD1c+ cDC2 cells and the aqueous-humor myeloid compartment is highly consistent with the established concept of systemic immune activation in uveitis. Mechanistically, IL10 represents immunosuppressive cytokine signaling, whereas PDGFB represents myeloid-mesenchymal pro-fibrotic and vascular-remodeling signaling; both appear in the overlap between the expression intersection and the genetic-association layer, suggesting that this axis may simultaneously carry functional pressures toward impaired inflammation resolution and tissue remodeling [6,37]. STAM2, an adaptor protein of the Hrs–STAM complex, governs the spatiotemporal amplitude of JAK-STAT signaling by regulating endosomal sorting and degradation of the IFN-α receptor [38]; it showed differentiation-state-dependent expression along the myeloid pseudotime trajectory and provided the most stable discriminative signal among independent myeloid/monocyte cohorts (training AUC 0.7883; external cohorts 0.8056 and 0.8000), while computational perturbation positioned it as a highly sensitive node in the myeloid regulatory network (|Z| = 5.17). We therefore propose STAM2 as a previously unappreciated regulatory node linking endosomal sorting, sustained JAK-STAT signaling, and myeloid activation in uveitis. Therapeutically, active-learning screening identified BRD-K11973162 as the only compound among 9,597 exceeding the prespecified reversal-probability threshold, and molecular docking further nominated compound–target combinations with binding energies ≤ −7.0 kcal/mol for IL10, PDGFB, and STAM2 (e.g., IL10–Sirolimus −9.40 kcal/mol; STAM2–Filgotinib −8.10 kcal/mol), providing computational intervention leads for this axis; qPCR in the LPS-stimulated THP-1 myeloid inflammation model confirmed significant up-regulation of all three candidate transcripts relative to unstimulated controls (IL10 1.5365-fold; PDGFB 1.6592-fold; STAM2 1.8220-fold; n=3+3), providing mRNA-level experimental support for these computational findings [34,35].
Several limitations should be noted. First, the diagnostic model and molecular subtyping were derived entirely from public retrospective, cross-sectional transcriptomic cohorts; prospective, multi-center cohorts with longitudinal follow-up are required to assess the relationship between the candidate panel and disease activity, relapse, or treatment response. Second, the genetic-association layer reached only the nominal significance tier: IL10, STAM2, and PDGFB did not pass FDR, several genes had few available instruments (as few as 3), and a few displayed genes had minimum F values slightly below the prespecified gate (29.77–29.96), so these results can only be interpreted as genetic-instrument-level association hints rather than causal evidence. Third, the expression-layer FDR of the machine-learning candidate panel was greater than 0.12, so its convergence reflects feature-selection stability; the training-cohort STAM2 model reached an AUC of 0.7883, below the 0.8 threshold, the two external cohorts were small with wide confidence intervals, and the same-study audit cohort yielded an AUC of only 0.6288, so cross-study transportability still requires confirmation in larger independent cohorts. Fourth, the aqueous-humor single-cell atlas contained no healthy controls, and the pseudotime trajectory, computational gene perturbation, and STRING association network are computational inferences; the 47 edges at STRING score 150–300 serve only to convey network density and are neither high-confidence interactions nor real gene knockouts. Fifth, drug prioritization relied solely on active-learning reversal probability and molecular docking, and the qPCR analysis was a small n=3+3, single-time-point measurement of relative mRNA expression, lacking cellular or biochemical pharmacodynamic and protein-level evidence; the small sample size and single hit compound also limit generalizability. Taken together, this study integrates expression, nominal genetic-association, machine-learning, single-cell, and in vitro qPCR evidence along one JAK-STAT axis to provide a directly reproducible, experimentally falsifiable candidate panel and mechanistic hypothesis framework; the genetic-association tier is nominal, and the causal direction still requires confirmation in prospective multicenter cohorts and functional experiments. Future studies should combine higher-resolution single-cell and spatial transcriptomics across additional independent cohorts with RNA-binding-protein, receptor-degradation, and functional perturbation experiments to dynamically dissect the possible role of the IL10–PDGFB–STAM2 axis in the pathology and treatment of uveitis.
5. Conclusion
In this study, we used peripheral-blood CD1c+ cDC2 cells from uveitis patients as the entry point and report parallel multi-layer evidence from expression, genetic association, machine learning, single-cell, and drug-prioritization analyses along the KEGG JAK-STAT molecular axis. We propose IL10–PDGFB–STAM2 as a candidate molecular axis potentially linking cDC2 immune dysregulation to intraocular inflammation in uveitis and identify BRD-K11973162 as the only computationally prioritized compound exceeding the prespecified reversal-probability threshold. qPCR showed significant up-regulation of all three candidate transcripts in LPS-stimulated THP-1 cells relative to unstimulated controls, providing an mRNA-level experimental clue for the panel. These findings offer a testable starting point for mechanistic studies and target prioritization in uveitis, while causal attribution and clinical translation still require prospective multi-center cohorts and functional experiments.
Supplementary Materials
The following supporting information can be downloaded at the website of this paper posted on Preprints.org: Figure S1, the full 20-gene forest plot underlying the displayed 8-gene subset of Figure 2 (the forest plot of all 20 nominally significant genes under the reference-style relaxed-LD primary analysis).
Author Contributions
Y.W. and J.R. jointly conceived the study, performed the analyses, interpreted the results, and wrote the manuscript. Both authors have read and agreed to the published version of the manuscript.
Funding
This research received no external funding.
Institutional Review Board Statement
Not applicable. This study re-analysed de-identified, previously published human datasets (GEO) and a commercially available human cell line (THP-1); no human participants and no animals were involved.
Informed Consent Statement
Not applicable. This study used previously published de-identified data and a commercially available cell line.
Data Availability Statement
Public data used in this study were obtained from GEO (GSE194060, GSE195501, GSE61399, GSE66936, GSE229166) and FinnGen R12; the KEGG JAK-STAT gene set was retrieved from the KEGG pathway record. The per-sample relative-expression values, group summaries, and test statistics for the qPCR analysis (unstimulated control and LPS-stimulated THP-1 groups) are provided as the Figure 8A source-data table; all analysis scripts, source-data tables, and render-audit files are archived with the project and are available from the corresponding author on reasonable request.
Conflicts of Interest
The authors declare no conflicts of interest.
References
- Jabs, D.A.; Nussenblatt, R.B.; Rosenbaum, J.T. Standardization of Uveitis Nomenclature (SUN) Working Group. Standardization of uveitis nomenclature for reporting clinical data. Results of the First International Workshop. Am. J. Ophthalmol. 2005, 140, 509–516. [Google Scholar] [CrossRef]
- Gritz, D.C.; Wong, I.G. Incidence and prevalence of uveitis in Northern California; the Northern California Epidemiology of Uveitis Study. Ophthalmology 2004, 111, 491–500. [Google Scholar] [CrossRef]
- Han, J.; Harper, J.; Copland, D.A.; Maghsoudlou, P. The Immunopathogenesis of uveitis. Front Med. 2026, 13, 1717056. [Google Scholar] [CrossRef]
- Streilein, J.W. Ocular immune privilege: therapeutic opportunities from an experiment of nature. Nat. Rev. Immunol. 2003, 3, 879–889. [Google Scholar] [CrossRef]
- Collin, M.; Bigley, V. Human dendritic cell subsets: an update. Immunology 2018, 154, 3–20. [Google Scholar] [CrossRef]
- Ouyang, W.; Rutz, S.; Crellin, N.K.; Valdez, P.A.; Hymowitz, S.G. Regulation and functions of the IL-10 family of cytokines in inflammation and disease. Annu Rev. Immunol. 2011, 29, 71–109. [Google Scholar] [CrossRef]
- Huang, X.F.; Brown, M.A. Progress in the genetics of uveitis. Genes Immun. 2022, 23, 57–65. [Google Scholar] [CrossRef]
- O'Shea, J.J.; Schwartz, D.M.; Villarino, A.V.; Gadina, M.; McInnes, I.B.; Laurence, A. The JAK-STAT pathway: impact on human disease and therapeutic intervention. Annu Rev. Med. 2015, 66, 311–328. [Google Scholar] [CrossRef]
- Maccora, I.; Land, P.; Miraldi Utz, V.; Angeles-Han, S.T. Therapeutic potential of JAK inhibitors in juvenile idiopathic arthritis-associated uveitis. Expert Rev. Clin. Immunol. 2023, 19, 689–692. [Google Scholar] [CrossRef]
- Davies, N.M.; Holmes, M.V.; Davey Smith, G. Reading Mendelian randomisation studies: a guide, glossary, and checklist for clinicians. BMJ 2018, 362, k601. [Google Scholar] [CrossRef]
- Burgess, S.; Scott, R.A.; Timpson, N.J.; Davey Smith, G.; Thompson, S.G.; EPIC- InterAct Consortium. Using published data in Mendelian randomization: a blueprint for efficient identification of causal risk factors. Eur. J. Epidemiol. 2015, 30, 543–552. [Google Scholar] [CrossRef]
- Barrett, T.; Wilhite, S.E.; Ledoux, P.; Evangelista, C.; Kim, I.F.; Tomashevsky, M.; Marshall, K.A.; Phillippy, K.H.; Sherman, P.M.; Holko, M.; et al. NCBI GEO: archive for functional genomics data sets--update. Nucleic Acids Res. 2013, 41, D991–5. [Google Scholar] [CrossRef]
- Love, M.I.; Huber, W.; Anders, S. Moderated estimation of fold change and dispersion for RNA-seq data with DESeq2. Genome Biol. 2014, 15, 550. [Google Scholar] [CrossRef]
- Kanehisa, M.; Goto, S. KEGG: kyoto encyclopedia of genes and genomes. Nucleic Acids Res. 2000, 28, 27–30. [Google Scholar] [CrossRef]
- Kurki, M.I.; Karjalainen, J.; Palta, P.; Sipilä, T.P.; Kristiansson, K.; Donner, K.M.; Reeve, M.P.; Laivuori, H.; Aavikko, M.; Kaunisto, M.A.; et al. FinnGen provides genetic insights from a well-phenotyped isolated population. Nature 2023, 613, 508–518. [Google Scholar] [CrossRef]
- Sollis, E.; Mosaku, A.; Abid, A.; Buniello, A.; Cerezo, M.; Gil, L.; Groza, T.; Güneş, O.; Hall, P.; Hayhurst, J.; et al. The NHGRI-EBI GWAS Catalog: knowledgebase and deposition resource. Nucleic Acids Res. 2023, 51, D977–D985. [Google Scholar] [CrossRef]
- Buniello, A.; MacArthur, J.A.L.; Cerezo, M.; Harris, L.W.; Hayhurst, J.; Malangone, C.; McMahon, A.; Morales, J.; Mountjoy, E.; Sollis, E.; et al. The NHGRI-EBI GWAS Catalog of published genome-wide association studies, targeted arrays and summary statistics 2019. Nucleic Acids Res. 2019, 47, D1005–D1012. [Google Scholar] [CrossRef]
- Ritchie, M.E.; Phipson, B.; Wu, D.; Hu, Y.; Law, C.W.; Shi, W.; Smyth, G.K. limma powers differential expression analyses for RNA-sequencing and microarray studies. Nucleic Acids Res. 2015, 43, e47. [Google Scholar] [CrossRef]
- Gu, Z.; Eils, R.; Schlesner, M. Complex heatmaps reveal patterns and correlations in multidimensional genomic data. Bioinformatics 2016, 32, 2847–2849. [Google Scholar] [CrossRef]
- Burgess, S.; Butterworth, A.; Thompson, S.G. Mendelian randomization analysis with multiple genetic variants using summarized data. Genet Epidemiol. 2013, 37, 658–665. [Google Scholar] [CrossRef]
- Hemani, G.; Zheng, J.; Elsworth, B.; Wade, K.H.; Haberland, V.; Baird, D.; Laurin, C.; Burgess, S.; Bowden, J.; Langdon, R.; et al. The MR-Base platform supports systematic causal inference across the human phenome. Elife 2018, 7, e34408. [Google Scholar] [CrossRef]
- Friedman, J.; Hastie, T.; Tibshirani, R. Regularization Paths for Generalized Linear Models via Coordinate Descent. J. Stat. Softw. 2010, 33, 1–22. [Google Scholar] [CrossRef]
- Breiman, L. Random Forests. Mach. Learn 2001, 45, 5–32. [Google Scholar] [CrossRef]
- Guyon, I.; Weston, J.; Barnhill, S.; Vapnik, V. Gene Selection for Cancer Classification using Support Vector Machines. Mach. Learn 2002, 46, 389–422. [Google Scholar] [CrossRef]
- Subramanian, A.; Tamayo, P.; Mootha, V.K.; Mukherjee, S.; Ebert, B.L.; Gillette, M.A.; Paulovich, A.; Pomeroy, S.L.; Golub, T.R.; Lander, E.S.; et al. Gene set enrichment analysis: a knowledge-based approach for interpreting genome-wide expression profiles. Proc. Natl. Acad. Sci. U S A 2005, 102, 15545–15550. [Google Scholar] [CrossRef]
- Korotkevich, G.; Sukhov, V.; Budin, N.; Shpak, B.; Artyomov, M.N.; Sergushichev, A. Fast gene set enrichment analysis. [CrossRef]
- Newman, A.M.; Liu, C.L.; Green, M.R.; Gentles, A.J.; Feng, W.; Xu, Y.; Hoang, C.D.; Diehn, M.; Alizadeh, A.A. Robust enumeration of cell subsets from tissue expression profiles. Nat. Methods 2015, 12, 453–457. [Google Scholar] [CrossRef]
- Wilkerson, M.D.; Hayes, D.N. ConsensusClusterPlus: a class discovery tool with confidence assessments and item tracking. Bioinformatics 2010, 26, 1572–1573. [Google Scholar] [CrossRef]
- Hao, Y.; Stuart, T.; Kowalski, M.H.; Choudhary, S.; Hoffman, P.; Hartman, A.; Srivastava, A.; Molla, G.; Madad, S.; Fernandez-Granda, C.; et al. Dictionary learning for integrative, multimodal and scalable single-cell analysis. Nat. Biotechnol. 2024, 42, 293–304. [Google Scholar] [CrossRef]
- Jin, S.; Guerrero-Juarez, C.F.; Zhang, L.; Chang, I.; Ramos, R.; Kuan, C.H.; Myung, P.; Plikus, M.V.; Nie, Q. Inference and analysis of cell-cell communication using CellChat. Nat. Commun. 2021, 12, 1088. [Google Scholar] [CrossRef]
- Cao, J.; Spielmann, M.; Qiu, X.; Huang, X.; Ibrahim, D.M.; Hill, A.J.; Zhang, F.; Mundlos, S.; Christiansen, L.; Steemers, F.J.; et al. The single-cell transcriptional landscape of mammalian organogenesis. Nature 2019, 566, 496–502. [Google Scholar] [CrossRef]
- Osorio, D.; Zhong, Y.; Li, G.; Xu, Q.; Yang, Y.; Tian, Y.; Chapkin, R.S.; Huang, J.Z.; Cai, J.J. scTenifoldKnk: An efficient virtual knockout tool for gene function predictions via single-cell gene regulatory network perturbation. Patterns (N Y) 2022, 3, 100434. [Google Scholar] [CrossRef]
- Szklarczyk, D.; Gable, A.L.; Nastou, K.C.; Lyon, D.; Kirsch, R.; Pyysalo, S.; Doncheva, N.T.; Legeay, M.; Fang, T.; Bork, P.; et al. The STRING database in 2021: customizable protein-protein networks, and functional characterization of user-uploaded gene/measurement sets. Nucleic Acids Res. 2021, 49, D605–D612. [Google Scholar] [CrossRef]
- Lamb, J.; Crawford, E.D.; Peck, D.; Modell, J.W.; Blat, I.C.; Wrobel, M.J.; Lerner, J.; Brunet, J.P.; Subramanian, A.; Ross, K.N.; et al. The Connectivity Map: using gene-expression signatures to connect small molecules, genes, and disease. Science 2006, 313, 1929–1935. [Google Scholar] [CrossRef]
- Trott, O.; Olson, A.J. AutoDock Vina: improving the speed and accuracy of docking with a new scoring function, efficient optimization, and multithreading. J. Comput Chem. 2010, 31, 455–461. [Google Scholar] [CrossRef]
- Robin, X.; Turck, N.; Hainard, A.; Tiberti, N.; Lisacek, F.; Sanchez, J.C.; Müller, M. pROC: an open-source package for R and S+ to analyze and compare ROC curves. BMC Bioinform. 2011, 12, 77. [Google Scholar] [CrossRef]
- Fredriksson, L.; Li, H.; Eriksson, U. The PDGF family: four gene products form five dimeric isoforms. Cytokine Growth Factor Rev. 2004, 15, 197–204. [Google Scholar] [CrossRef]
- Zanin, N.; Viaris de Lesegno, C.; Podkalicka, J.; Meyer, T.; Gonzalez Troncoso, P.; Bun, P.; Danglot, L.; Chmiest, D.; Urbé, S.; Piehler, J.; et al. STAM and Hrs interact sequentially with IFN-α Receptor to control spatiotemporal JAK-STAT endosomal activation. Nat. Cell Biol. 2023, 25, 425–438. [Google Scholar] [CrossRef]
Figure 1.
Expression landscape of JAK-STAT axis genes in peripheral CD1c+ cDC2 cells from uveitis and healthy controls. (A) The volcano plot displays all differential expression results (logFC versus −log10(p)) in CD1c+ cDC2 cells from GSE194060 (28 uveitis / 14 healthy controls), with point color encoding significance direction and axis genes belonging to the three-way intersection annotated. (B) The Venn diagram depicts the three-way overlap among nominally significant differentially expressed genes (DEGs, 3,301), KEGG hsa04630 JAK-STAT pathway genes (168), and uveitis-associated genes (3,872), converging on an 18-gene intersection; the DEG circle sums to 2660 + 6 + 617 + 18 = 3,301, consistent with the text, whereas the 93 genes shared exclusively by the JAK-STAT and uveitis-associated sets lie outside the DEG circle. (C) The distribution-as-heatmap module score (top) and the sample-gene expression heat map (bottom) depict the expression gradient of the 18 intersection genes between control and disease samples, annotated by Group. (D) The GO and KEGG enrichment bar chart depicts enriched terms of the intersection genes across biological process (BP), cellular component (CC), molecular function (MF), and KEGG pathways, with the x-axis representing −log10(p) and point size mapping the gene count per term. This layer serves to delimit the candidate space for the subsequent analyses.
Figure 1.
Expression landscape of JAK-STAT axis genes in peripheral CD1c+ cDC2 cells from uveitis and healthy controls. (A) The volcano plot displays all differential expression results (logFC versus −log10(p)) in CD1c+ cDC2 cells from GSE194060 (28 uveitis / 14 healthy controls), with point color encoding significance direction and axis genes belonging to the three-way intersection annotated. (B) The Venn diagram depicts the three-way overlap among nominally significant differentially expressed genes (DEGs, 3,301), KEGG hsa04630 JAK-STAT pathway genes (168), and uveitis-associated genes (3,872), converging on an 18-gene intersection; the DEG circle sums to 2660 + 6 + 617 + 18 = 3,301, consistent with the text, whereas the 93 genes shared exclusively by the JAK-STAT and uveitis-associated sets lie outside the DEG circle. (C) The distribution-as-heatmap module score (top) and the sample-gene expression heat map (bottom) depict the expression gradient of the 18 intersection genes between control and disease samples, annotated by Group. (D) The GO and KEGG enrichment bar chart depicts enriched terms of the intersection genes across biological process (BP), cellular component (CC), molecular function (MF), and KEGG pathways, with the x-axis representing −log10(p) and point size mapping the gene count per term. This layer serves to delimit the candidate space for the subsequent analyses.
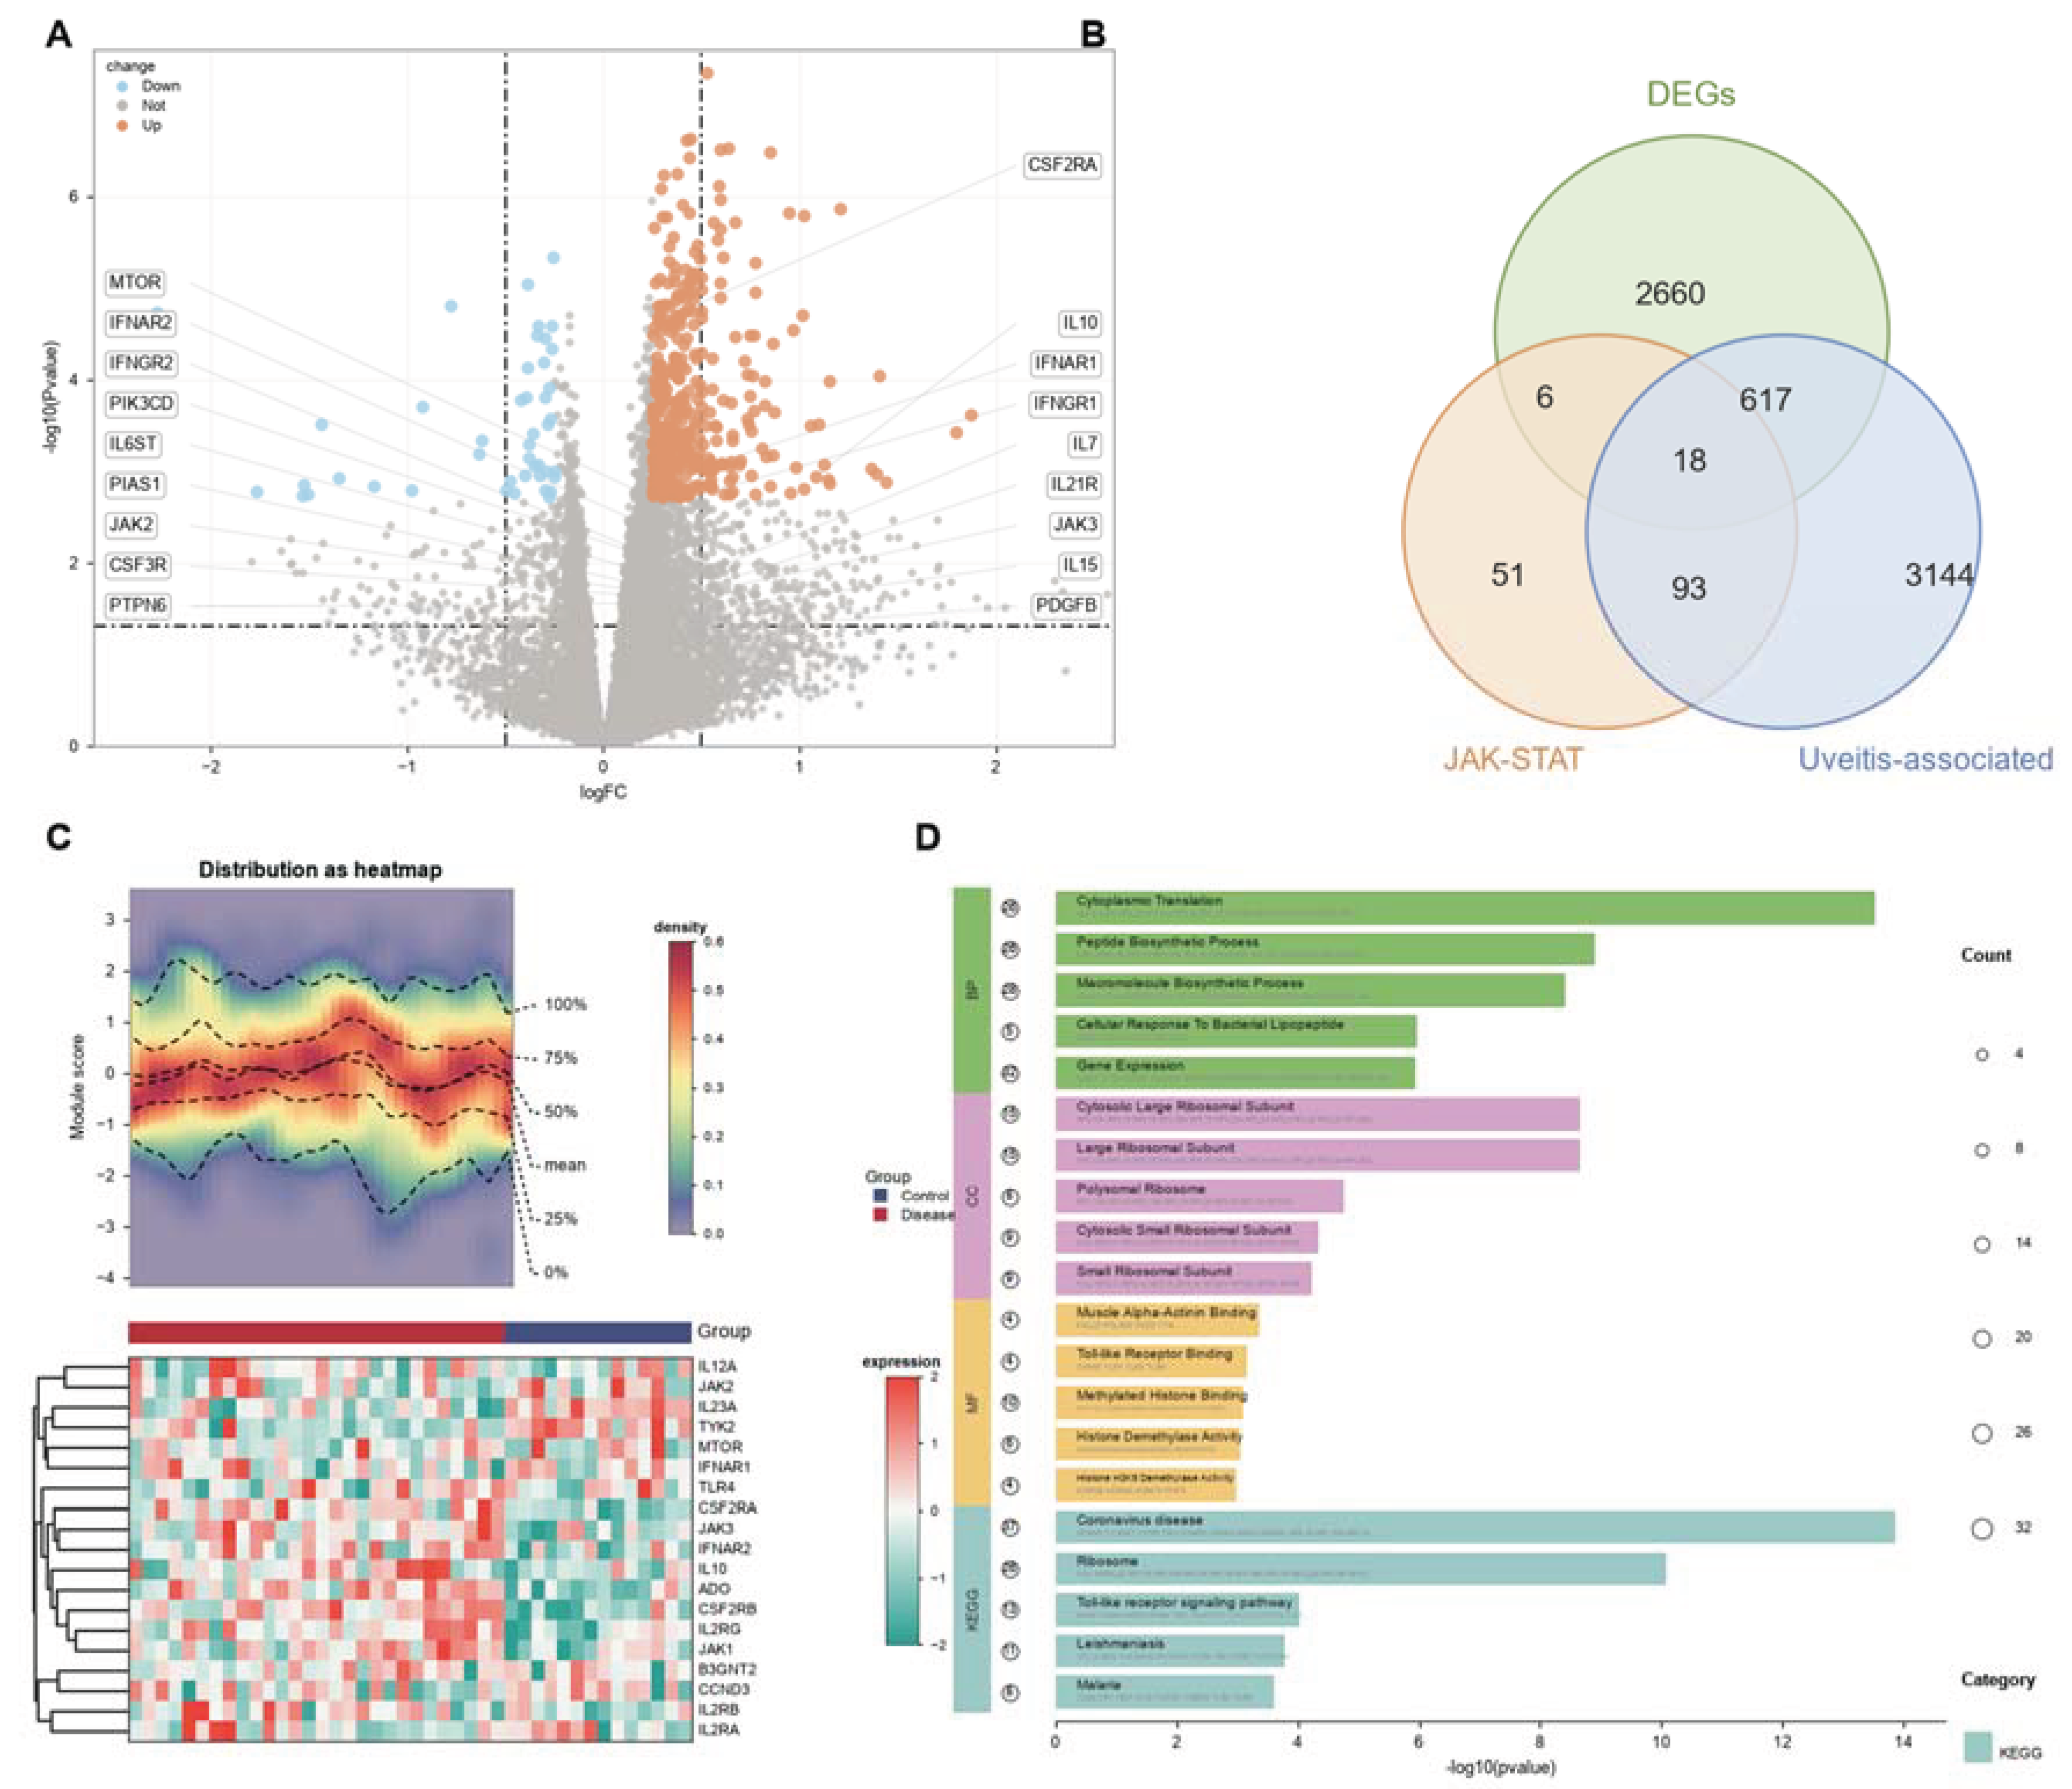
Figure 2.
Genetic association of JAK-STAT axis genes with iridocyclitis assessed by cis-instrument Mendelian randomization (FinnGen R12 `H7_IRIDOCYCLITIS`). (A) The forest table lists IVW results for the 8 displayed genes of the primary analysis, with columns for gene symbol (SYMBOL), number of instruments (nsnp), method (all inverse variance weighted), p value, and OR (95% CI). CCND1, EPOR, TYK2, IL2RB, and IL27RA passed both nominal and Benjamini-Hochberg FDR q<0.05 thresholds, whereas IL10 (p=0.032, q=0.1246), STAM2 (p=0.033, q=0.1246), and PDGFB (p=0.045, q=0.1573) reached nominal significance only. (B–I) Per-gene SNPassociation scatter plots (left; x-axis, SNP effect on exposure; y-axis, SNP effect on outcome; overlaid with IVW, MR-Egger, weighted-median, and simple-mode fits) and funnel plots (right; x-axis, IVW effect estimate beta(IVW); y-axis, its standard error 1/SE(IVW)) are shown for CCND1, EPOR, TYK2, IL2RB, IL27RA, IL10, STAM2, and PDGFB. Across the full analysis, 20 genes were identified at nominal significance (p<0.05), 8 of which passed FDR; 8 genes are displayed here to balance panel readability and cross-layer traceability. The displayed subset is fixed by "the three machine-learning-locked targets (IL10/PDGFB/STAM2) plus the strongest nominal genes by primary-analysis p value"; of the five overlapping genes of the expression and genetic-association layers (CSF3R, IFNGR2, IL10, JAK2, PDGFB), CSF3R, IFNGR2, and JAK2 do not enter the displayed subset, and the full 20-gene forest plot is provided in Supplementary Figure S1. The prespecified weak-instrument gate was minimum F>30; IL2RB (3), IL27RA (4), and IL10 (5) had fewer instruments, and CCND1 (minF 29.77) and STAM2 (minF 29.79) fell slightly below the gate; all were retained under the prespecified sensitivity protocol with per-gene annotation. This layer is a genetic-instrument-level association hint only and does not constitute genetic validation or causation.
Figure 2.
Genetic association of JAK-STAT axis genes with iridocyclitis assessed by cis-instrument Mendelian randomization (FinnGen R12 `H7_IRIDOCYCLITIS`). (A) The forest table lists IVW results for the 8 displayed genes of the primary analysis, with columns for gene symbol (SYMBOL), number of instruments (nsnp), method (all inverse variance weighted), p value, and OR (95% CI). CCND1, EPOR, TYK2, IL2RB, and IL27RA passed both nominal and Benjamini-Hochberg FDR q<0.05 thresholds, whereas IL10 (p=0.032, q=0.1246), STAM2 (p=0.033, q=0.1246), and PDGFB (p=0.045, q=0.1573) reached nominal significance only. (B–I) Per-gene SNPassociation scatter plots (left; x-axis, SNP effect on exposure; y-axis, SNP effect on outcome; overlaid with IVW, MR-Egger, weighted-median, and simple-mode fits) and funnel plots (right; x-axis, IVW effect estimate beta(IVW); y-axis, its standard error 1/SE(IVW)) are shown for CCND1, EPOR, TYK2, IL2RB, IL27RA, IL10, STAM2, and PDGFB. Across the full analysis, 20 genes were identified at nominal significance (p<0.05), 8 of which passed FDR; 8 genes are displayed here to balance panel readability and cross-layer traceability. The displayed subset is fixed by "the three machine-learning-locked targets (IL10/PDGFB/STAM2) plus the strongest nominal genes by primary-analysis p value"; of the five overlapping genes of the expression and genetic-association layers (CSF3R, IFNGR2, IL10, JAK2, PDGFB), CSF3R, IFNGR2, and JAK2 do not enter the displayed subset, and the full 20-gene forest plot is provided in Supplementary Figure S1. The prespecified weak-instrument gate was minimum F>30; IL2RB (3), IL27RA (4), and IL10 (5) had fewer instruments, and CCND1 (minF 29.77) and STAM2 (minF 29.79) fell slightly below the gate; all were retained under the prespecified sensitivity protocol with per-gene annotation. This layer is a genetic-instrument-level association hint only and does not constitute genetic validation or causation.
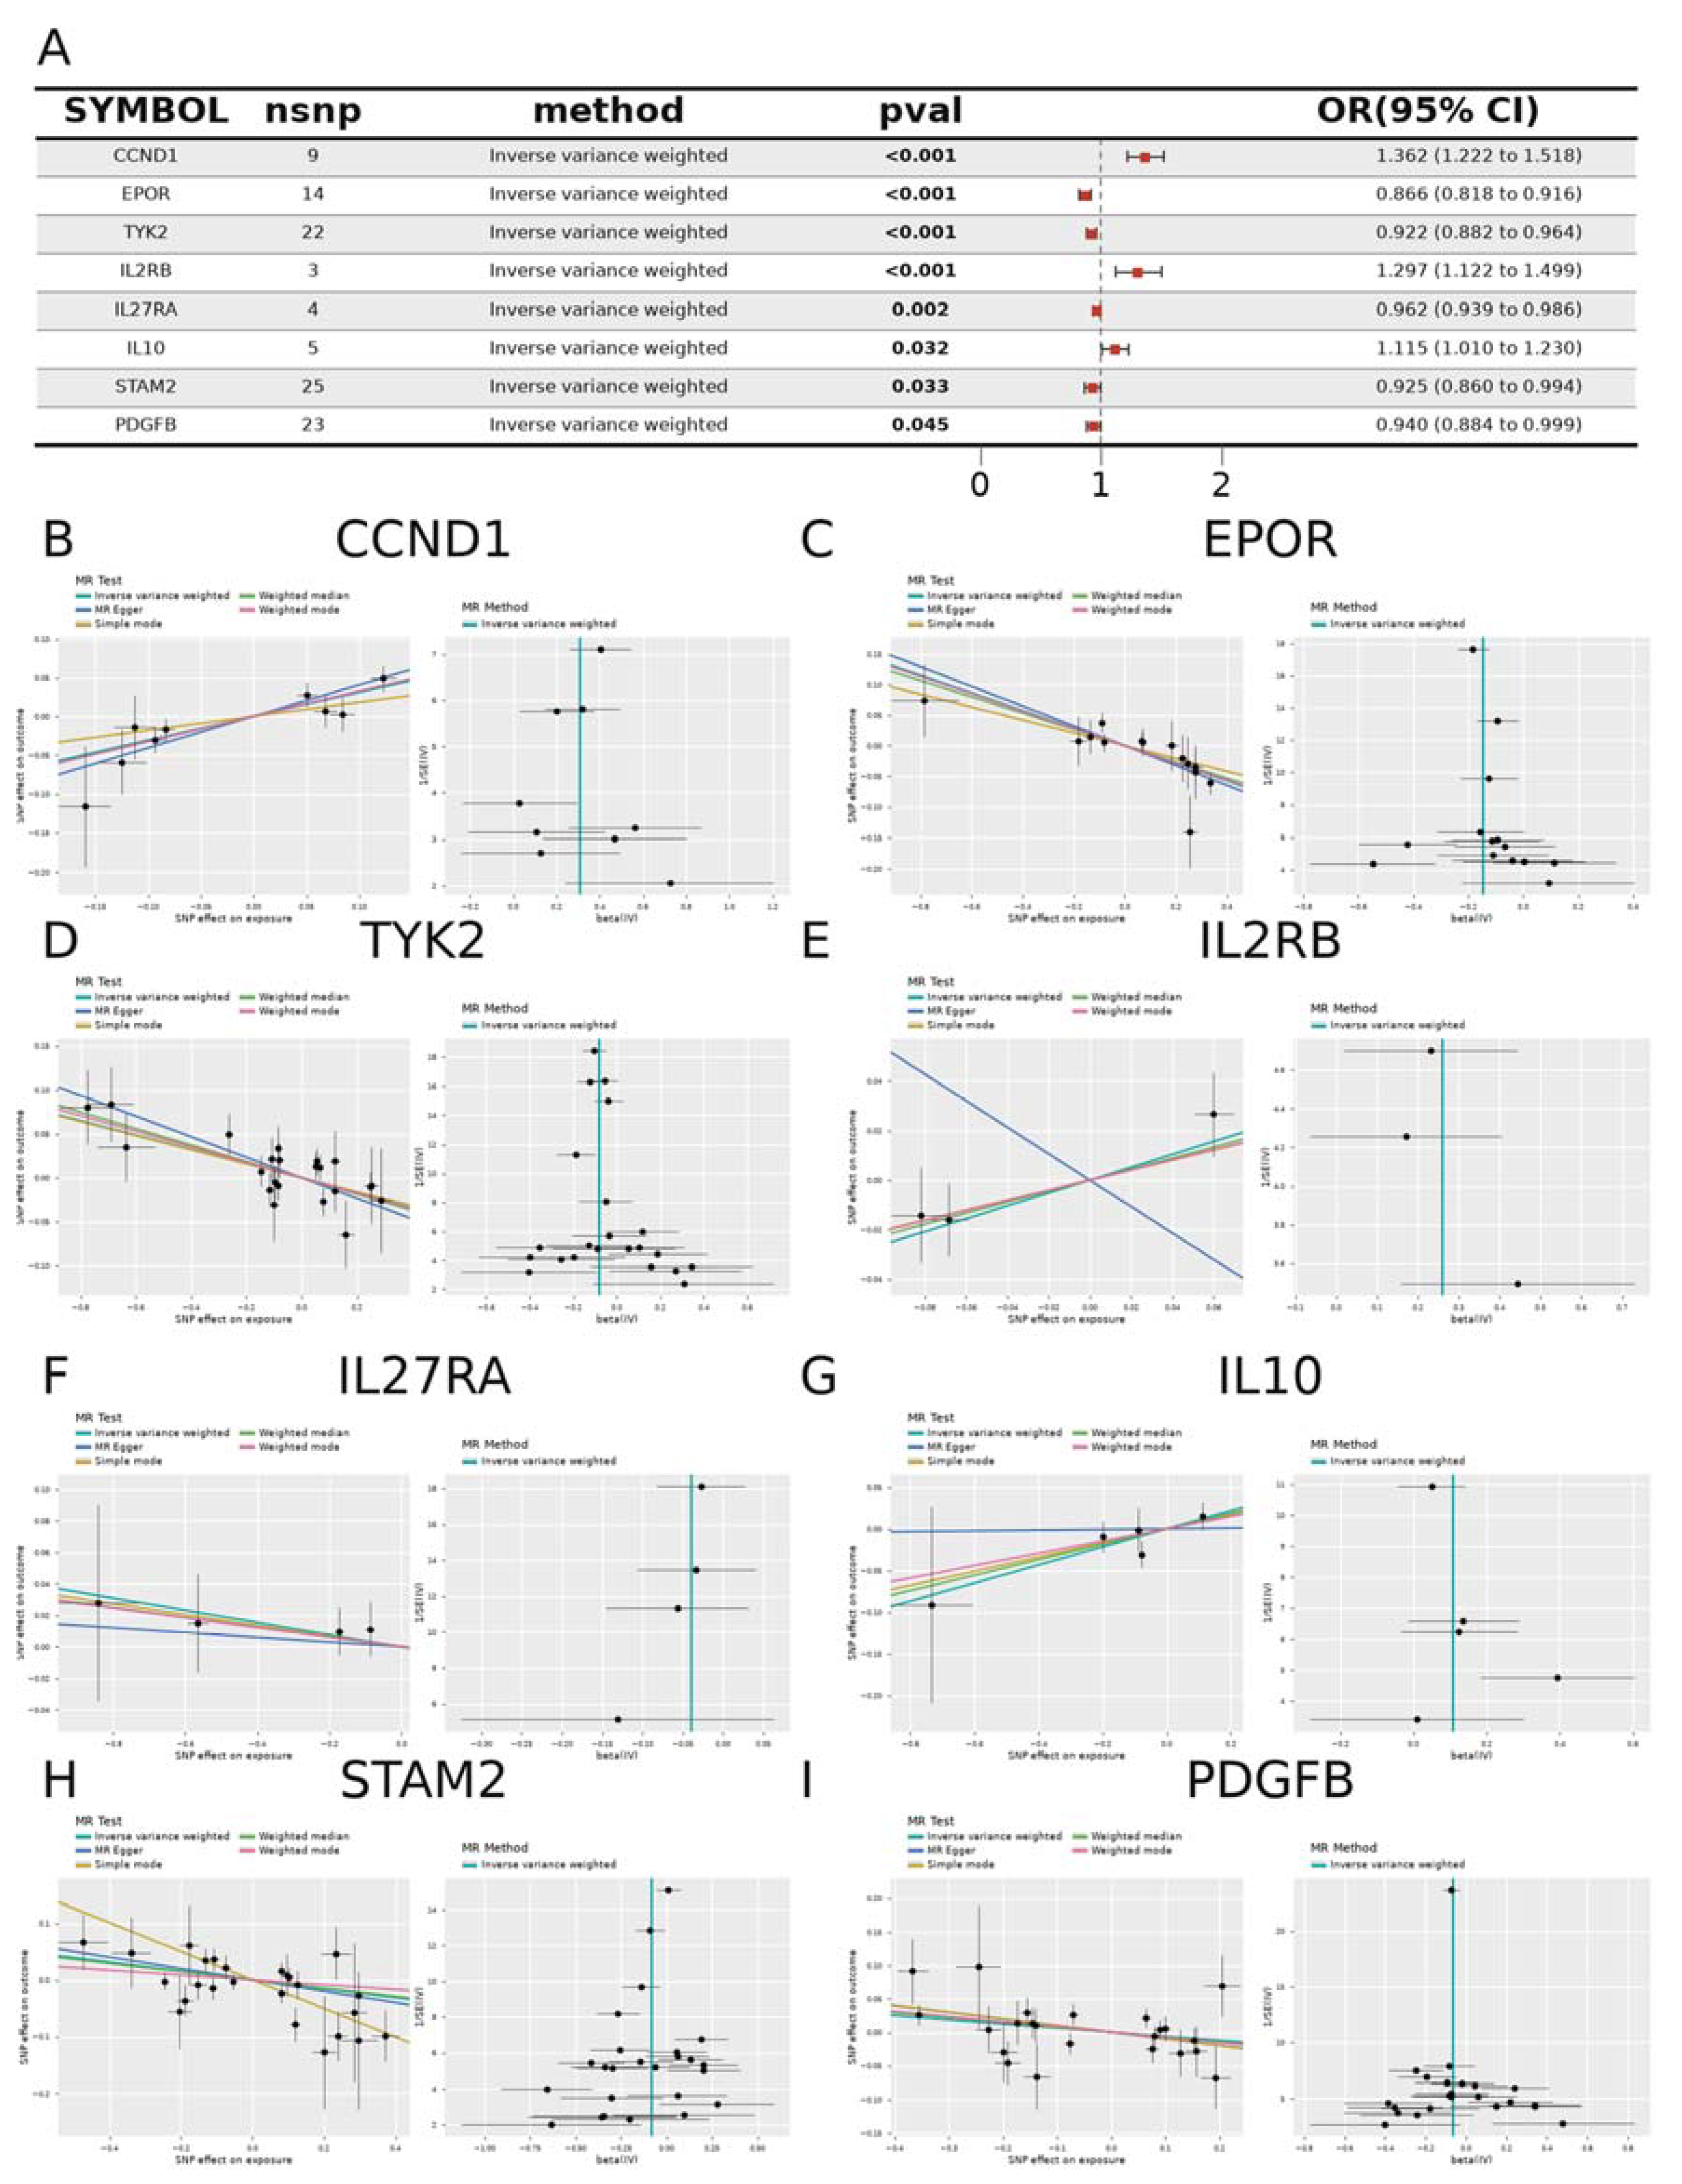
Figure 3.
Consensus-clustering molecular subtypes and immune-microenvironment heterogeneity of uveitis CD1c+ cDC2 cells (`n=28`). (A) Consensus cumulative distribution function (CDF) curves depict clustering stability for K=2 to K=10. (B) The relative change in area under the CDF curve across K supports K=2 as the optimal cluster number. (C) The consensus matrix heat map depicts the division of samples into two subgroups, C1 and C2 (n=9 and n=19), at K=2. (D) The principal component analysis (PCA) scatter plot depicts the separation of the two subgroups in low-dimensional space, with PC1 and PC2 explaining 18.0% and 12.5% of the variance, respectively; PCA is used for visualization only and does not participate in selecting K. (E) Preranked GSEA ridge plots based on limma moderated-t statistics depict differences between the two subgroups in representative inflammatory cytokine signaling and myeloid activation pathways, with NES and BH-adjusted p annotated per term and the most significant pathway reaching an adjusted p of 1.3966×10⁻¹². (F) The ranked log2FC curve of all differential expression results maps point color to FDR, retains true extreme genes, and marks the |logFC|=1 reference line with dashed lines. (G) The LM22 CIBERSORT deconvolution bar chart compares immune-cell fractions between the two subgroups, with an overall mean fit correlation of r=0.4888 and four cell types reaching cross-cell-type BH-adjusted q<0.05. This subtyping is based entirely on within-cohort structure, is descriptive, and is not extrapolated to a prognostic or treatment-guiding classification.
Figure 3.
Consensus-clustering molecular subtypes and immune-microenvironment heterogeneity of uveitis CD1c+ cDC2 cells (`n=28`). (A) Consensus cumulative distribution function (CDF) curves depict clustering stability for K=2 to K=10. (B) The relative change in area under the CDF curve across K supports K=2 as the optimal cluster number. (C) The consensus matrix heat map depicts the division of samples into two subgroups, C1 and C2 (n=9 and n=19), at K=2. (D) The principal component analysis (PCA) scatter plot depicts the separation of the two subgroups in low-dimensional space, with PC1 and PC2 explaining 18.0% and 12.5% of the variance, respectively; PCA is used for visualization only and does not participate in selecting K. (E) Preranked GSEA ridge plots based on limma moderated-t statistics depict differences between the two subgroups in representative inflammatory cytokine signaling and myeloid activation pathways, with NES and BH-adjusted p annotated per term and the most significant pathway reaching an adjusted p of 1.3966×10⁻¹². (F) The ranked log2FC curve of all differential expression results maps point color to FDR, retains true extreme genes, and marks the |logFC|=1 reference line with dashed lines. (G) The LM22 CIBERSORT deconvolution bar chart compares immune-cell fractions between the two subgroups, with an overall mean fit correlation of r=0.4888 and four cell types reaching cross-cell-type BH-adjusted q<0.05. This subtyping is based entirely on within-cohort structure, is descriptive, and is not extrapolated to a prognostic or treatment-guiding classification.
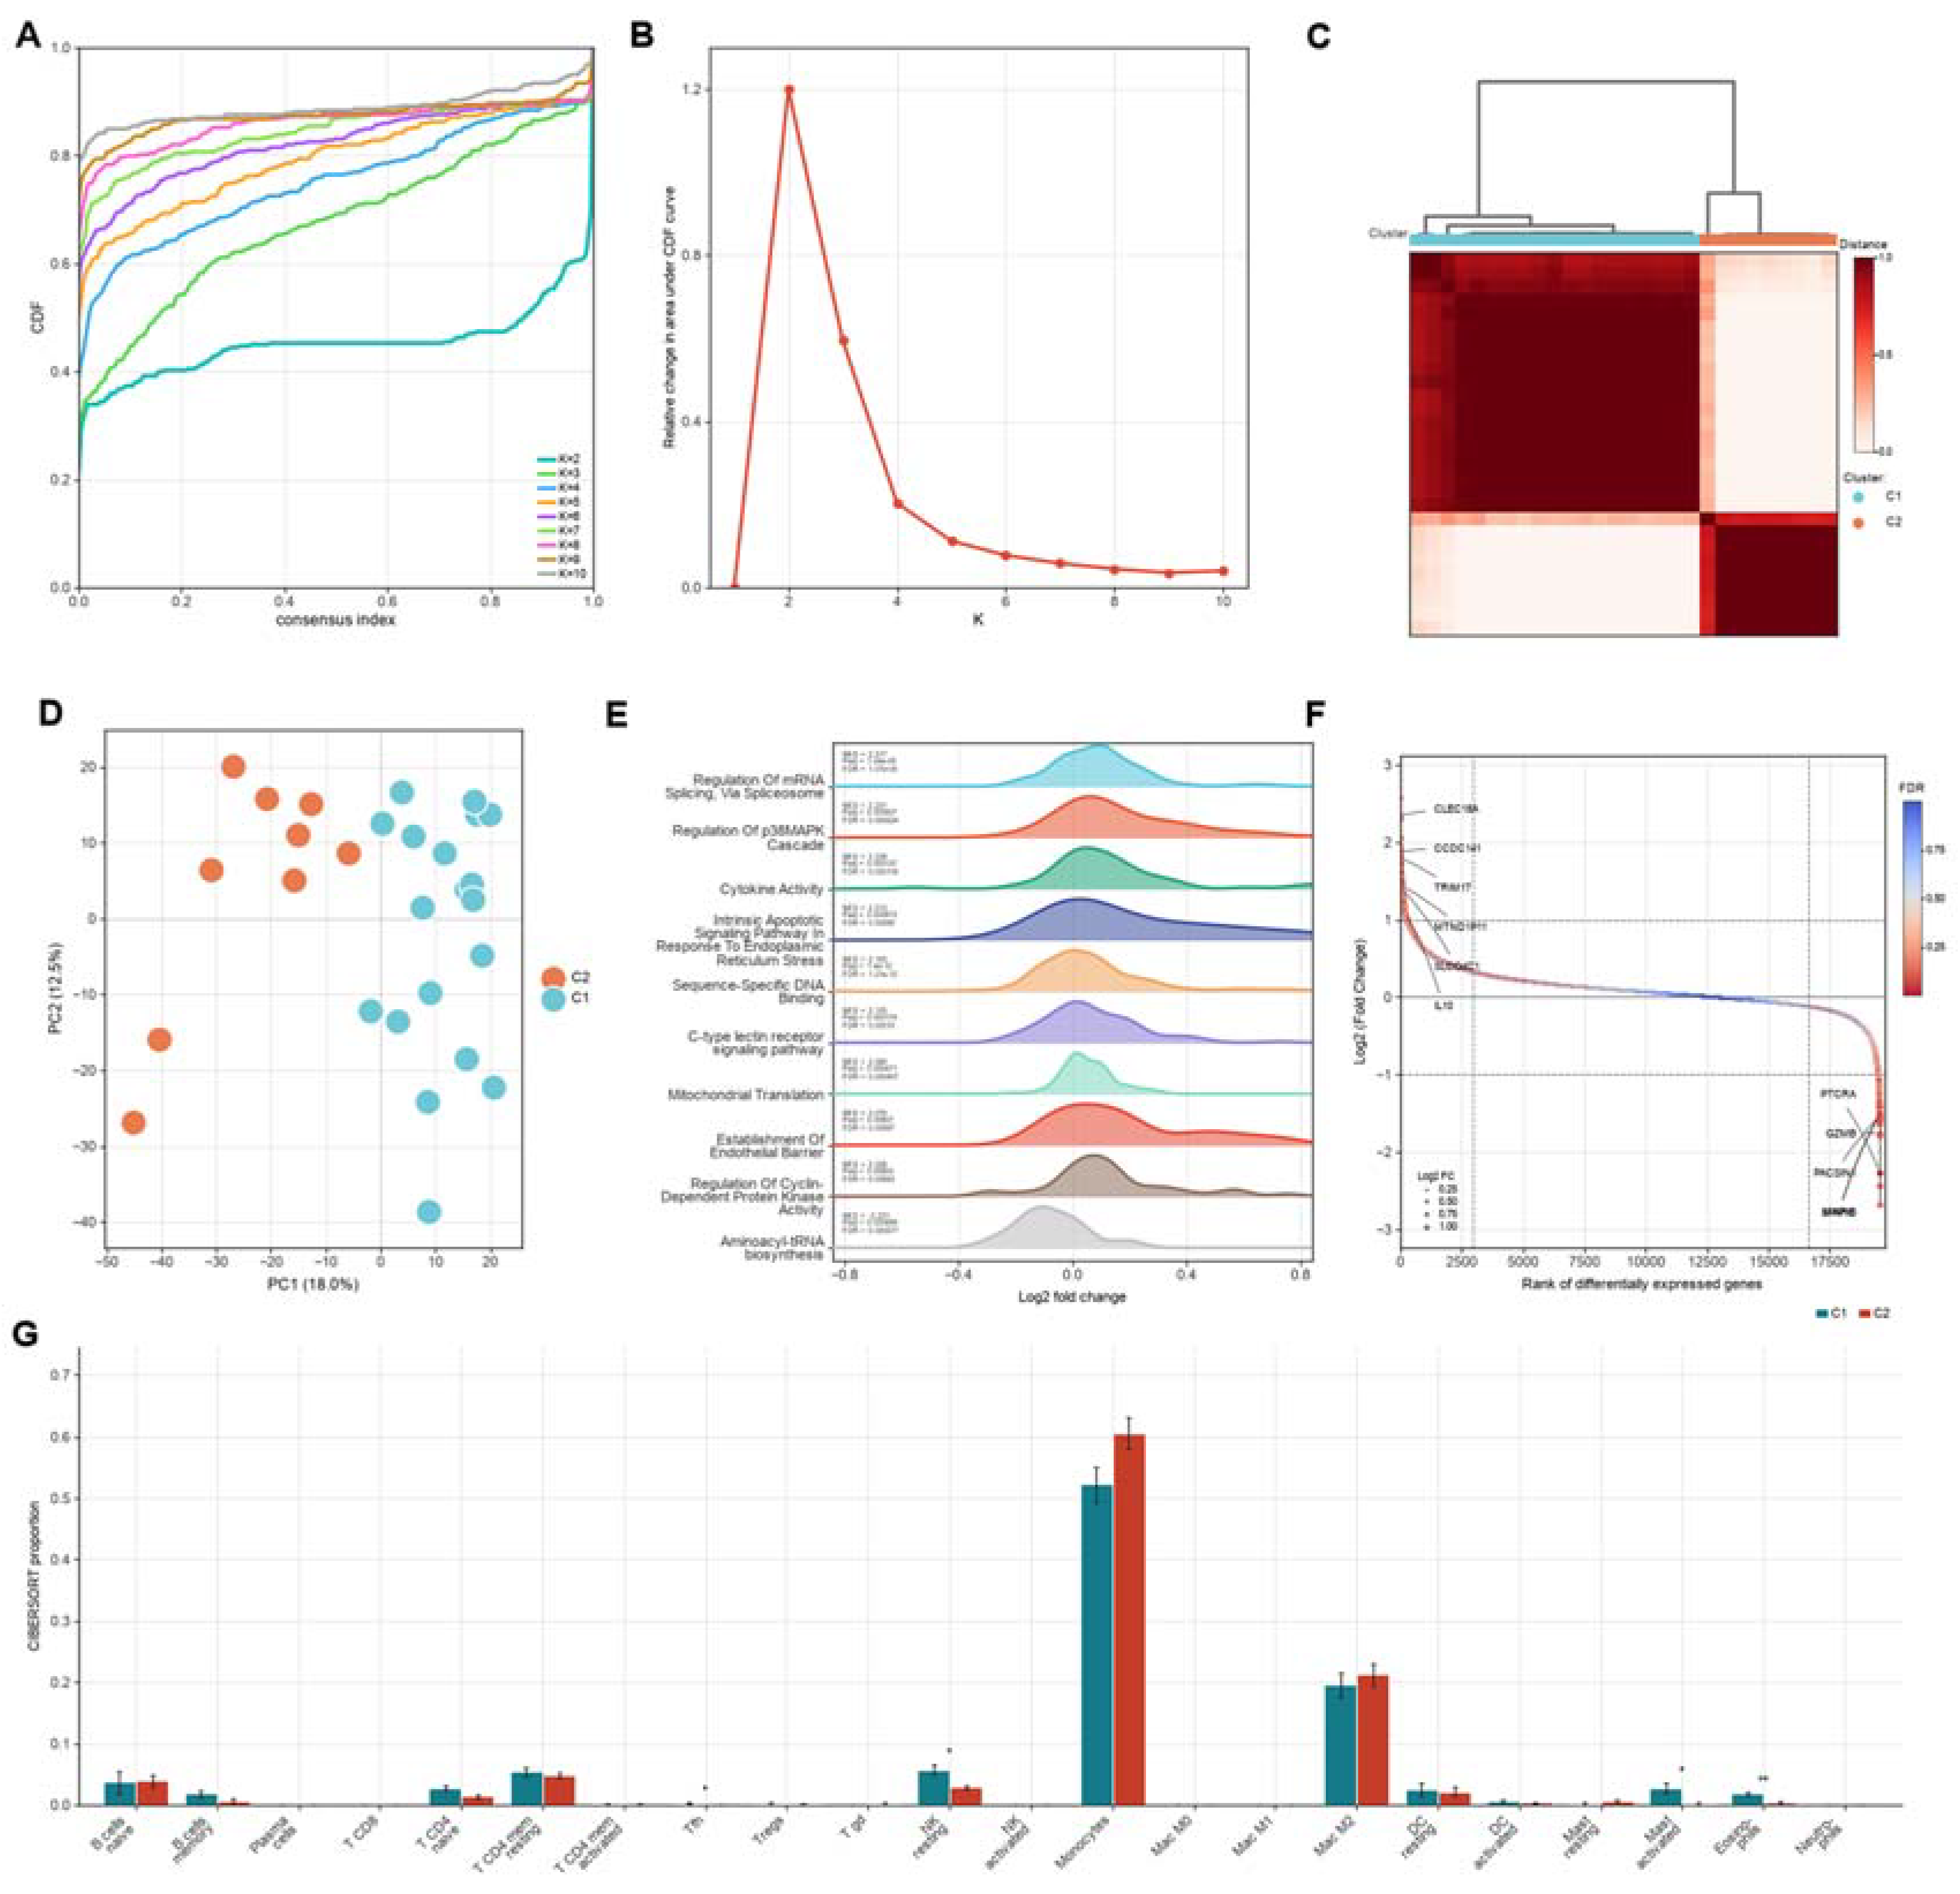
Figure 4.
Candidate panel defined by the intersection of LASSO, random forest, and SVM-RFE on the complete set of 20 nominally significant genes. (A) The LASSO logistic regression coefficient path (left) and 10-fold cross-validation binomial deviance curve (right), with dashed lines marking lambda.1se and lambda.min and the lambda.1se non-zero-coefficient rule adopted. (B) Random forest variable importance bar charts ranked by mean decrease in accuracy (left) and mean decrease in Gini (right), with IL10, STAM2, and PDGFB as the top 3. (C) SVM-RFE 10-fold cross-validation accuracy (left) and cross-validation error (right) curves, with min vector=8 and max accuracy rate=0.91. (D) The three-method Venn diagram, in which LASSO × random forest × SVM-RFE converge on the three transcripts IL10, PDGFB, and STAM2. (E) The circular chromosome map depicts the chromosomal positions of the three candidate genes. (F) Single-gene GSEA enrichment curves against 15,142 whole-transcriptome ranked genes, depicting significant terms including JAK-STAT signaling, ROS metabolic process, and NIK/NF-κB signaling with their NES and BH-adjusted p (minimum adjusted p=0.0146; 133 BH-significant pathways in total). (G) LM22 CIBERSORT deconvolution scatter plots showing immune-cell fractions between high- and low-expression groups of IL10, PDGFB, and STAM2, with an overall reconstruction correlation of r=0.4846; only the PDGFB/resting-NK association reached nominal significance after multiple testing, with no robust myeloid infiltration association. The machine-learning convergence defines the three central nodes of the candidate panel; the between-group expression FDR q of all three candidates is greater than 0.12, so their evidence tier rests on the nominal and machine-learning-convergence layers.
Figure 4.
Candidate panel defined by the intersection of LASSO, random forest, and SVM-RFE on the complete set of 20 nominally significant genes. (A) The LASSO logistic regression coefficient path (left) and 10-fold cross-validation binomial deviance curve (right), with dashed lines marking lambda.1se and lambda.min and the lambda.1se non-zero-coefficient rule adopted. (B) Random forest variable importance bar charts ranked by mean decrease in accuracy (left) and mean decrease in Gini (right), with IL10, STAM2, and PDGFB as the top 3. (C) SVM-RFE 10-fold cross-validation accuracy (left) and cross-validation error (right) curves, with min vector=8 and max accuracy rate=0.91. (D) The three-method Venn diagram, in which LASSO × random forest × SVM-RFE converge on the three transcripts IL10, PDGFB, and STAM2. (E) The circular chromosome map depicts the chromosomal positions of the three candidate genes. (F) Single-gene GSEA enrichment curves against 15,142 whole-transcriptome ranked genes, depicting significant terms including JAK-STAT signaling, ROS metabolic process, and NIK/NF-κB signaling with their NES and BH-adjusted p (minimum adjusted p=0.0146; 133 BH-significant pathways in total). (G) LM22 CIBERSORT deconvolution scatter plots showing immune-cell fractions between high- and low-expression groups of IL10, PDGFB, and STAM2, with an overall reconstruction correlation of r=0.4846; only the PDGFB/resting-NK association reached nominal significance after multiple testing, with no robust myeloid infiltration association. The machine-learning convergence defines the three central nodes of the candidate panel; the between-group expression FDR q of all three candidates is greater than 0.12, so their evidence tier rests on the nominal and machine-learning-convergence layers.
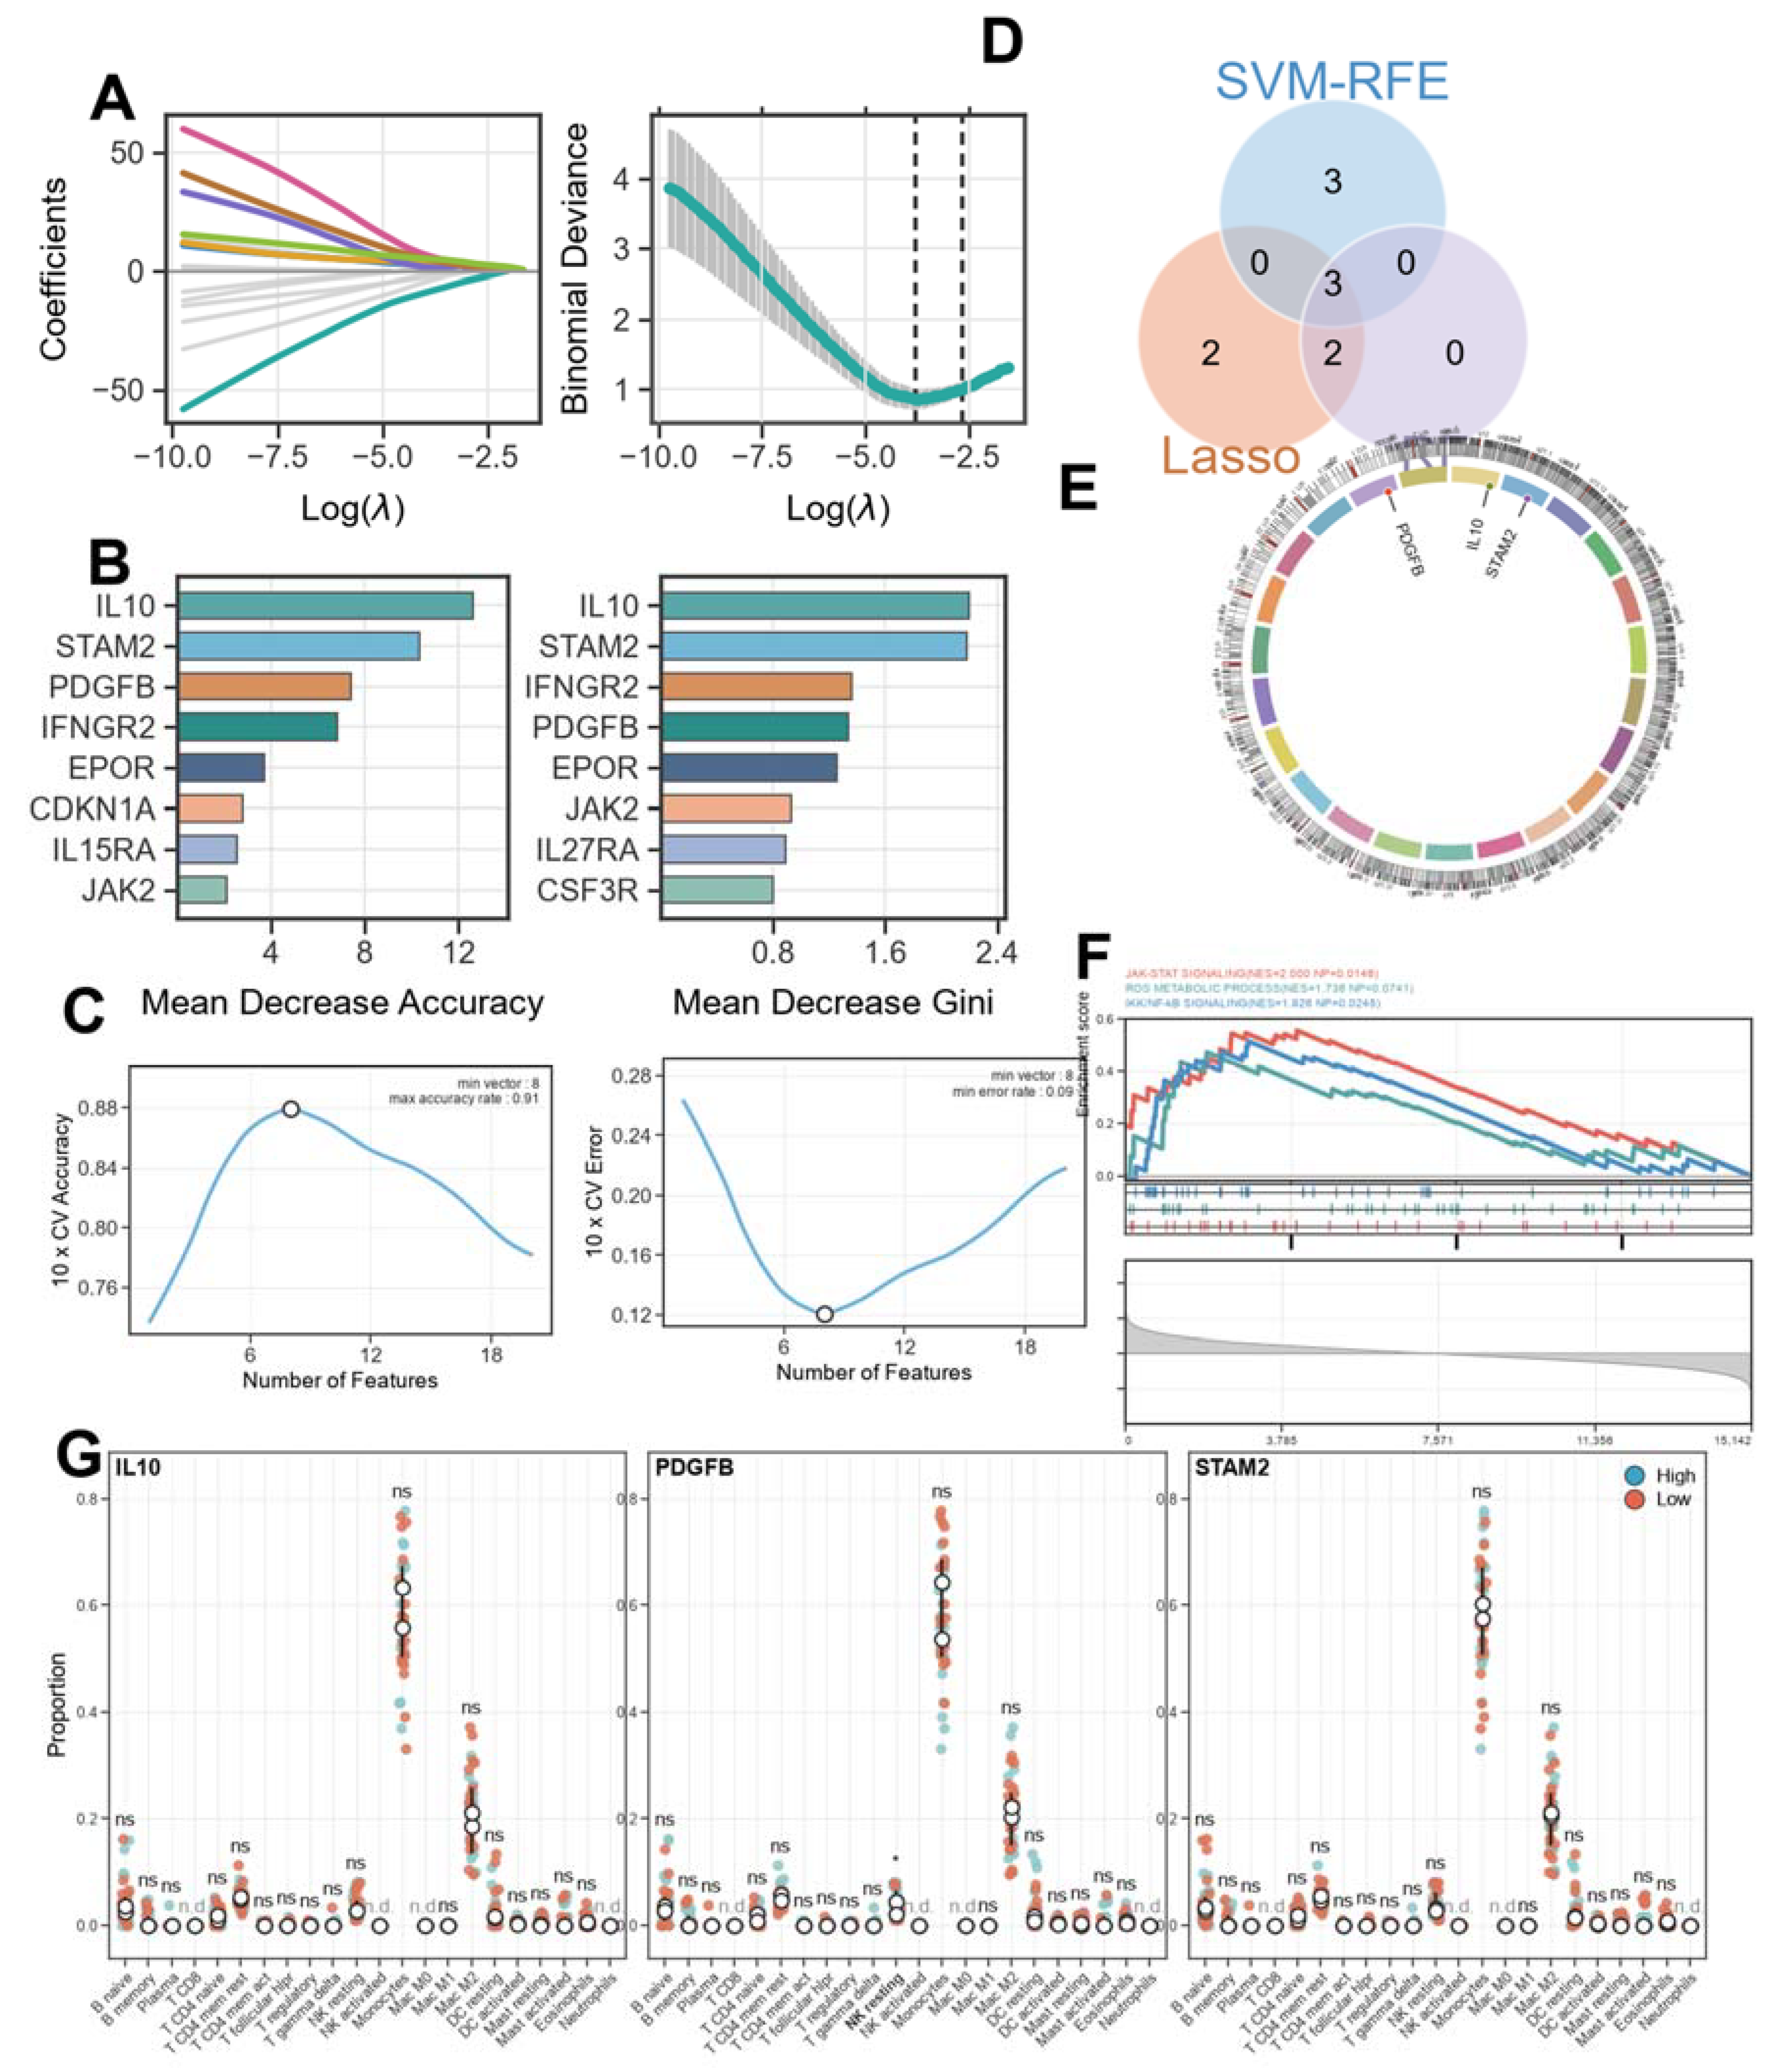
Figure 5.
Single-gene diagnostic performance of STAM2 in the training cohort and two independent external cohorts. (A) Box plot of STAM2 expression between healthy controls (HC) and uveitis samples in the GSE194060 training cohort, with Welch p=0.008865 (Wilcoxon p=0.001996) and ** indicating significance. (B) A nomogram built from STAM2 expression maps expression values to risk scores. (C) The calibration curve of the training cohort, with apparent and bias-corrected curves. (D) The training-cohort ROC curve, with a STAM2 single-gene logistic regression model AUC of 0.7883 (95% CI 0.6497–0.9269). (E) The training-cohort precision-recall (PR) curve. (F) ROC and PR curves for validation cohort 1, GSE61399 (sorted CD14+ monocytes, n=17, 8/9), with AUC 0.8056 (95% CI 0.588–1.000). (G) ROC and PR curves for validation cohort 2, GSE66936 (intermediate monocytes, n=9, 5/4), with AUC 0.8000 (95% CI 0.408–1.000). The GSE195501 cohort, which originates from the same study as the discovery cohort, yielded an AUC of only 0.6288 and is used for internal audit and sensitivity analysis only, not as independent-validation evidence. The training-cohort AUC did not cross the 0.80 threshold and the external cohorts are small, so STAM2 does not yet constitute a clinical-grade diagnostic marker.
Figure 5.
Single-gene diagnostic performance of STAM2 in the training cohort and two independent external cohorts. (A) Box plot of STAM2 expression between healthy controls (HC) and uveitis samples in the GSE194060 training cohort, with Welch p=0.008865 (Wilcoxon p=0.001996) and ** indicating significance. (B) A nomogram built from STAM2 expression maps expression values to risk scores. (C) The calibration curve of the training cohort, with apparent and bias-corrected curves. (D) The training-cohort ROC curve, with a STAM2 single-gene logistic regression model AUC of 0.7883 (95% CI 0.6497–0.9269). (E) The training-cohort precision-recall (PR) curve. (F) ROC and PR curves for validation cohort 1, GSE61399 (sorted CD14+ monocytes, n=17, 8/9), with AUC 0.8056 (95% CI 0.588–1.000). (G) ROC and PR curves for validation cohort 2, GSE66936 (intermediate monocytes, n=9, 5/4), with AUC 0.8000 (95% CI 0.408–1.000). The GSE195501 cohort, which originates from the same study as the discovery cohort, yielded an AUC of only 0.6288 and is used for internal audit and sensitivity analysis only, not as independent-validation evidence. The training-cohort AUC did not cross the 0.80 threshold and the external cohorts are small, so STAM2 does not yet constitute a clinical-grade diagnostic marker.
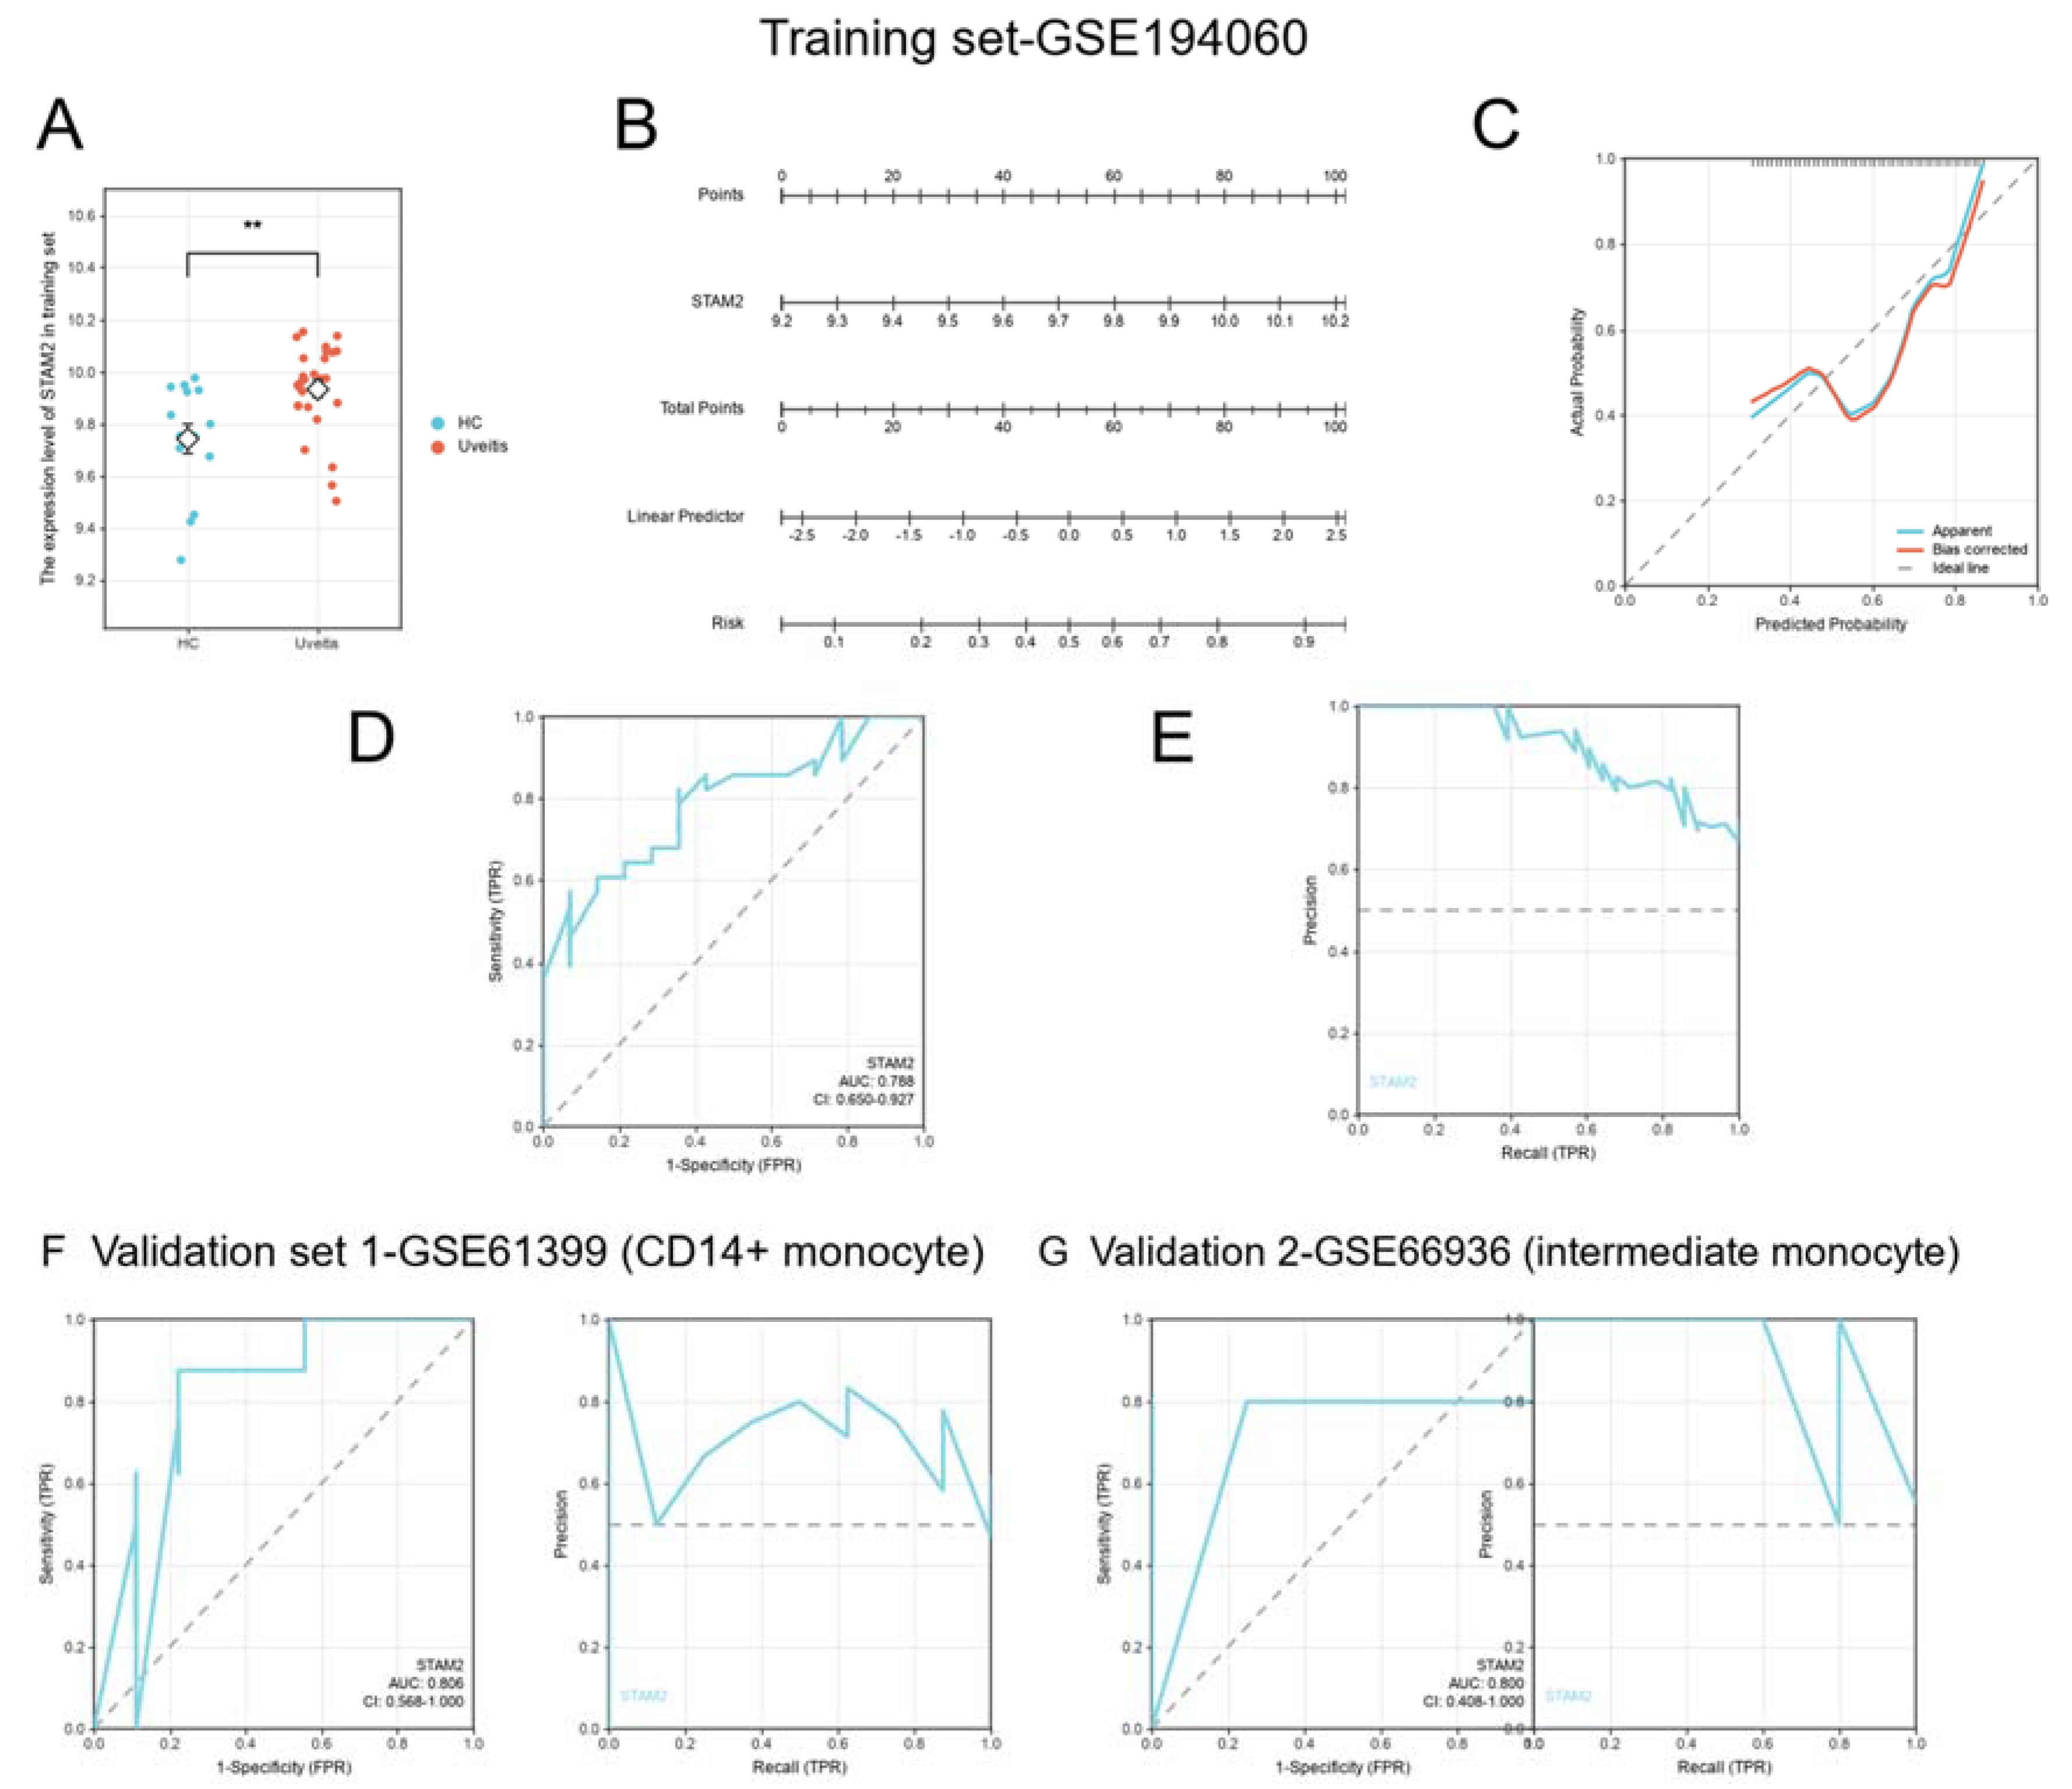
Figure 6.
Single-cell transcriptomic atlas of uveitis aqueous humor (GSE229166; 37,664 cells / 15,595 genes / 23 donors). (A) The t-SNE dimensionality-reduction scatter plot depicts 18 cell clusters. (B) The UMAP dimensionality-reduction scatter plot depicts the same 18 cell clusters. (C) UMAP (left) and t-SNE (right) cell-type maps annotated from canonical marker genes, resolving 20 cell types. (D) Sample-wise stacked bar chart of cell fractions, depicting the composition of immune-cell types in each sample, in which myeloid cells (monocyte/macrophage lineage and dendritic cells) constitute one of the main components of the aqueous-humor immune microenvironment. (E) The CellChat cell-cell communication circular network reconstructs 320 significant communication edges, 6,095 ligand-receptor interactions, and 59 signaling pathways. (F) The metabolic pathway dot plot depicts heterogeneity across cell types in cholesterol metabolism, glycolysis/gluconeogenesis, arginine and proline metabolism, and related pathways. The dataset contains no healthy controls, so these results represent an internal descriptive atlas of the uveitis aqueous-humor microenvironment only and cannot be used for direct disease-versus-health comparison.
Figure 6.
Single-cell transcriptomic atlas of uveitis aqueous humor (GSE229166; 37,664 cells / 15,595 genes / 23 donors). (A) The t-SNE dimensionality-reduction scatter plot depicts 18 cell clusters. (B) The UMAP dimensionality-reduction scatter plot depicts the same 18 cell clusters. (C) UMAP (left) and t-SNE (right) cell-type maps annotated from canonical marker genes, resolving 20 cell types. (D) Sample-wise stacked bar chart of cell fractions, depicting the composition of immune-cell types in each sample, in which myeloid cells (monocyte/macrophage lineage and dendritic cells) constitute one of the main components of the aqueous-humor immune microenvironment. (E) The CellChat cell-cell communication circular network reconstructs 320 significant communication edges, 6,095 ligand-receptor interactions, and 59 signaling pathways. (F) The metabolic pathway dot plot depicts heterogeneity across cell types in cholesterol metabolism, glycolysis/gluconeogenesis, arginine and proline metabolism, and related pathways. The dataset contains no healthy controls, so these results represent an internal descriptive atlas of the uveitis aqueous-humor microenvironment only and cannot be used for direct disease-versus-health comparison.
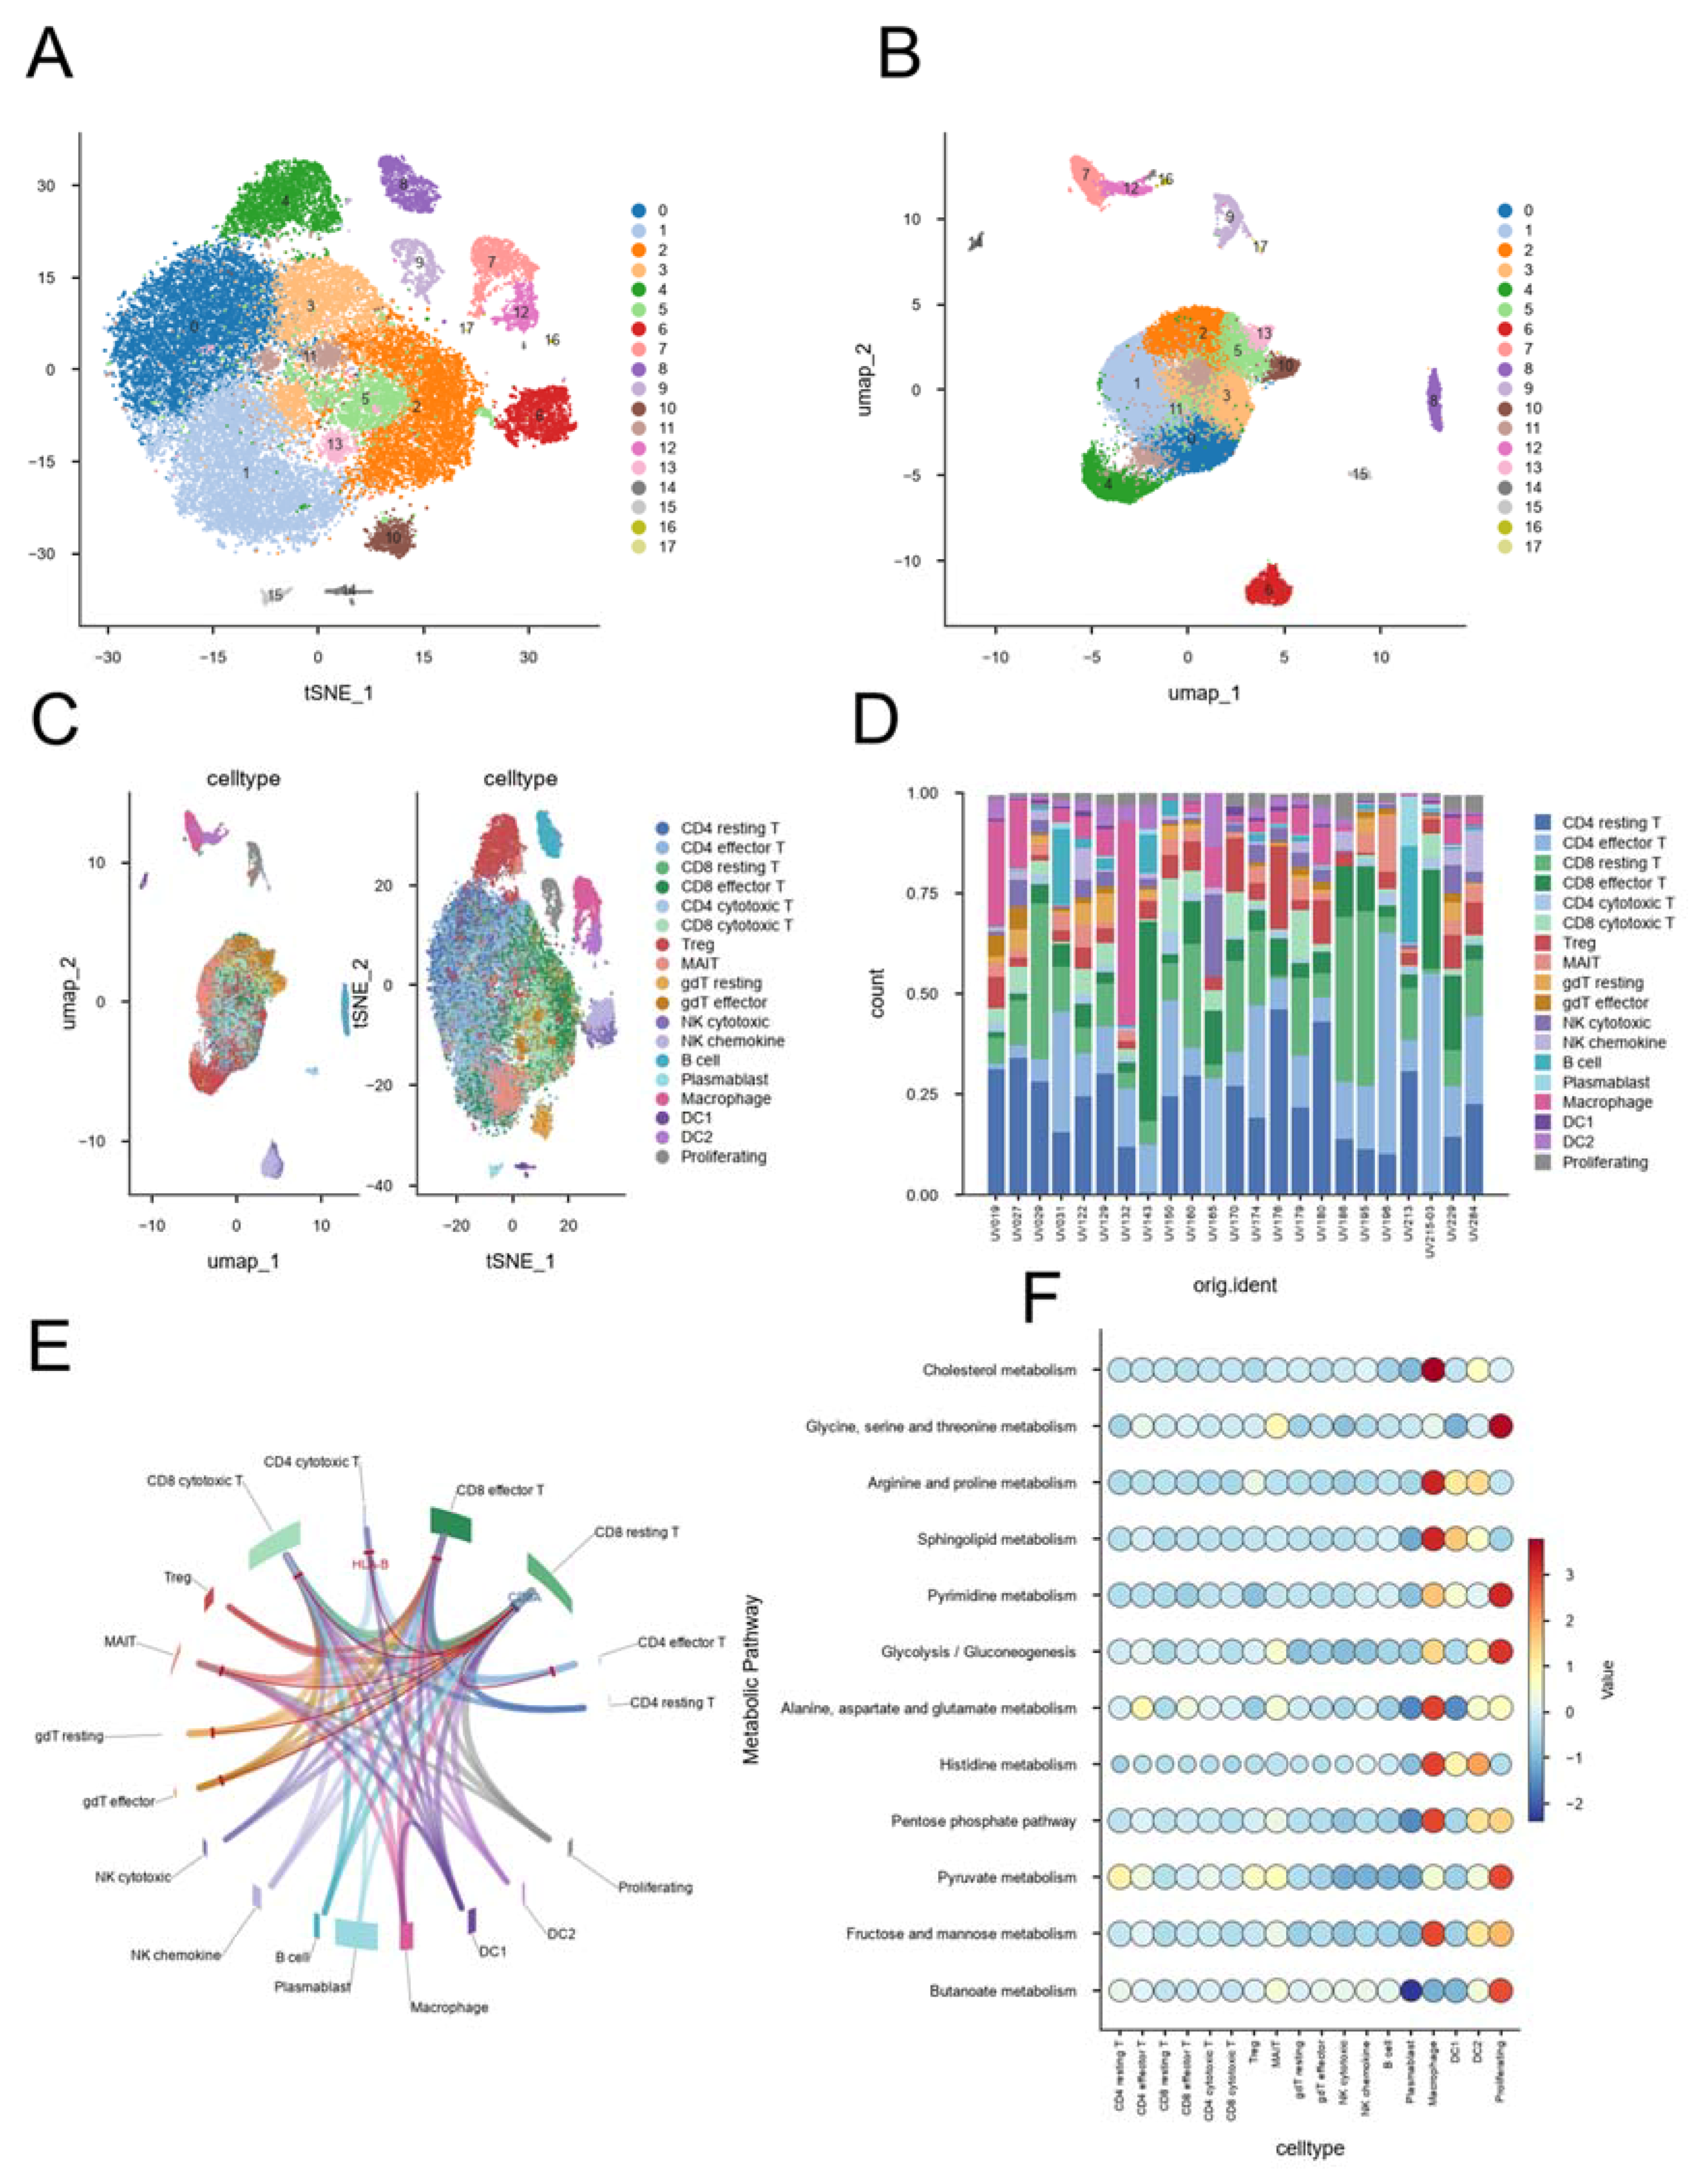
Figure 7.
Pseudotime dynamics and computational perturbation prediction of STAM2 in uveitis aqueous-humor myeloid cells. (A) STAM2 expression dot plot across cell types (x-axis, cell type; point size, percentage of expressing cells; point color, average expression). (B) Scatter plot of STAM2 relative expression along pseudotime, colored by macrophage, DC1, and DC2, with a black sliding trend curve. (C) monocle3 pseudotime trajectory plots, colored by pseudotime (top left), four differentiation states (State 1–4, top right), and macrophage/DC1/DC2 (bottom right); macrophages were inferred as the trajectory start state. (D) Bar chart of the top 10 differentially regulated genes after computational perturbation of STAM2, with the x-axis representing |Z-score|; STAM2 itself ranks first (|Z|=5.1742). (E) STRING protein-protein association network, displaying scores score≥300 as a high-confidence display layer and score 150–300 only as a density background layer, giving 26 nodes and 125 displayed edges in total, of which 78 are high-confidence display edges and 47 serve only to convey network density. (F) GO and KEGG enrichment dot plot showing 15 representative terms (3 GO_BP, 3 GO_CC, 6 GO_MF, and 3 KEGG), with point color mapping q value and point size mapping gene count. The myeloid trajectory comprises 2,157 cells and 111 significant gene-transition edges. These perturbation and network results are computational predictions.
Figure 7.
Pseudotime dynamics and computational perturbation prediction of STAM2 in uveitis aqueous-humor myeloid cells. (A) STAM2 expression dot plot across cell types (x-axis, cell type; point size, percentage of expressing cells; point color, average expression). (B) Scatter plot of STAM2 relative expression along pseudotime, colored by macrophage, DC1, and DC2, with a black sliding trend curve. (C) monocle3 pseudotime trajectory plots, colored by pseudotime (top left), four differentiation states (State 1–4, top right), and macrophage/DC1/DC2 (bottom right); macrophages were inferred as the trajectory start state. (D) Bar chart of the top 10 differentially regulated genes after computational perturbation of STAM2, with the x-axis representing |Z-score|; STAM2 itself ranks first (|Z|=5.1742). (E) STRING protein-protein association network, displaying scores score≥300 as a high-confidence display layer and score 150–300 only as a density background layer, giving 26 nodes and 125 displayed edges in total, of which 78 are high-confidence display edges and 47 serve only to convey network density. (F) GO and KEGG enrichment dot plot showing 15 representative terms (3 GO_BP, 3 GO_CC, 6 GO_MF, and 3 KEGG), with point color mapping q value and point size mapping gene count. The myeloid trajectory comprises 2,157 cells and 111 significant gene-transition edges. These perturbation and network results are computational predictions.
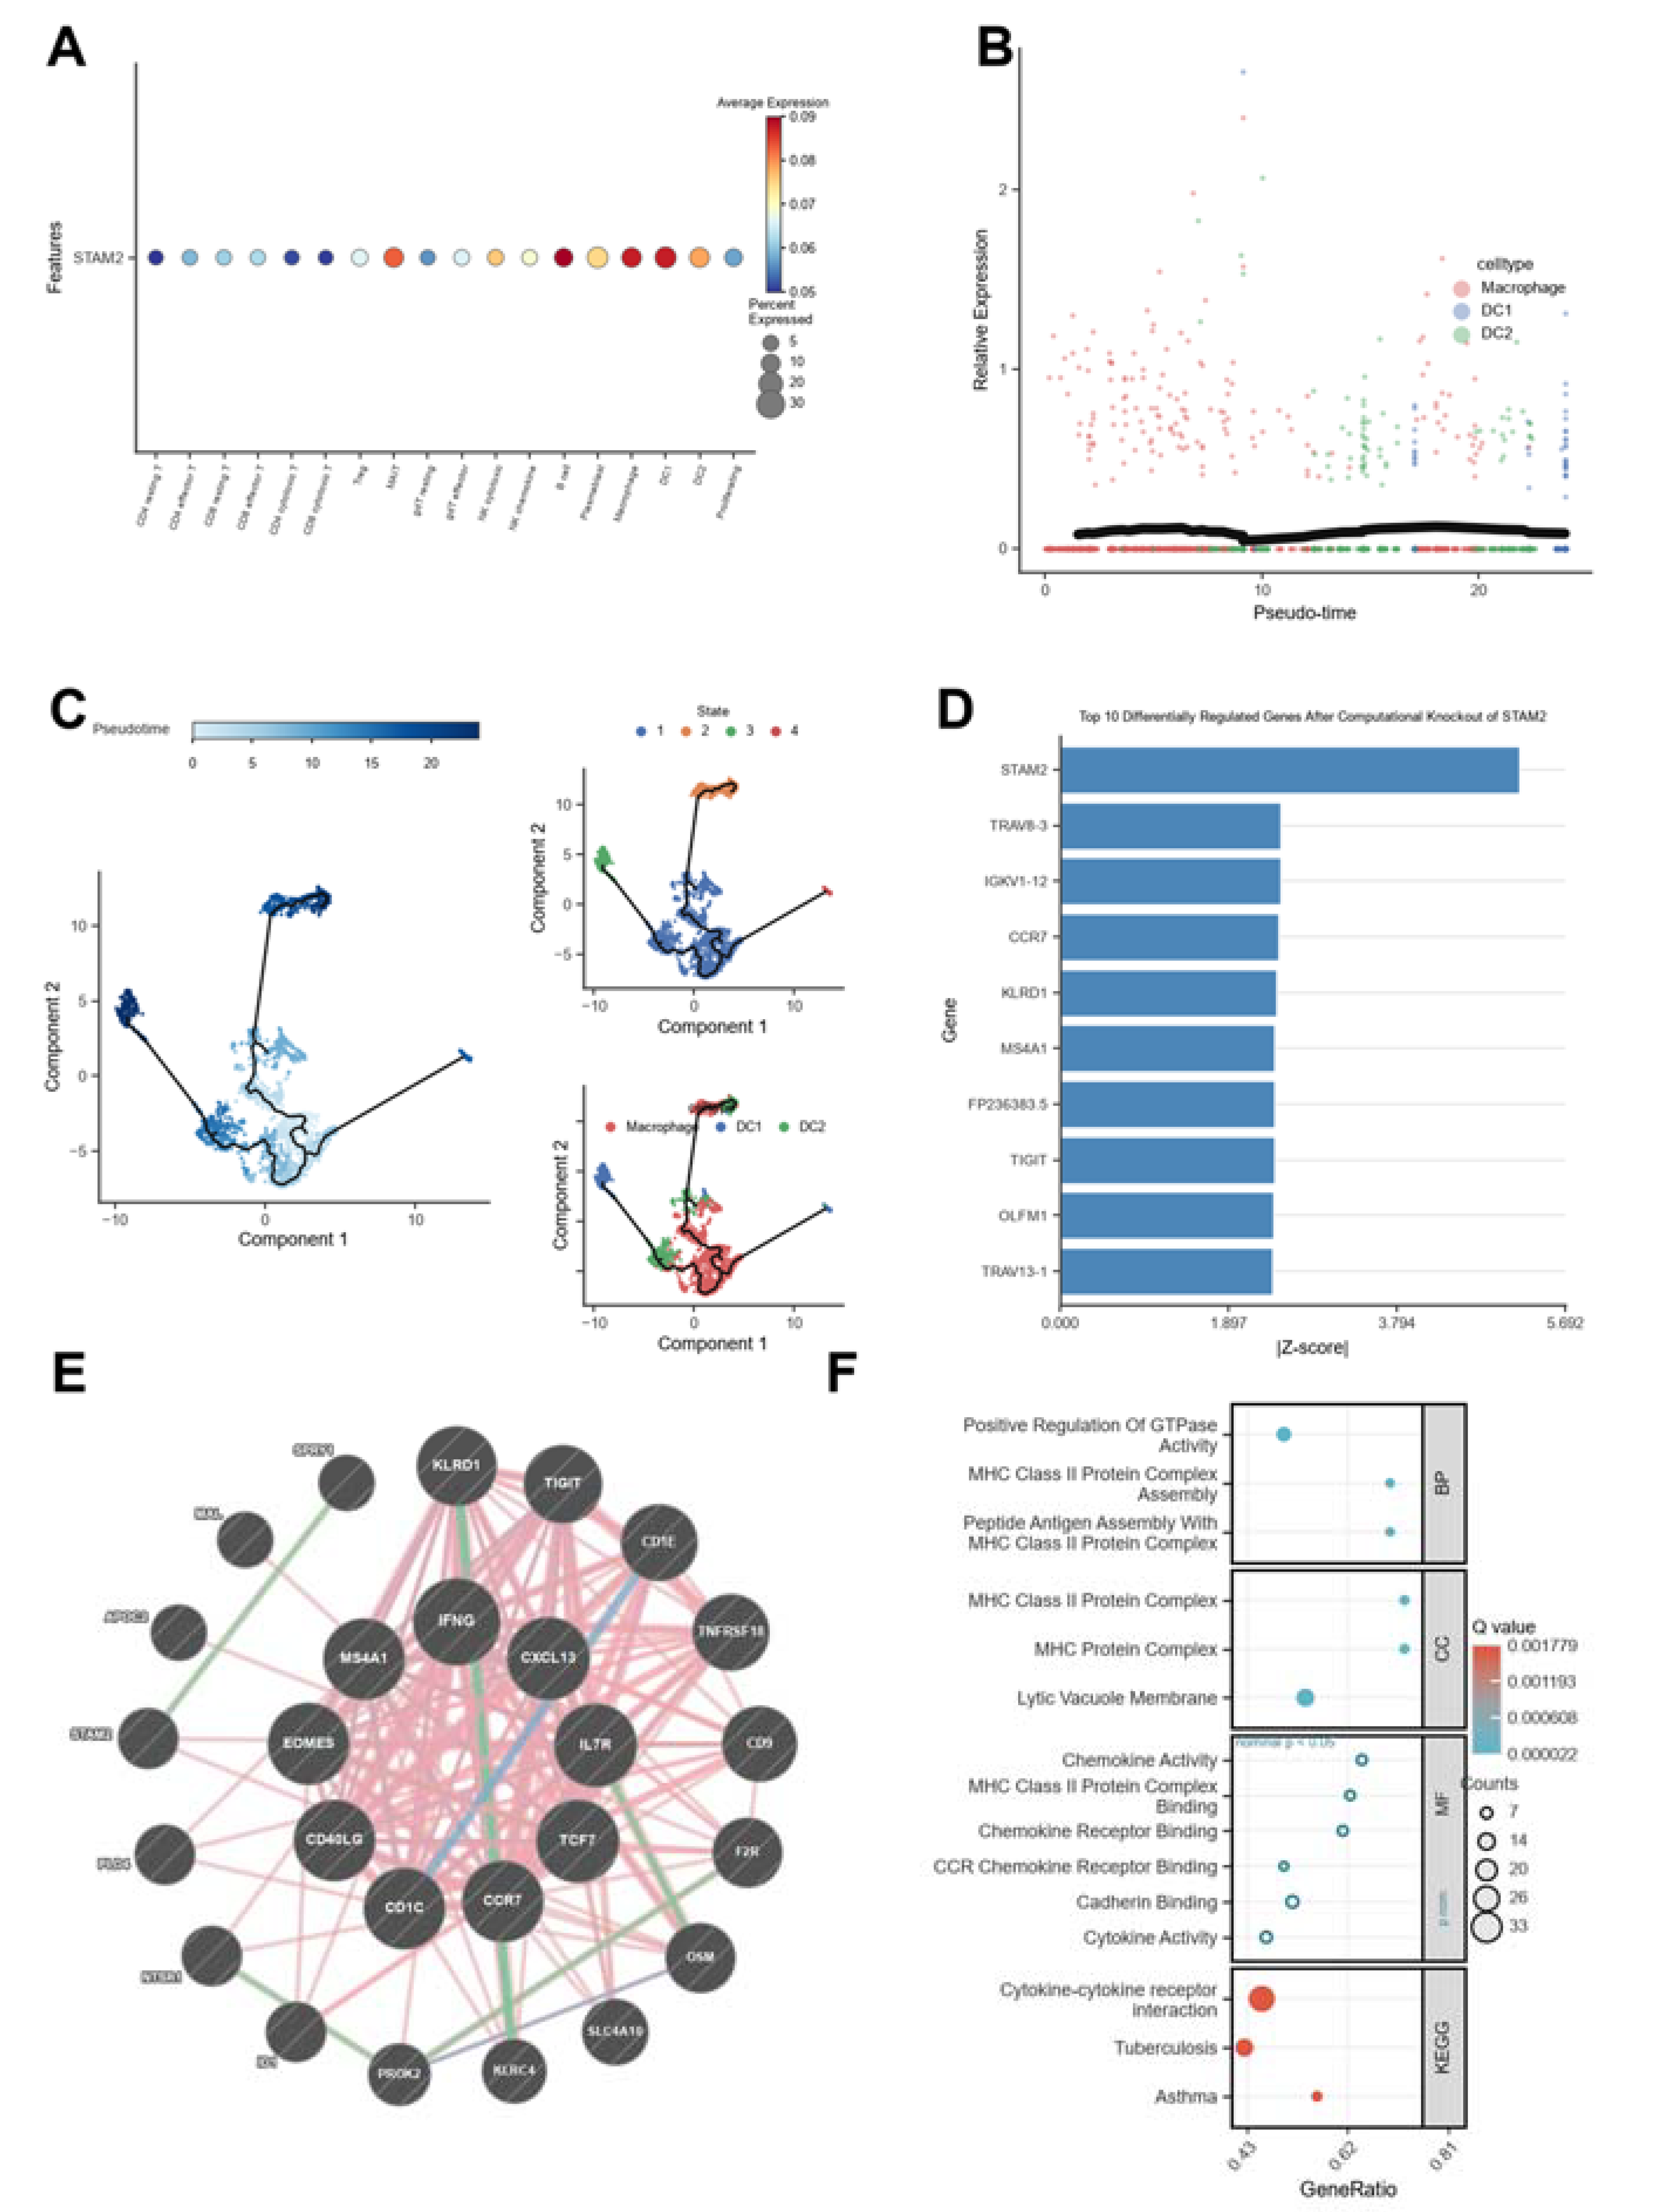
Figure 8.
qPCR validation, active-learning virtual screening, and molecular docking of the IL10–PDGFB–STAM2 candidate panel. (A) qPCR bar chart showing relative expression (2^(−ΔΔCt), normalized to GAPDH; mean ± SD; n=3+3) of IL10, PDGFB, and STAM2 in unstimulated control (n=3) and LPS-stimulated (n=3) THP-1 cells; IL10 was up-regulated 1.5365-fold (p=3.17×10⁻³, **), PDGFB 1.6592-fold (p=4.76×10⁻⁵, ***), and STAM2 1.8220-fold (p=1.95×10⁻⁵, ***). qPCR conclusions refer only to relative mRNA expression and do not imply protein-level, functional, or diagnostic evidence; the unstimulated control group served as the calibrator. (B) DrugReflector active-learning virtual screening results, displaying the distribution of 9,597 compounds in Logit Score–Probability space, with gray points representing all predictions and colored points the top 10 (BRD identifiers) annotated by leftward leader lines; the primary-analysis signature comprised 683 genes with limma BH FDR q<0.05 in GSE194060 (all others set to zero), the maximum reversal probability was 0.1591, and BRD-K11973162 was the only compound exceeding the prespecified reversal-probability threshold of 0.10 (1/9,597, logit 15.18); as a sensitivity analysis, the unfiltered whole-transcriptome signature yielded a maximum reversal probability of only 0.0128 with 0/9,597 compounds exceeding the threshold, and across 200 sample-level bootstrap resamples the primary-signature maximum exceeded 0.10 in 200/200 resamples (range 0.1345–0.2001). The x-axis Logit Score is defined as the logit of the reversal probability and the y-axis Probability is the reversal probability; neither is an experimentally measured value. (C) Compound-target network with IL10/PDGFB/STAM2 as central nodes connecting the candidates to their known/predicted small molecules, with yellow ellipses marking natural compounds and gray ellipses synthetic/approved compounds. (D) Molecular docking results showing the binding conformations (whole receptor-ligand view and binding-pocket zoom) of IL10–Sirolimus (Vina score −9.4 kcal/mol), PDGFB–Celastrol (−7.1 kcal/mol), and STAM2–Filgotinib (−8.1 kcal/mol), with Vina score, contact residues, and binding-center coordinates tabulated; the display threshold was a binding energy ≤ −7.0 kcal/mol. The drug and docking results are computational prioritization clues.
Figure 8.
qPCR validation, active-learning virtual screening, and molecular docking of the IL10–PDGFB–STAM2 candidate panel. (A) qPCR bar chart showing relative expression (2^(−ΔΔCt), normalized to GAPDH; mean ± SD; n=3+3) of IL10, PDGFB, and STAM2 in unstimulated control (n=3) and LPS-stimulated (n=3) THP-1 cells; IL10 was up-regulated 1.5365-fold (p=3.17×10⁻³, **), PDGFB 1.6592-fold (p=4.76×10⁻⁵, ***), and STAM2 1.8220-fold (p=1.95×10⁻⁵, ***). qPCR conclusions refer only to relative mRNA expression and do not imply protein-level, functional, or diagnostic evidence; the unstimulated control group served as the calibrator. (B) DrugReflector active-learning virtual screening results, displaying the distribution of 9,597 compounds in Logit Score–Probability space, with gray points representing all predictions and colored points the top 10 (BRD identifiers) annotated by leftward leader lines; the primary-analysis signature comprised 683 genes with limma BH FDR q<0.05 in GSE194060 (all others set to zero), the maximum reversal probability was 0.1591, and BRD-K11973162 was the only compound exceeding the prespecified reversal-probability threshold of 0.10 (1/9,597, logit 15.18); as a sensitivity analysis, the unfiltered whole-transcriptome signature yielded a maximum reversal probability of only 0.0128 with 0/9,597 compounds exceeding the threshold, and across 200 sample-level bootstrap resamples the primary-signature maximum exceeded 0.10 in 200/200 resamples (range 0.1345–0.2001). The x-axis Logit Score is defined as the logit of the reversal probability and the y-axis Probability is the reversal probability; neither is an experimentally measured value. (C) Compound-target network with IL10/PDGFB/STAM2 as central nodes connecting the candidates to their known/predicted small molecules, with yellow ellipses marking natural compounds and gray ellipses synthetic/approved compounds. (D) Molecular docking results showing the binding conformations (whole receptor-ligand view and binding-pocket zoom) of IL10–Sirolimus (Vina score −9.4 kcal/mol), PDGFB–Celastrol (−7.1 kcal/mol), and STAM2–Filgotinib (−8.1 kcal/mol), with Vina score, contact residues, and binding-center coordinates tabulated; the display threshold was a binding energy ≤ −7.0 kcal/mol. The drug and docking results are computational prioritization clues.
Disclaimer/Publisher’s Note: The statements, opinions and data contained in all publications are solely those of the individual author(s) and contributor(s) and not of MDPI and/or the editor(s). MDPI and/or the editor(s) disclaim responsibility for any injury to people or property resulting from any ideas, methods, instructions or products referred to in the content. |
© 2026 by the authors. Licensee MDPI, Basel, Switzerland. This article is an open access article distributed under the terms and conditions of the Creative Commons Attribution (CC BY) license (http://creativecommons.org/licenses/by/4.0/).
Copyright: This open access article is published under a Creative Commons CC BY 4.0 license, which permit the free download, distribution, and reuse, provided that the author and preprint are cited in any reuse.