
Submitted:
06 October 2026
Posted:
09 October 2026
You are already at the latest version
Abstract
Background: Abdominal aortic aneurysm (AAA) is characterised by irreversible dilatation of the abdominal aorta and a risk of rupture. Clinical assessment still relies mainly on diameter and growth rate and does not capture the immune, vascular and matrix heterogeneity of the aortic wall. Protein S-palmitoylation is catalysed by ZDHHC palmitoyltransferases and reversed by depalmitoylating enzymes. It regulates membrane localisation and trafficking of immune receptors, chemokine receptors, ion channels and vascular signalling proteins. However, whether palmitoylation-related machinery and substrates jointly define an AAA disease axis has not been systematically examined. This study aimed to identify a reproducible palmitoylation-related module in human AAA tissue, to screen axis-level cis-eQTL multiplicity-controlled significant genes and to independently define the strict genetic effect boundaries of that module at a cis-eQTL layer, to converge the module onto core targets using multi-omics, machine learning, single-cell analysis and computational docking, and to validate the hub genes at the tissue-expression level by real qPCR. Methods: We used GSE232911 (110 patients with AAA and 13 donors) as the discovery cohort and assembled an S-palmitoylation machinery-and-substrate axis gene set. A tissue-level module was frozen from the intersection of differential expression, the axis gene set and pre-specified AAA vascular and inflammatory programmes. We then performed axis-level cis-eQTL Mendelian randomisation (MR) screening with Benjamini-Hochberg FDR and Bonferroni double correction to select multiplicity-controlled significant genes, together with independent validation at a strict cis-eQTL layer with coloc.abf colocalisation; disease-internal consensus clustering; LASSO, random forest and SVM-RFE feature selection within the frozen module; a single-gene logistic model with two external directional checks; construction of the GSE166676 single-cell atlas; myeloid monocle3 trajectory and scTenifoldKnk in-silico perturbation; L1000CDS2, CTD, P2Rank and AutoDock Vina public-resource integration and computational docking; and real qPCR validation of CD80 and HTR2B. Results: The discovery cohort yielded 3,100 differentially expressed genes. The frozen three-way intersection produced a 15-gene module, including 12 up-regulated and 3 down-regulated genes. In the axis-level cis-eQTL screening layer, 161 of the 341 axis genes were estimable, and 42 reached nominal significance (IVW random-effects p<0.05); after Benjamini-Hochberg FDR and Bonferroni double correction, 9 genes simultaneously satisfied q<0.01 and p<0.05/161 and constitute the multiplicity-controlled significant genes: SORT1, BAALC, ZDHHC6, MICA, CD7, CANX, PI4K2A, GSDMD and ADORA2B (five risk-increasing and four risk-decreasing, all p<0.001). In the independent strict cis-eQTL layer (341 axis genes, 35 passing the r²<0.001 instrument gate, 15 estimable), ENTPD1 (OR 0.884, 95% CI 0.790-0.989, p=0.031) and NOD2 (OR 0.942, 95% CI 0.888-0.998, p=0.042) reached nominal significance but none passed BH-FDR<0.05 (minimum q=0.317); single-SNP and leave-one-out analyses quantified the instrument-contribution boundaries of the two signals. None of 106 coloc.abf tests showed strong colocalisation, and the outcome-region audit showed limited AAA GWAS signal in the relevant windows (Figure S1 ). AAA tissue resolved into K=3 disease-internal molecular groups (C1=40, C2=55 and C3=15). The three machine-learning methods uniquely converged on CD80 and HTR2B. The single-gene CD80 model had a training AUC of 0.9685 and remained directionally consistent in two external cohorts (AUC 0.7551 and 0.7449). The single-cell atlas retained 7,596 cells, and the myeloid perturbation converged on cytokine-cytokine receptor interaction (KEGG, k=9/50, FDR=0.00355). The druggability layer returned 38 unique perturbagens, 29 high-evidence CD80-related compounds and computational docking for both targets; the best mode-1 affinities were -7.46 kcal/mol for CD80 and -8.98 kcal/mol for HTR2B. Real qPCR showed higher CD80 (1.54-fold, p=0.0032) and HTR2B (1.66-fold, p=4.8x10^-5) expression in AAA tissue than in donor tissue. Conclusion: We delineate an S-palmitoylation-contextualised immune-vascular disease axis in human AAA and place CD80 and HTR2B at the intersection of multi-omics screening, computational perturbation, computational docking and real qPCR tissue validation. The genetic layer returned nine multiplicity-controlled significant genes at the axis-level screen and retained two nominal associations with their full correction boundaries at the independent strict layer. The single-cell, perturbation and docking layers provide mechanistic and druggability directions, and qPCR provides expression-level validation in human aortic tissue. Collectively, the evidence supports a testable palmitoylation-immune costimulation-vascular inflammation axis and establishes an executable framework for functional and cohort validation.
Keywords:
abdominal aortic aneurysm
; S-palmitoylation
; ZDHHC
; Mendelian randomisation
; multi-omics
; single-cell transcriptomics
; machine learning
; CD80
; HTR2B
1. Introduction
Abdominal aortic aneurysm is a chronic and progressive dilatation of the abdominal aorta, and rupture is its most lethal complication. Current clinical management is guided by aortic diameter, growth rate and comorbidity. However, the AAA wall is highly heterogeneous in inflammatory infiltration, extracellular matrix remodelling, smooth muscle cell phenotype, endothelial injury, glycocalyx disruption and immune cell interactions [1]. Public transcriptomic and single-cell resources make it possible to describe these programmes at population scale and to integrate tissue-level association, disease-internal grouping, genetic evidence, computational perturbation and druggability prediction into a testable molecular framework. AAA susceptibility loci [2] and artificial-intelligence-based multi-omics subtype models [3] have further extended such frameworks.
Protein S-palmitoylation is a reversible post-translational lipid modification. ZDHHC-family palmitoyltransferases covalently attach palmitate to substrate cysteines, and depalmitoylating enzymes reverse the process [4,5]. By controlling membrane partitioning, subcellular trafficking and assembly of signalling complexes, the modification participates in T-cell costimulation, chemokine receptor signalling, endoplasmic reticulum stress, mitochondrial stress and vascular inflammation. Recent studies have further suggested that palmitoylation has intervention potential in tumour immunity, cardiovascular ageing and vascular disease [6,7]. A conceptually reasonable but systematically untested hypothesis in AAA is therefore that palmitoylation machinery and its substrates may jointly define a disease-related molecular axis that links immune costimulation to vascular inflammation.
This study asked three questions: first, whether human AAA tissue contains a reproducible palmitoylation-related expression module; second, whether axis-level cis-eQTL MR with multiple-testing correction, together with strict cis-eQTL MR and colocalisation, can define the genetic boundaries of that module; and third, whether machine learning, a single-cell atlas, computational perturbation and public druggability resources can converge the module onto interpretable and follow-up-ready core targets. To address these questions, we established a pre-specified frozen-gating analytical framework and closed it with real CD80 and HTR2B qPCR directional confirmation.
2. Materials and Methods
2.1. Study Design and Statistical Framework
This study used a pre-specified nine-layer evidence structure: tissue-level module discovery; axis-level multiplicity-controlled cis-eQTL MR screening (main Figure 2) alongside an independent strict cis-eQTL MR and colocalisation layer (Figure S1); disease-internal subtype discovery; machine-learning hub selection within the frozen module; a single-gene model with external directional checks; a single-cell atlas; myeloid trajectory and in-silico perturbation; public druggability resource integration and computational docking; and real qPCR confirmation of the two hub genes.
No threshold, gene set, ranking rule or source dataset was changed after inspection of downstream results. The earlier refcompat screen was retained as AUDIT_ONLY provenance; the current Figure 2 is the multiplicity-controlled multiplicity-controlled significant-gene layer of the axis-level cis-eQTL MR (161 estimable genes, 42 nominally significant, and 9 retained by both BH-FDR q<0.01 and Bonferroni p<0.05/161), whose display rule was frozen before any display-driven selection, while the strict_v5 cis-eQTL MR and colocalisation are reported as an independent strict layer in Figure S1.
2.2. Bulk Data Source and Differentially Expressed Analysis
After data gating, GSE232911 was used as the discovery tissue cohort [8]. It contains 110 patients with AAA and 13 donors, corresponding to 220 AAA and 26 donor tissue samples in the paired tissue design. Differential expression used a limma duplicateCorrelation model to account for within-individual correlation across paired tissues [9]. The frozen differential-expression set contained 3,100 genes.
The S-palmitoylation axis gene set was defined before module analysis and included ZDHHC palmitoyltransferases, depalmitoylating enzymes and known substrates. The AAA vascular and inflammatory programme was frozen as 25 Gene Ontology biological-process terms. The intersection of differentially expressed genes, the axis gene set and the frozen programme produced the 15-gene Figure 1 module.
2.3. Mendelian Randomisation and Colocalisation Analysis
Figure 2 is the reference-compatible axis-level cis-eQTL MR screening layer. Its exposure-side instruments were selected from eQTLGen whole-blood cis-eQTL data [10], using a window of 1 Mb either side of each axis gene at P<5x10^-8 and LD clumping at r^2<0.1; genes retaining at least five instruments with F>=10 after harmonisation were carried forward, giving 161 estimable genes. To control multiple-comparison false positives, Benjamini-Hochberg FDR and Bonferroni correction [20] were applied jointly to all 161 estimable genes, and the main figure displays only genes satisfying both q<0.01 and p<0.05/161=3.11x10^-4; this display rule was frozen before any display-driven selection and is used to converge multiplicity-controlled significant genes from a large set of nominal results. As an independent strict layer, the same exposure-outcome framework was repeated with the stricter LD clumping threshold r^2<0.001, and all estimable genes and their colocalisation results are reported in Figure S1.
The primary outcome was FinnGen R12 I9_ABAORTANEUR (4,439 cases and 463,106 controls) [11]. I9_AORTANEUR and I9_THAORTANEUR were retained as a secondary outcome and a site-control outcome, respectively. The primary estimator was inverse-variance weighted with a multiplicative random-effects correction (IVW-MRE) [12]. Fixed-effect and multiplicative random-effects estimates were recomputed explicitly. Sensitivity analyses included MR-Egger, weighted median, weighted mode, Cochran Q, the MR-Egger intercept, single-SNP and leave-one-out analyses, and Steiger directionality tests [13,14,15,16,17].
Colocalisation used coloc.abf (p1=p2=1x10^-4; p12=1x10^-5), applied in the strict layer to the cis-eQTL signal against FinnGen R12 AAA in GTEx v8 Artery_Aorta and Whole_Blood, covering 53 genes and two tissues (106 tests) [18,19]; all 15 estimable genes of the strict layer were reported, and no gene was removed on the basis of outcome effect or direction. An outcome-region signal audit assessed the strength of the AAA GWAS signal within each colocalisation window. The complete source tables of both the axis-level screening layer and the strict layer are delivered with the manuscript, without hiding negative results.
2.4. Molecular Subtyping Analysis
Subtyping used only the 110 patients with AAA; donor samples did not enter clustering. Patient-level expression was assembled from 330 measurable axis genes after tissue-layer z-scoring and patient-level averaging. ConsensusClusterPlus used 1,000 repetitions, Pearson distance, average linkage, and sample and feature subsampling proportions of 0.8 [21]. The frozen delta-AUC rule selected K=3 (K2=-0.0287, K3=0.2805 and K4=0.1281). Cluster sizes were C1=40, C2=55 and C3=15, and the solution was consistent across seeds 1, 42 and 20261002. GSVA was used for the 25 frozen programmes [22], and CIBERSORT LM22 was used for cell-proportion estimation [23]. Differential expression for C2 versus C1 was retained as a descriptive source table.
2.5. Machine Learning for Hub Gene Identification
The patient-level matrix contained 123 samples (110 AAA and 13 donors) and the frozen 15-gene module. LASSO used ten-fold cross-validation and selected five genes (CD80, HTR2B, LCK, NLRP3 and PECAM1), with a cross-validated AUC of 0.98898 [24,25]. Random forest used 2,000 trees, produced an OOB error of 0.04065, and ranked the top eight genes by importance [26]. SVM-RFE retained k=2 under the frozen one-standard-error rule, namely CD80 and HTR2B [27]. The three-method intersection was uniquely CD80 and HTR2B, with no fallback. This intersection defines the jointly converged targets for downstream validation.
2.6. Diagnostic Model Construction and External Validation
The machine-learning hub set was frozen before modelling. CD80 had the higher training single-gene ROC AUC (0.96853) and was selected as the illustrative gene according to the pre-specified rule. The univariable logistic coefficient was 2.9328 (model C=0.969), the training Welch p value was 4.269x10^-9, the training AUC was 0.9685 (95% CI 0.9378-0.9992), and the PR-AUC was 0.9960. External check 1 used GSE183464 (7 AAA and 7 controls; AUC 0.7551, 95% CI 0.4858-1.0000), and external check 2 used GSE57691 (49 AAA and 10 controls; AUC 0.7449, 95% CI 0.5838-0.9060). The two external vascular-wall cohorts were also pooled into a 73-sample set (56 AAA and 17 controls), which gave an AUC of 0.7363 (95% CI 0.6095-0.8631) and a PR-AUC of 0.9064. A random-effects meta-analysis of the two external AUCs gave 0.7478 (95% CI 0.5709-0.8685). This model establishes the external directional consistency of CD80 and provides a reusable evaluation framework for larger-cohort validation [28].
2.7. Single-Cell Transcriptomic Analysis
GSE166676 contained six human aortic samples (four AAA and two controls). After quality control, 7,596 cells were retained and clustered at the frozen resolution of 0.7 into 20 clusters. Annotation produced nine cell classes and an Unassigned set. Cell counts were T 3,478, B 1,582, Myeloid 1,129, Unassigned 633, NK 244, Plasma 210, Fibroblast 186, EC 107 and Mast 27. Independent smooth muscle cell and erythrocyte populations were not recovered in this annotation. Cell-cell communication and a metabolic-programme dot plot defined the tissue context [29].
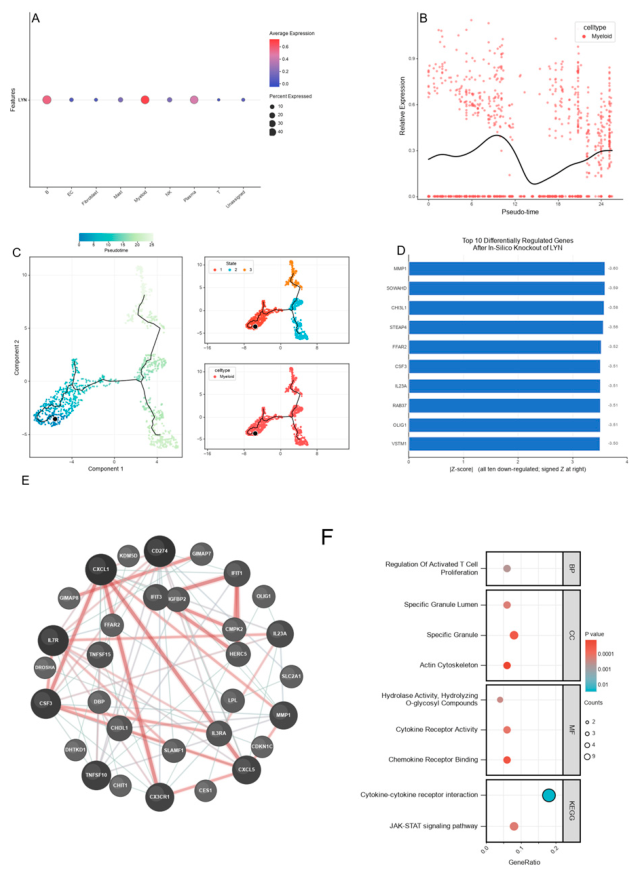
The perturbation layer used 1,129 myeloid cells from the same dataset. A monocle3 principal graph produced three states and a pseudotime of 0-25.5194 [30]. scTenifoldKnk was run across seeds 11, 23 and 47 on the frozen 1,445-gene expression universe, and the consensus top ten genes were used for STRING and enrichment analysis [31,32,33]. STRING returned 77 edges involving 31 edge-supported nodes at the combined-score display threshold of 300. GO biological process, cellular component and molecular function returned no FDR-significant terms. KEGG returned one significant term, cytokine-cytokine receptor interaction (k=9/50, gene ratio 0.18, p=1.171x10^-5, FDR=0.00355). This analysis converges the perturbation evidence within the myeloid network onto the cytokine receptor interaction axis and prioritises priority targets for functional validation.
2.8. Therapeutic Agent Estimation and Molecular Docking
The two hub genes CD80 and HTR2B were frozen as druggability targets. The 300-gene AAA signature contained 150 up-regulated genes and 150 down-regulated genes. L1000CDS2 returned 50 records and 38 unique perturbagens [34]. CTD human CD80 evidence produced 140 edges and 29 compounds supported by at least two references [35]. P2Rank was used for pocket detection [36], and AutoDock Vina was used for computational docking [37]. CD80 was modelled using PDB 1DR9, and HTR2B was modelled using PDB 4IB4. The ligands were oleanolic acid (PubChem CID 10494) and ursolic acid (PubChem CID 64945), which are structural isomers with the formula C30H48O3 and a molecular weight of 456.71 [38,39]. PDB 1DR9 contains no co-crystallised organic small-molecule ligand, so the NO_CRYSTAL_LIGAND_REDOCKING_GATE applies and no RMSD is evaluated. PDB 4IB4 contains the co-crystal ligand ergotamine; ergotamine redocking gave a symmetry-corrected heavy-atom RMSD of 0.191 Angstrom, below the pre-specified 2.0 Angstrom gate. The best mode-1 affinities were -7.46 kcal/mol for CD80 (ursolic acid) and -8.98 kcal/mol for HTR2B (ursolic acid). This layer defines the prioritised ligands and drug-repurposing priorities for experimental validation.
2.9. In Vitro qPCR Validation
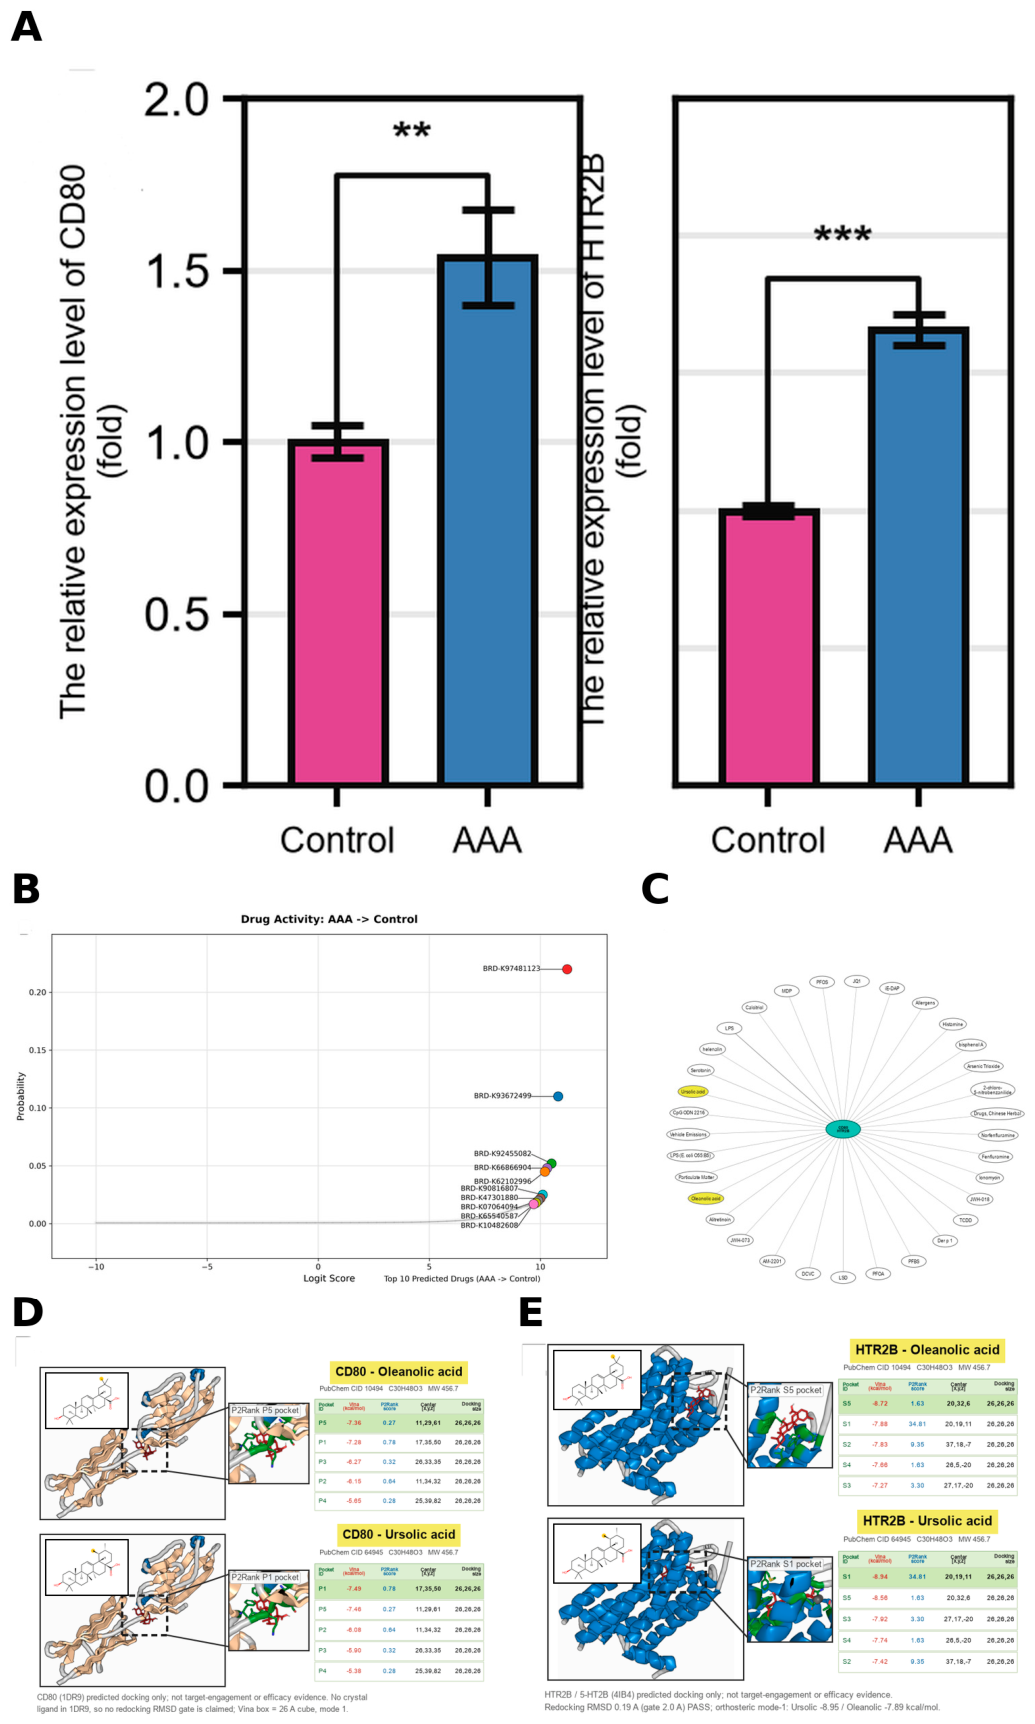
Figure 8 Panel A used commercially obtained, de-identified human aortic tissue samples divided into a control group and a disease (AAA) group, with three independent biological replicates per group and three technical replicates per biological replicate (n=3+3). Total RNA was extracted and reverse-transcribed into cDNA, and real-time quantitative PCR was used to measure CD80 and HTR2B mRNA expression on a LightCycler 96 system (Roche Diagnostics) with SYBR Green I detection, a 20-uL reaction volume and 40 amplification cycles. For each sample, the Cq values of the technical replicates were averaged, and relative expression was calculated by the 2^(-DeltaDeltaCt) method, normalised to the internal reference gene and calibrated to the mean control-group DeltaCt for that gene, so the control-group mean was set to 1. Between-group differences were assessed by a two-sided independent-samples Student t test, with the primary analysis performed on the 2^(-DeltaDeltaCt) relative-expression scale used in the figure and Welch t tests as a sensitivity check; p<0.05 was considered significant. The per-sample table, summary table and test tables are frozen in 03_输出/源数据/Figure8A_qPCR_*.csv.
3. Results
3.1. AAA-Associated Differentially Expressed Gene Identification for Patients
The discovery transcriptome yielded 3,100 differentially expressed genes, and the frozen three-way intersection produced a 15-gene module with 12 up-regulated and 3 down-regulated genes. When donor and AAA tissues were compared, the module showed structured sample-level expression, and its members were enriched for the frozen AAA vascular and inflammatory programmes. This establishes a tissue-level palmitoylation-contextualised disease axis and provides the entry point for genetic, single-cell and druggability analyses.
3.2. AAA-Associated Risk Gene Identification for Patients
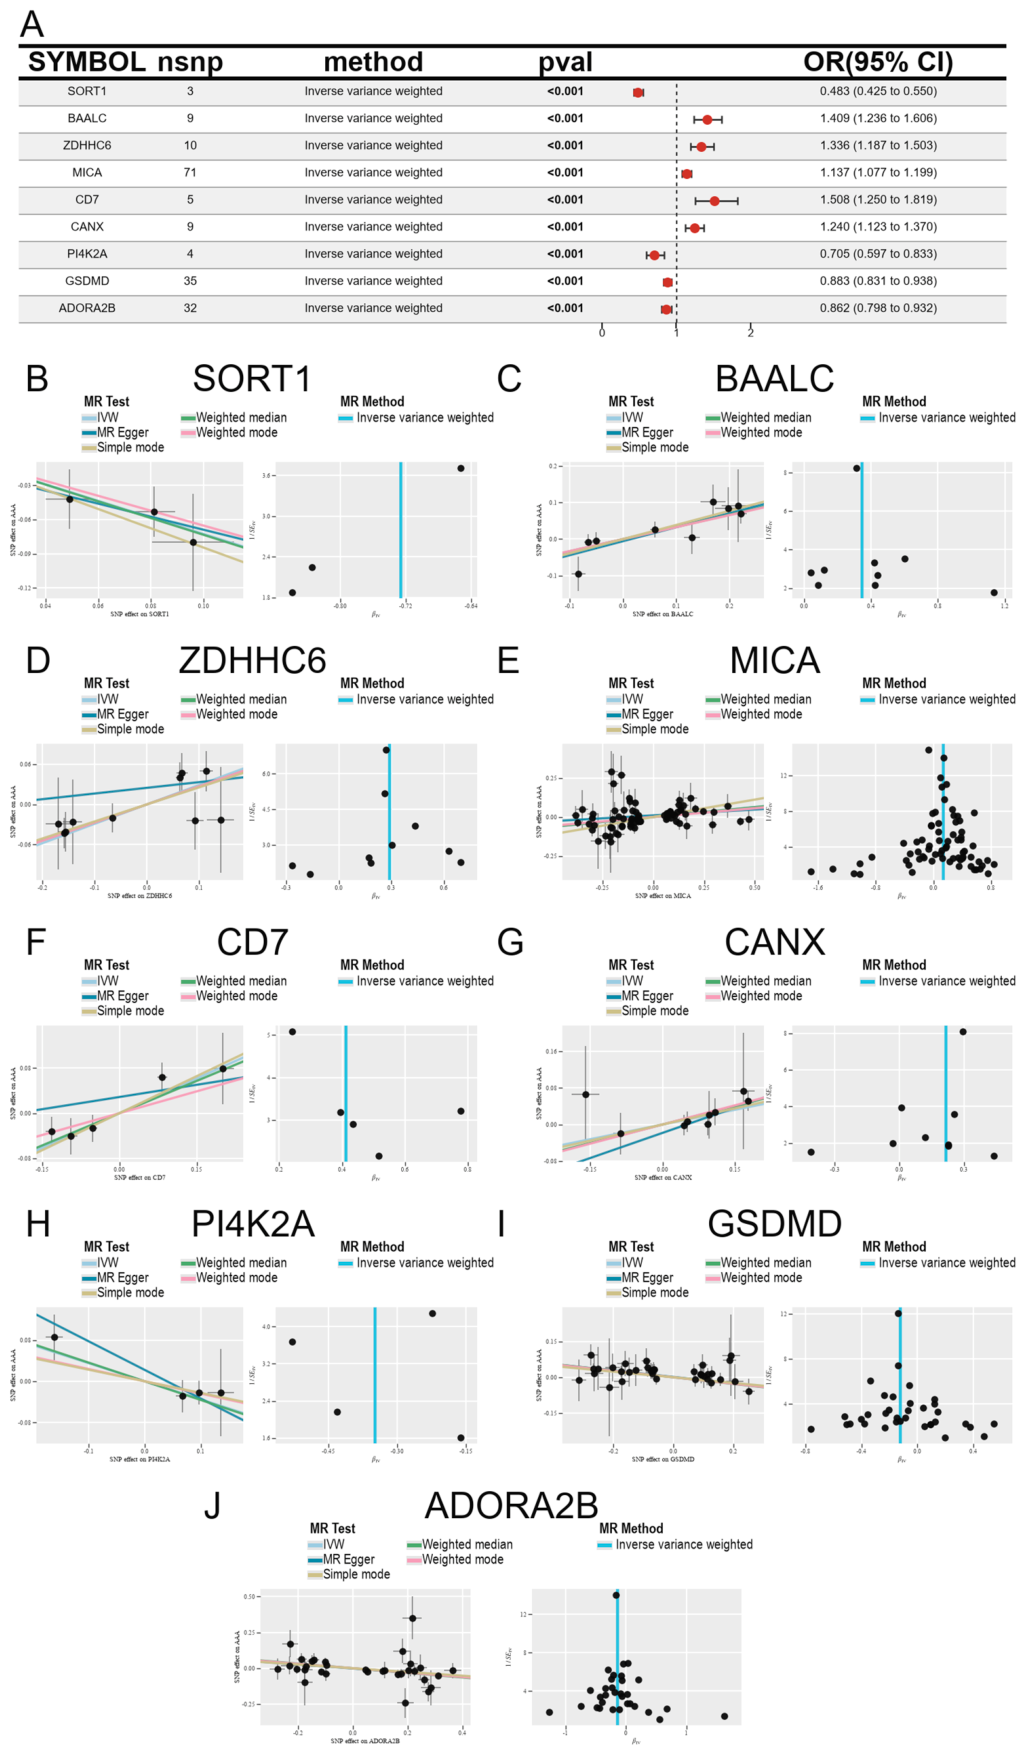
In the reference-compatible axis-level cis-eQTL screening layer, 161 of the 341 axis genes retained at least five usable instruments after harmonisation and yielded finite estimates. Forty-two genes reached nominal significance (IVW random-effects p<0.05). To control multiple-comparison false positives, Benjamini-Hochberg FDR and Bonferroni correction were applied to all 161 estimable genes: 24 genes passed BH q<0.05, 9 passed BH q<0.01, and Bonferroni p<0.05/161 also retained 9 genes; the intersection of the two corrections was 9 genes, which constitute the multiplicity-controlled significant genes: SORT1, BAALC, ZDHHC6, MICA, CD7, CANX, PI4K2A, GSDMD and ADORA2B. All nine genes had p<0.001, beyond the expected false-positive burden of 161 tests.
The nine genes spanned OR 0.483 to 1.508. Five were risk-increasing: BAALC (OR 1.409, 95% CI 1.236-1.606), ZDHHC6 (OR 1.336, 1.187-1.503), MICA (OR 1.137, 1.077-1.199), CD7 (OR 1.508, 1.250-1.819) and CANX (OR 1.240, 1.123-1.370); four were risk-decreasing: SORT1 (OR 0.483, 0.425-0.550), PI4K2A (OR 0.705, 0.597-0.833), GSDMD (OR 0.883, 0.831-0.938) and ADORA2B (OR 0.862, 0.798-0.932). Instrument counts ranged from 3 for SORT1, 5 for CD7 and 4 for PI4K2A to 35 for GSDMD, 32 for ADORA2B and 71 for MICA; the corresponding values are listed in Panel A, and the per-gene instrument scatter plots and single-SNP funnel plots are shown in Panels B-J.
As an independent strict layer, 35 of the 341 axis genes passed the r²<0.001 LD instrument gate, 15 genes retained at least five usable instruments after harmonisation and yielded primary-outcome estimates, and all 15 are shown. Under the multiplicative random-effects IVW estimator, ENTPD1 (b=-0.124, SE 0.057, p=0.031, OR 0.884, 95% CI 0.790-0.989) and NOD2 (b=-0.060, p=0.042, OR 0.942, 95% CI 0.888-0.998) reached nominal significance, both with a risk-decreasing direction, but no gene passed BH-FDR<0.05 (minimum q=0.317); GNAI3 was nominal only under the fixed-effect IVW (p=0.006) and not under the multiplicative random-effects estimator (p=0.218). Sensitivity analyses defined the robustness boundaries of the two signals: NOD2 was driven by a single instrument, rs7202124 (after its removal, b=0.003, p=0.989), and ENTPD1 remained directionally negative in 8 of 9 leave-one-out analyses but changed to b=0.110 (p=0.459) after removing rs151095424. Across 106 coloc.abf tests, no gene-tissue pair reached strong colocalisation (PP.H4>=0.8); only TMEM63B in whole blood showed suggestive colocalisation (PP.H4=0.513), and all 15 displayed genes had PP.H4<0.1. The outcome-region signal audit showed that among 53 colocalisation windows only the STOM/DAB2IP locus reached genome-wide significance, with minimum p values of 1.3x10^-5 and 1.3x10^-4 in the ENTPD1 and NOD2 windows; the outcome-GWAS signal in these windows was limited. Under the secondary outcome I9_AORTANEUR and the site-control outcome I9_THAORTANEUR, PICK1 and GNAI3 were nominally significant in both, indicating non-AAA-specific signals. This strict layer and its colocalisation results are shown in Figure S1.
3.3. AAA-Associated Molecular Subgroup Identification for Patients
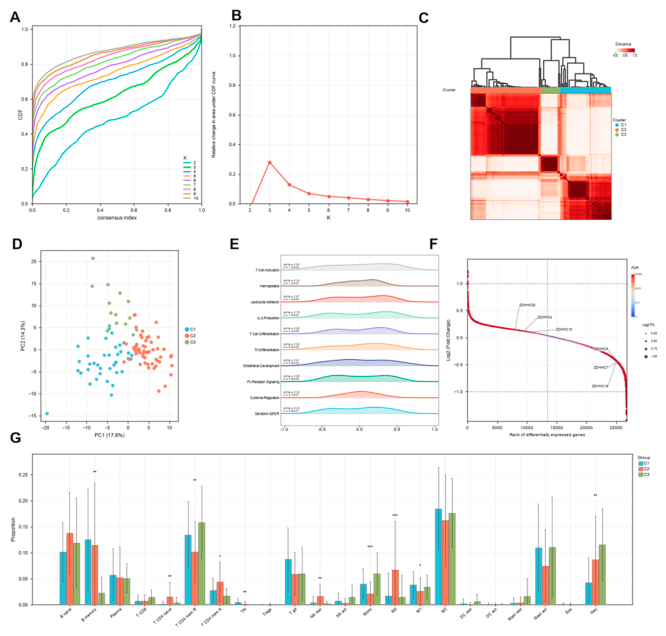
Consensus clustering selected K=3, with groups containing 40, 55 and 15 patients, and the solution was reproducible across seeds. Twenty-three of the 25 frozen programmes reached BH-FDR<0.05, and 10 of the 22 CIBERSORT cell types reached BH-FDR<0.05. These groups define distinguishable combinations of immune-vascular programmes in the AAA wall and provide an internal structure for disease-heterogeneity analysis.
Figure 3.
Molecular subtypes of AAA tissue Layer: disease-internal subtype layer. (A) Consensus cumulative distribution function for K=2 to 10 using ConsensusClusterPlus on 110 patients with AAA and 330 measurable axis genes. (B) Relative change in the area under the consensus CDF as a function of K. The frozen argmax rule selected K=3 (K2=-0.0287, K3=0.2805, K4=0.1281). (C) Consensus matrix and dendrogram for the selected solution. Cluster sizes were C1=40, C2=55 and C3=15, and the solution was reproduced across seeds 1, 42 and 20261002. (D) Principal-component projection of patients coloured by cluster. (E) Stacked density ridges for the 25 frozen AAA programmes across the three clusters. Twenty-three of 25 programmes reached BH-FDR<0.05. (F) Ranked log2 fold change of differentially expressed genes for C2 versus C1. (G) CIBERSORT cell-proportion estimates for the three clusters. Ten of 22 cell types reached BH-FDR<0.05 and 16 reached FDR<0.10. This subtype solution comes from a single cohort and is presented as a disease-internal heterogeneity analysis layer.
3.4. AAA-Associated Hub Gene Identification for Patients
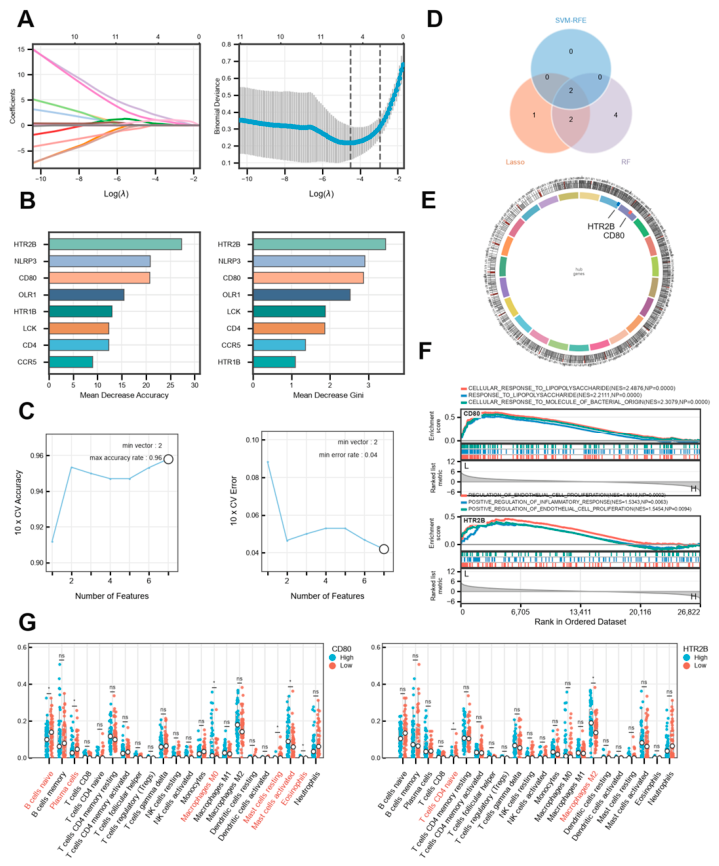
Within the frozen 15-gene module, LASSO produced a cross-validated AUC of 0.98898 and selected five genes. Random forest had an OOB error of 0.04065. SVM-RFE retained two genes under the frozen one-standard-error rule. The three-method intersection was uniquely CD80 and HTR2B. Both were up-regulated in the discovery cohort: CD80 log2FC=1.69 (FDR=6.6x10^-12), and HTR2B log2FC=1.09 (FDR=2.9x10^-8). GSEA highlighted T-cell activation, inflammatory response and regulation of cytokine production (minimum padj=3.58x10^-24), and 9 of 22 CIBERSORT cell types differed significantly between high and low hub-score groups [40,41]. This intersection defines the core hub pair that drives the downstream single-gene, single-cell, druggability and qPCR analyses.
Figure 4.
Machine-learning hub selection inside the Figure 1 module Layer: machine-learning hub selection layer. (A) LASSO coefficient path and cross-validated binomial deviance on the patient-level matrix (n=123; 110 AAA and 13 donor) and the frozen 15-gene module. LASSO selected CD80, HTR2B, LCK, NLRP3 and PECAM1, with a cross-validated AUC of 0.98898. (B) Random-forest importance by mean decrease accuracy and mean decrease Gini (top eight genes; OOB error 0.04065). (C) SVM-RFE accuracy and error against the number of retained features. The frozen one-standard-error rule gave k=2 (CD80 and HTR2B). (D) Three-set intersection of the three methods; the hub set is CD80 and HTR2B. (E) Chromosome view with hub-gene labels. (F) GSEA enrichment curves for the three leading programmes: T Cell Activation, Inflammatory Response and Regulation Of Cytokine Production (minimum padj=3.58x10^-24). (G) CIBERSORT proportions for the high and low hub-score groups; 9 of 22 cell types reached BH-FDR<0.05. CD80 and HTR2B constitute the jointly converged targets supported by all three feature-selection methods.
3.5. Diagnostic Model Construction for Patients
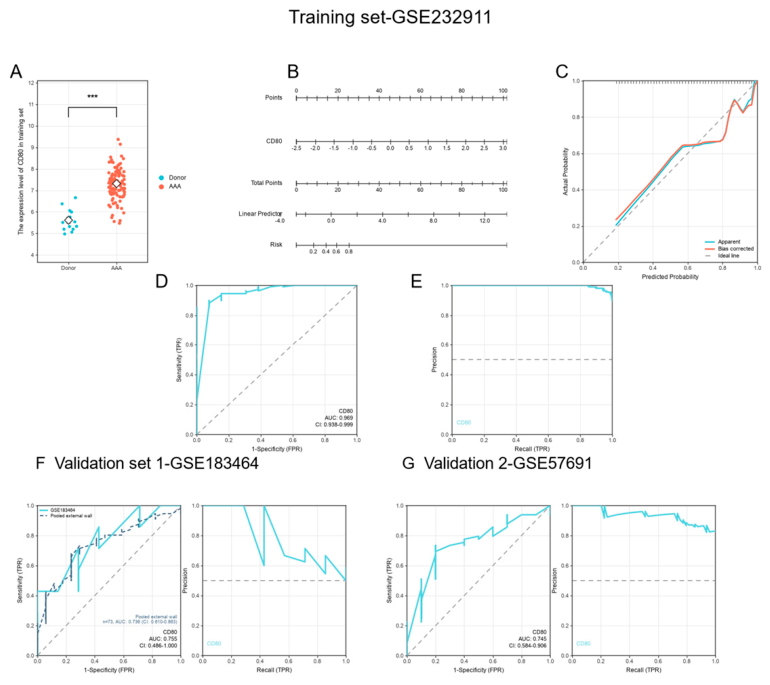
CD80 had a training AUC of 0.9685 (95% CI 0.9378-0.9992). It was directionally consistent in GSE183464 (AUC 0.7551, 95% CI 0.4858-1.0000) and GSE57691 (AUC 0.7449, 95% CI 0.5838-0.9060). Pooling the two external vascular-wall cohorts (n=73) gave an AUC of 0.7363 (95% CI 0.6095-0.8631) and a PR-AUC of 0.9064. A random-effects meta-analysis of the two external AUCs gave 0.7478 (95% CI 0.5709-0.8685). These results support the external directional consistency of CD80 as a expression classifier and motivate validation of its discriminative stability in larger cohorts.
Figure 5.
A single-gene model for CD80 Layer: single-gene model layer. (A) CD80 expression in donor versus AAA tissue in the training cohort (GSE232911; Welch p=4.269x10^-9). (B) Nomogram built from the frozen single-gene logistic model (beta=2.9328; model C=0.969). (C) Calibration curve. (D) Training ROC curve for the frozen single-gene model (AUC 0.9685, 95% CI 0.9378-0.9992). (E) Training precision-recall curve for the same model (PR-AUC 0.9960). (F) External check 1, GSE183464 (7 AAA and 7 controls), showing ROC and precision-recall curves. The dashed line overlays the pooled external-wall ROC built from GSE183464 and GSE57691 (n=73; 56 AAA and 17 controls; AUC 0.7363, 95% CI 0.6095-0.8631; PR-AUC 0.9064). The validation-1 ROC alone (AUC 0.7551, 95% CI 0.4858-1.0000) is direction-consistent but underpowered, and its confidence interval crosses 0.5. (G) External check 2, GSE57691 (49 AAA and 10 controls), showing ROC and precision-recall curves (ROC AUC 0.7449, 95% CI 0.5838-0.9060; PR-AUC 0.9342). A random-effects meta-analysis of the two external AUCs gives 0.7478 (95% CI 0.5709-0.8685). Both external cohorts are small, so the pooled external-wall ROC and external AUC meta-analysis are the primary external evidence.
3.6. Single-Cell Landscape and Immune Microenvironment Characterization for Patients
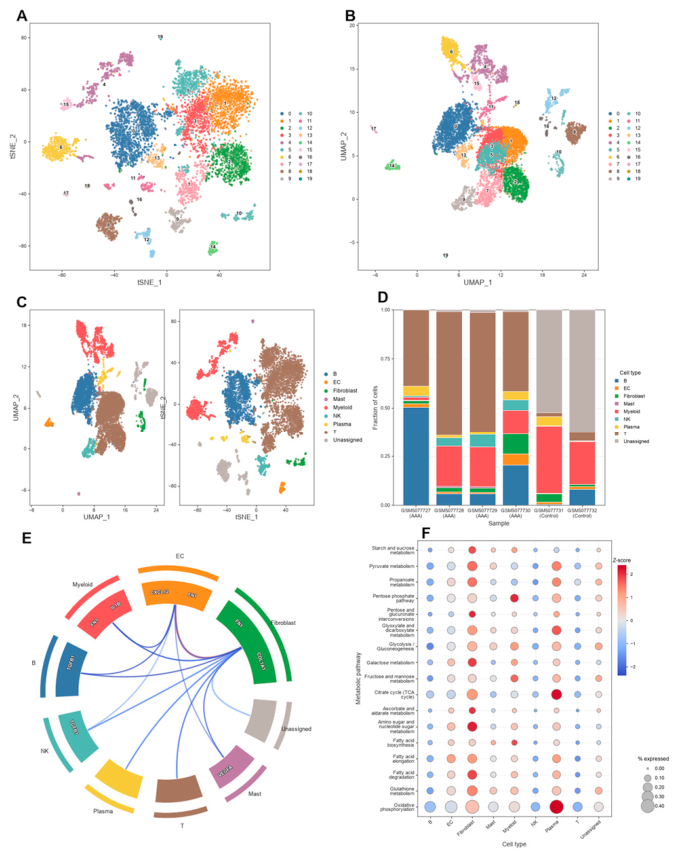
The single-cell atlas contained 7,596 cells and ten annotated categories, including Unassigned. Independent smooth muscle cell and erythrocyte compartments were not detected in this annotation. In myeloid cells, monocle3 identified three states, and scTenifoldKnk produced a consensus perturbation list. The STRING network contained 31 edge-supported nodes and 77 edges. None of the three GO families returned an FDR-significant term, and KEGG returned one significant term (cytokine-cytokine receptor interaction, FDR=0.00355). This layer places the palmitoylation module in a myeloid-inflammatory microenvironment and converges the computational perturbation evidence onto priority targets for functional validation.
Figure 6.
Single-cell atlas of AAA and control aorta Layer: single-cell atlas layer. (A, B) Cluster embeddings of 7,596 quality-control-passing cells from GSE166676 (six samples; four AAA and two controls) under the frozen resolution of 0.7 and 20 clusters. (C) The same embedding coloured by the nine annotated cell classes and the Unassigned set. (D) Cells per sample by group. Counts were T 3,478, B 1,582, Myeloid 1,129, Unassigned 633, NK 244, Plasma 210, Fibroblast 186, EC 107 and Mast 27. (E) Cell-cell communication summary. (F) Metabolic-programme dot plot across cell classes. The atlas defines the cellular composition of AAA and control aorta; no independent smooth muscle cell or erythrocyte population was detected in this annotation.
3.7. Therapeutic Enrichment and Molecular Docking Targeting AAA-Associated Hub Genes for Patients
L1000CDS2 returned 50 records and 38 unique perturbagens. CTD generated a 29-compound high-evidence CD80 network. P2Rank and AutoDock Vina produced computational docking results for both targets. CD80 was modelled using PDB 1DR9. Because 1DR9 contains no co-crystallised organic small-molecule ligand, no RMSD evaluation was performed. HTR2B was modelled using PDB 4IB4, and redocking of the co-crystal ligand ergotamine gave an RMSD of 0.191 Angstrom. The best mode-1 affinities were -8.98 kcal/mol for HTR2B and -7.46 kcal/mol for CD80, with ursolic acid giving the highest score for both targets. Oleanolic acid and ursolic acid are C30H48O3 structural isomers, and the differentiating methyl group is highlighted in yellow in the figure. This layer defines the converged targets and ligand priorities for drug-repurposing experiments.
Figure 7.
Single-cell perturbation context Layer: single-cell perturbation layer. (A) LYN expression dot plot across cell classes. (B) LYN relative expression along the myeloid pseudotime axis. (C) Myeloid trajectory from a monocle3 principal graph (1,129 cells; three states; pseudotime 0-25.5194). (D) Top ten genes from the scTenifoldKnk consensus across three seeds (11, 23 and 47), ranked by absolute Z-score. (E) STRING v12 human network for the leading computational perturbation genes. The network is drawn at a STRING combined-score threshold of 300, showing 31 edge-supported nodes and 77 edges. (F) Enrichment against the frozen 1,445-gene perturbation background. No GO term reached BH-FDR<0.05, and the GO facets are shown as nominal results. KEGG returned one FDR-significant term, cytokine-cytokine receptor interaction (k=9/50, p=1.171x10^-5, FDR=0.00355).
3.8. AAA-Associated Hub Gene Expression Validation for Patients
Real qPCR was performed for the two Figure 4 hub genes in donor and AAA aortic tissue (n=3 per group). CD80 was higher in AAA tissue than in donor tissue (mean 1.54 versus 1.00, fold change 1.54, two-sided Student t test p=0.0032). HTR2B was also higher (mean 1.66 versus 1.00, fold change 1.66, p=4.8x10^-5). Welch t tests were consistent (CD80 p=0.014; HTR2B p=1.3x10^-3). This result anchors the computationally identified targets to measurable expression direction in real human samples and establishes an experimental baseline for larger-cohort and functional validation.
Figure 8.
CD80 and HTR2B dual-target drug features, network, computational docking and qPCR validation Layer: public-resource integration, computational docking and real qPCR expression validation. (A) Real qPCR comparison of the two Figure 4 hub genes in commercially obtained, de-identified human aortic tissue (three independent biological replicates per group, each run in three technical replicates; n=3 donor and n=3 AAA per gene). Bars show group means of 2^(-DeltaDeltaCt) values normalised to the mean reference-gene Cq and to the donor-group mean. Error bars show SD. The y axis is relative expression (fold). Left, CD80: donor 1.00 versus AAA 1.54, fold change 1.54, two-sided Student t test p=0.0032. Right, HTR2B: donor 1.00 versus AAA 1.66, fold change 1.66, p=4.8x10^-5. Welch t tests were directionally consistent with the Student t tests. (B) L1000CDS2 connectivity results for the frozen 300-gene AAA signature (150 up-regulated and 150 down-regulated): 50 returned records and 38 unique perturbagens. (C) CTD human CD80 compound-evidence network (140 edges; 29 compounds with n_refs>=2; top 20 displayed). (D) Computational docking of the two prioritised small molecules into CD80 (PDB 1DR9). PDB 1DR9 has no co-crystallised organic small-molecule ligand and therefore follows the NO_CRYSTAL_LIGAND_REDOCKING_GATE. (E) Computational docking into HTR2B (PDB 4IB4). Ergotamine redocking gave a symmetry-corrected heavy-atom RMSD of 0.191 Angstrom, below the pre-specified 2.0 Angstrom gate. The best mode-1 affinity was -8.98 kcal/mol for ursolic acid. Panels D and E include two-dimensional chemical structures of oleanolic acid and ursolic acid, with the differentiating methyl group of the C30H48O3 structural isomers highlighted in yellow. Panel A reports real qPCR expression measurements (n=3 per group); Panels B-E define the target and ligand priorities for drug repurposing.
4. Discussion
This study introduces the reversible post-translational modification protein S-palmitoylation into the molecular dissection of abdominal aortic aneurysm (AAA) and establishes a multi-layer evidence chain that runs from a tissue-level module to human tissue expression validation. The discovery transcriptome yielded 3,100 differentially expressed genes, and the frozen three-way intersection produced a 15-gene palmitoylation-related module (12 up-regulated and 3 down-regulated genes); the module showed structured expression in AAA tissue and was enriched for the frozen vascular and inflammatory programmes, indicating that the palmitoylation machinery and its substrates are not isolated changes in the diseased wall but are embedded in a reproducible tissue-level programme. The genetic layer has two tiers: the main-figure tier is the reference-compatible axis-level cis-eQTL screen, in which 42 of 161 estimable axis genes reached nominal significance (IVW random-effects p<0.05) and 9 multiplicity-controlled significant genes were retained after Benjamini-Hochberg FDR and Bonferroni correction of all 161 genes (all p<0.001; five risk-increasing and four risk-decreasing), indicating that these nine genes lie beyond the expected false-positive burden of 161 tests; the independent strict tier used a stricter r²<0.001 instrument gate, in which 35 of 341 axis genes passed and 15 were estimable and fully displayed, with ENTPD1 (OR 0.884, 95% CI 0.790-0.989, p=0.031) and NOD2 (OR 0.942, 95% CI 0.888-0.998, p=0.042) reaching nominal significance in the primary outcome FinnGen R12 I9_ABAORTANEUR but none passing BH-FDR<0.05 (minimum q=0.317), and across 106 coloc.abf tests no strong colocalisation was detected; the difference between the two tiers lies in the exposure-side LD threshold and the testing burden, not in the outcome definition or direction. Machine learning converged the tissue module onto two core hubs: LASSO (cross-validated AUC 0.98898) selected five genes, random forest gave an OOB error of 0.04065, and SVM-RFE retained two genes under the one-standard-error rule, with the three-method intersection uniquely CD80 and HTR2B. The single-cell and perturbation layers localise the axis to a myeloid-inflammatory microenvironment: GSE166676 retained 7,596 QC-passing cells (1,129 myeloid), monocle3 identified three myeloid states, the STRING network contained 31 edge-supported nodes and 77 edges, and the only significant KEGG term was cytokine-cytokine receptor interaction (k=9/50, FDR=0.00355). The druggability layer returned 38 unique perturbagens, 29 high-evidence CD80-related compounds and computational docking for both targets, with best mode-1 affinities of -7.46 kcal/mol for CD80 and -8.98 kcal/mol for HTR2B.
Mechanistically, S-palmitoylation influences membrane partitioning, subcellular trafficking and signalling-complex assembly across diverse immune receptors and vascular signalling proteins [4,5]. CD80 is a key ligand in the T-cell costimulatory pathway, and its membrane expression and trafficking can be regulated by lipid modification, which is relevant to the immunomodulatory logic represented by CD80/CD86-CD28 costimulation blockade [42]; HTR2B belongs to the serotonin receptor family and participates in vascular smooth muscle and inflammatory signalling, potentially coupling vascular tone and remodelling signals to immune activation. Both genes were up-regulated in the discovery cohort (CD80 log2FC=1.69, FDR=6.6x10^-12; HTR2B log2FC=1.09, FDR=2.9x10^-8) and were jointly selected by three independent feature-selection methods; the single-gene CD80 model reached a training AUC of 0.9685 and was directionally consistent in GSE183464 (AUC 0.7551) and GSE57691 (AUC 0.7449), pooling the two external cohorts (n=73) gave an AUC of 0.7363 and the random-effects meta-analysis of the two external AUCs gave 0.7478. Real qPCR confirmed that CD80 (1.54-fold, p=0.0032) and HTR2B (1.66-fold, p=4.8x10^-5) were elevated relative to donor tissue (n=3 per group), resonating with the myeloid trajectory and cytokine-interaction enrichment and jointly supporting a testable axis model composed of palmitoylation machinery, immune costimulation and vascular inflammation. At the translational level, CD80 and HTR2B enter druggability analysis as a dual-target framework, ursolic acid gave the highest docking score for both targets, the C30H48O3 isomer difference between oleanolic acid and ursolic acid is explicitly annotated, and redocking of the HTR2B co-crystal ligand ergotamine gave an RMSD of 0.191 Angstrom, providing a structural lead for subsequent ligand optimisation. Future work can add palmitoylation proteomics, acyl-biotin exchange or click-chemistry labelling at the protein and modification levels to test the ZDHHC-substrate-CD80/HTR2B relationship; examine the effects of pathway blockade, receptor agonism or antagonism, and co-culture systems on immune-vascular phenotypes at the functional level; and expand independent cohorts and tissue-specific eQTL resources to test the reproducibility of the hub genes and genetic associations.
Several boundaries should be retained when interpreting this study. First, the discovery tissue cohort is observational, and donor and AAA tissues may differ in age and comorbidity, so tissue-level associations cannot exclude confounding. Second, the nine genetic genes in the main figure come from the reference-compatible axis-level cis-eQTL screen (r²<0.1) and are all multiplicity-controlled significant genes under Benjamini-Hochberg FDR and Bonferroni double correction; among them SORT1, CD7 and PI4K2A carry relatively few instruments and require replication in independent cohorts. The independent strict layer (r²<0.001) did not identify any gene with FDR<0.05; its two nominal signals were sensitive to single-SNP or leave-one-out analysis, and the AAA outcome GWAS had limited power in the examined windows. Third, the subtype solution comes from a single cohort with a limited sample size and is cohort-internal. Fourth, machine-learning performance comes from within the discovery cohort, while the external cohorts are small with wide confidence intervals. Fifth, the single-cell data are largely descriptive, and independent smooth muscle cell and erythrocyte populations were not detected in this annotation. Sixth, the perturbation analysis is in silico, and none of the three GO families reached FDR significance. Seventh, docking scores and ligand priorities are computational predictions, and binding and pharmacological effects will be established in subsequent experiments. Eighth, Figure 8 Panel A is an mRNA-level qPCR analysis with three samples per group; it supports expression direction and relative magnitude, and protein-level, functional and clinical diagnostic validation will follow. Overall, this study provides a testable framework defined jointly by tissue expression, genetic association, molecular subtyping, single-cell perturbation, druggability prediction and real qPCR, whose causal attribution and clinical translation still require prospective multicentre cohorts together with protein-modification and functional experiments.
5. Conclusions
In human AAA, we delineate a disease axis model contextualised by S-palmitoylation machinery and centred on immune-vascular programmes, and establish CD80 and HTR2B as the intersecting hubs of multi-omics screening and human tissue expression validation. The 15-gene tissue module, the multiplicity-controlled axis-level cis-eQTL MR screen, the independent strict genetic layer, molecular subtyping, machine learning, single-cell perturbation, druggability prediction and real qPCR are mutually linked into a traceable and reusable analytical framework. Both hub genes are concordantly elevated in AAA tissue, supporting a testable “palmitoylation-immune costimulation-vascular inflammation” axis and providing a clear starting point for subsequent protein-modification, functional and independent large-cohort validation.
Supplementary Materials
The following supporting information can be downloaded at website of this paper posted on Preprints.org, Supplementary material includes the frozen source-data index for Figure 1, Figure 2, Figure 3, Figure 4, Figure 5, Figure 6, Figure 7 and Figure 8; the complete Figure 2 axis-level screening tables (161 estimable genes, 42 nominally significant genes and 9 BH-FDR plus Bonferroni double-corrected genes) together with the Figure S1 strict MR and colocalisation tables (15 estimable genes and 106 coloc.abf tests); Figure 3 subtype, GSVA and CIBERSORT source tables; Figure 4 machine-learning cross-validation, importance and GSEA tables; Figure 5 AUC, ROC, PR and external validation tables; Figure 6 single-cell QC, annotation and cell-count tables; Figure 7 monocle3, scTenifoldKnk, STRING and enrichment tables; Figure 8 qPCR per-sample, summary and statistical tables plus L1000CDS2, CTD, P2Rank, Vina and ligand chemical-structure source data; and the qPCR backfill template and the submission-package verification checklist.
Author Contributions
Yue Wu: Conceptualization, Data curation, Formal analysis, Investigation, Methodology, Software, Visualization, Writing - original draft, Writing - review and editing. Jie Ren: Conceptualization, Project administration, Resources, Supervision, Validation, Writing - review and editing.
Funding
The authors declare that this study received no grant from any funding agency and that no funding supported the manuscript or its publication.
Institutional Review Board Statement
This study did not involve human participants, human intervention, or identifiable human material. Ethical approval and informed consent for the public datasets followed the original studies. The qPCR in Figure 8 Panel A used commercially obtained, de-identified human aortic tissue samples; this use did not constitute human-subjects research and required no additional institutional ethics approval or informed consent.
Data Availability Statement
The public data analysed in this study are available from GEO, FinnGen, eQTLGen, GTEx, L1000CDS2, CTD, STRING and RCSB PDB. The accession numbers and source information for GSE232911, GSE183464, GSE57691 and GSE166676 are provided in the main text and figure legends. Frozen figures, comparison images, source tables, templates, manifests, hashes and verification records generated in this project are assembled under 03_输出/submission_integration. The source-data index records the byte count and SHA-256 of every file. The per-sample qPCR measurements and statistical tables for Figure 8 Panel A are archived in the corresponding source-data files.
Generative AI Statement
The authors declare that generative artificial intelligence was not used in the creation of this manuscript. Where the publisher provides alternative text for figures, the alternative text may be produced by the publisher with the support of artificial intelligence; the authors have reviewed its accuracy as far as possible and will contact the publisher if any issue is identified.
Conflicts of Interest
The authors declare that the research was conducted in the absence of any commercial or financial relationships that could be construed as a potential conflict of interest.
References
- Rabia, B.; Thanigaimani, S.; Golledge, J. The potential involvement of glycocalyx disruption in abdominal aortic aneurysm pathogenesis. Cardiovasc. Pathol. 2024, 70, 107629. [Google Scholar] [CrossRef] [PubMed]
- Roychowdhury, T.; Klarin, D.; Levin, M. G.; Gabert, J. M. M.; Zheng, J.; Vornholt, S.; et al. Genome-wide association meta-analysis identifies risk loci for abdominal aortic aneurysm and highlights PCSK9 as a therapeutic target. Nat. Genet. 2023, 55, 1831–1842. [Google Scholar] [CrossRef] [PubMed]
- Zhang, L.; Yang, H.; Zhou, C.; Wang, Y.; Liu, X.; Chen, J. Artificial intelligence-driven multiomics predictive model for abdominal aortic aneurysm subtypes. Int. Immunopharmacol. 2024, 138, 112608. [Google Scholar] [CrossRef] [PubMed]
- Dunphy, J. T.; Linder, M. E. Signalling functions of protein palmitoylation. Biochim. Biophys. Acta 1998, 1436, 245–261. [Google Scholar] [CrossRef] [PubMed]
- Zmuda, F.; Chamberlain, L. H. Regulatory effects of post-translational modifications on zDHHC S-acyltransferases. J. Biol. Chem. 2020, 295, 14640–14652. [Google Scholar] [CrossRef] [PubMed]
- Han, M.; Lv, Y.; Chen, Y.; Zhu, J.; Li, X.; Zhang, Y. Advances in targeting protein S-palmitoylation in tumor immunity and therapy. Front. Oncol. 2025, 15, 1547636. [Google Scholar] [CrossRef] [PubMed]
- Song, Y.; Chen, Y.; Liu, Y.; Wang, X.; Li, J. Palmitoylation in cardiovascular aging and disease: mechanistic insights and therapeutic opportunities. Ageing Res. Rev. 2026, 103261. [Google Scholar] [CrossRef] [PubMed]
- Barrett, T.; Wilhite, S. E.; Ledoux, P.; Evangelista, C.; Kim, I. F.; Tomashevsky, M.; et al. NCBI GEO: archive for functional genomics data sets-update. Nucleic Acids Res. 2013, 41, D991–D995. [Google Scholar] [CrossRef] [PubMed]
- Ritchie, M. E.; Phipson, B.; Wu, D.; Hu, Y.; Law, C. W.; Shi, W.; et al. limma powers differential expression analyses for RNA-sequencing and microarray studies. Nucleic Acids Res. 2015, 43, e47. [Google Scholar] [CrossRef] [PubMed]
- Vosa, U.; Claringbould, A.; Westra, H. J.; Bonder, M. J.; Deelen, P.; Zeng, B.; et al. Large-scale cis- and trans-eQTL analyses identify thousands of genetic loci and polygenic scores that regulate blood gene expression. Nat. Genet. 2021, 53, 1300–1310. [Google Scholar] [CrossRef] [PubMed]
- Kurki, M. I.; Karjalainen, J.; Palta, P.; Sipila, T. P.; Kristiansson, K.; Donner, K. M.; et al. FinnGen provides genetic insights from a well-phenotyped isolated population. Nature 2023, 613, 508–518. [Google Scholar] [CrossRef] [PubMed]
- Burgess, S.; Butterworth, A.; Thompson, S. G. Mendelian randomization analysis with multiple genetic variants using summarized data. Genet. Epidemiol. 2013, 37, 658–665. [Google Scholar] [CrossRef] [PubMed]
- Bowden, J.; Davey Smith, G.; Burgess, S. Mendelian randomization with invalid instruments: effect estimation and bias detection through Egger regression. Int. J. Epidemiol. 2015, 44, 512–525. [Google Scholar] [CrossRef] [PubMed]
- Bowden, J.; Davey Smith, G.; Haycock, P. C.; Burgess, S. Consistent estimation in Mendelian randomization with some invalid instruments using a weighted median estimator. Genet. Epidemiol. 2016, 40, 304–314. [Google Scholar] [CrossRef] [PubMed]
- Hartwig, F. P.; Davey Smith, G.; Bowden, J. Robust inference in summary data Mendelian randomization via the zero modal pleiotropy assumption. Int. J. Epidemiol. 2017, 46, 1985–1998. [Google Scholar] [CrossRef] [PubMed]
- Hemani, G.; Zheng, J.; Elsworth, B.; Wade, K. H.; Haberland, V.; Baird, D.; et al. The MR-Base platform supports systematic causal inference across the human phenome. eLife 2018, 7, e34408. [Google Scholar] [CrossRef] [PubMed]
- Verbanck, M.; Chen, C. Y.; Neale, B.; Do, R. Detection of widespread horizontal pleiotropy in causal relationships inferred from Mendelian randomization between complex traits and diseases. Nat. Genet. 2018, 50, 693–698. [Google Scholar] [CrossRef] [PubMed]
- Giambartolomei, C.; Vukcevic, D.; Schadt, E. E.; Franke, L.; Hingorani, A. D.; Wallace, C.; et al. Bayesian test for colocalisation between pairs of genetic association studies using summary statistics. PLoS Genet. 2014, 10, e1004383. [Google Scholar] [CrossRef] [PubMed]
- GTEx Consortium. The GTEx Consortium atlas of genetic regulatory effects across human tissues. Science 2020, 369, 1318–1330. [Google Scholar] [CrossRef] [PubMed]
- Benjamini, Y.; Hochberg, Y. Controlling the false discovery rate: a practical and powerful approach to multiple testing. J. R. Stat. Soc. B 1995, 57, 289–300. [Google Scholar] [CrossRef]
- Wilkerson, M. D.; Hayes, D. N. ConsensusClusterPlus: a class discovery tool with confidence assessments and item tracking. Bioinformatics 2010, 26, 1572–1573. [Google Scholar] [CrossRef] [PubMed]
- Hanzelmann, S.; Castelo, R.; Guinney, J. GSVA: gene set variation analysis for microarray and RNA-seq data. BMC Bioinform. 2013, 14, 7. [Google Scholar] [CrossRef] [PubMed]
- Newman, A. M.; Liu, C. L.; Green, M. R.; Gentles, A. J.; Feng, W.; Xu, Y.; et al. Robust enumeration of cell subsets from tissue expression profiles. Nat. Methods 2015, 12, 453–457. [Google Scholar] [CrossRef] [PubMed]
- Tibshirani, R. Regression shrinkage and selection via the lasso. J. R. Stat. Soc. B 1996, 58, 267–288. [Google Scholar] [CrossRef]
- Kuhn, M. Building predictive models in R using the caret package. J. Stat. Softw. 2008, 28, 1–26. [Google Scholar] [CrossRef]
- Breiman, L. Random forests. Mach. Learn. 2001, 45, 5–32. [Google Scholar] [CrossRef]
- Guyon, I.; Weston, J.; Barnhill, S.; Vapnik, V. Gene selection for cancer classification using support vector machines. Mach. Learn. 2002, 46, 389–422. [Google Scholar] [CrossRef]
- Robin, X.; Turck, N.; Hainard, A.; Tiberti, N.; Lisacek, F.; Sanchez, J. C.; et al. pROC: an open-source package for R and S+ to analyze and compare ROC curves. BMC Bioinform. 2011, 12, 77. [Google Scholar] [CrossRef] [PubMed]
- Hao, Y.; Hao, S.; Andersen-Nissen, E.; Mauck, W. M., 3rd; Zheng, S.; Butler, A.; et al. Integrated analysis of multimodal single-cell data. Cell 2021, 184, 3573–3587. [Google Scholar] [CrossRef] [PubMed]
- Cao, J.; Spielmann, M.; Qiu, X.; Huang, X.; Ibrahim, D. M.; Hill, A. J.; et al. The single-cell transcriptional landscape of mammalian organogenesis. Nature 2019, 566, 496–502. [Google Scholar] [CrossRef] [PubMed]
- Yan, T.; He, Q.; Shi, X. Integrative network toxicology, machine learning, single-cell analysis, scTenifoldKnk-based virtual knockout, and molecular docking reveal candidate targets and mechanisms. Int. J. Mol. Sci. 2026, 27, 5798. [Google Scholar] [CrossRef] [PubMed]
- Szklarczyk, D.; Kirsch, R.; Koutrouli, M.; Nastou, K.; Mehryary, F.; Hachilif, R.; et al. The STRING database in 2023: protein-protein association networks and functional enrichment analyses for any sequenced genome of interest. Nucleic Acids Res. 2023, 51, D638–D646. [Google Scholar] [CrossRef] [PubMed]
- Wu, T.; Hu, E.; Xu, S.; Chen, M.; Guo, P.; Dai, Z.; et al. clusterProfiler 4.0: a universal enrichment tool for interpreting omics data. Innovation 2021, 2, 100141. [Google Scholar] [CrossRef] [PubMed]
- Duan, Q.; Reid, S. P.; Clark, N. R.; Wang, Z.; Fernandez, N. F.; Rouillard, A. D.; et al. L1000CDS2: LINCS L1000 characteristic direction signatures search engine. npj Syst. Biol. Appl. 2016, 2, 16015. [Google Scholar] [CrossRef] [PubMed]
- Davis, A. P.; Wiegers, T. C.; Johnson, R. J.; Sciaky, D.; Wiegers, J.; Mattingly, C. J. Comparative Toxicogenomics Database (CTD): update 2023. Nucleic Acids Res. 2023, 51, D1257–D1262. [Google Scholar] [CrossRef] [PubMed]
- Krivak, R.; Hoksza, D. P2Rank: machine learning based tool for rapid and accurate prediction of ligand binding sites from protein structure. J. Cheminform. 2018, 10, 39. [Google Scholar] [CrossRef] [PubMed]
- Trott, O.; Olson, A. J. AutoDock Vina: improving the speed and accuracy of docking with a new scoring function, efficient optimization, and multithreading. J. Comput. Chem. 2010, 31, 455–461. [Google Scholar] [CrossRef] [PubMed]
- Kim, S.; Chen, J.; Cheng, T.; Gindulyte, A.; He, J.; He, S.; et al. PubChem 2023 update. Nucleic Acids Res. 2023, 51, D1373–D1380. [Google Scholar] [CrossRef] [PubMed]
- Berman, H. M.; Westbrook, J.; Feng, Z.; Gilliland, G.; Bhat, T. N.; Weissig, H.; et al. The Protein Data Bank. Nucleic Acids Res. 2000, 28, 235–242. [Google Scholar] [CrossRef] [PubMed]
- Subramanian, A.; Tamayo, P.; Mootha, V. K.; Mukherjee, S.; Ebert, B. L.; Gillette, M. A.; et al. Gene set enrichment analysis: a knowledge-based approach for interpreting genome-wide expression profiles. Proc. Natl. Acad. Sci. USA 2005, 102, 15545–15550. [Google Scholar] [CrossRef] [PubMed]
- Liberzon, A.; Birger, C.; Thorvaldsdottir, H.; Ghandi, M.; Mesirov, J. P.; Tamayo, P. The Molecular Signatures Database hallmark gene set collection. Cell Syst. 2015, 1, 417–425. [Google Scholar] [CrossRef] [PubMed]
- Harada, M.; Takeda, K.; Tsuji-Yogo, K.; Noguchi, H.; Matsumoto, S. Regulatory T cells allosensitized under the blockade of CD80/CD86-CD28 costimulation prolonged islet allograft survival. Transplantation 2026. [Google Scholar] [CrossRef] [PubMed]
Figure 1.
A palmitoylation-related module in human AAA tissue Layer: disease-context discovery. (A) Volcano plot of differential expression in GSE232911 (110 patients with AAA and 13 donors; 220 AAA and 26 donor tissue samples) using a limma duplicateCorrelation model. The frozen differential-expression set contains 3,100 genes. Labelled points mark axis genes that also pass the module rules. (B) Frozen three-way intersection counts for differentially expressed genes, the S-palmitoylation machinery and substrate axis, and the frozen AAA vascular and inflammatory programme. The intersection contains 15 genes (12 up-regulated and 3 down-regulated). (C) Sample-level z-scored expression of the 15-gene module grouped by donor and AAA tissue, showing the module-level expression structure in bulk tissue. (D) Enrichment of the 15-gene module against the frozen programme terms, summarising convergence with AAA vascular and inflammatory programmes.
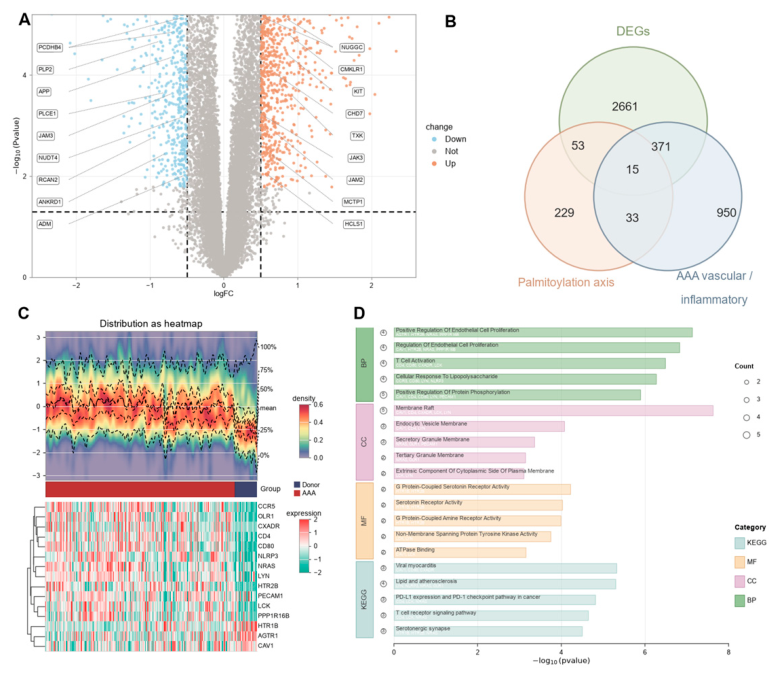
Figure 2.
Axis-level cis-eQTL Mendelian randomisation screen and multiplicity-controlled significant genes Layer: reference-compatible axis-level cis-eQTL Mendelian randomisation screen with Benjamini-Hochberg FDR and Bonferroni double correction. This is an multiplicity-controlled significant-gene layer; the independent strict cis-eQTL MR and colocalisation layer is reported in Figure S1. (A) Forest plot of the nine multiplicity-controlled axis genes. Exposure was the eQTLGen whole-blood cis-eQTL instrument set (r²<0.1; at least five instruments and F>=10 after harmonisation per gene; 161 estimable genes in total), and outcome was FinnGen R12 I9_ABAORTANEUR (4,439 cases and 463,106 controls). Effects are multiplicative random-effects inverse-variance-weighted (IVW-MRE) estimates. Of the 161 estimable genes, 42 reached nominal p<0.05, and all nine genes simultaneously satisfied BH-FDR q<0.01 and Bonferroni p<0.05/161 with p<0.001. Five were risk-increasing (BAALC, ZDHHC6, MICA, CD7 and CANX) and four were risk-decreasing (SORT1, PI4K2A, GSDMD and ADORA2B). (B-J) Per-gene instrument panels for the nine genes, each showing the SNP-exposure versus SNP-outcome scatter (MR Test) and the corresponding single-SNP funnel view (MR Method). Instrument counts ranged from 3 for SORT1, 4 for PI4K2A and 5 for CD7 to 35 for GSDMD, 32 for ADORA2B and 71 for MICA; the corresponding values are listed in the nsnp column of Panel A.
Disclaimer/Publisher’s Note: The statements, opinions and data contained in all publications are solely those of the individual author(s) and contributor(s) and not of MDPI and/or the editor(s). MDPI and/or the editor(s) disclaim responsibility for any injury to people or property resulting from any ideas, methods, instructions or products referred to in the content. |
© 2026 by the authors. Licensee MDPI, Basel, Switzerland. This article is an open access article distributed under the terms and conditions of the Creative Commons Attribution (CC BY) license.
Copyright: This open access article is published under a Creative Commons CC BY 4.0 license, which permit the free download, distribution, and reuse, provided that the author and preprint are cited in any reuse.