

Submitted:
05 October 2026
Posted:
08 October 2026
You are already at the latest version
Abstract
Background /Objectives: Longitudinal monitoring after CD19-directed chimeric antigen receptor (CAR)-T-cell therapy primarily focuses on CAR-T cell expansion. However, comprehensive immunophenotypic characterization of both CAR-T and endogenous T-cells remains limited. We investigated longitudinal immune dynamics following tisagen-lecleucel treatment using multiparameter flow cytometry. Methods: Nineteen patients with relapsed or refractory B-cell malignancies (11 diffuse large B-cell lymphoma and 8 B-cell acute lymphoblastic leukemia) receiving tisagenlecleucel were prospectively enrolled. Serial peripheral blood samples collected during the first 28 days after infusion were analyzed for CAR-T-cell kinetics, differentiation status, activation and exhaustion marker expression, longitudinal phenotypic changes, as well as associations with treatment response and immune-related toxicities. Results: CAR-T-cell expansion predominantly peaked on day 7 after infusion. However, in several patients with B-cell acute lymphoblastic leukemia, delayed peak expansion was observed. At peak expansion, CAR-T-cells were enriched for a central memory phenotype and exhibited significantly higher HLA-DR and PD-1 expression than endogenous T-cells. During follow-up, the number of central memory T-cells progressively declined, whereas terminal effector T-cell numbers increased, which was accompanied by reduced expression of HLA-DR, PD-1, and TIGIT. Despite the distinct activation profiles, CAR-T and endogenous T-cells displayed broadly similar differentiation patterns. Exploratory analyses further demonstrated higher absolute CAR-T-cell counts in patients who developed immune effector cell-associated neurotoxicity syndrome. Conclusions: This clinically applicable approach provides immunophenotypic information beyond CAR-T-cell enumeration alone and may facilitate biomarker discovery and longitudinal immune monitoring in patients receiving CAR-T-cell therapy.
Keywords:
flow cytometry
; CAR-T
; endogenous T-cell
; diffuse large B-cell lymphoma
; B-cell acute lymphoblastic leukemia
1. Introduction
CD19-directed chimeric antigen receptor (CAR)-T-cell therapy has substantially improved survival outcomes in patients with relapsed or refractory B-cell malignancies including diffuse large B-cell lymphoma (DLBCL) and B-cell precursor acute lymphoblastic leukemia (B-ALL) [1,2]. Despite these remarkable advances, disease relapse and treatment-related toxicities, particularly cytokine release syndrome (CRS) and immune effector cell-associated neurotoxicity syndrome (ICANS), remain major clinical challenges [3,4]. Numerous clinical and biological factors, including baseline disease burden, inflammatory markers, CAR-T product characteristics and early CAR-T expansion kinetics have been proposed to predict treatment efficacy and toxicity [5,6,7]. However, clinically robust and consistently validated biomarkers are still lacking [7,8].
Following CAR-T-cell infusion, in vivo CAR-T expansion is a major factor influencing therapeutic response and treatment-related toxicities [6,9]. Accordingly, longitudinal monitoring of circulating CAR-T-cells has become an integral component of clinical management. Several approaches, including molecular assays and flow cytometry, have been adopted to monitor CAR-T expansion in clinical practice [10,11,12]. Notably, a recent survey conducted by the Cellular Therapy and Immunobiology Working Party (CTIWP) of the European Society for Blood and Marrow Transplantation (EBMT) demonstrated the widespread implementation of flow cytometry-based immune monitoring across transplant centers [13].
Beyond CAR-T-cell expansion itself, accumulating evidence suggests that the endogenous immune compartment also contributes to treatment outcomes. Single-cell studies have highlighted that CAR-T therapy is accompanied by dynamic changes in endogenous T-cell populations and that specific T-cell states are associated with CAR-T persistence and treatment response [14,15]. Considering these findings, evaluating both CAR-T-cells and endogenous T-cells during immune monitoring has become important for understanding the biological determinants of treatment success and toxicity [13,16].
Multiparameter flow cytometry provides a unique advantage of simultaneously quantifying both CAR-T-cells and endogenous T-cells while characterizing their differentiation, activation, and exhaustion status [10,11,17]. This integrated approach provides insights beyond simple CAR-T enumeration by simultaneously assessing engineered and endogenous immune compartments. However, longitudinal clinical studies comprehensively evaluating these immunophenotypic features remain limited.
To address this gap, we performed longitudinal multiparameter flow cytometric immune monitoring in patients receiving tisagenlecleucel. We aimed to comprehensively characterize the dynamic immunophenotypic changes of CAR-T cells and endogenous T cells following CAR-T-cell therapy, thereby providing insights into the immunological mechanisms underlying therapeutic response and treatment-related toxicities.
2. Materials and Methods
2.1. Patients and Samples
We included patients with relapsed or refractory B-ALL (n=8) or DLBCL (n=11) who received tisagenlecleucel (Kymriah®) at Seoul St. Mary’s Hospital, Korea, between April 2025 and March 2026 were included. Peripheral blood samples were prospectively collected at predefined time points after CAR-T infusion to evaluate CAR-T-cell kinetics and immune profiling. A total of 54 peripheral blood samples were analyzed, including samples collected on days 3 (n = 6), 7 (n = 17), 14 (n = 13), 21 (n = 12), and 28 (n = 7) after CAR-T infusion.
2.2. Flow Cytometry Analysis
EDTA-anticoagulated peripheral blood samples were processed within 24 hours of collection. For immunophenotyping, peripheral blood aliquots were incubated with the twelve antibodies (Supplementary Table S1) for 15 minutes at room temperature in the dark. Erythrocytes were subsequently lysed using VersaLyse Lysing Solution (Beckman Coulter, Brea, CA, USA; Ref: A09777). Nucleated cells were washed three times with phosphate-buffered saline (PBS) and centrifuged at 400 × g for 3 min between washes, resuspended in 150 μL PBS, and immediately acquired on a DxFLEX flow cytometer (Beckman Coulter). A minimum of 100,000 events were collected per sample. Flow cytometry data were analyzed using Kaluza software version 2.4 (Beckman Coulter). To support the reliability of CAR-T-cell identification, two CAR-T-positive samples and one CAR-T-negative sample were analyzed using both the study reagent and an alternative CAR detection reagent, demonstrating comparable identification of CAR-positive T-cells (Supplementary Figure S1).
2.3. Gating Strategy
Flow cytometric data was analyzed to characterize CAR-T-cells and endogenous T-cell subsets. The hierarchical gating strategy is illustrated in Supplementary Figure S2. Briefly, singlets were identified using forward scatter height (FSC-H) versus forward scatter area (FSC-A) to exclude doublets. Lymphocytes were subsequently gated based on CD45 expression and side scatter (SSC-A) characteristics. Within the lymphocyte gate, CD3+ T-cells and CD19+ B cells were identified, and CD3+ T-cells were further classified as CAR-positive (CAR-T-cells) and CAR-negative (endogenous T-cells) based on CAR-FITC staining. Both the CAR-T and endogenous T-cell populations were further subdivided into CD4+ and CD8+ subsets. T-cell differentiation status was assessed using CCR7 and CD45RA expression. Naïve T-cells (TN) were defined as CD45RA+CCR7+, central memory T-cells (TCM) as CD45RA−CCR7+, effector memory T-cells (TEM) as CD45RA−CCR7−, and effector T-cells (TE) as CD45RA+CCR7−. HLA-DR, PD-1, and TIGIT expression was assessed in CAR-T and endogenous T-cell populations using median fluorescence intensity (MFI).
2.4. Definition of Peak CAR-T Expansion and Longitudinal Analyses
Peak CAR-T expansion was defined individually for each patient as the time point with the highest absolute circulating CAR-T-cell count among the available longitudinal samples. For longitudinal analyses, patients with at least one post-peak sample were included (n = 14). When multiple post-peak samples were available, the latest available follow-up sample was analyzed. Missing scheduled samples were not imputed. Because peak timing and sample availability differed among patients, the exact paired time points varied across patients. Patient-level peak and follow-up time points are provided in Supplementary Table S2.
2.5. Statistical Analyses
Statistical analyses were performed with MedCalc software (version 23.5.5). Unpaired two-sided Mann–Whitney U-tests were applied to assess statistical significance between groups of unpaired samples, and the Wilcoxon-matched-paired test to assess between groups of paired samples. Differences in categorical variables between the two independent groups were evaluated using Fisher’s exact test. A p value <0.05 was considered statistically significant.
3. Results
3.1. Patient Characteristics
The baseline characteristics of the 19 enrolled patients are summarized in Table 1. At the time of CAR-T infusion, 15 patients (78.9%) had relapsed disease, and 4 patients (21.1%) had refractory disease. Patients with B-ALL were substantially younger than those with DLBCL (median age, 13 vs. 59 years, P < 0.001). The median interval between leukapheresis and CAR-T infusion was 34 days (range, 26–61), including 35 days (33–46) for DLBCL and 30.5 days (26–61) for B-ALL. Patients with DLBCL had higher WBC and ANC levels (P = 0.012 and P = 0.009, respectively) and lower lymphocyte counts (P = 0.032) than those with B-ALL. The absolute number of CD3+ cells collected by leukaphresis was significantly higher in patients with DLBCL than in those with B-ALL (P = 0.029). All patients with B-ALL achieved complete remission (CR) at day 30, whereas patients with DLBCL showed heterogeneous responses. Grade ≥2 CRS occurred more frequently in patients with DLBCL than in those with B-ALL (63.6% vs. 37.5%), and ICANS was exclusively observed in patients with DLBCL.

Table 1.
Baseline characteristics, early clinical outcomes, and CAR-T-cell collection characteristics of the study cohort.
Table 1.
Baseline characteristics, early clinical outcomes, and CAR-T-cell collection characteristics of the study cohort.
| Variable | Total cohort | ALL (n=8) | DLBCL (n=11) | P value |
| Baseline characteristics at CAR-T infusion | ||||
| Age | 41.00 (13.00–59.00) | 13.00 (11.50–14.00) | 59.00 (54.50–67.50) | <0.001 |
| Sex (Male) | 13 (68.4%) | 4 (50.0%) | 9 (81.8%) | 0.319 |
| WBC (109/L) | 1.69 (0.60–5.49) | 0.35 (0.08–1.88) | 3.01 (1.55–7.27) | 0.012 |
| RBC (1012/L) | 3.08 (2.86–3.60) | 2.88 (2.70–3.03) | 3.29 (3.00–3.75) | 0.051 |
| Hb (g/dl) | 9.40 (8.40–10.80) | 8.55 (7.78–9.00) | 10.60 (9.55–11.35) | 0.023 |
| Hct (%) | 29.30 (24.80–32.80) | 24.75 (23.52–27.00) | 32.50 (29.30–33.55) | 0.017 |
| Platelet count (109/L) | 111.00 (38.50–150.50) | 91.50 (21.75–153.25) | 111.00 (89.00–143.50) | 0.563 |
| Neutrophil (%) | 92.00 (80.00–95.30) | 85.00 (47.50–93.50) | 93.70 (87.00–95.30) | 0.282 |
| Lymphocytes (%) | 2.00 (0.70–9.35) | 15.00 (3.25–43.50) | 1.70 (0.35–2.50) | 0.032 |
| Monocytes (%) | 2.00 (0.55–5.00) | 0.20 (0.00–4.25) | 2.70 (1.80–5.00) | 0.146 |
| ANC (109/L) | 1.50 (0.58–4.97) | 0.31 (0.04–1.19) | 2.82 (1.35–6.78) | 0.009 |
| ALC (109/L) | 0.05 (0.02–0.07) | 0.03 (0.01–0.04) | 0.06 (0.04–0.07) | 0.105 |
| Early clinical outcomes | ||||
| CRS grade ≥2 | 10 (52.6%) | 3 (37.5%) | 7 (63.6%) | 0.370 |
| ICANS presence | 2 (10.5%) | 0 (0.0%) | 2 (18.2%) | 0.485 |
| D30 response | 13 (68.4%) | 8 (100.0%) | 5 (45.5%) | 0.018 |
| CMR | 4 (21.1%) | 0 (0.0%) | 4 (36.4%) | |
| PMR | 2 (10.5%) | 0 (0.0%) | 2 (18.2%) | |
| PD | 5 (26.3%) | 0 (0.0%) | 5 (45.5%) | |
| CR | 8 (42.1%) | 8 (100.0%) | 0 (0.0%) | |
| CAR-T collection characteristics | ||||
| Apheresis volume (mL) | 270.00 (267.50–277.00) | 270.00 (263.00–274.75) | 271.00 (268.00–277.00) | 0.59 |
| TNC (109) | 23.77 (12.18–34.36) | 9.14 (6.73–51.31) | 26.66 (22.20–34.36) | 0.177 |
| CD3+ (109) | 8.83 (5.22–14.02) | 5.22 (3.52–8.53) | 10.41 (8.76–15.77) | 0.029 |
| CD3+/TNC ratio (%) | 47.96 (30.52–55.84) | 44.77 (18.11–78.58) | 47.96 (41.45–53.03) | 0.904 |
| Apheresis volume (mL) | 270.00 (267.50–277.00) | 270.00 (263.00–274.75) | 271.00 (268.00–277.00) | 0.59 |
* Data is presented as median (IQR) or n (%). Continuous variables were compared using Mann–Whitney U test and categorical variables using Fisher’s exact test. DLBCL response was assessed using the Lugano classification, whereas B-ALL response was assessed according to standard hematologic response criteria. Abbreviations: WBC, white blood cell; RBC, red blood cell; Hb, hemoglobin; Hct, hematocrit; ANC, absolute neutrophil count; ALC, absolute lymphocyte count; CRS, cytokine release syndrome; ICANS, immune effector cell-associated neurotoxicity syndrome; CMR, complete metabolic response; PMR, partial metabolic response; PD, progressive disease; CR, complete remission; TNC, total nucleated cell.
3.2. Expansion Kinetics of Circulating CAR-T-cells Following Infusion
CAR-T expanded rapidly after infusion. In the overall cohort, the median CAR-T proportion increased from 1.62% (0.29–3.52) on day 3 to 10.97% (3.82–15.84) on day 7 and subsequently declined to 1.28% (0.55–5.74) by day 28. Similarly, the absolute CAR-T counts peaked at day 7 at a median value of 165.96 × 10⁶/L (16.11–256.02) (Supplementary Figure S3A). Peak-expansion timing differed between the two disease groups (Figure 1A). Among the patients with DLBCL, 73% (8/11) reached peak expansion on day 7, whereas patients with B-ALL showed greater variability, with peak expansion occurring between days 3 and 28. Delayed peak expansion beyond day 14 was observed exclusively in the B-ALL cohort (Figure 1A-C). Interestingly, the relative CAR-T proportion decreased to near day 3 levels by day 28, whereas the absolute CAR-T counts remained higher than those observed at day 3, indicating distinct longitudinal patterns for relative and absolute CAR-T measurements (Supplementary Figure S3B).
3.3. Immunophenotypic Comparison Between CAR-T and Endogenous T-cells at Peak Expansion
At peak expansion, CAR-T and endogenous T-cells exhibited comparable differentiation profiles. TCM cells were the predominant subset in both compartments, (53.05% vs. 48.99%, P = 0.726), followed by TN (9.66% vs. 12.89%, P = 0.381), TEM (6.74% vs. 8.85%, P = 0.255), and TE cells (2.35% vs. 7.23%, P = 0.050) (Figure 2). Composite differentiation indices, including memory fraction, effector fraction, and early differentiation index, did not significantly differ between the two compartments (all P > 0.05). Despite these overall similarities, CAR-T-cells exhibited a significantly higher CD4/CD8 ratio than endogenous T-cells (median, 1.44 vs. 0.34, P = 0.003), indicating preferential enrichment of CD4+ cells within the CAR-T compartment (Figure 3A). In lineage-specific analyses, CD4+ CAR-T-cells contained fewer TN cells than endogenous CD4+ T-cells (median, 3.6% vs. 4.4%, P = 0.022), whereas CD8+ CAR-T-cells were enriched for TCM cells and depleted of TEM cells compared with endogenous CD8+ T-cells (51.5% vs. 42.1% P = 0.018 and 2.8% vs. 7.9% P = 0.005, respectively; Figure 3B–C). Expression of HLA-DR, PD-1 and TIGIT was further compared using MFI. HLA-DR and PD-1 expression were significantly higher in CAR-T-cells than in endogenous T-cells in the total CD3+ compartment (median MFI 72,646 vs. 39,228 and 43,432 vs. 25,358, respectively; both P < 0.001), with consistent differences in the CD4+ and CD8+ subsets. TIGIT expression levels did not significantly differ between the two populations in any subset (all P > 0.14) (Figure 3D–F).
3.4. Changes in CAR-T-Cell Differentiation After Peak Expansion
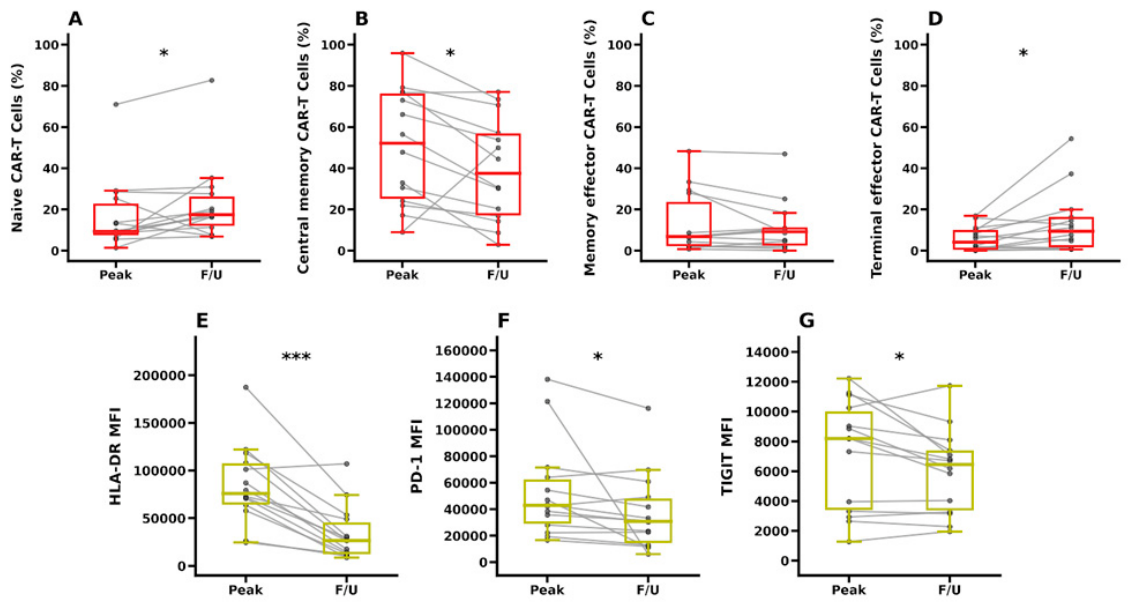
Paired analyses of peak and follow-up samples from 14 patients demonstrated phenotypic changes of CAR-T cells following peak expansion (Figure 4A–D). The TCM cell proportion significantly declined from 52.2% (25.8–75.8) at peak expansion to 37.6% (17.7–56.4) at follow-up (P = 0.0166), whereas TE cell proportion increased from 4.2% (0.9–9.6) to 9.4% (2.2–15.9) (P = 0.0203). TN cell proportion also modestly increased (9.3% vs. 17.5%, P = 0.0419), whereas TEM cell proportions remained unchanged (P = 0.715). Consistent with these phenotypic changes, HLA-DR, PD-1, and TIGIT expression significantly declined during follow-up (P = 0.0002, P = 0.0107, and P = 0.0353, respectively, Figure 4E–G)
3.5. Exploratory Analysis of T-Cell Phenotypes According to Response and Toxicity
Because all B-ALL patients achieved CR at D30, response-associated analyses were restricted to the DLBCL cohort. Given the limited size of the cohort, toxicity analyses were performed in the pooled cohort including both DLBCL and B-ALL patients. Among patients with DLBCL, responders showed trends toward higher endogenous CD4+ T-cell proportions (31.3% vs. 17.4%, P = 0.082), increased CD4/CD8 ratios (0.51 vs. 0.24, P = 0.082), and higher CD8+ TEM cell frequencies (9.0% vs. 2.7%, P = 0.082). Patients with CRS showed higher CAR-T CD4 TE-cell fractions (4.35% vs. 0%, P = 0.081) and increased TIGIT expression on CAR-T-cells (41,450 vs. 8,854, P = 0.094) than those without CRS; however, these differences did not reach statistical significance. In the exploratory ICANS analysis, the two patients with ICANS had higher absolute CAR-T counts than those without ICANS (805 vs. 196, P = 0.012). In contrast, lower TIGIT expressions were observed in endogenous CD8+ T-cells among patients with ICANS (2,685 vs. 9,780, P = 0.023). Detailed data is shown in Table S2
Figure 1.
Kinetic profiles and peak expansion day of CAR-T-cells by diagnosis groups. (A) Distribution of the peak expansion day for DLBCL (n=11) and B-ALL (n=8) patient cohorts. (B) Longitudinal kinetics of relative CAR-T-cell percentages among total T-cells and (C) absolute CAR-T levels over 28 days post-infusion. light gray lines represent individual patients, and thick solid lines with circles represent the median values. The number of samples available at each time point is indicated below the x-axis.
Figure 1.
Kinetic profiles and peak expansion day of CAR-T-cells by diagnosis groups. (A) Distribution of the peak expansion day for DLBCL (n=11) and B-ALL (n=8) patient cohorts. (B) Longitudinal kinetics of relative CAR-T-cell percentages among total T-cells and (C) absolute CAR-T levels over 28 days post-infusion. light gray lines represent individual patients, and thick solid lines with circles represent the median values. The number of samples available at each time point is indicated below the x-axis.
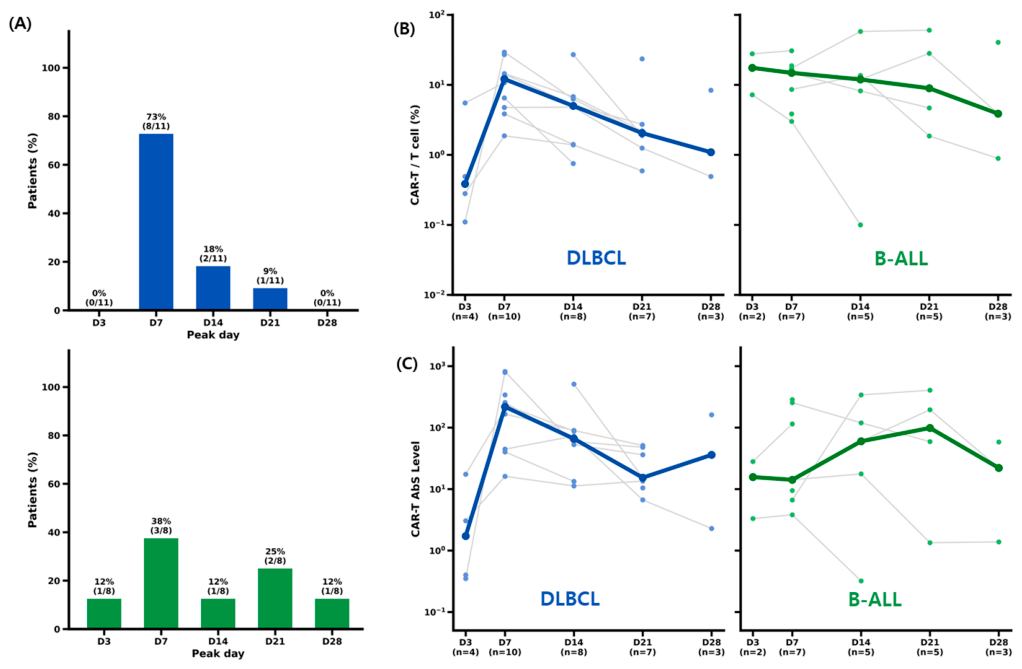
Figure 2.
Immunophenotypic comparison between CAR-T-cells and endogenous T-cells at peak expansion. Comparison of T-cell differentiation subsets between CAR-T-cells and endogenous T-cells at the individual peak expansion time point Horizontal bars indicate the median and interquartile range.
Figure 2.
Immunophenotypic comparison between CAR-T-cells and endogenous T-cells at peak expansion. Comparison of T-cell differentiation subsets between CAR-T-cells and endogenous T-cells at the individual peak expansion time point Horizontal bars indicate the median and interquartile range.
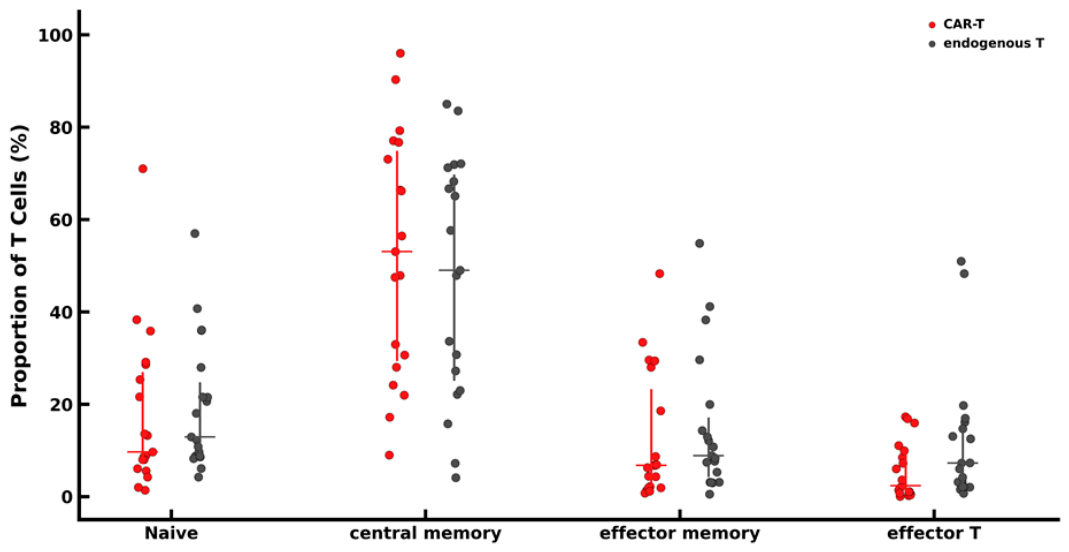
Figure 3.
Phenotypic characteristics of CAR-T-cells and endogenous T-cells at peak expansion. (A) CD4/CD8 ratio. (B) CD4 T-cell differentiation subsets. (C) CD8 T-cell differentiation subsets. (D–F) Median fluorescence intensity (MFI) of HLA-DR (D), PD-1 (E), and TIGIT (F) on total, CD4+, and CD8+ T-cells. Horizontal bars indicate the median and interquartile range. Statistical comparisons were performed using the Wilcoxon signed-rank test. *P < 0.05, **P < 0.01, ***P < 0.001.
Figure 3.
Phenotypic characteristics of CAR-T-cells and endogenous T-cells at peak expansion. (A) CD4/CD8 ratio. (B) CD4 T-cell differentiation subsets. (C) CD8 T-cell differentiation subsets. (D–F) Median fluorescence intensity (MFI) of HLA-DR (D), PD-1 (E), and TIGIT (F) on total, CD4+, and CD8+ T-cells. Horizontal bars indicate the median and interquartile range. Statistical comparisons were performed using the Wilcoxon signed-rank test. *P < 0.05, **P < 0.01, ***P < 0.001.
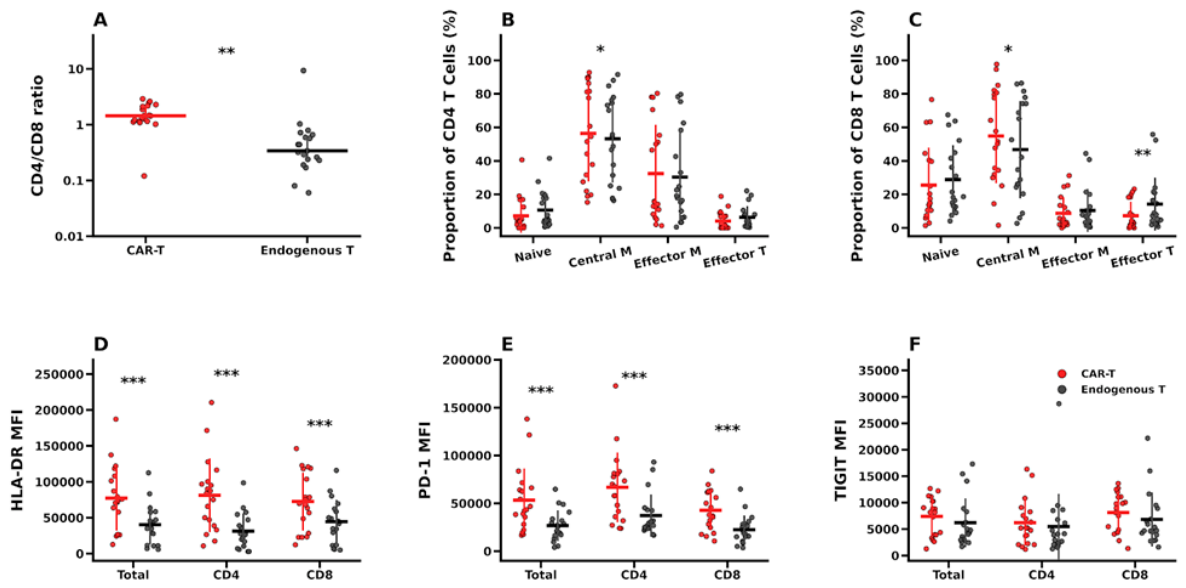
Figure 4.
Longitudinal phenotypic remodeling of CAR-T-cells following peak expansion. Paired comparison of CAR-T-cells at peak expansion (Peak) and the latest available follow-up sample (F/U) (n = 14). (A–D) Frequencies of TN, TCM, TEM, and TE subsets. (E–G) Median fluorescence intensity (MFI) of HLA-DR, PD-1, and TIGIT. Each line represents an individual patient. Box plots indicate the median and interquartile range, with whiskers representing the minimum and maximum values. Statistical comparisons were performed using the Wilcoxon signed-rank test. *P < 0.05, **P < 0.01, ***P < 0.001.
Figure 4.
Longitudinal phenotypic remodeling of CAR-T-cells following peak expansion. Paired comparison of CAR-T-cells at peak expansion (Peak) and the latest available follow-up sample (F/U) (n = 14). (A–D) Frequencies of TN, TCM, TEM, and TE subsets. (E–G) Median fluorescence intensity (MFI) of HLA-DR, PD-1, and TIGIT. Each line represents an individual patient. Box plots indicate the median and interquartile range, with whiskers representing the minimum and maximum values. Statistical comparisons were performed using the Wilcoxon signed-rank test. *P < 0.05, **P < 0.01, ***P < 0.001.
4. Discussion
The present study provides a comprehensive longitudinal characterization of immune remodeling following tisagenlecleucel therapy using multiparameter flow cytometry. By simultaneously monitoring CAR-T-cells and endogenous T-cells, we demonstrated dynamic immunophenotypic changes associated with CAR-T expansion, contraction, and clinical outcomes. These findings support the utility of integrated flow cytometric immune monitoring for characterizing post-infusion immune remodeling beyond simple CAR-T-cell enumeration.
Most patients exhibited expansion kinetics similar to those reported previously [9,11,18], with CAR-T-cells reaching peak expansion predominantly around day 7 after infusion. Delayed peak expansion was observed in several patients with B-ALL, suggesting greater heterogeneity in CAR-T kinetics than in patients with DLBCL. This difference may reflect disease-specific differences in antigen burden and the immune microenvironment, which influence the timing of in vivo CAR-T activation and proliferation.
At peak CAR-T expansion, TCM cells represented the predominant differentiation subset in our cohort, in contrast to previous reports describing enrichment of TEM cells or differentiated effector-like phenotypes [5,11,19]. This discrepancy may be attributable to the differences in CAR constructs, disease settings, phenotypic definitions, analytical platforms, and sampling time points.
HLA-DR and PD-1 expression was higher in CAR-T cells than in endogenous T cells at peak expansion, suggesting greater activation-associated phenotypic changes within the CAR-T compartment. Longitudinally, TCM levels declined after peak expansion, accompanied by an increase in TE cells and declining HLA-DR and PD-1 expression levels. Together, these findings suggest dynamic phenotypic evolution of CAR-T cells from a TCM-predominant, activation-associated state at peak expansion toward a more differentiated phenotype during the post-peak phase [7,20], although their functional implications remain uncertain.
An additional finding of this study was the broadly similar differentiation profile observed between CAR-T-cells and endogenous T-cells at peak expansion. Although the activation phenotype remained substantially more pronounced in the CAR-T compartment, our findings suggest that immune remodeling following CAR-T infusion is not only confined to the engineered T-cells but also involves coordinated phenotypic changes within endogenous T-cell populations [5]. This observation is consistent with recent single-cell studies demonstrating dynamic interactions between CAR-T-cells and the host immune compartment during immune reconstitution [14,15].
Although exploratory in nature, our analyses identified several immunophenotypic features associated with treatment-related Patients who developed ICANS demonstrated higher absolute CAR-T-cell counts, consistent with previous reports linking greater in vivo CAR-T expansion with an increased risk of neurotoxicity [21,22,23]. Lower TIGIT expression was also observed on endogenous CD8+ T cells in patients with ICANS. However, given the limited number of ICANS cases, the clinical significance of this finding remains uncertain. Together, our observations highlight the potential value of simultaneously monitoring both engineered CAR-T-cells and endogenous immune populations following infusion.
This study has several limitations. First, it was conducted at a single center and included only patients treated with tisagenlecleucel, which may limit the generalizability of the findings. Second, analyses of treatment response and treatment-related toxicities were exploratory because of the limited sample size and should be validated in larger independent cohorts. Finally, although multiparameter flow cytometry enabled detailed longitudinal immunophenotypic characterization, it could not directly assess the transcriptional or functional states of CAR-T-cells and endogenous T-cells. Thus, changes in markers such as PD-1, HLA-DR, and TIGIT should be interpreted as phenotypic observations rather than direct evidence of functional activation or exhaustion.
Nevertheless, this study provides one of the first comprehensive longitudinal flow cytometric analyses to simultaneously evaluate both CAR-T and endogenous T-cell compartments in real-world Korean cohort receiving commercial tisagenlecleucel therapy.
5. Conclusions
Our findings demonstrate that multiparameter flow cytometry can capture dynamic immune remodeling beyond simple CAR-T enumeration and support its potential role as a practical platform for longitudinal immune monitoring following CAR-T therapy.
Supplementary Materials
The following supporting information can be downloaded at the website of this paper posted on Preprints.org.
Author Contributions
J-ML conceived and designed the study and oversaw all aspects of its execution. SJ performed the flow cytometric immunophenotypic interpretation, statistical data analyses and drafted the manuscript. TWK and HB collected the samples, performed the experiments, and curated the data. THK, JJ, YK, MK, JY, and MGJ contributed to sample collection and provided scientific advice. DWJ contributed to the study design and sample collection. All authors reviewed, critically revised, and approved the final manuscript.
Funding
This work was supported by grants from the Basic Science Research Program through the National Research Foundation of Korea (NRF), funded by the Ministry of Education (RS-2023-00244625 and RS-2025-25412045 to J.-M.L.).
Institutional Review Board Statement
This study was conducted in accordance with the Declaration of Helsinki and was approved by the Institutional Review Board of Seoul St. Mary’s Hospital (KC25TISI0508).
Informed Consent Statement
Informed consent was obtained from all subjects involved in the study.
Data Availability Statement
Flow cytometry data and the raw FSC files are available on reasonable request from the corresponding author (J.M.L.). .
Acknowledgments
We thank the technical staff of the Department of Laboratory Medicine at Seoul St. Mary’s Hospital for their assistance with sample processing and data acquisition.
Conflicts of Interest
The authors declare no conflicts of interest.
Abbreviations
The following abbreviations are used in this manuscript:
| CAR | Chimeric Antigen Receptor |
| B-ALL | B-cell Precursor Acute Lymphoblastic Leukemia |
| DLBCL | Diffuse Large B-cell Lymphoma |
| TLA | Three letter acronym |
| CRS | Cytokine Release Syndrome |
| ICANS | Immune Effector Cell-associated Neurotoxicity Syndrome |
| CTIWP | Cellular Therapy and Immunobiology Working Party |
| EBMT | European Society for Blood and Marrow Transplantation |
| PBS | Phosphate-Buffered Saline |
| FSC-H | Forward Scatter Height |
| FSC-A | Forward Scatter Area |
| SSC-A | Side Scatter Area |
| TN | Naïve T-cells |
| TCM | Central Memory T-cells |
| TEM | Effector Memory T-cells |
| TE | Effector T-cells |
| MFI | Median Fluorescence Intensity |
| CR | Complete Remission |
| CMR | Complete Metabolic Response |
| PMR | Partial Metabolic Response |
| PD | Progressive Disease |
References
- Maude, S.L.; Laetsch, T.W.; Buechner, J.; Rives, S.; Boyer, M.; Bittencourt, H.; Bader, P.; Verneris, M.R.; Stefanski, H.E.; Myers, G.D.; et al. Tisagenlecleucel in Children and Young Adults with B-Cell Lymphoblastic Leukemia. N. Engl. J. Med. 2018, 378, 439–448. [Google Scholar] [CrossRef] [PubMed]
- Schuster, S.J.; Bishop, M.R.; Tam, C.S.; Waller, E.K.; Borchmann, P.; McGuirk, J.P.; Jäger, U.; Jaglowski, S.; Andreadis, C.; Westin, J.R.; et al. Tisagenlecleucel in Adult Relapsed or Refractory Diffuse Large B-Cell Lymphoma. N. Engl. J. Med. 2019, 380, 45–56. [Google Scholar] [CrossRef] [PubMed]
- Morris, E.C.; Neelapu, S.S.; Giavridis, T.; Sadelain, M. Cytokine release syndrome and associated neurotoxicity in cancer immunotherapy. Nat. Rev. Immunol. 2022, 22, 85–96. [Google Scholar] [CrossRef] [PubMed]
- Neelapu, S.S.; Tummala, S.; Kebriaei, P.; Wierda, W.; Gutierrez, C.; Locke, F.L.; Komanduri, K.V.; Lin, Y.; Jain, N.; Daver, N.; et al. Chimeric antigen receptor T-cell therapy—assessment and management of toxicities. Nat. Rev. Clin. Oncol. 2018, 15, 47–62. [Google Scholar] [CrossRef] [PubMed]
- García-Calderón, C.B.; Sierro-Martínez, B.; García-Guerrero, E.; Sanoja-Flores, L.; Muñoz-García, R.; Ruiz-Maldonado, V.; Jimenez-Leon, M.R.; Delgado-Serrano, J.; Molinos-Quintana, Á.; Guijarro-Albaladejo, B.; et al. Monitoring of kinetics and exhaustion markers of circulating CAR-T cells as early predictive factors in patients with B-cell malignancies. Front. Immunol. 2023, 14, 1152498. [Google Scholar] [CrossRef] [PubMed]
- Hay, K.A.; Hanafi, L.-A.; Li, D.; Gust, J.; Liles, W.C.; Wurfel, M.M.; López, J.A.; Chen, J.; Chung, D.; Harju-Baker, S.; et al. Kinetics and biomarkers of severe cytokine release syndrome after CD19 chimeric antigen receptor–modified T-cell therapy. Blood 2017, 130, 2295–2306. [Google Scholar] [CrossRef] [PubMed]
- Korell, F.; Berger, T.R.; Maus, M.V. Understanding CAR T cell-tumor interactions: Paving the way for successful clinical outcomes. Med 2022, 3, 538–564. [Google Scholar] [CrossRef] [PubMed]
- Majzner, R.G.; Mackall, C.L. Clinical lessons learned from the first leg of the CAR T cell journey. Nat. Med. 2019, 25, 1341–1355. [Google Scholar] [CrossRef] [PubMed]
- Mueller, K.T.; Maude, S.L.; Porter, D.L.; Frey, N.; Wood, P.; Han, X.; Waldron, E.; Chakraborty, A.; Awasthi, R.; Levine, B.L.; et al. Cellular kinetics of CTL019 in relapsed/refractory B-cell acute lymphoblastic leukemia and chronic lymphocytic leukemia. Blood 2017, 130, 2317–2325. [Google Scholar] [CrossRef] [PubMed]
- Demaret, J.; Varlet, P.; Trauet, J.; Beauvais, D.; Grossemy, A.; Hégo, F.; Yakoub-Agha, I.; Labalette, M. Monitoring CAR T-cells using flow cytometry. Cytom. B Clin. Cytom. 2021, 100, 218–224. [Google Scholar] [CrossRef] [PubMed]
- Peinelt, A.; Bremm, M.; Kreyenberg, H.; Cappel, C.; Banisharif-Dehkordi, J.; Erben, S.; Rettinger, E.; Jarisch, A.; Meisel, R.; Schlegel, P.-G.; et al. Monitoring of Circulating CAR T Cells: Validation of a Flow Cytometric Assay, Cellular Kinetics, and Phenotype Analysis Following Tisagenlecleucel. Front. Immunol. 2022, 13, 830773. [Google Scholar] [CrossRef] [PubMed]
- Sarikonda, G.; Pahuja, A.; Kalfoglou, C.; Burns, K.; Nguyen, K.; Ch’en, I.L.; Pollner, R.; Tangri, S.; Dakappagari, N. Monitoring CAR-T cell kinetics in clinical trials by multiparametric flow cytometry: Benefits and challenges. Cytom. B Clin. Cytom. 2021, 100, 72–78. [Google Scholar] [CrossRef] [PubMed]
- Passweg, J.R.; Baldomero, H.; Ciceri, F.; de la Cámara, R.; Glass, B.; Greco, R.; Hazenberg, M.D.; Kalwak, K.; McLornan, D.P.; Neven, B.; et al. Hematopoietic cell transplantation and cellular therapies in Europe 2022. CAR-T activity continues to grow; transplant activity has slowed: a report from the EBMT. Bone Marrow Transplant. 2024, 59, 803–812. [Google Scholar] [CrossRef] [PubMed]
- Frede, J.; Poller, J.C.; Shi, K.; Stuart, H.; Sotudeh, N.; Havig, C.; Lim, K.; Wiggers, C.R.M.; Cho, E.Y.; Vijaykumar, T.; et al. The endogenous T cell landscape is reshaped by CAR-T cell therapy and predicts treatment response in multiple myeloma. Leukemia 2025, 39, 3004–3014. [Google Scholar] [CrossRef] [PubMed]
- Guerrero-Murillo, M.; Rill-Hinarejos, A.; Trincado, J.L.; Bataller, A.; Ortiz-Maldonado, V.; Benítez-Ribas, D.; Español-Rego, M.; González-Navarro, E.A.; Martínez-Cibrián, N.; Marchese, D.; et al. Integrative single-cell multi-omics of CD19-CARᵖᵒˢ and CARⁿᵉᵍ T cells suggest drivers of immunotherapy response in B cell neoplasias. Cell Rep. Med. 2025, 6, 102026. [Google Scholar] [CrossRef] [PubMed]
- Larson, R.C.; Maus, M.V. Recent advances and discoveries in the mechanisms and functions of CAR T cells. Nat. Rev. Cancer 2021, 21, 145–161. [Google Scholar] [CrossRef] [PubMed]
- Blache, U.; Weiss, R.; Boldt, A.; Kapinsky, M.; Blaudszun, A.-R.; Quaiser, A.; Pohl, A.; Miloud, T.; Burgaud, M.; Vucinic, V.; et al. Advanced Flow Cytometry Assays for Immune Monitoring of CAR-T Cell Applications. Front. Immunol. 2021, 12, 658314. [Google Scholar] [CrossRef] [PubMed]
- Qi, T.; McGrath, K.; Ranganathan, R.; Dotti, G.; Cao, Y. Cellular kinetics: A clinical and computational review of CAR-T cell pharmacology. Adv. Drug Deliv. Rev. 2022, 188, 114421. [Google Scholar] [CrossRef] [PubMed]
- Sheih, A.; Voillet, V.; Hanafi, L.-A.; DeBerg, H.A.; Yajima, M.; Hawkins, R.; Gersuk, V.; Riddell, S.R.; Maloney, D.G.; Wohlfahrt, M.E.; et al. Clonal kinetics and single-cell transcriptional profiling of CAR-T cells in patients undergoing CD19 CAR-T immunotherapy. Nat. Commun. 2020, 11, 219. [Google Scholar] [CrossRef] [PubMed]
- Gattinoni, L.; Speiser, D.E.; Lichterfeld, M.; Bonini, C. T memory stem cells in health and disease. Nat. Med. 2017, 23, 18–27. [Google Scholar] [CrossRef] [PubMed]
- Santomasso, B.D.; Park, J.H.; Salloum, D.; Riviere, I.; Flynn, J.; Mead, E.; Halton, E.; Wang, X.; Senechal, B.; Purdon, T.; et al. Clinical and Biological Correlates of Neurotoxicity Associated with CAR T-cell Therapy in Patients with B-cell Acute Lymphoblastic Leukemia. Cancer Discov. 2018, 8, 958–971. [Google Scholar] [CrossRef] [PubMed]
- Aziz, F.; Chakraborty, A.; Saha, D.; Dutta, P. Immune effector cell-associated neurotoxicity syndrome: integrative mechanisms, predictive biomarkers, and translational pathways for prevention in CAR T-cell therapy. Front. Neurol. 2026, 17, 1739021. [Google Scholar] [CrossRef] [PubMed]
- Gust, J.; Hay, K.A.; Hanafi, L.-A.; Li, D.; Myerson, D.; Gonzalez-Cuyar, L.F.; Yeung, C.; Liles, W.C.; Wurfel, M.; Lopez, J.A.; et al. Endothelial Activation and Blood–Brain Barrier Disruption in Neurotoxicity after Adoptive Immunotherapy with CD19 CAR-T Cells. Cancer Discov. 2017, 7, 1404–1419. [Google Scholar] [CrossRef] [PubMed]
Disclaimer/Publisher’s Note: The statements, opinions and data contained in all publications are solely those of the individual author(s) and contributor(s) and not of MDPI and/or the editor(s). MDPI and/or the editor(s) disclaim responsibility for any injury to people or property resulting from any ideas, methods, instructions or products referred to in the content. |
© 2026 by the authors. Licensee MDPI, Basel, Switzerland. This article is an open access article distributed under the terms and conditions of the Creative Commons Attribution (CC BY) license (http://creativecommons.org/licenses/by/4.0/).
Copyright: This open access article is published under a Creative Commons CC BY 4.0 license, which permit the free download, distribution, and reuse, provided that the author and preprint are cited in any reuse.