

Submitted:
30 September 2026
Posted:
08 October 2026
You are already at the latest version
Abstract
Comparing central tendency across groups in complex survey data is challenging when outcome variables are skewed or contain outliers. While Mood’s median test provides a robust nonparametric solution under simple random sampling, it is not directly applicable to data arising from complex survey designs. This article proposes a design-based extension that integrates weighted median estimation with Rao–Scott adjusted tests of independence.The method replaces sample counts with estimated population totals derived from survey weights and uses design-consistent variance estimation to account for clustering, stratification, and unequal probabilities of selection. A Rao–Scott correction is then applied to obtain valid inference. The approach is demonstrated using data from a WHO STEPS survey, highlighting its practical utility in epidemiological applications.
Keywords:
complex survey data
; Mood’s median test
; Rao–Scott adjustment
; weighted median
; WHO STEPS survey
1. Introduction
Large-scale epidemiological surveys, such as the World Health Organization (WHO) STEPwise approach to surveillance (STEPS), frequently collect continuous biomarker data, including fasting blood glucose and blood pressure. These variables are often characterized by heavy tails, skewness, and the presence of outliers, violating the normality assumptions required for traditional parametric tests. In such contexts, comparing the central tendency across groups (e.g., urban vs. rural) necessitates robust nonparametric approaches.
Mood’s Median Test is a classical alternative under simple random sampling [1]. However, its direct application to complex survey data is invalid, as it ignores sampling weights, clustering, and stratification. These features affect both point estimation and variance, leading to biased inference and inflated Type I error rates. To remedy this problem, we propose a design-based median comparison procedure that combines weighted quantile estimation with Rao–Scott adjustments for contingency tables. The resulting method is not a literal extension of the hypergeometric Mood’s test, but rather a design-based test of independence based on dichotomization around an estimated population median.
1.1. Motivating Example - WHO STEPS Surveys
The WHO STEPS is widely used to generate nationally representative data on non-communicable disease (NCD) risk factors in adult populations. STEPS surveys are typically designed as population-based cross-sectional studies employing stratified multistage probability sampling to ensure representativeness across demographic and geographic subgroups. The standardized STEPS methodology consists of three sequential components. Step 1 involves the collection of socio-demographic and behavioural information through interviewer-administered questionnaires, including tobacco use, alcohol consumption, diet, physical activity, and self-reported history of chronic conditions. Step 2 comprises physical measurements such as height, weight, waist circumference, and blood pressure, obtained using calibrated instruments and standardized protocols. Step 3 includes biochemical assessments based on blood samples, commonly measuring indicators such as fasting blood glucose and total cholesterol [2].
A key feature of STEPS surveys is the collection of continuous health measurements, including blood pressure, blood glucose, cholesterol, and anthropometric indicators. These variables are frequently characterized by skewed distributions, heavy tails, and the presence of outliers, reflecting the underlying heterogeneity in population health. Such distributional features challenge the assumptions of classical parametric methods, particularly when comparing groups. In many applications, interest lies in simple comparisons of central tendency—for example, differences in blood pressure between males and females or blood glucose levels between rural and urban populations. The median provides a natural and robust summary measure under these conditions. This motivates the use of non-parametric methods such as Mood’s median test. However, the standard formulation of the test assumes simple random sampling and does not account for the complex survey design features—such as clustering, stratification, and unequal weighting—that characterize STEPS data, thereby necessitating appropriate design-based extensions.
2. Methods
2.1. Mood’s Median Test
Under simple random sampling, let be the ith observation in group g, where and . Let Define the global sample median and construct a table and
Under , the counts follow a multiple hypergeometric distribution, and the Pearson statistic is
where and Here, is the overall sample median and is the indicator function. denotes the expected frequency under the null hypothesis of independence, given by
and is the total sample size.
2.2. Mood’s Median Test for Complex Surveys
We extend this framework to complex surveys by replacing counts with estimated population totals and using design-based variance estimation. Let denote the sampling weight for individual i in PSU k. The design-consistent estimator of the population median satisfies
Because is estimated from the data, subsequent statistics must account for its sampling variability. In particular, the indicator functions are non-smooth functionals, and their variance is obtained using Taylor linearization based on the influence function of the weighted median, or alternatively via replicate-weight methods (e.g., jackknife).
Define estimated population totals as and Let and and are defined similarly. The design-based Pearson statistic is
This formulation uses estimated population totals rather than sample counts, ensuring design consistency.
2.3. Variance Estimation and Rao–Scott Adjustment
Under complex sampling, does not follow a distribution. Instead, it follows a where are eigenvalues derived from the design-based covariance matrix of . This covariance matrix must incorporate
- clustering and stratification,
- unequal weights,
- variability induced by estimating .
It is obtained using Taylor linearization applied jointly to the weighted proportions and the median-defining indicators, or via replicate-weight variance estimation.
The first-order Rao–Scott correction is given by
where is the mean eigenvalue (average design effect).
2.4. Second-Order Rao–Scott (Satterthwaite) Adjustment
Let
Define
The effective degrees of freedom is given by
The Satterthwaite-adjusted statistic is
We compare to an F distribution with numerator degrees of freedom and denominator degrees of freedom, where f is the number of PSUs and L is the number of strata.
2.5. Practical Implementation
The proposed method can be implemented through a sequence of straightforward steps that mirror standard practice in design-based survey analysis.
First, the population median is estimated using the survey weights. This step ensures that the threshold used to divide the data reflects the target population rather than the sample alone. Because the data arise from a complex sampling design, this median should be computed using a design-consistent estimator. Next, each observation is classified relative to the estimated median. Specifically, individuals are grouped according to whether their outcome value falls above or below (or equal to) the estimated population median. This creates a binary variable that captures the relative position of each observation within the overall distribution.
The data are then cross-classified by this median-based indicator and the grouping variable of interest (e.g., sex, residence, or exposure status). A design-based Pearson-type statistic is subsequently computed to assess the association between group membership and median classification. Because the data arise from a complex survey, this statistic does not follow the usual chi-square distribution. Therefore, a Rao–Scott adjustment is applied to correct both the scale of the statistic and its reference distribution, accounting for clustering, stratification, and unequal weights.
2.6. Software Implementation
All steps of the proposed procedure can be implemented in the survey package in R. The weighted median, contingency table, and Rao–Scott adjusted test are supported by standard functions.
3. Results
We used data from the 2024 WHO STEPS survey on non-communicable disease risk factors conducted in Trinidad and Tobago to show the application of this proposes approach. The survey was carried out between May and August 2024 as a nationally representative, population-based cross-sectional study of adults aged 18–69 years. A stratified multistage probability sampling design was employed to ensure representativeness of the target population across the country.
The STEPS survey followed the standardized three-step framework. Step 1 consisted of interviewer-administered questionnaires used to collect information on socio-demographic characteristics and behavioural risk factors, including tobacco use, alcohol consumption, diet, physical activity, and prior diagnoses of hypertension and diabetes. Step 2 involved physical measurements, including height, weight, waist circumference, and blood pressure, obtained using standardized procedures and calibrated instruments, with multiple blood pressure readings recorded per participant. Step 3 comprised biochemical assessments based on fasting venous blood samples, including measurements of blood glucose and total cholesterol.
A total of 4,052 adults participated in the survey, corresponding to an overall response rate of 75.0%. For the present analysis, we focused on comparing blood glucose levels between males and females. The analytical sample was restricted to participants with observed blood glucose measurements. Observations with missing blood glucose values were excluded. The final sample () therefore consisted of individuals with complete data required for the analysis.
Figure 1 shows the weighted median between males and females. The figure shows that the weighted medians for males and females are very similar, indicating little difference in the central tendency of the outcome between the two groups. The interquartile ranges (IQRs) also largely overlap, suggesting comparable variability. Overall, the visual evidence points to minimal differences in the distribution of the outcome by sex at the population level.
The weighted contingency table (Table 1) shows a near balance between males and females above and below the estimated population median. The estimated total above the median is slightly higher for males than females, while the reverse is observed for those below or equal to the median. However, these differences are relatively small in magnitude, suggesting no substantial shift in the distribution of the outcome variable by sex at the population level.
The Rao–Scott adjusted test indicates no statistically significant association between sex and the median-based classification of the outcome variable (, , ). This suggests that the distribution of observations above and below the estimated population median does not differ meaningfully between males and females. The result is consistent with the descriptive findings from the weighted medians and contingency table, both of which indicated minimal differences between the two groups.
4. Discussion
The proposed design-based extension of Mood’s median test provides a simple and robust approach for comparing medians across groups in complex survey data. By combining weighted median estimation with Rao–Scott adjusted tests of independence, the method accommodates unequal sampling weights, clustering, and stratification while retaining the intuitive interpretation of the classical Mood’s median test. Unlike standard applications of the test, which assume simple random sampling, the proposed approach produces inference that is appropriate for complex survey designs [3,4].
Application of the method to the 2024 Trinidad and Tobago WHO STEPS survey demonstrated its practical utility. The weighted medians of blood glucose were similar for males and females, and the weighted contingency table showed only minor differences in the proportions of individuals classified above and below the estimated population median. Consistent with these descriptive findings, the Rao–Scott adjusted test indicated no statistically significant association between sex and median-based classification (, ). These results suggest that blood glucose levels were comparable between males and females at the population level.
The proposed procedure is particularly useful when survey outcomes are skewed, heavy-tailed, or contain influential outliers, situations in which mean-based comparisons may be difficult to interpret. Because the method relies on median classification, it provides a robust alternative that is easily implemented using standard survey-analysis software. The approach may therefore be useful in epidemiological surveys, health examination studies, and other population-based investigations where design-based inference is required.
5. Conclusions
This article proposed a design-based extension of Mood’s median test for use with complex survey data. The method replaces sample counts with weighted population totals, incorporates survey design features through design-based estimation, and applies Rao–Scott adjustments to obtain valid statistical inference. Application to WHO STEPS survey data demonstrated that the procedure is straightforward to implement and provides an intuitive approach for comparing medians across groups when outcome variables are skewed or contain outliers. The proposed method offers a practical nonparametric alternative for epidemiological and public health surveys where conventional median tests are not appropriate because of complex sampling designs.
Author Contributions
SV: Writing – review & editing, Conceptualization, Writing – original draft.
Funding
This research received no specific grant from any funding agency in the public, commercial, or not-for-profit sectors.
Data Availability Statement
The data that support the findings of this study are available from the World Health Organization STEPwise approach to noncommunicable disease risk factor surveillance (WHO STEPS) survey conducted in Trinidad and Tobago in 2024. Access to the data is subject to approval by the relevant national authorities and the World Health Organization and may be obtained upon reasonable request through the appropriate data request procedures.
Acknowledgments
The author acknowledges the Ministry of Health of Trinidad and Tobago and the World Health Organization (WHO) for conducting and supporting the 2024 Trinidad and Tobago WHO STEPwise Approach to Noncommunicable Disease Risk Factor Surveillance (STEPS) survey. The author is also grateful to the WHO NCD Microdata Repository for providing access to the anonymized dataset used in this study.
Conflicts of Interest
The authors declare that the research was conducted in the absence of any commercial or financial relationships that could be construed as a potential conflict of interest.
References
- Brown, G.W.; Mood, A.M. On median tests for linear hypotheses. In Proceedings of the Proceedings of the Second Berkeley Symposium on Mathematical Statistics and Probability; University of California Press, 1951; Vol. 2, pp. 159–167. [Google Scholar]
- Organization, W.H.; et al. WHO STEPS surveillance manual: the WHO STEPwise approach to chronic disease risk factor surveillance/Noncommunicable Diseases and Mental Health, World Health Organization. In WHO STEPS surveillance manual: the WHO STEPwise approach to chronic disease risk factor surveillance/Noncommunicable Diseases and Mental Health; World Health Organization, 2005. [Google Scholar]
- Rao, J.N.; Scott, A.J. On chi-squared tests for multiway contingency tables with cell proportions estimated from survey data. Ann. Stat. 1984, 46–60. [Google Scholar] [CrossRef]
- Rao, J.; Scott, A. On simple adjustments to chi-square tests with sample survey data. Ann. Stat. 1987, 385–397. [Google Scholar] [CrossRef]
Figure 1.
Weighted medians and interquartile ranges (IQRs) of the outcome variable by sex (male vs female).
Figure 1.
Weighted medians and interquartile ranges (IQRs) of the outcome variable by sex (male vs female).
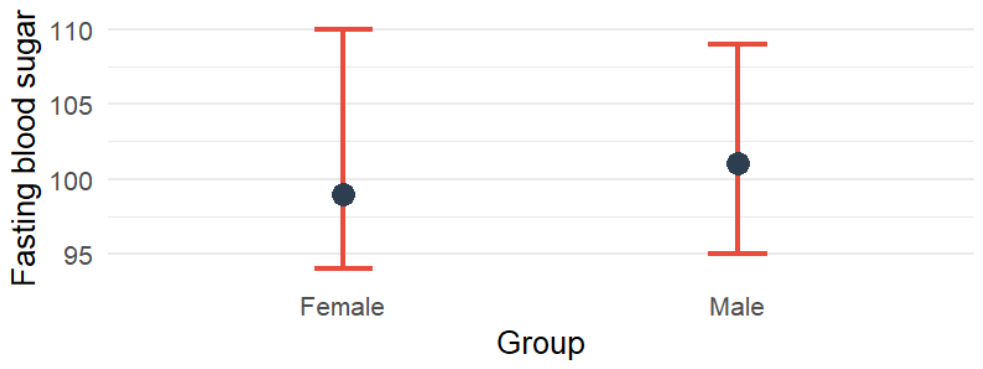

Table 1.
Weighted population totals classified by sex and whether observations fall above or below the estimated population median.
Table 1.
Weighted population totals classified by sex and whether observations fall above or below the estimated population median.
| Female | Male | |
|---|---|---|
| Above Median | 68 882.32 | 80 044.62 |
| Below/Equal Median | 89 449.58 | 77 756.54 |
Disclaimer/Publisher’s Note: The statements, opinions and data contained in all publications are solely those of the individual author(s) and contributor(s) and not of MDPI and/or the editor(s). MDPI and/or the editor(s) disclaim responsibility for any injury to people or property resulting from any ideas, methods, instructions or products referred to in the content. |
© 2026 by the authors. Licensee MDPI, Basel, Switzerland. This article is an open access article distributed under the terms and conditions of the Creative Commons Attribution (CC BY) license (http://creativecommons.org/licenses/by/4.0/).
Copyright: This open access article is published under a Creative Commons CC BY 4.0 license, which permit the free download, distribution, and reuse, provided that the author and preprint are cited in any reuse.