

Submitted:
02 October 2026
Posted:
07 October 2026
You are already at the latest version
Abstract
Publicly available data and information relevant and supportive to the 26 August 2026 Langtang Lirung disaster cascade are dispersed across repositories, data portals and other online sources, complicating their identification, assessment and reuse. This study presents a living catalogue (https://evelpidou.nkua.cloud/Nepal-Flood-2026-Catalogue/) of these resources and analyses its first assessed release, archived in Zenodo (https://doi.org/10.5281/zenodo.23034746). The search and charting process, reported in accordance with PRISMA-ScR, comprised 74 documented searches through 24 September 2026, followed by the assessment and reviewing that completed on 28 September. The resulting inventory contains 141 resources and 5,883 assets across eight thematic domains. Structured records preserve provenance, geographic and temporal descriptions, access conditions, rights and source limitations, while the WebGIS (https://evelpidou.nkua.cloud/Nepal-Flood-2026/) enables geographic exploration where spatial information is available. Beyond this initial release, planned periodic searches, event-triggered checks, community nominations and versioned updates provide for continued expansion. The contribution is a traceable inventory connecting pre-event baselines, event observations and subsequent analyses to their supporting material, with documented searches and decisions providing a basis for continued maintenance. The catalogue therefore reduces the time and effort required to identify and access relevant data and information, while lowering the risk of overlooking resources that could inform future investigations of the event. Unlike conventional scoping reviews centred on mapping existing studies or datasets, this approach proposes a new type that systematically identifies and evaluates the data and resources available to support future research.
Keywords:
cryospheric hazards
; debris flow
; disaster cascades
; remote sensing
; flood hydrology
; open data catalogue
; PRISMA-ScR
1. Introduction
1.1. Mechanics and Escalating Risks of High Mountain Hazard Cascades
A hazard cascade defines a dynamic chain of geomorphic and hydrological processes wherein an initial primary trigger initiates a succession of secondary and tertiary failures whose cumulative destructive impact frequently surpasses that of the original initiating event [1,2]. In high relief alpine environments, steep structural relief, extensive glacierization, and fragile paraglacial sediment stores combine to create extreme susceptibility to compound geomorphic disasters [3,4]. In their global synthesis of 51 high mountain process cascades across the European Alps, the Himalaya, the Andes, and the North American Coast Ranges. Mani et al. [2] demonstrated that catastrophic mass detachments (rockfalls, rockslides, and hanging ice avalanches) represent the most frequent primary triggers, with subsequent transformation into hyperconcentrated debris flows and valley floor outburst floods acting as the primary mechanisms of long distance hazard propagation.
Anthropogenic climate change is profoundly altering the stability of high mountain cryosphere systems. Rising surface air temperatures, accelerated terminus retreat, and sustained elevation of the 0°C freezing level degrade high altitude permafrost and rock wall ice aprons [5,6]. The progressive loss of structural ice cement, combined with paraglacial debuttressing following glacial thinning, dilates structural rock joints and destabilizes high angle metamorphic headwalls [7]. When elevated summer temperatures generate copious meltwater that infiltrates deep foliation planes, extreme cleft water pressures develop, conditioning rock slopes for catastrophic failure without requiring acute tectonic earthquake triggers.
1.2. The 26 August 2026 Langtang Lirung Transboundary Disaster Cascade
On 26 August 2026, a rock–ice avalanche initiated a transboundary hazard cascade through the Lhende Khola, Bhote Koshi and Trishuli river system between Nepal and China [37]. USGS ComCat records the landslide event at 02:52:10 UTC (08:37:10 Nepal Standard Time; event us7000tbwb). Xu [37] places the source on the northern flank of Langtang Lirung (7,227 m), at approximately 5,200 m above sea level. Satellite optical feature tracking identified acceleration of the hanging glacier beginning in January 2026 [8]. Wang et al. [8] interpret this acceleration as potentially associated with fracturing of the underlying bedrock and subsequent coupled ice–bedrock movement. Multi-decadal observations document glacier shrinkage and warming across the Langtang catchment [9], providing regional context rather than direct evidence of the failure mechanism.
Following detachment, the fragmented rock–ice mass entered the Lhende Khola drainage and developed into a rapidly moving debris-laden flow, incorporating material and water along its path [8,37]. The deposited teleseismic inversion results report a peak resultant force of 2.46 × 10¹² N and an empirical force-based mass estimate of 1.33 × 10¹² kg [10]. A depth-averaged mixture-flow reconstruction reproduced arrival-time constraints in the upper reaches under scenarios with low effective resistance [11]. Frictional heating, ice melting and entrainment have been proposed as contributing processes [8,11], but the reconstruction does not resolve basal pore-pressure evolution or establish a unique weakening mechanism [11]. Deposited debris also impounded a barrier lake at the Chhochen Khola–Purepu Tsangpo confluence upstream of Gyirong port. Overflow from this main lake began on 28 August and therefore cannot explain the initial flood surge [37].
The surge reached the Gyirong–Rasuwagadhi border complex at approximately 08:45 NPT, within about eight minutes of the USGS catalogue origin time [11,37]. This transboundary river valley had experienced catastrophic disaster impacts only 13 months prior: on 8 July 2025, a giant supraglacial lake on Purepu Glacier breached via hydrofracture, routing ~7.22 × 10⁶ m³ of water across the glacier surface and down the Purepu Tsangpo into the Gyirongzangbu–Bhote Koshi system [38]. That predecessor outburst destroyed the China–Nepal Friendship Bridge at Resuo Port, severely damaged the 111 MW Rasuwagadhi hydropower plant alongside four other power installations, and caused direct economic losses exceeding 53 million USD [38]. Propagating through this already compromised valley, the 26 August 2026 surge inflicted renewed destruction on port, customs and trade facilities, swept away downstream roads and bridges, damaged hydroelectric infrastructure, and caused heavy casualties [39]. Two uppermost hydrometric gauges were reportedly destroyed, although Xu’s reconstruction relied on secondary reporting rather than direct access to their records [37]. Downstream stage observations recorded the flood wave reaching Devghat approximately six hours after the catalogue origin time [11].
1.3. Access to Data and Resources for Further Research
Further investigation of the cascade depends on access to the data and information relevant to it, whether produced before, during, or after the disaster. Although the studies discussed above contribute to an understanding of the event, the resources that could support subsequent research extend beyond those used in the published accounts. Their identification is complicated by dispersion across online sources and by differences in how they are described and made accessible. Moreover, material produced independently of the disaster may be relevant without being explicitly associated with it, so searches confined to event-specific publications cannot be assumed to capture the available research inputs. Researchers must therefore establish what they can obtain and examine the accompanying documentation before deciding how the material could contribute to their work. When the results of discovery and assessment remain confined to individual investigations, subsequent researchers face much of the same search effort and may overlook material already located by others.
A systematic account of publicly available resources would allow this work to form a common reference for further investigation. To serve that purpose, it must retain traceable links to the original sources and describe the material sufficiently for users to assess it against their own research requirements. However, resources may become available or undergo revision after the initial search, creating a need for continued discovery and assessment. Maintaining this account therefore also requires documented updates that make clear what has changed and preserve the basis on which resources were included.
1.4. Objectives and Scope
To address these difficulties, this study systematically identifies and assesses publicly available data and resources relevant to the 26 August 2026 Langtang Lirung disaster cascade and documents them in a living catalogue. Covering the periods before, during, and after the event, the catalogue is intended to support further research by reducing the effort required to locate relevant material and understand its potential use. This article presents and reviews its first version, based on searches completed by 24 September 2026 and reported in accordance with PRISMA-ScR [12]. The catalogue records the information needed to assess and access the identified resources and their associated data assets, with evidence status documented separately from curation readiness.
The catalogue is designed to accommodate subsequent additions, drawing on the living review approach described by Elliott et al. [13]. Scheduled and event-triggered searches, together with community nominations, provide for continued discovery, while versioned releases document additions and revisions. The accompanying WebGIS enables spatial exploration of the catalogued resources and complements the descriptions and access links provided through the catalogue.
2. Study Area, Physiographic Setting, and Disaster Cascade Chronology
2.1. Physiographic, Tectonic, and Cryospheric Setting
The study area follows the connected headwater and downstream river reaches affected by the 26 August 2026 cascade, from the northern flank of Langtang Lirung through the China–Nepal border region and the Bhote Koshi–Trishuli system to the Narayani at Devghat [37]. This transboundary river system forms a strategically vital connection between Tibet and Nepal that has been identified as a high-susceptibility hotspot for glacial lake expansion and cascading cryospheric hazards across the central Himalaya [84].This extent brings together the source slopes, the channel reaches through which the disturbance propagated, and downstream locations with surviving hydrological observations. Regional studies of river incision and catchment hydrology provide context for this steep Himalayan setting [14,15,16], while event-specific mapping defines the area affected by the cascade.
Regional geological studies place Langtang within the Greater Himalayan crystalline rocks and document high-grade metamorphic units, deformation and thrust-related structures [17,18]. At the scale of the Himalayan orogen, the Main Central Thrust and South Tibetan Detachment bound much of this metamorphic sequence [19,20]. These studies establish a regional structural context for interpreting slope geometry, but they do not identify the orientation or strength of the particular discontinuities involved in the 2026 failure. Similarly, regional river-incision estimates describe landscape development over geological timescales [14,16]; they cannot substitute for measurements of the source slope or the channel conditions during the event. Glaciers in the central Nepal Himalaya receive substantial accumulation during the summer monsoon, when melting also occurs [23]. In Langtang, repeated elevation surveys document spatially variable glacier thinning, including changes on debris-covered tongues [9,24]. Permafrost is also relevant to high-elevation slope stability, although regional distribution maps and rock-glacier inventories provide indirect evidence of its occurrence and cannot establish the thermal state of an individual headwall [21,22]. The rock–ice mechanics described by Krautblatter et al. [25] therefore offer a basis for testing possible weakening processes, rather than proof that permafrost thaw caused this detachment.
2.2. Climatological Regimes, Monsoon Dynamics, and 2026 Preconditioning
The regional precipitation regime reflects summer monsoon circulation and winter disturbances arriving from the west, with the summer monsoon delivering approximately 80% of annual moisture across Nepal [87]. However, elevation alone does not describe its spatial variability. Observations in the Langtang valley show substantial precipitation differences over short distances and seasonal variation in temperature lapse rates [15], while regional TRMM analyses identify distinct rainfall maxima along the Himalayan front [27]. Comparisons between rain gauges and satellite estimates in the nearby Marsyandi basin likewise show that performance varies with elevation and rainfall conditions [28]. These findings explain why the catalogue retains both station observations and gridded products: their spatial support and measurement limitations must be considered before they are used to reconstruct conditions at the failure site.
The event occurred against a background of sustained glacier change and regional warming. Silwal et al. [9] reconstructed a loss of 78.46 ± 4.38 km² of glacier area in the Langtang catchment between the Little Ice Age and 2023 and reported warming of approximately 0.3°C per decade above 4,000 m during 1964–2023. These catchment-scale records describe the regional setting but do not measure the thermal or mechanical condition of the failed slope. Wider basin-scale syntheses across Nepal corroborate these localized trends, documenting a 22% reduction in glacier area across the Gandaki basin between ~1980 and 2010, alongside an upward shift in the equilibrium line altitude of approximately 95 m and accelerated ice thinning [87]. Conditions during 2026 are documented at different spatial and temporal scales. Wang et al. [8] identified an exceptionally cold June followed by anomalously warm July and August in ERA5-Land. A separate NASA POWER/MERRA-2 archive [31] reports a June–August temperature anomaly of +0.74°C relative to 1991–2020 at its source grid cell. The World Weather Attribution report [30] estimates temperatures at 5,150 m from local station observations and lapse rates and finds sustained above-freezing conditions during 12–26 August. These records support investigation of thermal preconditioning, while the report notes that local permafrost measurements are unavailable.
Antecedent precipitation and water availability also require scale-specific interpretation. The regional reanalyses describe seasonal conditions, whereas neither those grids nor the available accounts establish pore-water pressures or saturation throughout the source slope and valley fill. The role of water in slope failure and downstream entrainment therefore remains a question for further investigation [30,31,37].
2.3. Disaster Cascade Chronology and Physical Evolution
The USGS catalogue records a landslide at 02:52:10 UTC (08:37:10 NPT) on 26 August 2026. This origin provides the reference time used in subsequent reconstructions [11,37]; the independent GFZ solution is 02:52:23.17 UTC. Satellite studies identify a failure involving rock and glacier ice on the northern flank of Langtang Lirung [8,56]. The mapped source boundaries, elevation estimates and inferred volumes vary with the data and method, so the catalogue origin location and preliminary source dimensions should not be treated as a surveyed detachment geometry. The released material descended more than 1 km before continuing through the upper valley, where imagery documents substantial erosion and deposition [37,56]. The resulting mixture reached the border corridor within minutes. Its fragmentation, entrainment and phase changes are investigated in published interpretations and numerical scenarios, rather than directly resolved by the available timing observations [10,11].
Seismic and numerical analyses constrain different aspects of this passage. Huang et al. [10] report a preferred peak resultant force of approximately 2.46 × 10¹² N and an empirical force-based mass estimate of 1.33 × 10¹² kg, both dependent on the inversion and scaling assumptions. Park [11] reproduces the upper-corridor timing windows with low effective resistance in a depth-averaged mixture model, without resolving basal pore pressure or demonstrating a particular lubrication mechanism. Post-event reports also document a barrier lake; Xu [37] distinguishes its later overflow from the initial flood and leaves the contribution of any rapid earlier release unresolved. The available timing evidence combines a border CCTV record with interrupted telemetry and downstream river-stage observations. Park [11] uses an arrival window of 373–553 s after the USGS origin at Gyirong Port and conditional telemetry-loss windows of 170–770 s at Rasuwagadhi and 770–1370 s at Syabrubesi. These are not interchangeable with exact front-arrival times. Xu [37] reports that overflow of the main barrier lake began on 28 August, which excludes that later overflow as the origin of the initial 26 August wave but does not distinguish avalanche-driven displacement from an earlier short-lived blockage and release.
The downstream flood chronology is constrained by hydrometric observations and dated operational reports rather than by a single propagation speed. The official technical report records the last Betrawati transmission at 09:20 NPT, information placing the flood near Galchhi at 10:28, and a peak stage of 6.57 m at Devghat at 16:00. The corresponding discharge estimate was 5,850 m³/s. These are station observations and reported information times, which should be distinguished from reconstructed flood-front arrival intervals [57,69].
2.4. Transboundary Socioeconomic and Infrastructure Exposure
The Trishuli and Bhote Koshi river valley represents a critical economic and geopolitical conduit connecting central Nepal with the Tibet Autonomous Region of China. The valley floor accommodates the Galchhi–Trishuli–Betrawati–Syabrubesi–Rasuwagadhi highway (National Highway NH42, historically designated H06), which serves as the primary overland trade route through the Rasuwagadhi border dry port. The steep river gradient also sustains extensive renewable energy infrastructure, hosting a dense cascade of operating and under-construction run-of-river hydroelectric schemes. These include the 111 MW Rasuwagadhi Hydropower Project near the border (previously crippled during the July 2025 Purepu outburst [38]), the under-construction Upper Trishuli-1 Project (216 MW), the operating Upper Trishuli-3A (60 MW) and under-construction Upper Trishuli-3B (37 MW) downstream, as well as the Sanjen and Chilime projects situated along tributary gorges. Beyond its existing highway and dry port infrastructure, which facilitates over 1,000 million USD in bilateral annual trade and serves as the alignment for the planned trans-Himalayan China–Nepal railway, this valley floor is acutely vulnerable to transboundary flood hazards [84]. Hydrodynamic simulations across the Gyirong–Trishuli basin indicate that high-magnitude outburst surges can exceed seasonal monsoon peak flows by up to an order of magnitude and reach international border crossings in under 30 minutes, exposing over 100 km of road network, ~50 bridges, and nine operating or planned hydropower installations to severe inundation and structural damage [84,85].
The event damaged transport links, hydropower facilities, settlements and public services along the affected valleys. Riparian settlements along the upper Trishuli valley, particularly Timure and Syabrubesi, exhibit heightened social vulnerability and exposure resulting from rapid riverside building expansion within narrow valley bottoms, low baseline disaster preparedness, and the persistent lack of institutionalized cross-border early warning mechanisms [86].Early humanitarian reports provided dated estimates that changed as access and assessments improved. UNICEF’s situation report of 31 August, citing NDRRMA, reported 903 deaths and 4,247 missing persons across the affected area and explicitly identified the figures as preliminary. These report totals should be distinguished from structured BIPAD incident records and from estimates of people exposed to mapped flood extents. An independently reconciled total of generation capacity lost and event-wide economic damage was not established by the sources examined here [70].
3. Materials and Methods
3.1. Methodological Framework: The Living Scoping Review and Data Catalogue
3.1.1. Epistemic Identity of the Work
This article inventories publicly available information resources and their associated assets relevant to the 26 August 2026 Nepal hazard cascade. It includes pre-event baselines as well as event observations and subsequent publications. The catalogue organizes this material across eight thematic domains: spaceborne Earth observation; terrain, geomorphology, and cryosphere; hydrology, hydraulics, and meteorology; geophysics, geotechnical baselines, and soil properties; land cover and environmental baselines; exposure, infrastructure, and the built environment; post-event scientific literature and forensic analyses; and humanitarian crisis reporting and civil protection. These domains describe the scope of the inventory; the presence of a record does not establish that its data have been independently validated or used in an event reconstruction.
These eight information domains materialize across seven technical and computational asset modalities. Specifically, the catalogue indexes geospatial rasters and gridded arrays including Cloud-Optimized GeoTIFF and NetCDF files; vector geodatabases and feature layers spanning GeoPackage, Shapefile, GeoJSON, and KML formats; hydrometric and meteorological time series tables formatted as CSV and spreadsheet records; in situ field surveys, ground photographs, and damage inspection archives; cloud-native geospatial services, vector tile feeds, and SpatioTemporal Asset Catalog metadata manifests; data-bearing documents and forensic publications including peer-reviewed papers, technical reports, and official agency bulletins; and reproducible computational workflows, Python algorithms, and simulation code repositories. The search and charting process covers both publications and data resources distributed across satellite archives, hydrometeorological services, infrastructure registries, emergency mapping services, humanitarian portals, and research repositories. Source-specific searches identify candidate parent records and their associated files or endpoints. Charting records their provenance, coverage, access conditions, licence information, production methods, and stated limitations. Technical metadata checks and catalogue eligibility decisions are recorded separately from the scientific validation claimed by a source.
Different providers release and revise material on different schedules. A dated assessment therefore accompanies the catalogue so that later additions and corrections can be distinguished from the inventory reviewed here. The catalogue publishes metadata and links to provider-hosted material, and its associated WebGIS enables geographic exploration where suitable spatial information is available. Maintaining this connection between sources, assessment decisions and releases supports continued use as the evidence develops.
3.1.2. Relationship to Existing Evidence Syntheses and Data Inventories
The catalogue combines practices developed in evidence synthesis and data description. Systematic maps organize study characteristics and make them accessible through searchable tables and maps [40,41,42,43,44], while reviews of public datasets describe the availability and characteristics of information held by different providers [45]. Data descriptors and event studies document compilation methods, observations and analyses in greater depth [46,47,48]. Building on these approaches, the present review links parent resources to the files, documents, code and service endpoints relevant to one disaster and its pre-event baselines.
Version-controlled GLOF databases [49], historical outburst compilations [50], assessments of mountain-observation coverage [51], and the collaborative COOLR landslide repository [52] provide further precedents for recording provenance, evaluating coverage and incorporating new information. Copernicus emergency mapping and Sentinel Asia connect satellite products to disaster-management needs [53,54]. Table 1 sets out the purposes and units of evidence in these approaches, providing the context for the resource and asset structure used here.
3.1.3. Catalogue Workflow
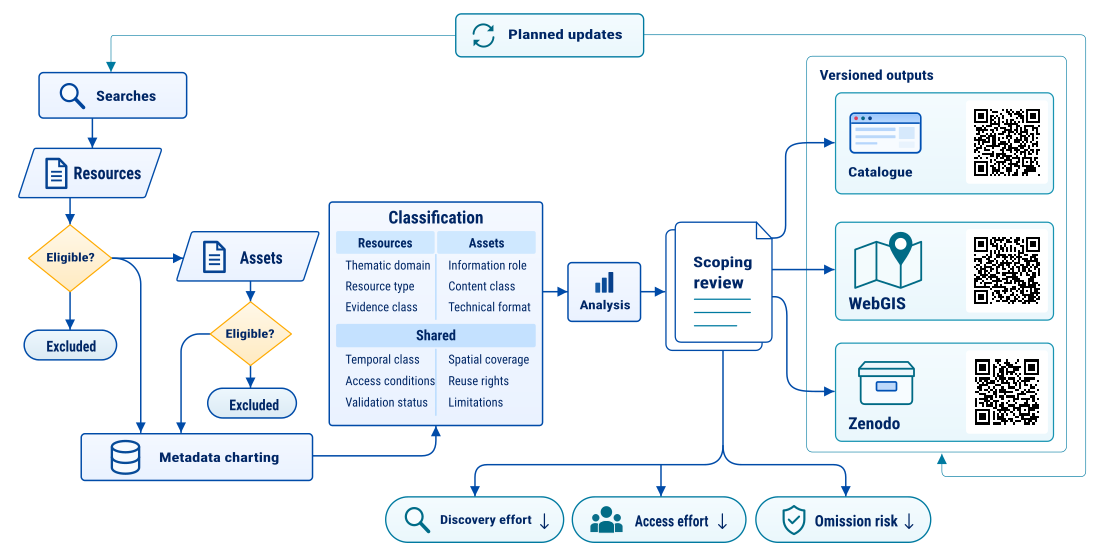
The workflow links source discovery, eligibility assessment, descriptive charting and publication of resource and asset records. Each parent resource and associated asset receives a separate decision, allowing a relevant source to be retained while an unsupported attachment or duplicate distribution is excluded. The completed assessment records the reason, original-source evidence and metadata corrections for every entry. Source publication status and scientific validation remain distinct from the decision to include a record in the catalogue.
The authors plan to maintain the catalogue through periodic source-specific searches, checks prompted by new or revised releases, and community nominations. This prospective workflow extends the dated search record reported here. The public nomination form prepares an email containing the proposed resource and its access information; a maintainer must receive and assess that nomination before changing its catalogue status. Subsequent updates should record search dates, eligibility decisions, corrections, and changed source information.
3.1.4. Evidence Characteristics and Catalogue Review Status
Evidence characteristics are described separately from catalogue review status. Resource records contain evidence-class, production-method, validation-status, uncertainty, and limitation fields. These distinguish measurements and source imagery, interpreted and automated products, modelled outputs, baseline information, exposure information, and mixed resources; the exported records also retain more specific source descriptions. Publication type and peer-review status are recorded where established. Agency origin, open availability, or a reviewed catalogue label is not used as a substitute for scientific validation. Catalogue assessment determines whether a resource is identifiable, relevant and available through an eligible access route. Its scientific interpretation depends on the measurements, methods and validation documented by the producer. A preprint, an interpreted satellite map and a direct observation can therefore all qualify for inclusion while supporting different kinds of inference. Recording those distinctions allows users to judge the evidence required for a particular research question.
3.2. Eligibility Criteria and Qualification Gates
3.2.1. Spatial Boundaries and Cascade Domain Delimitation
The review domain follows the connected source and downstream reaches of the cascade, from the northern flank of Langtang Lirung through the China–Nepal border corridor and the Bhote Koshi–Trishuli system to the Narayani at Devghat. Searches used source-specific geographic footprints suited to each archive, product or service, as recorded in the search register. These retrieval areas provide routes to relevant material; they are not a single mapped boundary of the disaster’s impacts. Spatial relevance is assessed from a source footprint, named locations, or the area described in the resource. Regional and global datasets may qualify where they supply relevant baseline or contextual information for the affected corridor. Documents, code, and service records need not have a numeric bounding box when their relevance is established from their content or stated coverage. Missing geographic metadata are recorded as a limitation; resources with no demonstrable connection to the review scope are excluded.
3.2.2. Temporal Windows and Event Phasing
The inventory distinguishes pre-event baselines, event-period observations, and post-event publications available by the 24 September 2026 cutoff. Observation or acquisition dates, source publication dates, and catalogue search dates are recorded separately where available. Historical baseline products retain their native reference periods, which may precede 1980; a resource is not assigned an event observation date merely because it was published or retrieved after the disaster.
3.2.3. Eligibility Assessment and Technical Charting
Eligibility assessment considers geographic and temporal relevance, contribution to the eight thematic domains, identifiable provenance, useful data or substantive source information, technical characteristics and access conditions. Table 2 sets out these seven dimensions. They apply across all asset modalities, including documents and code as well as spatial and numerical data. Where the original source did not establish the identity or eligible access route of a claimed asset, the assessment records an exclusion with the unresolved requirement stated as its reason.
Eligible resources are available without charge through direct access, free registration, or a transparent no-cost request process. Paid or private holdings and resources with an opaque access process are outside the catalogue eligibility criteria. Source identity and the distinction between the original producer and a distribution host are retained. Access and reuse permissions are assessed separately: a reachable file can still have unspecified or restrictive redistribution terms. Missing licence or technical information is stated explicitly and must not be converted into an open-licence or analysis-readiness claim.
3.2.4. Review Status and Record Updates
Assessment was completed on 28 September 2026 for all 172 parent entries and 6,416 assets in the search snapshot. Resource identity and relevance were checked against original publications, provider records and service documentation, while individual assets were checked against native file records, manifests or documented service routes. Identities that could not be established were recorded in the exclusion decisions. AI-assisted source comparison and metadata checks supported this process. The resource and asset decision ledgers record the evidence examined, corrections made and grounds for inclusion or exclusion, enabling subsequent author review and reassessment.
Completed catalogue assessment does not require every source to be peer reviewed or every asset to be converted into a common format. Historical versions, previews, quality layers, metadata and access services retain their specific roles. Duplicate distributions are linked to the retained record, while unsupported identities and access routes are excluded from the eligible inventory. Later releases can revise these decisions when new source evidence becomes available without overwriting the earlier assessment.
3.3. Information Sources, Search Strategies, and Living Surveillance Protocol
3.3.1. Multi-Tier Information Repositories and Search Platforms
Searches were organized by source and information need rather than by a single bibliographic database. The search register covers satellite archives and STAC services, including Microsoft Planetary Computer, Copernicus, USGS, and NASA; emergency mapping services and disaster activations; and national hydrometeorological, geological, and water-management sources. Each run identifies the interface and scope actually queried. The number of runs is reported separately from the number of providers, portals, and services.
Additional searches cover civil-protection and humanitarian platforms, UNOSAT and relief coordination sources; USGS, GEOFON, and EarthScope/FDSN geophysical services; research repositories and discovery services such as Zenodo, EarthArXiv, arXiv, and Crossref; infrastructure and OpenStreetMap sources; and environmental and hydrographic baselines. A distribution portal and an upstream data producer can both appear in the search record. Their roles are kept distinct to avoid counting a redistributed product as an independent observation.
3.3.2. Multidimensional Query Matrix and Multilingual Search Facets
Transboundary disaster evidence synthesis across the central Himalayas confronts acute geographic and orthographic fragmentation across international borders. The 26 August 2026 disaster cascade originated on the northern glaciated slopes of Langtang Lirung in Tibet before propagating into the deeply incised Trishuli basin of Nepal. To prevent national retrieval silos from omitting critical intelligence, the bibliographic search protocol combined Latinized toponyms, regional Devanagari spellings, and Simplified Chinese character sets. Query strings paired phonetic variations of the source massif and border posts, specifically Gyirong, Jilong, and Kyirong (吉隆) alongside Rasuwa (热索), with proximal river reaches, including the Lhende Khola and Bhote Koshi, down to the terminal hydrometric station at Devghat (普朗). Logical operators enforced mandatory co-occurrence between regional geographic identifiers and process-specific terminology, isolating event-specific records from general Himalayan tectonic literature. The physical search architecture mirrored the cascading mechanism of the disaster, intersecting cryogenic, seismological, and hydrodynamic process vocabularies. High-altitude detachment queries targeted rock-ice avalanche kinetics, cryogenic structural debuttressing, and glacial damming terminology across Chinese and international scientific indexing systems. To capture waveform telemetry and source-inversion models across open-access geodetic networks, queries combined mass-wasting descriptors with teleseismic observables, focusing on long-period Rayleigh wave inversions, force histories, and centroid moment tensor solutions. Downstream hydraulic queries targeted river stage telemetry, hyperconcentrated mixture routing, and rating curve extrapolations across national hydrometric stations, tracking the progression from catastrophic gorge transit to lower-basin attenuation.
Orbital and infrastructure facets captured spaceborne observations and structural vulnerability along the transport route. Spaceborne queries targeted both public and commercial constellations across synthetic aperture radar, optical multispectral missions, and stereo digital elevation archives. Infrastructure queries prioritized damaged civil assets and run-of-river installations along National Highway NH42, including the international Friendship Bridge, customs dry port facilities, and hydroelectric generation plants across the Trishuli cascade. Administrative emergency protocols were captured by querying international disaster charter activations, operational European and Asian satellite mapping campaigns, and official national incident registers. On cloud-native spatial archives lacking textual search indices, geographic bounding polygons were executed directly through STAC API endpoints to retrieve scene metadata and asset links. Retrieval of a STAC record does not establish that the linked image was downloaded, cloud-free, geometrically suitable, or ready for a particular analysis.
3.3.3. Systematic Search Executions and Accountable Audit Trail
The search register preserves the date, source, interface, strategy and outcome of each documented execution. Where available in the source record, it also retains run and strategy identifiers, spatial and temporal scope, stopping rules and numerical retrieval fields. Fields unavailable in the later published records remain missing rather than being inferred from narrative totals. Each execution remains a distinct provenance record even when several runs identify the same resource. Resource totals are therefore calculated from unique catalogue identifiers rather than by summing retrieval counts across searches; native search hits, acquisition records and asset listings retain their original units. The full register is supplied as Table S3, and the search outcomes and resulting assessment totals are reported in Section 4.1.1.
Search outcomes distinguish completed, partial and unavailable executions. Pagination exhaustion is evaluated within the declared interface and scope; endpoint failures, retrieval caps and missing responses remain explicit limitations. Completion refers to the recorded search procedure, while cloud-free image coverage, retrieval of scientific payloads and suitability for a particular analysis require separate assessment. Figure 1 sets out the workflow linking search execution, resource screening, eligibility decisions and asset cataloguing.
3.3.4. Further Searches, Community Nomination, and Version Control
Planned maintenance combines periodic searches with additional checks when relevant new material appears. Priorities include post-event elevation products, newly released hydrological observations, revised agency assessments, and peer-reviewed investigations. These releases can prompt reassessment of existing entries or addition of new candidates. Search execution, assessment decisions, and changes to the inventory will need to be documented in dated updates. The present manuscript reports searches through 24 September 2026; the proposed maintenance process is distinct from the work already completed.
The public nomination form accepts an active personal or institutional email address, resource title, URL or DOI, description, and confirmation of an access route without payment. Name and affiliation are optional. It prepares a message for the contributor to send through an email application and does not store submissions on the server. Receipt, provenance checks, eligibility assessment, and changes to catalogue records require subsequent handling; completing the form does not change a record’s review status. The catalogue source is maintained in Git, and the assessed release of 28 September 2026 is archived in Zenodo (see Supplementary Materials).
3.4. Data Extraction, Technical Asset Charting, and Provenance Auditing
3.4.1. Standardized Data Extraction and Charting Variables
Charting links resources to assets through local catalogue identifiers. Resource records describe identity, producer, source type, publication and update dates, geographic and temporal coverage, access and reuse conditions, methods and reported limitations. Asset records additionally describe the specific file or service, its relationship to the parent, format, size, resolution and coordinate information where applicable, source endpoint and evidence supporting the assessment. Original values are retained alongside corrections in Table S1 and Table S2. Missing information remains explicit, and a field that describes a parent acquisition is not automatically assigned to a preview or metadata file.
Local resource and asset identifiers preserve the parent–child structure and distinguish the original inventory from additions recovered during source verification. Provider identifiers, DOIs, scene names, file URLs and versions are recorded separately. When two entries refer to the same distribution, the decision ledger retains the alias and identifies the record counted in the eligible inventory. Versions and alternative manifestations remain distinguishable where their content or role differs.
3.4.2. Spatial Metadata and Coordinate Reference Systems
The catalogue retains native coordinate-reference information where supplied and records WGS 84 bounding boxes for geographic discovery where available. This metadata charting does not imply that all underlying files were reprojected or that vertical datums were harmonized. The current asset records include several projected and geographic reference systems as well as missing CRS fields. Any subsequent comparison of elevation, river stage, distance, area, or velocity must establish the relevant horizontal and vertical reference systems and apply documented transformations appropriate to that analysis.
3.4.3. Technical Assessment and Source-Reported Limitations
Technical assessment covered the identity and information role of every listed asset, its relationship to native source records, available access routes and stated reuse conditions. Provider manifests and metadata supported assessment of bulk collections, with file, archive, document or service-response checks used where needed to resolve identity and content. Endpoint responses were interpreted alongside that evidence because a successful HTTP response can lead to a login page rather than the named file. Scientific payloads were not uniformly downloaded or independently validated; the recorded assessment scope and source limitations determine what can be inferred about suitability for subsequent analysis.
The review distinguishes a source’s stated validation from checks performed during cataloguing. Gauge measurements, reconstructed discharge, mapped damage, and model or inversion outputs retain their different origins and limitations. Where a source does not provide a calibration, uncertainty estimate, observation record, or reproducible processing description, that absence is reported. The inventory does not independently establish missing peak flows, force histories, or sensor accuracy, and it does not replace the validation required for reuse in physical modelling.
3.4.4. Access, Licensing, and Support for Reuse
The catalogue documents identifiers, provenance, coverage, access routes and reuse conditions to support the FAIR aims of finding, accessing and reusing data [83]. Accessibility varies across providers: some services require free registration or a documented request, while other resources are directly downloadable. Permissions remain specific to each source, and the licence applied to catalogue metadata does not extend to third-party files. Native formats and coordinate systems are recorded so that users can determine the processing and transformations required for their intended analysis.
3.4.5. Descriptive Analysis of the Catalogue
Descriptive analysis covered the complete assessed release, with resources and assets counted separately by their unique identifiers. Current assessment decisions and corrections took precedence over historical fields retained for provenance. Each retained resource was assigned one primary domain according to its main information purpose, and its retained assets were counted under the same domain. This gives totals in which each resource and asset is counted once, while the classification table records other plausible thematic uses. The primary assignment therefore organizes the counts without restricting the subjects addressed by individual components. Each search execution was assigned to one source/interface family according to its principal retrieval route, independently of the thematic classification of the resources they identified.
Asset roles were grouped according to their assessed function and content. Technical formats were summarized separately because file structure does not determine scientific function. Resource counts within role or format groups record the presence of at least one retained asset and may overlap, whereas asset counts within each classification sum to the full inventory. Access and rights summaries describe the recorded conditions rather than infer permissions from accessibility. Spatial and temporal fields were interpreted according to whether they describe an observation, parent collection, study area or request. The complete search register, classification assignments, counting rules and reuse summaries are supplied in Table S3–S5, with scripts for reproducing the aggregate results.
Alongside the tables, descriptive plots and category cross-tabulations were used to examine catalogue composition and concentration; these forms of visualization are also used for evidence-synthesis databases [40]. Domain shares use separate resource and asset denominators, and the concentration curve includes every resource, ranked by descending asset count. In the domain-by-role matrix, colour represents each role’s share of the domain’s assets; paired counts show the number of assets and contributing resources. A supplementary matrix cross-tabulates all technical format groups and roles using within-format shares and asset counts.
4. Results
Section 4.1 reports the results for the complete assessed catalogue, covering search outcomes, thematic composition, asset roles and formats, and conditions affecting coverage and reuse. The subsequent thematic synthesis (Section 4.2, Section 4.3, Section 4.4, Section 4.5, Section 4.6 and Section 4.7) examines the observations and interpretations reported by the identified sources, moving from seismic timing and source-area change through hydrological propagation to satellite mapping, infrastructure impacts and emergency response. Findings are attributed to their source and measurement or analytical method, with agency event solutions, satellite observations, derived quantities, model outputs and situation reports distinguished throughout. Publication status and reported limitations are retained so that estimates can be compared in relation to their spatial coverage, observation dates and assumptions. Tables 7–12 describe the corresponding thematic resources and product families; Table S1 and Table S2 provide the complete item-level inventory and assessment trail.
4.1. Catalogue Search Outcomes, Composition, and Reuse
4.1.1. Search Executions and Eligibility Outcomes
The register documents 74 search executions between 3 and 24 September 2026: 65 completed, eight partial and one unavailable (Table 3). Satellite imagery and emergency mapping services accounted for the largest number of documented runs. Partial and unavailable searches encountered constraints including restricted access, pagination or request limits, and incomplete responses.
The search records contain 224 run–resource associations covering 172 unique original resource entries. Repeated discoveries therefore remain visible without increasing the resource count. Assessment retained 140 of these resources and excluded 32. Among the 6,416 assets associated with the original resource entries, 5,871 were retained, 544 excluded and one empty availability record preserved only in the audit trail. Verification against original sources also recovered one distinct resource and 12 eligible assets available or established before the cutoff. The assessed inventory consequently contains 141 resources and 5,883 assets. Six retained resources have no separately retained child asset, so their contribution is at the resource or collection level. Table S1 and Table S2 preserve all decisions and corrections, while Table S3 links the search history to the original resource population.
4.1.2. Thematic Composition and Distribution of Assets
The thematic distribution is more concentrated at the asset level than at the resource level (Table 4; Figure 2A). Spaceborne Earth observation accounts for 52 resources (36.9%) and 5,201 linked assets (88.4%), reflecting the enumeration of separately distributed components in satellite collections and emergency mapping releases. The other seven domains together contain 89 resources and 682 assets. Assigning each resource and its assets to one primary domain prevents double-counting across domains; overlapping uses remain documented in the accompanying classification.
Across individual resources, the number of retained assets ranges from zero to 1,524, with a median of four (Figure 2B). The six resources containing at least 100 assets together account for 4,760 assets (80.9%), so most assets belong to a small number of collections whose components have been catalogued in detail. Resource counts describe the distribution of catalogue entries across domains, while asset counts also reflect how providers package acquisitions, products and documentation.
4.1.3. Asset Roles and Technical Formats
Across the full inventory, data, observations and analytical products account for 1,775 assets (30.2%; Table 5), spanning inputs, measurements, mapped classifications, derived estimates and modelled products. Supporting metadata, previews, quality and diagnostic material, and alternative distributions together account for 3,845 assets (65.4%). The remaining groups comprise documents and services; code, workflows and mixed analysis archives; and records qualified as historical, superseded, retracted or mixed-validity.
The domain-by-role comparison shows how these overall proportions vary across the catalogue (Figure 3). Data, observations and analytical products occur in all eight domains, whereas quality and diagnostic material and alternative distributions occur only within Earth-observation holdings in this assessed inventory. Documents span six domains, with their largest counts in humanitarian and civil-protection material and scientific and forensic studies.
Technical formats describe how these assets are encoded or packaged (Table 6). Raster and multidimensional array formats account for 2,633 assets (44.8%), and still-image formats for 1,436 (24.4%). Cross-tabulation of all format groups and information roles shows how the same technical format can serve different functions (Figure S1). Format and role together help identify the processing and interpretation needed for reuse.
4.1.4. Coverage and Conditions for Reuse
Spatial and temporal metadata describe different types of coverage across pre-event reference material, event-period observations and subsequent analyses. Acquisition footprints and dates specify sensor coverage; study areas, service extents and request intervals describe the scope of the relevant study, service or request. Previews and metadata may inherit a parent scene’s acquisition information without representing additional observations, while an available station interface does not establish that records exist for the requested interval. The inventory supports discovery across the source area and downstream corridor, but quantifying the proportion of the disaster area or event chronology observed requires examination and comparison of the relevant scientific data.
The recorded assessments document a public route or response for 3,724 assets (63.3%); another 1,546 are associated with public metadata or browse access alongside protected scientific-data routes, and 531 with free registration or authentication. Other entries retain provider applications, service-specific conditions or qualified access outcomes in Table S5. These are descriptions of access routes, so they do not imply that every scientific file was downloaded. An asset-specific reuse grant was not established for 1,848 assets (31.4%), while 1,565 have mixed or component-specific terms. The remaining categories distinguish provider terms, standard licences, restrictions, noncommercial or no-derivatives conditions, public-domain statements and conflicting assertions. Making these conditions explicit allows users to locate material available without charge while determining separately what may be processed, shared or redistributed.
4.2. Geophysics, Geotechnical Baselines, and Seismological Records
4.2.1. Seismological Event Detection and Initiation Timing Benchmarks
Seismological records provide a reference chronology and observations of the forces and radiation associated with the mass movement. Their precision depends on the catalogue solution, waveform bandwidth and source model. The available event records and analysis archives can therefore support further reconstruction, but they do not independently determine the detached volume or all stages of the cascade [10,11].
The USGS Comprehensive Earthquake Catalog identifies event us7000tbwb as a reviewed landslide at 28.271° N, 85.515° E, with an origin time of 02:52:10 UTC and a fixed depth of 0 km. Its reported magnitude is 5.2, with magnitude type ms_vx. GFZ GEOFON identifies gfz2026qrfy as a landslide at 28.3° N, 85.5° E, with an origin time of 02:52:23.17 UTC, depth 0 km and Mw 5.69. The records should retain their original magnitude types and agency-specific solutions.
The two magnitude estimates use different scales and do not provide a direct measure of source volume. Their difference is not, by itself, a diagnostic test separating landslides from tectonic earthquakes; event classification and physical interpretation require the accompanying waveform and source analyses.
The USGS origin is used as the common time reference in the deposited reconstruction archives [10,11]. Catalogue searches reported by Gujree [58] and Xu [37] found no supporting tectonic event within their stated search windows. Such results should be retained with the searched area, period and magnitude threshold, rather than extended to an unreported 250 km, 72-hour exclusion test.
4.2.2. Regional Broadband Waveform Telemetry and Near-Field Station Constraints
FDSN services provide routes to station metadata and event-window waveform requests. Station metadata, waveform availability and the suitability of returned traces for inversion are separate checks: an endpoint alone does not establish complete, unclipped data. The deposited Huang et al. [10] archives document the station selection and processing used in their analyses.
The far-field archive supplies the station-selection table, processing code, force solutions and sensitivity results, but excludes the approximately 2 GB of raw waveforms and StationXML files. Its README directs users to federated FDSN services to obtain those inputs and notes that later changes to responses or traces may affect reproduction [10].
For the event date, FDSN metadata list NK.KKN at 27.800° N, 85.279° E with BHE, BHN and BHZ channels sampled at 50 Hz. IC.LSA is listed at 29.70325° N, 91.12762° E with BH1, BH2 and BHZ channels at 40 Hz for location codes 00 and 10. Requests must specify the applicable channel and location identifiers; these metadata do not establish that either station supplied the closest, uninterrupted or unclipped event record.
4.2.3. Multi-Phase Waveform Dynamics and High-Frequency Spectrogram Signatures
The near-field archive of Huang et al. [10] contains a 16-station analysis of 1–2 Hz seismic radiation. The records are transformed into self-normalised relative amplitudes and apparent radiation patterns through time, with alternative travel-time shifts, weighting choices and reference windows retained. These products describe changes in the recorded wavefield; attribution of individual intervals to acceleration, impact or channel transport is an interpretation of those patterns.
The archive explicitly distinguishes measured front and tail timings from derived passage centroids and lengths. It also identifies an assumption in the radiation analysis: the reference windows are treated as azimuthally uniform. Retaining these definitions and alternatives is necessary when using the products to test a proposed event chronology [10].
Timing constraints from seismic radiation and video can be compared with modelled passage times, but agreement does not independently demonstrate negligible basal friction. The inferred resistance remains conditional on source geometry, terrain representation, entrainment and the interpretation of the timing observations [10,11].
4.2.4. Teleseismic Single-Force Inversion and Dynamic Trajectory Reconstruction
The open archive deposited by Huang, Chen and Wang [10] contains a teleseismic single-force inversion of 80–150 s vertical Rayleigh waves from 47 global stations. It provides the force exerted by the moving mass on the Earth, together with station-selection information, processing scripts and alternative solutions. The accompanying mass-flow products are a separate set of three-phase r.avaflow v4 simulations using an imposed 200 million m³ release.
The preferred solution tabulated in headline_ensemble.csv allows force over approximately −25.6 to +533.4 s relative to the USGS origin. It has a peak horizontal force of 2.44 × 10¹² N and a peak resultant force of 2.46 × 10¹² N at approximately +104 s; the horizontal force reverses near +205 s. The summed horizontal-force directions before and after reversal are approximately 77° and 257°. A separate 523-sample constrained solution has a horizontal peak of 2.05 × 10¹² N at +105 s. These outputs represent different inversion choices and should not be combined into a single force history [10].
The preferred mass estimate of 1.33 × 10¹² kg is derived from the empirical relationship between peak force and mass used in the archive, rather than from dividing a measured impulse by an assumed front velocity. The 24 tabulated solutions yield estimates of 0.53–2.04 × 10¹² kg under that relationship, before accounting for empirical scaling scatter. This sensitivity and the distinction between force on the Earth and front motion limit direct comparison with a detached source volume or an entraining flow model [10,11].
4.2.5. Precursory Kinematic Deformation Baselines and the Remote Sensing Detection Dichotomy
Wang et al. [8] provide a complementary record of pre-failure deformation from 221 Sentinel-2 scenes acquired between February 2017 and August 2026. Their enhanced optical pixel-offset tracking identifies cumulative displacement exceeding 100 m and an acceleration of the outlet hanging glacier from 7.4 to 55.0 m yr⁻¹ beginning in January 2026, while the adjacent main glacier retained a rate of approximately 42.2 m yr⁻¹. The authors interpret the divergence as evidence for coupled ice–bedrock instability; the inferred bedrock fracture and thermal contribution remain interpretations of the displacement and climate records.
The value of combining optical and seismic observations lies in their different spatial and temporal support. Optical tracking measures surface displacement between acquisitions, whereas seismic analyses describe ground motion during specified recording windows. Neither a successful retrospective analysis nor the presence of continuous station metadata establishes an operational warning capability [8,10].
4.2.6. Catalogued Geophysics and Seismology Assets
Table 7 records the event products, waveform requests and analysis archives identified within the geophysics and seismology domain. The entries retain their individual verification and access status so that a candidate request is not mistaken for a retrieved waveform or a reviewed physical interpretation.
4.2.7. Geotechnical Baselines, Observational Gaps, and Research Priorities
The inversion archives permit scrutiny of source-model choices and their influence on estimated force and mass [10]. They do not independently partition detached rock, glacier ice and subsequently entrained material. Comparison with topographic change therefore requires a defined source footprint and suitable pre- and post-event elevation surfaces. Available pre-event DEMs and partial post-event stereo interpretations provide different constraints and should be documented separately [11,63].
The available imagery also records bedrock structures interpreted as evidence of progressive slope instability [56]. These observations do not constitute measurements of joint pressure, subsurface temperature, rock strength or the amount of damage inherited from the 2015 earthquake. The catalogue should make the spatial coverage and type of those observations clear so that subsequent geotechnical work can identify which inputs remain to be obtained.
4.3. Terrain, Geomorphology, and Cryospheric Source Detachment
4.3.1. High-Altitude Detachment Setting and Cirque Morphology
Satellite studies locate the failure on the northern flank of the Langtang Lirung massif, above the valley leading to the transboundary border corridor [8,37,56]. Published elevation and boundary estimates describe different points and mapped areas. In particular, the USGS catalogue location is a seismic source solution and should not be used as a surveyed scarp centroid.
The optical record shows that the failure involved both bedrock and glacier ice, with a descent of more than 1 km into the valley below [56]. The available source interpretations do not independently resolve the thickness of each component or the sequence of fragmentation during the descent. These dimensions should therefore be distinguished from the assumed source thicknesses used in runout simulations [11].
4.3.2. Multi-Source Digital Elevation Models and Pre-Event Topographic Baselines
The pre-event topographic resources include the High Mountain Asia 8 m DEM mosaics [55] and Berthier’s Pléiades-derived source-area DEM [63]. The HMA product combines imagery acquired during 2002–2016. Berthier’s version 2 deposit, released on 23 September 2026, provides a merged 2 m DEM from a tri-stereo acquisition on 13 October 2019 and corrects an approximately 10 m horizontal offset in the preceding version. Its intermediate resolutions represent processing of the same acquisition, rather than a series of independent elevation epochs.
Copernicus GLO-30 provides a regional elevation surface used in the numerical reconstructions [10,11]. It is a digital surface model derived primarily from 2011–2015 TanDEM-X acquisitions, with older products used for gap filling. Its EGM2008 vertical reference differs from the WGS84 ellipsoidal heights of the HMA and Berthier products. Comparisons and elevation differences require those reference systems, acquisition dates and source resolutions to be reconciled before interpreting change.
4.3.3. Regional Cryospheric Change and Interpretations of Slope Preconditioning
Silwal et al. [9] provide a long-term regional context through reconstructed glacier outlines, elevation changes and climate records for the Langtang catchment. Their estimated glacier-area loss of 78.46 ± 4.38 km² between the Little Ice Age and 2023 corresponds to approximately 41% of the reconstructed initial area. These catchment-scale changes support investigation of deglaciation and slope adjustment but do not demonstrate debuttressing at the 2026 failure surface.
Carlà et al. [56] compare eleven very high resolution optical images acquired between March 2020 and August 2026. They describe broadly stable glacier extent and main crevasse patterns alongside pre-existing incisions, cracks and depressions in the exposed bedrock, interpreting the failure as a deep-seated rock-slope instability that carried the overlying ice. Their study is a visual morphological interpretation, not an offset-tracking measurement or a direct test of basal sliding. The supporting imagery is available from the authors on request.
The climatic archives use different products and averaging windows. Wang, Mi and Lin [31] provide daily NASA POWER/MERRA-2 records for five grid cells during 1981–2026. At the source grid cell, their derived June–August 2026 anomaly is +0.74°C relative to 1991–2020, with a standardised anomaly of 2.33; that seasonal mean includes days after the collapse. Their cumulative positive-degree-day total through 26 August is 546.07°C·d, exceeding the previous maximum of 539.73°C·d in 2025. These are grid-based thermal indices, not measurements of fracture-water pressure or a continuously elevated freezing level.
The World Weather Attribution report [30] considers regional warming and conditions favourable to melting using gridded products and locally adjusted station temperatures. It states that permafrost measurements are unavailable from the valley and the Langtang catchment. Thus, the climatic evidence can inform hypotheses about long-term slope preconditioning without establishing the subsurface thermal history or immediate failure process.
Gujree [58] tests the presence of a pre-existing lake using inventories and multi-temporal water observations, finding no inventoried lake within 6 km of the mapped source. The analysis describes limits related to image resolution, observation timing and unobserved water storage. These results constrain the pre-existing-lake explanation within the coverage of the available observations, while leaving transient or otherwise undetected water storage unresolved.
4.3.4. Precursory Deformation Dynamics and Radar Detection Limits
The displacement record of Wang et al. [8] was derived from Sentinel-2 optical imagery, using enhanced pixel-offset tracking with two acquisition sets covering the long-term history and the final pre-failure period. The reported acceleration began in January 2026, when the outlet hanging glacier diverged from the adjacent main glacier. This kinematic result and Carlà et al.’s [56] visual assessment of glacier extent concern different observables and can be considered together without equating a stable outline with an absence of motion.
Sah [59] examines Sentinel-1 GRD backscatter along a single orbit, using five pre-event acquisitions between 29 June and 16 August 2026. The study reports no detectable precursor above its approximate 1 dB detection limit at the available 12-day sampling interval. This is an amplitude-change analysis, rather than an interferometric measurement of displacement or coherence. Its negative result is bounded by the acquisition geometry, sampling and detection limit and does not establish that slope deformation was absent.
Comparing these studies requires attention to what each technique measures and where it is sensitive. Surface displacement, optical morphology and radar backscatter are not interchangeable indicators of instability. The catalogue can support subsequent testing by preserving acquisition dates, processing choices and mapped areas, while leaving the physical interpretation and warning performance to analyses designed for those purposes [8,56].
4.3.5. Scarp Geometry, Runout Path Kinematics, and Volumetric Loss Divergence
Published source boundaries are not directly interchangeable. Carlà et al. [56] describe a source area of approximately 1 km² from very high resolution imagery, whereas the UNOSAT detachment mask used in the Huang and Park archives covers approximately 1.96 km² [10,11]. Park also reports a separate rapid estimate based on a 0.6552 km² source area. A comparison of released volumes must retain the footprint and thickness assumptions associated with each estimate.
Xu [37] summarises an approximately 22 km path and a drop of about 3,300 m to the border corridor. Such geometric measures describe runout and can be used to compare source interpretations, but an apparent reach ratio does not identify a material friction coefficient or establish lubrication by meltwater, air or fine sediment. Park [11] treats effective resistance as a model parameter whose interpretation depends on the adopted terrain and source scenario.
The volume and mass estimates address different quantities. Carlà et al. [56] use empirical area–volume scaling to suggest a rock volume from 10⁷ to more than 10⁸ m³, excluding the overlying ice. Park [11] adopts a 35.42 million m³ release as a modelling scenario and explicitly avoids treating it as an independently measured volume. Huang et al. [10] derive a preferred mass estimate of 1.33 × 10¹² kg from peak seismic force and an empirical scaling relation. Neither dividing that mass by an assumed density nor adding an unmeasured entrainment contribution yields a verified bulk volume of 500–600 million m³.
4.3.6. Valley Floor Jamming, Barrier Lake Impoundments, and Breaching Morphology
Post-event accounts document a main barrier lake and a possible smaller upstream impoundment. Xu [37], citing a Ministry of Water Resources radar survey, reports a main dam approximately 60 m high, 1,100 m long and 300 m wide, with a lake area of approximately 0.1 km² and an estimated storage of 2.2 million m³. These values retain the status and provenance of the reported survey; they are not measurements newly derived by this review.
Xu [37] reports identification of the smaller suspected impoundment in X-band SAR imagery on 28 August. The mapped water extent, an estimated storage volume and the time at which a lake was observed are distinct constraints. A post-event water polygon alone does not determine maximum storage or establish when a blockage formed.
The same account places the beginning of main-lake overflow at 17:50 Beijing time on 28 August (09:50 UTC; 15:35 NPT), with reported outflow of approximately 50 m³/s against inflow of 23 m³/s [37]. The later overflow cannot explain the initial 26 August flood, although a separate rapid blockage-and-release process remains unresolved.
4.3.7. Catalogued Terrain and Cryosphere Assets
Table 8 records the terrain, glacier and impoundment resources relevant to source-area investigation. Acquisition dates, publication dates and processing versions are retained separately, and catalogue entries with unresolved file-level metadata remain identifiable as such.
4.3.8. Observational Bottlenecks in Post-Disaster Geodetic Quantification
Cloud cover limited the spatial completeness of early post-event optical mapping, but it did not prevent every useful acquisition. Carlà et al. [56] include a 27 August very high resolution image, and Park [11] discusses corrected stereo measurements from cloud-free parts of the valley. Those partial products should not be equated with a complete source-area elevation difference. Further geodetic work depends on the coverage, co-registration, vertical reference and dates of suitable paired surfaces.
4.4. Hydrology, Hydraulics, and Valley Flood Routing
4.4.1. Catchment Hydrology and Antecedent Meteorological Baselines
The hydrological resources follow the cascade from the upper tributary and border corridor into the Bhote Koshi–Trishuli–Narayani system. Their geographic support differs: catchment reanalyses describe regional conditions, station records describe local stage responses, and numerical models represent specified reaches. Retaining those distinctions is necessary when using the catalogue to investigate flood generation and downstream propagation [11,30,31,37].
The retrieved climatic analyses do not establish an extreme rainfall trigger. Xu [37] leaves the quantitative contribution of antecedent rainfall unresolved, while the World Weather Attribution report [30] finds the examined seasonal precipitation indices within their historical variability and notes the absence of immediately preceding station rainfall data for its analysis. Those limitations leave the local rainfall contribution less well constrained than the regional temperature conditions.
The Wang, Mi and Lin archive [31] supplies daily NASA POWER/MERRA-2 temperature and precipitation series for 1981–2026, together with derived thermal indices and reproducible analysis code. The World Weather Attribution report [30] evaluates temperature changes using a different combination of observations and models. Their products can inform subsequent hydrological studies, but a regional air-temperature anomaly does not quantify meltwater delivery, valley-bed saturation or initial flow water content.
4.4.2. Debris Dam Emplacement and Outburst Hydrograph Mechanics
The reported barrier-lake geometry and chronology are summarised in Section 4.3.6. For hydraulic analysis, the central distinction is between the main lake’s documented later overflow and any short-lived storage or release during the initial avalanche passage. Xu [37] finds that the open observations cannot separate an avalanche-emplaced surge from a rapid partial dam release on 26 August.
Park [11] tests a reconstruction without prescribing an additional release from a temporary landslide dam. It meets the upper timing windows and broadly represents two downstream stage records within its adopted source and channel scenario. The study explicitly states that this agreement neither excludes a short-lived blockage nor establishes how the material acquired its mobility.
A breach hydrograph for a hypothesised early blockage would require independently constrained storage, dam geometry and erosion parameters. The later overflow rates reported by Xu [37] describe a different stage of the cascade and cannot supply an observed or calibrated discharge pulse for the initial flood.
4.4.3. Mixture-Flow Modelling and Timing Constraints
Park’s revised depth-averaged model [11] uses a shared velocity for the rock–ice–water mixture, with an effective Coulomb resistance term and a velocity-dependent term. It does not resolve excess pore pressure, granular contact stresses or phase separation. For the reference 35.42 million m³ release scenario, low effective resistance is compatible with the upper timing windows, but the fitted coefficients are conditional on the imposed source and terrain.
The revised calculations conserve mass during ice melting and examine sensitivity to the fraction of diagnosed mechanical energy transferred to heat. The reference calculation melts 69% of the initial ice within three minutes under the maximum-transfer scenario, compared with 39% when that transfer is halved [11]. These are model outputs: the study notes that ice-particle sizes were not measured and that an energy-limited cell calculation does not establish the rate of melting of real blocks or the presence of a lubricating film.
The border CCTV frame used by Park [11] corresponds to 463 s after the USGS origin, with a working comparison window of 373–553 s to allow for clock and front-picking uncertainty. Combined with the approximate path length, it indicates rapid passage through the upper corridor. The video, seismic radiation and telemetry losses nevertheless have different timing uncertainties and cannot be treated as independent exact validations of a single velocity or resistance value.
4.4.4. Downstream Hydrodynamic Attenuation, Stage Surges, and Hydrograph Routing
Downstream records distinguish the onset of stage rise, threshold crossings, telemetry loss and peak flow. Park [11] uses observed rise windows of 1.6–2.2 h at Galchhi, 4.5–5.2 h at Kali Khola and 5.88–6.05 h at Devghat, measured from the USGS origin. Devghat’s peak occurs later, near 16:00 NPT. The official operational chronology reports information reaching the forecasting service at specified times; those reports should not be substituted for measured leading-edge arrivals when calculating travel speeds.
The agency-derived stage series reproduced by Park [11] show rises of approximately 8.8 m at Galchhi, 5.6 m at Kali Khola and 1.9 m at Devghat. These are changes relative to each station’s pre-event level, not flow depths or a continuous surveyed trimline envelope. The revised model reproduces the nearer two records more closely than the Devghat amplitude, where its selected routing gives a 3.75 m rise.
The official technical report estimates a peak discharge of 5,850 m³/s at Devghat at approximately 16:00 NPT. It reports a total water volume of 57.40 million m³ and an excess volume of 19.96 million m³ above an assumed baseflow of 2,600 m³/s during the analysed flood interval. Its preliminary assessment assigns a return period of approximately 2–3 years [69]. These water-volume estimates do not quantify sediment entrainment or establish a detached source volume.
4.4.5. Gauging Infrastructure Destruction and Early Warning Latency Failure
The official technical report records losses of upstream gauging capacity during the flood. The reported times of last data reception or missing transmissions constrain the operational record, but do not by themselves specify the time or physical mode of station destruction. Park [11] accordingly represents the Rasuwagadhi and Syabrubesi outages as intervals and treats their relation to front arrival as conditional.
The operational report places the initial warning at 09:15 NPT and the mass SMS transmission at 09:16, approximately 38 and 39 minutes after the USGS origin, respectively. This chronology supports comparison with the much earlier passage through the upper corridor, while downstream locations had different potential lead times. The available timestamps do not partition the delay into measured durations of manual verification, institutional escalation and message delivery.
The report also records information received from China concerning the residual blockage. The available accounts therefore do not support describing cross-border communication as wholly absent. Evaluating warning performance requires the timing and content of messages, the locations they concerned and the observations available to each authority, rather than inferring the absence of a protocol from damage alone.
4.4.6. Catalogued Hydrology, Hydraulics, and Meteorology Assets
Table 9 records the hydrological observations, climatic archives and modelling resources identified for this domain. Model versions, observation definitions and access conditions are retained because code, derived outputs and operational reports do not provide equivalent forms of evidence.
4.4.7. Observational Deficits and Hydrodynamic Monitoring Vulnerabilities
The loss of upstream telemetry and the differing meanings of downstream records limit direct reconstruction of the flood hydrograph. Future analyses can use the preserved records to examine station survivability, timing uncertainty and the effect of changed channel geometry on stage–discharge relations. The catalogue supports that work by documenting the available observations and their provenance; it does not establish a tested replacement monitoring system [11].
4.5. Spaceborne Earth Observation and Remote Sensing
4.5.1. Multi-Constellation Sensor Architecture and Tasking Timeline
Emergency mapping resources were produced through several institutional channels. The International Charter records activation 1052 on 26 August 2026, and Sentinel Asia records activation on the same date under GLIDE FF-2026-000162-NPL. Copernicus EMSR927, UNOSAT and HOT supplied additional mapping resources. Activation records, acquired satellite scenes and delivered damage products are distinct evidence types and should be charted separately [76,77,78,81,82].
The verified resources combine optical imagery, radar observations and derived vector products with different spatial and temporal support. Event-bracketing Sentinel-2 and Landsat-9 observations support source-sector interpretation, while Sentinel-1 backscatter supports comparisons under cloud cover [62]. Product-level acquisition dates, processing methods and access conditions must be retained because the availability of one scene does not establish continuous or cloud-free coverage of the full cascade [74,77].
4.5.2. Optical Cloud Cover Constraints and Spatial Resolution Tradeoffs
Cloud, shadow and missing pixels limited interpretation of the high-altitude source in the early optical record. Li [62] identifies Landsat-9 imagery from 26 August and Sentinel-2 imagery from 27 August but reports incomplete visibility of the changed surface. The available evidence therefore supports a spatially variable observation gap; it does not establish complete optical obscuration of the entire source and upper runout for a uniform 48-hour period.
UNOSAT’s preliminary extent products used PlanetScope imagery acquired on 26 August and Sentinel-2 imagery acquired on 27 August. These records demonstrate that usable optical observations were available for parts of the affected corridor during the first two days, although the mapped extent and the visibility of the source headwall were different observational problems [78].
Copernicus map documentation identifies WorldView-3 imagery for Syapru Besi and Legion imagery for Timure, both acquired on 27 August at 05:05 UTC with a stated resolution of 0.3 m [77]. These acquisitions supported local visual damage grading, but image resolution alone does not establish positional accuracy or complete source coverage. Acharya and Paudel [57] separately report a 27 August WorldView-3 stereo footprint that stopped approximately 0.6 km west of the interpreted source.
Retrospective optical feature tracking also contributes to the assessment of pre-event motion [8]. Its evidentiary value depends on the tracked surface, image intervals and measurement uncertainty. A motion trend identified after the disaster should be retained as an attributed kinematic result rather than treated as a prospectively validated warning threshold.
Pradhan [60] tested the proposed Sentinel-2 shortwave-infrared precursor against the glacier’s historical record and matched non-collapsing glaciers. The reported 2026 value was close to the historical mean and did not establish a distinctive pre-collapse wetness anomaly. The study supports the need for temporal and regional controls; it does not identify atmospheric moisture fluctuations as the demonstrated cause of the spectral feature.
4.5.3. Radar Backscatter and the Limits of Precursor Detection
The REACH/IMPACT screening product compared a Sentinel-1 acquisition from 28 August with a one-year pre-event baseline. It standardised the radar backscatter change, averaged the anomaly over a 50 m neighbourhood and restricted the search to pre-event building footprints with a 30 m buffer. The resulting high-confidence layer identifies unusual change that may be associated with damage; it is not a direct observation of structural failure [74].
Sah [59] analysed Sentinel-1 ground-range-detected backscatter from a single relative orbit, rather than interferometric displacement or coherence. The study found no detectable pre-event amplitude precursor at its stated sensitivity and sampling interval, while detecting substantial post-event change near the source. This is a method-specific non-detection and cannot be generalized to an absence of deformation or universal radar blindness on steep headwalls.
Asadollahi [61] combined Sentinel-1, Sentinel-2, MODIS snow cover, ERA5-Land precipitation and other spatial baselines in a retrospective early-warning assessment. The heuristic index remained below the chosen alert threshold, but its weights and threshold were not independently calibrated as an operational warning system. The result concerns detectability in this retrospective configuration and does not establish either a reliable forecasting capability or an operational false-alarm rate.
4.5.4. Value-Added Emergency Damage Delineations and Impact Mapping
Copernicus EMSR927 provides grading products for AOI 01 Syapru Besi, AOI 02 Timure, AOI 03 Bidur and AOI 05 Phosretar. The first two use 27 August WorldView-3 and Legion imagery, respectively. The AOI 03 monitoring product combines PeruSAT-1 imagery from 27 August with Resurs-P imagery from 28 August, while the retrieved AOI 05 product uses Pléiades imagery from 31 August. These visually interpreted products distinguish damage grades within their mapped coverage; they do not determine the physical failure mechanism of every affected structure [77].
UNOSAT published separate preliminary mudflow/rockflow extent assessments for Rasuwa and Nuwakot and a combined impact assessment. The combined product reported approximately 37 km² affected within an analysed area of approximately 350 km², with roads and buildings potentially exposed to or near the mapped extent. The provider explicitly states that the analysis had not been validated in the field; exposure counts should therefore not be reported as confirmed structural losses. A separate UNOSAT barrier-lake product (4260), based on Cartosat-3 imagery acquired on 28 August and published on 31 August, identifies two newly formed lakes as a preliminary interpretation [78,79].
HOT’s fAIr product provides AI-scored damage classes for OpenStreetMap building footprints within the available post-event SkySat tile in the upper Trishuli–Bhote Koshi area. Its coverage is limited to that image footprint and does not represent the full affected corridor. It should be distinguished from the broader HOT flood-area dataset, which contains mapped infrastructure and a separate volunteer-reported bridge assessment [75,76].
Li [62] reports a preferred interpreted changed/source surface of 1.01 km², with alternative envelopes of 0.49–1.84 km², and a representative source-to-port route of 21.8 km. The study uses the 37.354 km² UNOSAT affected footprint and reports 695 building points and 15.671 km of roads graded destroyed in delivered rapid maps. These quantities respectively describe surface interpretation, route geometry and mapping classifications; they are not a measured detachment volume or an exhaustive field-verified loss inventory.
4.5.5. Catalogued Spaceborne Earth Observation Assets
Table 10 records the Earth-observation resource and product families relevant to this synthesis. Acquisition manifests, derived vector layers and data-bearing reports are identified separately, and unresolved access, licensing or coverage information is stated rather than inferred from the provider’s institutional status [74,75,77,78].
4.5.6. Systematic Bottlenecks in Mountain Disaster Remote Sensing
The reviewed optical products show that cloud effects must be evaluated at the location and acquisition scale. Imagery usable for downstream mapping may still obscure the source or part of its perimeter [62]. A fixed 24–48-hour response blackout cannot be inferred from cloud percentages or scene availability alone; a defensible assessment requires the actual acquisition times, usable footprints and release times of the relevant products [78].
Radar reduces dependence on cloud-free optical views, but its interpretation remains dependent on terrain, viewing geometry, scattering conditions and the chosen processing method. The reviewed amplitude analyses support post-event change detection while placing method-specific limits on precursor detection [59]. Evaluating additional viewing directions or complementary sensors is therefore a research priority, rather than a demonstrated requirement for a particular replacement satellite architecture [74].
The spectral and multisensor studies also show why retrospective anomalies require controls. Pradhan [60] compared the proposed optical signal with historical and regional baselines, whereas Asadollahi [61] assessed a heuristic index without independent operational calibration. Their results support explicit reporting of detection limits, control populations and threshold selection before any warning performance is claimed.
The reviewed products are distributed across multiple repositories and differ in format, coverage, release timing and reuse terms. A catalogue can make these differences visible by preserving product identifiers, provenance and links to the original metadata. Standardised discovery interfaces could improve retrieval, but this review did not measure whether repository or coordinate-system differences delayed the emergency response [74,76,77,78].
4.6. Exposure, Infrastructure, and Built Environment
4.6.1. Strategic Cross-Border Trade Routes and Border Control Facilities
The Rasuwagadhi–Gyirong crossing and adjoining settlements concentrate transport, customs and commercial assets close to the river corridor. Rapid mapping products document damage in this area, while Bhattarai and Adhikari [39] summarise reports of extensive disruption to the border complex and associated trade. These sources establish the importance of exposure at the crossing but do not resolve a single site-specific impact depth or a structural failure sequence for each facility [77].
Interruption of the crossing affected freight movement and access along the corridor [39]. Quantifying the resulting economic loss requires dated customs, transport and business records that separate damaged assets from foregone activity and recovery costs; these quantities cannot be derived from mapped damage extent alone.
4.6.2. Cascading Destruction across the Trishuli Hydropower Complex
Reports assembled by Bhattarai and Adhikari [39] identify hydropower and transmission infrastructure among the affected sectors. Their synthesis cites preliminary estimates that combine operating plants with projects under construction. These categories must remain separate because installed capacity, capacity under construction and generation temporarily unavailable describe different consequences.
Assessing failure modes at individual plants requires inspection records that identify the affected structure, the observation date and the basis of the damage assessment. The satellite products locate reported impacts, while operator investigations are needed to establish internal equipment damage, the mechanism of failure and restoration requirements [76].
A reconciled official ledger of generation outages was not recovered in this review. Future updates should link any capacity total to a dated operator record and state whether it represents nameplate capacity, actual output or construction exposure. Grid-frequency effects, load shedding and restoration costs require their own operational evidence.
4.6.3. Transportation Lifeline Severance and Structural Bridge Failures
The Planetary Response Network assessed primary and secondary roads in Rasuwa, Nuwakot and Kathmandu and reported 22 blockage locations in its 28 August dataset, including 19 described as severely flooded. NH42 was among the affected roads. These point observations establish transport disruption within the assessed area but do not measure a continuous 48 km reach of destroyed road or the thickness of deposited material [80].
The HOT flood-area dataset includes a separate bridge assessment based on volunteer field reports, with reported condition and deck length where recorded. This information can be compared with rapid satellite mapping to identify damaged crossings and access constraints. The available records do not support assigning boulder impact, hydrodynamic shear or foundation failure as the cause of every mapped bridge loss [76,77].
4.6.4. Human Casualties, Settlement Inundation, and Demographic Exposure
Humanitarian situation reports document severe loss of life, displacement and disruption of public services, but their figures must be tied to a reporting date and geographic scope. UNICEF’s report of 31 August, citing NDRRMA, listed 903 deaths and 4,247 missing persons and explicitly described these as preliminary estimates subject to revision. It also reported damage to schools and health facilities. These figures are a dated humanitarian snapshot, not a final event total or a verified extract from a ward-level BIPAD casualty register [70].
Displacement estimates also depend on the unit and survey coverage. IOM’s emergency tracking for 27–31 August covered 15 sites in Dhading, Nuwakot and Rasuwa and estimated 4,288 affected households, of which 2,886 were displaced. These household estimates should not be converted into a basin-wide count of displaced individuals without an explicit population basis. A reconciled event-wide economic loss estimate was not established by the sources reviewed [71].
Acharya and Paudel’s retrospective reconstruction [57] places the 09:16 mass-SMS dispatch after their inferred arrival interval at Syabrubesi and before that at Betrawati. These lead times are conditional on the reconstruction and should be distinguished from agency-reported telemetry-loss times. The study identifies a warning-time deficit near the source but does not estimate a causal multiplier of mortality; flow severity, exposure, message receipt and the ability to respond require separate assessment.
4.6.5. Catalogued Exposure and Infrastructure Assets
Table 11 brings together infrastructure and humanitarian information relevant to the exposed corridor. Mapped exposure, interpreted damage, field-reported condition and narrative situation reporting provide different types of evidence; their dates, coverage and production methods determine how they can be combined [70,76,77,78,80].
4.6.6. Infrastructure Vulnerability Lessons and Resilient Mountain Engineering
The reviewed products show that transport and energy assets were concentrated within the affected corridor. They do not establish the original design loads, safety factors or failure sequence of each structure. The event therefore supports examining debris impact, sedimentation, scour and blockage alongside conventional flood loading, but it does not demonstrate that all affected infrastructure was designed to Q100 or that flood-frequency analysis itself was the cause of failure [76,77].
Reconstruction studies could use the catalogued topography, impact mapping and operator records to test siting, protection and emergency-operation options under specified cascade scenarios. Setbacks, raised openings, intake controls and sediment-management works require site-specific feasibility and load assessment. This scoping review does not establish universally safe elevations or demonstrate the effectiveness of a particular protective design.
4.7. Forensic Scientific Literature, Early Warning Protocols, and Emergency Governance
4.7.1. Epistemic Evolution and the Rapid Forensic Literature Corpus
The available literature combines peer-reviewed studies, preprints and operational reports that address different parts of the cascade. Pre-event glacier observations [8,9], rapid mapping and source reconstruction [62], and warning chronology [57] provide complementary evidence. Their results should be distinguished by method and review status rather than treated as a single independently validated event reconstruction.
The preprint literature includes source and process interpretation, analysis of competing explanations, warning chronology and tests of satellite detectability [57,58,59,60,61,62]. These contributions are useful for locating data and hypotheses, but they do not resolve all source parameters or validate proposed operational systems. In particular, the backscatter study [59] addresses amplitude-based detectability rather than interferometric coherence or displacement. Agency publications contribute observation and response records with their own purposes and limitations. The official hydrological technical report documents gauge observations and warning dispatches; UNOSAT and Copernicus provide preliminary spatial assessments; and UNICEF and IOM describe humanitarian needs and response. The catalogue should preserve the date, scope and revision status of each record rather than combine provisional totals into a single apparently final account [69,70,71,77,78].
4.7.2. Systematic Evaluation of Competing Causal Hypotheses
The available evidence weakens some early explanations without uniquely identifying the trigger. Gujree [58] found no inventoried glacial lake within 6 km of the selected source location and used historical water observations to test a conventional lake-outburst explanation. The analysis nevertheless leaves limitations associated with small ponds, short-lived impoundments and water stored within or beneath ice.
The precipitation tests reported by Li [62] place the selected antecedent accumulations below the study’s wet-extreme threshold in both IMERG and ERA5-Land, across the tested windows and spatial supports. Agreement in relative ranking does not remove uncertainty in the precipitation amounts over the source slope or exclude unresolved local rainfall. The evidence therefore does not justify a categorical rejection of every rainfall contribution. Pre-event motion and structural stability also require careful separation. A stationary terminus would not, by itself, exclude internal deformation, local sliding or changes in the supporting rock mass. Competing mechanisms should be evaluated against the actual displacement measurements and structural observations, with their spatial support and uncertainty retained [8,56].
Taken together, the observations support a connected rock–ice mass-movement and downstream flood/debris-flow cascade, while the immediate trigger and relative contributions of rock, ice and water remain incompletely constrained [58,62]. Proposed roles for warming, fractured bedrock, water pressure and entrainment should remain attributed interpretations unless supported by direct measurements or independently tested models.
4.7.3. Forensic Evidence on Warning Dissemination and Operational Latency
Warning performance varied along the river. The agency report documents message dispatch and surviving downstream observations, while Acharya and Paudel [57] reconstruct local arrival intervals from the available records. Their reconstruction indicates a warning-time deficit near the source and potential lead time farther downstream. These inferences depend on the selected chronology and do not imply that all stations or settlements experienced the same warning conditions [69].
Using the USGS source time of 08:37:10 NPT and the reported mass-SMS dispatch at 09:16, Acharya and Paudel [57] reconstructed a trigger-to-dispatch interval of approximately 38.8 minutes. This interval includes detection and subsequent recognition, communication and confirmation stages; it is not evidence of a mandated 25–45-minute administrative procedure. Local warning lead times require additional arrival estimates and should retain the differences between agency timing entries and retrospective station-based reconstructions [69]. The official report documents gauge losses, but its notification, final-transmission and loss entries should not be read as interchangeable flood-front timestamps. Acharya and Paudel [57] separately infer arrival intervals from last normal and first elevated or missing observations. Reconciliation of station identifiers and observation times is therefore required before estimating local propagation speeds or treating a last report as the exact moment of destruction [69].
4.7.4. Transboundary Data Governance and International Emergency Coordination
The source and downstream corridor cross a border landscape in which a failure originating in Nepal affected the Lhende–Bhote Koshi system and communities on both sides of the Nepal–China frontier [57,58]. Source detection, communication about an impoundment, downstream flood tracking and humanitarian coordination are separate information needs. Their institutional requirements should be evaluated individually rather than inferred from a simplified cross-border flow narrative.
Gujree [58] describes existing China–Nepal cooperation on monitored glacial lakes and meteorological information. Acharya and Paudel [57] argue that detection of this source inside Nepal would not itself require a cross-border agreement, while information on a blockage or lake in China would create a separate exchange requirement. The evidence thus identifies questions about coverage and operational communication, not a demonstrated complete absence of bilateral cooperation or telemetry exchange. Humanitarian reports document a government-led response supported by international agencies. UNICEF’s 31 August situation report describes its work in water, sanitation and hygiene, health, nutrition, education and protection, while IOM’s displacement tracking records affected and displaced households within surveyed sites. These reports support assessment of needs and response activities, but they do not verify every rescue deployment or coordination claim made in preliminary accounts [70,71].
4.7.5. Catalogued Forensic Literature and Governance Assets
Table 12 records the scientific and humanitarian resources relevant to the synthesis, with publication status and unresolved source identities made explicit. A bibliographic entry is not treated as verified merely because it names a repository or contains a DOI; the identifier must resolve to the cited work and its claims must be checked against the source.
4.7.6. Evidentiary Synthesis Gaps and Multi-Sectoral Governance Priorities
Important gaps remain between the resources available and the quantities needed for a complete reconstruction. Source-sector visibility and alternative mapped envelopes limit geodetic interpretation, while warning analyses lack complete records of message receipt and public response [57,62]. Product provenance and version information are therefore necessary to distinguish directly observed quantities, derived estimates and hypotheses that later evidence may revise.
Further work could improve the exchange and joint interpretation of source-monitoring, hydrological and response information. The catalogue can support this work by maintaining traceable records and versions, while operational benefits require testing with the responsible agencies and affected communities. Repository federation or a data-sharing agreement alone cannot establish that a warning will reach people with sufficient time to act.
5. Discussion
5.1. Coupled Multi-Hazard Cascade Mechanics and Physical Feedbacks
5.1.1. Governing Mechanism: Compound Cryosphere–Bedrock Failure and Thermal Preconditioning
The catalogued source studies support a coupled rock-and-ice failure, but differ in how they interpret its preconditioning. Wang et al. [8] identify accelerated surface displacement from January 2026, whereas Carlà et al. [56] emphasise pre-existing bedrock structures and broadly stable glacier morphology. These findings concern different observables and do not determine a unique sequence of subsurface fracture, thaw and water-pressure changes. The long-term glacier and climate records provide context for those interpretations. Silwal et al. [9] document approximately 41% glacier-area loss across the Langtang catchment since the Little Ice Age and elevation-dependent warming during the recent observational period. Transferring those regional trends to a particular failure surface requires additional information on local geometry, ground temperature and hydrology; the World Weather Attribution report [30] notes the absence of local permafrost measurements. The event-period climatic estimates also depend on scale and reference period. Wang, Mi and Lin [31] report a +0.74°C June–August anomaly and a standardised value of 2.33 at their NASA POWER/MERRA-2 source grid cell relative to 1991–2020. Wang et al. [8] identify a cold June followed by warm July and August in ERA5-Land. Both records identify late-season warmth, but their different spatial support and averaging windows must be retained when interpreting conditions at the slope. At the source, the stable outline described by Carlà et al. [56] can coexist with the surface displacement measured by Wang et al. [8], because morphology and displacement describe different aspects of glacier change. Together, the studies identify observable changes and structural features that future analyses can test against competing failure models. Neither directly measures basal sliding, joint pressure or the sequence of subsurface fracture.
5.1.2. Dynamic Momentum Exchange, Seismological Inversion, and Fragmentation Energetics
The Huang et al. [10] archive supplies the data products and code needed to examine a long-period single-force reconstruction. It tabulates 24 solutions, including the preferred solution, derived from 80–150 s vertical Rayleigh waves at 47 stations. Because the force-support interval and other inversion choices affect the recovered history, interpretation should follow the identified solution and retain its assumptions when comparing the alternatives. In the preferred archived solution, peak horizontal and resultant forces are approximately 2.44 × 10¹² N and 2.46 × 10¹² N near +104 s, followed by a horizontal-force reversal near +205 s. These are forces exerted on the Earth, with directions opposite to the corresponding centre-of-mass acceleration under the single-force representation. The inversion does not directly resolve a 105-second free fall or identify the precise instant and geometry of valley-floor impact. The corresponding mass estimate of 1.33 × 10¹² kg follows an empirical peak-force scaling, and the alternative solutions span 0.53–2.04 × 10¹² kg under the same relation [10]. This spread reflects inversion choices and does not exhaust the uncertainty in the scaling itself. The estimate should therefore be compared with geodetic volumes and flow scenarios as a model-dependent constraint, rather than converted into a definitive entrained volume. The accompanying r.avaflow simulations [10] and Park’s mixture-flow calculations [11] explore different imposed source scenarios. Their source volumes, phase representations and comparison criteria must be retained when interpreting agreement with observations. Park’s revised preprint withdraws the earlier interpretation of an incomplete momentum derivative as an independent seismic force and treats the thermal calculation as a sensitivity analysis, not direct evidence of frictional flash melting.
5.1.3. Mixture Flow Rheology, Ephemeral Damming, and Decoupled Breach Mechanics
Park’s revised model [11] supports low effective resistance within the tested source and terrain scenarios. It reproduces the upper timing windows with a single-velocity mixture formulation but does not determine a material yield strength, resolve pore pressure or prove a contact-melting mechanism. The substantial mismatch between simulated and observed stage rise at Devghat also means that agreement with the upper timing windows alone cannot validate the reconstruction of the entire cascade. Barrier-lake observations provide a separate constraint on the timing of water storage and release. Xu [37] reports an estimated main-lake volume of 2.2 million m³ and overflow beginning on 28 August. A lake volume alone does not define a safe or hazardous threshold, and the later mapped impoundment does not establish the volume or timing of any short-lived blockage during the initial avalanche passage. The chronology excludes the documented 28 August main-lake overflow as the cause of the initial 26 August flood. It does not separate an avalanche-emplaced surge from rapid temporary impoundment and release. Xu [37] leaves those contributions unresolved, and Park [11] explicitly states that a reconstruction without an imposed additional outburst does not exclude a short-lived blockage. Distinguishing those alternatives requires additional constraints on the timing and extent of temporary water storage.
5.2. Earth-Observation Coverage and Limits of Inference
5.2.1. Optical Visibility and Product Coverage
The optical record illustrates the difference between acquiring a scene and observing the feature needed for a particular inference. Li [62] documents event-bracketing Landsat-9 and Sentinel-2 scenes whose cloud, shadow and missing pixels interrupt source-sector comparison. Their value for identifying a changed area does not establish uninterrupted visibility of the detachment boundary or the fine structural features required for a rupture model. Beyond the source sector, UNOSAT used PlanetScope observations from 26 August and Sentinel-2 observations from 27 August for preliminary downstream mapping. The coexistence of useful corridor observations and incomplete source visibility argues for recording usable coverage by location and acquisition, rather than describing a uniform optical blackout across the disaster [78]. Very-high-resolution coverage must also be assessed against the intended measurement. The EMSR927 acquisitions support damage grading within their specified downstream areas of interest, whereas the Berthier archive [63] supplies a pre-event elevation surface for the avalanche source. Quantitative reconstruction of detached volume requires a compatible post-event surface covering that source, together with documented co-registration and elevation uncertainty [77].
5.2.2. Radar Measurements and Method-Specific Detection Limits
Radar observation is less dependent on cloud cover, but a non-detection has meaning only in relation to the measurement, geometry and sampling used. Sah’s backscatter analysis [59] did not detect a pre-event amplitude precursor under its specified test. It neither measured interferometric displacement nor established that motion was absent, and it should not be used to classify all steep Himalayan headwalls as unobservable by radar. REACH/IMPACT’s Sentinel-1 product illustrates how the measurement method determines the interpretation of a mapped anomaly. The provider compares the 28 August acquisition with a one-year baseline, applies a 50 m neighbourhood average and an absolute z-score threshold of 1.60, and limits the analysis to a buffered built-environment domain. The resulting unusual-change layer supports damage screening and prioritization of imagery or field checks. Confirming structural loss requires those additional observations [74]. Interpretation also depends on which radar observable a product contains: backscatter amplitude, interferometric coherence and line-of-sight displacement are distinct measurements. Sah’s analysis [59] concerns amplitude-based change; assessing coherence or displacement along the flow path would require the relevant interferometric pairs, orbit and processing information, terrain masks and validation observations. The source products should therefore remain identifiable by the measurement they actually contain.
5.2.3. Retrospective Signals and Prospective Warning Tests
Pre-event motion estimates can help identify instability retrospectively, but demonstrating an operational warning capability requires more than observing acceleration before one known failure [8]. The test must establish when the signal would have been available, whether it was distinguishable from non-failing motion, and how a threshold performs on independent events and controls. Those questions remain separate from the physical interpretation of the measured displacement. The spectral and multisensor studies address related questions about the distinctiveness and calibration of potential warning signals. Pradhan [60] finds that the proposed spectral precursor is not distinctive against the tested historical and regional controls, while Asadollahi [61] reports a heuristic index below an uncalibrated alert threshold. These analyses constrain the claims that can be made from particular retrospective indicators; they do not quantify the operational performance of a deployed early-warning system.
5.3. In Situ Monitoring Fragility and Transboundary Early Warning Gaps
5.3.1. Gauge Survival, Observation Intervals and Downstream Warning
The official hydrological report documents interruptions and losses at upstream hydrometric stations, together with surviving observations farther downstream. Acharya and Paudel [57] interpret the available ten-minute records as arrival intervals of 08:50–09:00 NPT at Syabrubesi and 09:20–09:30 at Betrawati. These are their reconstructed intervals, not exact times of station destruction. Agency timing entries differ in their naming and description of last reports or losses, so the two chronologies should not be merged without reconciling the underlying records [69]. A stage observation at an exposed settlement may arrive too late to warn that settlement but still contribute information farther downstream. In Acharya and Paudel’s chronology [57], the 09:16 mass-SMS dispatch follows the Syabrubesi arrival interval and precedes the Betrawati interval. This comparison remains conditional on the reconstructed arrival intervals. The dispatch-based lead times are upper bounds on available warning time; actual receipt and response were not measured [69].
Beyond arrival timing, scour and deposition can affect discharge estimation by changing the relation between water level and discharge during sediment-rich floods [34]. The reliability of a particular rating curve must be assessed from its calibration, the recorded stage and evidence of channel change. At Devghat, the agency’s reported discharge is a rating-curve estimate derived from stage observations, so the distinction between the observed water level and the calculated flow rate remains relevant to any subsequent routing analysis [69].
5.3.2. Institutional Alert Latency versus Physical Flood Wave Transit Times
Acharya and Paudel [57] reconstruct approximately 38.8 minutes between the USGS catalogue origin time and the first mass-SMS dispatch. That interval includes the time needed to detect and recognize the event as well as the subsequent communication and confirmation stages. Its significance for warning depends on location: arrival estimates can establish whether dispatch preceded the local flood, whereas effective evacuation time also depends on message delivery, comprehension and the ability to respond [69]. Humanitarian reports describe damage to communications and physical access that complicated the response. The hydrological agency separately records dispatching 679,295 text messages at 09:16 NPT. These records describe different parts of the warning process. Assessing how many people received timely, actionable information requires delivery and response evidence in addition to a count of dispatched messages [69,70].
5.3.3. Monitoring Coverage and Transboundary Information Exchange
The transboundary setting creates several distinct monitoring needs. Detecting the initial failure at a source within Nepal differs from exchanging information about an impoundment in China or tracking the flood farther downstream [57,58]. Existing cooperation on monitored lakes and meteorological information provides part of this context, but its coverage and operating procedures must be assessed against the information required for this type of cascade. An operational assessment should reconstruct which observations reached each agency, when decisions were made and which messages reached exposed populations. Without that chain of evidence, the effects of cross-border exchange, domestic processing delays and local communications cannot be isolated. Improved data exchange therefore remains a potential intervention to evaluate, while the contribution of existing information gaps to evacuation failures remains to be established.
5.3.4. Complementary Source Detection and Warning Design
Source-sensitive monitoring could complement river-stage observations by detecting a disturbance before it reaches an upstream gauge. Acharya and Paudel [57] explore that possibility using assumed source-to-warning budgets of two and five minutes. These counterfactual calculations identify potential gains to investigate; operational evaluation would need to measure detection reliability, false alarms, communication delays and the time available for people at each downstream location to act. At the network level, monitoring design should consider sensor survival, coverage, redundancy and the information needed at successive locations. Seismic or other source observations, protected hydrometric stations and non-contact instruments may provide complementary measurements, but their suitability depends on site conditions and tested performance. Shared operating procedures and data exchange should be evaluated alongside message delivery and community response, while maintaining the useful functions of existing hydrometric networks [69].
5.4. Infrastructure Vulnerability and Cascading Economic Exposure
5.4.1. Run-of-River Hydroelectric Cascade Fragility and Failure Modes
The reports reviewed identify hydropower facilities and transmission infrastructure among the affected assets [39]. Because the corridor contains both operating installations and projects under construction, assessments must distinguish interruption of generation from damage to construction works and transmission links. A dated operator ledger would allow the reported impacts to be reconciled across facilities and connected to the duration of lost output [76]. Satellite damage grades and situation reports can identify affected facilities, but they cannot establish internal mechanical damage to turbines, valves or penstocks. Quantifying abrasion, blockage, equipment loss and restoration needs requires operator inspections and maintenance records. These data remain necessary inputs for an engineering assessment rather than outcomes demonstrated by this scoping review [77]. Understanding the consequences for engineering design requires connecting those observations to the loads and failure modes at each facility. Sediment transport, debris impact, scour and blockage can add to the effects represented by water discharge alone. Flood-frequency analysis and specified cascade scenarios can therefore contribute complementary information, provided that original design assumptions, channel conditions and damage investigations are available for comparison.
5.4.2. Transport Lifeline Severance and Cross-Border Economic Disruption
The transport datasets address disruption at the scale of individual observations. The Planetary Response Network’s 28 August release locates road blockages, while HOT’s bridge layer records reported conditions at crossings. Interpreted within their assessed areas and observation dates, these records can help reconstruct access constraints. Estimating the total length of road destroyed or the duration of trade interruption would require a more complete, reconciled transport assessment [76,80]. Transport and border disruption can produce economic effects beyond direct physical damage, as discussed by Bhattarai and Adhikari [39]. A defensible economic assessment would distinguish repair costs, interrupted output, trade diversion and household livelihood losses and link each estimate to its reporting period and method. The present review does not establish a reconciled monetary total for these effects. Humanitarian reports show that infrastructure damage also interrupted access to schools, health services, water and sanitation. UNICEF’s assessment describes these service losses and the additional risks faced by displaced households. Combining such reports with transport and exposure layers can identify priorities for further assessment, while avoiding the assumption that every settlement intersecting a mapped corridor experienced the same loss of access [70,76,80].
5.4.3. Research Requirements for Infrastructure Risk Reduction
Future engineering assessments can use the catalogued resources to develop and test cascade scenarios alongside conventional hydrological design conditions. Scenarios should specify the source, sediment supply, possible blockages and breach behaviour, with uncertainties in these inputs carried through to estimates of local loads and inundation. Decisions about siting, openings, barriers and emergency access require site-specific evidence and cannot be prescribed from the present resource inventory alone. The same evidence is needed to compare protective measures and emergency operating procedures. Their performance depends on achievable detection time, debris characteristics, safe shutdown requirements and the consequences of failure. Evaluating these dependencies would connect the available resource inventory to engineering decisions while identifying the additional observations needed at each site.
5.5. Contribution and Maintenance of the Disaster Data Inventory
5.5.1. Distributed Sources and Changing Availability
The research uses discussed in Section 5.1, Section 5.2, Section 5.3 and Section 5.4 depend on retaining the connection between each result and the observations, assumptions and processing steps behind it. That connection is difficult to trace when satellite products, agency reports, preprints and model outputs are distributed across separate services or redistributed under different titles. The catalogue brings their records together and distinguishes the original producer from the host, acquisition dates from publication dates, and source validation from catalogue assessment. These distinctions are particularly consequential when several publications reuse the same underlying observations. A dated assessment makes the inventory interpretable as the evidence base develops. The search cutoff identifies the period covered, while the later assessment date records when source identity, access and eligibility were checked. Retaining excluded records and their reasons allows subsequent reviewers to revisit those decisions if missing material becomes available. Continued access still depends on the original providers, so maintenance must document changes in availability as well as additions and revised scientific findings.
5.5.2. Relationship to Evidence Maps and Disaster Registries
Structured evidence maps provide an established basis for making dispersed research discoverable. EviAtlas supports maps, tables and plots derived from evidence-synthesis databases [40]; the syntheses of Chausson et al. [41] and Cheng et al. [42] organize evidence on nature-based adaptation and the contribution of forests to poverty alleviation, respectively. The climate-impact mapping of Callaghan et al. [43], the adaptation synthesis of Berrang-Ford et al. [44], and the climate-and-health evidence-map protocol [64] organize research around broader scientific and policy questions. The review by Malhotra et al. [65] examines the effectiveness and cost-effectiveness of ecosystem-based disaster risk reduction. Their units of analysis reflect those purposes. For the present event, resource–asset relationships extend this charting approach to the files, documents and endpoints associated with each source, recording access conditions and provenance alongside thematic relevance while retaining the source’s own unit of observation and interpretation.
The geohazard compilations and reconstructions reviewed here also demonstrate that versioning, spatial indexing and source documentation have substantial precedents [46,47,48,49,50,66,67,68]. COOLR incorporates additional landslide reports through collaborative contributions [52], and the mountain-observation literature addresses coverage and inventory maintenance [51]. The contribution of this catalogue lies in bringing those practices to the full range of resources identified for the Nepal cascade, across eight thematic domains and seven asset modalities. Table 1 explains how its scope relates to the existing approaches.
5.5.3. Resource–Asset Relationships and Review Boundaries
The concentration of assets in large Earth-observation collections illustrates the importance of retaining resource–asset relationships (Section 4.1). Earth observation accounts for more than one-third of resources but almost nine-tenths of assets, and six extensively enumerated collections supply four-fifths of the files and endpoints. That concentration reflects both available products and how their components are distributed and catalogued: imagery, diagnostic layers, previews and metadata are often supplied separately. Interpreting asset totals as independent evidence would overstate the contribution of the largest collections and obscure smaller hydrological, geophysical or documentary holdings. Recording the role, parentage and version of every asset makes the inventory useful for selecting inputs and tracing dependencies across studies. Thematic assignments and technical formats provide complementary routes into those holdings, while the WebGIS adds geographic context where suitable spatial information exists. Acquisition footprints, search areas and mapped impact extents must retain their distinct meanings when these records are explored together.
5.5.4. Access, Reuse, and Future Maintenance
The access and rights results show that locating a resource, retrieving its contents and establishing permission for reuse require separate assessment. Public metadata can make a resource findable even when scientific payloads require authentication or a provider application; similarly, a publicly reachable file does not establish an asset-specific reuse grant. Recording these conditions alongside formats, provenance and supporting documentation gives researchers a basis for planning access and processing before committing to an analysis. This supports FAIR data stewardship [83] without extending the catalogue’s own metadata licence to third-party holdings. Maintenance should therefore revisit existing access routes and rights statements as well as identify new resources, preserving changes to source versions, availability and attribution in dated releases.
Community nominations can complement this maintenance work by identifying resources that scheduled searches may miss. The public form prepares an email containing the proposed resource and its access information; maintainers then assess the submission before assigning a catalogue status. Keeping nomination, candidate assessment and completed review distinct allows contributions to expand the inventory while preserving a record of the decisions needed for catalogue inclusion.
6. Conclusions
6.1. Evidence Available for Further Investigation of the Disaster Cascade
The identified resources support further investigation of the 26 August 2026 cascade by bringing together event timing, source-area observations, regional environmental records and numerical interpretations. They provide complementary constraints, but do not resolve a unique triggering mechanism or a definitive detached volume. Optical displacement and morphological studies document pre-failure movement and structural features [8,56], while regional glacier and climate records describe the longer-term and seasonal context [9,30,31]. The thermal state, joint-water pressure and local strength changes at the failure surface remain insufficiently constrained to attribute the collapse to a specific thermal–hydraulic sequence. The lake inventories, water observations and climatic analyses constrain proposed explanations within their spatial and temporal limits [30,31,58]. They do not constitute a complete audit of all water storage, rainfall or glacier-motion processes. Future research can use the documented source material to test these proposed explanations without treating the absence of a detected feature as proof of its physical absence.
The seismic archives preserve agency-specific event solutions and model-dependent force and mass estimates [10]. Huang et al.’s preferred peak-force estimate corresponds to an empirical mass of 1.33 × 10¹² kg, with substantial variation across alternative inversions. The mass estimates require comparison with independently constrained source geometry and composition before they can be interpreted as a moving volume. For downstream propagation, the timing and stage records support a rapid upper-corridor passage followed by a much later downstream peak. Park’s revised modelling [11] reproduces part of this record under low effective resistance but retains uncertainties in source volume, thermal processes and routing. Xu’s account [37] separates the documented 28 August lake overflow from the initial flood, while leaving the contribution of an earlier temporary blockage unresolved.
6.2. Implications for Infrastructure Assessment and Disaster Governance
The resource inventory provides inputs for assessing infrastructure exposed to coupled mass movement, sediment transport and flooding. Further engineering studies can combine those inputs with conventional hydrological design conditions, operator records and site investigations to test local loads, failure mechanisms and protective measures. The appropriate design response will depend on that analysis and on the functions and constraints of each facility.
Warning research should address both the short travel times near the source and the continuing value of observations farther downstream. Source-sensitive detection and more resilient telemetry could complement existing river monitoring, but their benefit requires independent testing of detection, communication and public response. Differences between reported station-loss times and reconstructed arrival intervals should be retained when evaluating warning performance [57,69]. The transboundary setting supports further work on shared monitoring coverage, data exchange and coordinated response. Existing arrangements, information gaps and agency responsibilities should be documented before new mechanisms are proposed. Traceable, versioned access to the underlying evidence can support that assessment, while timely and effective warning also depends on observations, communication and local capacity to act [57,58].
6.3. Contribution and Continuing Use of the Catalogue
The catalogue will be maintained through searches repeated every month across all eight thematic domains and the source families covered by this review. Between these rounds, additional searches will follow community nominations or newly released or revised material brought to the authors’ attention. The scheduled searches will help identify resources that have appeared without being announced or nominated, while the additional checks will allow relevant material to be considered before the next search cycle.
Newly identified resources and assets will undergo the same eligibility assessment applied to the first release. Additions may include both newly released material and older resources missed by previous searches, including relevant pre-event records. New assets and revised versions belonging to an existing resource will be linked to its catalogue entry, while changes in content, access or reuse conditions will prompt reassessment of that entry. Each dated release will document the searches, additions, corrections and assessment decisions, preserving earlier versions so that researchers can identify the inventory on which their work was based.
Supplementary Materials
The assessed catalogue release and its supporting tables, figures, scripts and data dictionary are archived in Zenodo (https://doi.org/10.5281/zenodo.23034746). The data catalogue is available through https://evelpidou.nkua.cloud/Nepal-Flood-2026-Catalogue/, with the associated WebGIS at https://evelpidou.nkua.cloud/Nepal-Flood-2026/.
Author Contributions
Conceptualization, A.L. and E.S.; methodology, A.L.; software, A.L.; validation, A.L., N.E., E.S., and N.K.; formal analysis, A.L.; investigation, A.L., N.E., E.S., and N.K.; resources, N.E.; data curation, A.L.; writing, original draft preparation, A.L., E.S; writing, review and editing, A.L., N.E., E.S., and N.K.; visualization, A.L.; supervision, N.E.. All authors have read and agreed to the published version of the manuscript.
Funding
This research received no external funding.
Conflicts of Interest
The authors declare no conflict of interest.
Abbreviations
The following abbreviations are used in this manuscript:
| PRISMA-ScR | Preferred Reporting Items for Systematic Reviews and Meta-Analyses extension for Scoping Reviews |
| PRISMA-LSR | Preferred Reporting Items for Systematic Reviews and Meta-Analyses for Living Systematic Reviews |
| GLOF | Glacial Lake Outburst Flood |
| DEM | Digital Elevation Model |
| SAR | Synthetic Aperture Radar |
| InSAR | Interferometric Synthetic Aperture Radar |
| STAC | SpatioTemporal Asset Catalog |
| COG | Cloud Optimized GeoTIFF |
| DHM | Department of Hydrology and Meteorology (Nepal) |
| NDRRMA | National Disaster Risk Reduction and Management Authority (Nepal) |
| ICIMOD | International Centre for Integrated Mountain Development |
| CEMS | Copernicus Emergency Management Service |
| UNOSAT | United Nations Satellite Centre |
| USGS | United States Geological Survey |
| GFZ | German Research Centre for Geosciences (Helmholtz Centre Potsdam) |
| NEA | Nepal Electricity Authority |
| BIPAD | Building Information Platform Against Disaster |
| HOT | Humanitarian OpenStreetMap Team |
| NPT | Nepal Standard Time (UTC+5:45) |
| UTC | Coordinated Universal Time |
| SWIR | Shortwave Infrared |
| NDSI | Normalized Difference Snow Index |
| FAIR | Findable, Accessible, Interoperable, and Reusable |
| UAV | Unmanned Aerial Vehicle |
| GPU | Graphics Processing Unit |
| SMS | Short Message Service |
| PMTiles | ProtoMap Tiles (Cloud-Native Vector Tile Archive) |
| CEE | Collaboration for Environmental Evidence |
| ROSES | RepOrting standards for Systematic Evidence Syntheses |
| GLO-30 | Copernicus 30-Meter Global Digital Elevation Model |
References
- Kappes, M.S.; Keiler, M.; Glade, T. From Single- to Multi-Hazard Risk Analyses: A Concept Addressing Emerging Challenges. In Proceedings of the International Conference “Mountain Risks: Bringing Science to Society”, Firenze, Italy, 24-26 November 2010; CERG Editions: Strasbourg, France, 2010; pp. 351–356. [Google Scholar]
- Mani, P.; Allen, S.; Evans, S.G.; Kargel, J.S.; Mergili, M.; Petrakov, D.; Stoffel, M. Geomorphic Process Chains in High-Mountain Regions: A Review and Classification Approach for Natural Hazards Assessment. Rev. Geophys. 2023, 61, e2022RG000791. [Google Scholar] [CrossRef]
- Walter, F.; Amann, F.; Kos, A.; Kenner, R.; Phillips, M.; de Preux, A.; Huss, M.; Tognacca, C.; Clinton, J.; Diehl, T.; et al. Direct Observations of a Three Million Cubic Meter Rock-Slope Collapse with Almost Immediate Initiation of Ensuing Debris Flows. Geomorphology 2020, 351, 106933. [Google Scholar] [CrossRef]
- Cui, P.; Ge, Y.; Li, S.; Li, Z.; Xu, X.; Zhou, G.G.D.; Chen, H.; Wang, H.; Lei, Y.; Zhou, L.; et al. Scientific Challenges in Disaster Risk Reduction for the Sichuan–Tibet Railway. Eng. Geol. 2022, 309, 106837. [Google Scholar] [CrossRef]
- Beniston, M.; Farinotti, D.; Stoffel, M.; Andreassen, L.M.; Coppola, E.; Eckert, N.; Fantini, A.; Giacona, F.; Hauck, C.; Huss, M.; et al. The European Mountain Cryosphere: A Review of Its Current State, Trends, and Future Challenges. Cryosphere 2018, 12, 759–794. [Google Scholar] [CrossRef]
- Chiarle, M.; Geertsema, M.; Mortara, G.; Clague, J.J. Relations between Climate Change and Mass Movement: Perspectives from the Canadian Cordillera and the European Alps. Glob. Planet. Change 2021, 202, 103499. [Google Scholar] [CrossRef]
- Bondesan, A.; Francese, R.G. The Climate-Driven Disaster of the Marmolada Glacier (Italy). Geomorphology 2023, 431, 108687. [Google Scholar] [CrossRef]
- Wang, T.; Sassa, S.; Yang, W.; Li, R.; Xu, C.; Qi, W. Precursor of a powerful large glacier landslide causing tsunami floods in the 26 August 2026 Nepal disaster. Landslides 2026. [Google Scholar] [CrossRef]
- Silwal, G.; Davies, B.; Carr, J.R.; King, O.; Buzzard, S.; Carrivick, J.L.; Baral, P. Glacier changes in Langtang Catchment, Central Nepalese Himalaya from the Little Ice Age (∼1815 CE) to 2023 CE. Glob. Planet. Change 2026, 264, 105555. [Google Scholar] [CrossRef]
- Huang, S.; Chen, C.-M.; Wang, B. Datasets and Analysis scripts for “The first minutes of the 2026 Nepal rock–ice avalanche and flash flood”. Zenodo 2026, version 1. [Google Scholar] [CrossRef]
- Park, H. A Rock-Ice Avalanche and the 2026 Bhote Koshi-Trishuli Flood, Nepal. EarthArXiv 2026, version 2. [Google Scholar] [CrossRef]
- Tricco, A.C.; Lillie, E.; Zarin, W.; O'Brien, K.K.; Colquhoun, H.; Levac, D.; Moher, D.; Peters, M.D.; Horsley, T.; Weeks, L.; et al. PRISMA Extension for Scoping Reviews (PRISMA-ScR): Checklist and Explanation. Ann. Intern. Med. 2018, 169, 467–473. [Google Scholar] [CrossRef]
- Elliott, J.H.; Synnot, A.; Turner, T.; Simmonds, M.; Akl, E.A.; McDonald, S.; Salanti, G.; Meerpohl, J.; MacLehose, H.; Hilton, J.; et al. Living Systematic Review: 1. Introduction - the Why, What, When, and How. J. Clin. Epidemiol. 2017, 91, 23–30. [Google Scholar] [CrossRef]
- Lavé, J.; Avouac, J.P. Fluvial Incision and Tectonic Uplift Across the Himalayas of Central Nepal. J. Geophys. Res. Solid Earth 2001, 106, 26561–26591. [Google Scholar] [CrossRef]
- Immerzeel, W.W.; Petersen, L.; Ragettli, S.; Pellicciotti, F. The Importance of Observed Gradients of Air Temperature and Precipitation for Modeling Runoff from a Glacierized Watershed in the Nepalese Himalayas. Water Resour. Res. 2014, 50, 2212–2226. [Google Scholar] [CrossRef]
- Burbank, D.W.; Blythe, A.E.; Putkonen, J.; Pratt-Sitaula, B.; Gabet, E.; Oskin, M.; Barros, A.; Ojha, T.P. Decoupling of Erosion and Precipitation in the Himalayas. Nature 2003, 426, 652–655. [Google Scholar] [CrossRef]
- Macfarlane, A.M.; Hodges, K.V.; Lux, D. A Structural Analysis of the Main Central Thrust Zone, Langtang National Park, Central Nepal Himalaya. Geol. Soc. Am. Bull. 1992, 104, 1389–1402. [Google Scholar] [CrossRef]
- Reddy, S.M.; Searle, M.P.; Massey, J.A. Structural Evolution of the High Himalayan Gneiss Sequence, Langtang Valley, Nepal. Geol. Soc. Lond. Spec. Publ. 1993, 74, 375–389. [Google Scholar] [CrossRef]
- Burchfiel, B.C.; Chen, Z.; Hodges, K.V.; Liu, Y.; Royden, L.H.; Deng, C.; Xu, J. The South Tibetan Detachment System, Himalayan Orogen: Extension Contemporaneous with and Parallel to Shortening in a Collisional Mountain Belt. Geol. Soc. Am. Spec. Pap. 1992, 269, 1–41. [Google Scholar] [CrossRef]
- Searle, M.P.; Law, R.D.; Godin, L.; Larson, K.P.; Streule, M.J.; Cottle, J.M.; Jessup, M.J. Defining the Himalayan Main Central Thrust in Nepal. J. Geol. Soc. 2008, 165, 523–534. [Google Scholar] [CrossRef]
- Schmid, M.-O.; Baral, P.; Gruber, S.; Shahi, S.; Shrestha, T.; Stumm, D.; Wester, P. Assessment of Permafrost Distribution Maps in the Hindu Kush Himalayan Region Using Rock Glaciers Mapped in Google Earth. The Cryosphere 2015, 9, 2089–2099. [Google Scholar] [CrossRef]
- Gruber, S.; Fleiner, R.; Guegan, E.; Panday, P.; Schmid, M.-O.; Stumm, D.; Wester, P.; Zhang, Y.; Zhao, L. Review Article: Inferring Permafrost and Permafrost Thaw in the Mountains of the Hindu Kush Himalaya Region. The Cryosphere 2017, 11, 81–99. [Google Scholar] [CrossRef]
- Ageta, Y.; Higuchi, K. Estimation of Mass Balance Components of a Summer-Accumulation Type Glacier in the Nepal Himalaya. Geogr. Ann. Ser. A 1984, 66, 249–255. [Google Scholar] [CrossRef]
- Ragettli, S.; Bolch, T.; Pellicciotti, F. Heterogeneous Glacier Thinning Patterns over the Last 40 Years in Langtang Himal, Nepal. The Cryosphere 2016, 10, 2075–2097. [Google Scholar] [CrossRef]
- Krautblatter, M.; Funk, D.; Günzel, F.K. Why Permafrost Rocks Become Unstable: A Rock–Ice-Mechanical Model in Time and Space. Earth Surf. Process. Landf. 2013, 38, 876–887. [Google Scholar] [CrossRef]
- Haeberli, W.; Cohen, D.; Arenson, L.U. On Transient Thermally Induced Stability Changes in High-Mountain Permafrost Rock Walls. EGUsphere 2026. [Google Scholar] [CrossRef]
- Bookhagen, B.; Burbank, D.W. Topography, Relief, and TRMM-Derived Rainfall Variations along the Himalaya. Geophys. Res. Lett. 2006, 33, L08405. [Google Scholar] [CrossRef]
- Barros, A.P.; Joshi, M.; Putkonen, J.; Burbank, D.W. A Study of the 1999 Monsoon Rainfall in a Mountainous Region in Central Nepal Using TRMM Products and Rain Gauge Observations. Geophys. Res. Lett. 2000, 27, 3683–3686. [Google Scholar] [CrossRef]
- Pepin, N.; Bradley, R.S.; Diaz, H.F.; Baraer, M.; Caceres, E.B.; Forsythe, N.; Fowler, H.; Greenwood, G.; Hashmi, M.Z.; Liu, X.D.; et al. Elevation-Dependent Warming in Mountain Regions of the World. Nat. Clim. Chang. 2015, 5, 424–430. [Google Scholar] [CrossRef]
- Clarke, B.; Zachariah, M.; Davies, B.; Hock, R.; Immerzeel, W.; Jha, R.; Robinson, T.R.; Keeping, T.; Barnes, C.; Otto, F.; et al. Rapid warming in the Himalaya exacerbates geohazard cascades beyond adaptation limits. World Weather Attrib. Sci. Rep. 2026, 92. [Google Scholar] [CrossRef]
- Wang, W.; Mi, H.; Lin, K. Code and data for: Record melt-season warmth preconditioned the 26 August 2026 Langtang Lirung ice–rock avalanche: a 45-year reanalysis-based storyline attribution. Zenodo 2026, 1. [Google Scholar] [CrossRef]
- Huggel, C.; Salzmann, N.; Allen, S.; Caplan-Auerbach, J.; Fischer, L.; Haeberli, W.; Larsen, C.; Schneider, D.; Wessels, R. Recent and Future Warm Extreme Events and High-Mountain Slope Stability. Philos. Trans. R. Soc. A 2010, 368, 2435–2459. [Google Scholar] [CrossRef]
- Iverson, R.M.; Reid, M.E.; Logan, M.; LaHusen, R.G.; Godt, J.W.; Griswold, J.P. Positive Feedback and Momentum Growth during Debris-Flow Entrainment of Wet Bed Sediment. Nat. Geosci. 2011, 4, 116–121. [Google Scholar] [CrossRef]
- Iverson, R.M. The Physics of Debris Flows. Rev. Geophys. 1997, 35, 245–296. [Google Scholar] [CrossRef]
- Pudasaini, S.P.; Krautblatter, M. A Two-Phase Mechanical Model for Rock–Ice Avalanches. J. Geophys. Res. Earth Surf. 2014, 119, 2272–2290. [Google Scholar] [CrossRef]
- Costa, J.E.; Schuster, R.L. The Formation and Failure of Natural Dams. Geol. Soc. Am. Bull. 1988, 100, 1054–1068. [Google Scholar] [CrossRef]
- Xu, D. The 26 August 2026 Langtang Lirung Ice–Rock Avalanche and Its Transboundary Cascade: A Multi-Source Observational Reconstruction in the Bhote Koshi Basin. EarthArXiv 2026, version 2. [Google Scholar] [CrossRef]
- Zhang, T.-G.; Wang, W.-C.; Khadka, N.; Kougkoulos, I.; Cook, S.J.; Watson, C.S.; Gao, Y.; Li, S.-H.; Yang, X.; Wang, Z.-Y.; et al. Transboundary Outburst Floods from Giant Supraglacial Lakes over the Himalayan China–Nepal Border. Adv. Clim. Chang. Res. 2026. [Google Scholar] [CrossRef]
- Bhattarai, K.; Adhikari, A.P. From Himalayan Catastrophe to National Resilience: Lessons from the 2026 Bhote Koshi and Trishuli River Floods in Nepal. SocArXiv 2026, version 1. [Google Scholar] [CrossRef]
- Haddaway, N.R.; Feierman, A.; Grainger, M.J.; Gray, C.T.; Tanriver-Ayder, E.; Dhaubanjar, S.; Westgate, M.J. EviAtlas: A Tool for Visualising Evidence Synthesis Databases. Environ. Evid. 2019, 8, 22. [Google Scholar] [CrossRef]
- Chausson, A.; Turner, B.; Seddon, D.; Chabaneix, N.; Girardin, C.A.J.; Kapos, V.; Key, I.; Roe, D.; Smith, A.; Woroniecki, S.; et al. Mapping the Effectiveness of Nature-Based Solutions for Climate Change Adaptation. Glob. Chang. Biol. 2020, 26, 6134–6155. [Google Scholar] [CrossRef]
- Cheng, S.H.; MacLeod, K.; Ahlroth, S.; Onder, S.; Perge, E.; Shyamsundar, P.; Rana, P.; Garside, R.; Kristjanson, P.; McKinnon, M.C.; Miller, D.C. A Systematic Map of Evidence on the Contribution of Forests to Poverty Alleviation. Environ. Evid. 2019, 8, 3. [Google Scholar] [CrossRef]
- Callaghan, M.; Schleussner, C.-F.; Nath, S.; Lejeune, Q.; Knutson, T.R.; Reichstein, M.; Hansen, G.; Theokritoff, E.; Andrijevic, M.; Brecha, R.J.; et al. Machine-Learning-Based Evidence and Attribution Mapping of 100,000 Climate Impact Studies. Nat. Clim. Chang. 2021, 11, 966–972. [Google Scholar] [CrossRef]
- Berrang-Ford, L.; Siders, A.R.; Lesnikowski, A.; Fischer, A.P.; Callaghan, M.W.; Haddaway, N.R.; Mach, K.J.; Araos, M.; Shah, M.A.R.; Wannewitz, M.; et al. A Systematic Global Stocktake of Evidence on Human Adaptation to Climate Change. Nat. Clim. Chang. 2021, 11, 989–1000. [Google Scholar] [CrossRef]
- Lindersson, S.; Brandimarte, L.; Mård, J.; Di Baldassarre, G. A Review of Freely Accessible Global Datasets for the Study of Floods, Droughts and Their Interactions with Human Societies. WIREs Water 2020, 7, e1424. [Google Scholar] [CrossRef]
- Cheng, H.; Hu, K.; Liu, S.; Zhang, X.; Li, H.; Zhang, Q.; Ning, L.; Gouli, M.R.; Li, P.; Yang, A.; et al. A Worldwide Event-Based Debris Flow Barrier Dam Dataset from 1800 to 2023. Earth Syst. Sci. Data 2025, 17, 1573–1593. [Google Scholar] [CrossRef]
- Godet, J.; Nicolle, P.; Hocini, N.; Gaume, E.; Davy, P.; Pons, F.; Javelle, P.; Garambois, P.-A.; Lague, D.; Payrastre, O. Benchmark Dataset for Hydraulic Simulations of Flash Floods in the French Mediterranean Region. Earth Syst. Sci. Data 2025, 17, 2963–2983. [Google Scholar] [CrossRef]
- Shugar, D.H.; Jacquemart, M.; Shean, D.; Bhushan, S.; Upadhyay, K.; Sattar, A.; Schwanghart, W.; McBride, S.; Van Wyk de Vries, M.; Mergili, M.; et al. A Massive Rock and Ice Avalanche Caused the 2021 Disaster at Chamoli, Indian Himalaya. Science 2021, 373, 300–306. [Google Scholar] [CrossRef]
- Shrestha, F.; Steiner, J.F.; Shrestha, R.; Dhungel, Y.; Joshi, S.P.; Inglis, S.; Ashraf, A.; Wali, S.; Walizada, K.M.; Zhang, T. A Comprehensive and Version-Controlled Database of Glacial Lake Outburst Floods in High Mountain Asia. Earth Syst. Sci. Data 2023, 15, 3941–3961. [Google Scholar] [CrossRef]
- Veh, G.; Lützow, N.; Tamm, J.; Luna, L.V.; Hugonnet, R.; Vogel, K.; Geertsema, M.; Clague, J.J.; Korup, O. Less Extreme and Earlier Outbursts of Ice-Dammed Lakes since 1900. Nature 2023, 614, 701–707. [Google Scholar] [CrossRef]
- Thornton, J.M.; Pepin, N.; Shahgedanova, M.; Adler, C. Coverage of In Situ Climatological Observations in the World's Mountains. Front. Clim. 2022, 4, 814181. [Google Scholar] [CrossRef]
- Juang, C.S.; Stanley, T.A.; Kirschbaum, D.B. Using Citizen Science to Expand the Global Map of Landslides: Introducing the Cooperative Open Online Landslide Repository (COOLR). PLoS ONE 2019, 14, e0218657. [Google Scholar] [CrossRef]
- Ajmar, A.; Boccardo, P.; Broglia, M.; Kucera, J.; Giulio-Tonolo, F.; Wania, A. Response to Flood Events: The Role of Satellite-Based Emergency Mapping and the Experience of the Copernicus Emergency Management Service. In Flood Damage Survey and Assessment; Molinari, D., Menoni, S., Ballio, F., Eds.; John Wiley & Sons: Hoboken, NJ, USA, 2017; pp. 211–228. [Google Scholar] [CrossRef]
- Kaku, K. Satellite Remote Sensing for Disaster Management Support: A Holistic and Staged Approach Based on Case Studies in Sentinel Asia. Int. J. Disaster Risk Reduct. 2019, 33, 417–432. [Google Scholar] [CrossRef]
- Shean, D. High Mountain Asia 8-Meter DEM Mosaics Derived from Optical Imagery (HMA_DEM8m_MOS), Version 1; NASA National Snow and Ice Data Center Distributed Active Archive Center: Boulder, CO, USA, 2017. [Google Scholar] [CrossRef]
- Carlà, T.; Tofani, V.; Casagli, N. Very-high-resolution optical imagery reveals key clues to the Langtang Lirung ice–rock avalanche. EarthArXiv 2026 version 1. [CrossRef]
- Acharya, S.; Paudel, A. The Bhote Koshi–Trishuli flash flood of 26 August 2026, Rasuwa, Nepal: warning latency exceeded flood travel time. EarthArXiv updated. 2026, version 5. [Google Scholar] [CrossRef]
- Gujree, I. A cascade, not a flood: testing the competing accounts of the 26 August 2026 Lhende Khola–Bhote Koshi disaster. EarthArXiv 2026. [Google Scholar] [CrossRef]
- Sah, A.K. No Detectable Precursor in Sentinel-1 Backscatter before the 26 August 2026 Langtang Lirung Rock–Ice Avalanche, Nepal. EarthArXiv 2026, version 2. [Google Scholar] [CrossRef]
- Pradhan, P. Was the Pre-Event SWIR Anomaly at Tsangbu Ri a Genuine Glacier-Collapse Precursor? A Calibrated Multi-Glacier Test of the 2026 Case. EarthArXiv 2026, version 3. [Google Scholar] [CrossRef]
- Asadollahi, A. Multi-Sensor Satellite-Based Retrospective Early-Warning Assessment of the 26 August 2026 Flood Event in the Langtang Region of Nepal. EarthArXiv 2026. [Google Scholar] [CrossRef]
- Li, R. When a High-Mountain Slope Failure Cascades Downstream: Physical Footprint and Evolving Exposure of the 2026 Gyirong Mixed Rock–Ice Cascade. arXiv 2026, arXiv:2609.04563version 2. [Google Scholar] [CrossRef]
- Berthier, E. Pléiades (CNES) pre-event Digital Elevation Models (DEMs) for the rock–ice avalanche source area of the August 2026 Trishuli catastrophic flood. Zenodo 2019, version 2. [Google Scholar] [CrossRef]
- Berrang-Ford, L.; Sietsma, A.J.; Callaghan, M.; Minx, J.C.; Scheelbeek, P.; Haddaway, N.R.; Haines, A.; Belesova, K.; Dangour, A.D. Mapping Global Research on Climate and Health Using Machine Learning (a Systematic Evidence Map). Wellcome Open Res. 2021, 6, 7. [Google Scholar] [CrossRef]
- Malhotra, S.K.; Saran, A.; Bhandari, R.; Ojiambo, K.O.; Shirodkar, S.; Stewart, G.; White, H.; Waddington, H.S. Effectiveness and Cost-Effectiveness of Ecosystem-Based Disaster Risk Reduction Interventions in Low- and Middle-Income Countries: A Rapid Systematic Review. Campbell Syst. Rev. 2025, 21, e70083. [Google Scholar] [CrossRef]
- Mancino, S.; Sblano, A.; Lovergine, F.P.; Massimi, V.; Sethi, T.; Capolongo, D.; Amatulli, G. Unified Global Landslide Catalogue (UGLC): A Single, Standardised Global-Scale Landslide Dataset. Earth Syst. Sci. Data 2026, 18, 4697–4723. [Google Scholar] [CrossRef]
- Xu, Y.; Ouyang, C.; Xu, Q.; Wang, D.; Zhao, B.; Luo, Y. CAS Landslide Dataset: A Large-Scale and Multisensor Dataset for Deep Learning-Based Landslide Detection. Sci. Data 2024, 11, 12. [Google Scholar] [CrossRef]
- Paprotny, D.; Terefenko, P.; Śledziowski, J. HANZE v2.1: An Improved Database of Flood Impacts in Europe from 1870 to 2020. Earth Syst. Sci. Data 2024, 16, 5145–5170. [Google Scholar] [CrossRef]
- Flood Forecasting Division; Centre for Hydrology and Water Resources Research; Water and Energy Commission Secretariat; Government of Nepal. “२०८३ भोटेकोशी-त्रिशूली-नारायणी बाढी” सम्बन्धी प्राविधिक प्रतिवेदन [Technical Report on the 2083 Bhote Koshi–Trishuli–Narayani Flood]. Kathmandu, Nepal, 26 August 2026. Available online: https://hydrology.gov.np/cm/files/Bhotekoshi-Trishuli-Narayani_Flood_Report_CHWRR_1%20_1787809133090.pdf.
- UNICEF Nepal. 2026. Nepal Humanitarian Situation Report No. 1 (Rasuwa Flood), 31 August 2026. UNICEF. Available online: https://www.unicef.org/documents/nepal-humanitarian-situation-report-no1-rasuwa-flood-31-august-2026.
- International Organization for Migration. Nepal—Flash Floods—Displacement Snapshot (27–31 August 2026). Displacement Tracking Matrix. 3 September 2026. Available online: https://dtm.iom.int/reports/nepal-flash-floods-displacement-snapshot-27-31-august-2026.
- Zou, Q.; Cui, P.; Zhou, B.; Lei, Y.; Chen, S.Y. IRDR Special Report: Risk Assessment of Debris Flows along the China–Nepal Transportation Corridor. In Integrated Research on Disaster Risk; International Programme Office: Beijing, China, 30 August 2026; Available online: https://www.irdrinternational.org/knowledge_pool/publications/145.
- International Centre for Integrated Mountain Development. Kyirong–Rasuwa Flood 2026 | Nepal–China Cryosphere Risk. 2026. Available online: https://www.icimod.org/kyirong-rasuwa-flood-2026-nepal-china-border/ (accessed on 28 September 2026).
- REACH Initiative. Nepal Flash Flood: Damage Assessment using Sentinel-1 Radar. Humanitarian Data Exchange. 2026. Available online: https://data.humdata.org/dataset/nepal-flash-flood-damage-assessment-using-sentinel-1-radar-data.
- Humanitarian OpenStreetMap Team (HOT). Nepal Flood 2026: fAIr Damage Assessment, Upper Trishuli and Bhote Koshi. Humanitarian Data Exchange. 2026. Available online: https://data.humdata.org/dataset/hot_flood_npl_buildings_damage.
- Humanitarian OpenStreetMap Team (HOT). Nepal Flood 2026 Flood Affected Area, Bhote Koshi and Trishuli. Humanitarian Data Exchange. 2026. Available online: https://data.humdata.org/dataset/hot_flood_npl.
- Copernicus. Nepal - Flood (EMSR927). Humanitarian Data Exchange. 2026. Available online: https://data.humdata.org/dataset/npl-flood-emsr927.
- United Nations Satellite Centre (UNOSAT). Mudflow/Rockflow Impact Assessment in Rasuwa & Nuwakot Districts, Bagmati Province, Nepal as of 26–27 August 2026. Humanitarian Data Exchange. 2026. Available online: https://data.humdata.org/dataset/mudflow-rockflow-impact-assessment-in-rasuwa-nuwakot-districts-bagmati-province-nepal-as-o.
- United Nations Satellite Centre (UNOSAT). Satellite-Detected Newly Formed Barrier Lakes Following an Ice-Rock Avalanche in Rasuwa District, Nepal, as of 28 August 2026. Humanitarian Data Exchange. 2026. Available online: https://data.humdata.org/dataset/newly-formed-barrier-lakes-following-an-ice-rock-avalanche-in-rasuwa-district-nepal-as-of-.
- Network, Planetary Response. Nepal Flooding: Road Blockages. Humanitarian Data Exchange. 2026. Available online: https://data.humdata.org/dataset/nepal-flooding-road-blcokages.
- International Charter Space and Major Disasters. Flood in Nepal—Activation 1052. 26 August 2026. Available online: https://disasterscharter.org/activations/flood-in-nepal-activation-1052-.
- Sentinel Asia. Flash Flood in Rasuwa District, Nepal on 26 August, 2026. 2026. Available online: https://sentinel-asia.org/EO/2026/article20260826NP.html.
- Wilkinson, M.D.; Dumontier, M.; Aalbersberg, I.J.; et al. The FAIR Guiding Principles for Scientific Data Management and Stewardship. Sci. Data 2016, 3, 160018. [Google Scholar] [CrossRef]
- Khadka, N.; Chen, X.; Liu, W.; Gouli, M.R.; Zhang, C.; Shrestha, B.; Sharma, S. Glacial Lake Outburst Floods Threaten China–Nepal Connectivity: Synergistic Study of Remote Sensing, GIS and Hydrodynamic Modeling with Regional Implications. Sci. Total Environ. 2024, 948, 174701. [Google Scholar] [CrossRef]
- Gouli, M.R.; Hu, K.; Khadka, N.; Liu, S.; Yifan, S.; Adhikari, M.; Talchabhadel, R. Quantitative Assessment of the GLOF Risk along China–Nepal Transboundary Basins by Integrating Remote Sensing, Machine Learning, and Hydrodynamic Model. Int. J. Disaster Risk Reduct. 2025, 118, 105231. [Google Scholar] [CrossRef]
- Khadka, N.; Chen, X.; Shrestha, M.; Liu, W. Risk Perception and Vulnerability of Communities in Nepal to Transboundary Glacial Lake Outburst Floods from Tibet, China. Int. J. Disaster Risk Reduct. 2024, 107, 104476. [Google Scholar] [CrossRef]
- Khadka, N.; Chen, X.; Sharma, S.; Shrestha, B. Climate Change and Its Impacts on Glaciers and Glacial Lakes in Nepal Himalayas. Reg. Environ. Change 2023, 23, 143. [Google Scholar] [CrossRef]
Figure 1.
Systematic search execution, resource screening, eligibility assessment, and asset cataloguing workflow for the living scoping review.
Figure 1.
Systematic search execution, resource screening, eligibility assessment, and asset cataloguing workflow for the living scoping review.
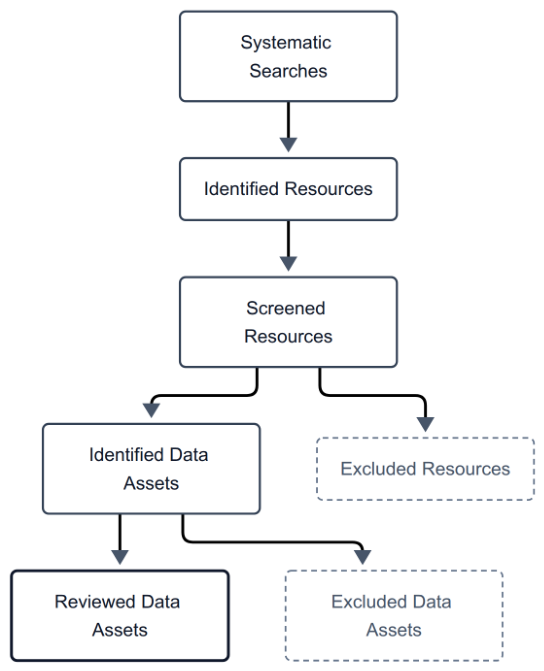
Figure 2.
Catalogue composition and asset concentration. (A) Shares of the 141 resources and 5,883 assets across all eight primary thematic domains; each set of shares sums to 100% before rounding. Assets inherit their parent resource’s primary domain. (B) Cumulative asset share across all 141 resources ranked by descending asset count, including the six resources with no retained child asset. The dashed line is an equal-count reference. The six resources containing at least 100 assets account for 4,760 assets (80.9%). Counts describe catalogue entries and components, rather than independent measurements. Source: assessed catalogue and Table S4; search cutoff, 24 September 2026; assessment, 28 September 2026.
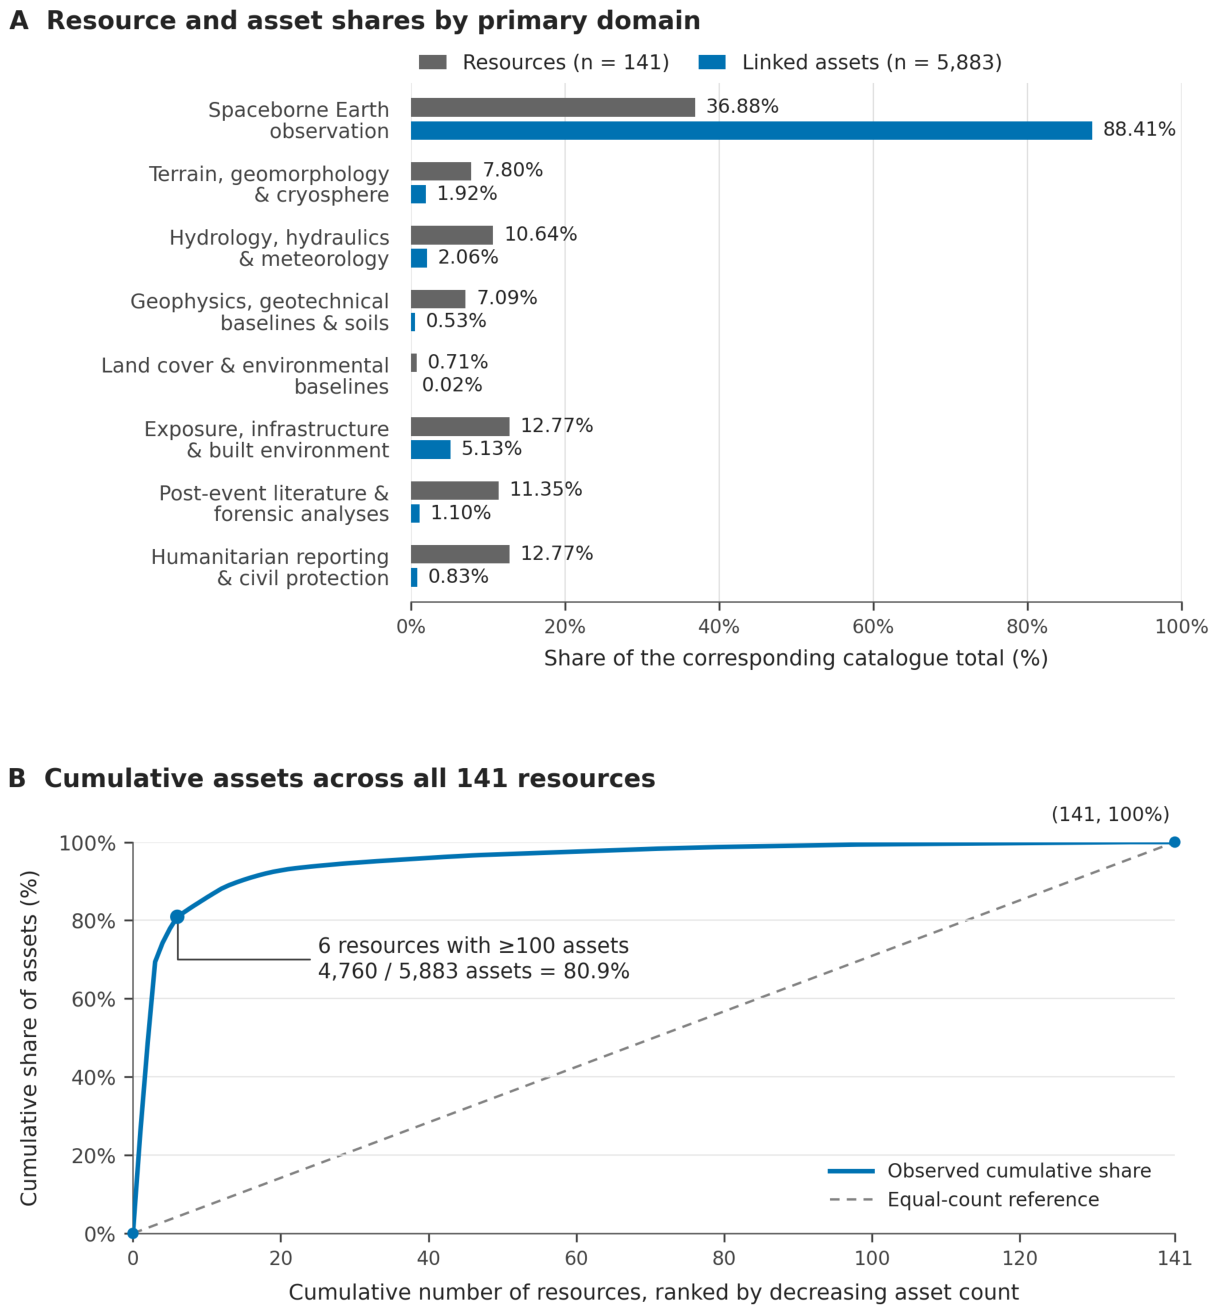
Figure 3.
Information roles across all eight primary thematic domains. Colour gives the percentage of each domain’s assets assigned to a role. In each cell, the upper value is the asset count and the lower value is the number of distinct parent resources contributing those assets. Resource counts can overlap across roles; row labels give the full resource and asset denominators, including retained resources without child assets. Zeros indicate no retained asset in that combination. Each asset is counted once under its parent’s primary domain and assessed role group. Source: assessed catalogue and Table S4–S5; search cutoff, 24 September 2026; assessment, 28 September 2026.
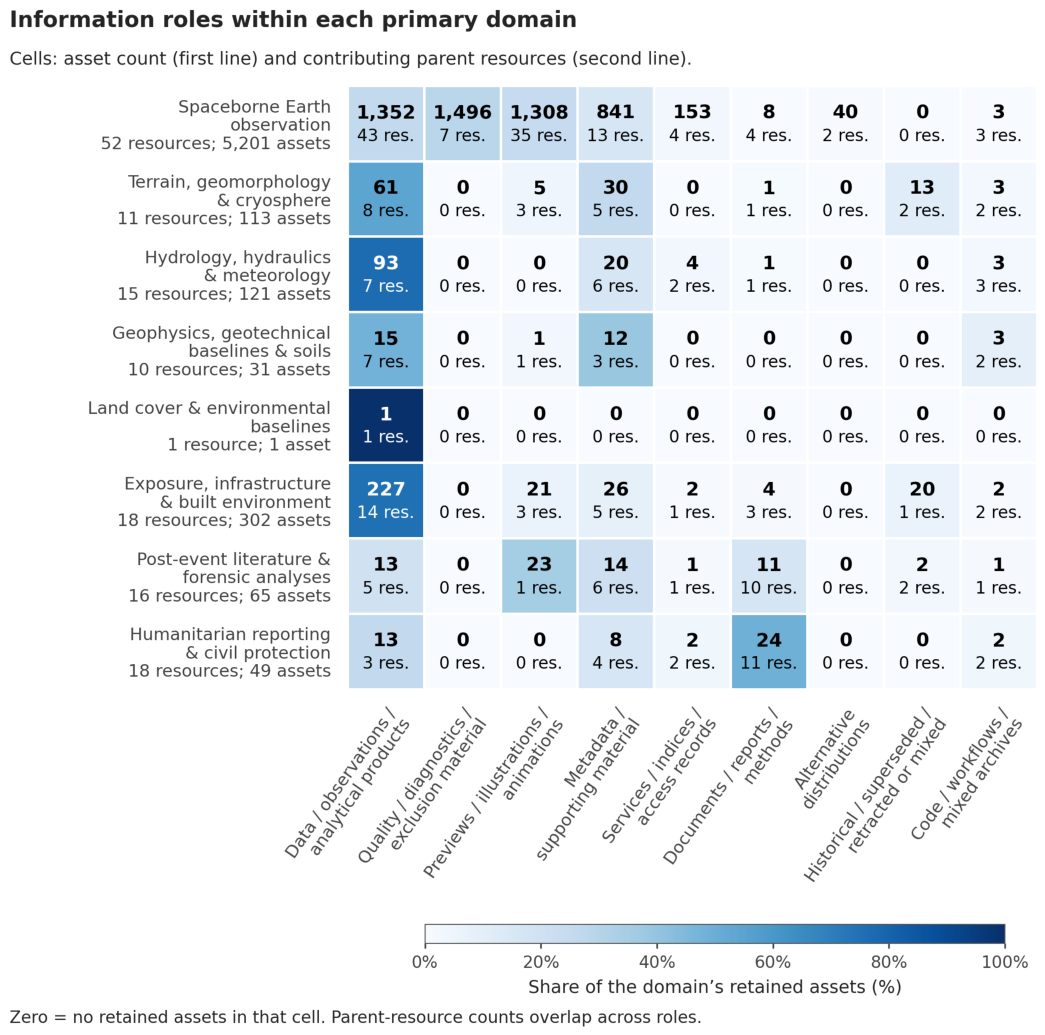

Table 1.
Scope and documented characteristics of related evidence syntheses, data inventories, and disaster information services.
Table 1.
Scope and documented characteristics of related evidence syntheses, data inventories, and disaster information services.
| Publication or service type | References | Unit and scope | Approach described in the source | Updating or release characteristics | Relationship to this catalogue |
| Living reviews and scoping-review reporting | Elliott et al. [13]; Tricco et al. [12] | Evidence relevant to a defined review question | Living review methods and transparent scoping-review reporting | Updating requires a defined process and renewed assessment; reporting guidance is not a scheduler | The present study charts information resources and associated assets, with a dated snapshot and explicit review states. |
| Systematic environmental evidence maps | Haddaway et al. [40]; Chausson et al. [41]; Cheng et al. [42] | Study characteristics, interventions, outcomes, and locations | Structured evidence charting and interactive exploration; EviAtlas is a visualization tool | The cited publications describe specific tools or syntheses; no common update frequency is established | These approaches inform structured discovery. This catalogue additionally records files, services, source relationships, access and rights. |
| Global climate evidence maps and syntheses | Callaghan et al. [43]; Berrang-Ford et al. [44,64] | Climate-impact, adaptation, and climate-health research | Machine-learning-assisted mapping, systematic synthesis, and an evidence-map protocol | Update arrangements are source-specific; the climate-health reference is a protocol | Their literature and study units differ from a resource–asset inventory; no relative resolution, validation or performance ranking is inferred. |
| Reviews of publicly available datasets | Lindersson et al. [45] | Global datasets for floods, droughts and society | Review and charting of available dataset characteristics | The paper documents the review at publication; it does not establish this catalogue’s update performance | Provides a precedent for reviewing data availability. The present inventory is organized around a particular event and its baselines. |
| Hazard datasets and event reconstructions | Cheng et al. [46]; Godet et al. [47]; Shugar et al. [48] | Debris-flow barrier dams; hydraulic observations for flash floods; Chamoli event reconstruction | Compilation, measurement and analysis appropriate to each dataset or event | Cited studies describe datasets and analyses; release and preservation conditions belong to their repositories | These sources contain detailed scientific data or analyses. This catalogue links material produced by multiple independent providers. |
| Historical GLOF databases and analyses | Shrestha et al. [49]; Veh et al. [50] | High Mountain Asia GLOF events and historical ice-dammed-lake outbursts | Version-controlled event compilation and quantitative analysis of historical records | Version control is explicit for [49]; no shared living-review schedule is inferred for both papers | Demonstrates established provenance and database versioning practices, with a hazard-event unit rather than the catalogue’s file and resource units. |
| Mountain observation coverage and inventories | Thornton et al. [51] | Climatological station coverage and broader mountain-observation metadata | Coverage analysis using station records; discussion of community inventories | The paper discusses community contributions and regular inventory updates | Supports transparent reporting of where observations exist and where coverage is missing, rather than a claim of complete monitoring. |
| Collaborative landslide repositories | Juang et al. [52] | Landslide reports from citizen-science and other sources | Collaborative reporting with source information and assessment | COOLR is designed to accept additional reports; it is not appropriately described as a static release | A complementary event-reporting resource; different scope is not evidence that it lacks useful review or provenance controls. |
| Satellite support for disaster management | Ajmar et al. [53]; Kaku [54] | Emergency mapping and satellite information for disaster-management stages | Copernicus emergency mapping experience and the staged Sentinel Asia approach | Service and activation processes differ; the cited works do not support closure of every function after an emergency | The catalogue indexes relevant service products alongside scientific, baseline and humanitarian resources. |
| This resource and asset inventory | This study | Resources, datasets, files, scenes, documents, code, and service endpoints across eight domains and seven modalities | Source-specific searches, eligibility assessment, descriptive charting, and explicit catalogue states | Search cutoff 24 September 2026; assessment completed 28 September; planned periodic and event-triggered searches with documented revisions | Links 141 retained resources and 5,883 assets with provenance, access and rights information and decisions at both levels; preserves exclusions, corrections, duplicate relationships and historical versions. |
Table 2.
Eligibility and descriptive assessment dimensions applied to resources and their associated assets.
Table 2.
Eligibility and descriptive assessment dimensions applied to resources and their associated assets.
| Assessment dimension | Information considered | Eligibility or charting approach | Limit or unresolved status |
| 1. Geographic relevance | Footprint, named places, or described coverage | Establish a connection to the affected corridor or to a relevant regional/global baseline. | No demonstrable scope connection excludes a resource; missing numeric coordinates do not alone exclude documents, code, or other relevant non-spatial records. |
| 2. Temporal relevance | Observation, acquisition, publication, and search dates | Distinguish pre-event baselines, event observations, and later publications available by 24 September 2026; retain native historical epochs. | Do not substitute publication or retrieval date for acquisition time. Record unavailable or imprecise dates explicitly. |
| 3. Thematic relevance | Eight information domains and seven asset modalities | Include material that informs documentation, investigation, exposure, risk, or response within the review scope. | Resources unrelated to that scope are excluded; candidate listing is not confirmation of eligibility. |
| 4. Provenance | Producer, host, contributor, source links, and derivation | Identify the originating source and distinguish observations from redistributed or derived products. | Unverified attribution remains explicit; a known host does not independently validate the scientific content. |
| 5. Information content | Files, services, observations, data-bearing documents, publications, or code | Assess whether the resource supplies relevant data or substantive source information. | Duplicate news coverage or commentary with no unique data is outside eligibility. Preprints and institutional reports are not excluded solely for lacking journal peer review. |
| 6. Technical description | Format, structure, CRS, extent, size, resolution, and method where applicable | Chart available technical information and the scope of any file or endpoint check. | Missing fields, invalid files and unavailable endpoints are retained as limitations or unresolved candidates; no universal reprojection or format conversion is implied. |
| 7. Access and rights | Cost, registration/request process, licence and redistribution terms | Eligible access is without charge through a direct link, free registration, or a transparent no-cost request route. Assess reuse terms separately. | Paid/private holdings and opaque access processes are ineligible. Missing or restrictive rights do not become open permission because an endpoint is reachable. |
Table 3.
Documented search executions by source/interface family and recorded outcome. Each run is assigned once according to its principal retrieval route; a run may contain multiple queries, and families are not counts of independent providers.
Table 3.
Documented search executions by source/interface family and recorded outcome. Each run is assigned once according to its principal retrieval route; a run may contain multiple queries, and families are not counts of independent providers.
| Source/interface family | Runs | Completed | Partial | Unavailable |
| Satellite imagery and emergency mapping services | 27 | 24 | 3 | 0 |
| Humanitarian and community mapping repositories | 7 | 6 | 0 | 1 |
| Scholarly, data and code repositories | 13 | 10 | 3 | 0 |
| General web and project-specific pages | 4 | 4 | 0 | 0 |
| Government observation, emergency and infrastructure portals | 13 | 11 | 2 | 0 |
| Environmental and geospatial baseline portals | 6 | 6 | 0 | 0 |
| Seismological agency services | 3 | 3 | 0 | 0 |
| Infrastructure project disclosures | 1 | 1 | 0 | 0 |
| Total | 74 | 65 | 8 | 1 |
Table 4.
Composition of the complete assessed catalogue by primary thematic domain. Resource percentages use 141 as the denominator; linked-asset percentages use 5,883. Each resource is assigned once, and assets inherit the parent assignment for this table. Cross-domain uses are retained in Table S4.
| Primary thematic domain | Resources, n (%) | Linked assets, n (%) |
| Spaceborne Earth observation | 52 (36.88) | 5,201 (88.41) |
| Terrain, geomorphology and cryosphere | 11 (7.80) | 113 (1.92) |
| Hydrology, hydraulics and meteorology | 15 (10.64) | 121 (2.06) |
| Geophysics, geotechnical baselines and soil properties | 10 (7.09) | 31 (0.53) |
| Land cover and environmental baselines | 1 (0.71) | 1 (0.02) |
| Exposure, infrastructure and built environment | 18 (12.77) | 302 (5.13) |
| Post-event scientific literature and forensic analyses | 16 (11.35) | 65 (1.10) |
| Humanitarian crisis reporting and civil protection | 18 (12.77) | 49 (0.83) |
| Total | 141 (100.00) | 5,883 (100.00) |
Table 5.
Complete asset inventory grouped by assessed information role and content. Each asset appears once; the parent-resource column counts resources with at least one asset in a group and therefore overlaps. Historical or mixed-validity classification preserves the source qualification and does not imply that every component of an archive is invalid.
| Information role | Assets, n (%) | Parent resources, n |
| Data, observations and analytical products | 1,775 (30.17) | 88 |
| Quality, diagnostic/context and exclusion material | 1,496 (25.43) | 7 |
| Previews, illustrations and animations | 1,358 (23.08) | 43 |
| Metadata and other supporting material | 951 (16.17) | 42 |
| Services, indices and access records | 162 (2.75) | 10 |
| Documents, reports and method descriptions | 49 (0.83) | 30 |
| Alternative distributions | 40 (0.68) | 2 |
| Explicitly historical, superseded, retracted or mixed-validity records | 35 (0.59) | 5 |
| Code, workflows and mixed analysis archives | 17 (0.29) | 15 |
| Total | 5,883 (100.00) | 135 distinct resources¹ |
¹ Assets occur under 135 of the 141 retained resources. Parent counts across role groups overlap; six retained resources have no separately retained child asset. The complete assignment and the underlying role labels are supplied in Table S5.
Table 6.
Technical-format groups for all retained assets. Classification follows the recorded format after assessment corrections; mixed archives remain archives rather than being expanded into unlisted members. Parent-resource counts overlap across groups. Percentages may differ from 100% in their sum because of rounding.
| Technical-format group | Assets, n (%) | Parent resources, n |
| Raster and multidimensional array formats | 2,633 (44.76) | 18 |
| Still-image formats | 1,436 (24.41) | 43 |
| Tabular formats | 533 (9.06) | 22 |
| Structured text formats | 451 (7.67) | 37 |
| Vector, tile and geospatial-overlay formats | 379 (6.44) | 26 |
| Compressed archives | 131 (2.23) | 29 |
| Documents, web pages and reference text | 168 (2.86) | 69 |
| Web/API responses or request interfaces | 79 (1.34) | 3 |
| Waveform formats | 2 (0.03) | 2 |
| Source-code files | 1 (0.02) | 1 |
| Video formats | 2 (0.03) | 2 |
| Format not stated | 68 (1.16) | 2 |
| Total | 5,883 (100.00) | 135 distinct resources |
Table 7.
Curated data assets catalogued under Information Domain 4 (Geophysics, Geotechnical Baselines, and Seismological Records) for the 26 August 2026 Langtang disaster cascade.
Table 7.
Curated data assets catalogued under Information Domain 4 (Geophysics, Geotechnical Baselines, and Seismological Records) for the 26 August 2026 Langtang disaster cascade.
| Asset Title and Content Description | Technical Modality | Coordinate Extent / Station Location | Temporal Bounds | Access and Licensing Status | Canonical Repository Endpoint |
| USGS ComCat event GeoJSON summary (us7000tbwb): agency origin, location, magnitude and product links | Modality 2: Event GeoJSON | 28.271° N, 85.515° E (Point) | 2026-08-26T02:52:10Z | Direct Open Access; Public Domain | https://earthquake.usgs.gov/fdsnws/event/1/query?eventid=us7000tbwb&format=geojson |
| USGS ComCat QuakeML XML Event Description (us7000tbwb): Standardized seismological XML event entity | Modality 3: Time Series and Tabular Entity / QuakeML XML | 28.271° N, 85.515° E (Point) | 2026-08-26T02:52:10Z | Direct Open Access; Public Domain | https://earthquake.usgs.gov/fdsnws/event/1/query?eventid=us7000tbwb&format=quakeml |
| GFZ GEOFON event gfz2026qrfy: agency landslide solution, Mw 5.69 | Modality 3: Event catalogue record; FDSN text | 28.3° N, 85.5° E (agency location) | 2026-08-26T02:52:23.17Z | Publicly accessible catalogue; reuse licence not verified | https://geofon.gfz.de/fdsnws/event/1/query?eventid=gfz2026qrfy&format=text |
| Kakani, Nepal (NK.KKN) event-window waveform request: BHE, BHN and BHZ channels at 50 Hz | Modality 3: Waveform request / miniSEED | 27.800° N, 85.279° E (Point) | Requested window: 26 August 2026, 02:45–03:30 UTC | Public FDSN response confirmed: 752,640-byte miniSEED file received; continuity, scientific suitability and reuse terms remain unverified | https://service.iris.edu/fdsnws/dataselect/1/query?net=NK&sta=KKN&cha=BHZ,BHN,BHE&start=2026-08-26T02:45:00&end=2026-08-26T03:30:00&format=miniseed |
| Far-field single-force inversion archive (Huang et al. [10]): derived forces, station table, code and sensitivity results | Modality 7: Computational workflow and derived inversion archive | Global network of 47 selected stations | 26 August 2026; preferred force support −25.6 to +533.4 s relative to 02:52:10 UTC | Open archive; README specifies MIT for code and CC BY 4.0 for derived data; raw waveforms excluded | https://zenodo.org/records/22884627/files/far_field_force_inversion.zip |
| Near-field 1–2 Hz seismic radiation archive (Huang et al. [10]): self-normalised amplitudes and alternative tracking products | Modality 3: Time Series and Telemetry / Envelope Array | Himalayan region (16 stations) | 26 August 2026 analysis; exact data windows retained in archive configuration | Direct Open Access; Creative Commons Attribution 4.0 | https://zenodo.org/records/22884627/files/near-field-tracking.zip |
| Three-phase r.avaflow v4 simulation videos (Huang et al. [10]): imposed 200 million m³ source scenario | Modality 7: Simulation video outputs / MP4 | Modelled source and upper-valley corridor; exact footprint not verified | Simulation of the 26 August 2026 event; not an acquisition date | Direct Open Access; Creative Commons Attribution 4.0 | https://zenodo.org/records/22884627/files/Sup%20Videos.zip |
| USGS ComCat regional event query: 250 km radius around 28.21° N, 85.57° E | Modality 2: Catalogue query / GeoJSON | Query centre 28.21° N, 85.57° E; radius 250 km | Query parameters: 1 August to 31 August 2026, 00:00 UTC | Direct Open Access; Public Domain | https://earthquake.usgs.gov/fdsnws/event/1/query?format=geojson&latitude=28.21&longitude=85.57&maxradiuskm=250&starttime=2026-08-01&endtime=2026-08-31 |
Table 8.
Curated data assets catalogued under Information Domain 2 (Terrain, Geomorphology, and Cryospheric Source Detachment) for the 26 August 2026 Langtang disaster cascade.
Table 8.
Curated data assets catalogued under Information Domain 2 (Terrain, Geomorphology, and Cryospheric Source Detachment) for the 26 August 2026 Langtang disaster cascade.
| Asset Title and Content Description | Technical Modality | Coordinate Extent / Coverage Bounds | Temporal Bounds | Access and Licensing Status | Canonical Repository Endpoint |
| Copernicus DEM GLO 30 Central Nepal and Gyirong Elevation Grid (30 m Resolution) | Modality 1: Geospatial Raster / GeoTIFF | Regional product identified; study-area subset bounds not verified | Primary TanDEM-X acquisitions: 2011–2015; older gap-fill inputs | Free registered CDSE access under Copernicus DEM licence | https://dataspace.copernicus.eu/explore-data/data-collections/copernicus-contributing-missions/collections-description/COP-DEM |
| High Mountain Asia 8 m DEM mosaics, Version 1 (Shean [55], NSIDC) | Modality 1: Geospatial Raster / GeoTIFF | High Mountain Asia product; event-specific tile extent not verified | Source acquisitions: 28 January 2002–24 November 2016 | Free NASA Earthdata login required; product-specific terms apply | https://nsidc.org/data/hma_dem8m_mos/versions/1 |
| UNOSAT live web map and associated geodatabase, product 4256 | Modality 2: Web map and listed GDB ZIP | Published event mapping coverage; exact GDB bounds not verified | Created 26 August 2026; listed source imagery from 26–27 August | Public product record; GDB link listed; file retrieval and licence require separate assessment | https://unosat.org/products/4256 |
| Pléiades pre-event 2 m DEM, Berthier [63], version 2 | Modality 1: Geospatial Raster / GeoTIFF | Mapped rock–ice avalanche source area; EPSG:32645; WGS84 ellipsoidal heights | Acquisition: 13 October 2019; version 2 released 23 September 2026 | Open DEM; licence conflict: metadata CC BY 4.0, description CC BY-NC 4.0; raw imagery separately licensed | https://doi.org/10.5281/zenodo.22911264 |
| Copernicus DEM GLO-30 standard elevation tiles N28E085 and N27E085 | Modality 1: Copernicus GLO-30 elevation tiles | Combined tile bounds: 27°–29° N, 85°–86° E | Primary TanDEM-X acquisitions: 2011–2015; older gap-fill inputs | Anonymous public S3 access; Copernicus DEM licence | https://registry.opendata.aws/copernicus-dem/ |
Table 9.
Curated data assets catalogued under Information Domain 3 (Hydrology, Hydraulics, and Meteorology) for the 26 August 2026 Langtang disaster cascade.
Table 9.
Curated data assets catalogued under Information Domain 3 (Hydrology, Hydraulics, and Meteorology) for the 26 August 2026 Langtang disaster cascade.
| Asset Title and Content Description | Technical Modality | Coordinate Extent / Coverage Bounds | Temporal Bounds | Access and Licensing Status | Canonical Repository Endpoint |
| Depth-Averaged Mixture-Flow Forensic Manuscript (Park [11], EarthArXiv) | Modality 6: Data-Bearing Document / PDF | Upper avalanche corridor and downstream river-routing domain; exact grid bounds in model files | Event: 26 August 2026; reviewed preprint version 2: 7 September 2026 | Direct Open Access; Creative Commons Attribution 4.0 | https://doi.org/10.31223/X5250R |
| Mixture-Flow Simulation Code and Parameter Sets for 2026 Flood Routing Model (Park [11]) | Modality 7: Computational Workflow / Code | Model domain defined by archived inputs; exact bounds not independently verified | Archive version 1: 6 September 2026 | Direct open access; MIT licence | https://doi.org/10.5281/zenodo.22549896 |
| Mixture-flow reconstruction grids, diagnostics and videos (Park [11]), archived version 1 | Modalities 1, 3 and 7: NPZ/JSON grids, CSV results and MP4 outputs | Model domain defined by archived inputs; exact bounds not independently verified | Archive version 1: 6 September 2026 | Direct Open Access; Creative Commons Attribution 4.0 | https://doi.org/10.5281/zenodo.22549201 |
| Forensic Analysis of Early Warning System Latency and Flood Travel Time (Acharya [57], EarthArXiv) | Modality 6: Data-Bearing Document / PDF | Sites and reaches assessed in the preprint; no verified resource bounding box | 26 August 2026 event; publication version recorded at repository | Direct Open Access; Creative Commons Attribution 4.0 | https://doi.org/10.31223/x5hn5h |
| Devghat stage and discharge estimates in the official technical report | Modality 6: Official technical report / PDF | Devghat station; coordinates not verified in the report | 26 August 2026 operational chronology | Public report; reuse licence not specified | https://hydrology.gov.np/cm/files/Bhotekoshi-Trishuli-Narayani_Flood_Report_CHWRR_1%20_1787809133090.pdf |
| Hydrometric data-loss chronology in the official technical report | Modality 6: Official technical report / PDF | Named upstream gauging stations; no verified resource bounding box | 26 August 2026 operational chronology | Public report; reuse licence not specified | https://hydrology.gov.np/cm/files/Bhotekoshi-Trishuli-Narayani_Flood_Report_CHWRR_1%20_1787809133090.pdf |
| Wang, Mi and Lin [31] NASA POWER/MERRA-2 daily climate archive and analysis | Modalities 3 and 7: JSON/CSV data and Python code | Five grid-cell centres: 27.77°–28.77° N, 85.01°–86.01° E; not continuous coverage | 1 January 1981–31 August 2026; baseline 1991–2020 | MIT code; CC BY 4.0 derived data; original NASA data terms apply | https://doi.org/10.5281/zenodo.22806147 |
| Rapid warming in the Himalaya exacerbates geohazard cascades beyond adaptation limits (WWA [30]) | Modality 6: Data-Bearing Document / PDF | Himalayan regional and event-context analyses | Report published 15 September 2026 | Direct open access; CC BY-NC-ND 4.0 | https://doi.org/10.25560/136420 |
Table 10.
Earth-observation resources and products relevant to the 26 August 2026 cascade. Coverage and dates refer to the specified source or product; access and reuse conditions are recorded separately.
Table 10.
Earth-observation resources and products relevant to the 26 August 2026 cascade. Coverage and dates refer to the specified source or product; access and reuse conditions are recorded separately.
| Asset Title and Content Description | Technical Modality | Coordinate Extent / Coverage Bounds | Temporal Bounds | Access and Licensing Status | Canonical Repository Endpoint |
| International Charter activation 1052 and satellite acquisition information | Activation record / acquisition metadata | Nepal affected corridor; product-specific footprints | Activation: 26 August 2026; acquisitions vary by product | Public activation record; imagery access and reuse vary by product | https://disasterscharter.org/activations/flood-in-nepal-activation-1052- |
| International Charter activation 1052 value-added product collection | Maps and derived products; formats vary | Product-specific areas in Nepal | Individual product dates; initial displayed maps 28 August 2026 | Public product collection; check individual product and image terms | https://disasterscharter.org/activations/flood-in-nepal-activation-1052- |
| Copernicus EMSR927 AOI 01 Syapru Besi: Initial grading, version 1 | Vector layers / GeoPackage (with map and summary table) | AOI 01, Syapru Besi; use delivered AOI geometry | 27 August 2026 05:05 UTC; map released 27 August | Public derived products; HDX CC BY; source imagery has separate rights | https://rapidmapping.emergency.copernicus.eu/backend/EMSR927/AOI01/GRA_PRODUCT/EMSR927_AOI01_GRA_PRODUCT_v1.zip?type=gpkg |
| Copernicus EMSR927 AOI 02 Timure: Initial grading, version 2 | Vector layers / GeoPackage (with map and summary table) | AOI 02, Timure; use delivered AOI geometry | 27 August 2026 05:05 UTC; map released 28 August | Public derived products; HDX CC BY; source imagery has separate rights | https://rapidmapping.emergency.copernicus.eu/backend/EMSR927/AOI02/GRA_PRODUCT/EMSR927_AOI02_GRA_PRODUCT_v2.zip?type=gpkg |
| Copernicus EMSR927 AOI 03 Bidur: Grading monitoring 01, version 1 | Vector layers / GeoPackage (with map and summary table) | AOI 03, Bidur; use delivered AOI geometry | 27–28 August 2026 imagery; released 31 August | Public derived products; HDX CC BY; source imagery has separate rights | https://rapidmapping.emergency.copernicus.eu/backend/EMSR927/AOI03/GRA_MONIT01/EMSR927_AOI03_GRA_MONIT01_v1.zip?type=gpkg |
| Copernicus EMSR927 AOI 05 Phosretar: Grading; retrieved map states version 3 | Vector layers / GeoPackage (with map and summary table) | AOI 05, Phosretar; use delivered AOI geometry | 31 August 2026 imagery; retrieved map released 4 September | Public derived products; HDX CC BY; source imagery has separate rights | https://rapidmapping.emergency.copernicus.eu/backend/EMSR927/AOI05/GRA_PRODUCT/EMSR927_AOI05_GRA_PRODUCT_v1.zip?type=gpkg |
| UNOSAT Mudflow/Rockflow Impact Assessment in Rasuwa & Nuwakot (product 4259) | File geodatabase ZIP; exposure spreadsheet | Provider analysis area in Rasuwa and Nuwakot; approximately 350 km² | Imagery 26–27 August 2026; assessment 28 August | Public download; CC BY-SA (HDX record; version not specified) | https://unosat.org/products/4259 |
| UNOSAT Satellite-detected Mudflow/Rockflow Extent, Rasuwa (product 4257) | File geodatabase ZIP; exposure spreadsheet | Rasuwa assessment area; approximately 230 km² | Imagery 26–27 August 2026 | Public download; CC BY-SA (HDX record; version not specified) | https://unosat.org/products/4257 |
| UNOSAT Newly Formed Barrier Lakes, Rasuwa (product 4260) | File geodatabase ZIP; map and spreadsheet | Two interpreted barrier lakes near the source corridor | Cartosat-3 imagery 28 August 2026; published 31 August | Public download; CC BY-SA (HDX record; version not specified) | https://unosat.org/products/4260 |
| REACH/IMPACT Sentinel-1 likely-damage / unusual-change screening, version 3 | Shapefile screening layer and AOI; XLSX summaries | Provider-assessed AOI; 16 municipal summaries | Baseline 26 August 2025–26 August 2026; post-event 28 August 2026 | Public download; CC BY (HDX record; version not specified) | https://data.humdata.org/dataset/nepal-flash-flood-damage-assessment-using-sentinel-1-radar-data |
| HOT fAIr AI-scored building damage per OSM footprint | Vector features / GeoJSON and KML | Available SkySat post-event tile, upper Trishuli–Bhote Koshi | 27 August 2026 product date; release 28 August | Public download; CC BY (HDX record; version not specified) | https://data.humdata.org/dataset/hot_flood_npl_buildings_damage |
| ADRC disaster record and Sentinel Asia emergency-observation products | HTML event record; maps, vectors and imagery previews | Rasuwa event and individual product footprints | Activation 26 August 2026; product dates vary | Public event/product pages; some imagery access restricted | https://sentinel-asia.org/EO/2026/article20260826NP.html |
Table 11.
Exposure and infrastructure information sources for the 26 August 2026 cascade. Mapped proximity or exposure is distinguished from damage classification and field-reported condition; unresolved metadata are stated explicitly.
Table 11.
Exposure and infrastructure information sources for the 26 August 2026 cascade. Mapped proximity or exposure is distinguished from damage classification and field-reported condition; unresolved metadata are stated explicitly.
| Asset Title and Content Description | Technical Modality | Coordinate Extent / Coverage Bounds | Temporal Bounds | Access and Licensing Status | Canonical Repository Endpoint |
| Copernicus EMSR927 AOI 01 Syapru Besi grading | Vector layers / GeoPackage | AOI 01, Syapru Besi; use delivered AOI geometry | 27 August 2026 imagery; map version 1 | Public derived products; HDX CC BY; source imagery rights separate | https://data.humdata.org/dataset/npl-flood-emsr927 |
| Copernicus EMSR927 AOI 02 Timure grading | Vector layers / GeoPackage | AOI 02, Timure; use delivered AOI geometry | 27 August 2026 imagery; map version 2 released 28 August | Public derived products; HDX CC BY; source imagery rights separate | https://data.humdata.org/dataset/npl-flood-emsr927 |
| HOT fAIr AI-scored building damage per OSM footprint | Vector features / GeoJSON and KML | Available SkySat post-event tile, upper Trishuli–Bhote Koshi | 27 August 2026 product date; release 28 August | Public download; CC BY (HDX record; version not specified) | https://data.humdata.org/dataset/hot_flood_npl_buildings_damage |
| UNOSAT Mudflow/Rockflow Impact Assessment in Rasuwa & Nuwakot (4259) | File geodatabase ZIP and exposure spreadsheet | Provider assessment area; approximately 350 km² | Imagery 26–27 August 2026; assessment 28 August | Public download; CC BY-SA (HDX record; version not specified) | https://data.humdata.org/dataset/mudflow-rockflow-impact-assessment-in-rasuwa-nuwakot-districts-bagmati-province-nepal-as-o |
| Planetary Response Network: Nepal Flooding—Road Blockages | Point shapefile (WGS 84 / EPSG:4326) | Assessed primary/secondary roads in Rasuwa, Nuwakot and Kathmandu | 28 August 2026 assessment | Public download; CC BY (HDX record; version not specified) | https://data.humdata.org/dataset/nepal-flooding-road-blcokages |
| HOT volunteer-reported bridge damage assessment | Vector points / GeoJSON | Assessed bridges in the flood corridor; coverage follows field reports | Post-event volunteer reports; resource updated 29 August 2026 | Public download; ODbL (broader HOT dataset record) | https://data.humdata.org/dataset/hot_flood_npl |
| IRDR Special Report: Risk assessment of Debris Flows along the China-Nepal Transportation Corridor | Technical report / PDF (7 pages) | China–Nepal Transportation Corridor | Published 30 August 2026; underlying baseline assessment | Public PDF; report reuse licence not stated | https://www.irdrinternational.org/knowledge_pool/publications/145 |
| Bhattarai and Adhikari [39]: From Himalayan Catastrophe to National Resilience | SocArXiv preprint / PDF; narrative policy synthesis | Bhote Koshi–Trishuli disaster and national policy context | Version 1 published 5 September 2026 | Public download; CC BY 4.0 | https://doi.org/10.31235/osf.io/hzgae_v1 |
Table 12.
Scientific literature and humanitarian information resources identified for the cascade. Publication status, source identity and access conditions are reported separately; unresolved entries are not treated as evidence for event claims.
Table 12.
Scientific literature and humanitarian information resources identified for the cascade. Publication status, source identity and access conditions are reported separately; unresolved entries are not treated as evidence for event claims.
| Asset Title and Content Description | Technical Modality | Coordinate Extent / Coverage Bounds | Temporal Bounds | Access and Licensing Status | Canonical Repository Endpoint |
| Acharya and Paudel [57]: Warning latency exceeded flood travel time | EarthArXiv preprint / PDF | Bhote Koshi–Trishuli–Narayani warning chronology | 26 August 2026 event; post-event reconstruction | Public preprint; CC BY 4.0 | https://doi.org/10.31223/X5HN5H |
| Xu [37]: The 26 August 2026 Langtang Lirung ice–rock avalanche and its transboundary cascade: a multi-source observational reconstruction in the Bhote Koshi basin | EarthArXiv preprint / PDF | Lhende Khola–Bhote Koshi cascade and downstream corridor | 26 August 2026 event; version 2 dated 1 September 2026 | Public preprint; CC BY 4.0 (registrar metadata) | https://doi.org/10.31223/X56793 |
| Gujree [58]: A cascade, not a flood—testing competing accounts | EarthArXiv preprint / PDF | Selected source sector and Lhende–Bhote Koshi cascade | Historical water observations 2019–2025; 2026 event | Public preprint; preprint licence not independently verified | https://doi.org/10.31223/X51J54 |
| Asadollahi [61]: Multi-Sensor Satellite-Based Retrospective Early-Warning Assessment | EarthArXiv preprint / PDF | Study-defined Langtang region and glacier/water masks | 2020–2025 precipitation baseline and 2026 event period | Public preprint; reuse licence not independently verified | https://doi.org/10.31223/X5KB85 |
| Carlà, Tofani and Casagli [56]: Very-high-resolution optical imagery reveals key clues to the Langtang Lirung ice–rock avalanche | EarthArXiv preprint / PDF | Study-defined source sector; numerical bounding box not verified | Pre-event and post-event observations; version 1 published 14 September 2026 | Public preprint; CC BY-NC-ND 4.0 | https://doi.org/10.31223/X5WB9B |
| Wang et al. [8]: Precursor of a powerful large glacier landslide causing tsunami floods in the 26 August 2026 Nepal disaster | Journal article / PDF | Study-defined glacier and cascade area | Pre-event observations and 2026 event; published 14 September 2026 | Publisher access; open reuse licence not verified | https://doi.org/10.1007/s10346-026-02842-6 |
| Silwal et al. [9]: Glacier changes in Langtang Catchment, Central Nepalese Himalaya from Little Ice Age (~1815 CE) to 2023 CE | Journal article / PDF | Langtang Himal; study-defined glacier inventory | Glacier reconstruction from approximately 1815 to 2023; published online 8 June 2026 | Public article; CC BY 4.0 (Crossref licence metadata) | https://doi.org/10.1016/j.gloplacha.2026.105555 |
| Clarke et al. [30]: Rapid warming in the Himalaya exacerbates geohazard cascades beyond adaptation limits | World Weather Attribution Scientific Report 92 / PDF | Study-defined regional and elevation domains | Study-specific historical and 2026 comparison windows; published 15 September 2026 | Public report; CC BY-NC-ND 4.0 | https://doi.org/10.25560/136420 |
| ICIMOD Kyirong–Rasuwa Flood 2026 mutable source index | Institutional web resource / HTML | Nepal–China event corridor and regional context | Index established 28 August 2026; current page modified 28 September; later additions outside evidence cutoff | Public HTML index; no open redistribution licence established; current page is not a frozen pre-cutoff synthesis | https://www.icimod.org/kyirong-rasuwa-flood-2026-nepal-china-border/ |
| UNICEF Nepal Humanitarian Situation Report No. 1 (Rasuwa Flood) | Situation report / PDF (8 pages) | Rasuwa, Nuwakot, Dhading, Gorkha and Tanahun districts | Information as of 31 August 2026 | Public PDF; reuse licence not stated in examined report | https://www.unicef.org/documents/nepal-humanitarian-situation-report-no1-rasuwa-flood-31-august-2026 |
| IOM Nepal Flood Response Situation Report No. 1, 27 August 2026 | Situation report / PDF | Rasuwa, Nuwakot and Dhading; broader response context | Information as of 27 August 2026 | Public report; reuse licence not verified | https://reliefweb.int/report/nepal/nepal-flood-response-situation-report-1-27-august-2026 |
| Sah [59]: No detectable precursor in Sentinel-1 backscatter | EarthArXiv preprint / PDF; GRD amplitude analysis | Single-orbit source-sector scene and terrain-matched controls | Pre-event 29 June–16 August; comparison 16–28 August 2026 | Public preprint; CC BY 4.0 | https://doi.org/10.31223/X59N5N |
| Pradhan [60]: Was the pre-event SWIR anomaly a genuine glacier-collapse precursor? | EarthArXiv preprint / PDF; historical and multi-glacier controls | Tsangbu Ri target and 17 matched control glaciers | 2000–2025 baseline and 2026 case; v3 published 19 September | Public preprint; CC BY-NC 4.0 | https://doi.org/10.31223/X56F8S |
Disclaimer/Publisher’s Note: The statements, opinions and data contained in all publications are solely those of the individual author(s) and contributor(s) and not of MDPI and/or the editor(s). MDPI and/or the editor(s) disclaim responsibility for any injury to people or property resulting from any ideas, methods, instructions or products referred to in the content. |
© 2026 by the authors. Licensee MDPI, Basel, Switzerland. This article is an open access article distributed under the terms and conditions of the Creative Commons Attribution (CC BY) license.
Copyright: This open access article is published under a Creative Commons CC BY 4.0 license, which permit the free download, distribution, and reuse, provided that the author and preprint are cited in any reuse.