
Submitted:
03 October 2026
Posted:
07 October 2026
You are already at the latest version
Abstract
Spaza shops are central to food access and livelihoods in South African townships, yet little is known about how they combine digital payments with persistent cash use and partial formalisation. This convergent mixed-methods study surveyed a stratified random sample of 150 spaza owners in Tlhabane Township, Rustenburg, and conducted 19 semi-structured interviews with owners and key informants. Immigrant entrepreneurs owned 86.7% of shops. Respondents reported 2.25 payment device or platform mentions per shop, led by Flash (63.3%) and Yoco (54.0%), yet 95.9% preferred cash, 87.8% received most sales in cash, and 76.3% of employers paid wages in cash. Customer preference (96.0%) and convenience (95.3%) dominated reasons for cash use, and 50.7% also cited tax avoidance. Interviews suggested that owners use vending platforms and card terminals for different purposes, and that cash-only supplier deliveries and slow card settlement keep cash floats essential. Registration was selective: 91.3% were registered with municipal or provincial authorities and 78.7% with protection associations, but only 10.7% each with the tax authority and the companies registry. The findings reveal a hybrid cash–digital ‘dual operational reality’ and selective formalisation. Digitalisation policy should combine supplier-side instant payments, simplified tax and transparent engagement with associational governance.
Keywords:
spaza shops
; digital payments
; informal economy
; selective formalisation
; township economy
; financial inclusion
; technology adoption
; South Africa
1. Introduction
Spaza shops (small, home-based convenience retailers that sell groceries, airtime, prepaid electricity and household goods in small quantities) are among the most visible enterprises in South Africa’s townships. They place staple foods within walking distance of low-income households, extend informal credit, sell in units that match daily budgets, and provide self-employment and casual jobs where formal employment is scarce [1,2,3]. Small-area censuses of township economies have shown that spaza shops are among the most common categories of informal enterprise, and that the sector has been restructured over the past two decades by the entry of immigrant entrepreneurs, who brought new business models built on bulk buying, low margins, long trading hours and kin-based networks [4,5,6,7]. That restructuring has been accompanied by competition, recurrent xenophobic violence and a policy debate about who should be allowed to trade [8,9].
Two developments have made the sector a policy priority. First, the payments landscape available to micro-retailers has changed rapidly. Low-cost mobile card readers, bank-issued merchant devices and prepaid-vending platforms now compete for township merchants, and in March 2023 the South African Reserve Bank and the national clearing house launched PayShap, a real-time, low-value payment rail designed in part to reduce reliance on cash [10]. Cross-country evidence suggests that digital payment adoption is associated with faster growth, better access to credit and a modest shrinking of informal employment [11], and that digital payments can lower transaction costs, improve record-keeping and reduce the security risks of holding cash for entrepreneurs [12,13]. Second, a wave of foodborne illness in late 2024, which the President linked to the deaths of at least 22 children, prompted a national order that all spaza shops and food-handling outlets register with their municipalities within 21 days, together with a R500 million fund to support township and rural businesses [14]. The registration deadline was later extended to 28 February 2025 [15]. Digitalisation and formalisation have therefore moved to the centre of the policy conversation about the township economy at the same time.
Despite this, the evidence on how spaza shops actually use digital payments remains thin and fragmented. Existing South African studies have documented barriers to technology adoption among informal and township enterprises, such as limited digital skills, cost, connectivity, security and access to information [16,17,18,19], and a small number of case studies have examined electronic payment adoption by spaza owners in specific townships [20]. Three gaps stand out. First, most studies treat adoption as a binary outcome, whether a shop has a card machine or not, rather than asking how much of the business actually runs digitally across customer sales, supplier payments and wages. Second, digital adoption is rarely analysed together with formal registration, even though the two are linked in both theory and policy: digital payments leave records that tax and regulatory authorities can see [21,22]. Third, the evidence base is concentrated in the metropolitan areas of Cape Town, Johannesburg and Durban; secondary and mining towns, where migrant labour, cash wages and immigrant-owned retail interact differently, are under-studied [9].
This study addresses these gaps through a case study of spaza shops in Tlhabane Township, Rustenburg, in the platinum-mining belt of North West Province. It asks four research questions:
- RQ1: To what extent, and through which devices and platforms, have spaza shops in Tlhabane adopted digital payment acceptance?
- RQ2: Why does cash remain the preferred medium of exchange?
- RQ3: How far do digital practices extend from customer sales into internal operations such as wage payments?
- RQ4: With which public and private bodies are spaza shops registered, and what does this pattern imply for formalisation policy?
The study makes three contributions. Empirically, it provides survey estimates with confidence intervals for a secondary-city township that is absent from the literature, and it distinguishes between owning a payment device and transacting digitally. Conceptually, it combines a technology–organisation–environment view of adoption with an institutional view of informality to explain why digital acceptance can coexist with persistent cash use and partial formalisation. Here we call this a dual operational reality and selective formalisation. For policy, it shows that the 2024–2025 registration drive and payment-system innovations such as PayShap address different parts of the same problem, and it identifies the complementary measures needed to link them in support of Sustainable Development Goals 1, 8, 9 and 10 [23].
The remainder of the paper is organised as follows. Section 2 reviews the literature and presents the conceptual framework. Section 3 describes the study area, design and methods. Section 4 reports the results, Section 5 discusses them together with their policy implications and limitations, and Section 6 concludes.
2. Literature Review and Conceptual Framework
2.1. The Changing Spaza Sector
The spaza shop emerged under apartheid as a home-based response to restrictions on Black-owned business in townships, and for most of its history it was a survivalist, family-run activity [4]. From the early 2000s, immigrant entrepreneurs from Somalia, Ethiopia, Bangladesh, Pakistan and elsewhere entered the sector in large numbers. Studies in Cape Town and Gauteng attribute their competitiveness to collective bulk purchasing, low mark-ups, extended opening hours, reinvestment of profits, and partnership or employment arrangements that draw on co-ethnic networks [6,7]. In a survey of 1051 spaza shopkeepers across eleven sites in three cities, Piper and Charman found that foreign owners accounted for just over half of the sample, with large variation between sites [7]. Customers value spaza shops for proximity, convenience, small pack sizes, credit and personal relationships with the shopkeeper [1]. The same studies record serious vulnerabilities. Immigrant owners report violent attacks, extortion and police harassment at far higher rates than South African owners, and many are excluded from formal banking [8,9]. Independent retailers more generally report finance and marketing as their main constraints [24], and township food retail supply chains remain fragmented and cash-intensive [25].
2.2. Digital Payments, Informality and Financial Inclusion
The development literature identifies several channels through which digital payments can benefit micro-entrepreneurs. They lower the cost and risk of handling cash, create a transaction history that can support credit applications, make it easier to pay suppliers and staff remotely, and connect merchants to customers who no longer carry cash [12,13,26]. The best-known evidence comes from mobile money in Kenya, where adoption improved households’ ability to share risk and was associated with long-run reductions in poverty [27,28]. Comparative work on M-Pesa, India’s UPI, Brazil’s Pix and Peru’s Yape shows that adoption depends on the interaction between private providers, regulators and interoperability rules, and that there is no single template [29]. At the macro level, digital payment adoption is associated with higher per capita growth and a small decline in the informal employment share [11].
The same visibility that makes digital payments useful also makes them unattractive to some informal operators. Electronic transactions leave records that can be used to verify turnover, so cashless payments can reduce tax evasion [21]. Conversely, firms that want to stay outside the tax net have an incentive to keep transacting in cash. In South Africa, the interaction between the informal economy and the tax system involves VAT thresholds, presumptive taxation through the turnover-tax regime for micro-businesses, and the costs of compliance relative to the benefits of registration [22,30]. Financial exclusion also limits adoption. High bank fees, documentation requirements and mistrust of banks are recurring barriers for poor and low-income South Africans [31], and they bear particularly heavily on immigrants with insecure documentation [9].
2.3. Technology Adoption in Micro-Enterprises
Individual-level models such as the Technology Acceptance Model and the Unified Theory of Acceptance and Use of Technology explain adoption through perceived usefulness, ease of use, social influence and facilitating conditions [32,33]. Diffusion of innovations theory adds the perceived relative advantage, compatibility, complexity, trialability and observability of an innovation [34]. For firms, the technology–organisation–environment (TOE) framework is widely used. It attributes adoption to the characteristics of the technology, the resources and structure of the organisation, and the external environment of customers, suppliers, competitors and regulators [35,36]. TOE is particularly suitable for spaza shops because adoption decisions there are made by owner-managers who are strongly influenced by customers and suppliers. Studies of South African township and informal enterprises find barriers in all three domains: device and data costs and unreliable connectivity (technology), limited digital skills and record-keeping (organisation), and customer habits, crime and weak institutional support (environment) [16,17,18,19,20].
Payment acceptance also has the features of a two-sided platform market, in which the value of a payment instrument to a merchant depends on how many customers use it and vice versa. Merchants may therefore hold several instruments at once, or multi-home, to reach different customer groups [37]. In township retail, where most customers still carry cash, the network benefits of any one digital instrument are limited, and this helps explain why adoption can be broad but shallow.
2.4. Institutional Theory, Selective Formalisation and Informal Governance
Informal entrepreneurship is increasingly understood not simply as necessity-driven survivalism but as a heterogeneous set of strategies through which entrepreneurs respond to institutional conditions [38,39,40]. In institutional theory, formal institutions (laws, regulations and their enforcement) and informal institutions (norms, values and shared beliefs) jointly shape economic behaviour [41]. Webb and colleagues define informal entrepreneurship as activity that is illegal under formal institutions but legitimate in the eyes of large social groups, and argue that it thrives where the two sets of institutions are misaligned [42]. From this perspective, formalisation is not a single step but a sequence of choices about which authorities to engage. Because the costs and benefits of each registration differ, firms may engage selectively [43], and many informal firms gain little from full formal status [44]. Informality remains the dominant mode of employment in many developing economies [45], and in South African townships informal institutions include community and trader associations that regulate entry, mediate disputes and offer protection, sometimes coercively [7,8].
2.5. Conceptual Framework
Figure 1 integrates these perspectives. TOE factors shape payment practice, which is defined across three transaction domains (customer acceptance, the share of sales actually settled digitally, and internal payments such as wages) rather than as the binary ownership of a device. Payment practice and formalisation outcomes are mutually reinforcing: digital transactions create the records that formal registration relies on, while registration with national authorities raises the visibility costs of cash. The institutional lens explains why this loop may stall. Where informal institutions such as cash norms, trust-based supplier relationships and associational protection meet owners’ immediate needs more cheaply than formal ones, owners can adopt digital tools for convenience while keeping most of the business in cash, and register with the authorities that control day-to-day trading while avoiding those that tax. The framework guided the design of the survey and interview instruments and is used to organise the discussion.
3. Materials and Methods
3.1. Study Area
Tlhabane is a township in the Rustenburg Local Municipality, Bojanala Platinum District, North West Province, a few kilometres west of the Rustenburg central business district. Rustenburg is the hub of South Africa’s western platinum belt, and its economy and settlement pattern have been shaped by mining employment, migrant labour and rapid informal settlement growth. These features make it a useful contrast to the metropolitan townships in which most spaza research has been conducted [5,9]. At the 2011 census, the Tlhabane main place had 50,073 residents living in 17,545 households [46]. Spaza shops in the township trade under the by-laws and business registration processes of the Rustenburg Local Municipality, which was responsible for implementing the 2024–2025 national spaza registration drive locally [14,15].
3.2. Research Design
The study used a cross-sectional, convergent mixed-methods case study design [47,48]. A structured survey of spaza shop owners measured the prevalence of payment practices and registration. Semi-structured interviews with a sub-sample of owners and with key informants were conducted during the same fieldwork period to explain the survey patterns and identify mechanisms that a questionnaire could not capture. The two strands were analysed separately and then integrated at the interpretation stage, with qualitative themes used to explain, qualify or challenge the survey estimates. The integration is summarised in a joint display at the end of Section 4.6. The data were collected as part of a broader study of entrepreneurship success factors among South African and immigrant entrepreneurs in the informal trading sector of North West Province; this article reports the payment, wage and registration components of that study.
3.3. Sampling and Survey Administration
The target population comprised owner-operators of spaza shops trading in Tlhabane at the time of fieldwork. Because municipal records tend to under-count informal businesses, the research team compiled a field listing of all active, visible spaza shops during a pre-fieldwork mapping exercise. This listing of N = 450 shops served as the sampling frame, giving every listed shop a known, non-zero probability of selection. The frame was stratified by two variables: geographic location (township sections and extensions), to capture spatial variation within Tlhabane, and owner nationality (South African or foreign), to reflect the composition of the local trading sector. Crossing the two variables produced eight strata. A sample of n = 150 shops, one-third of the frame, was drawn at random from the strata with proportional allocation, so that each stratum is represented in the sample in proportion to its size in the frame.
For a proportion of 0.5, a sample of 150 gives a maximum margin of error of ±8.0 percentage points at the 95% confidence level. Because the sample is one-third of a finite frame, a finite-population correction would reduce this to about ±6.5 points. The intervals reported in this paper are not corrected for the finite population or the stratified design and are therefore conservative.
The questionnaire contained closed and multiple-response items in five sections: (i) owner and business profile; (ii) product mix; (iii) payment preferences and the main payment medium for sales; (iv) payment devices and platforms in use and the reason for choosing them; and (v) wage payment practices and registration with public and private bodies. Items on payment devices, reasons for cash preference and registration allowed more than one response. A team of trained fieldworkers administered the questionnaire face to face in October 2025, in English or Setswana according to the respondent’s preference, and captured responses directly on an electronic form (Google Forms) to reduce data-entry errors. The instrument had first been piloted with five spaza owners trading outside the sampled area to refine question wording and check consistency between the two language versions. Item non-response reduced the effective sample to between 145 and 150 for some items, and the base for each estimate is reported.
3.4. Interviews
The qualitative strand comprised 19 semi-structured interviews. Fifteen were held with spaza shop owners purposively selected from the survey respondents for maximum variation on three axes: owner nationality (South African and foreign); shop age, from recently established businesses to those trading for ten years or more; and level of digital adoption, from cash-only “low adopters” to “high adopters” using card machines, mobile money or digital supplier platforms. Four key-informant interviews were conducted to triangulate the owners’ accounts: one with a local mobile point-of-sale (mPOS) field representative, on infrastructure, transaction fees and barriers to uptake; one with a leader of a local traders’ protection association, on safety, informal governance and collective bargaining; and two with local economic development and licensing officials of the Rustenburg Local Municipality, on by-laws, zoning and formalisation.
The interview guide followed the conceptual framework (Figure 1). It covered reasons for choosing particular payment devices, experiences with transaction fees, settlement and connectivity, customer and supplier payment habits, wage arrangements, and motives for registering or not registering with each authority. Interviews lasted 45–60 min and were conducted in Setswana, English or another language preferred by the participant. With the participants’ verbal and written permission, they were audio-recorded, transcribed verbatim and translated into English. Recruitment and concurrent analysis stopped when additional interviews produced no new codes or themes [49].
3.5. Data Analysis
Survey data were analysed descriptively. For each indicator we report the number of respondents, the percentage and a 95% Wilson score confidence interval, which performs better than the normal approximation for small samples and proportions close to 0 or 1 [50]. For multiple-response items, percentages are calculated over all 150 respondents and can sum to more than 100%. Two derived indicators were calculated: the number of device or platform mentions per shop (the total number of mentions divided by 150), and the distribution of wage-payment methods among shops that have employees. Response distributions were exported from Google Forms, and confidence intervals were computed in Python. Because the data available for this paper are aggregate response distributions, associations between variables (for example, between owner nationality and adoption) were not tested. This limitation is discussed in Section 5.7.
Interview transcripts were analysed thematically following the six phases described by Braun and Clarke [51]: familiarisation, initial coding, theme generation, review, definition and write-up. A hybrid approach was used, combining deductive codes derived from the TOE and institutional constructs in Figure 1 with inductive codes that emerged from the transcripts. The first author coded all transcripts, and a second researcher independently coded a 20% subset; discrepancies were discussed and resolved by consensus. Data were managed and coded in NVivo 15 (Lumivero, Denver, CO, USA). In Section 4.6, each theme is presented alongside the survey estimate it helps to explain. Owners are identified by code (P01–P15), nationality and shop age, and key informants by code (KI1–KI4).
3.6. Ethical Considerations
The study received full ethical approval from the Institutional Research Ethics Committee of the Durban University of Technology (DUT-IREC) as part of the study “Entrepreneurship success factors in the South African informal trading sector: A comparison of South African and immigrant entrepreneurs in North West Province” (clearance number IREC 056/25; date of approval 28 August 2025). Gatekeeper permission was obtained before data collection and acknowledged by the committee. All participants received an information sheet, gave informed consent before participating and could withdraw at any time. Because some questions concerned tax and registration status, no names, shop addresses or identity numbers were recorded with survey responses, and interview excerpts are reported using codes. Participation was voluntary and unpaid.
3.7. Use of Generative Artificial Intelligence
During the preparation of this manuscript the authors used Claude (Anthropic; model Opus 5.5) to draw the conceptual diagram (Figure 1) . The authors have reviewed and edited the output and take full responsibility for the content of this publication.
4. Results
4.1. Profile of Owners and Shops
Of the 150 shops surveyed, 130 (86.7%) were owned by immigrant entrepreneurs and 20 (13.3%) by South Africans (Table 1). Because the sample was stratified by owner nationality with proportional allocation, this split reproduces the composition of the sampling frame rather than being an estimate subject to sampling error. Ownership in both groups was predominantly male: more than 90% of immigrant owners and more than 79% of South African owners were men. Immigrant owners were concentrated in the 40–45 year age band, while South African owners spanned a wider band of 35–50 years. The clearest difference concerned business age. Immigrant-owned shops had typically been trading for 3–5 years, whereas South African-owned shops had typically been trading for more than 10 years. This pattern is consistent with a sector in which a long-established core of South African owners has been overtaken numerically by a more recent and larger wave of immigrant entrants [4,6], although a single cross-sectional survey cannot establish this trend. Because only 20 South African owners were surveyed, comparisons between the two groups are indicative only.
Almost all shops (145 of 150; 96.7%, 92.4–98.6%) sold non-branded products that were prepared, baked or repackaged on site or by local suppliers, such as bread, achaar and snacks. These products are typically sold in small units and at higher margins than branded goods, and they make up a significant part of the spaza value proposition.
4.2. Payment Practice across Transaction Domains
Table 2 summarises the main indicators, and Figure 2 compares payment practice across the three transaction domains. Cash dominated all three. Of the 145 owners who answered the question, 95.9% (91.3–98.1%) preferred to be paid in cash and only 4.1% (1.9–8.7%) preferred card. When asked how most of their sales were actually paid, 87.8% (81.6–92.2%) of 148 respondents said cash and 12.2% (7.8–18.4%) said card. Thus about one shop in eight already received most of its sales revenue digitally, roughly three times the share that preferred digital payment. This suggests that, for some shops, customer demand rather than owner preference is driving digital uptake.
The digital share appeared higher for wages than for sales, although the bases differ and the confidence intervals overlap. Of 149 respondents, 58.4% paid employees in cash, 16.1% used a cell phone or banking app, 2.0% used a bank transfer, and 23.5% had no employees. Among the 114 shops with employees, 76.3% (67.7–83.2%) paid wages in cash and 23.7% (16.8–32.3%) paid them digitally. None of the respondents selected the payroll-system option.
4.3. Reasons for Preferring Cash
The reasons given for preferring cash are shown in Figure 3. They fall into three groups. Market and cash-ecosystem reasons dominated: customer preference (96.0%, 91.5–98.2%) and convenience (95.3%, 90.7–97.7%) were cited by almost everyone, and about half cited the absence of cash-float problems (53.3%, 45.4–61.1%) and the need to pay suppliers in cash (50.0%, 42.1–57.9%). Regulatory avoidance was the next most important reason: 50.7% (42.7–58.6%) said that they did not want to pay tax. Financial exclusion was rarely cited. Only 2.0% (0.7–5.7%) reported having no bank account, and the same proportion reported distrust of banks.
4.4. Payment Devices and Platforms
Respondents reported using a wide range of payment devices and platforms (Figure 4a). Flash (63.3%, 55.4–70.6%) and Yoco (54.0%, 46.0–61.8%) were the most common, followed by Capitec (32.0%) and iKhokha (30.7%). Kazang devices together accounted for mentions equal to 19.3% of respondents (Timpa X, 12.0%; Timpa 3, 7.3%; some shops may hold both), and Shop2Shop (9.3%), Thrive by Standard Bank (6.7%), PayShap (6.0%) and VodaPay (3.3%) were less common. Device and platform mentions summed to 224.7% of respondents, an average of 2.25 mentions per shop. This indicates widespread multi-homing: shops typically hold more than one device or service, combining card-acceptance terminals with prepaid-vending and value-added-service platforms. The main reason for choosing a device was its functions, such as integration, receipt options and additional features (52%), followed by operational characteristics such as portability and connectivity (35%). Cost was the main reason for only 7% of respondents, and other reasons for 5% (Figure 4b; the shares sum to 99% because of rounding in the source tabulation, and the base for this item was not recorded separately).
The contrast between Figure 2 and Figure 4 is the central quantitative finding of the study. Ownership of digital payment infrastructure is widespread and diversified, but digital payment is the main sales channel for only 12.2% of shops. Most shops can accept a card or sell a digital service, yet only about one in eight receives most of its sales revenue digitally.
4.5. Registration and Governance
Registration was common but uneven across authorities (Figure 5). Most owners were registered with a municipal or provincial authority (91.3%, 85.7–94.9%), and a large majority were affiliated with a trader or community protection association (78.7%, 71.4–84.5%). By contrast, only 10.7% (6.7–16.6%) were registered with the South African Revenue Service (SARS) and the same share with the Companies and Intellectual Property Commission (CIPC). A residual 6.0% (3.2–11.0%) were not registered with any body. Registration is therefore concentrated in the bodies that govern the day-to-day right to trade, namely the municipality and the association, and is low for the national bodies that confer legal personality and tax status.
4.6. Qualitative Insights
The interviews help explain several of the survey patterns. Five themes emerged from the owner interviews (Section 4.6.1, Section 4.6.2, Section 4.6.3, Section 4.6.4 and Section 4.6.5). Each is presented below alongside the survey estimate it helps to explain. Section 4.6.6 reports the key informants’ perspectives, and Table 3 integrates the two strands.
4.6.1. Device Specialisation and Multi-Homing
The survey showed that shops typically hold more than one payment device or platform, led by Flash (63.3%), Yoco (54.0%) and Capitec (32.0%) (Figure 4a). The interviews explain why. Owners drew a sharp functional distinction between value-added-services (VAS) vending platforms and card-acceptance terminals. They described Flash and Kazang mainly as tools for selling airtime, electricity and digital vouchers, which earn commission and bring customers into the shop. Dedicated mPOS devices such as Yoco and iKhokha, by contrast, were used almost exclusively to accept debit cards. A second card device also served as a hedge against network downtime:
“I keep the Flash machine strictly for electricity, airtime, and when people want to buy those 1Voucher PINs. It brings people into the shop. But for swiping bank cards, I use the Yoco machine because it connects faster when someone wants to pay for groceries.”(P03, immigrant owner, shop age 6 years)
“You cannot rely on just one provider. If the Capitec network is down or lagging, I pull out the iKhokha device so I don’t lose the sale. The customers here don’t like to wait.”(P11, South African owner, shop age 3 years)
4.6.2. Cash Ecosystems: Customers and Suppliers
Customer preference (96.0%) and convenience (95.3%) were the leading reasons for preferring cash, and half of the respondents (50.0%) said that suppliers had to be paid in cash (Figure 3). The interviews describe both ends of this cash ecosystem. Downstream, many customers are pension recipients or casual workers paid in cash, and a shop that refuses notes loses the customer to a competitor nearby. Upstream, delivery drivers for soft-drink and wholesale suppliers expect cash on delivery, so owners must keep a substantial cash float:
“Most of my daily customers are pension beneficiaries or casual workers who get paid in physical cash. They come here with notes, so I have to take them. If I refuse cash, they will just walk to the next spaza.”(P06, South African owner, shop age 8 years)
“The main issue is the stock delivery trucks. When the Coca-Cola or wholesale truck comes to drop off soft drinks or flour, the drivers demand hard cash right there. They do not accept card payments or phone transfers from us, so I must keep a heavy cash float in the shop.”(P14, immigrant owner, shop age 2 years)
4.6.3. Fees, Settlement, Connectivity and Security
Owners chose devices mainly for their functions (52%) and operational characteristics (35%) rather than cost (7%) (Figure 4b). In the interviews, transaction fees were likewise treated as secondary to liquidity, signal reliability and physical safety. Card payments reduce the cash that makes a shop a target for robbery. However, fluctuating network coverage causes disputes when a transaction fails part-way, and settlement delays over weekends lock up the working capital needed for restocking:
“The card machines are good because carrying too much cash makes you a target for tsotsis [criminals]. If the money is in the bank, it is safe from theft. But the network in Tlhabane fluctuates constantly. If the device loses connection mid-transaction, it creates arguments with customers about whether the money left their account.”(P02, immigrant owner, shop age 4 years)
“I don’t mind the small fee Yoco takes from a swipe. My biggest problem is the settlement delay. If I swipe a card on a Friday, the money sometimes only reflects in my bank account on Monday or Tuesday. I cannot buy fresh bread or milk at the wholesale market on Saturday morning if my capital is locked up in the machine.”(P09, South African owner, shop age 5 years)
4.6.4. Wage Arrangements
Of all respondents, 58.4% paid wages in cash and 18.1% paid them digitally, while 23.5% had no employees (Figure 2). Owners described employment terms that are local, flexible and based on unwritten, trust-based agreements. Wages are set weekly or monthly and paid directly from the shop’s cash drawer, sometimes to employees who have no bank account and would pay fees to withdraw a digital wage:
“My shop assistant lives nearby. We agreed on a weekly cash wage of R800. At the end of every Saturday, I just count the cash from the drawer and hand it to him. He does not have a formal bank account, and paying him digitally would just mean he has to pay bank fees to take it out.”(P07, immigrant owner, shop age 5 years)
4.6.5. Selective Registration and Associational Protection
Most shops were registered with a municipal or provincial authority (91.3%) or affiliated with a protection association (78.7%), but few were registered with SARS or CIPC (10.7% each) (Figure 5). Half of the respondents also linked their preference for cash to not wanting to pay tax (50.7%; Figure 3). The interviews show the reasoning behind this hierarchy. Owners obtain municipal trading permits to avoid closure and confiscation of stock by law enforcement, and they join protection associations for security and dispute resolution. National registration, by contrast, was seen as a costly compliance burden with no local benefit:
“We register for the local municipal trading permit because if the metro police come and you don’t have it, they lock the shop and confiscate your stock. It is about survival. But registering for CIPC or SARS makes no sense for a small spaza. It brings extra costs and audits for money we don’t even make.” (P01, South African owner, shop age 10 years)
“I pay R150 every month to our local traders’ protection association. If there is a break-in, a xenophobic threat, or a dispute with a local supplier, the association committee comes to intervene and protect us. The national government and SARS do nothing to protect my shop in Tlhabane, so why should I register with them?”(P12, immigrant owner, shop age 4 years)
4.6.6. Key-Informant Perspectives
The four key informants corroborated the owners’ accounts and added detail on the structural constraints behind them. The mPOS representative (KI1) said that slow card-settlement timelines push owners to keep a secondary device. This is consistent with the backup-device strategy described in Section 4.6.1 and the settlement problem described in Section 4.6.3. The protection-association leader (KI2) emphasised informal networks as the owners’ main source of security, in line with the owners’ reasons for joining associations (Section 4.6.5). The two municipal officials (KI3 and KI4) acknowledged that local trading permits serve mainly as regulatory shields that allow shops to keep trading, rather than as pathways to business growth. They also acknowledged that municipal registration operates in a silo, disconnected from national tax and company-registration systems.
5. Discussion
5.1. A Dual Operational Reality: Digital Acceptance without Digital Dependence
The results show that spaza shops in Tlhabane operate in two payment systems at once. Digital infrastructure is widely held and diversified, at about 2.25 device or platform mentions per shop, yet cash is preferred by 95.9% of owners and still carries most of the revenue of 87.8% of shops. In the framework of Figure 1, the technology dimension is no longer the main obstacle: owners chose devices for their functions and operational reliability far more often than for cost, which suggests that, once the decision to adopt has been made, fit with the business matters more than price. Owners’ accounts are consistent with this. They emphasised network reliability and the security benefit of holding less cash, and one owner described transaction fees as minor compared with settlement delays (Section 4.6.3). Earlier studies likewise emphasise skills, security and fit with business needs as conditions for adoption [19,20]. The obstacle lies in the environment. Customer preference and convenience, cited by more than 95% of respondents, reflect a two-sided market in which a digital instrument is worth little to a merchant until enough customers use it [37]. In such a market, holding several devices is a low-cost way to avoid losing a sale to a card-carrying customer or a request for airtime or electricity, but it does not change the cash basis of the business.
The composition of the device market supports this interpretation. The two most frequently reported platforms are a prepaid-vending and value-added-services platform (Flash) and a card-acceptance specialist (Yoco). Kazang vending devices were mentioned by up to about one in five respondents. The interviews confirm the distinction: owners described Flash and Kazang as vending tools and reserved Yoco and iKhokha for card payments, and some held a second card device as a hedge against network failure (Section 4.6.1). The mPOS representative linked secondary devices to slow settlement as well (Section 4.6.6). Much of what is recorded as digital adoption in spaza shops may therefore be the sale of digital products, such as airtime, data, electricity and vouchers, alongside, rather than instead of, cash sales of groceries. Studies that count device ownership as adoption may thus overstate the digitalisation of township retail. This is why the present study measures the share of revenue received digitally as well as ownership. The fact that 12.2% of shops received most of their sales by card, while only 4.1% preferred card, also suggests that digitalisation is partly demand-led. As more customers receive wages and social grants into accounts and pay by card, the share of revenue settled digitally is likely to rise regardless of owners’ preferences [13,29].
Supplier and cash-float reasons, each cited by about half of respondents, point to the upstream side of the cash ecosystem. Township food supply chains run through cash-and-carry wholesalers, informal bulk-buying arrangements and local producers of the non-branded goods that 96.7% of shops sell [6,25]. Owners described delivery drivers who expect cash on the spot (Section 4.6.2). A shop that is paid digitally but must pay its suppliers in cash has to withdraw funds and bear the associated fees and security risks, which cancels much of the benefit of digital acceptance. Settlement lags compound the problem: card revenue taken on a Friday may not be available for restocking on Saturday (Section 4.6.3), so a cash float remains a working-capital necessity rather than a sign of reluctance to adopt. Digitalising spaza retail therefore depends as much on wholesaler and supplier acceptance of instant payments as on merchant devices. Low-cost instant payment rails such as PayShap, used by only 6.0% of respondents, could be important here because they allow small business-to-business payments without card fees [10].
The same logic extends inside the firm (RQ3). Among shops with employees, about three in four paid wages in cash and about one in four paid them through a banking app or transfer. Cash wages are consistent with employment arrangements that are informal, often based on kinship or co-ethnic ties [6,7]. Owners described weekly or monthly wages agreed verbally and paid from the cash drawer, sometimes to assistants who have no bank account and would pay fees to withdraw a digital wage (Section 4.6.4). Cash wages also mean that employees are paid in the same medium in which the shop is paid, which reduces the owner’s need to withdraw cash. The minority who pay wages digitally suggest that the barrier is not technical on the owner’s side, since banking apps are already available to owners. Wage digitalisation could therefore be a low-cost entry point, provided that employees have access to low-cost accounts. It would give them a payment record that supports their own financial inclusion, a goal reflected in SDG target 8.10 [13,23].
5.2. Cash, Tax and the Logic of Informality
Half of the respondents (50.7%) said that they preferred cash because they did not want to pay tax. This is an unusually direct admission and should be interpreted carefully: it is self-reported, it may reflect a general aversion to an opaque tax system rather than a calculated evasion strategy, and the rate of tax registration (10.7%) indicates that most respondents were not tax-registered in any case. Nevertheless, the finding matches theoretical and empirical work showing that the transparency of electronic payments raises the expected cost of evasion and that firms seeking to stay outside the tax net have an incentive to keep transacting in cash [11,21]. It also matches the institutional argument that informality persists where formal rules are perceived as costly and the informal alternative is socially legitimate [42].
For policy, this means that payment digitalisation and tax administration cannot be designed separately. If owners expect digital records to lead directly to tax assessments, compliance obligations and possibly enforcement, the private benefits of digital acceptance are partly offset by expected fiscal costs. South Africa already has a simplified turnover-tax regime for micro-businesses [30], and the literature on taxing the informal economy emphasises low-rate presumptive regimes and simple registration over enforcement-led approaches [22]. A credible commitment that digital transaction data will be used to support simplified, low-rate compliance and access to finance, rather than retrospective penalties, would reduce one of the main reasons for keeping cash.
5.3. Financial Exclusion: Less Visible than Expected
Only 2.0% of respondents cited lack of a bank account, and 2.0% distrust of banks, as a reason for preferring cash. This is lower than might be expected from the literature on immigrant traders, many of whom report being refused banking services [9,31]. Two explanations are plausible. First, the use of card-acceptance devices and banking apps for wages implies that many owners, or their business partners, already have a bank account to which proceeds are settled. Second, owners who face documentation barriers may avoid the problem by using a partner’s or relative’s account or a non-bank platform, so that they do not experience their situation as exclusion. Either way, the finding suggests that in Tlhabane the main barrier to digital payment is not access to an account but the economics of a cash-based market and the perceived fiscal visibility of digital transactions. The interviews support the first explanation and suggest that exclusion sits elsewhere in the cash ecosystem. Owners described keeping card revenue in the bank as protection against theft, which implies that they are banked. The people they described as living in cash were their customers, including pensioners and casual workers, and their employees, including a shop assistant without a bank account (Section 4.6.2, Section 4.6.3 and Section 4.6.4). Financial exclusion may therefore constrain spaza digitalisation mainly through the owner’s customers and workers rather than through the owner.
5.4. Selective Formalisation and Associational Governance
The registration pattern is the clearest evidence of selective formalisation. More than nine in ten owners were registered with a municipal or provincial authority, but only about one in ten was registered with CIPC or SARS. This hierarchy follows the immediate operational value of each registration. Municipal registration, and since 2024 municipal compliance with food-premises hygiene requirements, governs whether a shop can trade without being closed, especially after the national directive of November 2024 [14,15]. Registration with CIPC and SARS, by contrast, brings legal personality and tax obligations whose benefits, such as access to formal credit, supplier accounts and public procurement, are distant for most micro-retailers [43,44]. Owners therefore appear to register where registration secures their right to trade and to avoid registration where it mainly brings obligations. The interviews make this logic explicit: the municipal permit was described as protection against closure and confiscation of stock, and CIPC and SARS registration as a cost without local benefit (Section 4.6.5). The timing of the fieldwork matters here. The survey was conducted in October 2025, about eight months after the extended registration deadline of 28 February 2025, so the high municipal registration rate probably reflects, at least in part, the national registration drive. The pattern is consistent with the drive having brought shops onto municipal databases without moving them towards national legal and fiscal registration. The municipal officials’ own account points the same way. They described local permits as regulatory shields rather than growth pathways and acknowledged that municipal registration is disconnected from national tax and compliance systems (Section 4.6.6). Selective formalisation is therefore reinforced by the way the registering institutions are organised, and not only by owners’ choices.
The high rate of affiliation with trader or community protection associations (78.7%) has important implications. In the framework of Figure 1, these associations are informal institutions that perform functions the state performs poorly in townships, such as security, dispute resolution, regulation of shop location and, in some cases, collective buying [7,8]. One owner reported paying R150 a month to an association that intervenes in break-ins, xenophobic threats and supplier disputes (Section 4.6.5), which illustrates both the value of the service and its cost. That nearly four in five owners belong to such a body indicates that private, associational governance is almost as widespread as municipal registration and far more widespread than national registration. For immigrant owners in particular, who face disproportionate violence and extortion [9], affiliation may be the most valuable registration they hold. Associations are therefore potential intermediaries for formalisation and digitalisation programmes, for example as channels for information, group onboarding to low-cost payment services or collective negotiation with wholesalers. However, policy should recognise that some associations also restrict competition or extract protection payments, and engagement with them should be transparent and accountable.
5.5. Product Mix, Food Safety and Trust
The near-universal sale of non-branded, locally prepared or repackaged goods (96.7%) explains both the value of spaza shops to customers and their exposure to the 2024 food-safety crisis. These products allow owners to sell in small, affordable units and earn higher margins, and customers buy them because they trust the shopkeeper and value freshness and convenience [1]. Research on informal food markets shows that consumers often equate freshness, visible cleanliness and personal relationships with safety, and that trust in the vendor can substitute for formal safety assurance [52,53]. In South Africa the food-control system is fragmented across national, provincial and municipal levels, and environmental health capacity is limited [54]. The registration drive tried to close this gap by linking the right to trade with food-premises compliance [14]. We argue that digital records could support this goal. Digital payments to identifiable suppliers would make supply chains more traceable, which is relevant to both food safety and tax. Because this product category is also the most cash-intensive part of the business, linking supplier payment digitalisation to food-safety support would serve both objectives.
5.6. Implications for Policy and Sustainable Development
The findings support five recommendations, each linked to Sustainable Development Goal (SDG) targets [23].
- Measure use, not ownership. Government and providers should track the share of spaza revenue settled digitally, not just the number of devices issued. Device counts overstate digitalisation where vending and card devices are held side by side (SDG 9.3).
- Digitalise the supply side. Programmes should target cash-and-carry wholesalers and local suppliers of non-branded goods so that digitally received revenue can be spent digitally, using low-cost instant payments such as PayShap (SDG 8.10, 9.3).
- Bundle digitalisation with simplified tax. Offering simplified turnover-tax registration with clear, non-punitive treatment of past informality, and linking digital transaction histories to access to credit and the R500 million support fund, would change the cost–benefit balance of visibility (SDG 8.3, 10.2).
- Use the municipal registration platform as a gateway. Since more than 90% of shops already deal with the municipality, the municipal process could serve as a one-stop point for optional CIPC and SARS registration and for information about payment services. Officials’ description of municipal registration as disconnected from national systems suggests that linking these databases is the missing step (SDG 8.3).
- Work transparently with associations and avoid xenophobic framing. Protection associations reach most owners and could be channels for information and group onboarding, provided that engagement is accountable. Because most shops are immigrant-owned, policies that make formalisation conditional on nationality-based restrictions are likely to push activity back into cash and informality, undermining SDG 10 (reduced inequalities) and SDG 1 (no poverty) [9].
5.7. Limitations and Future Research
The study has several limitations. First, it is a single-township case study with a sample of 150, and the results cannot be generalised to other townships without caution, although the confidence intervals indicate the precision of the estimates for Tlhabane. Second, the analysis is based on aggregate response distributions, so differences between immigrant and South African owners, or associations between adoption, firm size and registration, could not be tested statistically. With only 20 South African owners, such comparisons would in any case have little statistical power. Future studies should oversample South African-owned shops through disproportionate allocation and use multivariable models. Third, sensitive behaviours such as tax avoidance and registration status were self-reported and may be under- or over-reported. Fourth, the questionnaire did not distinguish card acceptance from the sale of prepaid digital products on the same device. The interviews describe how owners divide these functions but cannot quantify the split. The questionnaire also did not measure transaction values or fees, and did not record whether the reasons for device choice were asked of device users only. Fifth, the sampling frame was a field listing of visible shops, so shops operating out of sight inside homes may be under-represented. Sixth, the interview sample is small and purposive, with only one or two key informants per role, and the quotations illustrate mechanisms rather than measure their prevalence. Finally, the study is cross-sectional and, because fieldwork took place after the 2024–2025 registration drive, it cannot compare registration before and after the drive. Longitudinal panels of township retailers, transaction-level data from payment providers, and research on supplier-side digitalisation and on the role of protection associations would address these gaps.
6. Conclusions
This study examined how spaza shops in Tlhabane Township, Rustenburg, use digital payment technologies and engage with formal registration. Immigrant entrepreneurs own most shops, and nearly all shops sell locally prepared or repackaged goods. Digital payment infrastructure is widespread, with an average of more than two devices or platforms per shop, led by Flash and Yoco. Yet cash remains the preferred medium for 95.9% of owners and carries most of the revenue in 87.8% of shops. Inside the firm, about three in four employers pay wages in cash, so digital practices have barely reached internal operations. Cash persists mainly because of customer preference and convenience; about half of owners also cite paying suppliers in cash, and half link it to avoiding tax. The interviews suggest why: vending platforms and card terminals serve different purposes, and cash-only supplier deliveries and slow card settlement keep cash floats essential. Formalisation is selective: almost all shops are registered with a municipal or provincial authority and most belong to a protection association, but only about one in ten is registered with SARS or CIPC.
Together these results describe a dual operational reality in which digital acceptance coexists with a cash-based business model, and a pattern of selective formalisation in which owners engage with the authorities that control their right to trade and avoid those that tax. Municipal officials’ acknowledgement that local permits are disconnected from national tax and company registration shows that this selectivity is built into the institutions as well as into owners’ choices. Digitalisation of township retail is therefore unlikely to follow automatically from distributing devices or ordering registration. It requires the supply chain to accept digital payments, tax arrangements that make visibility worthwhile, and engagement with the informal institutions that already govern the sector. Addressing these conditions together offers a route to a township economy that is more inclusive, safer and more resilient, in line with the 2030 Agenda for Sustainable Development.
Author Contributions
Conceptualization, P.C.S. and F.G.N.; methodology, P.C.S.; investigation, P.C.S.; data curation, P.C.S.; formal analysis, P.C.S.; visualization, P.C.S.; writing original draft, preparation, P.C.S.; writing, review and editing, F.G.N. and M.M.; supervision, F.G.N. All authors have read and agreed to the published version of the manuscript.
Funding
This research received no external funding.
Institutional Review Board Statement
The study was conducted in accordance with the Declaration of Helsinki and approved by the Institutional Research Ethics Committee of the Durban University of Technology as part of the study “Entrepreneurship success factors in the South African informal trading sector: A comparison of South African and immigrant entrepreneurs in North West Province” (clearance number IREC 056/25; date of approval 28 August 2025).
Informed Consent Statement
Informed consent was obtained from all subjects involved in the study.
Data Availability Statement
The anonymised data presented in this study are available on request from the corresponding author. The data are not publicly available because they contain information on participants’ tax and registration status that could compromise their privacy.
Acknowledgments
The authors thank the spaza shop owners of Tlhabane who gave their time to this study, the key informants who shared their perspectives, and the fieldworkers who assisted with data collection. The authors take full responsibility for the content of this publication.
Conflicts of Interest
The authors declare no conflicts of interest.
Abbreviations
The following abbreviations are used in this manuscript:
| CI | Confidence interval |
| CIPC | Companies and Intellectual Property Commission |
| IREC | Institutional Research Ethics Committee |
| SARS | South African Revenue Service |
| SDG | Sustainable Development Goal |
| TOE | Technology–organisation–environment |
References
- Van Eyk, M.; Amoah, F.; Yase, T. Sustaining the Township Economy: An Investigation into the Factors Influencing the Shopping Experience of Spaza Shop Customers in South Africa. J. Econ. Behav. Stud. 2022, 14, 20–32. [Google Scholar] [CrossRef]
- Willie, M.M. The Effect of Spaza Shops on Employment and Socioeconomic Dynamics in South Africa. SSRN Electron. J. 2024. [Google Scholar] [CrossRef]
- Willie, M.M. Diversity and Characteristics of Spaza Shops in South Africa. Gold. Ratio Data Summ. 2025, 5, 44–46. [Google Scholar] [CrossRef]
- Charman, A.; Petersen, L.; Piper, L. From Local Survivalism to Foreign Entrepreneurship: The Transformation of the Spaza Sector in Delft, Cape Town. Transformation 2012, 78, 47–73. [Google Scholar] [CrossRef]
- Charman, A.; Petersen, L.M.; Piper, L.E.; Liedeman, R.; Legg, T. Small Area Census Approach to Measure the Township Informal Economy in South Africa. J. Mix. Methods Res. 2017, 11, 36–58. [Google Scholar] [CrossRef]
- Liedeman, R.; Charman, A.; Piper, L.; Petersen, L. Why Are Foreign-Run Spaza Shops More Successful? The Rapidly Changing Spaza Sector in South Africa. Econ3x3, 2013. Available online: https://www.econ3x3.org/articles/why-are-foreign-run-spaza-shops-more-successful-rapidly-changing-spaza-sector-south-africa/ (accessed on 1 October 2026).
- Piper, L.; Charman, A. Xenophobia, Price Competition and Violence in the Spaza Sector in South Africa. Afr. Hum. Mobil. Rev. 2016, 2, 332–361. [Google Scholar] [CrossRef]
- Charman, A.; Piper, L. Xenophobia, Criminality and Violent Entrepreneurship: Violence against Somali Shopkeepers in Delft South, Cape Town, South Africa. S. Afr. Rev. Sociol. 2012, 43, 81–105. [Google Scholar] [CrossRef]
- Tawodzera, G.; Crush, J. ‘A Foreigner Is Not a Person in This Country’: Xenophobia and the Informal Sector in South Africa’s Secondary Cities. Urban Transform. 2023, 5, 2. [Google Scholar] [CrossRef]
- South African Reserve Bank. Press Release on the Launch of PayShap—A Digital Payment Service. 2023. Available online: https://www.resbank.co.za/content/dam/sarb/publications/media-releases/2023/payshap-/Press%20release%20on%20the%20launch%20of%20Payshap%20-%20a%20digital%20payment%20service.pdf (accessed on 1 October 2026).
- Aguilar, A.; Frost, J.; Guerra, R.; Kamin, S.; Tombini, A. Digital Payments, Informality and Economic Growth; BIS Working Papers No. 1196; Bank for International Settlements: Basel, Switzerland, 2024. [Google Scholar]
- Klapper, L. How Digital Payments Can Benefit Entrepreneurs. IZA World Labor 2017, 396. [Google Scholar] [CrossRef]
- Demirgüç-Kunt, A.; Klapper, L.; Singer, D.; Ansar, S. The Global Findex Database 2021: Financial Inclusion, Digital Payments, and Resilience in the Age of COVID-19; World Bank: Washington, DC, USA, 2022. [Google Scholar] [CrossRef]
- The Presidency of the Republic of South Africa. Address by President Cyril Ramaphosa on Deaths of Children Due to Food-Borne Illnesses, Union Buildings, Tshwane, 15 November 2024. Available online: https://www.thepresidency.gov.za/address-president-cyril-ramaphosa-deaths-children-due-food-borne-illnesses-union-buildings-tshwane (accessed on 1 October 2026).
- Department of Cooperative Governance and Traditional Affairs (CoGTA). The Extension of the Deadline for Registration of the Spaza Shops and Other Food Handling Outlets. 18 December 2024. Available online: https://www.cogta.gov.za/index.php/2024/12/18/the-extension-of-the-deadline-for-registration-of-the-spaza-shops-and-other-food-handling-outlets/ (accessed on 1 October 2026).
- Bvuma, S.; Marnewick, C. Sustainable Livelihoods of Township Small, Medium and Micro Enterprises towards Growth and Development. Sustainability 2020, 12, 3149. [Google Scholar] [CrossRef]
- Jeza, S.; Lekhanya, L.M. The Influence of Digital Transformation on the Growth of Small and Medium Enterprises in South Africa. Probl. Perspect. Manag. 2022, 20, 297–309. [Google Scholar] [CrossRef]
- Steyn, R. Changing Thoughts towards Digital Literacy Interventions for South African Entrepreneurs. Read. Writ. 2018, 9, a172. [Google Scholar] [CrossRef]
- Ebrahim, A.Q.; van den Berg, C.L. The Barriers to Technology Adoption among Businesses in the Informal Economy in Cape Town. S. Afr. J. Inf. Manag. 2024, 26, a1872. [Google Scholar] [CrossRef]
- Mafuwane, H.C.; Muchie, M. A Case Study of the Adoption of Electronic Payment Methods by Spaza Shop Owners in Mkhuhlu Township in South Africa. Int. J. Manag. Innov. Entrep. Res. 2022. Available online: https://mgesjournals.com/ijmier/article/view/ijmier.2022.821 (accessed on 1 October 2026).
- Immordino, G.; Russo, F.F. Cashless Payments and Tax Evasion. Eur. J. Political Econ. 2018, 55, 36–43. [Google Scholar] [CrossRef]
- Valodia, I.; Francis, D. Tax and the Informal Economy. In The Informal Economy Revisited: Examining the Past, Envisioning the Future; Chen, M., Carré, F., Eds.; Routledge: London, UK, 2020. [Google Scholar] [CrossRef]
- United Nations General Assembly. Transforming Our World: The 2030 Agenda for Sustainable Development; Resolution A/RES/70/1; United Nations: New York, NY, USA, 2015. [Google Scholar]
- Makhitha, K.M.; Soke, B.V. Investigating the Challenges for the Development of Independent Retailers in South Africa. Int. J. Res. Bus. Soc. Sci. 2021, 10, 16–26. [Google Scholar] [CrossRef]
- Tuomala, V.; Grant, D.B. Exploring Supply Chain Issues Affecting Food Access and Security among Urban Poor in South Africa. Int. J. Logist. Manag. 2022, 33, 27–48. [Google Scholar] [CrossRef]
- Senyo, P.K.; Karanasios, S.; Gozman, D.; Baba, M. Moving Away from Trading on the Margins: Economic Empowerment of Informal Businesses through FinTech. Inf. Syst. J. 2023, 33, 154–184. [Google Scholar] [CrossRef]
- Jack, W.; Suri, T. Risk Sharing and Transactions Costs: Evidence from Kenya’s Mobile Money Revolution. Am. Econ. Rev. 2014, 104, 183–223. [Google Scholar] [CrossRef]
- Suri, T.; Jack, W. The Long-Run Poverty and Gender Impacts of Mobile Money. Science 2016, 354, 1288–1292. [Google Scholar] [CrossRef]
- Aurazo, J.; Gasmi, F. Digital Payment Systems in Emerging Economies: Lessons from Kenya, India, Brazil, and Peru. Inf. Econ. Policy 2024, 69, 101113. [Google Scholar] [CrossRef]
- South African Revenue Service. Turnover Tax. Available online: https://www.sars.gov.za/types-of-tax/turnover-tax/ (accessed on 1 October 2026).
- Chitimira, H.; Ncube, M. Legislative and Other Selected Challenges Affecting Financial Inclusion for the Poor and Low Income Earners in South Africa. J. Afr. Law 2020, 64, 337–355. [Google Scholar] [CrossRef]
- Davis, F.D. Perceived Usefulness, Perceived Ease of Use, and User Acceptance of Information Technology. MIS Q. 1989, 13, 319–340. [Google Scholar] [CrossRef]
- Venkatesh, V.; Morris, M.G.; Davis, G.B.; Davis, F.D. User Acceptance of Information Technology: Toward a Unified View. MIS Q. 2003, 27, 425–478. [Google Scholar] [CrossRef]
- Rogers, E.M. Diffusion of Innovations, 5th ed.; Free Press: New York, NY, USA, 2003. [Google Scholar]
- Tornatzky, L.G.; Fleischer, M. The Processes of Technological Innovation; Lexington Books: Lexington, MA, USA, 1990. [Google Scholar]
- Oliveira, T.; Martins, M.F. Literature Review of Information Technology Adoption Models at Firm Level. Electron. J. Inf. Syst. Eval. 2011, 14, 110–121. [Google Scholar]
- Rochet, J.-C.; Tirole, J. Platform Competition in Two-Sided Markets. J. Eur. Econ. Assoc. 2003, 1, 990–1029. [Google Scholar] [CrossRef]
- Williams, C.C.; Youssef, Y. Is Informal Sector Entrepreneurship Necessity- or Opportunity-Driven? Some Lessons from Urban Brazil. Bus. Manag. Res. 2014, 3, 41–53. [Google Scholar] [CrossRef]
- Salvi, E.; Belz, F.-M.; Bacq, S. Informal Entrepreneurship: An Integrative Review and Future Research Agenda. Entrep. Theory Pract. 2023, 47, 265–303. [Google Scholar] [CrossRef]
- Tang, Y.K.; Konde, V. Which Resource Acquisition Acts Drive Growth of Informal Firms? Evidence from Zambia. J. Small Bus. Enterp. Dev. 2021, 28, 888–907. [Google Scholar] [CrossRef]
- North, D.C. Institutions, Institutional Change and Economic Performance; Cambridge University Press: Cambridge, UK, 1990. [Google Scholar]
- Webb, J.W.; Tihanyi, L.; Ireland, R.D.; Sirmon, D.G. You Say Illegal, I Say Legitimate: Entrepreneurship in the Informal Economy. Acad. Manag. Rev. 2009, 34, 492–510. [Google Scholar] [CrossRef]
- Kibuuka, P.; Tustin, D.H. The Key Triggers for the Transitioning of Informal SMMEs to Formal SMMEs: A Baseline Survey of the Gauteng Province—South Africa. Psychol. Res. 2019, 9. [Google Scholar] [CrossRef]
- La Porta, R.; Shleifer, A. Informality and Development. J. Econ. Perspect. 2014, 28, 109–126. [Google Scholar] [CrossRef]
- International Labour Office. Women and Men in the Informal Economy: A Statistical Picture, 3rd ed.; International Labour Office: Geneva, Switzerland, 2018. [Google Scholar]
- Frith, A. Census 2011: Main Place ‘Tlhabane’ (662048). Based on Statistics South Africa, Census 2011. Available online: https://census2011.adrianfrith.com/place/662048 (accessed on 1 October 2026).
- Creswell, J.W.; Plano Clark, V.L. Designing and Conducting Mixed Methods Research, 3rd ed.; SAGE: Thousand Oaks, CA, USA, 2018. [Google Scholar]
- Setia, M.S. Methodology Series Module 3: Cross-Sectional Studies. Indian J. Dermatol. 2016, 61, 261–264. [Google Scholar] [CrossRef]
- Guest, G.; Bunce, A.; Johnson, L. How Many Interviews Are Enough? An Experiment with Data Saturation and Variability. Field Methods 2006, 18, 59–82. [Google Scholar] [CrossRef]
- Wilson, E.B. Probable Inference, the Law of Succession, and Statistical Inference. J. Am. Stat. Assoc. 1927, 22, 209–212. [Google Scholar] [CrossRef]
- Braun, V.; Clarke, V. Using Thematic Analysis in Psychology. Qual. Res. Psychol. 2006, 3, 77–101. [Google Scholar] [CrossRef]
- Isanovic, S.; Constantinides, S.V.; Frongillo, E.A.; Bhandari, S.; Samin, S.; Kenney, E.; Wertheim-Heck, S.; Nordhagen, S.; Holdsworth, M.; Dominguez-Salas, P.; et al. How Perspectives on Food Safety of Vendors and Consumers Translate into Food-Choice Behaviors in 6 African and Asian Countries. Curr. Dev. Nutr. 2023, 7, 100015. [Google Scholar] [CrossRef]
- Kuboka, M.; Grace, D.; Artursson, K.; Lindahl, J.; Carlsson, G.; Mutua, F. Food Safety in Informal Public Markets in Kenya: Perceptions of Stakeholders in the Food Chain. Front. Sustain. Food Syst. 2024, 8, 1411318. [Google Scholar] [CrossRef]
- Mphaga, K.V.; Moyo, D.; Rathebe, P.C. Unlocking Food Safety: A Comprehensive Review of South Africa’s Food Control and Safety Landscape from an Environmental Health Perspective. BMC Public Health 2024, 24, 2040. [Google Scholar] [CrossRef]
Figure 1.
Conceptual framework linking technology–organisation–environment (TOE) factors, payment practice and formalisation outcomes, interpreted through an institutional lens. SDG, Sustainable Development Goal.
Figure 1.
Conceptual framework linking technology–organisation–environment (TOE) factors, payment practice and formalisation outcomes, interpreted through an institutional lens. SDG, Sustainable Development Goal.
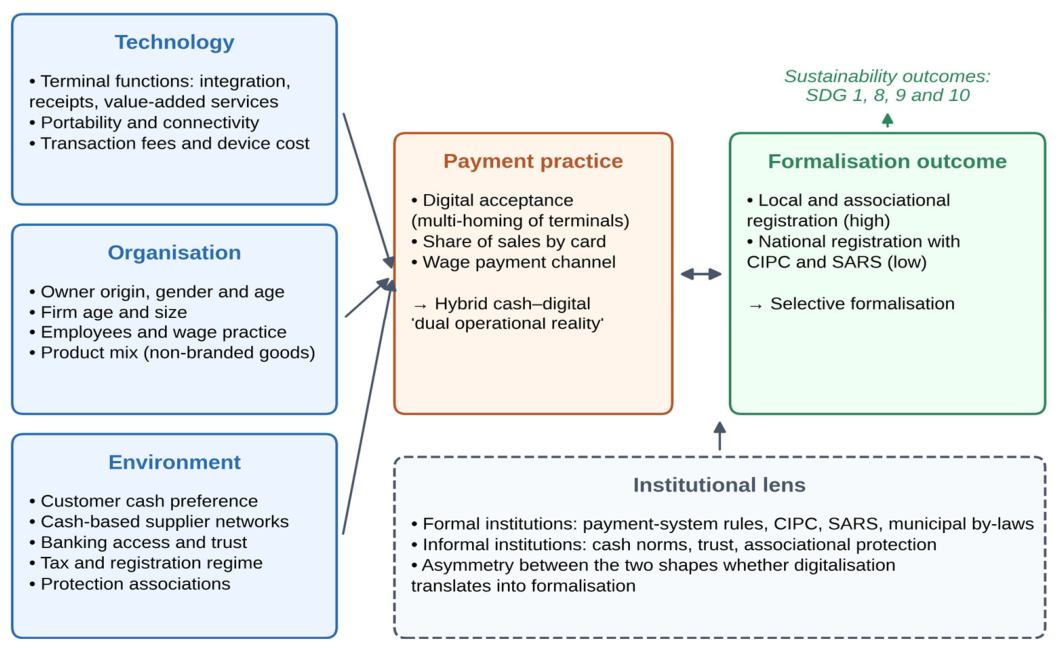
Figure 2.
Payment medium by transaction domain among spaza shops in Tlhabane. Preferred payment (n = 145) and main payment for most sales (n = 148) are owner reports; wage payment (n = 149) combines payment through a cell phone or banking app (16.1%) and bank transfer (2.0%) as card/digital.
Figure 2.
Payment medium by transaction domain among spaza shops in Tlhabane. Preferred payment (n = 145) and main payment for most sales (n = 148) are owner reports; wage payment (n = 149) combines payment through a cell phone or banking app (16.1%) and bank transfer (2.0%) as card/digital.
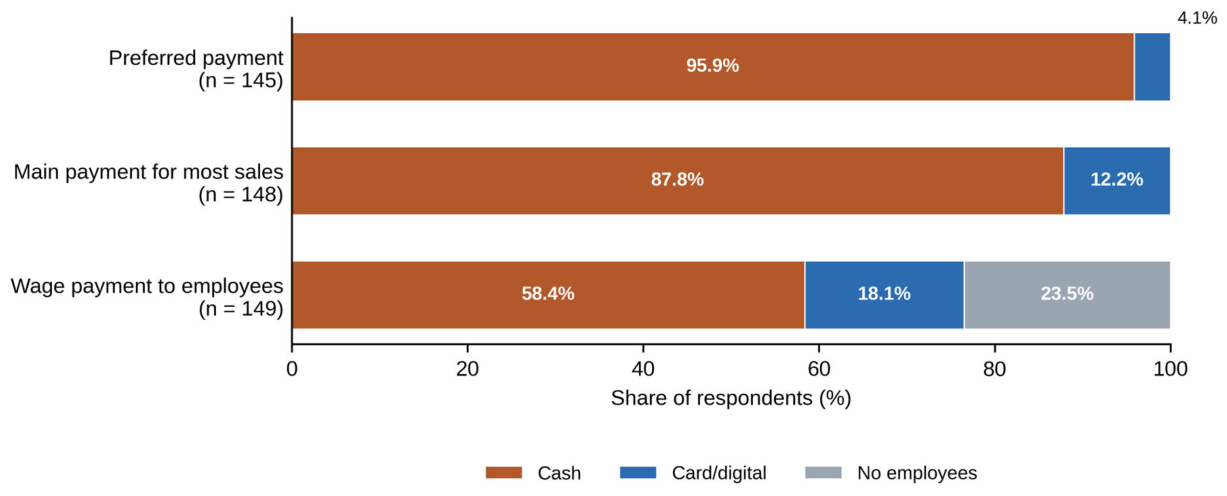
Figure 3.
Reasons for preferring cash (multiple responses; n = 150). Error bars show 95% Wilson score confidence intervals.
Figure 3.
Reasons for preferring cash (multiple responses; n = 150). Error bars show 95% Wilson score confidence intervals.
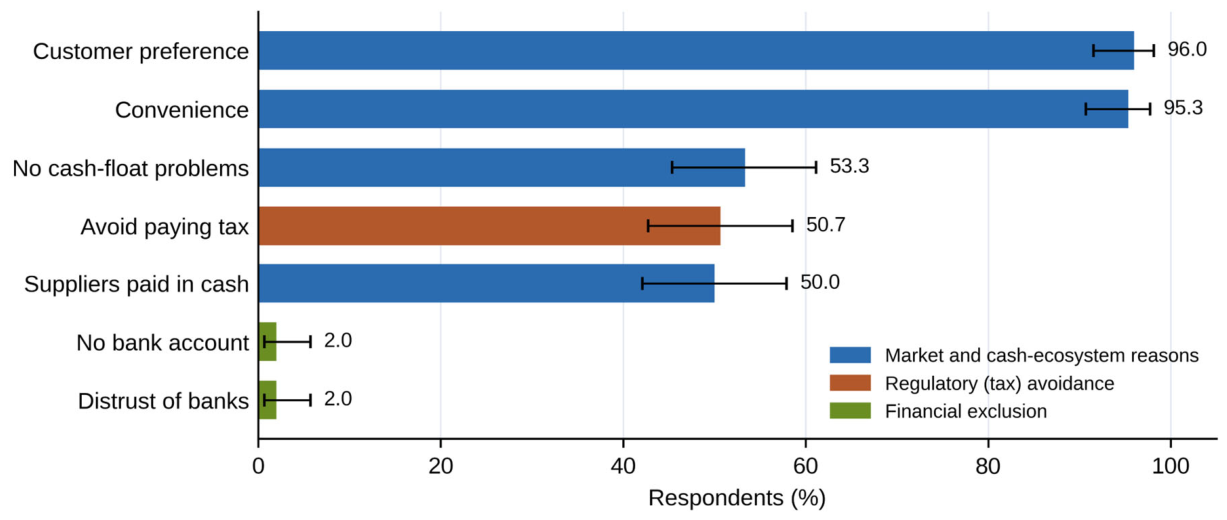
Figure 4.
(a) Payment devices and platforms in use (multiple responses; n = 150), with 95% Wilson score confidence intervals. (b) Main reason for choosing a device (% of respondents).
Figure 4.
(a) Payment devices and platforms in use (multiple responses; n = 150), with 95% Wilson score confidence intervals. (b) Main reason for choosing a device (% of respondents).
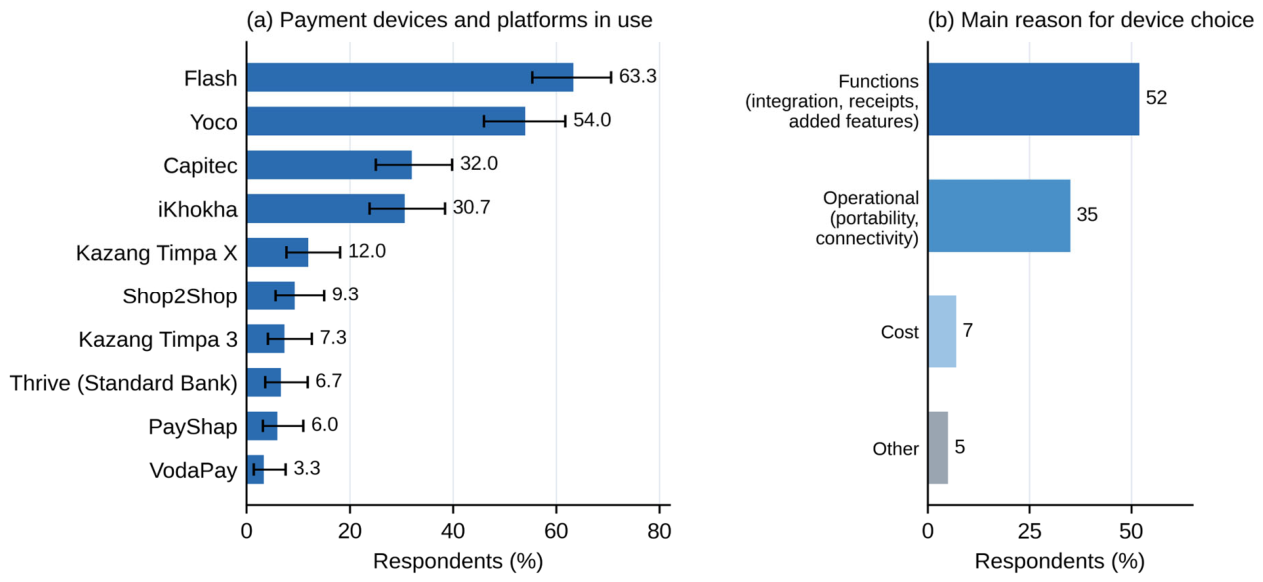
Figure 5.
Registration with public authorities and affiliation with private governance bodies (multiple responses; n = 150). Error bars show 95% Wilson score confidence intervals. SARS, South African Revenue Service; CIPC, Companies and Intellectual Property Commission.
Figure 5.
Registration with public authorities and affiliation with private governance bodies (multiple responses; n = 150). Error bars show 95% Wilson score confidence intervals. SARS, South African Revenue Service; CIPC, Companies and Intellectual Property Commission.
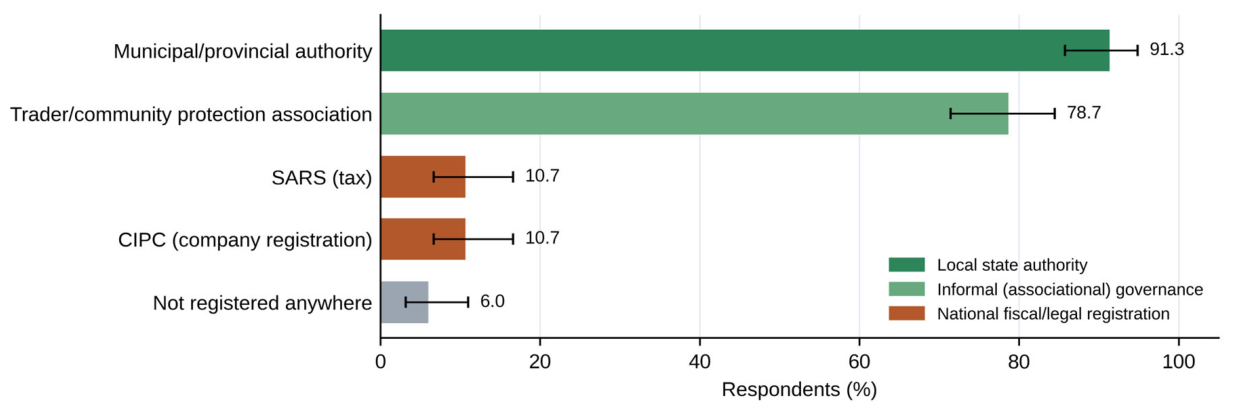

Table 1.
Profile of spaza shop owners and businesses in Tlhabane (n = 150).
| Characteristic | Immigrant-owned | South African-owned |
| Share of shops, % a | 86.7; n = 130 | 13.3; n = 20 |
| Male owners | >90% | >79% |
| Predominant owner age | 40–45 years | 35–50 years |
| Typical age of business | 3–5 years | >10 years |
a Fixed by the stratified design (proportional allocation by owner nationality), so no confidence interval is shown. Gender, owner age and business age are reported as the summary values available from the survey tabulation.
Table 2.
Key survey indicators with 95% Wilson score confidence intervals.
| Indicator | n/N | % | 95% CI |
| Immigrant-owned shop a | 130/150 | 86.7 | – |
| Sells non-branded/self-packaged products | 145/150 | 96.7 | 92.4–98.6 |
| Prefers cash payment | 139/145 | 95.9 | 91.3–98.1 |
| Most sales paid in cash | 130/148 | 87.8 | 81.6–92.2 |
| Most sales paid by card | 18/148 | 12.2 | 7.8–18.4 |
| Wages paid in cash (all respondents) | 87/149 | 58.4 | 50.4–66.0 |
| Wages paid in cash (shops with employees) | 87/114 | 76.3 | 67.7–83.2 |
| Wages paid via banking app or transfer (shops with employees) | 27/114 | 23.7 | 16.8–32.3 |
| No employees | 35/149 | 23.5 | 17.4–30.9 |
| Uses Flash | 95/150 | 63.3 | 55.4–70.6 |
| Uses Yoco | 81/150 | 54.0 | 46.0–61.8 |
| Uses PayShap | 9/150 | 6.0 | 3.2–11.0 |
| Cites tax avoidance as a reason for cash | 76/150 | 50.7 | 42.7–58.6 |
| Registered with municipal/provincial authority | 137/150 | 91.3 | 85.7–94.9 |
| Registered with a protection association | 118/150 | 78.7 | 71.4–84.5 |
| Registered with SARS | 16/150 | 10.7 | 6.7–16.6 |
| Registered with CIPC | 16/150 | 10.7 | 6.7–16.6 |
| Not registered with any body | 9/150 | 6.0 | 3.2–11.0 |
a Fixed by the stratified design; see Table 1. Device, reason and registration items allowed multiple responses, so percentages are calculated over all respondents and do not sum to 100%. SARS, South African Revenue Service; CIPC, Companies and Intellectual Property Commission.
Table 3.
Joint display integrating the survey and interview findings.
| Domain | Survey evidence | Interview evidence | Integration |
| Device adoption | 2.25 device/platform mentions per shop; Flash 63.3%, Yoco 54.0% | Vending platforms (Flash, Kazang) used for airtime, electricity and vouchers; card terminals (Yoco, iKhokha) for card payments; second device kept as a backup (P03, P11, KI1) | Expands: multi-homing reflects functional specialisation and risk hedging |
| Customer demand | 95.9% prefer cash; customer preference 96.0%, convenience 95.3% | Customers are pensioners and casual workers paid in cash; refusing cash loses the sale (P06) | Confirms |
| Suppliers and cash float | Suppliers paid in cash 50.0%; no cash-float problems 53.3% | Delivery drivers demand cash on delivery; card revenue settles days later (P14, P09, KI1) | Expands: cash float is a working-capital need |
| Device choice | Functions 52%, operational 35%, cost 7% | Fees treated as minor relative to settlement, connectivity and security (P02, P09) | Confirms |
| Wages | 76.3% of employers pay wages in cash | Wages agreed verbally and paid from the cash drawer; employee without a bank account (P07) | Expands: exclusion sits with employees |
| Financial exclusion | No bank account 2.0%; distrust of banks 2.0% | Owners bank card revenue for safety; customers and workers live in cash (P02, P06, P07) | Qualifies: exclusion is located among customers and workers |
| Registration | Municipal/provincial 91.3%, association 78.7%, SARS and CIPC 10.7% each | Permit protects against closure; association fee R150 per month; national registration seen as cost without benefit (P01, P12); permits are “regulatory shields” in a silo separate from national systems (KI3, KI4) | Confirms and expands: selectivity is reinforced institutionally |
P, owner participant; KI, key informant. “Confirms” means that the two strands agree; “expands” that the interviews add a mechanism the survey did not measure; and “qualifies” that the interviews change how the survey estimate should be read.
Disclaimer/Publisher’s Note: The statements, opinions and data contained in all publications are solely those of the individual author(s) and contributor(s) and not of MDPI and/or the editor(s). MDPI and/or the editor(s) disclaim responsibility for any injury to people or property resulting from any ideas, methods, instructions or products referred to in the content. |
© 2026 by the authors. Licensee MDPI, Basel, Switzerland. This article is an open access article distributed under the terms and conditions of the Creative Commons Attribution (CC BY) license.
Copyright: This open access article is published under a Creative Commons CC BY 4.0 license, which permit the free download, distribution, and reuse, provided that the author and preprint are cited in any reuse.