
Submitted:
01 October 2026
Posted:
06 October 2026
You are already at the latest version
Abstract
The acid dissociation constant (pKa) is a fundamental property reflecting the local propensity of a chemical species to release a proton. While graph neural networks excel at predicting global properties, accurate pKa prediction requires a shift toward atomic mapping. We introduce hydrogen-centered graph machines (HGM), specifically designed for pKa prediction, by incorporating within the graph the mobile proton involved in the acid-base equilibrium. To support this approach, we refined over 2,300 metrologically validated data points to guarantee fidelity to aqueous species. By calibrating the parametric complexity of HGM across an ensemble of 50 models, we ensured generalization capabilities for robust predictions. As a result, HGM achieved root mean square errors (RMSEs) between 0.6 and 0.7 pKa units on the SAMPL6, Jensen, and EuroSAMPL1 test sets. However, 2D topological representations remain localized and thus fail to capture charge delocalization—where present—across an entire chemical species, particularly within complex poly-nitrogen systems. To bridge this gap, we introduce a mesomeric weighting strategy that complements the initial structure with relevant resonance forms. This approach significantly enhances predictive accuracy, driving the RMSE down to 0.5 pKa units for the more complex SAMPL6 and EuroSAMPL1 challenges. Beyond proven accuracy, HGM acts as an automated metrological filter to establish an applicability domain. Thus, HGM identifies structural anomalies—such as complex tautomers and 3D interactions like charge-assisted hydrogen bonds—via statistical warnings that confirm their pKa prediction falls beyond the actual scope of the HGM framework. As a definitive proof of concept, we deployed HGM to investigate four complex therapeutics (prednisolone, amoxicillin, azithromycin, and pristinamycin IA). We successfully pinpointed the exact ionization sites and attributed the measured pKa values to their corresponding equilibria. Benchmarking against the eight available experimental pKa values yields a mean absolute error of 0.4 pKa units. Fundamentally, for such complex systems, it is the synergy between the mapping of multiple speciation pathways and the chemist's critical evaluation that resolves the attribution ambiguities inherent to standard commercial databases. We release a standalone Docker container for result verification and out-of-the-box predictions of new compounds.
Keywords:
pKa prediction
; machine learning
; graph machines
; neural networks
; data curation
; SMILES representation
; micro-equilibria
; Density Functional Theory
; SAMPL blind challenges
; Docker
1. Introduction
As highlighted in a recent comprehensive review [1], accurate pKa estimation remains a cornerstone of pharmaceutical design, environmental analysis, and materials science. While machine learning (ML) frameworks—particularly those benchmarked during successive SAMPL [2,3] and Novartis challenges [4]—have advanced the field, critical hurdles remain. Recent years have seen the rise of graph neural networks (GNNs) and hybrid architectures trained on massive datasets [5,6]. Models such as Graph-pKa [7] and MolGpKa [8] have set new standards by shifting the focus toward predicting micro-pKa for each individual ionizable site.
Currently, state-of-the-art performance on the SAMPL challenges is achieved by models that augment graph networks with physical descriptors. For instance, H-SPOC [9] utilizes high-dimensional structural features, while QupKake [10] and Uni-pKa [11,12] merge GNNs with semiempirical quantum mechanical (QM) or Density Functional Theory (DFT) indicators. While these hybrid frameworks deliver high accuracy, they often rely on expansive, opaque training sets and entail significant computational costs—requiring up to 10 minutes per molecule in some cases [11]. This computational burden limits their utility in large-scale chemoinformatics workflows, highlighting a persistent gap: the need for a model that reaches the accuracy of these 'heavyweight' architectures while offering the agility and transparency of a purely 2D-informed predictive framework.
Achieving this high-resolution accuracy with 2D descriptors is challenging, as the local electronic environment of the protonation site is often governed by complex intramolecular interactions that global topological features fail to capture. To overcome this, our methodology is grounded in fundamental physico-chemical principles rather than purely statistical correlations. In a previous study, we developed an atom-centered graph-based architecture to successfully predict 13C NMR chemical shifts [13]. By treating each atom as the root of a local subgraph, the model effectively captured the specific electronic environment of individual nuclei. Given the robustness of this representation, we hypothesized that this atom-centered approach could be generalized to estimate pKa values for specific ionizable sites [14].
In this work, we present the hydrogen-centered graph machines (HGM) framework, an architecture directly adapted from our previous studies on NMR chemical shifts. Transitioning from spectroscopy to acidity estimation required us to extend our graph representation. HGM natively processes the full SMILES string, ensuring that formal charges, stereochemical configurations, and isotopic information are encoded as node and edge features within the graph. This approach enables site-specific predictions that match the accuracy of high-parameter 3D models while maintaining the computational agility required for large-scale screenings.
Beyond its predictive performance, the HGM architecture acts as a diagnostic tool to delineate the model's applicability domain. By identifying outliers—such as the rigid proton-encaging structure of sparteine or complex tautomeric systems—we can define the inherent limits of 2D graph-based descriptors. These deviations are not failures of the learning process, but signal that 2D topological representations lack the capacity to encode long-range field effects or constrained 3D steric environments. Detecting these 3D outliers allows us to map the boundaries of the model's reliability and provides chemical insight into the molecular features that necessitate 3D-aware treatments.
The development of predictive models is fundamentally constrained by the quality of experimental data, which often suffers from inconsistent nomenclature and measurement bias. Thus, we subjected the reference datasets to a metrological audit, rectifying errors in species assignment and experimental values.
The model architecture and hyperparameters were established through an iterative workflow. Initial training steps on a baseline dataset allowed for the robust selection of the HGM complexity and the definition of its applicability domain using leverages. To maximize predictive reliability, the data then underwent a final, exhaustive metrological refinement. The selected architecture was subsequently trained on this curated corpus. Importantly, we retained challenging structural outliers—such as 2,2'-biphenol—in the training set, as these cases are essential for defining the performance limits of 2D topological descriptors.
Following this training procedure, the predictive performance was rigorously evaluated across three independent datasets: SAMPL6 [3], the Jensen set [15], and EuroSAMPL1 [16]. By accounting for topological factors, HGM achieved performance levels comparable to computationally demanding QM approaches, while requiring a fraction of the computational cost. To ensure transparency, the curated datasets and the final production model are provided via a Docker container [17].
2. Materials and Methods
2.1. Data Sourcing
The training dataset used in this study is based on the collection compiled by Hunt et al. [18]. It aggregates 2,435 experimental aqueous pKa values from major reference sources, including the monographs by Perrin [19,20] and Kortum [21], as well as the ChEMBL database [5]. This dataset was selected because it provides explicit pKa assignments for individual atomic sites.
As detailed in Hunt et al. [18], while the molecular weight and topological complexity distributions are skewed towards low-molecular-weight compounds compared to modern approved drugs, the dataset provides a broad coverage of the 'drug-like' chemical space. Property distributions—including lipophilicity, aromaticity, and structural complexity—align with standard pharmaceutical profiles, with the exception of specific classes such as steroids, macrocycles, and linear peptides. This diversity is mandatory for the design of models having a wide applicability domain across chemical space.
A key advantage of the Hunt dataset is its site-specific definition of acidity and basicity. Unlike databases that report only a single pKa value per molecule [4,22], this dataset explicitly identifies the conjugate acid/base pair involved in each ionization equilibrium. Each protonation event is mapped to a specific atom (e.g., [OH:8], where 8 denotes the index of the oxygen atom carrying the acidic site), which allows for the explicit handling of polyprotic molecules. For example, glutaric acid is represented as two distinct ionization events: the first deprotonation (pKa 4.3) of the neutral species and the subsequent deprotonation (pKa 5.4) of the mono-anion. This site-specific data presentation is directly compatible with our HGM approach, which performs its graph-based computations centered on the specific atom undergoing deprotonation.
2.2. Architecture of H-Centered Graph Machines
Unlike general Graph Machines, which estimate global properties or activities of molecules, H-centered Graph Machines are designed to estimate specific, local properties. In the present case, the acid dissociation constant (pKa) of a specific deprotonation site is estimated by explicitly treating the dissociable hydrogen atom as the root node of the graph. The design of general Graph Machines has been described in detail in previous publications [23,24]. Figure 1 summarizes the end-to-end transformation process applied to the tagged SMILES string of the (1R,2R)-1-ethyl-2-methylpiperidin-1-ium cation to build the corresponding H-centered graph machine.
The construction of an HGM network starts with a SMILES code where the target hydrogen is explicitly tagged (e.g., [H:1]). The 2D molecular graph is derived from this code, and subsequently converted into a directed acyclic graph (DAG), where the edge orientation is defined by the paths from the leaves to the hydrogen root. In the final step, this DAG is mapped onto a neural network structure where each node is implemented as a parameterized non-linear function. This function is typically a multi-layer perceptron (MLP), represented schematically as an orange triangle in Figure 1. For intermediate nodes, this MLP processes the concatenated outputs from adjacent child nodes to generate an n-dimensional output. The local labels (including atom type, connectivity degree, stereochemical configuration (@), and formal charge (+)) do not act as numerical inputs but as dictionary keys to instantiate node-specific parameters. To accommodate the variable connectivity of different atoms while maintaining a fixed input dimension for the network, any absent child connections are padded with zero vectors. Each MLP features a single hidden layer of n neurons with hyperbolic tangent (tanh) activation functions. The n outputs of these hidden neurons are passed directly to the input of the parent node via fixed connections (weight = 1). A dedicated linear output neuron is exclusively present at the root node (the target hydrogen) to aggregate this information and map the final hidden layer output into a 1-dimensional macroscopic pKa estimation.
Once constructed for all structures in the dataset, the HGM networks are trained simultaneously using a global weight-sharing scheme. To ensure generalization, the weight matrices connecting the input and hidden layers (constituting n x n parameters) are strictly shared across all nodes of all graphs, regardless of the underlying chemical structure. However, to differentiate the specific chemical nature of each node, the local labels are used to inject label-specific bias parameters. Instead of processing these labels as concatenated numerical inputs, the model uses them as dictionary keys to retrieve learnable bias vectors that are directly added to the node's input vector. For example, the MLP node function evaluating an oxygen or nitrogen node will retrieve and add a full vector of n learnable biases optimized strictly for that element. However, to prevent overfitting and ensure a stable Levenberg-Marquardt optimization, this parameter allocation is systematically tailored based on topological constraints and relative data scarcity. For instance, a terminal atom like fluorine, which always acts as a leaf node in a molecular DAG, is restricted to a single bias parameter, as additional parameters yield no empirical predictive gain. Similarly, high-valency motifs (such as degrees 5 or 6) typically represent a minority fraction compared to ubiquitous core valencies in chemical databases. Allocating a full set of n parameters to these scarce labels would induce numerical instabilities during the optimization process. Furthermore, due to the presence of multiple bonds (e.g., within a nitro group), these high-degree nodes never receive more than three incoming connections, making them topologically no more complex to process than a standard quaternary carbon center. Consequently, the number of associated learnable parameters remains small. Conversely, despite exhibiting a relative scarcity comparable to restricted high-valency motifs, versatile elements like sulfur retain an unconstrained parameter allocation. Because sulfur spans a wide range of valencies (from degrees 2 to 6) and intermediate DAG positions, maintaining the full parameter space remains necessary to capture its topological diversity.
Thus, a trained HGM model operates under a dual architecture: globally shared weight matrices modulated by highly specific, label-driven local bias vectors. The total number of trainable parameters is therefore a function of both the structural diversity of the local labels present in the dataset and the hidden layer dimension (n), which is determined during the model selection step described in Section 2.4. Ultimately, the concatenated numerical data is sequentially propagated from the leaf nodes to the root node, which computes the macroscopic pKa of the site of interest based on its specific topological and electronic environment.
2.3. Dataset Assessment and Curation Protocol
To address the limitations identified in the initial dataset, we performed a systematic metrological assessment of the 2,435 entries originally compiled by Hunt [18]. This curation process downsized the dataset to 2,302 unique ionization sites (see Table S1; file B2302.xlsx, sheet 'B2302'), removing redundant entries and ensuring that the model is trained and tested on strictly consistent data.
2.3.1. Structural Amendments and Speciation Consistency
The dataset was curated to resolve structural inconsistencies and experimental ambiguities. First, 18 entries that were common to both the training set and the external Jensen test set (e.g., morphine and cimetidine isomers) were removed to prevent data leakage and ensure an unbiased external evaluation. Subsequently, we removed 124 entries where the original dataset reported conflicting species assignments for a single pKa value, and filtered out four additional entries lacking reliable literature data. For instance, pyrido[2,3-b]pyrazin-6-amine was originally associated with seven distinct protomeric forms for only two pKa values. We filtered these entries, retaining the most chemically plausible forms to ensure perfect consistency with the corresponding experimental conditions. Further ambiguities were resolved using prior chemical knowledge. Initial training cycles effectively served as an anomaly detection tool: consistently high prediction errors for specific sites prompted a systematic re-evaluation of the original data sources to correct misassigned tautomers or erroneous values.
Rather than blindly discarding data points that exhibited high prediction residuals during initial training phases, we implemented a strict retention strategy. We carefully preserved instances where these apparent deviations from baseline predictions are rooted in well-defined 3D physical phenomena rather than experimental errors. These retained cases primarily include:
- Intramolecular Hydrogen Bonding: Compounds such as 2,2'-biphenol or naptalam, where the spatial stabilization of the conjugate base significantly shifts the pKa, compared to their non-chelated analogues.
- Steric Hindrance: Molecules where protonation site accessibility is strongly restricted, such as ortho-substituted N,N-dimethylanilines or bulky amines (e.g., N-(1,3-dicyclohexylpropan-2-yl)-3-phenylpropan-1-amine).
Retaining these challenging examples ensures that the training set accounts for complex spatial and electronic environments. This prevents the artificial inflation of the model's apparent performance and rigorously tests its generalization capacity against structural effects that typically push the boundaries of standard 2D topological descriptors.
2.3.2. Literature Verification and Data Correction
To maximize data retention while resolving lingering uncertainties, we conducted a manual review of the primary literature for entries requiring verification. This process led to the correction of 21 experimental pKa values and 19 SMILES strings, along with the reassignment or introduction of 13 specific entries (representing nine distinct compounds). This step was essential for rectifying formal charges—specifically for accurately identifying zwitterionic states—and for correcting inverted pKa assignments found in the original source database. Ultimately, the resulting curated dataset of 2,302 unique ionization sites provides a consistent, experimentally verified foundation for training the HGM framework.
2.4. HGM Model Training and Selection
The curated dataset, comprising 2,302 SMILES (denoted as B2302), was randomly split into a training set of 2,102 SMILES (denoted as B2102) and a validation set of 200 SMILES (B200). Consistent with the experimental uncertainty observed in the IUPAC database meta-analysis [25] (see Section 3.1), all reported pKa values are expressed with a single decimal place. However, aggregated statistical error metrics are reported with two decimal places to accurately track mathematical convergence during model selection.
The overall strategy for model training and selection is divided into two distinct steps. The first one uses the B2102 dataset to train multiple candidate models and select the most robust ones based on their individual virtual leave-one-out (VLOO) scores. The second one utilizes the validation set (B200) to assess the true generalization capability of the models selected in the first step, and to define the boundaries within which their estimations can be trusted (i.e., their applicability domain). Together, these two steps identify the optimal model architecture required to reliably predict the pKa of new, unseen molecules.
For a given complexity (number of hidden neurons of the node functions, or equivalently number of parameters thereof), 500 HGM models were trained independently with different initial parameter values (empirical tests confirmed that expanding this pool to 1,000 initializations yielded no measurable improvement), and their individual VLOO scores were computed on the B2102 set. We define the VLOO score of a model as an approximation of its leave-one-out (LOO) score, obtained at a much lower computational cost. Just as the LOO score, it provides an estimation of the generalization error of the model. For brevity, VLOO score is denoted as VLOO for the remainder of this study.
Consider a nonlinear model whose p parameters were trained from a dataset of M examples. The Jacobian matrix Z of the model is the (M, p) matrix whose rows are the derivatives of the model estimation with respect to the parameters of the model. The VLOO provides an estimate of the model's generalization capacity. It is defined as the root-mean-square of the approximated VLOO cross-validation errors:
where rm is the training error on example m, and hmm is the m-th diagonal element of the “hat matrix” [26], which is the orthogonal projection matrix onto the subspace defined by the columns of Z. The term hmm is called the tangent-plane leverage (or simply leverage) of example m; it reflects the influence of example m on the weights of the model [27,28]. Consequently, the quotient directly approximates the estimation error that the model would commit on example m if it had been excluded from the training set. As diagonal elements of an orthogonal projection matrix, the leverages of the training examples have the following properties:
The presence of one or more examples with large leverages indicates that the model is overfitted to these examples (conventionally, a leverage is considered “large” if it is larger than 2p/M). In such a case, the VLOO of the model is large, indicating poor generalization. Ideally, it should be on the order of the experimental noise variance in the training data (assuming uniform noise variance).
We denote by pKa(m), for m = 1…M (where M = 2,102), the observed pKa value of the structure encoded by SMILES m present in the training set, and by , the estimated value of the pKa for that structure provided by model k (where k = 1…500) from the initial pool of independently trained HGM models. Thus, the VLOO of HGM model k is:
Out of the 500 initialized networks, the top 10%—comprising the 50 HGM models exhibiting the smallest individual VLOOk—were selected to generate the final HGM ensemble. This specific size (50 models) was empirically established to ensure strict reproducibility when comparing architectures. Relying on a single "best" model or a very small pool (e.g., 10 models) failed to average out training noise, leading to high variance. Conversely, while a larger ensemble is desirable to smooth predictions on test sets and provide a reliable measure of prediction uncertainty, expanding it further (e.g., 100 models) incorporates lower-ranked models that degrade the mean performance. The 10% retention ratio offers the optimal bias-variance trade-off: analyzing the VLOO degradation curve reveals that extending the selection from the top 40 to the top 50 models increases the mean individual error by a negligible margin (less than 0.003 pKa units for a 19-neuron architecture). This guarantees a pool of models large enough to maintain a statistically robust ensemble prediction, even when individual predictions are subsequently discarded due to high uncertainty. To characterize the generalization capacity of this ensemble, we evaluate two distinct metrics: the mean individual VLOO score and the ensemble error.
First, the mean individual VLOO score denoted as , is the arithmetic mean of the individual VLOOk values of the 50 selected models. This metric represents the average estimated generalization error of the individual networks of the ensemble:
Second, the true generalization capacity stems from aggregating these models into an ensemble. For a given SMILES m, the VLOO estimation of the pKa value vm,k made by a single model k can be expressed as:
We define the ensemble virtual estimation as the average of these individual VLOO estimations across the 50 selected models:
The ensemble error of the 50 selected HGM models, denoted as RMSEvirtual, is then defined as the root mean square error (RMSE) between the experimental values and these ensemble virtual estimations across the entire training set (where M = 2,102):
Reporting both metrics is fundamental: while provides the average estimated generalization error for individual models, RMSEvirtual evaluates the actual generalization capacity of the aggregated ensemble. The reduction in error between these two metrics directly illustrates the predictive improvement achieved by averaging the individual networks.
To assess the generalization capability and establish the applicability domain of the selected ensemble, estimations were generated for the validation set (B200) and the corresponding leverages were computed. The leverage hmm of a SMILES m of the training set, being a diagonal element of the hat matrix, can be expressed as:
where denotes the m-th row of the Jacobian matrix Z (a 1xp row vector), and xm its transpose (a px1 column vector). Similarly, the leverage of a SMILES m of the validation set is computed as:
where denotes the m-th row of the Jacobian matrix Z’ (a 1xp row vector), and its transpose (a px1 column vector) containing the derivatives of the model estimation for SMILES m of the validation set B200, with respect to the parameters of the model trained on B2102.
Hence, the latter leverages, computed on a validation set, are no longer the diagonal elements of a projection matrix. They may be larger than 1, and their sum is no longer equal to p, so that the interpretation of their values is not as straightforward as that of the training set. Nevertheless, it is widely admitted that SMILES in the validation set exhibiting very large leverages are likely to be extremely sensitive to variations of the model parameters; hence, estimations for such SMILES are considered highly uncertain.
Therefore, it is necessary to empirically establish a threshold leverage value, ht, beyond which an estimated pKa value from a given model is considered unreliable. SMILES for which the ensemble cannot provide a reliable estimation fall outside the applicability domain of the HGM model ensemble. Consequently, ht acts as an additional hyperparameter of the model, alongside the number of hidden neurons n. Values of ht may range from stringent (e.g., ht = 1) to permissive (e.g., ht = 5 or ht = 10), giving rise to narrow or broad validity domains respectively.
To quantify the ensemble agreement, we defined kmin as the minimum number of valid models (out of the 50 in the ensemble) available to estimate any single SMILES in the validation set, based on the specified leverage threshold (ht). A value of kmin = 0 indicates that for some SMILES, no model in the ensemble satisfied the threshold. The strictness of ht directly governs the trade-off between estimation accuracy and the size of the applicability domain: a stringent threshold yields a smaller, reliable subset of "surviving" SMILES, whereas a more permissive threshold increases the coverage of the validation set at the cost of potential accuracy degradation.
To determine the true generalization capability of the ensemble, the estimation performance on the validation set (B200) was assessed by applying the chosen leverage threshold (ht). Specifically, for each SMILES, estimations exceeding the threshold ht were considered unreliable and discarded. The performance was then evaluated across the subset of SMILES for which at least one reliable estimation was available, calculating the Root Mean Square Validation Error denoted RMSVE(ht):
where Mval is the number of SMILES retained within the applicability domain, and the ensemble estimation of the pKa for the structure encoded by SMILES m, computed as the mean value of the individual estimations satisfying the threshold ht:
To ensure the statistical robustness of these metrics and to mitigate the influence of the random weight initialization of the individual models, the entire selection procedure —comprising the training of 500 models followed by the selection of the 50 best—was repeated across three independent runs. To guarantee rigorous reporting, the kmin value presented is always the most conservative (lowest) value observed across the three independent runs.
Alongside the RMSVE(ht), the robustness of the ensemble is evaluated by tracking the count of severe outliers remaining within the specified applicability domain (ht). An outlier is defined as an estimation exhibiting an absolute deviation (AD) greater than 1.5 pKa units from the experimental value. Tracking this metric identifies networks that might achieve an acceptable mean error while remaining prone to large individual deviations. Additionally, to monitor the potential structural drift caused by over-parameterization, we compute the global mean validation leverage (), averaged across all 50 models and all 200 SMILES of the validation set.
This procedure was repeated for network complexities ranging from 12 to 22 hidden neurons. For each complexity, we evaluated the RMSEvirtual, and RMSVE(ht) as described in the previous paragraphs.
2.5. Extended Training Analysis Protocol
To evaluate the origin of specific estimation errors on unseen data—distinguishing between training data scarcity and representational limitations—an extended training analysis (ETA) protocol was developed. ETA consists of concatenating targeted test or validation datasets directly to the primary training pool and executing a standard training run on this extended set. While a single execution is sufficient for standard anomaly diagnostics, this training procedure can be repeated across independent runs (e.g., three runs) to extract relevant standard deviations (SDs) and rigorously ensure statistical robustness.
The ETA diagnostic operates sequentially. First, an overall evaluation is performed on the extended set using the RMSEvirtual metric (defined as the root-mean-square of the ensemble virtual errors). The mean RMSEvirtual of the initial training set is compared to the mean RMSEvirtual of the added test or validation set. This comparison immediately determines whether the appended dataset aligns with the established parameter space or constitutes an exotic chemical domain.
Second, a particularized evaluation is conducted at the individual SMILES level, specifically focusing on previously identified outliers or highly influential points. For a given SMILES m, its initial estimation error—calculated when it was part of the unseen dataset, strictly excluding individual models where the leverage exceeded the applicability domain threshold (ht) and tracking the number of retained models (kmin)—is compared to its new virtual deviation (VD), defined as the absolute difference between the experimental value and the ensemble virtual estimation , following concatenation. Based on an alert threshold—defined as twice the baseline RMSEvirtual of the initial training set—estimation anomalies are classified into two distinct categories:
- Extrapolation due to data scarcity: If the initial estimation error is reduced to a VD below the alert threshold, the SMILES is successfully modeled. However, if this addition requires a high parameter allocation—reflected by a new mean leverage well above the statistical 2p/M boundary defined previously in Section 2.4—it demonstrates that the initial error stemmed from an under-representation of this specific chemical space in the primary training dataset.
- Representational limitation: If the VD remains above the alert threshold despite the addition of that SMILES to the training pool, it flags a fundamental limitation (e.g., dynamic mesomeric effects unresolved by 2D topological graphs) or noisy experimental data.
2.6. Exhaustive Dataset Audit, Final Training, and Deployment
While the initial anomaly detection (described in Section 2.3.1) successfully eliminated severe outliers and allowed for the robust selection of the optimal network architecture (GM19) via the B2102 and B200 splits, preliminary evaluations on external test sets revealed a more insidious, systemic bias within the training data. Specifically, consistent prediction deviations for certain molecular families on the external benchmarks indicated that numerous structures in the original dataset were encoded as minor tautomers rather than their predominant, physically relevant protomeric forms in aqueous solution. Because these misassigned tautomers formed an internally consistent—albeit physically incorrect—cluster within the original training set, they were not flagged by the initial gross-error filtering.
Recognizing the scale of this tautomeric assignment issue, we undertook a complete, exhaustive metrological audit of the entire B2302 dataset. Rather than relying on calculated properties, structures and values were meticulously cross-referenced against primary literature and foundational compilations, notably the IUPAC database. This high-fidelity review went far beyond structural corrections: it allowed us to identify and rectify minor experimental pKa errors (in the range of 0.2 to 0.3 units) present in the original Hunt compilation, and to systematically track down 'phantom' data. Consequently, structures corresponding to physically non-existent tautomers, unmeasured pKa values, or completely untraceable references were strictly eliminated. To preserve the dataset's scale and chemical diversity following these deletions, new structures validated from "golden level" primary sources were introduced. This systematic curation process yielded the reliable dataset of 2,334 SMILES (denoted as B2334), which is provided in its entirety in Table S8.
Reaching this final dataset involved a series of precise modifications: the introduction of 132 high-fidelity SMILES (Table S9) and the removal of 100 problematic entries (Table S10). Furthermore, the audit led to the correction of 75 structural assignments (Table S11) and 95 experimental pKa values (Table S12), alongside the strict standardization of 449 entries via stereochemistry removal (Table S13) and 154 entries via precise kekulization (Table S14). All these detailed tracking tables, alongside the complete B2334 dataset, are aggregated in the B2334.xlsx Supplementary Information file.
The final optimal architecture (determined as GM19 in Section 3.1, comprising 537 parameters) was then retrained from scratch on this B2334 dataset. To ensure strict statistical reproducibility, this final training procedure was conducted across three independent runs. The resulting ensembles were subsequently utilized to perform the definitive predictive assessments on the three external benchmarks (SAMPL6, Jensen, and EuroSAMPL1) discussed in Section 3.4.
Finally, to facilitate community access and ensure computational reproducibility, the final HGM production model is provided as a Docker container. This deployment environment allows for site-specific pKa predictions on explicitly tagged hydrogen atoms, ensuring consistent results across platforms by eliminating potential software dependency conflicts.
2.7. Use of Generative Artificial Intelligence
In accordance with journal guidelines, the authors declare the use of generative artificial intelligence (GenAI) during the preparation of this manuscript. Specifically, Google’s Gemini Pro (version 3.1) large language model was employed as an advanced editorial assistant to refine the academic language, optimize structural phrasing, and ensure terminological consistency throughout the text. The GenAI tool was strictly restricted to language editing and was not involved in the study design, metrological data curation, model training, data analysis, or scientific interpretation. All models, chemical data, results, and final conclusions presented herein remain the exclusive intellectual contribution and sole responsibility of the human authors, who thoroughly reviewed, edited, and validated all AI-assisted revisions.
3. Results
3.1. HGM Model Selection
As defined in the training protocol (see Section 2.4), the selection of the optimal HGM architecture follows a two-step procedure. First, for each candidate architecture, models are ranked based on VLOO scores on the training set B2102. Second, the final ensemble generalization capacity and its applicability domain are assessed using the validation set B200, which serves here strictly as a proxy for hyperparameter tuning prior to final evaluation on independent test sets. Table 1 reports the values of the metrics previously described in Section 2.4 for architectures of increasing complexity. Note that architectures comprising fewer than 12 hidden neurons are not included here, as their preliminary predictive performance proved insufficient.
As observed, increasing the network complexity from GM12 to GM22 yields continuous improvements in the training metrics. Crucially, the SDs computed across independent runs for both VLOO metrics remain strictly below 0.01 pKa units (omitted from Table 1 for clarity). This exceptionally low variance prevents any statistical overlap between successive architectures, demonstrating the high reproducibility and robustness of the training process. However, while smaller datasets typically exhibit a U-shaped VLOO curve that clearly identifies the optimal architecture, the size of B2102 prevents immediate leverage inflation. Consequently, while shows an overall drop from 0.67 to 0.48 pKa units, its decrease rapidly decelerates into an asymptotic plateau around 0.5 for complexities higher than GM18. This stagnation makes it impossible to determine the optimal architecture using the mean individual error alone.
Concurrently, RMSEvirtual steadily decreases, dropping from 0.29 to 0.22 pKa units between GM18 and GM22. Significantly, this 0.22 pKa units mark reflects a physical boundary. By analyzing a subset of 24,222 entries (representing over 10,000 unique molecules) from the digitized IUPAC database [29], we calculated an average SD of 0.2 pKa units between independent measurements of identical compounds. Because the IUPAC compilation and our training corpus share major primary sources—most notably the foundational monographs by Perrin [19,20]—this calculated variability serves as a rigorous reference point for the intrinsic experimental noise limit. It dictates that further increasing the network complexity beyond GM22 is unnecessary, as the model would merely begin to fit the experimental uncertainty.
At this stage, the training metrics demonstrate that an architecture of at least GM18 is required to reach the onset of the performance plateau, but they cannot determine which architecture (from GM18 to GM22) will best generalize to unseen compounds without overfitting. To resolve this, we evaluate the validation set B200 to assess not only the true generalization error of each architecture, but also the consistency of their respective applicability domains.
First, it is essential to establish the proper leverage threshold (ht) for this evaluation. As shown in Table 1 (fourth row), applying a restrictive threshold h1 results in a fragile ensemble: from GM18 onwards, the minimum number of reliable models (kmin) drops to 0, indicating that one or more challenging SMILES are entirely rejected by the ensemble. Because these excluded SMILES are typically the most severe outliers, discarding them artificially lowers the apparent error, rendering the corresponding RMSVE(h1) fallacious. A realistic evaluation therefore requires more permissive thresholds, such as h5 and h10, which ensure these difficult SMILES remain within the applicability domain. The objective is therefore to identify the optimal boundary: one that maximizes the ensemble size (kmin) for all SMILES without degrading predictive performance.
Table 1 reports both the RMSVE(h5) and RMSVE(h10). While the performance remains identical for simpler networks (GM12 to GM18), relaxing the threshold from h5 to h10 proves highly beneficial for higher-complexity architectures. For the GM19 architecture, this relaxation significantly increases the minimum number of reliable models (kmin) available for the most challenging SMILES in B200—from 28 models (h5) to a robust 39 models (h10)—without degrading the validation error, which remains statistically stable (shifting from 0.57 to 0.56). This stability stems directly from ensemble dynamics: the inclusion of a greater number of participating models smooths out individual variance. However, empirical tests on GM19 showed that extending this threshold further (e.g., h20 or h50) provides no additional benefit and causes a slight, steady increase in the validation error (rising to 0.57 for h50). While a highly permissive threshold inflates the number of participating models (with kmin approaching 48), it inevitably forces the inclusion of individual models that are extrapolating too far beyond their reliable applicability domain, thereby introducing systematic extrapolation errors into the ensemble mean. This dynamic justifies h10 as the optimal empirical boundary.
Having established h10 as the robust evaluation standard, Table 1 reveals that the RMSVE(h10) reaches an absolute minimum of 0.56 pKa units for the GM19 architecture. At higher complexities, the mean error stagnates or slightly increases, signaling the onset of overfitting where the network begins to memorize localized training anomalies. It is important to note that, unlike the training metrics, these validation errors exhibit noticeable SDs (ranging from 0.01 to 0.03 pKa units) across independent runs. This variance introduces a partial statistical overlap between competing architectures, indicating that the mean validation error alone is insufficient to definitively identify the optimal model. To break this tie, this trend must be corroborated by both the count of severe outliers (AD > 1.5 pKa units) and the stability of the ensemble (kmin).
First, the outlier count drops from 9 for GM12 to an absolute minimum of 4 for GM19, before rising again to 6 for GM22. Second, comparing GM19 and GM22 highlights the degradation of the ensemble predictions that occurs in over-parameterized models. As the parameter count increases, the high-dimensional parameter space of larger architectures becomes increasingly sparse relative to the training data. This over-parameterization drift can be directly quantified by evaluating the global mean leverage of the validation set (, averaged across both the 50 models of the ensemble and the 200 validation SMILES). This metric rises from 0.7 for GM19 to 1.2 for GM22, pushing these compounds toward the unreliable edges of the applicability domain. This global upward shift in leverage explains why GM22 sees its ensemble size drop (kmin = 25) compared to the robust ensemble of GM19 (kmin = 39). Based on minimum validation error, ensemble density, and estimation reliability, GM19 is selected. The detailed estimations generated by this selected GM19 architecture for both the training and validation sets—calculated as an average over three independent runs—are provided in Tables S2 and S3 (last column) of the Supplementary Materials, available in the B2302.xlsx file. Table S2 also includes the ensemble virtual estimations () and the resulting RMSEvirtual for the training set B2102. Section 3.2 provides an analysis of these four residual outliers to determine whether their deviations stem from inherent model limitations or identifiable physicochemical phenomena, such as steric hindrance [30,31] or intramolecular hydrogen bonding [32,33].
3.2. Chemical Analysis of Residual Outliers and Benchmark Comparison
The evaluation of the estimations generated by the selected GM19 ensembles on the B200 validation set identified four major outliers exhibiting ADs equal to or exceeding 1.5 pKa units: bentazone (AD = 3.1), 4-hydroxypyridine 1-oxide (AD = 2.5), CHEMBL2094588 (AD = 2.3), and 1H-perimidin-2-amine (AD = 1.5). Figure 2 illustrates these evaluated species, with the investigated acidic or basic hydrogen atoms highlighted in red and blue, respectively.
To systematically classify these deviations, the ETA protocol (detailed in Section 2.5) was applied using the combined dataset (B2102/B200) across three independent runs. The overall evaluation demonstrated consistent behavior: the initial training set (B2102) yielded a mean VLOOensemble of 0.3 pKa units (SD = 0.004), and the appended validation set (B200) perfectly matched this performance with a mean RMSEvirtual of 0.3 pKa units (SD = 0.002). Consequently, the alert threshold for the particularized evaluation is established at 0.6 pKa units (twice the baseline).
The particularized evaluation confirms that the first three outliers—bentazone, CHEMBL2094588, and 1H-perimidin-2-amine—suffer from extreme extrapolation. Prior to ETA, these complex polycyclic systems exhibited validation leverage values near the applicability boundary ( ranging from 4.5 to 5.6). Following concatenation, their initial estimation errors are reduced to ensemble VDs of 0.5, 0.2, and 0.2 pKa units, respectively. Being below the 0.6 pKa alert threshold, these SMILES are successfully modeled. However, this process requires high parameter allocation, reflected by new mean leverages of 0.8 for all three SMILES (well above the 2p/M≈0.47 boundary). This confirms that their initial deviation was due to data scarcity in the primary training set. This extrapolation pattern is further corroborated by albendazole (CHEMBL1483_1), a minor outlier (AD = 1.3) sharing a similarly high validation leverage ( = 5.0).
By contrast, 1-hydroxypyridin-4-one reveals a native representational limitation. Initially exhibiting a significant estimation error of 2.5 despite a moderately low validation leverage ( = 1.1), this SMILES maintains an ensemble VD of 0.8 pKa units post-concatenation, alongside an allocated mean leverage of 0.5. Remaining above the 0.6 pKa alert threshold, this case demonstrates the inability of 2D topological graphs to encode the dynamic mesomeric effects inherent to the N-oxide moiety. While manually incorporating distinct resonance contributors (e.g., zwitterionic forms) can partially bridge this gap, integrating such electronic interplay natively during training remains beyond the current scope of the 2D representation.
A similar representational limitation is observed for bulky or ortho-substituted amines. When their corresponding SMILES inputs are evaluated, mean leverage values remain safely within the applicability domain (∈ [0.2,0.5]), yet the estimations provided by the ensemble systematically overestimate their experimental pKa values by 1.4 to 1.5 units. Quantum chemical calculations (PM6 [34,35]) confirm that steric hindrance from neighboring groups—such as cyclohexyl rings or ortho-substituents—restricts solvent accessibility and profoundly destabilizes the ammonium ion. Because these 3D spatial shielding and specific solvation effects cannot be directly encoded by a purely 2D graph-based model, the algorithm defaults to treating these sites as unhindered amines, leading to systematic overestimations.
Across the three independent runs within the B2102 training set itself, an average of six SMILES consistently emerge as residual outliers with mean ADs ranging from 1.0 to 1.5 pKa units. While the more complex GM22 architecture can virtually eliminate these specific training outliers, this apparent improvement in training performance is systematically offset by a loss of generalization ability on the B200 validation set. This justifies the selection of the GM19 architecture as the optimal configuration, balancing learning capacity and generalization. These specific SMILES, typically characterized by high ring strain in rigid 3D geometries (e.g., azetidine) or atypical intramolecular hydrogen bonding, define the current limitation of 2D graph-based representations, and will be further discussed in Section 4.
Finally, Table 2 compares the estimation performance of the selected GM19 ensembles with the benchmark results originally reported by Hunt et al. [18] on their respective validation sets. HGM demonstrates a strictly lower RMSVE and a higher coefficient of determination (R2) compared to the benchmark model. Furthermore, the number of significant estimation failures—defined as estimations exhibiting an AD exceeding 2.0 pKa units—is substantially reduced in the present study (dropping from 8% to 2%), suggesting an improved estimation stability across diverse chemical spaces.
3.3. Generalization Performance of the Final Production Model (B2334)
As detailed in Section 2.6, the optimal GM19 architecture was retrained on the metrologically curated B2334 dataset across three independent runs to generate the final production ensembles. To confirm that this consolidation maintained consistent predictive performance, its generalization capacity was evaluated.
Across the three runs, the production ensembles achieve a of 0.48 pKa units and a highly robust RMSEvirtual of 0.25 pKa units. For both metrics, the SD computed across the independent runs remains strictly below 0.01 pKa units, demonstrating both the reproducibility and the overall reliability of the training process. Full details of the experimental and estimated values, including virtual estimations, for the B2334 production training set are provided in Table S8 (see file B2334.xlsx, sheet 'B2334', columns D and E).
The distribution of the ensemble virtual estimations remains narrow. Across the entire B2334 dataset, a single SMILES—corresponding to 2-(2-hydroxyphenyl)phenol—exhibits a mean AD exceeding 1.0 unit (specifically, 1.5). The reduction from the six training outliers identified in preliminary builds to this single anomaly illustrates the impact of the metrological curation. Retrospective analysis reveals that most previous outliers were artifacts of the original data rather than algorithmic failures: two of them lacked traceable experimental sources (subsequently removed), one possessed an erroneous experimental target value (N,2,6-trimethylaniline, now corrected, yielding an AD of 0.4), and another—corresponding to azulene-1-carboxylic acid—was previously encoded in a physically irrelevant state, yielding accurate estimations once properly represented as a zwitterion. For the final two compounds, their pKa prediction errors simply dropped below the 1.0 threshold upon retraining.
Furthermore, the architecture maintains reliable predictions across diverse functional groups without generating severe isolated outliers. Across the entire database, only three SMILES exhibit a mean leverage () exceeding 0.9: the first attributed to a perhalogenated fluorochloroalcohol, the second to hexamethyldisilazane (the only compound containing two silicon atoms), and the third to hexanitrodiphenylamine (the unique compound featuring six nitro groups). Despite their rare topological features forcing them to act as high-leverage support points—with the fluorochloroalcohol likely subject to strong intramolecular hydrogen bonding and through-space field effects—their mean absolute estimation deviations approach zero (|ΔpKa|≤ 0.1). This indicates that the ensembles successfully integrate these marginal chemical spaces into its applicability domain. The performance of the production ensembles is summarized in the scatter plot of the virtual estimations versus the experimental pKa values (Figure 3).
This tight alignment along the bisector confirms a consistent and unbiased virtual estimation accuracy across the entire pKa range. A specific focus was placed on the 25 compounds exhibiting a high mean leverage ( > 0.8), represented as a distinct series. While their atypical chemical features push them toward the boundaries of the applicability domain, their virtual ensemble estimations remain remarkably close to the experimental values. Within this specific group, the maximum virtual AD is strictly bounded at 0.6 pKa units (observed for dibenzyl hydrogen phosphate, illustrated as the leftmost structure in Figure 3).
Furthermore, the virtual outliers (|ΔpKa|≥1.0) are highlighted. Out of the 2,334 compounds, only five fall into this category—all of which are illustrated in Figure 3. Four of these are narrowly confined near the threshold (ADs ranging from 1.0 to 1.2), leaving 2-(2-hydroxyphenyl)phenol (illustrated at the top of the Figure) as the sole prominent virtual outlier (deviation of 1.8). This tiny subset, representing approximately 0.2% of the dataset, underscores the model's robustness: even when these compounds are treated as unseen data, large deviations are virtually nonexistent.
3.4. HGM in Action: The SAMPL6 Blind Test
The sixth edition of the Statistical Assessment of the Modeling of Proteins and Ligands (SAMPL6 [3]) challenge provides a benchmark for evaluating computational tools, specifically within the chemical space of small-molecule kinase inhibitors. This set of 24 organic molecules (SM01–SM24) was curated to challenge current methods by introducing complexities such as multiple titratable sites, heterocyclic scaffolds, and tautomerization. All macroscopic pKa values were determined via high-quality UV-absorbance spectroscopy (Sirius T3 [36]). In this evaluation, we utilize the SAMPL6 results (detailed in Table S15 of the Supporting Information, file B2334.xlsx, 'SAMPL6' worksheet, columns D and E) not merely as a validation metric, but as a diagnostic tool to demonstrate how the HGM approach resolves site ambiguity when guided by spectroscopic evidence.
3.4.1. Site Identification and NMR-Driven Mapping
A key challenge in pKa prediction is the disparity between macroscopic values and the microscopic protonation states involved. While the SAMPL6 challenge provided macroscopic data, subsequent NMR characterization for compounds SM07 and SM14 allowed for the precise identification of their protonation sites [36]. Specifically, NMR titration confirmed that for their shared quinazoline scaffold, protonation occurs exclusively at the N-12 position (para to the amine chain; see Figure 4). This spectroscopic insight proved crucial for modeling the SM02, SM04, SM09, SM11, SM12, and SM13 series, where N-12 was assigned as the protonation site by structural analogy.
This structural and spectroscopic rigor is summarized in Figure 4, which serves as a benchmark for comparing the HGM architecture against automated approaches, such as those by Hunt et al. (values in parentheses). The figure highlights the impact of site identification on predictive accuracy; frequently major discrepancies do not arise from the training algorithm, but from incorrect site assignments, particularly in the benchmark results (errors highlighted in pink). Bold values indicate the selected pKa, representing either the thermodynamically preferred site or the final value derived after mesomeric adjustment.
3.4.2. From Site Ambiguity to Mesomeric Refinement via NMR Guidance
In a strictly 'blind' prediction scenario, where no prior spectroscopic data is available, the identification of the protonation site in multifunctional heterocycles remains a primary source of predictive error. For the majority of the SAMPL6 structures—such as SM01, SM10, SM17, and SM18—the model successfully and unambiguously identifies a single predominant ionization site. More remarkably, within the complex 4-aminoquinazoline series (excluding SM11, which features a distinct 5-membered fused ring system), the HGM architecture natively identifies the correct target: it systematically predicts the para position (N-12) as the most basic site, or ranks it in tight competition with the ortho position (N-10). For instance, in SM07, HGM accurately assigns a higher basicity to N-12 (5.3) compared to N-10 (5.0).
However, while the algorithm successfully localizes the correct protonation event, this purely 'blind' topological prediction (5.3) still significantly underestimates the experimental macroscopic reality (6.1). This underestimation highlights a fundamental limitation: a static 2D graph focused solely on the protonated atom cannot natively map the massive electron donation originating from distant substituents across the heterocyclic framework.
To bridge this gap, we utilized the post-challenge 15N NMR data for SM07 [36]. Titration experiments not only confirm N-12 as the exclusive protonation site, but they reveal that the NMR signals for the exocyclic nitrogen N-8 exhibit a massive downfield shift (approximately 30 ppm), while the N-10 signal remains nearly unaffected (less than 3 ppm). This pattern identifies the N-8 amine lone pair as the primary contributor to the mesomeric stabilization of the N-12 microstate, while N-10 does not participate significantly in this electronic redistribution.
We interpret this substantial downfield shift at N-8 as evidence of significant charge delocalization toward the exocyclic amine. This physical reality can be represented by a resonance structure where the positive formal charge is localized on N-8 (Figure 5, Form II). Although this mesomeric contributor involves a loss of ring aromaticity, its electronic influence on the macroscopic pKa is substantial. To account for this, we move beyond a single-site model to a 'weighted microstate' approach.
By applying a weighting factor of 0.85 to the primary N-12 protonated form (Form I) and 0.15 to the N-8 mesomeric contributor (Form II), HGM accounts for this electronic balance. Given that the GM19 ensembles predict a pKa of 5.2 for Form I and 9.8 for Form II, the resulting weighted pKa for SM07 is 5.9 (calculated as 0.85×5.2+0.15×9.8), which effectively reduces the residual error to just 0.2 pKa units compared to the experimental value of 6.1.
To provide a physical basis for this weighted model, semi-empirical (PM6) calculations were performed on the various protonated states of SM07. Results confirm that the N-12 protonated cation is thermodynamically more stable than its N-10 counterpart. Furthermore, the geometry of the N-12 cation reveals significant shortening of the C–N-8 bond, alongside a marked reduction of the negative charge on the exocyclic nitrogen (N-8) relative to the neutral species. These structural and electronic shifts provide robust theoretical support for N-8’s active participation in charge delocalization via resonance.
It is essential to emphasize that mesomeric refinement is implemented as a site-specific response to structural cues rather than a universal rule. The boundary of this approach is well-illustrated by the cases of SM14 and SM24. For SM14, NMR data confirm a distinct protonation sequence starting at the endocyclic nitrogen (N-5), with no significant charge delocalization toward the exocyclic site (N-10) due to surrounding steric bulk hindering solvent stabilization. A similar logic applies to SM24; unlike SM07, mesomeric weighting is not applied. The combination of its bulky p-methoxyphenyl group and the ethanolamine side chain creates a shielded environment that prevents the effective solvation of an iminium-like resonance form. Our analysis, supported by semi-empirical energy calculations, identifies the para-nitrogen (N-6) as the primary protonation site, as the ortho-position (N-10) is significantly disadvantaged by this local crowding. By prioritizing the most thermodynamically stable and solvatable site without over-generalizing resonance effects, HGM maintains high predictive accuracy even across these complex, sterically constrained scaffolds.
As shown in Figure 4, applying this NMR-guided refinement to the quinazoline series aligns predictions with experimental reality. Compounds highlighted in the dotted boxes (Figure 4) demonstrate this effect; notably, for SM04 (exp. 6.0, pred. 5.9) and SM12 (exp. 5.3, pred. 5.3), the final weighted pKa values—incorporating resonance contributions—are shown in bold, reducing errors to nearly zero. This result validates that the HGM architecture effectively bridges the gap between raw topological predictions and the electronic reality of complex drug-like fragments. This 'Spectroscopic Guidance' protocol provides a robust framework that we will subsequently apply to resolve the specific case of phenacaine within the Jensen dataset [15], as well as structural outliers in the EuroSAMPL1 set [16].
3.4.3. Statistical Performance and Robustness on the SAMPL6 Set
To evaluate the predictive power of HGM, we compared two decision-making scenarios for the quinazoline series. In a strictly 'blind' automated pipeline—where the model systematically selects the site predicted as the most basic (which, as demonstrated, corresponds to the para position for this scaffold)—HGM achieves a global root mean square test error RMSTE(h10) of 0.6 (SD = 0.10) and a mean absolute error (MAE) of 0.5 (SD = 0.08). Integrating the mesomeric weighting protocol, as described in the previous section, refines these metrics, leading to an RMSTE(h10) of 0.5 (SD = 0.08) and a MAE of 0.4 (SD = 0.06), as displayed in Table 3. Furthermore, HGM demonstrated remarkable predictive stability across the SAMPL6 dataset. Over the three independent runs, the lowest ensemble size (kmin) was observed for only a single compound (SM03), which still triggered at least 42 valid predictions (out of 50) from the ensembles. This decrease of kmin reflects the limited representation of its specific thiadiazole-thiophene scaffold within the training data, serving as a diagnostic flag that indicates when a chemical environment approaches the boundary of the architecture's applicability domain.
These results position HGM competitively within the SAMPL6 benchmark. Notably, the weighted HGM strategy achieves a MAE of 0.4, lower than all other methods, including the best QM-based performer (COSMO-RS [37], MAE 0.6) and industry-standard commercial software (ACD/Labs results from Hunt’s paper [18], MAE 0.6). Additionally, recent ACD/Labs predictions retrieved from the CAS database [38] yielded an RMSE of 0.8 and a MAE of 0.5, although these metrics could only be calculated for 29 out of the 31 pKa values. This suggests high consistency across the diverse chemical space of the challenge. Furthermore, HGM yields lower error metrics compared to recent high-performing frameworks such as H-SPOC [9] and Uni-pKa [11] (both reporting an RMSE of 0.7 and a MAE of 0.6), demonstrating the quantitative advantage of our physically grounded approach.
While the model by Hunt et al. [18] reports a global RMSE of 0.9 and a MAE of 0.7, a closer inspection reveals the limitations of topologically blind models. To underscore the necessity of explicit site assignment, we investigated the topographical basicity landscape for the specific case of SM24 (exp. 2.6). The HGM ensembles evaluated all three potential nitrogen centers, predicting pKa values of 2.9 for the para site, 2.7 for the ortho site, and a highly acidic 0.7 for the exocyclic amine. While the endocyclic positions present competitive basicities, the exocyclic nitrogen is thermodynamically excluded from macroscopic protonation. Nevertheless, the RBF network assigns its macroscopic prediction to this exact exocyclic position (indicated by the pink value for SM24 in Figure 4). This topographical misassignment is not an isolated occurrence. As detailed in Figure 4, the RBF network proposed by Hunt et al. incorrectly identifies the primary protonation site for 7 out of the 31 macroscopic pKa targets in the challenge. When topologically blind architectures achieve numerically plausible macroscopic metrics despite such a high rate of site attribution error, it indicates a reliance on fortuitous error compensation rather than physically meaningful predictions. By enforcing a rigorous, site-specific mapping, the HGM framework inherently avoids this pitfall.
While the overall statistical performance is robust, Figure 4 highlights two specific outliers: SM05 (exp. 4.6, pred. 6.3, error 1.7) and SM01 ((exp. 9.5, pred. 8.2, error 1.3).
To classify the origin of these deviations, the ETA protocol (detailed in Section 2.5) was applied in a single execution by concatenating the 31 SAMPL6 SMILES to the primary B2334 dataset, yielding an extended set of 2,369 SMILES. The appended SAMPL6 subset yielded a mean RMSEvirtual of 0.2 pKa units, fully consistent with the primary dataset baseline of 0.25 pKa units. Consequently, the alert threshold is established at 0.5 pKa units (twice the baseline).
Compound-specific analysis reveals divergent origins for these errors. For SM05, the initial error (1.7) drops to an ensemble VD of 0.1 pKa units following concatenation. Being well below the 0.5 threshold, its pKa is successfully modeled. However, this integration requires a substantial parameter allocation, reflected by a high mean leverage ( = 0.6). This confirms that the initial error for SM05 stemmed from extrapolation due to data scarcity in the primary training set.
Conversely, SM01 exhibits a representational limitation. Despite a modest parameter allocation ( = 0.3), its ensemble VD converges to 0.7 pKa units, remaining above the alert threshold. This indicates either that the 2D topological graph fails to encode the specific physico-chemical behavior of this molecule, or points to noisy experimental data.
Beyond the specific cases of SM01 and SM05, the mesomeric weighting strategy developed above for the SAMPL6 quinazoline series offers a broader methodological solution. It directly resolves the representational limits previously identified in Section 3.2 for the B200 validation outliers. For highly conjugated systems such as CHEMBL2094588 (exp. 9.1) and 1H-perimidin-2-amine (exp. 7.6), the default 2D topological graph initially failed to encode the extensive charge delocalization across their respective three-nitrogen systems.
Generating explicit SMILES for their three pertinent mesomeric forms reveals a consistent behavior across both molecules. Contrary to a purely equiprobable distribution (1/3 : 1/3 : 1/3), a 1/2 : 1/4 : 1/4 weighting scheme—assigning half of the weight to the primary protonated form (Figure 2) and evenly splitting the remainder between the two forms involving neighboring nitrogen lone pairs—yields better estimations. Under this specific distribution, the estimation for CHEMBL2094588 converges to 9.4 (∣ΔpKa∣ = 0.3), and 1H-perimidin-2-amine reaches 7.7 (∣ΔpKa∣ = 0.1). This demonstrates that integrating standard chemical knowledge overcomes the structural limitations of 2D representations.
Building upon the lessons from SAMPL6—notably the distinction between data scarcity and representational limits—the evaluation proceeds to the Jensen dataset [15].
3.5. Reassessing the Jensen Dataset: Performance and Data Quality
The Jensen dataset (53 SMILES corresponding to 48 compounds) is frequently cited as a benchmark for pKa prediction. However, as noted by Hunt et al. [18], the performance of commercial codes on this set is likely inflated; many of these molecules are well-known drugs whose pKa values have been established for decades, and are almost certainly included in the training sets of proprietary software [39]. This creates a circular validation loop, favoring methods that memorize data over those that generalize. To avoid this bias, our predictions on the Jensen dataset were performed using models trained on our extended B2334 dataset. We explicitly ensured that all Jensen structures were excluded from this training set (18 structures; see Table S5 of the Supporting Information, file B2302.xlsx, 'removed smiles' worksheet, column D), allowing for an unbiased assessment of predictive capability. In this context, the performance of physical models—such as the DFT results by Eckert and Klamt [40]—remains a useful reference point, as they rely on minimal parameterization rather than extensive training.
The HGM approach aims for this standard of transparency. To establish a rigorous baseline, we audited the Jensen dataset from Hunt’s paper [18], identifying eight inaccuracies regarding protonation sites and formal charges (see Table S16 of the Supporting Information, file B2334.xlsx, 'Jensen' worksheet, column G). This re-evaluation revealed that several entries in the original dataset relied on incorrect structural or site assignments—such as misidentifying the basic site for clozapine and guanethidine, assigning an incorrect global protonation state (e.g., metaproterenol), or using tautomeric forms inconsistent with experimental data (e.g., cimetidine, niacin). Correcting these assignments ensures that predictions are evaluated against the appropriate physical species in solution. Unlike previous benchmarks, our evaluation retains the complete set, including the doubly charged cefadroxil. Across three independent training runs on this corrected dataset, five compounds consistently emerged as outliers, each exhibiting a mean AD strictly greater than 1.0 pKa units (> 1.0): sparteine (2.6), nefopam (2.2), phenacaine (1.7), nikethamide (1.5), and niacin– (1.3). For these five outliers, the lowest ensemble size (kmin) remains high, yielding at least 48 valid predictions (out of 50) from the ensembles. This confirms that the observed deviations do not stem from the compounds falling outside the applicability domain.
Addressing these highest deviations first reveals two distinct boundary cases, illuminated by their respective mean leverage ) values. For nefopam, the exceptionally low mean leverage ( = 0.2) signifies the structure is processed as being well within the applicability domain. While initial hypotheses pointed towards an experimental data artifact linked to sample degradation [41], a rigorous kinetic assessment confirms the experimental pKa of 8.5 is robust. The significant discrepancy—6.3 predicted versus 8.5 in literature—is instead a direct consequence of a 2D topological artifact, the mechanistic details of which are thoroughly analyzed in Section 4. By contrast, sparteine (= 1.6) represents a distinct physical limitation; its rigid tetracyclic framework enables a 3D through-space stabilization of the proton that topological 2D graphs cannot capture (further discussed in Section 4).
Similarly, the substantial mean leverage of phenacaine (= 1.6) highlights another topological challenge: the accurate representation of highly delocalized charged systems. To resolve this discrepancy, we extended the mesomeric weighting protocol. While two forms were sufficient for the 4-aminoquinazoline system in the SAMPL6 set [3], PM6 modeling of protonated phenacaine reveals a fully symmetric amidinium system where the positive charge is delocalized across the N−C−N triad. Since a single 2D graph fails to accurately capture this charge delocalization, we explicitly compensated for this representational limit by averaging three canonical forms: two nitrogen-centered cations and a central carbocationic form. Consistent with the mesomeric strategy established previously, a 1/2 : 1/4 : 1/4 population weighting scheme was applied. Averaging across three independent runs, this mesomeric correction yields a predicted pKa of 9.4, reducing the AD from the 9.3 experimental value to 0.1 pKa units.
Finally, the remaining two outliers are both meta-substituted pyridines, yet their distinct mean leverages point to different underlying physical challenges. For nikethamide (= 0.8), the overestimation of the pKa highlights a limitation regarding solvation. The topological architecture cannot account for the 3D steric hindrance generated by the bulky N,N-diethylamide group, which disrupts the solvation sphere of the conjugate acid and experimentally depresses the macroscopic pKa. In contrast, niacin– ( = 1.2) suffers from the complexity of macroscopic aqueous speciation. By deconvoluting the experimental macroscopic pKa using aqueous speciation data (91% zwitterion, 9% neutral) from Green et al. [42], we derived true microscopic pKa values of 4.8 and 3.8, respectively. Evaluating these representations shows that the neutral form is predicted at 4.2 (a deviation of +0.4), whereas the zwitterionic form yields a deviation of +1.2 (predicted at 6.0). This demonstrates the inability of a 2D graph representation to capture the 3D electrostatic field effects governing this specific zwitterionic equilibrium.
Evaluating the raw dataset—which deliberately retains outliers like sparteine and nefopam, and applies no mesomeric weighting for phenacaine—provides an unvarnished assessment of the architecture's physical boundaries. In this regime, HGM yields a mean RMSTE(h10) of 0.7 (SD = 0.03), a mean MAE of 0.5 (SD = 0.03), and a maximum AD of 2.6 pKa units (the complete set of HGM predictions is provided in Table S16 of the Supporting Information, file B2334.xlsx, 'Jensen' worksheet, columns D and E).
To delineate the predictive baseline of the 2D architecture from its physical boundaries, an additional evaluation subset designated as the 2D Domain, is presented. In this subset, the mesomeric weighting for phenacaine is applied, while molecules whose basicity is predominantly governed by explicit 3D phenomena—specifically the intramolecular hydrogen bonding of sparteine and the steric hydrophobic shielding of nefopam—are excluded. Within this domain, HGM yields a mean RMSTE(h10) of 0.5 (SD = 0.02) and a mean MAE of 0.4 (SD = 0.03) pKa units. Consequently, Max AD decreases to 1.5 pKa units (attributed to nikethamide). However, all subsequent comparative benchmarking against external methodologies uses the full dataset to ensure an unbiased evaluation.
As detailed in Table 4, which benchmarks HGM against established approaches—including PM3/COSMO, DFT, ChemAxon, Epik, and ACD/Labs (with performance metrics retrieved from Hunt et al. [18])—our approach achieves predictive accuracy comparable to leading commercial tools and aligns with the rigorous baseline established by Eckert and Klamt’s DFT calculations [40].
To classify the exact nature of the five previously identified outliers, the ETA protocol was applied by concatenating the Jensen dataset to the primary B2334 data, yielding an extended set of 2,391 SMILES. The overall evaluation in a single execution demonstrated structural stability: the primary B2334 set maintained a RMSEvirtual of 0.25 pKa units, while the appended Jensen set yielded a compatible mean of 0.3 pKa units. Consequently, the alert threshold is established at 0.5 pKa units (twice the primary baseline, as detailed in Section 2.5).
The specific analysis clearly separates these five outliers into two distinct categories. For niacin, nikethamide, and phenacaine, the initial substantial prediction errors are reduced to VDs of 0.3, 0.5, and 0.3 pKa units, respectively. These values fall at or below the alert threshold, but require significant parameter allocations, with mean leverages () ranging from 0.4 to 0.6. This confirms that their initial poor predictions were due to data scarcity and extrapolation, rather than algorithmic failure.
Conversely, nefopam and sparteine exhibit clear representational limitations. Sparteine requires a substantial parameter allocation ( = 0.5), yet its VD only converges to 0.9 pKa units. Furthermore, nefopam presents a low leverage ( = 0.2) but maintains a VD of 1.5 pKa units. Remaining well above the 0.6 threshold, these two SMILES demonstrate the inability of the 2D topological graph to encode their specific structural features.
However, structural extrapolation does not systematically result in representational failure. To further investigate the architecture's behavior under extrapolation, compounds from the Jensen set exhibiting high test leverages ( > 2.0) but not classified as primary outliers were analyzed. Despite operating outside the structural domain of the training data, the ensemble model maintained contained initial prediction errors. For example, ADs for prazosin, clotrimazole, clozapine, and acyclovir were bounded at 1.0, 1.0, 0.8, and 0.7 pKa units, respectively. When subjected to the ETA protocol, their VDs systematically reduced to 0.2, 0.2, 0.3, and 0.1 pKa units. Similarly, guanethidine saw its initial 0.4 prediction error reduced to a 0.0 VD. These results highlight two key properties: the ensemble architecture ensures prediction stability during extrapolation, and the 2D graph fully encodes these complex structures once sufficient and adequate data is provided.
3.6. Final Validation: Robustness across the EuroSAMPL1 Blind Challenge
The EuroSAMPL1 challenge provides a comprehensive and contemporary benchmark for pKa prediction, consisting of 35 drug-like molecules with experimental values spanning the 2.0 to 10.0 pKa range (the complete set of structures is depicted in Figure S1 of the Supplementary Information) [16]. All measurements were conducted using the Sirius T3 gold standard, incorporating Yasuda-Shedlovsky extrapolation for compounds with limited solubility to ensure high-quality reference data. While deprotonation sites are generally well documented, several structures required a rigorous assessment to ensure physical consistency. For compound EuroSAMPL-12, a significant contradiction was noted in the original report between the visual representation, which incorrectly suggests pyridine nitrogen protonation, and the reported microstate transitions (charge 0 to –1) [16]. HGM correctly identifies the carboxylic acid as the primary ionization site (predicted pKa 3.7 vs. 3.7 experimental), as zwitterionic alternatives were found to be thermodynamically inconsistent.
Similarly, for EuroSAMPL-14 (5-bromo-6-methylpyrimidin-4-ol), although the original publication depicts the molecule in a phenolic form and incorrectly highlights a ring nitrogen as a basic site, experimental microstate data confirm an acidic transition. PM6 semi-empirical calculations conducted in this study resolved this inconsistency by demonstrating that the amide tautomer is thermodynamically favored over the phenolic form. Furthermore, among the possible amide configurations, the ortho-amide was found to be approximately 44.0 kJ⋅mol⁻¹ more stable than its para-isomer. Consequently, the observed pKa is correctly attributed to the deprotonation of the amide nitrogen.
This auditing was also applied to EuroSAMPL-18 and EuroSAMPL-26, where the ortho-amide forms were correctly identified as the dominant species in the original report. It is noteworthy, however, that common structural databases such as Chemical Abstracts (CAS) [38] represent these compounds using their para-NH tautomeric forms. PM6 calculations confirmed that the ortho-amide forms are thermodynamically preferred over these para-isomers, being respectively 49.0 kJ⋅mol⁻¹ and 42.5 kJ⋅mol⁻¹ more stable. Additionally, these amide tautomers were found to be significantly more stable than their phenolic counterparts. By prioritizing these thermodynamically stable forms, HGM ensures that its predictions are grounded in the predominant chemical species present in solution.
The initial evaluation of HGM, using an ensemble of three independent runs, provided a robust baseline for the challenge. A comprehensive overview of all predicted values for the EuroSAMPL1 set, both before and after weighting, is detailed in Table S17 of the Supporting Information (file B2334.xlsx, 'EuroSAMPL1' worksheet, columns D and E). Without any structural or electronic weighting, the architecture achieved an RMSTE(h10) of 0.7 (SD = 0.03) and a MAE of 0.5 (SD = 0.02) pKa units across the 35 molecules, with a maximum AD of 1.6 units. Specifically, this raw evaluation identified five initial outliers with ADs exceeding 1.0 unit: EuroSAMPL-19 (1.7), EuroSAMPL-15 (1.6), EuroSAMPL-33 (1.6), EuroSAMPL-30 (1.3), and EuroSAMPL-7 (1.1). These metrics already place HGM within the range of chemical accuracy, demonstrating the strength of the underlying graph-based approach.
Figure 6 illustrates the six protonated aromatic amines (EuroSAMPL-4, 7, 19, 28, 33, and 35) where a weighted mesomeric protocol proved essential for accurate prediction. The investigated basic hydrogen atoms are highlighted in blue.
In these protonated forms, the positive charge is significantly stabilized by aromatic delocalization through the ring, mediated by mesomeric donor atoms (N or S). The first row of Figure 6 focuses on compounds where the charge involves exocyclic centers or specific heteroatoms; for EuroSAMPL-4 and EuroSAMPL-35, the charge is shared with the exocyclic nitrogen, while for EuroSAMPL-7, it is shared between the exocyclic nitrogen, the endocyclic nitrogen, and the intracyclic sulfur atom. The scaffold of EuroSAMPL-4 mirrors the 4-aminoquinazoline nitrogen ring system previously analyzed in the SAMPL6 dataset. Conversely, the second row (EuroSAMPL-19, 33, and 28) illustrates cases where delocalization occurs on the second nitrogen atom located within the ring system, a pattern maintained across both fused (19, 33) and substituted (28) scaffolds.
To accurately capture the diverse electronic environments within these structures, a structure-specific mesomeric weighting strategy was implemented, dividing the molecules into three distinct categories based on PM6 and DFT (B3LYP/6-311+G(2d,p)) optimizations:
- Standard amidinium-like delocalization (EuroSAMPL-4 and 35): The minor mesomeric form disrupts the aromatic system. Consequently, the standard 0.85 to 0.15 weighting ratio—initially established for the SM07 structure—was applied.
- Complex three-center delocalization (EuroSAMPL-7): Calculations confirmed the participation of the ring sulfur in charge stabilization alongside the two nitrogen atoms (indicated by a contraction of the S-C bond). However, including the sulfur-protonated form yielded a critically low ensemble size (average kmin = 18). Such a severe drop demonstrates that the network fails to reach a stable prediction for this specific topology, prompting its exclusion to maintain model reliability. To compensate for this unrepresented sulfur contribution while utilizing only the nitrogen-centered forms (which yielded a stable average prediction of 6.8, average kmin = 37), the weighting ratio was empirically adjusted to 0.70 to 0.30. This specific refinement yielded a final ensemble prediction of 4.5, compared to the experimental value of 4.6 (an error of 0.1 pKa units).
- Aromaticity-preserving delocalization (EuroSAMPL-19, 28, and 33): The positive charge is delocalized between two ring nitrogen atoms without any loss of aromaticity in either resonance state. Given the energetic and structural equivalence of these representations, an equal 0.50 to 0.50 weighting ratio was applied.
The application of these chemically grounded parameters across the dataset led to a final ensemble RMSTE(h10) of 0.5 and a MAE of 0.4 pKa units. These performance metrics are summarized in Table 5.
As shown in Table 5, the model matches the performance of QupKake (a hybrid QM/ML method [10]), the top submission of the EuroSAMPL1 challenge. Although the maximum AD remains steady at 1.6 units following the mesomeric weighting protocol, our approach successfully maintains a tighter error distribution than SP1 (ML, top blind submission [43]), Biovia COSMO-RS (QM, 2nd best submission [39]), Marvin (commercial [44]), and ACD/Labs (commercial [45]). These methodologies exhibit noticeably higher Max AD values of 1.7, 2.4, 3.3, and 2.6 pKa units, respectively.
An analysis of the lowest ensemble size (kmin) across the EuroSAMPL1 dataset confirms the reliability of the predictions. For the classical SMILES representations, kmin values remain high, ranging between 48 and 50 valid predictions (out of 50) from the ensembles. When evaluating the mesomeric forms, the ensemble size shows a slight decrease. The absolute minimum (kmin = 37) is observed for a single structure (NC1=[N+]([H:1])C(c2ccc(C)cc2)=CS1), with all other mesomeric representations maintaining a kmin strictly greater than 40. This high ensemble retention demonstrates that the architecture remains robust and its predictions reliable, even when processing complex delocalized states.
Despite this success, only two outliers (EuroSAMPL-15 and 30) remain, exhibiting ADs of up to 1.6 pKa units. These specific predictive challenges were shared by most participants due to the complex interplay of antagonistic electronic effects. It is important to emphasize, however, that this is not a general limitation for phenols, as the phenolic compounds EuroSAMPL-8, 13, 16, and 22 were accurately predicted by all participants. These two remaining cases will be further examined in Section 4.
The predictive performance of the refined HGM ensemble is summarized in the scatter plot shown in Figure 7. Although HGM and SP1 display comparable overall performance, with both approaches achieving an RMSE of 0.5, their accuracy varies across specific pKa ranges. Between pKa 3.0 and 5.0, SP1 demonstrates exceptional precision, slightly edging ahead of HGM in this acidic region. However, above pKa 7.0, SP1 exhibits a systematic overprediction bias, whereas HGM maintains an unbiased, homogeneous distribution around the identity line. This lack of directional bias in the higher pKa range, coupled with a lower maximum AD (1.6 for HGM vs. 1.7 for SP1), highlights the robustness of HGM across diverse chemical families. The two remaining outliers—EuroSAMPL-15, and 30 (whose structures are shown in Figure 7)—represent the only significant departures from this trend.
To independently classify the deviations observed in the EuroSAMPL1 dataset, the ETA protocol was applied by concatenating it to the primary B2334 dataset. The overall evaluation demonstrated perfect structural consistency: the primary B2334 set maintained a RMSEvirtual of 0.25 pKa units, while the appended EuroSAMPL1 set yielded a consistent RMSEvirtual of 0.24 pKa units. As previously established, the raw test predictions had identified five initial outliers. While adjusting for mesomeric weights successfully resolved the errors for euroSAMPL-7, -19, and -33, the discrepancies for euroSAMPL-15 and -30 remained, as they lack relevant mesomeric forms. However, when subjected to the ETA protocol, the VDs for all five compounds were systematically reduced to 0.2, 0.2, 0.4, 0.4, and 0.3 pKa units, respectively. These values fall strictly below the 0.5 alert threshold, but require significant parameter allocations, with mean leverages () ranging from 0.36 to 0.69. Consistent with the findings for the SAMPL6 and Jensen datasets, this confirms that the initial poor predictions were strictly due to data scarcity and extrapolation, rather than a failure of the 2D topological graph.
Note on the SAMPL8 Dataset: although the SAMPL8 challenge [2,46] was considered, an audit of the experimental protocols (notably the high-throughput automated methods and subsequent Yasuda-Shedlovsky extrapolations) revealed significant data inconsistencies [47]. For instance, SAMPL8-1 was initially reported with two pKa values (2.5 and 5.0). Subsequent re-measurements using the Sirius T3 apparatus confirmed a single neutral-to-anion transition at 4.0—which aligns with the HGM prediction of 4.3. Similar revisions occurred for SAMPL8-22 (shifted from 3.4 to 2.6, compared to the HGM prediction of 3.0). Furthermore, for the initially claimed cation-to-neutral transition of SAMPL8-1 at 2.5, HGM evaluates a theoretical value of -2.7 (a prediction error exceeding 5 pKa units). Notably, this massive deviation was consistently observed by other independent challenge participants using fundamentally different 3D approaches (e.g., Diedenhofen et al. [46], who also predicted negative values for this transition), strongly pointing to a flawed initial experimental reference rather than a methodological shortcoming. Due to these unresolved experimental uncertainties, the SAMPL8 dataset (raw RMSE of 1.6) falls outside the strictly validated applicability domain of the present work and is therefore excluded from further detailed analysis.
4. Discussion
4.1. The HGM Framework: Methodological Advancements and Generalization
Conventionally, 2D graph applications in chemoinformatics process structures to extract global molecular properties or root their analysis on heavy-atom scaffolds, as seen in carbon chemical shift models. By contrast, HGM (Section 2.2) designates the explicit ionizable hydrogen as the root node of the graph. Practically, this implies that the property calculation is executed at the output node corresponding to this hydrogen. This architecture forces HGM to evaluate the chemical environment from the perspective of the ionization site itself, rather than relying on an automatically designated heavy heteroatom to anchor the calculation. The macroscopic pKa value is thereby processed as a localized atomic property rather than a diffuse molecular feature.
This site-specific anchoring relies on a constrained neural architecture. With a total of 537 parameters, our model lacks the capacity to memorize the vast diversity of chemical environments, encompassing variations in valence, formal charge, stereochemistry, atom types, and bond connectivity. The architectural complexity was capped using the RMSEvirtual metric (Section 2.4). This metric-driven approach to architecture selection mitigated the risk of overfitting, ensuring that the final ensembles extract generalizable chemical patterns rather than fitting structural noise.
Despite its restriction to 2D topologies, the HGM architecture demonstrates the capacity to handle extensive charge delocalization. Provided a sufficient cluster of related analogs is present in the training set, HGM captures complex resonance stabilizations—such as the mutual reinforcement between the analogous 1H-perimidin-2-amine or CHEMBL2094588—achieving accurate virtual predictions. Subsequent ETA (Section 2.5) evaluations confirmed that uncorrected HGM handles these effects efficiently when a chemical class (e.g., quinazolines) is jointly integrated into the training data. However, to proactively address inherent delocalization challenges for unseen structures, the present work introduces a mesomeric weighting protocol. Adapting prior NMR heuristics, this rule-based correction provides a necessary adjustment to the input graph to improve test set generalization (Section 2.4.2). Nevertheless, predicting unseen scaffolds remains vulnerable to data scarcity, and the topological approach reaches its limits when 3D spatial constraints exceed the representational capacity of 2D graphs. A 2D graph cannot encode rigid 3D geometries, as exemplified by sparteine. Interestingly, HGM captures electrostatic interactions like intramolecular hydrogen bonding provided an isomorphism exists between the 2D graph and the 3D conformation for at least the atoms forming the interaction chain (e.g., euroSAMPL-15), but fails when this topological correlation is broken by conformational freedom (e.g., 2,2'-biphenol). Ultimately, these overriding spatial constraints and the scarcity of close analogs define the boundaries of the 2D representation, setting the stage for the structural outliers discussed in the next section.
4.2. Breaking the 2D/3D Isomorphism: Topological Artifacts and Structural Limits
As shown in Section 3.2 and Section 3.3, retrospective analysis of both estimation and prediction outliers reveals that failures rarely stem from algorithmic shortcomings, but rather from the inability of 2D representations to account for 3D structures. Within the training set, this limitation is particularly problematic when the 2D graph falls within densely populated regions of the data. The cases of azetidine and 1-azabicyclo[2.2.2]octane (quinuclidine) illustrate two distinct manifestations of this topological artifact. For these two training set compounds, HGM yields low leverage values ( = 0.16 and 0.06, respectively), indicating that their 2D topological environments are indeed very common in the training space. Yet, their virtual prediction deviations reach up to 1.2 pKa units. Their 2D representations ignore the 3D structural features that govern the acidity of their protonated forms, as detailed below.
In the case of azetidines, the 2D graph fails to capture the relative stability between the protonated and neutral states: because the algorithm encodes only the starting acidic site, it cannot account for the ring strain and conformational penalties that selectively destabilize the neutral conjugate base upon deprotonation of the input cation. Furthermore, the 2D representation does not account for the non-linear stereoelectronic effects linked to ring expansion. As demonstrated by Ohwada et al. [48], the basicity of cyclic amines is primarily governed by the nitrogen's degree of pyramidalization rather than the internal C-N-C bond angle. While three-membered rings (e.g., rigid aziridines, 10 compounds in the training set, max AD = 0.3) impose a pyramidalization that reduces their electron-donating ability, azetidines undergo a geometric relaxation with a pyramidalization angle close to that of unstrained pyrrolidines and piperidines. The topological input, based on connectivity, simply lacks this 3D structural information.
Conversely, for the protonated quinuclidine core, the limitation arises from stereoelectronic shielding. In 3D, the rigid bicyclic cage ties the alkyl chains back, leaving the ammonium unhindered and stabilized by solvation. Consequently, it retains its proton more than expected, making the ammonium a weak acid with an experimental pKa value of 11.0 [49]. The algorithm, however, merely perceives a substituted tertiary amine cation and erroneously applies the steric and solvation penalties typical of flexible acyclic analogues (e.g., triethylamine, pKa 10.9). Assuming the cation is poorly solvated and thus less stable, HGM calculates an easier deprotonation, resulting in a significantly underestimated pKa (AD ≈ 0.9). Unlike the charge delocalization cases (Section 4.1), providing direct analogues in the training set does not resolve this: for instance, 1-methylazetidine (AD = 0.9, VD = -1.0, = 0.16) and 3-phenyl-1-azabicyclo[2.2.2]octane (AD = 0.7, VD = -0.7, = 0.07), both training set compounds, are similarly misestimated, as the few constrained exceptions are mathematically overpowered by unconstrained analogues sharing similar topologies.
These structural limitations identified in the training set similarly affect predictions on external data. Nefopam, a compound from the Jensen test set, illustrates this issue. The algorithm calculates a low leverage value ( = 0.2) for this structure, indicating a well-represented topology, yet produces a substantial prediction error (predicted pKa 6.3 vs. experimental 8.5). This 2.2-unit deviation was initially so anomalous that an experimental measurement error was suspected. A retrospective deconstruction of the molecule into simpler analogues, evaluated by HGM, did not isolate the source of the discrepancy. A Solvent Accessible Surface analysis subsequently revealed that rigid spatial crowding in the full nefopam molecule restricts solvent access to the ammonium. Similar to quinuclidine, the 2D graph lacks the 3D information required to encode this steric hindrance to solvation.
In contrast to silent prediction failures like nefopam, specific spatial configurations are occasionally captured by the extended 2D representation, triggering statistical warnings. The tetracyclic alkaloid sparteine illustrates this scenario within the Jensen test set. HGM yielded an elevated leverage value ( = 1.6), signaling an unusual topological signature, which coincided with a high prediction error (AD = 2.6). The algorithm relies on an extended 2D topology that incorporates stereochemical information. The four defined stereocenters in the sparteine SMILES provide the necessary complexity for HGM to detect this anomaly. However, following metrological curation, the training set retains only 108 instances of asymmetric centers (@) and 60 instances of directional double bonds (/ or ). Consequently, the algorithm lacks sufficient chiral examples to infer the spatial constraints of sparteine.
As illustrated by the optimized geometry in Figure 8, this pKa deviation is driven by the existence of an intramolecular hydrogen bond. The fusion of the six-membered rings, notably involving a boat conformation, forces the ammonium proton into close proximity with the second basic nitrogen. This results in a short interaction distance (dN...H = 185 pm at the B3LYP/6-31G+(d,p) level), characteristic of a strong hydrogen bond. While HGM cannot predict this spatial constraint when sparteine is evaluated as a test compound, integrating it into the training data during the ETA phase (see Section 2.5) allows the algorithm to mathematically account for this feature. This integration reduces the absolute estimation deviation to 0.4 (VD = 0.9), and yields a mean leverage value () of 0.54. Although leverage mechanically decreases upon inclusion in the training set, this value remains above the mean threshold (2p/M = 0.46), indicating that the statistical fit depends on this single data point to correlate the extended 2D stereodescriptors with the pKa shift induced by the 3D cage. Consequently, while the algorithm demonstrates the mathematical capacity to fit this pKa shift upon data integration, this localized parameter adjustment will not generalize to other compounds outside of direct sparteine derivatives. Future dataset curations must therefore include a broader diversity of chiral molecules to mitigate this limitation.
A high leverage value signifies topological rarity (extrapolation risk), not necessarily a prediction failure. When the 2D topology remains isomorphic to the 3D conformation, HGM extrapolates accurately even in sparse topological regions. The antiviral acyclovir exemplifies this robustness: despite a leverage of = 13.5, the algorithm predicts its pKa with an AD of 0.7. The uncertainty of this extrapolation is reflected in the ensemble dispersion metrics rather than in the prediction error. The prediction exhibits a SD of 0.5, and kmin decreases to 23/27/31 (across the three runs, out of the 50 initial models). This confirms that while fewer sub-models contribute to the ensemble, the predictive power is retained as long as the 2D/3D isomorphism is preserved.
Evaluating the pKa based on the 2D topology of the acidic species presents a fundamental limitation. HGM processes only the acidic form of the acid-base pair, omitting the thermodynamic state of the conjugate base. As demonstrated earlier with the conformational penalties of cyclic amines, the inability to encode the full deprotonation process causes prediction deviations. Consequently, when the conjugate base undergoes specific 3D stabilization, the algorithm overpredicts the pKa (underestimating acidity).
This principle explains the deviations for EuroSAMPL-15 and EuroSAMPL-30, two outliers from the EuroSAMPL-1 test set. For EuroSAMPL-15, although the acidic form features an intramolecular hydrogen bond, the experimental pKa is lower than predicted (prediction error = -1.6). If only the stabilization of the acid were involved, the algorithm would underestimate the pKa. Instead, the dominant thermodynamic driving force is the delocalization of the negative charge on the conjugate base. Similarly, for EuroSAMPL-30 (prediction error = -1.3), the acidic form’s single hydrogen bond is offset by several intramolecular hydrogen bonds formed between the phenolate oxygen and the neighboring amide and alcohol protons. This results in a greater overall stabilization of the conjugate base. In both instances, because the topological input is exclusively rooted on the dissociable proton, the algorithm lacks the structural information of the conjugate base required to model these post-deprotonation stabilization effects.
This phenomenon is mirrored in the B2334 training set by 2,2'-biphenol and its derivative [1,1'-biphenyl]-2,2',4,4'-tetraol. For 2,2'-biphenol, HGM yields a large estimation deviation for its first acidity (AD = 1.5). In the neutral form, optimized at the B3LYP/6-31+G(d,p) level, the interacting atoms establish a seven-membered pseudo-ring (dO…H = 183 pm, inter-ring dihedral of 50.3°). Upon deprotonation, the mono-anion adopts a twisted geometry (inter-ring dihedral of 36.3°, C–C–O–H dihedral of -31.4°) driven by a charge-assisted hydrogen bond (CAHB). This structural shift forces the oxygen atoms into close proximity, resulting in a short interaction (dO−H = 109 pm, dO…H = 134 pm) characteristic of a low-barrier hydrogen bond—an asymmetric structure that lower-level semi-empirical methods do not accurately model. Because the algorithm relies on the neutral form to estimate pKa1, it misses the stabilization emerging after proton loss. The tetraol analogue corroborates this behavior, exhibiting a similar estimation deviation for its first acidity (estimated pKa1 8.1 vs. experimental 7.4). Conversely, when estimating the second acidity (experimental pKa2 = 11.8 for 2,2’-biphenol, 10.1 for the tetraol), the input graph corresponds to the mono-anion itself. This 2D topology explicitly features a phenolate with a hydroxyl group in the gamma position, yielding accurate results: a prediction of 12.1 for 2,2’-biphenol (whose mono-anion is absent from the training set) and a virtual estimation of 10.2 for the tetraol (whose mono-anion is included).
While evaluating exclusively the acidic form represents a structural limitation, it does not preclude accurate estimation by HGM. For compounds like EuroSAMPL-15 and EuroSAMPL-30, once included in the training set during the ETA phase, the algorithm correlates their 2D topological features with their experimental pKa values. This inclusion reduces their VDs to -0.2 and -0.4 pKa units, respectively. This demonstrates that if sufficient analogous examples are present in the training space, the algorithm implicitly learns the corresponding pKa, effectively mapping the topology of the acid directly to the experimental value without encoding the conjugate base.
4.3. Defining the Applicability Domain and Future Algorithmic Perspectives
Reliable deployment of HGM requires defining a strict applicability domain, governed by two hyperparameters extracted during the inference phase: the mean leverage () and the ensemble agreement (kmin). The mean leverage quantifies the topological familiarity of the graph relative to the training space. While the mean threshold (2p/M = 0.46) serves as a statistical baseline for the training set, leverage during prediction must be interpreted as a measure of extrapolation risk rather than a definitive predictor of error. For instance, a topologically distant molecule like EuroSAMPL-29 ( = 1.8) yields an accurate prediction (prediction error of 0.1 pKa units).
While these two metrics are mathematically linked—a low kmin inherently inflates the mean leverage —they provide complementary insights. The leverage indicates the overall extrapolation magnitude, whereas kmin measures the prediction stability across the 50 selected sub-models, remaining robust against isolated statistical outliers. The antiviral acyclovir (Section 4.2) exemplifies this extrapolation: its large mean leverage ( = 13.5) is accompanied by a drop in ensemble agreement (kmin of 23/27/31), reflecting high algorithmic dispersion in sparse topological regions, even though the final prediction remains fairly accurate (AD = 0.7).
Conversely, EuroSAMPL-30 presents a standard topology ( = 0.69) yet produces a large deviation (-1.3 pKa units). This disconnection is illustrated by even simpler ortho-substituted systems, such as 2-nitro-1-naphthylamine (a member of the training set), which yields a large VD of 1.2 while presenting a well-represented topology ( = 0.26). For EuroSAMPL-30, despite the large prediction error, the ensemble agreement remains high (kmin of 49/49/50 across the three independent runs). This high agreement guarantees that the output is robust and independent of the random initialization of the weights. The ensemble consistently processes the 2D topology, confirming that the prediction error stems from hidden 3D effects (i.e., conjugate base stabilization) rather than algorithmic instability.
Together, these metrics establish HGM as a metrological consistency filter. When a prediction exhibits high agreement (kmin ≈ 50) yet yields a large deviation from the experimental pKa, it indicates a data or physical anomaly. As demonstrated throughout the curation process, such statistical flags expose underlying database errors—such as erroneous tautomers, incorrect experimental assignments, or unencoded 3D structural features—functioning as an automated diagnostic tool to curate chemical databases.
When addressing chemical complexities such as charge delocalization, ad-hoc topological patches—such as mesomeric weightings—were initially implemented to assist the algorithm. However, analysis of the EuroSAMPL1 dataset reveals that such manual interventions become obsolete when the relevant chemical space is adequately represented in the training data. A subset of nitrogen-containing heterocycles (EuroSAMPL-4, -7, -19, -28, and -33) initially emerge as outliers in the EuroSAMPL1 test set, exhibiting prediction errors ranging from 0.9 to 1.7 pKa units. Yet, when appended to the initial training data during the ETA phase, HGM models their specific delocalization patterns natively. The ADs drop to 0.1 or below, with leverages remaining above the mean threshold (ranging from 0.47 to 0.67). This indicates that the algorithm adjusts its weights to encode the structural formula via the proper SMILES, rendering the manual weighting patch superfluous. Therefore, hardcoding physical phenomena via handcrafted rules is unnecessary if the training set encompasses sufficient chemical diversity. Nevertheless, because acquiring comprehensive and reliable experimental data for every rare structural configuration remains challenging, these topological patches continue to serve as a pragmatic fallback.
Consequently, the future development of graph-based pKa prediction relies on expanding the parameter space and implementing advanced architectures to circumvent the 2D/3D isomorphism limits identified in Section 4.2. To retain the computational efficiency of 2D graphs while capturing 3D stabilization effects, a viable short-term strategy involves encoding intramolecular hydrogen bonds directly within the SMILES notation. By explicitly tagging the interacting atoms—similar to the topological flagging of the dissociable proton—and introducing specific labels to inject relational biases, the input would provide the necessary topological features for the algorithm to model geometry-induced stabilizations.
Ultimately, predicting an acid-base equilibrium mathematically requires evaluating both species of the acid-base pair. Future algorithmic developments should explore multi-input architectures, such as Siamese GNNs. By simultaneously processing the graph of the acid (rooted on the dissociable proton) and the graph of its conjugate base (rooted on the deprotonated heteroatom, charged or not), the algorithm could explicitly evaluate the relative stability between both states. Furthermore, rooting the input graph on this deprotonated site would natively capture anionic delocalization. Just as mesomeric weighting schemes were applied to protonated species to delocalize positive charges, weighting negatively charged resonance forms (e.g., carboxylates or phenolates) could correct predictions for highly delocalized acids. This dual-state evaluation would not only overcome the representational constraints observed for complex species like 2,2'-biphenol, but also directly address the current limitations of HGM in the acidic domain of the EuroSAMPL1 test set, bridging the performance gap observed in Figure 7 relative to top-performing methods like SP1.
4.4. Real-World Application: Benchmarking on Pharmaceuticals
To demonstrate the robustness and self-diagnostic capabilities of HGM in a pragmatic setting, its predictive performance was evaluated on active pharmaceutical ingredients selected from common therapeutics widely prescribed in general medical practice. Benchmarking such functionalized molecules presents a significant challenge, as acquiring reliable, experimentally validated pKa values measured under standard aqueous conditions is difficult for these fairly large structures. To ensure statistical robustness, all HGM-predicted pKa values discussed in this section represent the average of three independent prediction runs. This evaluation explores acid-base profiles, escalating in structural complexity: from an ultra-weak acid that remains strictly neutral in physiological conditions (prednisolone), to a confirmed zwitterion (amoxicillin), a large dibasic macrolide existing as a dication at physiological pH (azithromycin), and finally to a larger polyprotic macrocycle possessing three acid-base sites (pristinamycin IA). The structures of these evaluated compounds are presented in Figure 9.
For each compound, predictive accuracy is evaluated against experimental pKa values [50,51,52,53]. Furthermore, every prediction is validated through the applicability domain metrics defined in Section 4.3: the ensemble agreement (kmin) and the mean leverage (). This progressive benchmarking illustrates how a site-explicit approach can resolve intramolecular electrostatic penalties and diagnose structural misassignments in commercial databases.
The benchmarking begins with prednisolone, an ultra-weak acidic scaffold that remains strictly neutral under physiological conditions. Among its three hydroxyl groups, HGM identifies the tertiary C17-OH as the most acidic, predicting a pKa of 12.1. The reliability of this prediction is supported by robust applicability domain metrics, with a high ensemble agreement (kmin ≈ 49) and a moderate mean leverage (≈ 2.4). This prediction correctly categorizes the molecule within the non-ionizable domain for physiological purposes. Consequently, it exposes artifactual values (such as the 12.6 value cited by Stan et al. [52]) that are routinely propagated in high-throughput databases with unrealistic precision and without reliable experimental measurements. A comparable case is observed for the related steroid budesonide (reported pKa of 12.0 [54]), where the HGM predictions (13.5–13.9) predictably miss a complex long-range (9-atom) intramolecular hydrogen bond stabilizing the conjugate base.
For prednisolone, the actual pKa of this first dissociation may be slightly lower than the predicted 12.1 (Figure 9) due to specific conformational effects: upon deprotonation, the C17-alkoxide can form a stable 6-membered intramolecular hydrogen bond with the adjacent primary hydroxyl at C21. Furthermore, sequential calculations reveal that once this C17-alkoxide is formed, the electrostatic penalty on the adjacent primary hydroxyl shifts its pKa from an intrinsic 13.3 to an effective 14.8. This confirms that a second deprotonation is forbidden in aqueous media. By accurately mapping this Coulombic repulsion, HGM prevents these ultra-weak sites from introducing computational noise into downstream predictions.
Transitioning from the ultra-weak acidity of prednisolone to multi-ionizable scaffolds, amoxicillin (Figure 9) presents a zwitterionic system with three distinct ionization sites: a carboxylic acid, a primary amine, and a phenolic hydroxyl. Potentiometric measurements at 298.15 K establish the macroscopic pKa values at 2.7, 7.5, and 10.0, respectively. Guided through the exact deprotonation pathway via the site-explicit approach, HGM predicts the carboxylic acid pKa (2.6) starting from the ammonium form, the amine pKa (7.3) from the zwitterion, and the phenol pKa (9.9) from the carboxylate. These results yield a maximum deviation of 0.2 log units. The reliability of these predictions is supported by the applicability domain metrics: all three sites achieved high ensemble agreement (kmin = 50) and low mean leverages ( ranging from 0.2 to 0.8).
Further escalating the structural complexity, azithromycin represents a large dibasic macrolide (azalide) containing two aliphatic tertiary amines: one located on the desosamine sugar and the other embedded within the 15-membered macrolactone ring. High-precision potentiometric measurements assign macroscopic pKa values of 8.7 and 9.5 to these sites, respectively [REF Sebastiano]. The concomitant measurement of related macrolides by the same authors—namely erythromycin (experimental pKa 8.9, closely predicted by HGM at 8.4) and telithromycin (experimental pKa values 4.9 and 8.7, with the corresponding dimethylammonium pKa predicted by HGM at 8.3)—allows for the unambiguous assignment of the 8.7 constant to the desosamine dimethylammonium group. HGM identifies both basic centers and correctly determines their relative basicity. Starting from the dicationic state, the algorithm predicts the dissociation of the sugar ammonium at 8.3, followed by the endocyclic ammonium at 8.7. While a deviation is observed for the second dissociation—likely stemming from the extensive intramolecular hydrogen bond network characterizing such large scaffolds—the algorithm successfully maps the correct basicity hierarchy across this complex architecture. As with amoxicillin, the reliability of these predictions is corroborated by the applicability domain metrics. Both ionization steps exhibit high ensemble agreement (kmin ≥ 49) and low mean leverages ( ranging from 0.5 to 1.7). These robust metrics, alongside minimal prediction deviations across the three independent runs, underscore the stability of HGM even when processing such heavily functionalized macrocycles.
The final phase of the benchmarking explores pristinamycin IA, a peptidic macrolactone belonging to the streptogramin family (Figure 9). This macrocycle presents three ionizable sites: a p-dimethylaminophenylalanine tertiary amine (experimental pKa 4.5), and an amphoteric 3-hydroxypicolinoyl residue encompassing a pyridinium (experimental pKa 2.6) and a phenolic hydroxyl (experimental pKa 7.2). Historical literature extrapolations [51], based on solvent mixtures, report an unusually acidic macro-constant of 1.0, formally attributed to the phenol (red OH) to justify a 98% zwitterionic predominance in solution (i.e., with the amphoteric residue existing simultaneously as a positively charged pyridinium and a negatively charged phenolate). To evaluate this hypothesis, mapping the complete acid-base profile requires exact site-specific cross-speciation. By explicitly defining the protonation status of remote sites, HGM can independently test both the zwitterionic and the neutral pathways to determine the correct sequence of micro-states.
When evaluating the zwitterionic pathway, the algorithm computes the phenol dissociation first. Starting from the fully protonated species (noted H3P2+), computing this initial deprotonation requires maintaining both the pyridinium and the remote disubstituted aniline in their protonated states. HGM predicts a pKa1 of 6.3 for the phenol deprotonation (H3P2+ → H2P+) and a pKa2 of 6.7 for the subsequent pyridinium deprotonation (HP → P–). This narrow 0.4 pKa margin demonstrates that the zwitterion is a transient minor species. Furthermore, along this charged pathway, the mean leverage spikes to 6.7. This large leverage value serves as an internal alert, indicating that specific speciation state falls outside the HGM's applicability domain, thereby directly refuting the historical zwitterionic assumption.
Conversely, along the neutral pathway, computing the initial pyridinium dissociation (pKa1) requires the algorithm to maintain the remote disubstituted aniline in its protonated state and the phenol as a neutral hydroxyl. Under these conditions, HGM predicts a pKa1 of 2.9 (+0.3). Next, evaluating the remote disubstituted aniline (pKa2) requires the pyridine to be deprotonated while the phenol remains uncharged, yielding a prediction of 5.0 (+0.5). Finally, the computation for the phenol dissociation (pKa3) logically demands both the remote aniline and the pyridine to be in their uncharged states, resulting in a prediction of 8.3 (1.1 log unit deviation).
Along this path, the predictions demonstrate high reliability (kmin ≈ 47−50, < 3.5), closely reproducing the experimental pKa profile (experimental pKa 2.6 for the pyridinium and 7.2 for the phenol, as deduced by Largeron et al. [51]). This neutral speciation is firmly rooted in the HGM training space, which includes 3-hydroxypicolinaldehyde, a structural analog closely related to the model compound 1 used by Largeron et al. [51] to study these micro-equilibria. For this analog, the experimental pKa values of the neutral pathway are 3.4 for the pyridinium and 7.0 for the phenol (measured at 293 K) [55]. Importantly, the 1.1 log unit deviation observed for the phenol illustrates the boundaries of 2D-graph representations: the algorithm effectively captures the inductive effects and topological patterns, but likely cannot exactly quantify the effect of a CAHB existing within the conjugate base.
However, DFT optimizations at the B3LYP/6-31+G(d,p) level on a zwitterionic model fragment of the 3-hydroxypicolinoyl residue confirm that while the phenolate oxygen forms a CAHB with the amide N-H (186.1 pm), and the carbonyl oxygen forms a weaker interaction with the pyridinium N-H (206.4 pm), these remain standard hydrogen bonds. They are distinct from the ultra-short low-barrier hydrogen bonds (~134 pm, as observed in strongly interacting systems like 2,2'-biphenol, Section 4.2) required to trigger an extreme pKa drop to 1.0. These geometric parameters confirm that the stabilization is insufficient to cause such a pKa shift, supporting the HGM rejection of the historical zwitterionic macro-constant.
To summarize this benchmarking phase, Table 6 compiles the experimental and HGM-predicted pKa values for the four evaluated compounds (prednisolone, amoxicillin, azithromycin, and pristinamycin IA). For comparative purposes, the table includes predictions from ACD/Labs, retrieved via our CAS subscription.
As shown in the summarized data, the HGM framework successfully maps the complete protonation landscape of these complex molecules. The topological approach yields micro-pKa values that closely track the available experimental macroscopic measurements. For instance, predictions for amoxicillin deviate by only 0.1 and 0.2 log units from the experimental values for the carboxylic acid and ammonium sites, respectively. Similarly, for the dibasic macrolide azithromycin, the algorithm accurately discriminates between the two tertiary amines, correctly establishing their relative basicity despite the close proximity of their measured pKa values. For pristinamycin IA, by assigning a discrete value to every explicit hydrogen, the framework successfully predicts all three pKa constants required for full speciation profiling. Moreover, this site-specific resolution enabled HGM to unpack the assertions from the Largeron paper [51], effectively separating valid physical phenomena from artifactual claims.
In contrast, ACD predictions retrieved via CAS exhibit attribution ambiguities. Because these interfaces output isolated values categorized merely as "most acidic" or "most basic," they mask secondary ionizations and force speculative manual site attribution. For amoxicillin, determining whether the "most acidic" value of 2.4 corresponds to the carboxylic acid or the phenol—and fundamentally identifying which functional groups act as acids or bases—relies entirely on the user's chemical knowledge. For azithromycin, the interface reports a single basic value of 8.6; without site-explicit mapping, a user cannot deduce whether this constant belongs to the desosamine sugar or the macrocycle. Similarly, for pristinamycin IA, the single basic output of 3.5 creates an attribution dilemma between the anilinium and the pyridinium sites. We were only able to assign this value to the anilinium retrospectively, guided by the basicity hierarchy established by HGM. This indeterminacy highlights the fundamental limitation of such black-box reporting and reinforces the necessity of the HGM site-explicit audit.
Excluding the ultra-weak acidic site of prednisolone, the overall predictive performance for the eight remaining ionizable sites across these heavily functionalized scaffolds yields an MAE of 0.4 and an RMSE of 0.5 log units. This quantitative accuracy further highlights the robustness of the model when processing complex polyprotic therapeutics.
5. Conclusions
In this work, we have demonstrated that the accuracy of pKa prediction depends on the metrological quality of the training data and the precision of the network at the site-specific level, rather than on architectural complexity alone. By moving away from global 2D-graph representations and focusing on the hydrogen root node [H:1], we have developed an HGM architecture that delivers accurate, site-specific predictions without the computational cost of first-principles calculations.
Benchmarking across the SAMPL6, Jensen and EuroSAMPL1 datasets yields RMSE values of 0.7, 0.6, and 0.5 pKa units, respectively. These metrics compare favorably with industry-standard fragment methods (0.8) and thermodynamic cycles (0.9–1.4), matching the accuracy of state-of-the-art QM models. The performance on complex scaffolds—ranging from resonance-stabilized aminopyrimidines to polyfunctional benzimidazoles—underscores the robustness of HGM, a deep learning core trained on a curated dataset.
Furthermore, the retrospective analysis of active pharmaceutical ingredients highlights the HGM utility beyond raw numerical accuracy. By natively extracting applicability domain metrics—specifically the ensemble agreement (kmin) and the mean leverage ()—the framework acts as an automated metrological filter. These internal statistical flags successfully diagnose physical anomalies (such as 3D conjugate base stabilization), expose artifactual constants propagated in the literature, and prevent unsafe extrapolation in uncharted topological space. Coupled with its site-explicit sequential approach, the model maps complete and transparent speciation pathways that are frequently truncated by standard commercial chemical databases.
While we identify a physical limit in 2D topological models regarding long-range intramolecular interactions (such as the ortho-effect) and 3D CAHBs, HGM remains reliable despite its operational simplicity. A primary advantage of this approach is that it relies on the SMILES string of the structure of interest, requiring no additional molecular descriptors or experimental data beyond the initial training set. By providing the scientific community with a Docker prototype that ensures the reproducibility of the results, we offer a predictive tool for medicinal chemists. This resource does not replace expert intuition but supports the rapid and precise audit of the protonation landscape in drug-like chemical space, facilitating the rational design of new therapeutic agents.
Supplementary Materials
The following supporting information can be downloaded at the website of this paper posted on Preprints.org. Figure S1: Analysis of pKₐ sites for the EuroSAMPL1 test set (Figure S1.pdf). The datasets used in the present work for the training and validation of the graph-machine models, the complete details of the metrological curation, and the external test sets are available online as two Excel files under the names B2302.xlsx and B2334.xlsx. The file B2302.xlsx contains: Table S1: Compound names, SMILES codes, and experimental pKₐ for the total set of 2302 SMILES; Table S2: Compound names, SMILES codes, experimental pKₐ, HGM estimations, and HGM virtual estimations for the training set of 2102 SMILES; Table S3: Compound names, SMILES codes, experimental pKₐ, and HGM estimations for the validation set of 200 SMILES; Table S4: Compound names, SMILES codes, corrected pKₐ values according to the literature, and initial experimental pKₐ values reported by Hunt et al. for the 21 SMILES (representing 19 compounds); Table S5: Compound names, SMILES codes, experimental pKₐ values, and reasons for compound exclusion for the 146 removed SMILES (representing 99 compounds); Table S6: Compound names, corrected SMILES codes, and initial SMILES codes for the 19 corrected SMILES (representing 19 compounds); Table S7: Compound names, SMILES codes, and experimental pKₐ values for the 13 newly introduced or structurally reassigned SMILES (representing nine compounds). The file B2334.xlsx contains: Table S8: Compound names, SMILES codes, experimental pKₐ values, HGM estimations, HGM virtual estimations, IUPAC names, and molecular formulas for the training set of 2334 SMILES; Table S9: Compound names, SMILES codes, experimental pKₐ values, IUPAC names, and molecular formulas for the 132 added SMILES (representing 99 compounds); Table S10: Compound names, SMILES codes, experimental pKₐ values, IUPAC names, and molecular formulas for the 100 removed SMILES (representing 90 compounds); Table S11: Compound names, corrected SMILES codes, initial SMILES codes from the original B2302 dataset, experimental pKₐ values, IUPAC names, and molecular formulas for the 75 SMILES (representing 74 compounds); Table S12: Compound names, SMILES codes, corrected experimental pKₐ values, initial experimental pKₐ values from the original B2302 dataset, IUPAC names, and molecular formulas for the 95 corrected pKₐ (representing 93 compounds); Table S13: Compound names, simplified SMILES codes, initial SMILES codes from the original B2302 dataset, experimental pKₐ values, IUPAC names, and molecular formulas for the 449 simplified SMILES (representing 428 compounds); Table S14: Compound names, kekulized SMILES codes, initial SMILES codes from the original B2302 dataset, experimental pKₐ values, IUPAC names, and molecular formulas for the 154 kekulized SMILES (representing 145 compounds); Table S15: Compound names, SMILES codes, experimental pKₐ values, and HGM predictions (comparing expert mesomeric weighting versus blind para selection) for the SAMPL6 test set of 31 SMILES (representing 24 compounds); Table S16: Compound names, SMILES codes, experimental pKₐ values, HGM predictions, HGM 2D Domain predictions, molecular formulas, and the original incorrect SMILES assignments from Hunt et al. [18] for the 53 SMILES of the Jensen test set (representing 48 compounds); Table S17: Compound names, SMILES codes, experimental pKₐ values, HGM raw predictions, and HGM refined predictions for the EuroSAMPL1 test set of 35 SMILES (representing 35 compounds).
Author Contributions
Conceptualization, F.D. and J.-L.P.; methodology, F.D., J.-L.P., and G.D.; software, F.D. and J.-L.P.; formal analysis, F.D.; investigation, F.D.; resources, F.D.; data curation, F.D.; writing—original draft preparation, F.D.; writing—review and editing, F.D. and G.D.; visualization, F.D.; supervision, F.D.; project administration, F.D. All authors have read and agreed to the published version of the manuscript.
Funding
This research received no external funding.
Institutional Review Board Statement
Not applicable.
Informed Consent Statement
Not applicable.
Data Availability Statement
The HGM prediction prototype is provided as a Docker container image to ensure reproducibility. It can be pulled directly from Docker Hub using the command docker pull espcigm/metagen-demo-pka:latest. Please note that this specific image was built for ARM64 architecture (e.g., Apple Silicon). Users operating on standard x86_64/AMD64 architectures will need to utilize Docker's built-in emulation capabilities or rebuild the container locally using the provided source files.
Acknowledgments
We are grateful to B. Quenet for providing access to her computers, in particular the Apple silicon computers (Mac Studio, Apple M1 and M2 Ultra processors).
Conflicts of Interest
The authors declare no conflicts of interest.
Abbreviations
The following abbreviations are used in this manuscript:
| AD | absolute deviation |
| CAHB | charge-assisted hydrogen bond |
| CAS | Chemical Abstracts |
| DAG | directed acyclic graph |
| DFT | density functional theory |
| ETA | extended training analysis |
| GNN | graph neural network |
| HGM | hydrogen-centered graph machines |
| LOO | leave-one-out |
| MAE | mean absolute error |
| ML | machine learning |
| MLP | multi-layer perceptron |
| NMR | nuclear magnetic resonance |
| QM | quantum mechanical |
| RMSE | root mean square error |
| RMSTE | root mean square test error |
| RMSVE | root mean square validation error |
| SD | standard deviation |
| VD | virtual deviation |
| VLOO | virtual leave-one-out |
References
- Baikété, J.; Malloum, A.; Conradie, J. pKa prediction for small molecules: an overview of experimental, quantum, and machine learning-based approaches. J. Comput.-Aided Mol. Des. 2025, 40, 5. [Google Scholar] [CrossRef] [PubMed]
- Amezcua, M.; Setiadi, J.; Ge, Y.; Mobley, D.L. An overview of the SAMPL8 host-guest binding challenge. J. Comput.-Aided Mol. Des. 2022, 36, 707–734. [Google Scholar] [CrossRef] [PubMed]
- Işık, M.; Rustenburg, A.S.; Rizzi, A.; Gunner, M.R.; Mobley, D.L.; Chodera, J.D. Overview of the SAMPL6 pKa challenge: evaluating small molecule microscopic and macroscopic pKa predictions. J. Comput.-Aided Mol. Des. 2021, 35, 131–166. [Google Scholar] [CrossRef] [PubMed]
- Baltruschat, M.; Czodrowski, P. Machine learning meets pKa. F1000Research 2020, 9. [Google Scholar] [CrossRef] [PubMed]
- Gaulton, A.; Bellis, L.J.; Bento, A.P.; Chambers, J.; Davies, M.; Hersey, A.; Light, Y.; McGlinchey, S.; Michalovich, D.; Al-Lazikani, B.; et al. ChEMBL: a large-scale bioactivity database for drug discovery. Nucleic Acids Res. 2012, 40, D1100–1107. [Google Scholar] [CrossRef] [PubMed]
- Mayr, F.; Wieder, M.; Wieder, O.; Langer, T. Improving Small Molecule pKa Prediction Using Transfer Learning With Graph Neural Networks. Front. Chem. 2022, 10, 866585. [Google Scholar] [CrossRef] [PubMed]
- Xiong, J.; Li, Z.; Wang, G.; Fu, Z.; Zhong, F.; Xu, T.; Liu, X.; Huang, Z.; Liu, X.; Chen, K.; et al. Multi-instance learning of graph neural networks for aqueous pKa prediction. Bioinformatics 2022, 38, 792–798. [Google Scholar] [CrossRef] [PubMed]
- Pan, X.; Wang, H.; Li, C.; Zhang, J.Z.H.; Ji, C. MolGpka: A Web Server for Small Molecule pKa Prediction Using a Graph-Convolutional Neural Network. J. Chem. Inf. Model. 2021, 61, 3159–3165. [Google Scholar] [CrossRef] [PubMed]
- Liu, S.; Yang, Q.; Zhang, L.; Luo, S. Highly Precise Prediction of Micro- and Supra-pKa Based on 3D Descriptors Integrating Non-Covalent Interactions. Angew. Chem. Int. Ed. Engl. 2025, 64, e202424069. [Google Scholar] [CrossRef] [PubMed]
- Abarbanel, O.D.; Hutchison, G.R. QupKake: Integrating Machine Learning and Quantum Chemistry for Micro-pKa Predictions. J. Chem. Theory Comput. 2024, 20, 6946–6956. [Google Scholar] [CrossRef] [PubMed]
- Luo, W.; Zhou, G.; Zhu, Z.; Ke, G.; Wei, Z.; Gao, Z.; Zheng, H. Uni-pKa: an accurate and physically consistent pKa prediction through protonation ensemble modeling. ChemRxiv 2023, 1–27. [Google Scholar] [CrossRef]
- Luo, W.; Zhou, G.; Zhu, Z.; Yuan, Y.; Ke, G.; Wei, Z.; Gao, Z.; Zheng, H. Bridging Machine Learning and Thermodynamics for Accurate pKa Prediction. JACS Au 2024, 4, 3451–3465. [Google Scholar] [CrossRef] [PubMed]
- Duprat, F.; Ploix, J.-L.; Dreyfus, G. Can Graph Machines Accurately Estimate 13C NMR Chemical Shifts of Benzenic Compounds. Molecules 2024, 29, 3137. [Google Scholar] [CrossRef] [PubMed]
- Perrin, D.D.; Dempsey, B.; Serjeant, E.P. pKa Prediction for Organic Acids and Bases; Chapman and Hall, 1981. [Google Scholar]
- Jensen, J.H.; Swain, C.J.; Olsen, L. Prediction of pKa Values for Druglike Molecules Using Semiempirical Quantum Chemical Methods. J. Phys. Chem. A 2017, 121, 699–707. [Google Scholar] [CrossRef] [PubMed]
- Tielker, N.; Lim, M.; Kibies, P.; Gretz, J.; Hein-Janke, B.; Chodun, C.; Mata, R.A.; Czodrowski, P.; Kast, S.M. The euroSAMPL1 pKa blind prediction and reproducible research data management challenge. Phys. Chem. Chem. Phys. 2025, 27, 18855–18869. [Google Scholar] [CrossRef] [PubMed]
- Docker version 4.46.0. Available online: (accessed on. (accessed on 2026).
- Hunt, P.; Hosseini-Gerami, L.; Chrien, T.; Plante, J.; Ponting, D.J.; Segall, M. Predicting pKa Using a Combination of Semi-Empirical Quantum Mechanics and Radial Basis Function Methods. J. Chem. Inf. Model. 2020, 60, 2989–2997. [Google Scholar] [CrossRef] [PubMed]
- Perrin, D.D. Dissociation Constants of Organic Bases in Aqueous Solution; (Pure and Applied Chemistry); Butterworths, 1965. [Google Scholar]
- Perrin, D.D.; IUPAC. Dissociation constants of Organic Bases in Aqueous Solution: Supplement 1972; Crane: Russak, 1972. [Google Scholar]
- Kortuem, G.; Vogel, W.; Andrussow, K. Dissociation Constants of Organic Acids in Aqueous Solution; Butterworths & Co., 1961. [Google Scholar]
- Mansouri, K.; Cariello, N.F.; Korotcov, A.; Tkachenko, V.; Grulke, C.M.; Sprankle, C.S.; Allen, D.; Casey, W.M.; Kleinstreuer, N.C.; Williams, A.J. Open-source QSAR models for pKa prediction using multiple machine learning approaches. J. Cheminform. 2019, 11, 60. [Google Scholar] [CrossRef] [PubMed]
- Dioury, F.; Duprat, A.; Dreyfus, G.; Ferroud, C.; Cossy, J. QSPR Prediction of the Stability Constants of Gadolinium(III) Complexes for Magnetic Resonance Imaging. J. Chem. Inf. Model. 2014, 54, 2718–2731. [Google Scholar] [CrossRef] [PubMed]
- Goulon, A.; Picot, T.; Duprat, A.; Dreyfus, G. Predicting activities without computing descriptors: graph machines for QSAR. SAR QSAR Environ. Res. 2007, 18, 141–153. [Google Scholar] [CrossRef] [PubMed]
- Zheng, J.W.; Lafontant-Joseph, O.; Green, W.H. Digitized Dataset of Aqueous Dissociation Constants. ChemRxiv 2026, 1–47. [Google Scholar] [CrossRef]
- Dreyfus, G. Neural Networks: Methodology and Applications; Springer: Berlin; New York, 2005; p. 497. [Google Scholar]
- Monari, G.; Dreyfus, G. Withdrawing an example from the training set: An analytic estimation of its effect on a non-linear parameterised model. Neurocomputing 2000, 35, 195–201. [Google Scholar] [CrossRef]
- Monari, G.; Dreyfus, G. Local Overfitting Control via Leverages. Neural Comput. 2002, 14, 1481–1506. [Google Scholar] [CrossRef] [PubMed]
- Zheng, J.W.; Lafontant-Joseph, O. IUPAC Digitized pKa Dataset, v2.2. Available online: https://zenodo.org/records/7236453 (accessed on 19 March 2026).
- Perrault, G. Influence of inductive and steric effects on the basicity of tertiary amines. Determination and interpretation of ΔH and ΔS. Can. J. Chem. 1968, 46, 2021. [Google Scholar]
- Ahlbrecht, H.; Duber, E.O.; Epsztajn, J.; Marcinkowski, R.M.K. Cycloparaffins fused with aromatic rings - ring size effects. XXXIII. Delocalization, conformation and basicity of anilines. Tetrahedron 1984, 40, 1157. [Google Scholar] [CrossRef]
- Leonard, N.J.; Oki, M. Cyclic aminoacyloins. II. F-Strain in limitation of transannular interaction between nitrogen and carbonyl carbon. J. Am. Chem. Soc. 1954, 76, 3463. [Google Scholar] [CrossRef]
- Leupold, I.; Musso, H. Hydrogen bonds. XI. Influence of substituents on the acidity of 2,2'-dihydroxybiphenyls. Justus Liebigs Ann. Chem. 1971, 746, 134. [Google Scholar]
- Frisch, M.J.; Trucks, G.W.; Schlegel, H.B.; Scuseria, G.E.; Robb, M.A.; Cheeseman, J.R.; Scalmani, G.; Barone, V.; Mennucci, B.; Petersson, G.A.; et al. Gaussian 09, Revision A.02; Gaussian, Inc.: Wallingford, CT, 2009. [Google Scholar]
- Dennington, R.; Keith, T.; Millam, J. Gaussview, 5.0.9; Semichem Inc.: Shawnee Mission, KS, 2009. [Google Scholar]
- Isik, M.; Levorse, D.; Rustenburg, A.S.; Ndukwe, I.E.; Wang, H.; Wang, X.; Reibarkh, M.; Martin, G.E.; Makarov, A.A.; Mobley, D.L.; et al. pKa measurements for the SAMPL6 prediction challenge for a set of kinase inhibitor-like fragments. J. Comput.-Aided Mol. Des. 2018, 32, 1117–1138. [Google Scholar] [CrossRef] [PubMed]
- Pracht, P.; Wilcken, R.; Udvarhelyi, A.; Rodde, S.; Grimme, S. High accuracy quantum-chemistry-based calculation and blind prediction of macroscopic pKa values in the context of the SAMPL6 challenge. J. Comput.-Aided Mol. Des. 2018, 32, 1139–1149. [Google Scholar] [CrossRef] [PubMed]
- SciFinder; Chemical Abstracts Service: Columbus, O. Available online: https://scifinder-n.cas.org/ (accessed on 19 March 2026).
- Biovia COSMO/RS; Dassault Systèmes SE, BIOVIA: San Diego, CA, 2026.
- Eckert, F.; Klamt, A. Accurate prediction of basicity in aqueous solution with COSMO-RS. J. Comput. Chem. 2006, 27, 11–19. [Google Scholar] [CrossRef] [PubMed]
- Tu, Y.H.; Wang, D.P.; Allen, L.V., Jr. Nefopam hydrochloride degradation kinetics in solution. J. Pharm. Sci. 1990, 79, 48–52. [Google Scholar] [CrossRef] [PubMed]
- Green, R.W.; Tong, H.K. The Constitution of the Pyridine Monocarboxylic Acids in their Isoelectric Forms. J. Am. Chem. Soc. 1956, 78, 4896–4900. [Google Scholar] [CrossRef]
- ADMET Predictor’s PCB Module S+pKa; Simulations Plus, Inc.: Research Triangle Park, NC, 2026.
- Marvin, 2120. ChemAxon; Budapest, Hungary, 2021. [Google Scholar]
- ACD/pKa, Advanced Chemistry Development (ACD/Labs) Software. Toronto, ON, Canada, 2026.
- Diedenhofen, M.; Eckert, F.; Terzi, S. COSMO-RS blind prediction of distribution coefficients and aqueous pKa values from the SAMPL8 challenge. J. Comput.-Aided Mol. Des. 2023, 37, 395–405. [Google Scholar] [CrossRef] [PubMed]
- Bahr, M.N.; Nandkeolyar, A.; Kenna, J.K.; Nevins, N.; Da Via, L.; Isik, M.; Chodera, J.D.; Mobley, D.L. Automated high throughput pKa and distribution coefficient measurements of pharmaceutical compounds for the SAMPL8 blind prediction challenge. J. Comput.-Aided Mol. Des. 2021, 35, 1141–1155. [Google Scholar] [CrossRef] [PubMed]
- Ohwada, T.; Hirao, H.; Ogawa, A. Theoretical Analysis of Lewis Basicity Based on Local Electron-Donating Ability. Origin of Basic Strength of Cyclic Amines. J. Org. Chem. 2004, 69, 7486–7494. [Google Scholar] [CrossRef] [PubMed]
- Aue, D.H.; Webb, H.M.; Bowers, M.T. A thermodynamic analysis of solvation effects on the basicities of alkylamines. An electrostatic analysis of substituent effects. J. Am. Chem. Soc. 1976, 98, 318–329. [Google Scholar] [CrossRef]
- Felix, I.M.B.; Moreira, L.C.; Chiavone-Filho, O.; Mattedi, S. Solubility measurements of amoxicillin in mixtures of water and ethanol from 283.15 to 298.15 K. Fluid Phase Equilib. 2016, 422, 78–86. [Google Scholar] [CrossRef]
- Largeron, M.; Fleury, M.B. Acid-Base Properties of Pristinamycin IA and Related Compounds. J. Pharm. Sci. 1992, 81, 565–568. [Google Scholar] [CrossRef] [PubMed]
- Stan, G.-S.; Badea, I.A.; Aboul-Enein, H.Y. HPLC Method for Quantification of Five Compounds in a Parenteral Form Used in Treatment of Companion Animals. J. Chromatogr. Sci. 2016, 54, 1567–1572. [Google Scholar] [CrossRef] [PubMed]
- Rossi Sebastiano, M.; Doak, B.C.; Backlund, M.; Poongavanam, V.; Over, B.r.; Ermondi, G.; Caron, G.; Matsson, P.r.; Kihlberg, J. Impact of Dynamically Exposed Polarity on Permeability and Solubility of Chameleonic Drugs Beyond the Rule of 5. J. Med. Chem. 2018, 61, 4189–4202. [Google Scholar] [CrossRef] [PubMed]
- Corey, E.J.; Fossel, E.T. Transdermal formulations of fluticasone. WO2014152280, 2014. [Google Scholar]
- Nakamoto, K.; Martell, A.E. Pyridoxine and Pyridoxal Analogs. IV. Ultraviolet Spectra and Solution Equilibria of 3-Methoxypyridine-2(and 4-)-aldehydes and of 3-Hydroxypyridine-2 (and 4-)-aldehydes1,2. J. Am. Chem. Soc. 1959, 81, 5863–5869. [Google Scholar] [CrossRef]
Figure 1.
Workflow of the hydrogen-centered graph machines framework for the pKa prediction of the (1R,2R)-1-ethyl-2-methylpiperidin-1-ium cation. ⓐ SMILES code—explicitly tagged with [H:1] to designate the ionization site—and 2D-structure of the cation. ⓑ Directed acyclic graph derived from the SMILES input, with the target hydrogen root highlighted in pink. ⓒ Graph machine architecture: orange triangles represent parameterized non-linear node functions. Local labels (e.g., atom type, connectivity) are displayed in dashed boxes, indicating their role as dictionary keys that instantiate specific bias vectors rather than numerical data streams. Solid lines accompanied by the letter n represent the transmission of the n-dimensional data between nodes. To accommodate variable node connectivity while maintaining a fixed input dimension for the node functions, absent child connections are padded with zero vectors. For simplicity, this padding principle is exclusively illustrated by the single [0] box on the node function corresponding to the DAG C,3 node. Finally, the terminal node function (top orange triangle) processes the incoming data stream to directly compute the macroscopic pKa value.
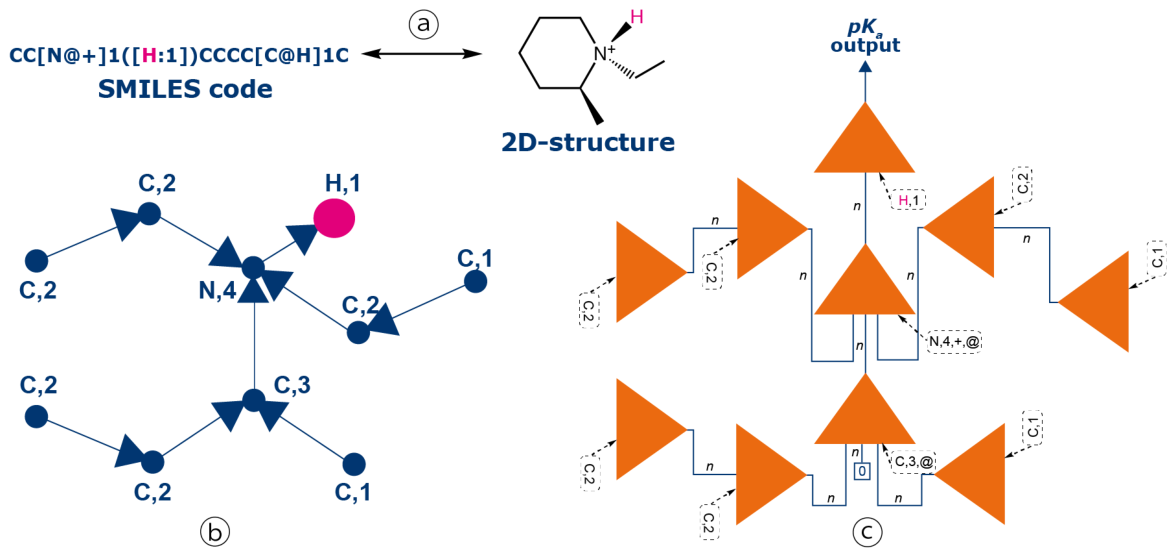
Figure 2.
Structures of the four major outliers from the B200 validation set. The compounds are depicted in their relevant protonation state for their evaluated pKa (neutral forms for acidic red sites, and monoprotonated conjugate acids for basic blue sites).
Figure 2.
Structures of the four major outliers from the B200 validation set. The compounds are depicted in their relevant protonation state for their evaluated pKa (neutral forms for acidic red sites, and monoprotonated conjugate acids for basic blue sites).
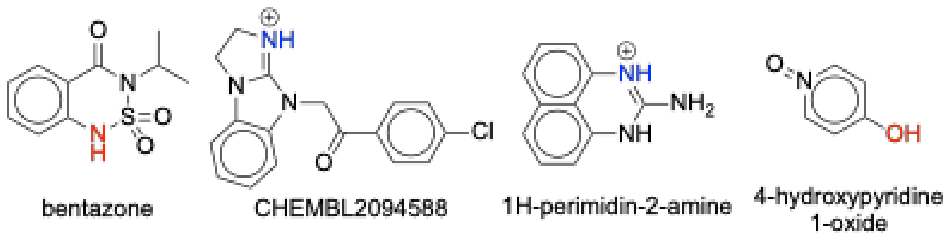
Figure 3.
Scatter plot of the virtual estimations versus the experimental pKa values for the B2334 production ensembles. The global population (blue) is compared against high-leverage compounds ( > 0.8, red) and virtual outliers (|ΔpKa|≥ 1.0, green). The dashed line represents the bisector. For the illustrated molecules, acidic and basic sites are highlighted in red and blue, respectively.
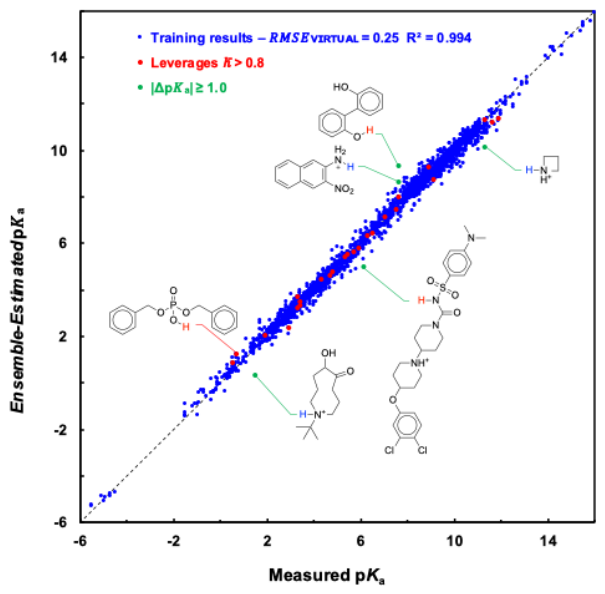
Figure 4.
Comparative analysis of pKa sites for the SAMPL6 set. Molecules are shown in neutral forms, with basic nitrogens in blue and acidic groups in red. Predicted pKa values for competing sites are provided, with targeted atoms numbered for specific structures. Experimental values appear below the formulas. Bold values represent final HGM predictions, corresponding either to preferred sites (e.g., SM01, SM03) or to mesomeric weighted averages (e.g., SM02: exp. 5.0, pred. 5.3). Site selection rely on NMR (SM07, SM14) or chemical analogy. Grey Dotted boxes indicate mesomeric weighting. Hunt et al. [18] values are in parentheses; pink highlights their erroneous assignments.
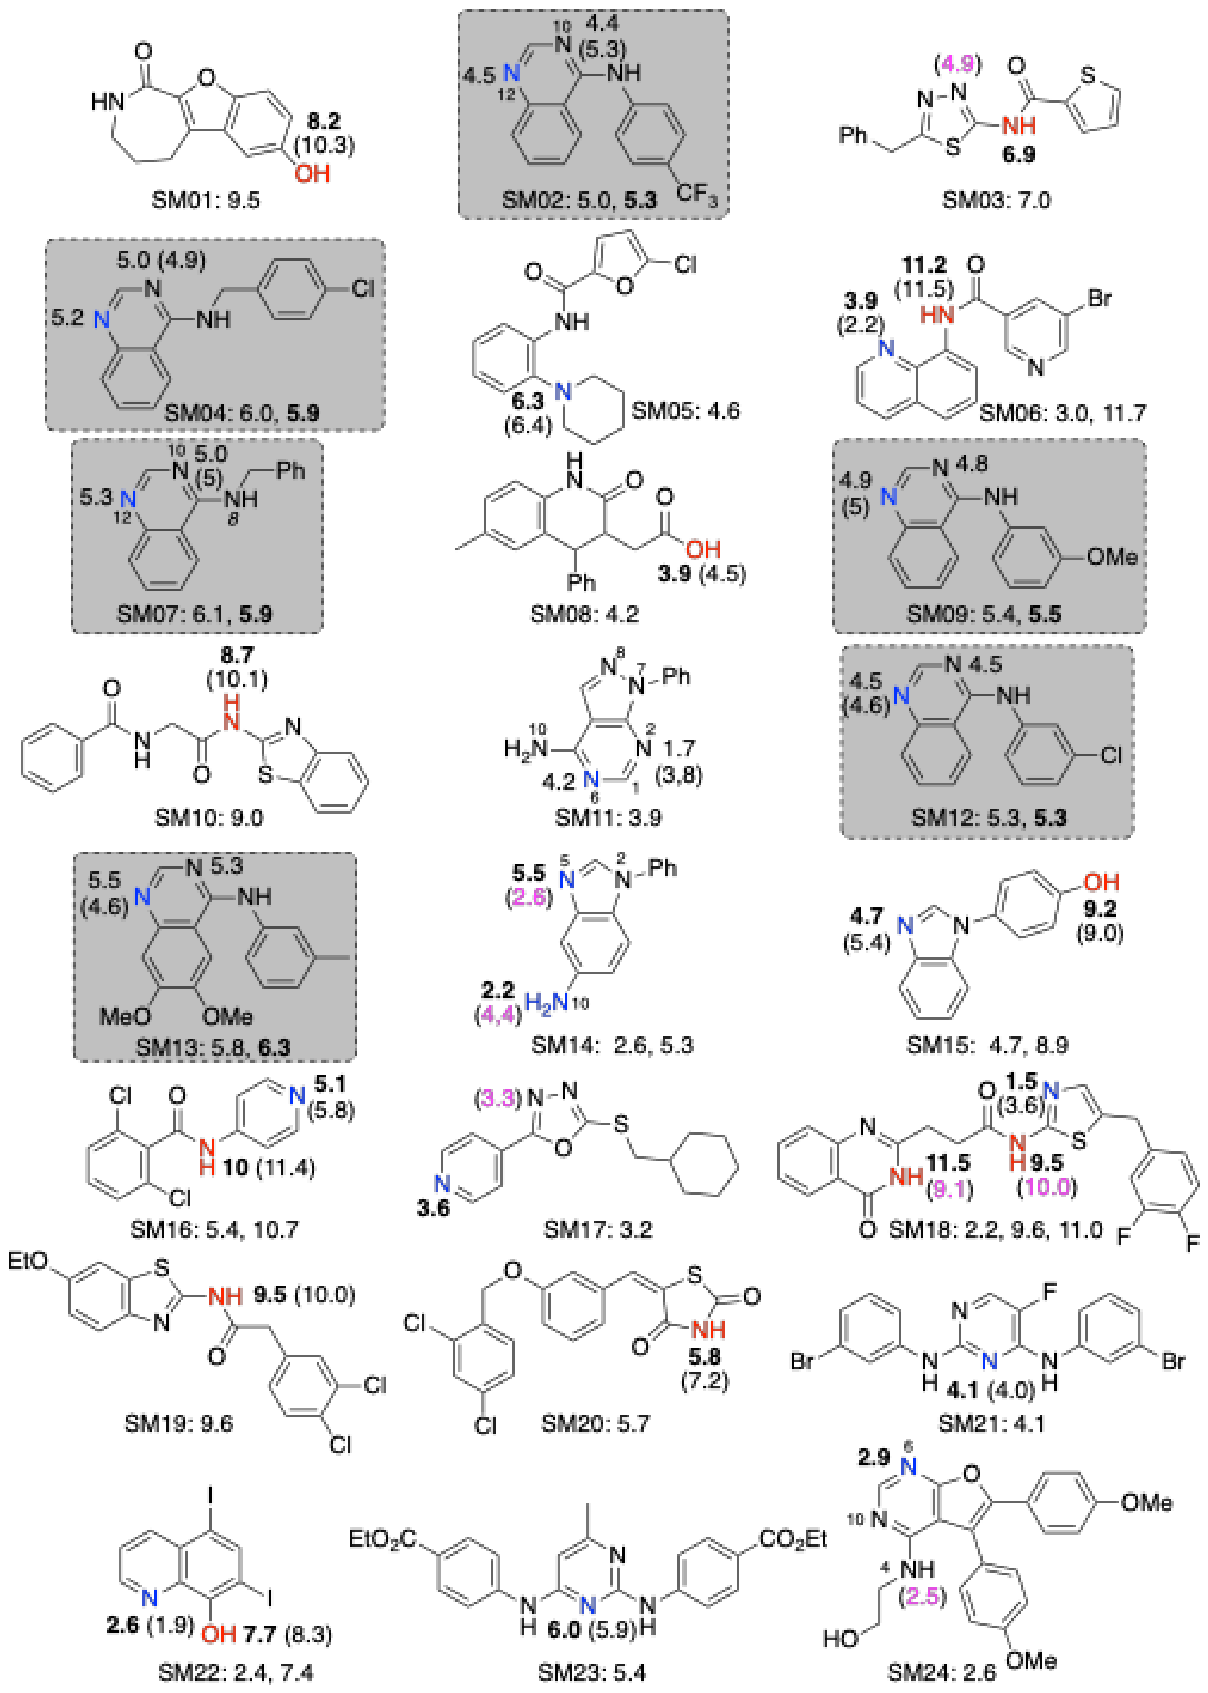
Figure 5.
Mesomeric weighting scheme for the protonated state of SM07. The final pKa is calculated as a weighted average of the pKa values predicted for the aromatic Form I (pKa 5.2) and the delocalized iminium Form II (pKa 9.8). The evaluated ring NH proton is highlighted in blue in both resonance structures. Based on NMR data and refined through statistical optimization across the series, a 0.85/0.15 ratio is applied, yielding a predicted pKa of 5.9 (exp. 6.1).
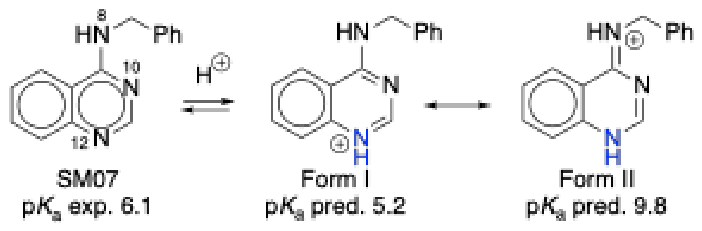
Figure 6.
Protonated structures of the six aromatic amines from the EuroSAMPL1 datasetrequiring a weighted mesomeric protocol.
Figure 6.
Protonated structures of the six aromatic amines from the EuroSAMPL1 datasetrequiring a weighted mesomeric protocol.
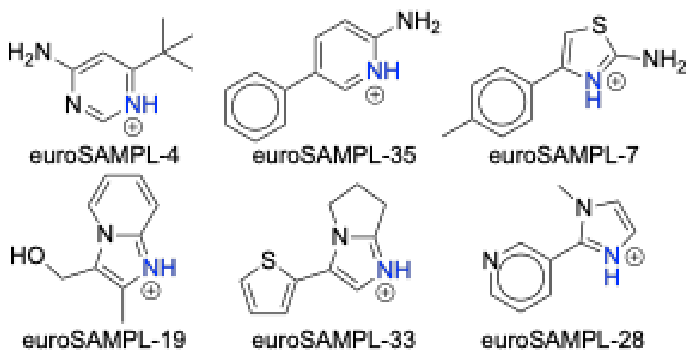
Figure 7.
Correlation between predicted and measured pKa values for the EuroSAMPL1 dataset. Red points correspond to the HGM refined ensemble predictions (after mesomeric weighting), while blue points represent the SP1 (top blind) submission. The dashed line represents the identity line (y = x). Labels for compounds EuroSAMPL-15 and 30 highlight the specific challenges analyzed in Section 4.
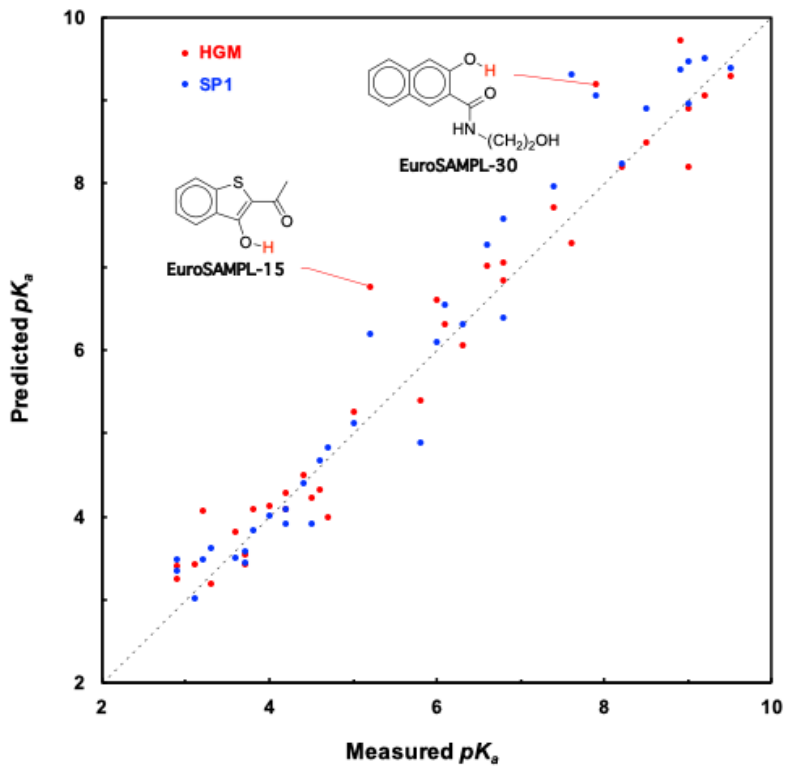
Figure 8.
3D-Structure of the monoprotonated sparteine optimized at the B3LYP/6-31+G(d,p) level. The intramolecular hydrogen bond is indicated by a dashed line. For clarity, only the ammonium proton (H44) and the ring-junction protons (H6, H11, H13, and H22) are displayed.
Figure 8.
3D-Structure of the monoprotonated sparteine optimized at the B3LYP/6-31+G(d,p) level. The intramolecular hydrogen bond is indicated by a dashed line. For clarity, only the ammonium proton (H44) and the ring-junction protons (H6, H11, H13, and H22) are displayed.
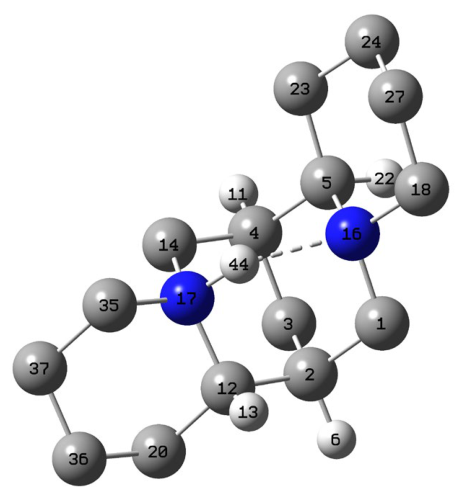
Figure 9.
Structures of the evaluated active pharmaceutical ingredients. Experimental pKa values (unless otherwise noted) are indicated below each structure, while HGM-calculated pKa values (averaged over three runs) are positioned adjacent to the relevant sites. Molecules are shown in neutral forms, with basic nitrogens in blue and acidic groups in red. For pristinamycin IA, two of the three experimental values (2.6 and 7.2) represent the individual pKa values of the neutral pathway (see text).
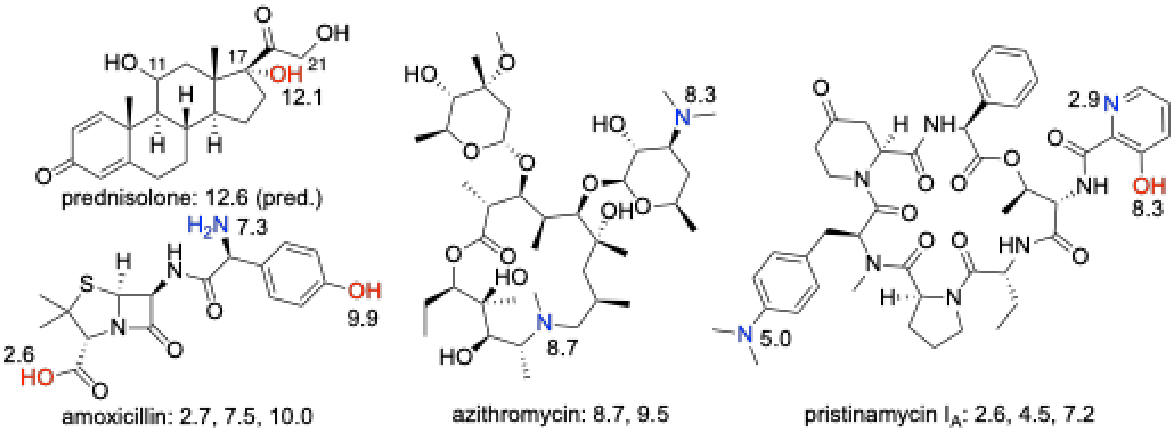

Table 1.
Performance metrics of the HGM ensemble on the training (B2102) and validation (B200) sets as a function of network complexity (number of hidden neurons n).
Table 1.
Performance metrics of the HGM ensemble on the training (B2102) and validation (B200) sets as a function of network complexity (number of hidden neurons n).
| Property GMn | GM12 | GM14 | GM16 | GM18 | GM19 † | GM20 | GM21 | GM22 |
|---|---|---|---|---|---|---|---|---|
| Params | 327 | 382 | 437 | 492 | 537 | 565 | 594 | 623 |
| 1,2 | 0.67 | 0.62 | 0.57 | 0.54 | 0.52 | 0.50 | 0.49 | 0.48 |
| RMSEvirtual1,2 | 0.45 | 0.39 | 0.33 | 0.29 | 0.26 | 0.25 | 0.23 | 0.22 |
| kmin (h1) 3 | 17 | 12 | 1 | 0 (1) | 0 (1) | 0 (3) | 0 (4) | 0 (6) |
| kmin (h5) 3 | 43 | 38 | 36 | 34 | 28 | 15 | 13 | 12 |
| kmin (h10) 3 | 47 | 42 | 45 | 43 | 39 | 33 | 34 | 25 |
| RMSVE(h5) 1,4 | 0.66 (<0.005) | 0.64 (0.01) | 0.62 (0.01) | 0.59 (0.03) |
0.57 (0.02) |
0.60 (0.02) | 0.60 (0.01) | 0.59 (0.01) |
| RMSVE(h10) 1,4 | 0.66 (<0.005) | 0.64 (0.01) | 0.62 (0.01) | 0.59 (0.02) | 0.56 (0.01) | 0.59 (0.02) | 0.59 (0.01) | 0.57 (0.02) |
| Outliers (h10) 5 | 9 | 8 | 8 | 6 | 4 | 4 | 5 | 6 |
1 Error metrics—mean individual VLOO score (), ensemble error (RMSEvirtual), and root mean square validation error (RMSVE)—are expressed in pKa units and represent the average of three independent runs. 2 Standard deviations for both VLOO metrics remain strictly below 0.005 pKa units and are omitted for clarity. 3 hT denotes the leverage threshold ht < T. kmin values presented are the most conservative (lowest) observed across the three runs. For kmin(h1), values in parentheses indicate the number of compounds in the validation set for which no individual model satisfied the threshold. 4 For RMSVE(hT), values are presented as mean (standard deviation). 5 Outliers are defined as estimations exhibiting an absolute deviation > 1.5 pKa units. † Architecture selected for final testing based on the optimal trade-off between prediction accuracy (minimal RMSVE) and ensemble robustness (kmin).
Table 2.
Comparative performance on independent validation sets.
| Model | NT1 | NV1 | RMSVE 2 | MAE 2 | Max AD 2 | AD > 2.0 3 | R2 |
|---|---|---|---|---|---|---|---|
| Hunt et al. (RBF) 4 | 1,570 | 336 | 1.0 | 0.6 | 5.0 | 27 (8%) | 0.90 |
| GM19 | 2,102 | 200 | 0.6 | 0.4 | 3.1 | 4 (2%) | 0.97 |
1NT and NV are the numbers of training and validation examples. 2 root mean square validation error (RMSVE), mean absolute error (MAE), and maximum absolute deviation (Max AD) are expressed in pKa units and rounded to one decimal place. 3 AD > 2.0 denotes the number of compounds for which the AD exceeds 2.0 pKa units. 4 RBF: radial basis function.
Table 3.
Comparative performance metrics on the SAMPL6 dataset.
| Method | Approach / Strategy | RMSE 1 | MAE 1 |
|---|---|---|---|
| HGM | Mesomeric weighting (Expert) | 0.5 | 0.4 |
| HGM 2 | Blind para selection | 0.6 | 0.5 |
| P. Pracht 3 | COSMO-RS (best challenge performer, QM) | 0.7 | 0.6 |
| ACD/Labs | Commercial software (Industry standard) | 0.8 | 0.6 |
| Hunt et al. 4 | RBF network | 0.9 | 0.7 |
| H-SPOC | High-dimensional structural descriptors | 0.7 | 0.6 |
| Uni-pKa | Hybrid GNN + DFT indicators | 0.7 | 0.6 |
1 Root mean square errors (RMSE) and mean absolute errors (MAE) are expressed in pKa units and rounded to one decimal place. 2 For the blind para selection scenario, the pKa for the six 4-aminoquinazolines (SM02, SM04, SM07, SM09, SM12, SM13) as well as SM24 was systematically assigned to the nitrogen atom predicted as the most basic by HGM, corresponding to the para position relative to the amine chain. For SM11 (a structurally distinct pyrazolo[3,4-d]pyrimidine derivative), the weighting scheme does not apply, and the model natively identifies the ortho nitrogen as the most basic site. 3 The COSMO-RS performance reported in the original study excluded SM14a and SM18a, as the implementation used at that time did not support doubly charged species. 4 RBF denotes radial basis function.
Table 4.
Comparative analysis of RMSTE and maximum absolute deviation for pKa prediction approaches on the Jensen dataset.
Table 4.
Comparative analysis of RMSTE and maximum absolute deviation for pKa prediction approaches on the Jensen dataset.
| Metric | PM3 COSMO |
DFT | Chem-Axon | Epik | ACD Labs |
Hunt | HGM 2 (raw) | HGM 2,3 (2D Domain) |
|---|---|---|---|---|---|---|---|---|
| RMSTE 1 | 1.0 (0.9) 4 | 0.7 | 0.7 | 0.7 | 0.6 | 1.0 | 0.7 | 0.5 |
| Max AD 1 | 2.5 (2.3) 4 | 1.9 | 2.8 | 3.6 | 2.0 | 2.9 | 2.6 5 | 1.5 5 |
1 All values are expressed in pKa units. RMSTE and Max AD denote the root mean square test error and the maximum absolute deviation, respectively. 2 HGM results represent the average of three independent training runs (SD = 0.03 for RMSTE). 3 HGM (2D Domain) applies the mesomeric weighting for phenacaine and excludes sparteine and nefopam. 4 In parentheses, results after shifting predictions to zero average error as per the original reference. 5 The maximum AD values of 2.6 and 1.5 correspond to sparteine and nikethamide for the raw and 2D Domain evaluations, respectively.
Table 5.
Performance comparison of HGM against top-tier methods and commercial standards on EuroSAMPL1.
Table 5.
Performance comparison of HGM against top-tier methods and commercial standards on EuroSAMPL1.
| Method/Submission ID | RMSE 1 | MAE 1 | Max AD 1 |
|---|---|---|---|
| HGM (raw ensemble) | 0.7 | 0.5 | 1.6 |
| HGM (refined ensemble) | 0.5 | 0.4 | 1.6 |
| QupKake QM/ML (top best submission) | 0.5 | 0.4 | 1.1 |
| SP1 ML (top blind submission) | 0.5 | 0.4 | 1.7 |
| Biovia COSMO-RS (2nd best submission) | 0.7 | 0.6 | 2.4 |
| Marvin (ChemAxon) 2 | 0.7 | 0.5 | 3.3 |
| ACD/Labs (via CAS) 2,3 | 0.9 | 0.6 | 2.6 |
1 Root mean square errors (RMSEs), mean absolute errors (MAEs) and maximum absolute deviations (Max ADs) are expressed in pKa units and rounded to one decimal place. 2 Predictions made with commercial softwares. 3 Only 33 out of 35 predictions could be retrieved from the CAS database.
Table 6.
Performance of the HGM framework on four active pharmaceutical ingredients.
| Compound | Ionizable Site |
Exp. pKa (298 K) |
HGM Prediction |
ACD/Labs Prediction 1 |
|---|---|---|---|---|
| Prednisolone | C17-OH | 12.6 2 | 12.1 | 12.4 |
| Amoxicillin | Carboxylic acid | 2.7 | 2.6 | 2.4 |
| Ammonium | 7.5 | 7.3 | 7.1 | |
| Phenol | 10.0 | 9.9 | - 3 | |
| Azithromycin | Sugar ammonium | 8.7 | 8.3 | - 4 |
| Macrocycle ammonium | 9.5 | 8.7 | 8.6 | |
| Pristinamycin IA | Anilinium | 4.5 | 5.0 | 3.5 |
| Pyridinium | 2.6 | 2.9 | - 4 | |
| Phenol | 7.2 | 8.3 | 6.3 |
1 Attribution made by the authors. 2 No reliable thermodynamic measurement available in aqueous media; predicted value is given by Stan et al. [52]. 3 Secondary acidic dissociation not reported in CAS screening interfaces. 4 Secondary basic dissociation not reported in CAS screening interfaces.
Disclaimer/Publisher’s Note: The statements, opinions and data contained in all publications are solely those of the individual author(s) and contributor(s) and not of MDPI and/or the editor(s). MDPI and/or the editor(s) disclaim responsibility for any injury to people or property resulting from any ideas, methods, instructions or products referred to in the content. |
© 2026 by the authors. Licensee MDPI, Basel, Switzerland. This article is an open access article distributed under the terms and conditions of the Creative Commons Attribution (CC BY) license.
Copyright: This open access article is published under a Creative Commons CC BY 4.0 license, which permit the free download, distribution, and reuse, provided that the author and preprint are cited in any reuse.