

Submitted:
22 September 2026
Posted:
06 October 2026
You are already at the latest version
Abstract
Inherited retinal diseases (IRDs) are progressive disorders characterized by photoreceptor and reti-nal pigment epithelium dysfunction, for which effective disease-modifying treatments remain lim-ited. Wharton’s jelly-derived mesenchymal stromal cells (WJ-MSCs) may exert neuroprotective and immunomodulatory effects through paracrine mechanisms. The suprachoroidal route may provide targeted delivery toward the choroid–retinal pigment epithelium–outer retinal interface while avoiding direct subretinal transplantation. This study evaluated preliminary structural, functional, electrophysiological, and safety outcomes 45 days after suprachoroidal administration of WJ-MSCs in patients with IRDs. This prospective, open-label, single-arm exploratory clinical study was con-ducted at Universidade Santo Amaro, Brazil. Ten patients with genetically and multimodally con-firmed IRDs were recruited in June 2026 and followed for 45 days. Eligible participants had no pre-vious ocular treatment and best-corrected visual acuity (BCVA) ≤20/30. Human umbilical cord-derived WJ-MSCs were administered as a single suprachoroidal injection at a dose of 1 × 10⁶ cells in 0.1 mL per treated eye, without additional study-specific in vitro expansion after preparation of the cryopreserved product. BCVA, intraocular pressure (IOP), central foveal thickness (CFT), automated visual-field mean deviation (MD) and pattern standard deviation (PSD), and electro-retinographic (ERG) parameters were assessed at baseline and day 45. Paired Student’s t-tests and Wilcoxon signed-rank tests were performed using Python 3.12.3 and SciPy 1.17.1. Both eyes were included in the analysis, with recognition of within-patient correlation. Mean BCVA improved from 0.849 ± 0.750 to 0.740 ± 0.718 logMAR, corresponding to a mean change of −0.109 logMAR, without statistical significance by either the paired t-test (p = 0.1003) or Wilcoxon test (p = 0.0904). Mean IOP changed from 15.6 ± 2.56 to 16.1 ± 3.28 mmHg, without significant difference. CFT increased from 226.8 ± 108.2 to 275.8 ± 178.4 μm; this difference was significant by the Wilcoxon test (p = 0.0313), but not by the paired t-test (p = 0.0619). Visual-field MD improved from −20.86 ± 8.87 to −19.09 ± 9.47 dB, with significant differences by both the paired t-test (p = 0.0082) and Wilcoxon test (p = 0.0042), whereas PSD remained stable. At the group level, none of the eight ERG parameters showed a sig-nificant change by paired t-test. The Wilcoxon analysis identified a difference only in 30-Hz flicker P1 latency (p = 0.0195), which was not confirmed by the paired t-test. Using an exploratory 30% test–retest variability threshold, Patient 10 demonstrated improvement trends in 7 of 8 ERG parameters, whereas Patients 4 and 9 showed predominantly declining patterns. No ocular inflammatory, infec-tious, or clinically significant treatment-related pressure events were observed during the 45-day follow-up. These preliminary findings indicate that suprachoroidal administration of WJ-MSCs was feasible and was not associated with major ocular safety events during the 45-day observation pe-riod. The observed improvement in visual-field MD warrants further investigation but should be interpreted cautiously given the single-arm design, small sample size, heterogeneous diagnoses, mixed perimetric protocols, potential inter-eye correlation, and marked individual-level variability. The absence of consistent group-level ERG improvement and the CFT increase observed in one par-ticipant further emphasizes the exploratory nature of these findings. Larger controlled studies with standardized functional endpoints, validated ERG repeatability criteria, patient-level mixed-effects analyses, and longer follow-up are required to determine whether the observed functional changes represent a treatment-related biological effect. The study support further controlled investigation of the suprachoroidal route as a targeted strategy for inherited retinal diseases.
Keywords:
inherited retinal disease
; retinitis pigmentosa
; Stargardt disease
; Wharton’s jelly
; mesenchymal stem cells
; suprachoroidal injection
; visual field
; electroretinography
; optical coherence tomography
; retinal regeneration
1. Introduction
Inherited retinal diseases (IRDs) comprise a clinically and genetically heterogeneous group of disorders characterized by progressive dysfunction and degeneration of photoreceptors, retinal pigment epithelium (RPE), and other retinal neuronal populations. Their clinical manifestations include night blindness, peripheral visual-field loss, central visual impairment, and, in advanced cases, profound irreversible blindness. Disease progression varies according to the affected gene, inheritance pattern, residual retinal structure, and age at onset [1,2].
Retinitis pigmentosa (RP), Stargardt disease, and PPH2 dystrophy represent distinct phenotypic entities within the spectrum of hereditary retinal degeneration. RP is generally characterized by rod-predominant degeneration followed by cone dysfunction and progressive peripheral field constriction. Stargardt disease primarily affects the macular region and may result in progressive central visual loss. These conditions share the lack of broadly effective treatments for many affected individuals, particularly when patients are not candidates for mutation-specific gene therapy or when photoreceptor degeneration is advanced [1,3].
Cell-based therapies have emerged as potentially mutation-independent strategies for retinal neuroprotection, tissue repair, or cellular replacement. Candidate products include retinal progenitor cells, bone-marrow-derived mononuclear cells, CD34-positive cells, mesenchymal stem/stromal cells (MSCs), human embryonic stem-cell-derived RPE cells, and induced pluripotent stem-cell-derived retinal cells. Proposed mechanisms include replacement of damaged cells, secretion of neurotrophic and anti-apoptotic factors, immunomodulation, attenuation of inflammatory signaling, and transfer of biologically active molecules through extracellular vesicles [2,4,5,6,7,8,9,10,11,12].
Wharton’s jelly-derived mesenchymal stem cells (WJ-MSCs) are of particular interest because they can be obtained from umbilical cord tissue and exhibit immunomodulatory and trophic properties. Preclinical studies suggest that WJ-MSCs may preserve retinal structure, support photoreceptor survival, and delay outer nuclear layer degeneration, although electrophysiological improvement has not been consistently demonstrated. Early clinical studies involving WJ-MSCs in retinal degeneration have reported variable functional outcomes and generally favorable short-term safety profiles, but the evidence remains limited by small samples, heterogeneous routes of administration, and lack of control groups [13,14,15,16,17].
The route of cell delivery is an important determinant of therapeutic targeting and safety. Intravitreal injection is technically accessible but may limit exposure of the outer retina because of the internal limiting membrane and vitreous environment. Subretinal injection offers direct access to the RPE–photoreceptor interface but requires vitreoretinal surgery and carries risks related to retinal detachment, hemorrhage, inflammation, and graft-associated complications. Suprachoroidal injection may provide targeted exposure of the choroid, RPE, and outer retina while avoiding direct penetration of the retinal tissue [2,4,6,7,18].
A systematic review and meta-analysis of 21 prospective studies involving 382 patients and 496 eyes reported early visual-acuity improvement after cell-based therapy in RP and Stargardt disease. In RP, approximately 49% of eyes showed visual-acuity improvement at 6 months, decreasing to approximately 30% at 12 months. The pooled visual-acuity improvement at 6 months was approximately −0.12 logMAR, whereas the difference was not statistically significant at 12 months. Suprachoroidal administration was identified as a potentially promising route for RP, although the overall evidence quality was limited and randomized trials were lacking [3].
In addition to visual acuity, visual-field testing, OCT, and electroretinography provide complementary information about treatment response. Visual-field mean deviation (MD) estimates global sensitivity loss, while pattern standard deviation (PSD) reflects localized field irregularity. OCT can identify structural changes such as retinal thickening, outer-retinal preservation, fluid accumulation, epiretinal proliferation, or segmentation artifacts. ERG provides an objective measure of retinal electrophysiological function through amplitude and latency parameters under scotopic, photopic, and flicker conditions [1,2,3].
However, interpretation of ERG changes requires attention to test–retest variability. Electrode placement, retinal adaptation, patient cooperation, stimulus conditions, and technical factors can produce substantial variation between examinations. In the present exploratory analysis, a 30% threshold was applied to classify changes as beyond presumed test–retest variability. This threshold was assumed for exploratory purposes and was not derived from a dedicated repeatability study using the specific device and protocol.
The present study evaluated preliminary 45-day structural, functional, electrophysiological, and safety outcomes after suprachoroidal injection of WJ-MSCs in patients with genetically confirmed IRDs. We hypothesized that the intervention could produce measurable changes in visual-field sensitivity, retinal structure, and ERG parameters while maintaining short-term ocular safety [3,14,16,19].
2. Materials and Methods
2.1. Study Design and Setting
This was a prospective, open-label, single-arm clinical trial with preliminary 45-day outcomes. The study was conducted at Universidade Santo Amaro (UNISA), São Paulo, Brazil.
Twenty eyes of 10 patients were included in the analysis. Patients had genetically and multimodally confirmed hereditary retinal dystrophies, including RP, PPH2 dystrophy, and Stargardt dystrophy.
The study cohort was recruited in June 2026 and evaluated at baseline and 45 days after suprachoroidal WJ-MSC injection.
Baseline examinations were performed before treatment, and the post-treatment evaluation was conducted 45 days after the intervention.
The study included both eyes of each participant. Because measurements from the two eyes of the same patient are correlated, the statistical analysis was performed using paired observations and the study design considered within-patient correlation.
2.2. Participants
Patients were eligible if they had an established diagnosis of hereditary retinal dystrophy confirmed through multimodal ophthalmic imaging and genetic testing.
Inclusion criteria
- Established hereditary retinal dystrophy confirmed by multimodal imaging;
- Confirmatory genetic testing;
- No previous ocular treatment for the retinal disease;
- BCVA ≤20/30;
- Availability of baseline and 45-day follow-up examinations;
- Ability to provide written informed consent.
Exclusion criteria
- Previous ocular treatment;
- Unclear or unconfirmed ocular diagnosis;
- BCVA better than 20/30;
- Active ocular infection or inflammation;
- Coexisting ocular disease likely to affect visual function;
- Incomplete baseline or post-treatment records;
- Inability to undergo the required examinations.
The study population included patients with RP, PPH2 dystrophy, and Stargardt dystrophy.
2.3. Ethical Approval and Informed Consent
The study was conducted in accordance with the Declaration of Helsinki. The protocol was approved by the Research Ethics Committee of Universidade Santo Amaro under CAAE 97710926200000081.
Written informed consent was obtained from all participants using the standardized informed consent form approved by the UNISA Research Ethics Committee.
2.4. Cell Product and Intervention
The intervention consisted of a single suprachoroidal administration of human Wharton’s jelly-derived mesenchymal stromal cells (WJ-MSCs). The cells were obtained from human umbilical cord Wharton’s jelly and were supplied as a commercially manufactured cryopreserved cell product (stemCORD; StemCorp Serviços Biomédicos Ltda., São Paulo, Brazil; batch no. 18340000260226). According to the manufacturer’s documentation, the cells were isolated from umbilical cord tissue obtained from healthy donors and underwent in vitro expansion during the manufacturing process using the CellBind culture system (Corning, Corning, NY, USA). Therefore, the term “passage 0” in the present study refers specifically to the absence of additional study-specific in vitro expansion after receipt and preparation of the cryopreserved product, rather than to the absence of prior manufacturing expansion.
The cryopreserved product was supplied in 2-mL vials and stored in liquid nitrogen at approximately −196 °C, with a declared content of 8 × 10⁶ cells per vial. The cryopreservation formulation contained StemPro™ MSC SFM XenoFree medium and clinical-grade dimethyl sulfoxide (DMSO). According to the manufacturer’s certificate of analysis, product characterization included donor serological screening, G-banding karyotype analysis, flow-cytometric immunophenotyping, endotoxin testing, mycoplasma testing, and sterility testing. The manufacturer also documented the use of fetal bovine serum, DMSO, antibiotics, and antifungal agents during the manufacturing process, with the possibility of residual amounts being present in the final product.
Immediately before administration, the cryopreserved cell preparation was thawed and processed according to the institutional protocol. The final cell suspension was adjusted to a dose of 1 × 10⁶ cells in 0.1 mL for each treated eye. No additional in vitro cell expansion or culture was performed as part of the study-specific preparation. The same standardized surgical protocol was used for all participants by the same qualified ophthalmic surgeon.
For suprachoroidal administration, a 30-gauge needle was incorporated into a modified peripheral intravenous catheter segment that functioned as a depth-limiting guide. Approximately 1 mm of the sharp distal portion of the needle was exposed beyond the catheter tip to facilitate controlled scleral penetration while limiting excessive advancement toward the vitreous cavity. The cell suspension was loaded into a 1-mL syringe connected to the protected 30-gauge needle assembly (Figure 1).
After topical ocular anesthesia and 5% povidone-iodine antisepsis, the device was positioned approximately 4 mm posterior to the limbus. The needle-guide assembly was gently advanced through the sclera to access the suprachoroidal space (Figure 2). A total volume of 0.1 mL containing 1 × 10⁶ WJ-MSCs was then administered slowly over approximately 10 s. Following injection, the needle was withdrawn carefully, and the ocular surface and injection site were examined for immediate complications. Post-procedure topical antibiotic drops were prescribed for 5 days.
The suprachoroidal route was selected to facilitate delivery of the cellular product toward the choroid–retinal pigment epithelium–outer retinal interface while avoiding direct subretinal or intravitreal injection. All patients underwent standardized postoperative clinical monitoring and were evaluated for ocular inflammation, infection, intraocular pressure changes, hemorrhage, retinal or choroidal complications, and other treatment-related adverse events during the 45-day follow-up period.
2.5. Ophthalmic Assessments
The following examinations were performed at baseline and 45 days after treatment:
- BCVA;
- IOP;
- OCT;
- Automated visual-field testing;
- Electroretinography;
- Clinical examination for ocular inflammatory and infectious signs.
2.6. Visual Acuity
BCVA was recorded using Snellen notation and converted to logMAR values.
Lower logMAR values indicated better visual acuity. A negative post-treatment change indicated improvement.
Counting-fingers visual acuity was assigned a reference value of 2.0 logMAR solely for quantitative statistical analysis. This approximation does not constitute a standardized continuous visual-acuity measurement and was interpreted cautiously.
2.7. Intraocular Pressure
IOP was measured in mmHg using standardized tonometry. When bilateral IOP values were reported in the clinical records, the recorded value was applied to both eyes.
The analysis evaluated both group-level change and individual values that might indicate clinically relevant pressure elevation.
2.8. Optical Coherence Tomography
OCT was performed using the RS-330 Retina Scan Duo system (Nidek, Japan).
Central foveal thickness (CFT) was recorded in micrometers. OCT images were assessed for central retinal thickness and should also be reviewed qualitatively for intraretinal fluid, subretinal fluid, cystoid spaces, epiretinal membrane, vitreomacular traction, hyperreflective foci, segmentation artifacts, and changes in outer-retinal architecture.
An increase in CFT was not interpreted automatically as regeneration because retinal thickening may also reflect edema, inflammation, traction, or measurement artifact.
2.9. Automated Visual-Field Testing
Automated visual-field examinations were performed using the Humphrey Field Analyzer II, series 700 (Carl Zeiss, Germany), with 24-2 and/or 10-2 protocols.
The following indices were analyzed:
- Mean deviation (MD), in dB;
- Pattern standard deviation (PSD), in dB.
Reliability criteria included fixation losses, false-positive responses, and false-negative responses. Tests not meeting the institutional reliability criteria were excluded from the corresponding paired analysis.
A positive change in MD was considered favorable because it represented a shift toward less negative values. PSD was analyzed as a structural-functional descriptor without prespecifying that a small numerical change represented clinical improvement.
2.10. Electroretinography
ERG was performed using the RETIport system (Roland Consult, Germany). The analyzed parameters were:
- Scotopic 0.01 b-wave latency;
- Scotopic 0.01 b-wave amplitude;
- Photopic 3.0 a-wave latency;
- Photopic 3.0 b-wave latency;
- Photopic 3.0 a-wave amplitude;
- Photopic 3.0 b-wave amplitude;
- 30-Hz flicker P1 latency;
- 30-Hz flicker N1–P1 amplitude.
For amplitude parameters, an increase was interpreted as directionally favorable. For latency parameters, a decrease was interpreted as directionally favorable.
2.11. ERG Test–Retest Variability Criterion
Because a dedicated repeatability study for the RETIport device and the present protocol was not available, an exploratory 30% threshold was assumed.
A change greater than 30% relative to the baseline value was classified as beyond the assumed test–retest variability. Changes within ±30% were considered stable because they could plausibly reflect measurement noise associated with electrode positioning, adaptation, patient cooperation, and technical factors.
For each ERG parameter:
%Δ = [(post-treatment value − baseline value) / baseline value] × 100
For amplitude parameters:
- >30% increase: trend toward improvement;
- >30% decrease: trend toward decline;
- Change within ±30%: stable.
For latency parameters:
- >30% decrease: trend toward improvement;
- >30% increase: trend toward decline;
- Change within ±30%: stable.
This threshold was exploratory and should not be interpreted as a validated minimally clinically important difference.
2.12. Outcome Measures
Primary outcome
The primary exploratory outcome was the change in visualfield MD from baseline to day 45.
Secondary outcomes
Secondary outcomes included:
- Change in BCVA in logMAR;
- Change in IOP in mmHg;
- Change in CFT in micrometers;
- Change in visual-field PSD;
- Change in ERG amplitudes and latencies;
- Ocular inflammatory signs;
- Ocular infectious signs;
- Clinically relevant IOP variation.
2.13. Statistical Analysis
Statistical analyses were performed using Python 3.12.3 and SciPy 1.17.1.
Continuous variables were summarized using means and standard deviations. Pre- and post-treatment values were compared using paired Student’s t-tests and Wilcoxon signed-rank tests.
A two-sided p value <0.05 was considered statistically significant. Because the study evaluated several structural, functional, and electrophysiological endpoints in a small cohort, the results were considered exploratory and no causal efficacy conclusion was drawn.
Both eyes were included and correlated within the patient-level study structure. For confirmatory analyses, a mixed-effects model with a patient-level random effect would be preferable.
Patient 9 was retained in the primary analysis because exclusion of an extreme observation after reviewing the results could introduce post hoc selection bias. Its influence was acknowledged and interpreted through individuallevel analysis.
2.13.1. Statistical Analysis Report
Parameters analyzed: BCVA (Best-Corrected Visual Acuity)· IOP (Intra-ocular Pressure) Visual Field (VF: MD and PSD) · OCT (Central Foveal Thiness)
This report presents the comparative statistical analysis between assessments performed before and after the application, organized by patient and by examination instrument. For each data set, detailed per-patient tables are presented, followed by the group's statistical summary (paired t-test and Wilcoxon signed-rank test for paired samples, appropriate for small samples and potentially non-normal distributions). Patient names have been replaced with sequential numeric identifiers (Patient 1-10, in the same order as the original document) to protect patient identity.
Methodological note: visual acuity values recorded as 'counting fingers' (CF) were converted to a reference logMAR equivalent (2.0) solely to enable quantitative statistical treatment; this is a widely used approximation in the ophthalmology literature, not a direct measurement. Cells with no record in the original document (e.g., 'unavailable' or missing data) were excluded from the corresponding paired calculation.
2.14. Safety Analysis
Safety outcomes included:
- Ocular inflammatory signs;
- Ocular infectious signs;
- IOP variation;
- Other ocular or systemic adverse events potentially related to the intervention.
Patients were clinically monitored throughout the 45-day follow-up.
3. Results
3.1. Best-Corrected Visual Acuity
Mean BCVA improved numerically from 0.849 ± 0.750 logMAR at baseline to 0.740 ± 0.718 logMAR at day 45, representing a mean change of −0.109 logMAR.
The difference was not statistically significant by the paired Student’s t-test (t = 1.7275, p = 0.1003) or the Wilcoxon signed-rank test (W = 4, p = 0.0904) (Table 1).
The largest individual improvements were observed in Patient 3’s right eye, from 20/200 to 20/30, and Patient 5’s left eye, from counting fingers at 2 m to 20/200.
Visual acuity was converted from Snellen notation to the logMAR scale (log of the Minimum Angle of Resolution), where lower values indicate better visual acuity. Thus, a negative delta (post minus pre) represents improvement (Table 2 and Table 3).
Significance tests (paired):
- Paired t-test: t = 1.7275, p = 0.1003 → difference not statistically significant (p ≥ 0.05).
- Wilcoxon signed-rank test: W = 4, p = 0.0904 → difference not statistically significant (p ≥ 0.05).
Interpretation: there was a mean reduction in logMAR (mean improvement in visual acuity) after injection, but the difference did not reach statistical significance in the paired tests, which may reflect either a true absence of a group-level effect or the small sample size (10 patients / 20 eyes) combined with high individual variability — some patients showed marked improvement (e.g., Patient 3, RE: 20/200 → 20/30) while others remained stable.
3.2. IOP — Intraocular Pressure (mmHg)
IOP values reported as both eyes were considered equal for OD and OS in the corresponding pair (Table 4 and Table 5).
Significance tests (paired):
- Paired t-test: t = -1.045, p = 0.3092 → difference not statistically significant (p ≥ 0.05).
- Wilcoxon signed-rank test: W = 27.5, p = 0.3343 → difference not statistically significant (p ≥ 0.05).
Interpretation: mean IOP showed a slight increase (approx. +0.5 mmHg) after application, without statistical significance. Clinically, values remained within the normal range (10–21 mmHg) for most patients, with the exception of isolated cases in Patient 1 (22 mmHg post) and Patient 4 (20/22 mmHg post), which warrant follow-up.
3.3. OCT — Central Foveal Thickness (µm).

Table 6.
OCT – central foveal thickness (µm) mean Δ values pre and post-injection.by patient.
| Patient | Eye | Pre (µm) | Post (µm) | Δ (µm) | Δ (%) |
|---|---|---|---|---|---|
| Patient 1 | RE | 193 | 198 | +5 | +2.6% |
| LE | 202 | 206 | +4 | +2% | |
| Patient 2 | RE | 237 | 383 | +146 | +61.6% |
| LE | 332 | 245 | -87 | -26.2% | |
| Patient 3 | RE | 229 | 242 | +13 | +5.7% |
| LE | 282 | 275 | -7 | -2.5% | |
| Patient 4 | RE | 244 | 238 | -6 | -2.5% |
| LE | 223 | 199 | -24 | -10.8% | |
| Patient 5 | RE | 66 | 84 | +18 | +27.3% |
| LE | 56 | 167 | +111 | +198.2% | |
| Patient 6 | RE | 131 | 278 | +147 | +112.2% |
| LE | 232 | 231 | -1 | -0.4% | |
| Patient 7 | RE | 148 | 154 | +6 | +4.1% |
| LE | 104 | 139 | +35 | +33.7% | |
| Patient 8 | RE | 278 | 281 | +3 | +1.1% |
| LE | 263 | 263 | +0 | +0% | |
| Patient 9 | RE | 406 | 836 | +430 | +105.9% |
| LE | 511 | 681 | +170 | +33.3% | |
| Patient 10 | RE | 233 | 235 | +2 | +0.9% |
| LE | 167 | 181 | +14 | +8.4% |
Table 7.
OCT — Central Foveal Thickness (µm) Group statistical summary (n = 20 eyes).
| Measure | Pre-application | Post-application | Mean Δ |
|---|---|---|---|
| Mean µm (SD) | 226.8 (±108.2) | 275.8 (±178.4) | +49 |
Significance tests (paired):
- Paired t-test: t = -1.9838, p = 0.0619 → difference not statistically significant (p ≥ 0.05) (borderline).
- Wilcoxon signed-rank test: W = 41.5, p = 0.0313 → difference statistically significant (p < 0.05).
Interpretation: there was a mean increase in foveal thickness (~49 µm) after application, statistically significant on the Wilcoxon test (p = 0.031) and borderline on the paired t-test (p = 0.062). This increase is strongly influenced by extreme values, notably Patient 9 (RE: 406→836 µm; LE: 511→681 µm), suggesting a possible localized edema/effect that warrants individual investigation, in addition to more modest gains in Patient 3 and Patient 6 (Figure 3 and Figure 4).
3.4. Visual Field (VF) —MD and PSD
The Mean Deviation (MD, in dB) and Pattern Standard Deviation (PSD, in dB) indices were assessed under the 24-2 and 10-2 protocols, for right eye (RE) and left eye (LE). MD values closer to zero indicate less visual field loss; lower PSD values indicate less irregularity of the visual field (Figure 5).
Table 8.
Patient 1 pre and post-injection MD and PSD mean Δ values.
| Protocol | Eye | MD Pre | MD Post | Δ MD | PSD Pre | PSD Post | Δ PSD |
|---|---|---|---|---|---|---|---|
| 24-2 | RE | -33.09 | -33.03 | +0.06 | 1.44 | 1.50 | +0.06 |
| 24-2 | LE | -33.05 | -33.04 | +0.01 | 1.54 | 1.88 | +0.34 |
| 10-2 | RE | -33.81 | -31.05 | +2.76 | 3.91 | 6.34 | +2.43 |
| 10-2 | LE | -33.01 | -31.43 | +1.58 | 4.28 | 6.24 | +1.96 |
Patient's mean Δ MD: +1.1 dB| Patient's mean Δ PSD: +1.2 dB.
Table 9.
Patient 2 pre and post-injection MD and PSD mean Δ values.
| Protocol | Eye | MD Pre | MD Post | Δ MD | PSD Pre | PSD Post | Δ PSD |
|---|---|---|---|---|---|---|---|
| 24-2 | RE | -17.67 | -9.87 | +7.80 | 11.81 | 10.89 | -0.92 |
| 24-2 | LE | -16.92 | -18.06 | -1.14 | 13.86 | 13.58 | -0.28 |
| 10-2 | RE | -16.16 | -12.59 | +3.57 | 11.77 | 8.90 | -2.87 |
| 10-2 | LE | -13.65 | -15.82 | -2.17 | 10.05 | 10.41 | +0.36 |
Patient's mean Δ MD: +2.02 dB | Patient's mean Δ PSD: -0.93 dB.
Table 10.
Patient 3 pre and post-injection MD and PSD mean Δ values.
| Protocol | Eye | MD Pre | MD Post | Δ MD | PSD Pre | PSD Post | Δ PSD |
|---|---|---|---|---|---|---|---|
| 24-2 | RE | -22.71 | -15.19 | +7.52 | 6.85 | 11.31 | +4.46 |
| 24-2 | LE | -18.87 | -22.84 | -3.97 | 10.04 | 7.04 | -3.00 |
| 10-2 | RE | -21.71 | -21.26 | +0.45 | 13.14 | 13.54 | +0.40 |
| 10-2 | LE | -20.97 | -19.85 | +1.12 | 11.39 | 12.64 | +1.25 |
Patient's mean Δ MD: +1.28 dB | Patient's mean Δ PSD: +0.78 dB.
Table 11.
Patient 4 pre and post-injection MD and PSD mean Δ values.
| Protocol | Eye | MD Pre | MD Post | Δ MD | PSD Pre | PSD Post | Δ PSD |
|---|---|---|---|---|---|---|---|
| 24-2 | RE | -30.02 | — | — | 6.62 | — | — |
| 24-2 | LE | -30.19 | — | — | 5.18 | — | — |
| 10-2 | RE | -22.25 | -21.52 | +0.73 | 10.06 | 11.06 | +1.00 |
| 10-2 | LE | -22.39 | -24.48 | -2.09 | 8.51 | 9.88 | +1.37 |
Patient's mean Δ MD: -0.68 dB | Patient's mean Δ PSD: +1.19 dB.
Table 12.
Patient 5 pre and post-injection MD and PSD mean Δ values.
| Protocol | Eye | MD Pre | MD Post | Δ MD | PSD Pre | PSD Post | Δ PSD |
|---|---|---|---|---|---|---|---|
| 24-2 | RE | -10.06 | -6.90 | +3.16 | 7.30 | 6.78 | -0.52 |
| 24-2 | LE | -8.96 | -6.72 | +2.24 | 6.83 | 7.96 | +1.13 |
| 10-2 | RE | -15.47 | -13.43 | +2.04 | 11.04 | 11.02 | -0.02 |
| 10-2 | LE | -16.38 | -13.83 | +2.55 | 10.11 | 10.98 | +0.87 |
Patient's mean Δ MD: +2.5 dB | Patient's mean Δ PSD: +0.37 dB.
Table 13.
Patient 6 pre and post-injection MD and PSD mean Δ values.
| Protocol | Eye | MD Pre | MD Post | Δ MD | PSD Pre | PSD Post | Δ PSD |
|---|---|---|---|---|---|---|---|
| 24-2 | RE | -24.72 | -28.98 | -4.26 | 6.79 | 6.27 | -0.52 |
| 24-2 | LE | -21.14 | -22.95 | -1.81 | 9.05 | 8.18 | -0.87 |
| 10-2 | RE | -24.37 | -21.25 | +3.12 | 8.81 | 9.56 | +0.75 |
| 10-2 | LE | -20.56 | -18.17 | +2.39 | 9.53 | 11.28 | +1.75 |
Patient's mean Δ MD: -0.14 dB | Patient's mean Δ PSD: +0.28 dB.
Table 14.
Patient 7 pre and post-injection MD and PSD mean Δ values.
| Protocol | Eye | MD Pre | MD Post | Δ MD | PSD Pre | PSD Post | Δ PSD |
|---|---|---|---|---|---|---|---|
| 24-2 | RE | -30.35 | -30.29 | +0.06 | 5.24 | 5.67 | +0.43 |
| 24-2 | LE | -30.77 | -31.18 | -0.41 | 4.35 | 3.01 | -1.34 |
| 10-2 | RE | -24.08 | -23.55 | +0.53 | 7.91 | 7.99 | +0.08 |
| 10-2 | LE | -24.77 | -23.59 | +1.18 | 6.81 | 7.05 | +0.24 |
Patient's mean Δ MD: +0.34 dB | Patient's mean Δ PSD: -0.15 dB.
Table 15.
Patient 8 pre and post-injection MD and PSD mean Δ values.
| Protocol | Eye | MD Pre | MD Post | Δ MD | PSD Pre | PSD Post | Δ PSD |
|---|---|---|---|---|---|---|---|
| 24-2 | RE | -0.72 | -0.79 | -0.07 | 1.40 | 1.17 | -0.23 |
| 24-2 | LE | -0.96 | -1.12 | -0.16 | 1.49 | 1.68 | +0.19 |
| 10-2 | RE | — | -0.51 | — | — | 0.98 | — |
| 10-2 | LE | -0.89 | -0.52 | +0.37 | 1.34 | 1.19 | -0.15 |
Patient's mean Δ MD: +0.05 dB | Patient's mean Δ PSD: -0.06 dB.
Table 16.
Patient 9 pre and post-injection MD and PSD mean Δ values.
| Protocol | Eye | MD Pre | MD Post | Δ MD | PSD Pre | PSD Post | Δ PSD |
|---|---|---|---|---|---|---|---|
| 24-2 | RE | -22.76 | -6.41 | +16.35 | 11.18 | 8.38 | -2.80 |
| 24-2 | LE | -21.44 | -15.78 | +5.66 | 12.08 | 12.28 | +0.20 |
| 10-2 | RE | — | — | — | — | — | — |
| 10-2 | LE | — | — | — | — | — | — |
Patient's mean Δ MD: +11.01 dB | Patient's mean Δ PSD: -1.3 dB.
Table 17.
Patient 10 pre and post-injection MD and PSD mean Δ values.
| Protocol | Eye | MD Pre | MD Post | Δ MD | PSD Pre | PSD Post | Δ PSD |
|---|---|---|---|---|---|---|---|
| 24-2 | RE | -30.66 | -28.11 | +2.55 | 6.45 | 9.61 | +3.16 |
| 24-2 | LE | -30.56 | -29.36 | +1.20 | 7.00 | 7.80 | +0.80 |
| 10-2 | RE | -20.52 | -17.04 | +3.48 | 10.77 | 7.10 | -3.67 |
| 10-2 | LE | -23.73 | -18.01 | +5.72 | 10.60 | 7.36 | -3.24 |
Patient's mean Δ MD: +3.24 dB | Patient's mean Δ PSD: -0.74 dB.
Table 18.
MD Index (Mean Deviation).
| Measure | Pre-injection | Post-injection | Mean Δ |
|---|---|---|---|
| Mean dB (SD) — n=35 | -20.86 (±8.87) | -19.09 (±9.47) | +1.77 |
- Paired t-test: t = -2.8098, p = 0.0082 → difference statistically significant (p < 0.05).
- Wilcoxon signed-rank test: W = 140, p = 0.0042 → difference statistically significant (p < 0.05).
Table 19.
PSD Index (Pattern Standard Deviation).
| Measure | Pre-application | Post-application | Mean Δ |
|---|---|---|---|
| Mean dB (SD) — n=35 | 7.85 (±3.63) | 7.93 (±3.56) | +0.08 |
Table 20.
Comparative Summary Across Parameters.
| Parameter | n (eyes) | Mean Δ | Wilcoxon (p) | Paired t (p) | Significance |
|---|---|---|---|---|---|
| BCVA (logMAR) | 20 | -0.109 | 0.0904 | 0.1003 | No |
| IOP (mmHg) | 20 | +0.5 | 0.3343 | 0.3092 | No |
| OCT (µm) | 20 | +49 | 0.0313 | 0.0619 | Yes (Wilcoxon) |
| VF — MD (dB) | 35 | +1.77 | 0.0042 | 0.0082 | Yes |
| VF — PSD (dB) | 35 | +0.08 | 0.4561 | 0.7883 | No |
3.4. ERG Statistical Analysis Results
A coefficient of variation (CV) of 30% was assumed for test-retest variability in the same patient over a 30-day interval — meaning a difference between two measurements of up to 30% of the baseline value may occur due to inherent variability of the exam (electrode positioning, adaptation, patient cooperation), even without any real clinical change.
Criterion applied: a pre-to-post change was only classified as a "trend toward improvement" or "trend toward decline" when |Δ%| > 30%. Changes of up to 30% were classified as "stable", since they fall within the expected noise range of the method itself.
Direction: for amplitude parameters (µV), an increase = improvement; for latency parameters (ms), a decrease = improvement.
This analysis is exploratory: the 30% figure was assumed as a premise, not derived from published data for this specific equipment/protocol.
Even without the 30% adjustment, none of the 8 parameters showed a statistically significant difference between pre- and post-treatment at the group level (paired t-test and Wilcoxon, all p > 0.05 for the t-test; Flicker 30Hz – P1 showed p = 0.020 in the Wilcoxon test, not confirmed by the t-test). Applying the 30% criterion, the average magnitude of group change remains small relative to the expected exam variability — reinforcing that there is no evidence of a consistent treatment effect at the group level (Table 21).
Count of parameters (out of 8) classified as trend toward improvement, trend toward decline, or stable within 30% (Table 22).
4. Discussion
This prospective, open-label, single-arm exploratory study evaluated the short-term structural, functional, electrophysiological, and safety outcomes following suprachoroidal administration of Wharton’s jelly-derived mesenchymal stromal cells (WJ-MSCs) in patients with inherited retinal diseases (IRDs). The principal findings were a statistically significant improvement in visual-field mean deviation (MD) in the paired analyses, a statistically significant increase in central foveal thickness (CFT) detected by the Wilcoxon test but not by the paired Student’s t-test, no statistically significant group-level improvement in best-corrected visual acuity (BCVA), stable pattern standard deviation (PSD) and intraocular pressure (IOP), and heterogeneous electrophysiological responses without consistent group-level ERG improvement. These findings should be interpreted as preliminary because of the small sample size, absence of an untreated control group, heterogeneous diagnoses, short follow-up, mixed visual-field protocols, and potential correlation between measurements obtained from both eyes of the same participant [3,14,16,19].
4.1. Visual Acuity
Mean BCVA improved by 0.109 logMAR from baseline to day 45, but this change did not reach statistical significance in either the paired Student’s t-test or the Wilcoxon signed-rank test. The magnitude of the observed change was comparable to the pooled improvement of approximately 0.12 logMAR reported at 6 months in patients with retinitis pigmentosa receiving cell-based therapy. However, direct comparison is limited by substantial differences in follow-up duration, study design, cell source, administration route, patient characteristics, and outcome assessment [3,14,16,19,20].
The absence of statistical significance in the present study may be related to the small sample size and considerable baseline variability. In addition, the conversion of counting-fingers visual acuity to 2.0 logMAR may have influenced the magnitude and distribution of the observed changes. Although this conversion permits exploratory statistical analysis, it does not provide the same measurement properties as standardized ETDRS letter scores. Future controlled studies should therefore use standardized ETDRS-based visual-acuity assessment and validated approaches for very low visual acuity.
The BCVA findings consequently do not provide evidence of a statistically demonstrable treatment-related improvement at 45 days. Nevertheless, the numerical direction of change warrants further investigation in larger studies with longer follow-up and more precise visual-acuity measurement.
4.2. Visual-Field Mean Deviation
The principal functional finding was an improvement in visual-field MD from −20.86 ± 8.87 dB at baseline to −19.09 ± 9.47 dB at day 45, corresponding to a mean change of approximately +1.77 dB. This difference was statistically significant in both the paired Student’s t-test and the Wilcoxon signed-rank test. Visual-field MD may provide complementary information to BCVA in IRDs because it reflects global visual-field sensitivity and may capture functional changes that are not adequately represented by central visual acuity [1,2].
However, the statistical significance of this finding should not be equated with proof of treatment efficacy. Automated perimetry is susceptible to learning effects, fatigue, fixation instability, attention, response bias, and other sources of short-term variability [1,2]. These effects may be particularly relevant when measurements are obtained only at baseline and 45 days without repeated pretreatment examinations.
An additional methodological limitation is that both 24-2 and 10-2 visual-field protocols were included in the dataset. Although both provide quantitative measures of visual sensitivity, they sample different retinal regions and should not be considered fully interchangeable. The use of mixed protocols therefore limits the interpretation of a pooled MD analysis. Future trials should prespecify a single perimetric protocol as the primary functional endpoint, preferably with repeated baseline examinations to establish individual test–retest stability.
The individual response of Patient 9 also requires particular consideration. This participant demonstrated a marked improvement in MD of approximately +11.01 dB but simultaneously exhibited substantial increases in CFT and predominantly declining ERG parameters. Because these findings are discordant, the improvement in MD should not automatically be interpreted as evidence of a biological treatment response. Changes in fixation, perimetric reliability, retinal morphology, or localized pathology may have contributed to the observed change. Patient 9 was retained in the primary analysis because post hoc exclusion of an extreme observation could introduce selection bias. Nevertheless, sensitivity analyses excluding this influential observation would be informative in future analyses.
Importantly, the present study included both eyes of each participant. Measurements from fellow eyes are biologically and statistically correlated, and therefore treating each eye as an independent observation may underestimate uncertainty. Although the paired analyses account for the pre- versus post-treatment structure, they do not fully address the hierarchical nature of two eyes nested within the same participant. Confirmatory studies should therefore use patient-level mixed-effects models, with participant included as a random effect and eye-level observations appropriately modeled.
4.3. Pattern Standard Deviation
PSD remained essentially stable, with a mean change of approximately +0.08 dB. Thus, the observed improvement in MD was not accompanied by a corresponding measurable change in localized visual-field irregularity.
The divergence between MD and PSD may be compatible with a generalized change in visual-field sensitivity rather than restoration of focal visual-field defects. However, this interpretation remains uncertain because both parameters are influenced by perimetric variability and by the characteristics of the visual-field protocol used. Pointwise visual-field analysis, regional sensitivity analysis, and longitudinal progression modeling may provide additional information in future controlled studies.
Accordingly, the stability of PSD should be considered a neutral finding rather than evidence either for or against retinal functional recovery.
4.4. Optical Coherence Tomography
Mean CFT increased from 226.8 ± 108.2 μm at baseline to 275.8 ± 178.4 μm at day 45. The difference reached statistical significance in the Wilcoxon signed-rank analysis (p = 0.0313), whereas the paired Student’s t-test did not demonstrate statistical significance (p = 0.0619). The discrepancy between the two statistical approaches suggests that the result may be sensitive to the distribution of the observations and to individual extreme values.
Patient 9 contributed substantially to this finding, with CFT increasing from 406 to 836 μm in the right eye and from 511 to 681 μm in the left eye. This marked structural change was retained in the primary analysis to avoid post hoc exclusion bias. However, it substantially affects the interpretation of the group-level result and illustrates the importance of patient-level OCT assessment in small exploratory studies.
An increase in CFT should not be interpreted as evidence of retinal regeneration. Increased retinal thickness may result from several mechanisms, including intraretinal fluid, cystoid changes, inflammatory thickening, epiretinal proliferation, vitreomacular traction, or segmentation artifacts. Qualitative assessment of the OCT images, including evaluation of retinal layers, fluid compartments, and segmentation accuracy, is therefore necessary before attributing an increase in CFT to a biological effect of cell therapy.
The discordance between the CFT increase in Patient 9 and the predominantly declining ERG pattern in the same participant further supports a cautious interpretation. In future studies, quantitative CFT should be complemented by predefined qualitative OCT grading and layer-specific structural endpoints, particularly measures of outer retinal integrity and photoreceptor-related biomarkers.
4.5. ERG Findings
At the group level, none of the eight analyzed ERG parameters demonstrated a statistically significant difference in the paired Student’s t-test. The Wilcoxon signed-rank test identified a statistically significant difference only in 30-Hz flicker P1 latency (p = 0.0195), which was not confirmed by the paired t-test [14,16,19,20]. Therefore, the present electrophysiological data do not demonstrate consistent group-level improvement in retinal function at 45 days.
This finding is compatible with the heterogeneous electrophysiological responses reported in the limited clinical literature on cell-based approaches for retinal degeneration. Functional outcomes following cell therapy have varied across studies, and electrophysiological endpoints have not consistently demonstrated improvement. Differences in disease stage, cell source, administration route, dose, follow-up duration, and electrophysiological methodology make direct comparisons difficult [3,14,16,19,20].
The exploratory patient-level analysis based on a 30% change threshold revealed substantial heterogeneity. Patient 10 demonstrated improvement trends in 7 of 8 ERG parameters, whereas Patient 4 showed decline trends in 6 of 8 parameters and Patient 9 showed predominantly declining electrophysiological patterns. These observations indicate that group-level averages may obscure heterogeneous individual trajectories. However, the 30% threshold used in this study was assumed rather than empirically validated for the RETIport system, the specific laboratory, and the testing protocol. It should therefore be regarded exclusively as a hypothesis-generating classification and not as a validated minimally clinically important difference [14,16,19,20].
The interpretation of ERG responses also requires consideration of the directionality of individual parameters. In general, increased amplitude and decreased latency may be directionally compatible with improved retinal electrophysiological function. Nevertheless, a change in an isolated ERG component cannot establish global retinal recovery when other components remain unchanged or deteriorate [2,12].
Furthermore, eight electrophysiological parameters were evaluated, together with several structural and functional endpoints. Because multiple exploratory comparisons were performed without formal adjustment for multiplicity, an isolated nominal p-value should be interpreted cautiously. In particular, the 30-Hz flicker P1 latency result should be considered hypothesis-generating rather than confirmatory.
Repeated baseline ERG examinations, standardized acquisition conditions, and a dedicated test–retest reproducibility study are therefore important methodological priorities for future trials.
4.6. Comparison with Previous WJ-MSC Studies
Preclinical studies provide a biological rationale for investigating WJ-MSCs in retinal degeneration. In an RCS rat model, subretinal administration of human WJ-MSCs was associated with preservation of retinal structure and absence of tumor formation during the study period, with electrophysiological outcomes also evaluated over time. These findings support further investigation of WJ-MSCs but cannot be directly extrapolated to the present human study because of differences in species, disease model, administration route, cell dose, and timing of assessment [13].
Clinical studies using WJ-MSCs administered through the sub-Tenon route have reported preliminary changes in visual function and generally favorable short-term safety profiles. However, differences in administration route, cell preparation, culture conditions, dosing, patient selection, and outcome definitions prevent direct quantitative comparison with the present suprachoroidal approach [14,15,16,17,19,20].
A systematic review and meta-analysis of 21 prospective studies involving 382 patients and 496 eyes reported early visual-acuity improvement after cell-based therapy in RP and Stargardt disease. In RP, approximately 49% of eyes demonstrated visual-acuity improvement at 6 months, decreasing to approximately 30% at 12 months, while the pooled visual-acuity improvement at 6 months was approximately 0.12 logMAR. The analysis also identified suprachoroidal administration as a potentially relevant route for RP, although the evidence was limited and randomized controlled trials were lacking [3].
The present study differs from these previous investigations by specifically evaluating a suprachoroidal WJ-MSC approach and by incorporating visual-field testing, OCT, and ERG in addition to BCVA. These multimodal assessments may provide a broader characterization of short-term functional and structural changes. Nevertheless, the absence of a control group and the short 45-day follow-up prevent determination of whether the observed changes are attributable to the intervention rather than to measurement variability, natural fluctuation, or other confounding factors.
4.7. Safety and Targeted Delivery
No ocular inflammatory or infectious signs were observed during the 45-day follow-up, and no clinically significant treatment-related IOP events were identified. These observations indicate that the procedure was feasible and was not associated with major ocular safety events during the observation period [14,15,16,17,19,20].
However, a 45-day follow-up period is insufficient to characterize delayed complications associated with cellular therapies or the suprachoroidal route. Potential longer-term events may include persistent inflammation, epiretinal membrane formation, proliferative vitreoretinopathy, retinal detachment, choroidal neovascularization, abnormal tissue proliferation, or delayed immune reactions [7,9,19,20]. Accordingly, the present findings should be described as evidence of short-term procedural feasibility rather than definitive evidence of long-term safety.
The suprachoroidal route may represent a biologically attractive alternative between intravitreal and subretinal administration. It potentially permits exposure of the choroid, retinal pigment epithelium, and outer retina while avoiding direct penetration of the retinal tissue [2,6,7,18]. Nevertheless, the actual distribution, persistence, survival, and biological activity of WJ-MSCs following suprachoroidal administration remain incompletely characterized [2,6,7,18,21].
Consequently, the present clinical observations provide an initial basis for further investigation of this delivery route but do not establish the biological mechanism responsible for the observed functional changes.
4.8. Strengths and Limitations
Several aspects strengthen the exploratory value of this study. These include its prospective design, standardized 45-day follow-up, genetic and multimodal confirmation of the retinal diagnoses, use of a defined WJ-MSC product, standardized suprachoroidal administration, multimodal outcome assessment, inclusion of visual-field and ERG endpoints, systematic safety monitoring, and retention of Patient 9 in the primary analysis despite its marked individual structural and functional changes.
The study nevertheless has important limitations. The sample size was small, there was no untreated or sham-controlled comparison group, and the cohort included heterogeneous inherited retinal disorders. Follow-up was limited to 45 days, preventing assessment of durability and delayed adverse events. Both eyes were analyzed, creating potential within-patient correlation that is not fully addressed by conventional paired tests. The visual-field dataset included both 24-2 and 10-2 protocols, limiting direct comparability of MD measurements. Missing visual-field observations further reduced the effective sample size for this endpoint.
Additional limitations include the conversion of counting-fingers acuity to 2.0 logMAR, which may introduce measurement distortion; the absence of repeated pretreatment ERG and visual-field examinations; the lack of a validated ERG test–retest threshold; and the evaluation of multiple exploratory endpoints without correction for multiplicity.
The 30% ERG threshold was not derived from a dedicated reproducibility study of the RETIport device, the laboratory, or the exact acquisition protocol. Its use was therefore exploratory and should not be interpreted as evidence of clinically meaningful electrophysiological improvement.
Patient 9 deserves particular attention because of its substantial CFT increase and marked improvement in MD accompanied by predominantly declining ERG parameters. Retaining this participant in the primary analysis was methodologically appropriate because exclusion based on post-treatment observations could introduce selection bias. Nevertheless, the influence of this participant indicates the need for prespecified sensitivity analyses and patient-level modeling in future studies.
Finally, the absence of a control group is particularly important when interpreting the statistically significant MD finding. Without an untreated comparator and repeated baseline measurements, it is not possible to distinguish a potential treatment-related effect from learning effects, measurement variability, regression to the mean, or other temporal changes.
4.9. Implications for Future Research
The findings of this preliminary study provide several methodological considerations for future investigations. Controlled prospective or randomized studies with larger sample sizes and disease-specific stratification will be necessary to determine whether the observed functional changes are reproducible and treatment-related.
Future protocols should prespecify standardized cell-product characteristics, including dose, viability, manufacturing and release criteria, together with detailed documentation of cell identity and preparation. Repeated baseline assessments of visual fields and ERG should be incorporated to establish individual test–retest variability before treatment.
A single prespecified visual-field protocol should be used as the primary functional endpoint, and analyses should account explicitly for the correlation between fellow eyes using patient-level mixed-effects models. OCT assessment should combine quantitative thickness measurements with predefined qualitative grading of retinal morphology. ERG endpoints should be supported by dedicated reproducibility studies and validated thresholds for clinically meaningful change.
Longer follow-up is also necessary to determine the persistence of functional changes and to monitor delayed structural or inflammatory complications. Patient-reported visual-function outcomes may provide complementary information regarding clinically meaningful changes that are not fully captured by BCVA, visual-field indices, OCT, or ERG.
Finally, future studies should prespecify primary and secondary endpoints and apply appropriate methods for controlling multiplicity when multiple exploratory comparisons are performed.
Overall, the present findings should be interpreted as preliminary evidence regarding the feasibility of suprachoroidal WJ-MSC administration and as a basis for hypothesis generation. The observed improvement in visual-field MD is of interest and warrants confirmation, but it should not be interpreted in isolation as evidence of treatment efficacy. The heterogeneous electrophysiological responses, the CFT increase observed in one participant, and the methodological limitations of the current study underscore the need for adequately powered controlled trials with standardized functional endpoints, patient-level statistical modeling, validated ERG reproducibility criteria, and longer follow-up.
5. Conclusions
These preliminary findings indicate that suprachoroidal administration of WJ-MSCs was feasible and was not associated with major ocular safety events during 45 days of follow-up. The observed improvement in visual-field mean deviation warrants further investigation but should be interpreted cautiously given the single-arm design, small sample size, heterogeneous diagnoses, mixed perimetric protocols, and potential inter-eye correlation. Larger controlled studies with standardized functional endpoints and longer follow-up are required to determine whether these findings represent a treatment-related biological and functional effect. The study support further controlled investigation of the suprachoroidal route as a targeted strategy for inherited retinal diseases.
Author Contributions
All authors: P.D.S., T.R., M.V.R., B.V.C., C.E.C.J., A.d.J.Q., T.C.M.S., A.R.C, L.L., A.A.P.M., S.F.S and E.P.A. , make substantial contributions to the conception of the work and for the acquisition, analysis, or interpretation of data for the work; They reviewed it critically for important intellectual content; Provide final approval of the version to be published; Agree to be accountable for all aspects of the work by ensuring that questions relating to the accuracy or integrity of any part of the work are appropriately investigated and resolved. All authors have read and agreed to the published version of the manuscript.
Funding
This research received no external funding.
Institutional Review Board Statement
The study was conducted in accordance with the Declaration of Helsinki. The protocol was approved by the Research Ethics Committee of University of Santo Amaro (UNISA), São Paulo, Brazil, under CAAE 97710926200000081.
Informed Consent Statement
Written informed consent was obtained from all participants using the standardized informed consent form approved by the UNISA Research Ethics Committee.
Consent for Publication
Written informed consent for publication of potentially identifiable information was obtained from all participants.
Data Availability Statement
Study data can be accessed at pds.oftalmologia@gmail.com .
Conflicts of Interest
The authors declare no conflicts of interest.
Abbreviations
The following abbreviations are used in this manuscript:
| BCVA: | best-corrected visual acuity |
| CFT: | central foveal thickness |
| CF: | counting fingers |
| ERG: | electroretinography |
| hWJ-MSC: | human Wharton’s jelly-derived mesenchymal stem cell |
| IOP: | intraocular pressure |
| IRD: | inherited retinal disease |
| logMAR: | logarithm of the minimum angle of resolution |
| MD: | mean deviation |
| MSC: | mesenchymal stem/stromal cell |
| N1–P1: | flicker amplitude |
| OCT: | optical coherence tomography |
| PSD: | pattern standard deviation |
| RPE: | retinal pigment epithelium |
| RP: | retinitis pigmentosa |
| WJ-MSC: | Wharton’s jelly-derived mesenchymal stem cell |
| UNISA: | Universidade Santo Amaro |
Appendix A
Appendix A.1. Parameter Classification Matrix (All Patients)
| Patient | Scotopic 0.01 – B latency (ms) | Scotopic 0.01 – B amplitude (µV) | Photopic 3.0 – A latency (ms) | Photopic 3.0 – B latency (ms) | Photopic 3.0 – A amplitude (µV) | Photopic 3.0 – B amplitude (µV) | Flicker 30 Hz – P1 (ms) | Flicker 30 Hz – N1-P1 (µV) |
| Patient 10 | Trend toward improvement | Trend toward improvement | Trend toward improvement | Trend toward improvement | Trend toward improvement | Trend toward improvement | Stable (within 30%) | Trend toward improvement |
| Patient 1 | Stable (within 30%) | Stable (within 30%) | Trend toward improvement | Stable (within 30%) | Trend toward improvement | Trend toward improvement | Stable (within 30%) | Trend toward decline |
| Patient 6 | Stable (within 30%) | Trend toward improvement | Trend toward improvement | Trend toward improvement | Trend toward decline | Trend toward decline | Trend toward decline | Trend toward improvement |
| Patient 8 | Trend toward decline | Trend toward improvement | Stable (within 30%) | Stable (within 30%) | Trend toward improvement | Trend toward improvement | Stable (within 30%) | Trend toward improvement |
| Patient 3 | Stable (within 30%) | Stable (within 30%) | Stable (within 30%) | Stable (within 30%) | Trend toward decline | Stable (within 30%) | Stable (within 30%) | Trend toward improvement |
| Patient 5 | Trend toward improvement | Stable (within 30%) | Trend toward decline | Trend toward decline | Trend toward improvement | Trend toward improvement | Stable (within 30%) | Trend toward decline |
| Patient 7 | Stable (within 30%) | Stable (within 30%) | Stable (within 30%) | Stable (within 30%) | Stable (within 30%) | Stable (within 30%) | Stable (within 30%) | Stable (within 30%) |
| Patient 4 | Trend toward improvement | Trend toward decline | Stable (within 30%) | Trend toward decline | Trend toward decline | Trend toward decline | Trend toward decline | Trend toward decline |
| Patient 2 | Stable (within 30%) | Trend toward decline | Stable (within 30%) | Stable (within 30%) | Stable (within 30%) | Stable (within 30%) | Stable (within 30%) | Stable (within 30%) |
| Patient 9 | Stable (within 30%) | Trend toward decline | Stable (within 30%) | Stable (within 30%) | Stable (within 30%) | Trend toward decline | Stable (within 30%) | Trend toward decline |
Appendix B
Appendix B.1. Detailed Pre/Post Values by Patient
Patient 10. (Pre-injection → Post-injection).
| Parameter | Pre | Post | Δ | Δ% | Beyond 30%? |
| Scotopic 0.01 – B latency (ms) | 78.4 | 29.65 | -48.75 | -62.2% | Yes |
| Scotopic 0.01 – B amplitude (µV) | 9.8 | 35.8 | 26.0 | 265.3% | Yes |
| Photopic 3.0 – A latency (ms) | 21.6 | 14.35 | -7.25 | -33.6% | Yes |
| Photopic 3.0 – B latency (ms) | 48.15 | 23.35 | -24.8 | -51.5% | Yes |
| Photopic 3.0 – A amplitude (µV) | 3.16 | 32.85 | 29.69 | 940.4% | Yes |
| Photopic 3.0 – B amplitude (µV) | 19.05 | 45.1 | 26.05 | 136.7% | Yes |
| Flicker 30 Hz – P1 (ms) | 47.25 | 48.6 | 1.35 | 2.9% | No |
| Flicker 30 Hz – N1-P1 (µV) | 7.0 | 12.0 | 5.0 | 71.4% | Yes |
Patient 1. (Pre-injection → Post-injection).
| Parameter | Pre | Post | Δ | Δ% | Beyond 30%? |
| Scotopic 0.01 – B latency (ms) | 51.4 | 62.05 | 10.65 | 20.7% | No |
| Scotopic 0.01 – B amplitude (µV) | 10.45 | 9.7 | -0.75 | -7.2% | No |
| Photopic 3.0 – A latency (ms) | 19.1 | 10.45 | -8.65 | -45.3% | Yes |
| Photopic 3.0 – B latency (ms) | 39.5 | 49.9 | 10.4 | 26.3% | No |
| Photopic 3.0 – A amplitude (µV) | 10.3 | 14.6 | 4.3 | 41.7% | Yes |
| Photopic 3.0 – B amplitude (µV) | 8.45 | 56.9 | 48.45 | 573.4% | Yes |
| Flicker 30 Hz – P1 (ms) | 46.95 | 56.8 | 9.85 | 21.0% | No |
| Flicker 30 Hz – N1-P1 (µV) | 8.05 | 3.25 | -4.8 | -59.6% | Yes |
Patient 6. (Pre-injection → Post-injection).
| Parameter | Pre | Post | Δ | Δ% | Beyond 30%? |
| Scotopic 0.01 – B latency (ms) | 61.8 | 79.85 | 18.05 | 29.2% | No |
| Scotopic 0.01 – B amplitude (µV) | 13.05 | 18.65 | 5.6 | 42.9% | Yes |
| Photopic 3.0 – A latency (ms) | 17.35 | 9.1 | -8.25 | -47.6% | Yes |
| Photopic 3.0 – B latency (ms) | 40.35 | 16.45 | -23.9 | -59.2% | Yes |
| Photopic 3.0 – A amplitude (µV) | 13.95 | 9.15 | -4.8 | -34.4% | Yes |
| Photopic 3.0 – B amplitude (µV) | 15.2 | 2.05 | -13.15 | -86.5% | Yes |
| Flicker 30 Hz – P1 (ms) | 46.8 | 66.75 | 19.95 | 42.6% | Yes |
| Flicker 30 Hz – N1-P1 (µV) | 4.5 | 13.75 | 9.25 | 205.6% | Yes |
Patient 8. (Pre-injection → Post-injection).
| Parameter | Pre | Post | Δ | Δ% | Beyond 30%? |
| Scotopic 0.01 – B latency (ms) | 34.35 | 69.15 | 34.8 | 101.3% | Yes |
| Scotopic 0.01 – B amplitude (µV) | 2.44 | 15.9 | 13.46 | 550.9% | Yes |
| Photopic 3.0 – A latency (ms) | 10.45 | 10.7 | 0.25 | 2.4% | No |
| Photopic 3.0 – B latency (ms) | 49.6 | 49.9 | 0.3 | 0.6% | No |
| Photopic 3.0 – A amplitude (µV) | 3.67 | 11.5 | 7.83 | 213.4% | Yes |
| Photopic 3.0 – B amplitude (µV) | 10.75 | 39.25 | 28.5 | 265.1% | Yes |
| Flicker 30 Hz – P1 (ms) | 58.6 | 66.05 | 7.45 | 12.7% | No |
| Flicker 30 Hz – N1-P1 (µV) | 3.35 | 4.85 | 1.5 | 44.8% | Yes |
Patient 3. (Pre-injection → Post-injection).
| Parameter | Pre | Post | Δ | Δ% | Beyond 30%? |
| Scotopic 0.01 – B latency (ms) | 84.85 | 99.65 | 14.8 | 17.4% | No |
| Scotopic 0.01 – B amplitude (µV) | 78.15 | 68.9 | -9.25 | -11.8% | No |
| Photopic 3.0 – A latency (ms) | 14.5 | 17.15 | 2.65 | 18.3% | No |
| Photopic 3.0 – B latency (ms) | 33.05 | 32.45 | -0.6 | -1.8% | No |
| Photopic 3.0 – A amplitude (µV) | 26.4 | 9.4 | -17.0 | -64.4% | Yes |
| Photopic 3.0 – B amplitude (µV) | 79.8 | 88.2 | 8.4 | 10.5% | No |
| Flicker 30 Hz – P1 (ms) | 66.9 | 67.2 | 0.3 | 0.4% | No |
| Flicker 30 Hz – N1-P1 (µV) | 53.35 | 72.45 | 19.1 | 35.8% | Yes |
Patient 5. (Pre-injection → Post-injection).
| Parameter | Pre | Post | Δ | Δ% | Beyond 30%? |
| Scotopic 0.01 – B latency (ms) | 84.85 | 35.8 | -49.05 | -57.8% | Yes |
| Scotopic 0.01 – B amplitude (µV) | 14.6 | 12.65 | -1.95 | -13.4% | No |
| Photopic 3.0 – A latency (ms) | 9.25 | 14.95 | 5.7 | 61.6% | Yes |
| Photopic 3.0 – B latency (ms) | 16.0 | 51.1 | 35.1 | 219.4% | Yes |
| Photopic 3.0 – A amplitude (µV) | 4.15 | 11.55 | 7.4 | 178.3% | Yes |
| Photopic 3.0 – B amplitude (µV) | 4.6 | 21.0 | 16.4 | 356.5% | Yes |
| Flicker 30 Hz – P1 (ms) | 59.6 | 67.1 | 7.5 | 12.6% | No |
| Flicker 30 Hz – N1-P1 (µV) | 20.05 | 3.0 | -17.05 | -85.0% | Yes |
Patient 7 (Pre-injection → Post-injection)
| Parameter | Pre | Post | Δ | Δ% | Beyond 30%? |
| Scotopic 0.01 – B latency (ms) | 99.8 | 90.55 | -9.25 | -9.3% | No |
| Scotopic 0.01 – B amplitude (µV) | 50.0 | 55.65 | 5.65 | 11.3% | No |
| Photopic 3.0 – A latency (ms) | 14.85 | 16.1 | 1.25 | 8.4% | No |
| Photopic 3.0 – B latency (ms) | 31.25 | 31.4 | 0.15 | 0.5% | No |
| Photopic 3.0 – A amplitude (µV) | 37.95 | 30.3 | -7.65 | -20.2% | No |
| Photopic 3.0 – B amplitude (µV) | 99.0 | 70.95 | -28.05 | -28.3% | No |
| Flicker 30 Hz – P1 (ms) | 63.4 | 63.0 | -0.4 | -0.6% | No |
| Flicker 30 Hz – N1-P1 (µV) | 78.8 | 57.0 | -21.8 | -27.7% | No |
Patient 4 (Pre-injection → Post-injection)
| Parameter | Pre | Post | Δ | Δ% | Beyond 30%? |
| Scotopic 0.01 – B latency (ms) | 94.35 | 49.35 | -45.0 | -47.7% | Yes |
| Scotopic 0.01 – B amplitude (µV) | 193.0 | 34.9 | -158.1 | -81.9% | Yes |
| Photopic 3.0 – A latency (ms) | 14.25 | 14.85 | 0.6 | 4.2% | No |
| Photopic 3.0 – B latency (ms) | 30.2 | 44.2 | 14.0 | 46.4% | Yes |
| Photopic 3.0 – A amplitude (µV) | 42.75 | 9.8 | -32.95 | -77.1% | Yes |
| Photopic 3.0 – B amplitude (µV) | 186.5 | 42.45 | -144.05 | -77.2% | Yes |
| Flicker 30 Hz – P1 (ms) | 25.8 | 68.4 | 42.6 | 165.1% | Yes |
| Flicker 30 Hz – N1-P1 (µV) | 112.9 | 19.8 | -93.1 | -82.5% | Yes |
Patient 2 (Pre-injection → Post-injection)
| Parameter | Pre | Post | Δ | Δ% | Beyond 30%? |
| Scotopic 0.01 – B latency (ms) | 77.5 | 71.6 | -5.9 | -7.6% | No |
| Scotopic 0.01 – B amplitude (µV) | 140.0 | 91.15 | -48.85 | -34.9% | Yes |
| Photopic 3.0 – A latency (ms) | 12.9 | 15.3 | 2.4 | 18.6% | No |
| Photopic 3.0 – B latency (ms) | 30.5 | 31.25 | 0.75 | 2.5% | No |
| Photopic 3.0 – A amplitude (µV) | 23.2 | 24.9 | 1.7 | 7.3% | No |
| Photopic 3.0 – B amplitude (µV) | 93.65 | 75.5 | -18.15 | -19.4% | No |
| Flicker 30 Hz – P1 (ms) | 62.95 | 61.9 | -1.05 | -1.7% | No |
| Flicker 30 Hz – N1-P1 (µV) | 101.4 | 83.55 | -17.85 | -17.6% | No |
Patient 9 (Pre-injection→ Post-injection)
| Parameter | Pre | Post | Δ | Δ% | Beyond 30%? |
| Scotopic 0.01 – B latency (ms) | 83.2 | 87.2 | 4.0 | 4.8% | No |
| Scotopic 0.01 – B amplitude (µV) | 196.5 | 96.75 | -99.75 | -50.8% | Yes |
| Photopic 3.0 – A latency (ms) | 13.05 | 15.25 | 2.2 | 16.9% | No |
| Photopic 3.0 – B latency (ms) | 31.85 | 32.15 | 0.3 | 0.9% | No |
| Photopic 3.0 – A amplitude (µV) | 50.5 | 46.85 | -3.65 | -7.2% | No |
| Photopic 3.0 – B amplitude (µV) | 182.9 | 105.2 | -77.7 | -42.5% | Yes |
| Flicker 30 Hz – P1 (ms) | 63.1 | 64.75 | 1.65 | 2.6% | No |
| Flicker 30 Hz – N1-P1 (µV) | 115.25 | 74.75 | -40.5 | -35.1% | Yes |
References
- Adak, S.; Magdalene, D.; Deshmukh, S.; Das, D.; Jaganathan, B.G. A review on mesenchymal stem cells for treatment of retinal diseases. Stem Cell Rev. Rep. 2021, 17(4), 1154–1173. [Google Scholar] [CrossRef] [PubMed]
- Puertas-Neyra, K.; Usategui-Martín, R.; Coco, R.M.; Fernandez-Bueno, I. Intravitreal stem cell paracrine properties as a potential neuroprotective therapy for retinal photoreceptor neurodegenerative diseases. Neural Regen. Res. 2020, 15(9), 1631–1638. [Google Scholar] [CrossRef] [PubMed]
- Chen, X.; Xu, N.; Li, J.; Zhao, M.; et al. Stem cell therapy for inherited retinal diseases: A systematic review and meta-analysis. Stem Cell Res. Ther. 2023, 14, 286. [Google Scholar] [CrossRef] [PubMed]
- Siqueira, R.C.; Messias, A.; Voltarelli, J.C.; Scott, I.U.; Jorge, R. Intravitreal injection of autologous bone marrow-derived mononuclear cells for hereditary retinal dystrophy: A phase I trial. Retina 2011, 31(6), 1207–1214. [Google Scholar] [CrossRef] [PubMed]
- Weiss, J.N.; Levy, S.; Malkin, A. Stem Cell Ophthalmology Treatment Study (SCOTS) for retinal and optic nerve diseases: A preliminary report. Neural Regen. Res. 2015, 10(6), 982–988. [Google Scholar] [CrossRef] [PubMed]
- Park, S.S.; Bauer, G.; Abedi, M.; Pontow, S.; Panorgias, A.; Jonnal, R.; et al. Intravitreal autologous bone marrow CD34+ cell therapy for ischemic and degenerative retinal disorders: Preliminary phase 1 clinical trial findings. Invest Ophthalmol. Vis. Sci. 2015, 56(1), 81–89. [Google Scholar] [CrossRef] [PubMed]
- Inoue, Y.; Iriyama, A.; Ueno, S.; Takahashi, H.; Kondo, M.; Tamaki, Y.; Araie, M.; Yanagi, Y. Subretinal transplantation of bone marrow mesenchymal stem cells delays retinal degeneration in the RCS rat model of retinal degeneration. Exp. Eye Res. 2007, 85(2), 234–241. [Google Scholar] [CrossRef] [PubMed]
- Kicic, A.; Shen, W.Y.; Wilson, A.S.; Constable, I.J.; Robertson, T.A.; Rakoczy, P.E. Differentiation of marrow stromal cells into photoreceptors in the rat eye. J. Neurosci. 2003, 23(21), 7742–7749. [Google Scholar] [CrossRef] [PubMed]
- Lu, B.; Malcuit, C.; Wang, S.; Girman, S.; Francis, P.; Lem, J.; et al. Long-term safety and function of human embryonic stem cell-derived cells in animal models of retinal disease. Stem Cells Transl. Med. 2012, 1(10), 720–731. [Google Scholar]
- Santos-Ferreira, T.; Llonch, S.; Borsch, O.; Postel, K.; Haas, J.; Ader, M. Retinal transplantation of photoreceptors derived from human induced pluripotent stem cells. Invest Ophthalmol. Vis. Sci. 2016, 57(6), 2687–2695. [Google Scholar]
- Johnson, T.V.; Bull, N.D.; Hunt, D.P.; Marina, N.; Tomarev, S.I.; Martin, K.R. Neuroprotective effects of intravitreal mesenchymal stem cells on retinal ganglion cells in experimental glaucoma. Invest Ophthalmol. Vis. Sci. 2010, 51(4), 2051–2059. [Google Scholar] [CrossRef] [PubMed]
- Mead, B.; Amaral, J.; Tomarev, S. Bone marrow-derived mesenchymal stem cell-derived exosomes promote survival of retinal ganglion cells through miRNA-dependent mechanisms. Stem Cells Transl. Med. 2017, 6(4), 1273–1285. [Google Scholar] [CrossRef] [PubMed]
- Leow, S.N.; Luu, C.D.; Hairul Nizam, M.; Mok, P.L.; Ruhaslizan, R.; Wong, H.S.; Halim, Wan Haslina Wan Abdul; Ng, M.H.; Ruszymah, B.H.I.; Chowdhury, S.R. Safety and efficacy of human Wharton’s jelly-derived mesenchymal stem cells therapy for retinal degeneration. PLoS ONE 2015, 10(6), e0128973. [Google Scholar] [CrossRef] [PubMed]
- Kahraman, N.S.; Oner, A. Umbilical cord derived mesenchymal stem cell implantation in retinitis pigmentosa: A 6-month follow-up results of a phase 3 trial. Int. J. Ophthalmol. 2020, 13(9), 1423–1429. [Google Scholar] [CrossRef] [PubMed]
- Özmert, E.; Arslan, U. Management of retinitis pigmentosa by Wharton’s jelly-derived mesenchymal stem cells: Preliminary clinical results. Stem Cell Res. Ther. 2020, 11, 25. [Google Scholar] [CrossRef] [PubMed]
- Özmert, E.; Arslan, U. Management of retinitis pigmentosa by Wharton’s jelly-derived mesenchymal stem cells: Prospective analysis of 1-year results. Stem Cell Res. Ther. 2020, 11, 353. [Google Scholar] [CrossRef] [PubMed]
- Özmert, E.; Arslan, U. Management of retinitis pigmentosa via Wharton’s jelly-derived mesenchymal stem cells or combination with Magnovision: 3-year prospective results. Stem Cells Transl. Med. 2023, 12(10), 631–650. [Google Scholar] [CrossRef] [PubMed]
- Arnhold, S.; Absenger, Y.; Klein, H.; Addicks, K.; Schraermeyer, U. Transplantation of bone marrow-derived mesenchymal stem cells into the subretinal space of rat eyes. Graefes Arch. Clin. Exp. Ophthalmol. 2007, 245(3), 414–422. [Google Scholar] [PubMed]
- Tuekprakhon, A.; Sangkitporn, S.; Trinavarat, A.; et al. Intravitreal autologous mesenchymal stem cell transplantation: A non-randomized phase I clinical trial in patients with retinitis pigmentosa. Stem Cell Res. Ther. 2021, 12, 52. [Google Scholar] [CrossRef] [PubMed]
- Wiącek, M.P.; Gosławski, W.; Grabowicz, A.; et al. Long-term effects of adjuvant intravitreal treatment with autologous bone marrow-derived lineage-negative cells in retinitis pigmentosa. Stem Cells Int. 2021, 2021, 6631921. [Google Scholar] [CrossRef] [PubMed]
- Otani, A.; Kinder, K.; Ewalt, K.; Otero, F.J.; Schimmel, P.; Friedlander, M. Bone marrow-derived stem cells target retinal astrocytes and can promote or inhibit retinal angiogenesis. Nat. Med. 2002, 8(9), 1004–1010. [Google Scholar] [CrossRef] [PubMed]
Figure 1.
Step-by-step assembly of the suprachoroidal injection device.
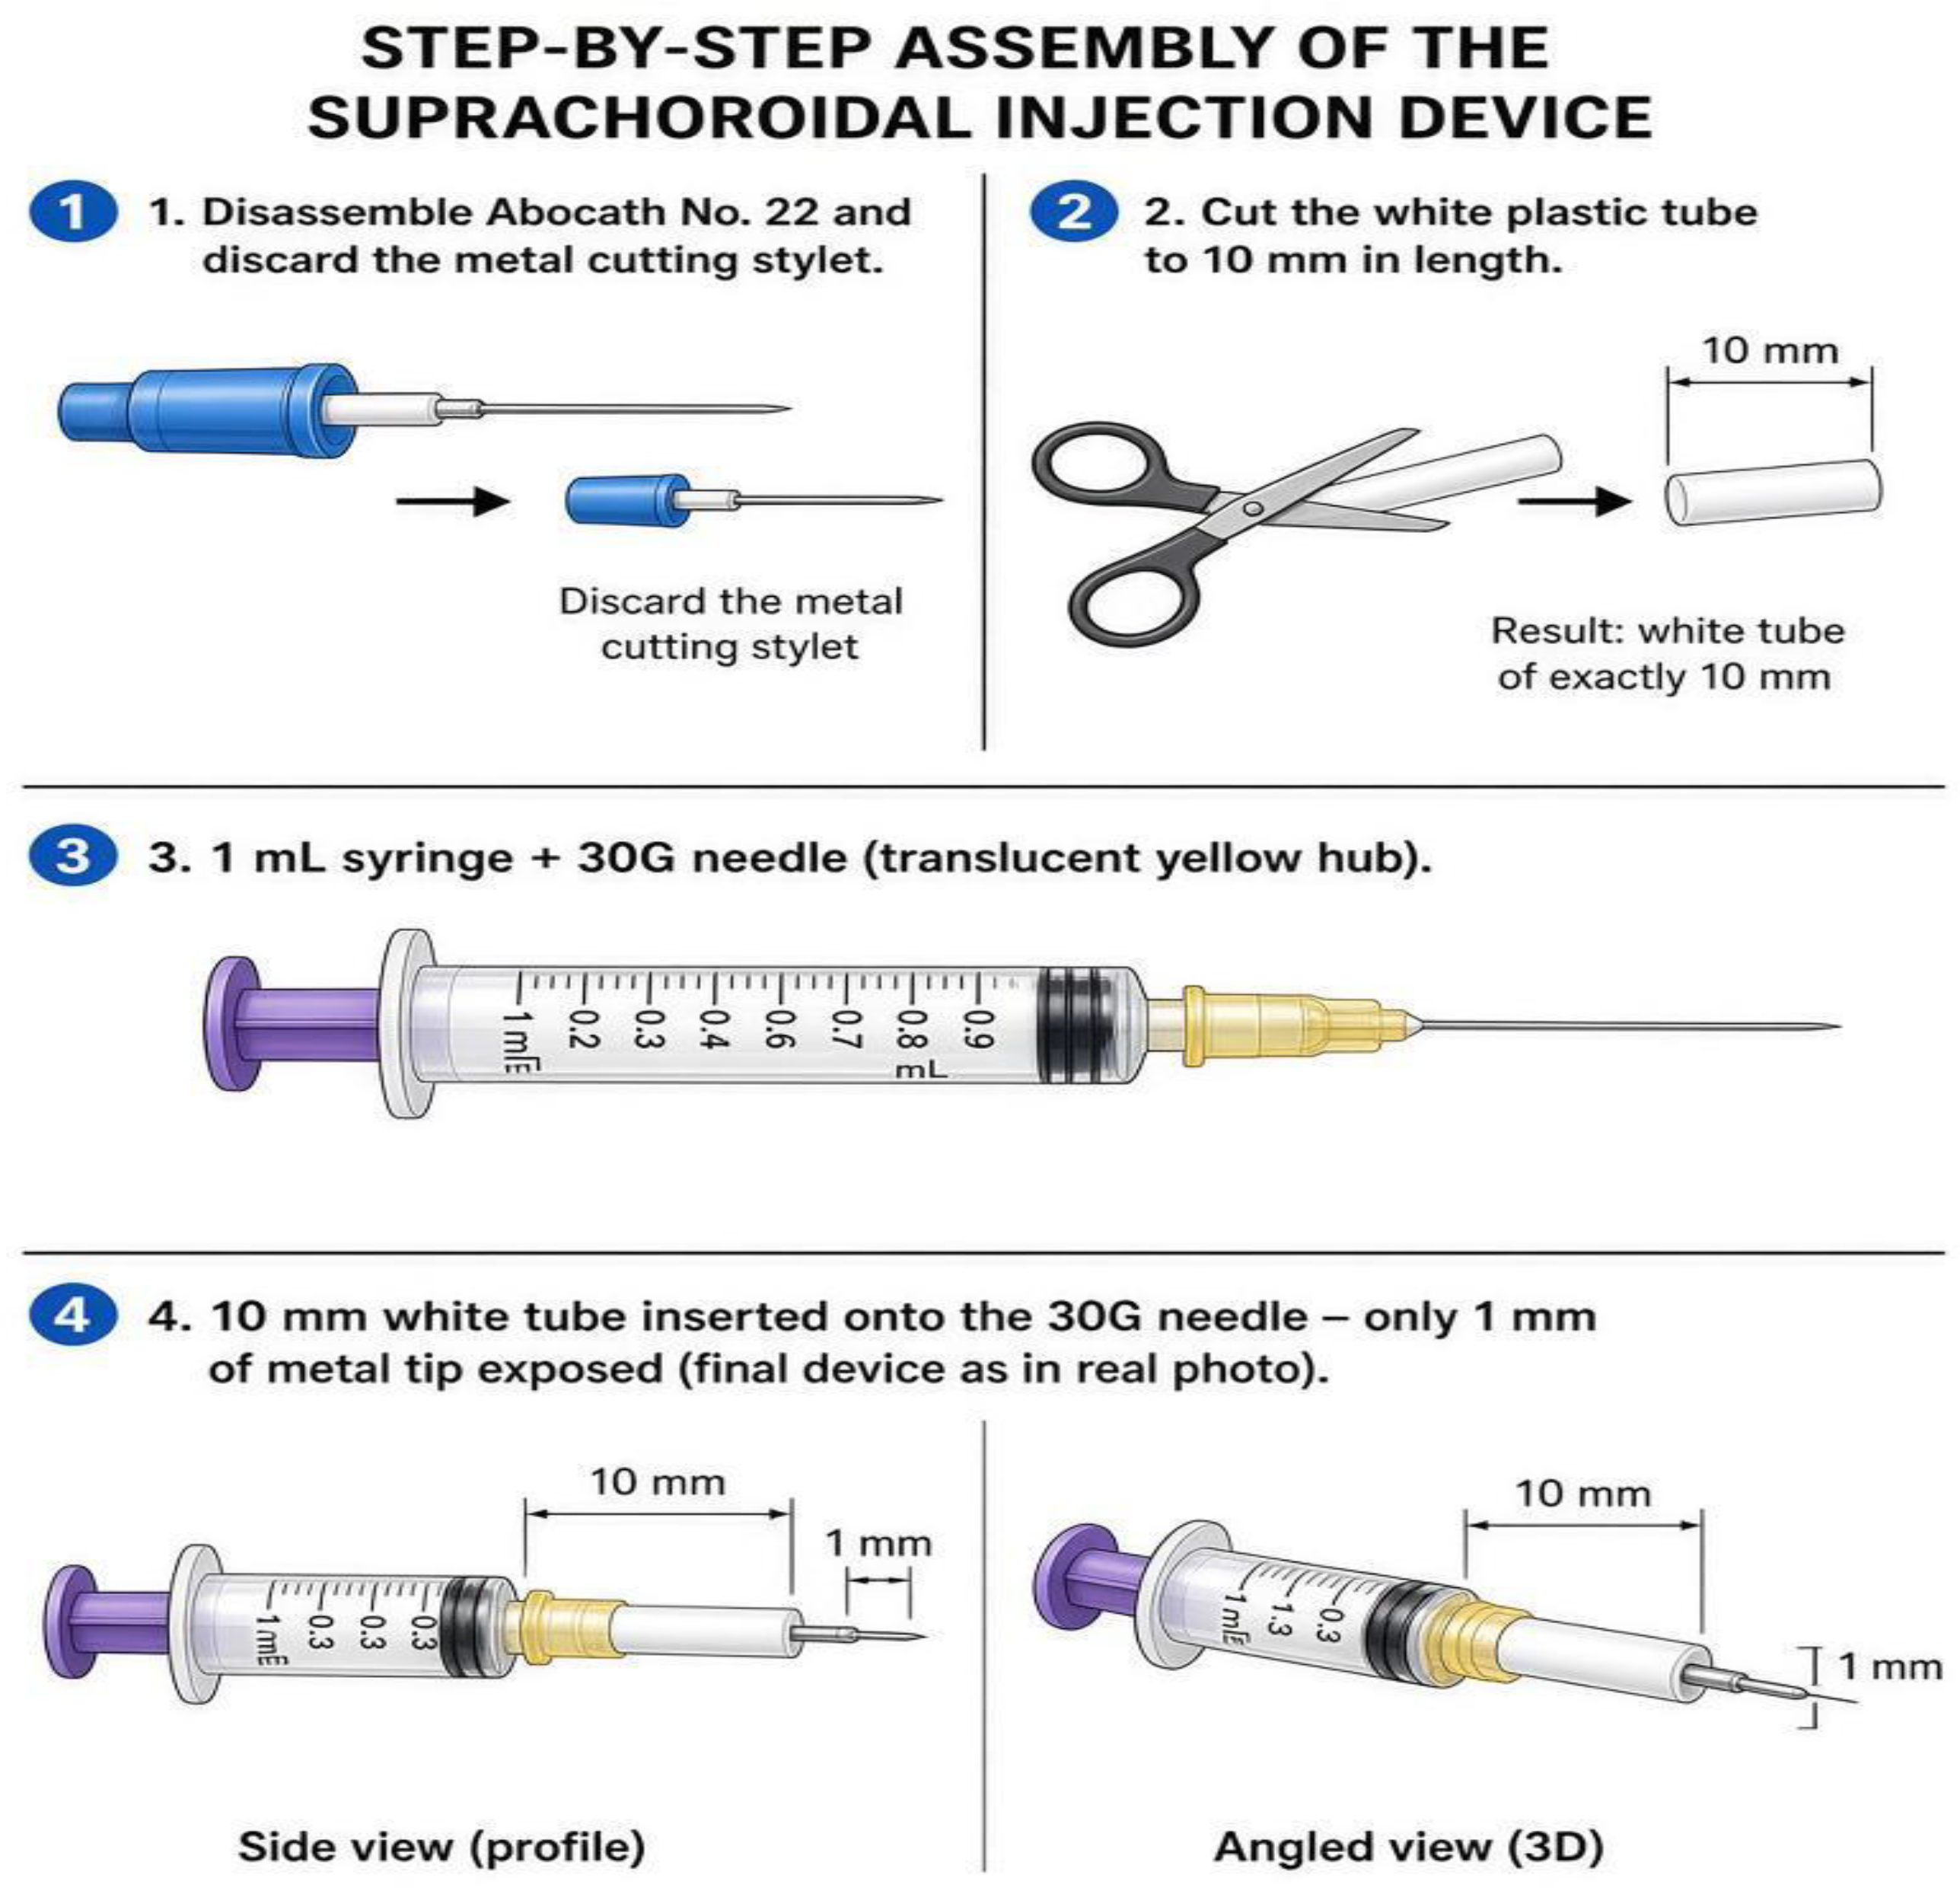
Figure 2.
Schematic view of suprachoroidal injection.
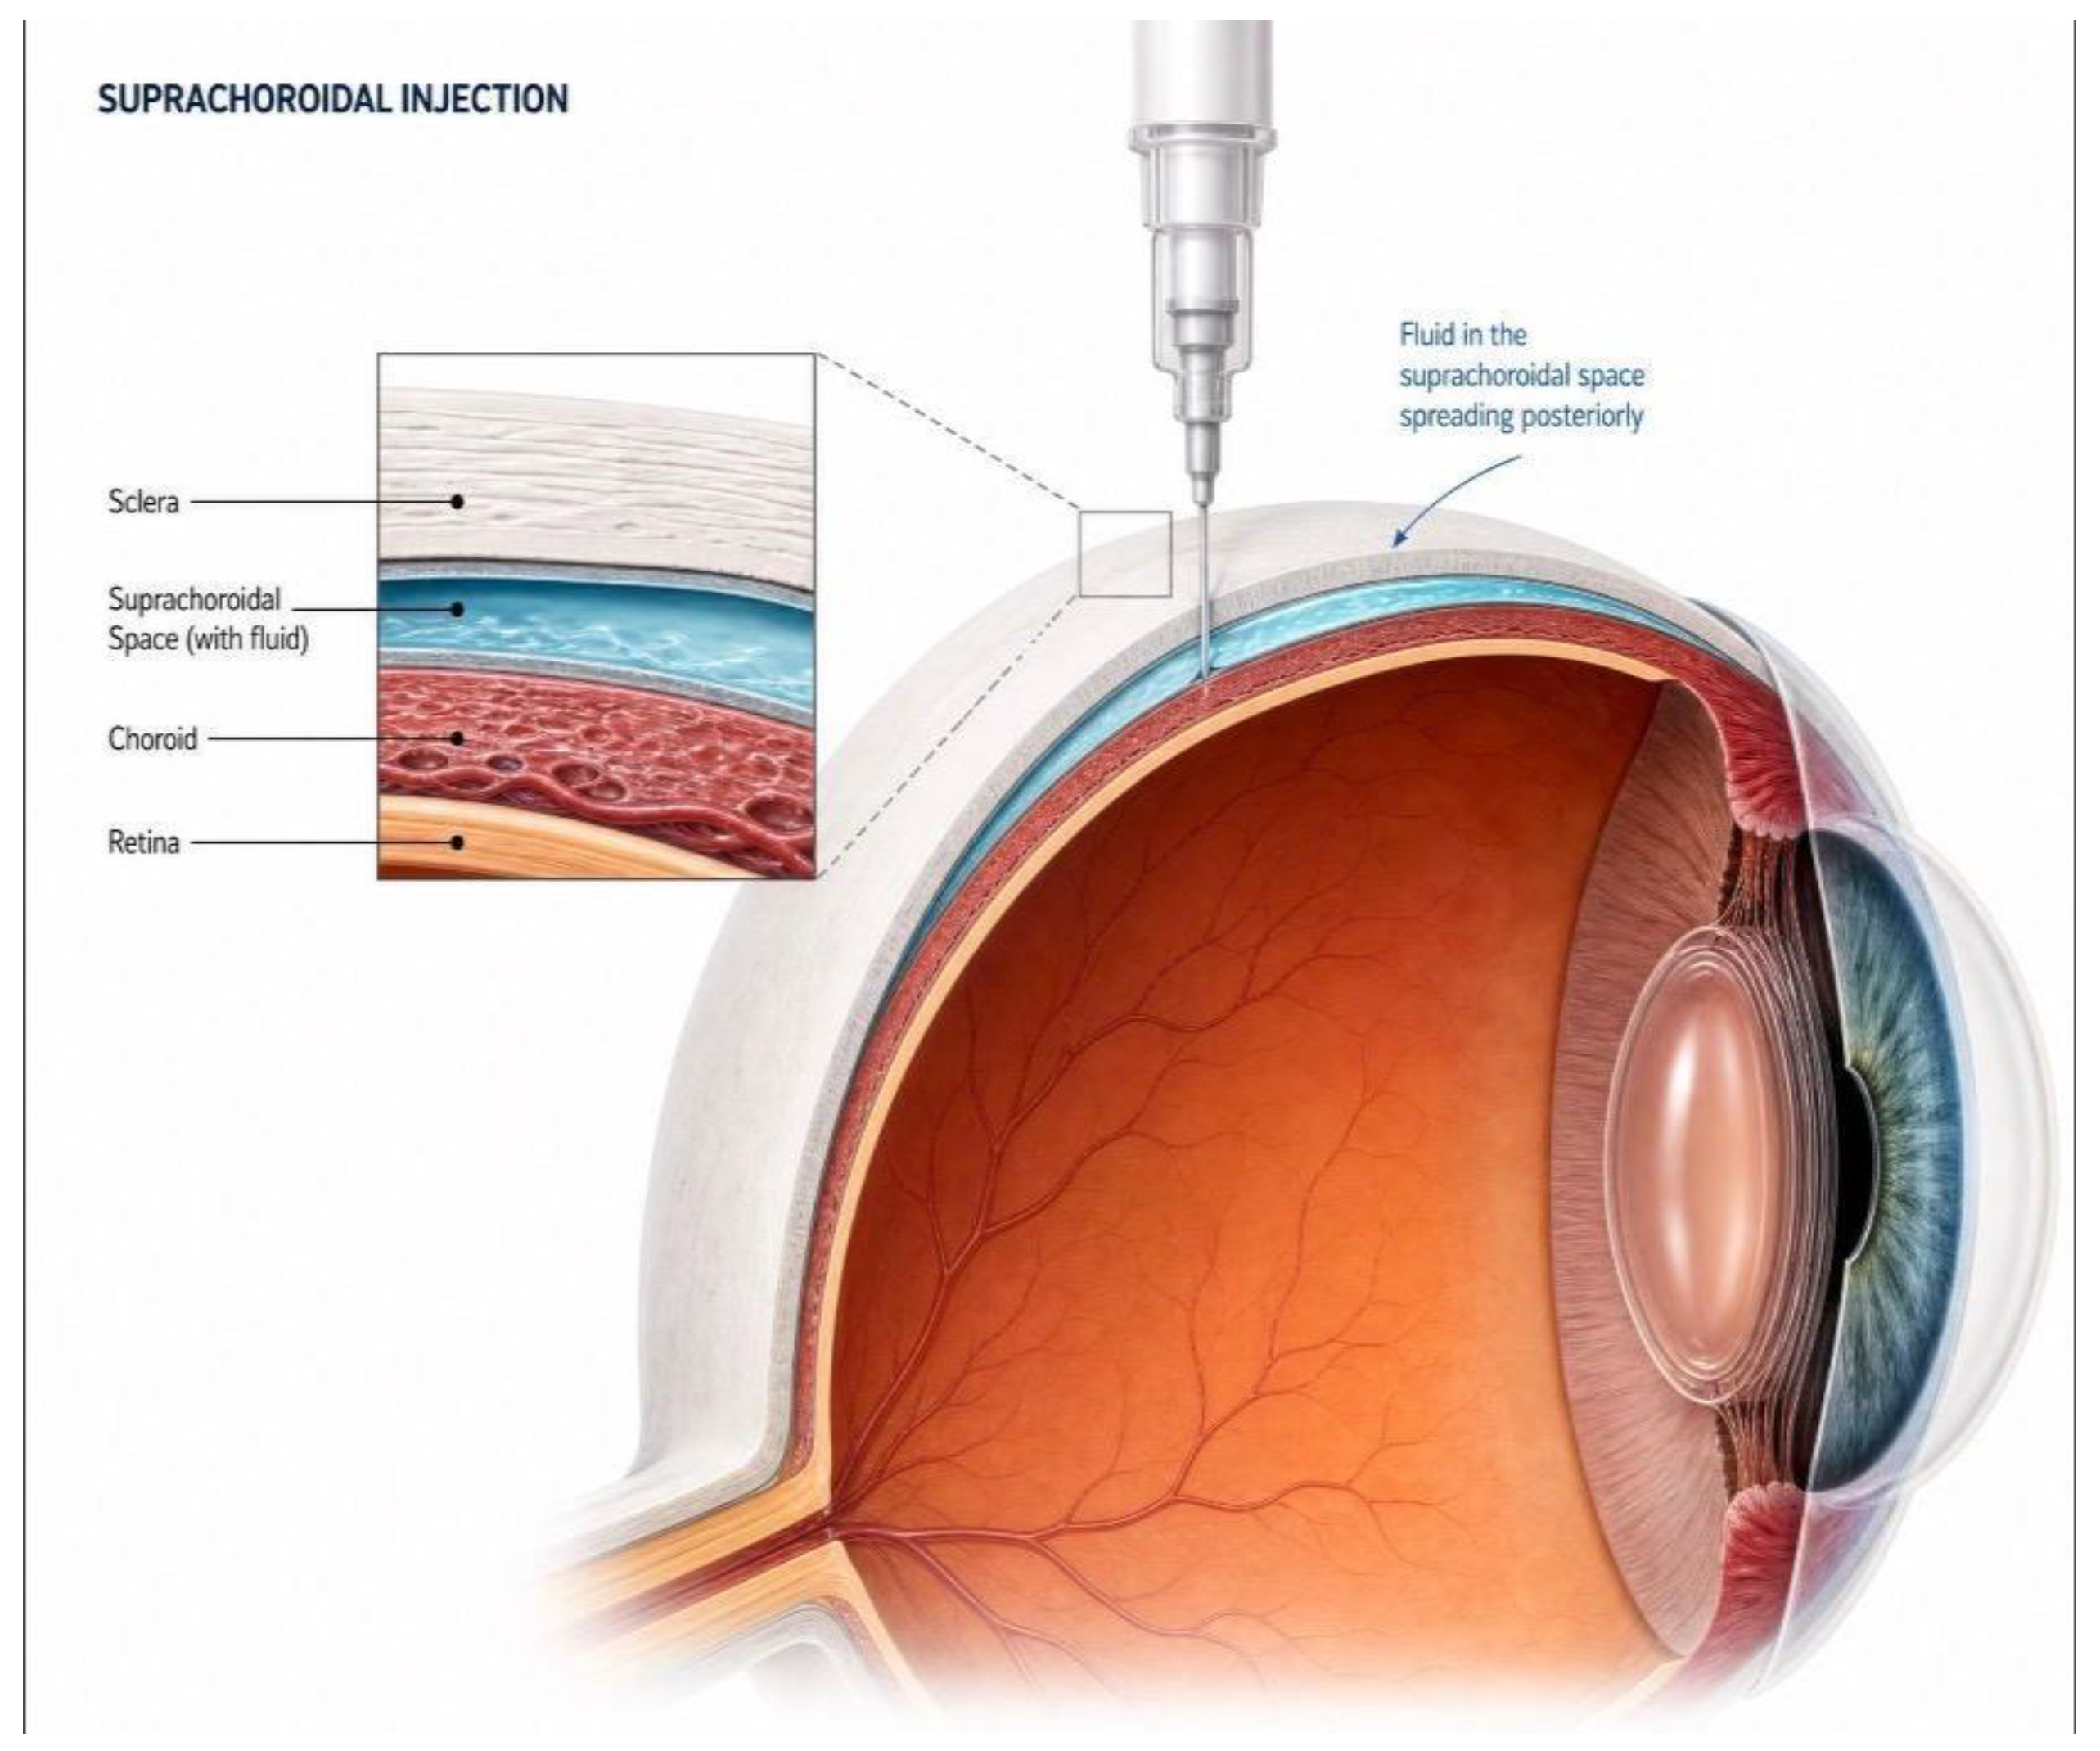
Figure 3.
Pre-op injection OCT - central foveal thickness (µm) findings of patient number 6.
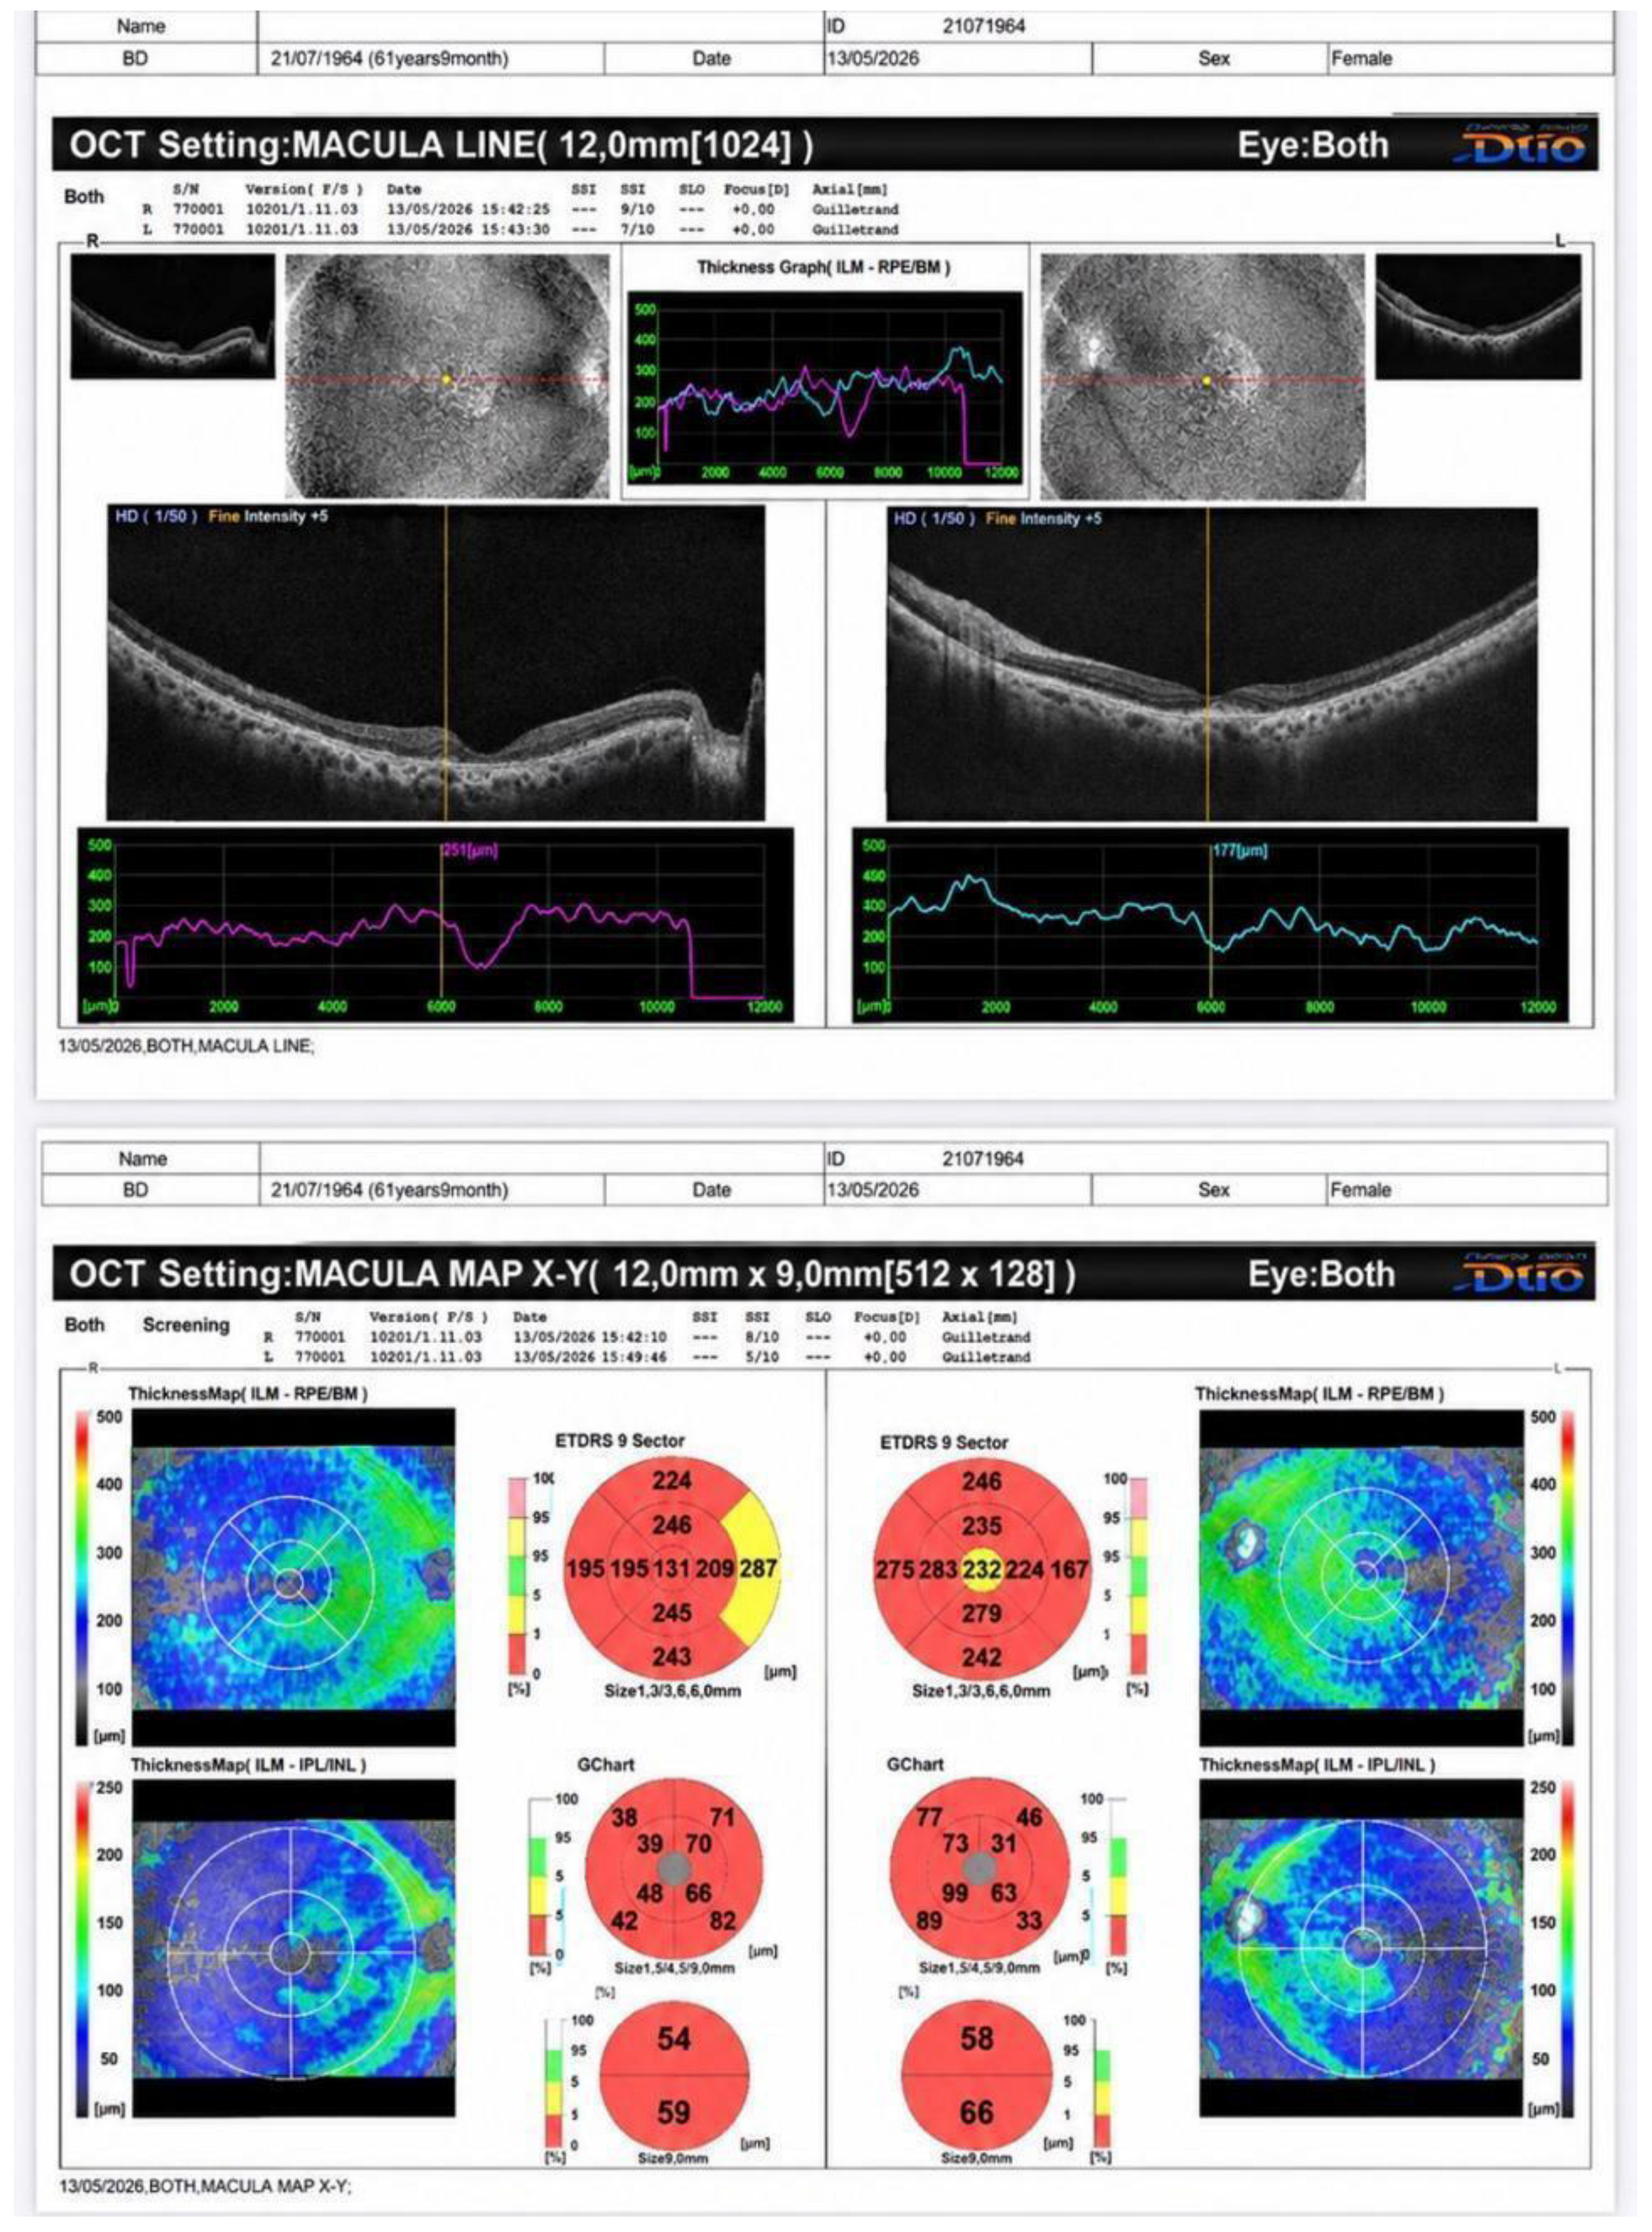
Figure 4.
Post-op injection OCT - central foveal thickness(µm) findings of patient number 6..
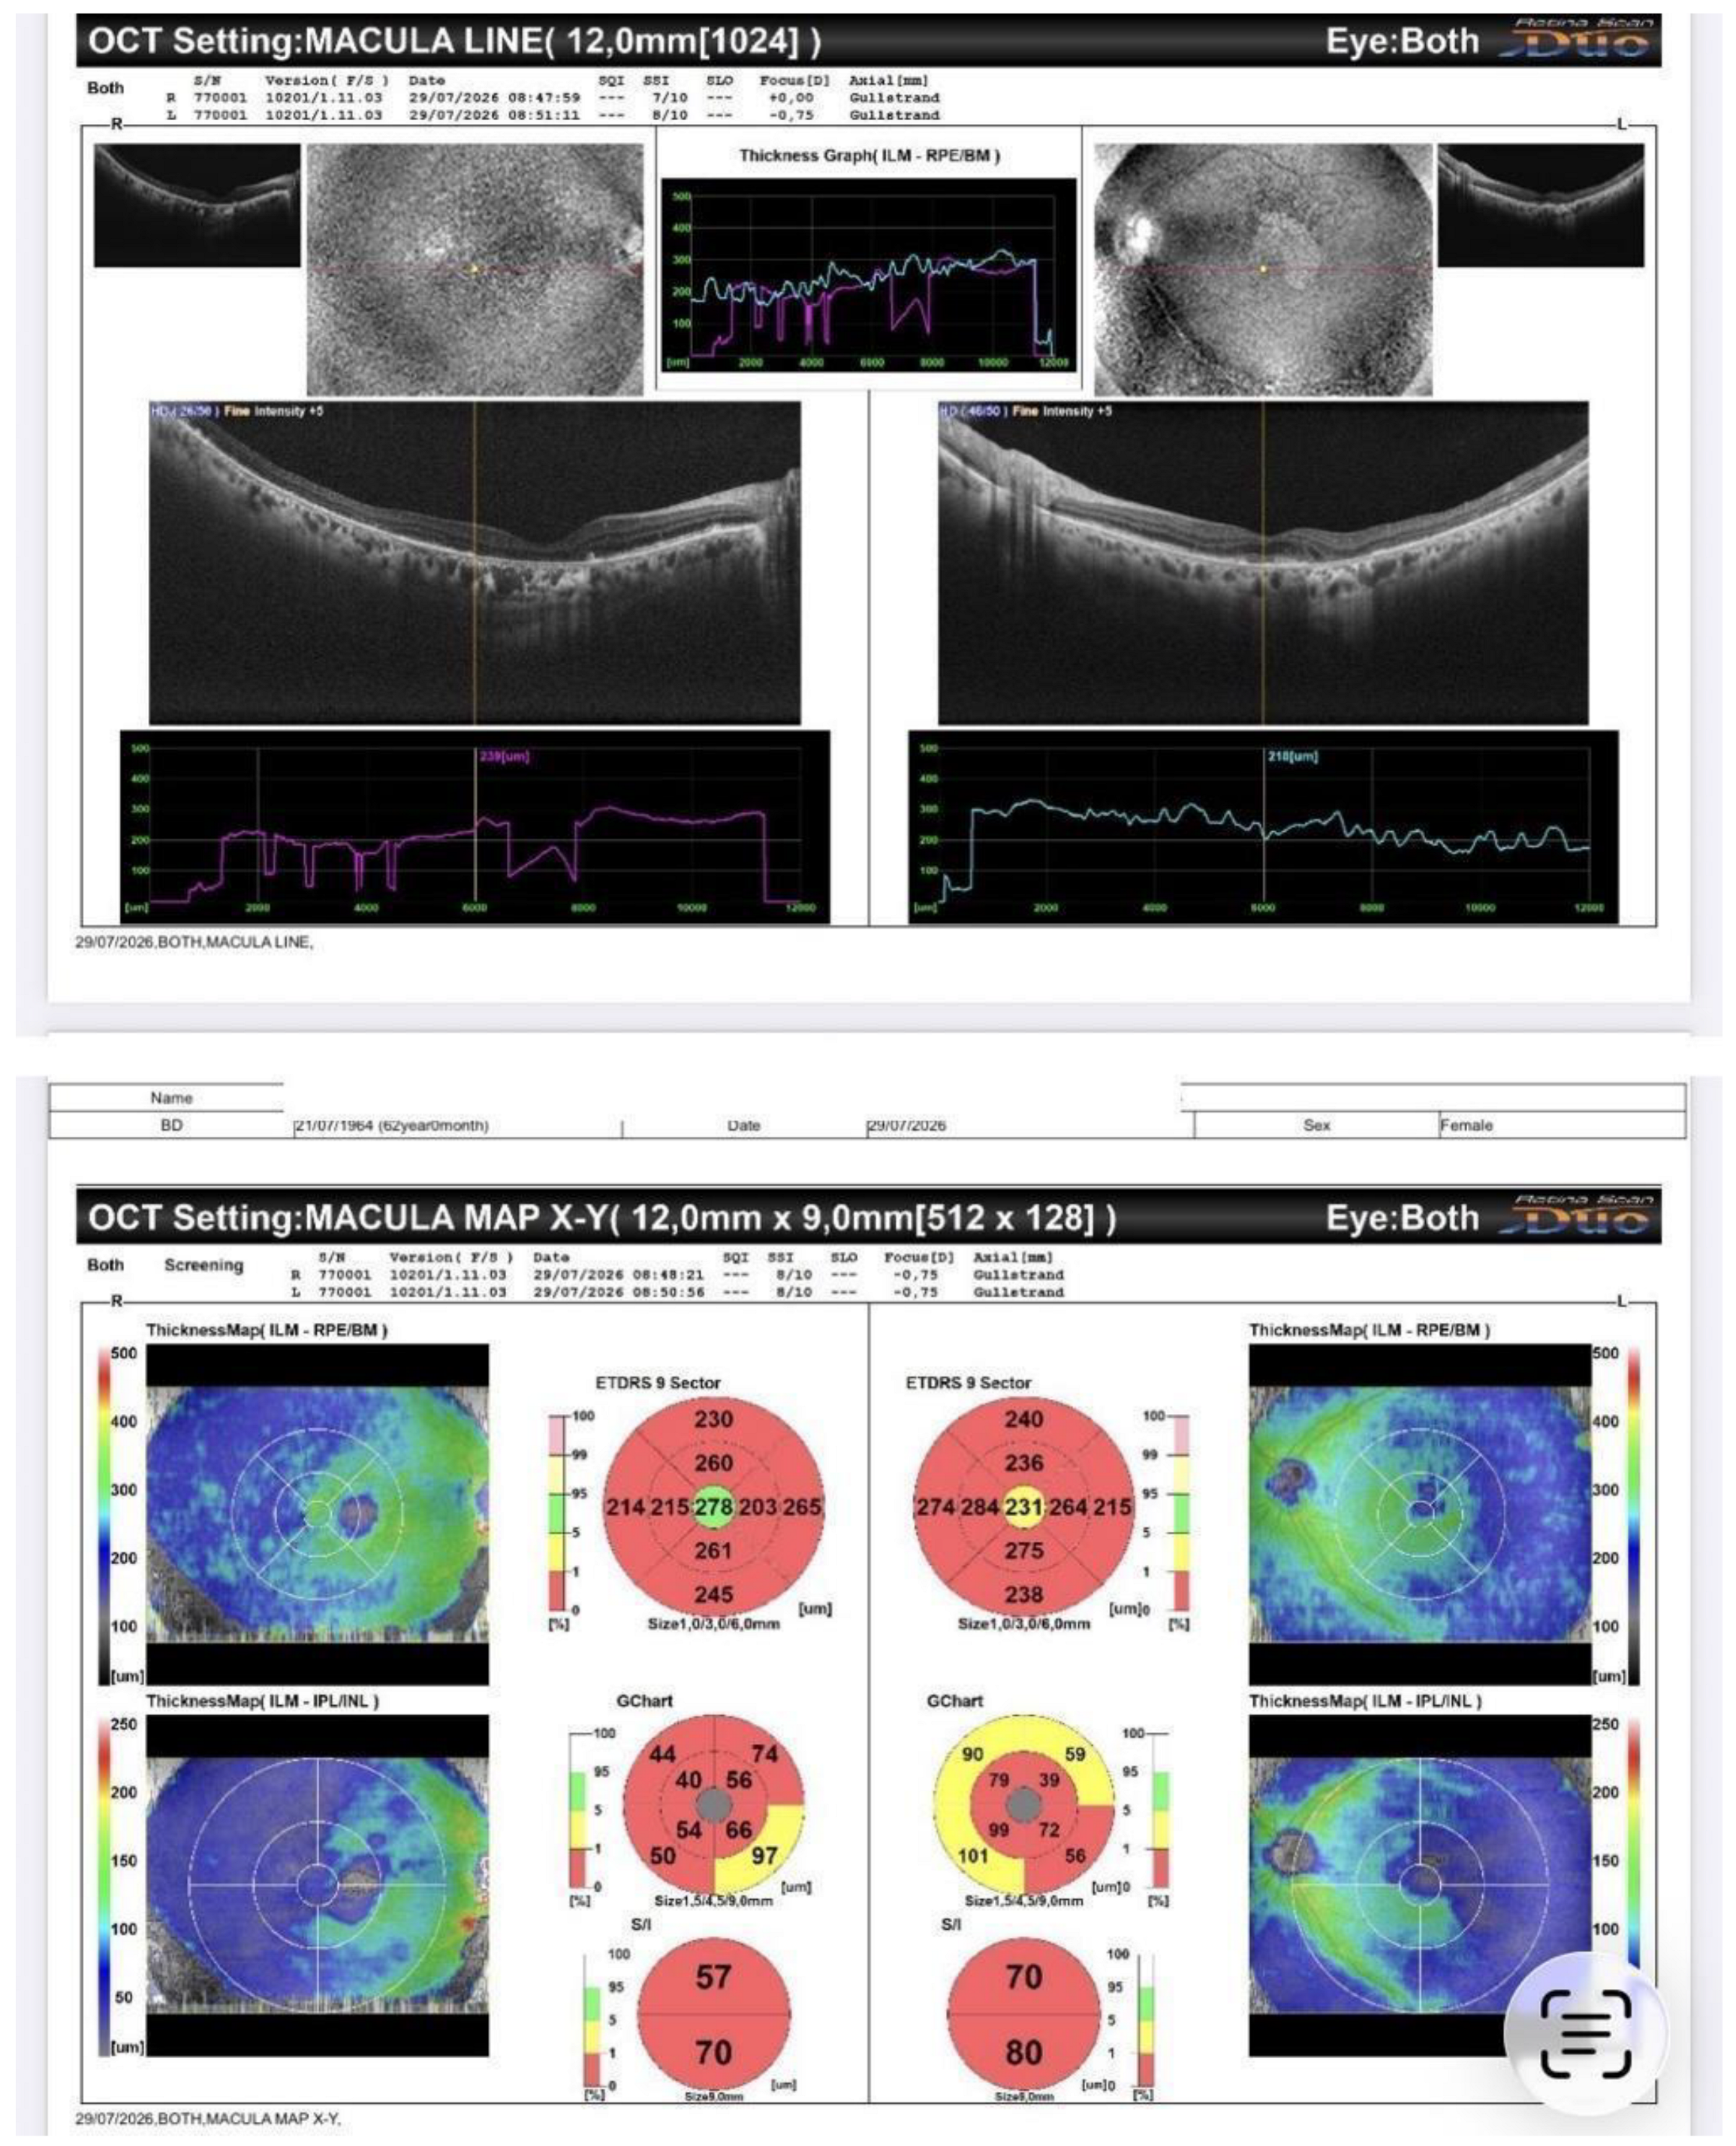
Figure 5.
Visual field 24-2 pre and post-injection of patient number 9.
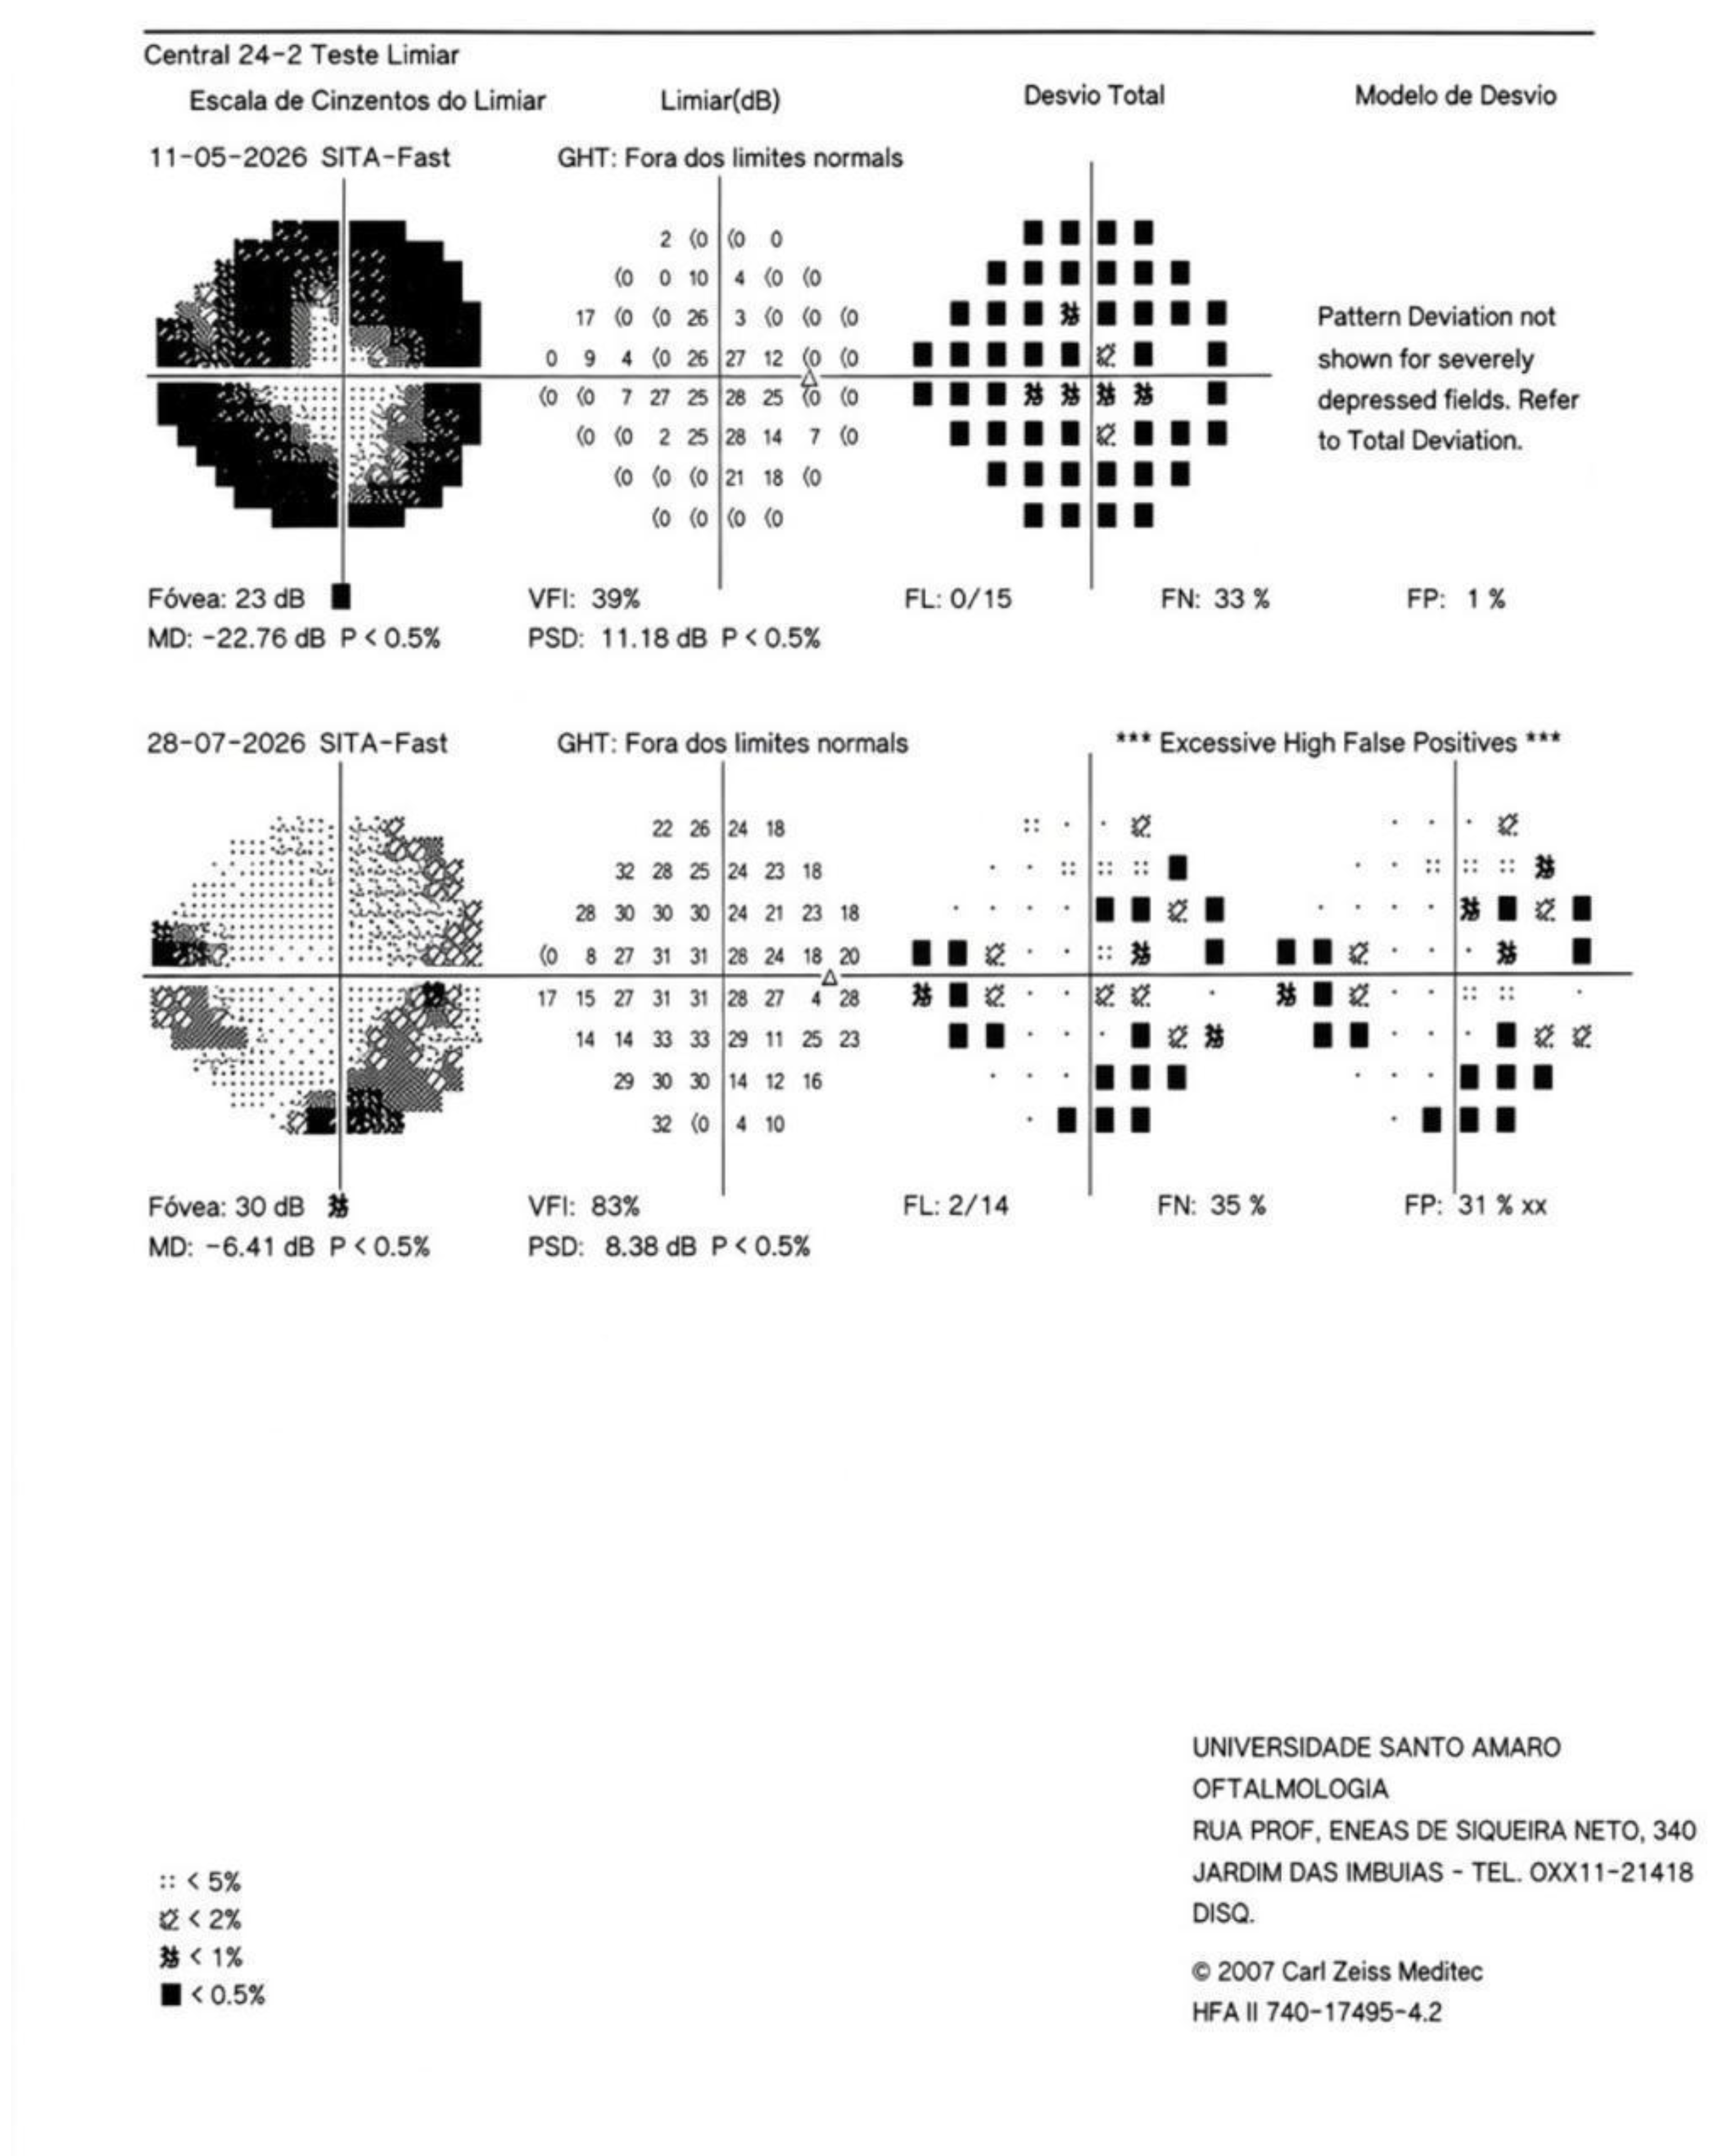
Table 1.
BCVA before and after suprachoroidal WJ-MSC injection.
| Variable | Baseline | Day 45 | Mean change | Paired t-test | Wilcoxon test |
|---|---|---|---|---|---|
| BCVA, logMAR | 0.849 ± 0.750 | 0.740 ± 0.718 | −0.109 | p = 0.1003 | p = 0.0904 |
Table 2.
BCVA pre and post-injection mean Δ values by patient.
| Patient | Eye | Snellen Pre | Snellen Post | logMAR Pre | logMAR Post | Δ logMAR |
|---|---|---|---|---|---|---|
| Patient 1 | RE | 20/60 | 20/40 | 0.477 | 0.301 | -0.176 |
| LE | 20/40 | 20/40 | 0.301 | 0.301 | +0.000 | |
| Patient 2 | RE | CF 3M | CF 3M | 2.000 | 2.000 | +0.000 |
| LE | 20/200 | 20/200 | 1.000 | 1.000 | +0.000 | |
| Patient 3 | RE | 20/200 | 20/30 | 1.000 | 0.176 | -0.824 |
| LE | 20/20 | 20/25 | 0.000 | 0.097 | +0.097 | |
| Patient 4 | RE | 20/30 | 20/30 | 0.176 | 0.176 | +0.000 |
| LE | 20/30 | 20/30 | 0.176 | 0.176 | +0.000 | |
| Patient 5 | RE | 20/100 | 20/100 | 0.699 | 0.699 | +0.000 |
| LE | CF 2M | 20/200 | 2.000 | 1.000 | -1.000 | |
| Patient 6 | RE | CF 2M | CF 2M | 2.000 | 2.000 | +0.000 |
| LE | 20/30 | 20/25 | 0.176 | 0.097 | -0.079 | |
| Patient 7 | RE | CF 2M | CF 2M | 2.000 | 2.000 | +0.000 |
| LE | CF 1M | CF 2M | 2.000 | 2.000 | +0.000 | |
| Patient 8 | RE | 20/20 | 20/20 | 0.000 | 0.000 | +0.000 |
| LE | 20/200 | 20/200 | 1.000 | 1.000 | +0.000 | |
| Patient 9 | RE | 20/100 | 20/80 | 0.699 | 0.602 | -0.097 |
| LE | 20/100 | 20/80 | 0.699 | 0.602 | -0.097 | |
| Patient 10 | RE | 20/25 | 20/25 | 0.097 | 0.097 | +0.000 |
| LE | 20/60 | 20/60 | 0.477 | 0.477 | +0.000 |
Table 3.
BCVA pre and post-injection Group statistical summary (n = 20 eyes).
| Measure | Pre-injection | Post-injection | Mean Δ |
|---|---|---|---|
| Mean logMAR (SD) | 0.849 (±0.750) | 0.740 (±0.718) | -0.109 |
Table 4.
IOP pre and post-injection mean Δ values by patient.
| Patient | IOP Pre (OD/OS) | IOP Post (OD/OS) | Δ (OD/OS) |
|---|---|---|---|
| Patient 1 | 20 / 20 | 22 / 22 | +2 / +2 |
| Patient 2 | 14 / 16 | 14 / 16 | +0 / +0 |
| Patient 3 | 14 / 14 | 14 / 14 | +0 / +0 |
| Patient 4 | 16 / 16 | 20 / 22 | +4 / +6 |
| Patient 5 | 14 / 14 | 14 / 12 | +0 / -2 |
| Patient 6 | 14 / 14 | 16 / 16 | +2 / +2 |
| Patient 7 | 20 / 20 | 18 / 18 | -2 / -2 |
| Patient 8 | 12 / 12 | 12 / 12 | +0 / +0 |
| Patient 9 | 16 / 16 | 14 / 14 | -2 / -2 |
| Patient 10 | 14 / 16 | 16 / 16 | +2 / +0 |
Table 5.
IOP pre and post-injection mean Δ values Group statistical summary (n = 20 eyes).
| Measure | Pre-application | Post-application | Mean Δ |
|---|---|---|---|
| Mean mmHg (SD) | 15.6 (±2.56) | 16.1 (±3.28) | +0.5 |
Table 21.
ERG pre and post-injection Group-Level Results (n = 10).
| Parameter | N | Mean Pre | SD Pre | Mean Post | SD Post | Mean Δ | SD Δ | t | p (t-test) | p (Wilcoxon) |
|---|---|---|---|---|---|---|---|---|---|---|
| Scotopic 0.01 – B latency (ms) | 10 | 75.05 | 20.14 | 67.48 | 23.38 | -7.56 | 30.26 | -0.791 | 0.4495 | 0.6953 |
| Scotopic 0.01 – B amplitude (µV) | 10 | 70.8 | 77.84 | 44.0 | 32.49 | -26.79 | 58.84 | -1.44 | 0.1838 | 0.4922 |
| Photopic 3.0 – A latency (ms) | 10 | 14.73 | 3.77 | 13.82 | 2.72 | -0.91 | 5.16 | -0.558 | 0.5904 | 1.0 |
| Photopic 3.0 – B latency (ms) | 10 | 35.04 | 9.82 | 36.21 | 11.99 | 1.17 | 17.35 | 0.213 | 0.8359 | 0.5391 |
| Photopic 3.0 – A amplitude (µV) | 10 | 21.6 | 17.41 | 20.09 | 13.01 | -1.51 | 16.55 | -0.289 | 0.7791 | 0.8457 |
| Photopic 3.0 – B amplitude (µV) | 10 | 69.99 | 70.7 | 54.66 | 31.2 | -15.33 | 57.64 | -0.841 | 0.4221 | 0.7695 |
| Flicker 30 Hz – P1 (ms) | 10 | 54.14 | 12.53 | 63.06 | 6.12 | 8.92 | 13.47 | 2.095 | 0.0657 | 0.0195 |
| Flicker 30 Hz – N1-P1 (µV) | 10 | 50.46 | 47.66 | 34.44 | 33.29 | -16.02 | 32.19 | -1.574 | 0.1499 | 0.2324 |
Note: SD = standard deviation. Δ = Post − Pre. Values highlighted in yellow indicate p < 0.05.
Table 22.
ERG Per-Patient Results accounting for 30% Variability.
| Patient | Improvement trend | Decline trend | Stable (within 30%) | Overall Status |
|---|---|---|---|---|
| Patient 10 | 7 | 0 | 1 | Predominant improvement trend |
| Patient 1 | 3 | 1 | 4 | Mixed, improvement-leaning |
| Patient 6 | 4 | 3 | 1 | Mixed, improvement-leaning |
| Patient 8 | 4 | 1 | 3 | Mixed, improvement-leaning |
| Patient 3 | 1 | 1 | 6 | Mixed, balanced |
| Patient 5 | 3 | 3 | 2 | Mixed, balanced |
| Patient 7 | 0 | 0 | 8 | No real change (stable) |
| Patient 4 | 1 | 6 | 1 | Mixed, decline-leaning |
| Patient 2 | 0 | 1 | 7 | Predominant decline trend |
| Patient 9 | 0 | 3 | 5 | Predominant decline trend |
Disclaimer/Publisher’s Note: The statements, opinions and data contained in all publications are solely those of the individual author(s) and contributor(s) and not of MDPI and/or the editor(s). MDPI and/or the editor(s) disclaim responsibility for any injury to people or property resulting from any ideas, methods, instructions or products referred to in the content. |
© 2026 by the authors. Licensee MDPI, Basel, Switzerland. This article is an open access article distributed under the terms and conditions of the Creative Commons Attribution (CC BY) license (http://creativecommons.org/licenses/by/4.0/).
Copyright: This open access article is published under a Creative Commons CC BY 4.0 license, which permit the free download, distribution, and reuse, provided that the author and preprint are cited in any reuse.