

Submitted:
30 September 2026
Posted:
05 October 2026
You are already at the latest version
Abstract
In this paper a comparison of labor cost is carried out for apparel manufacturing in different countries. The factors that may have impact on labor cost are analyzed using data spanning from 2001 through 2025. Out of the multiple options for the location of apparel manufacturing and decisions regarding apparel sourcing, lower cost options are generally preferred. However, the landscape has shifted significantly due to rising wages in traditionally low-cost countries, the impact of the COVID-19 pandemic, trade tariff disruptions (particularly US-China trade tensions and 2025 reciprocal tariffs), automation pressures, and sustainability compliance requirements. Analysis is made to estimate the rate of labor cost increase in low wage and high wage countries using updated linear regression models. The global apparel market, valued at approximately $1.77 trillion in 2024, continues to be shaped by these evolving cost dynamics. This revised edition incorporates data through 2025 from the ILO Global Wage Report 2024–25, Werner International, the US Bureau of Labor Statistics, and multiple industry sources.
Keywords:
apparel manufacturing
; labor cost
; global wages
; forecasting
; supply chain
; tariffs
; automation
; sustainability
1. Labor Employment, Wages and Cost Reduction in Apparel Manufacturing
The textile and apparel industry has always been labor intensive. However, increased automation has resulted in less dependence on workforce in certain operations. Processes in spinning and weaving have been automated, and there is significant improvement in the automation of preparation for garment manufacturing. The manual operation of a sewing machine for stitching continues to sustain substantial labor requirements in garment manufacturing plants. It is always desired to keep this element of cost at the lowest, since it affects the overall costing of apparel.
The global apparel manufacturing industry employed approximately 430 million people worldwide in 2025, with the fashion and textile industry representing one of the largest employment sectors in developing countries. The global apparel market was valued at approximately $1.77 trillion in 2024 and is projected to reach $2.26 trillion by 2030 at a 4.2% compound annual growth rate (Customcy, 2026; Grand View Research, 2025). The Asia-Pacific region dominates, accounting for 40.5% of global revenues in 2024.
Garment industry employment potential and the labor cost factor continue to affect sourcing decisions for apparel, as retailers are always trying to place bulk orders at lower cost options. However, the trends of wage increases differ markedly across countries. Wages remain on the lower side in developing and emerging countries, but the rate of increase is faster. The operations involved in bulk manufacturing such as marker planning, spreading and cutting have been carried out by automatic systems that are integrated, providing efficiency in fabric consumption savings and defect elimination apart from higher operating speeds.
The apparel manufacturing activity has historically been categorized by concerns about ‘sweatshop’ conditions that pay lower wages in inferior working conditions while demanding higher working hours. However, proper analysis of wage data and comparison with other industries reveals that opening markets for international economy has been beneficial for developing countries and improving the standard of living. This positive trend has been confirmed by the ILO Global Wage Report 2024–25, which found that global real wages grew by 2.7% in the first half of 2024, marking the largest gain in over 15 years (ILO, 2024).
Notably, the industry faces new cost pressures in 2024–2025. Unit labor costs in apparel manufacturing rose by 7.1% in 2024, indicating that manufacturers spent substantially more on labor per unit of output compared to the previous year (U.S. Bureau of Labor Statistics, 2025). Additionally, the introduction of US reciprocal tariffs in 2025 has caused significant disruptions, with tariffs on Chinese apparel imports reaching approximately 35% and new tariffs announced on other Asian producers including 46% on Vietnam (later negotiated to 20%) and 49% on Cambodia (later reduced to 19%) (Cosmo Sourcing, 2025; Just-Style, 2025).
2. Labor Productivity, GDP Growth and Real Wages
Labor productivity indicates the output per unit time per worker. Increasing labor productivity results in higher economic growth for a country. The economic growth of a country results in increase in real wages. The condition of workforce as well as technological advancement contributes towards increasing productivity. Education, training and a conducive atmosphere for industrial operation enable firms to afford increased wages and contribute towards national growth (Pettinger, 2014).
The ILO Global Wage Report 2024–25 found that despite a 29% rise in productivity in high-income countries between 1999 and 2024, real wages have only risen by 15%, highlighting a failure to share productivity gains equitably with workers (ITUC, 2024). This decoupling between productivity and wages remains a key structural challenge globally.
Real wages for any country are those wages adjusted to reflect the cost of living in that country. These are used for comparison. The ILO report further revealed that real wage growth differs significantly by region, with average wages increasing more quickly in Asia and the Pacific, Central and Western Asia, and Eastern Europe compared to the rest of the world. The 2021–2022 cost-of-living crisis hit low-wage earners hardest, especially since they spend a larger share of their income on essentials (ILO, 2024).
As shown in Figure 5, global real wages declined by 0.9% in 2022 due to the inflationary pressures of the pandemic recovery period but recovered strongly to 2.7% growth in the first half of 2024. More countries than usual raised their minimum wage levels in 2022 and 2023 in response to inflation, though these increases were generally not sufficient to fully offset the rising cost of living for minimum wage workers.
3. Comparison of Labor Cost in Different Countries Across Continents
Since there are fluctuations of currency valuations in different countries over time, it is essential to consider those changes. The labor cost for major garment exporting countries is compared across multiple time periods. The prevailing wages and minimum wages in different countries for the years 2001, 2011, 2015, 2020 and 2025, along with their equivalent dollar conversion, are presented in Table 1 and Figure 1.
The data reveals several key trends since the original 2015 analysis. Bangladesh, while still one of the lowest-wage garment-producing countries, saw its minimum wage rise to $113 per month in 2025 after a 55% increase in 2024 followed by an additional 10% increase in 2025 (The Business Standard, 2025). Cambodia raised its garment sector minimum wage to $208 per month for 2025 (ASEAN Briefing, 2024). China has experienced the most dramatic increases, with coastal urban garment wages now averaging $500–$800 per month (Capital World Group, 2026), and its minimum wage reaching $380 per month in some regions.
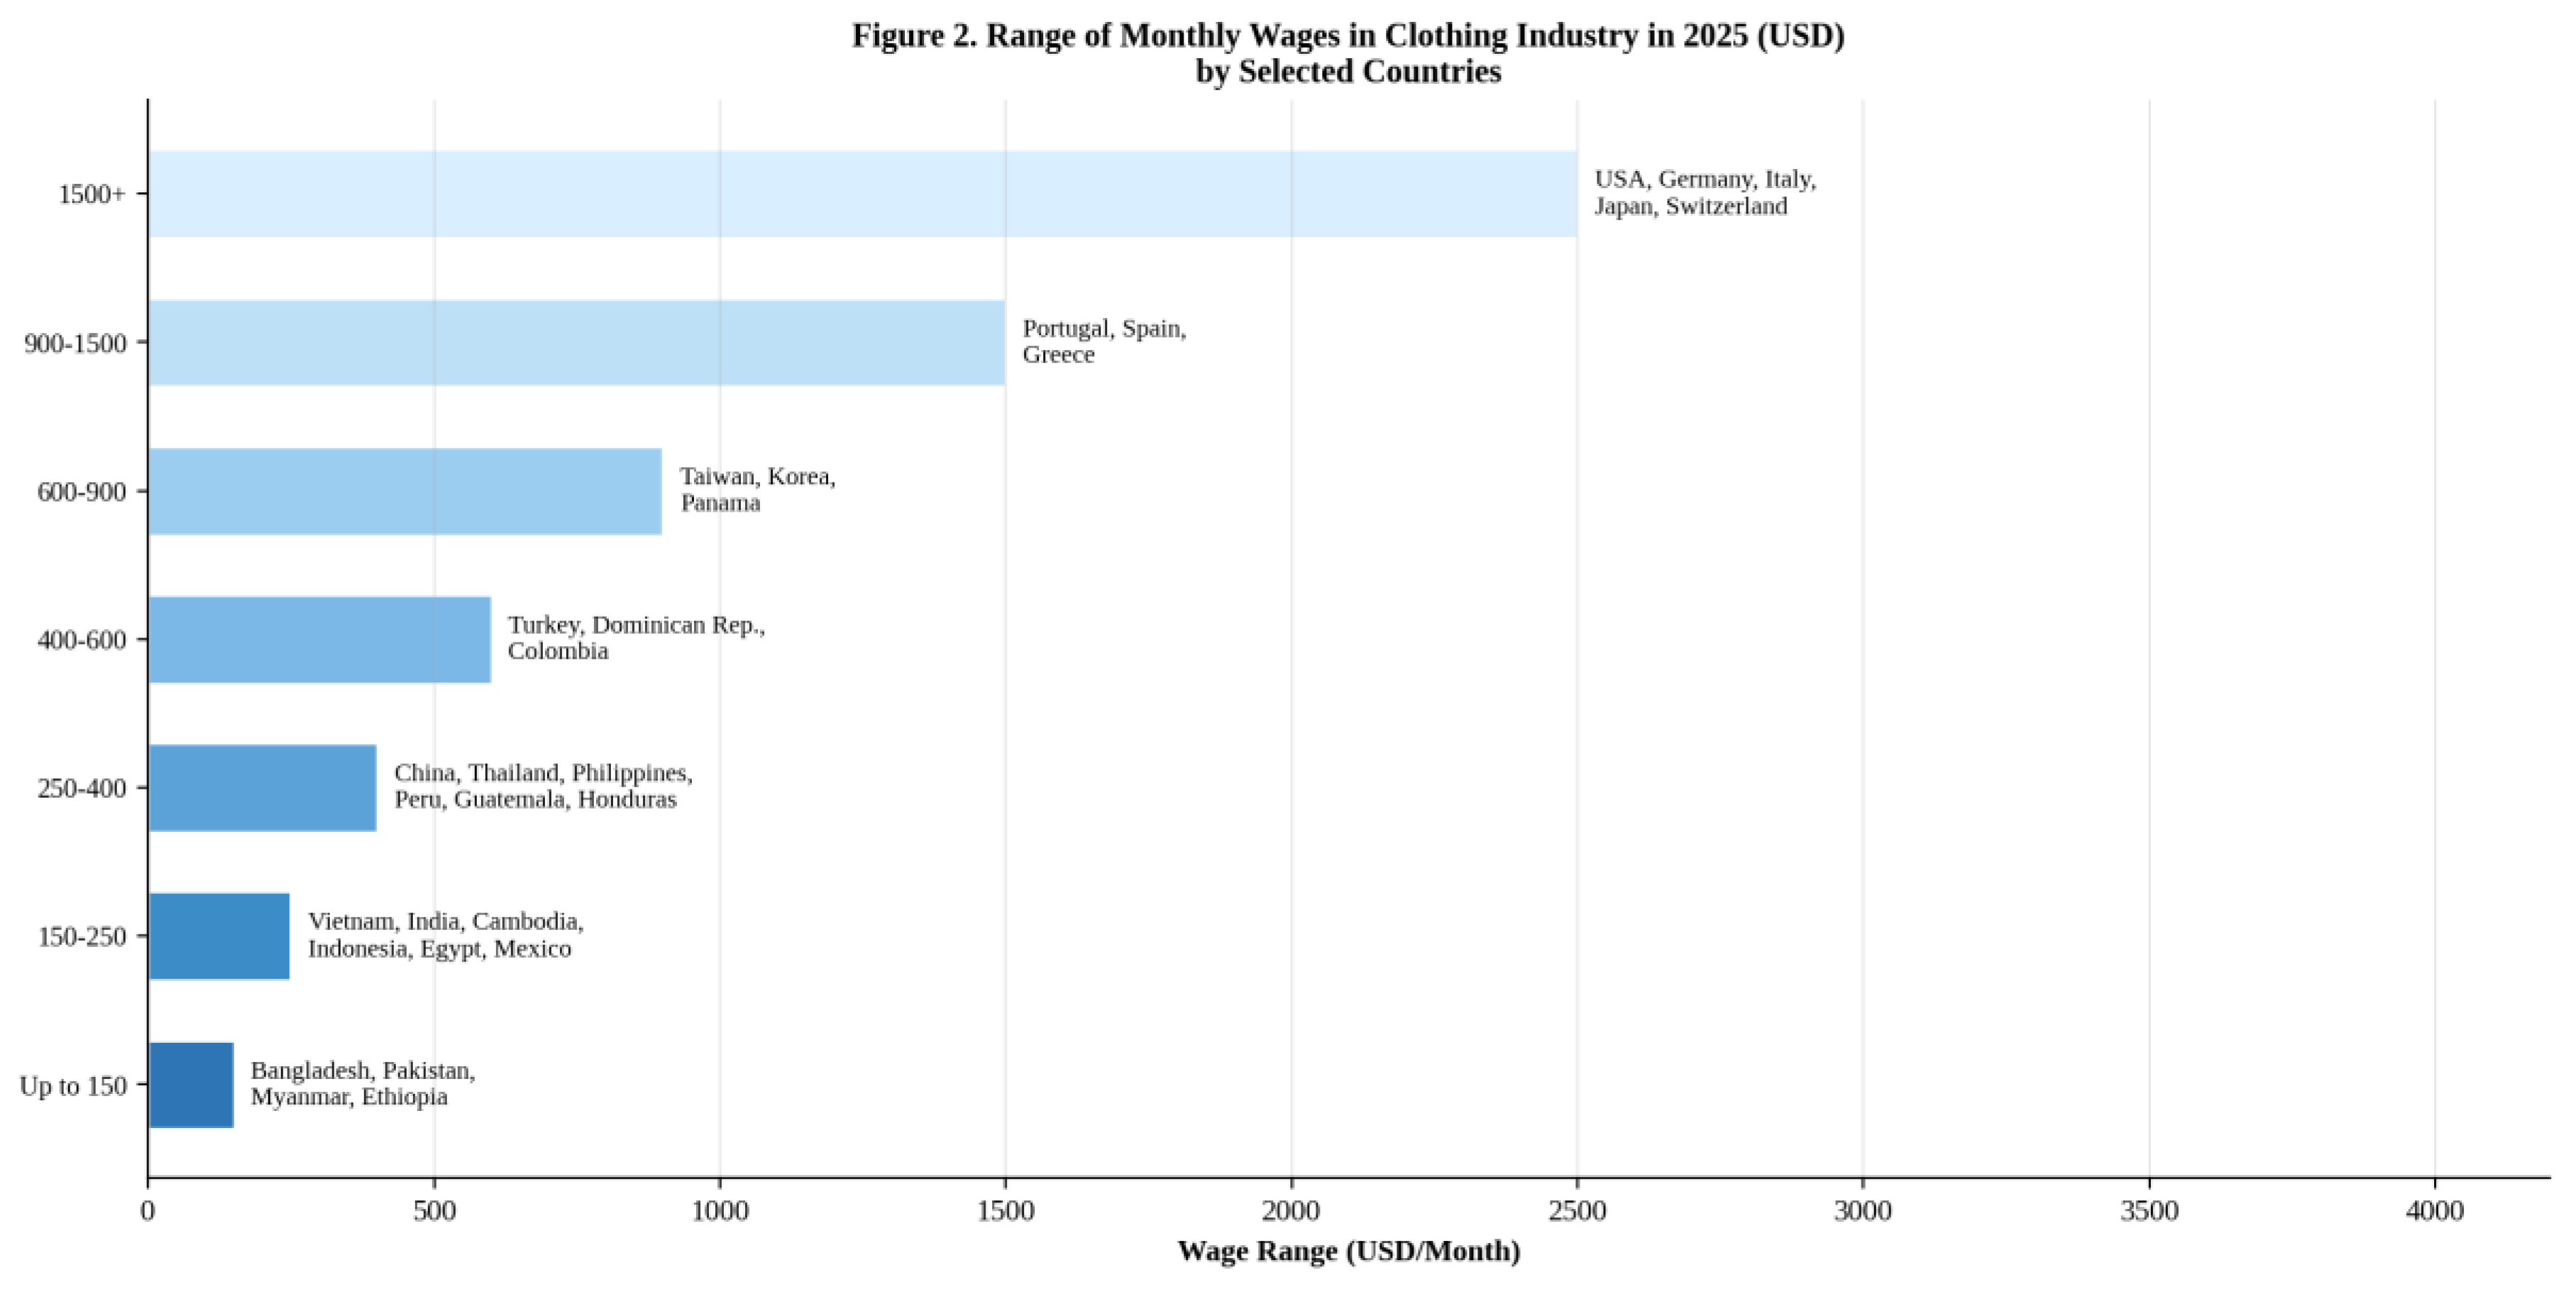
The range of monthly wages in the clothing industry as of 2025 is presented in Table 2. Compared to the 2014 ranges in the original paper, there has been a general upward shift, with previously low-wage countries moving into higher brackets.
Figure 2.
Range of Monthly Wages in Clothing Industry in 2025 (USD) by Selected Countries.
The labor cost per hour is more appropriate for comparison to eliminate differences due to working hours and other factors. The cost of labor in USD per hour is given in Table 3 and plotted in Figure 3 and Figure 4. The table has been updated to include data for 2020 and 2024. As a hypothesis, it was assumed that the labor cost would continue to show a rising trend—the updated data confirms this hypothesis for all countries studied.
The figures have been plotted and linear trendlines fitted. The value of R-squared is shown for each country. In linear regression, the trendline is drawn using the standard coefficient of determination formula. The R-squared value indicates the proportion of variance in the dependent variable that is predictable from the independent variable (time).
Figure 3.
Labor Cost Trends in Textile Industry for High Wage Countries (USD per Hour) with Linear Trendlines and R² Values.
Figure 3.
Labor Cost Trends in Textile Industry for High Wage Countries (USD per Hour) with Linear Trendlines and R² Values.
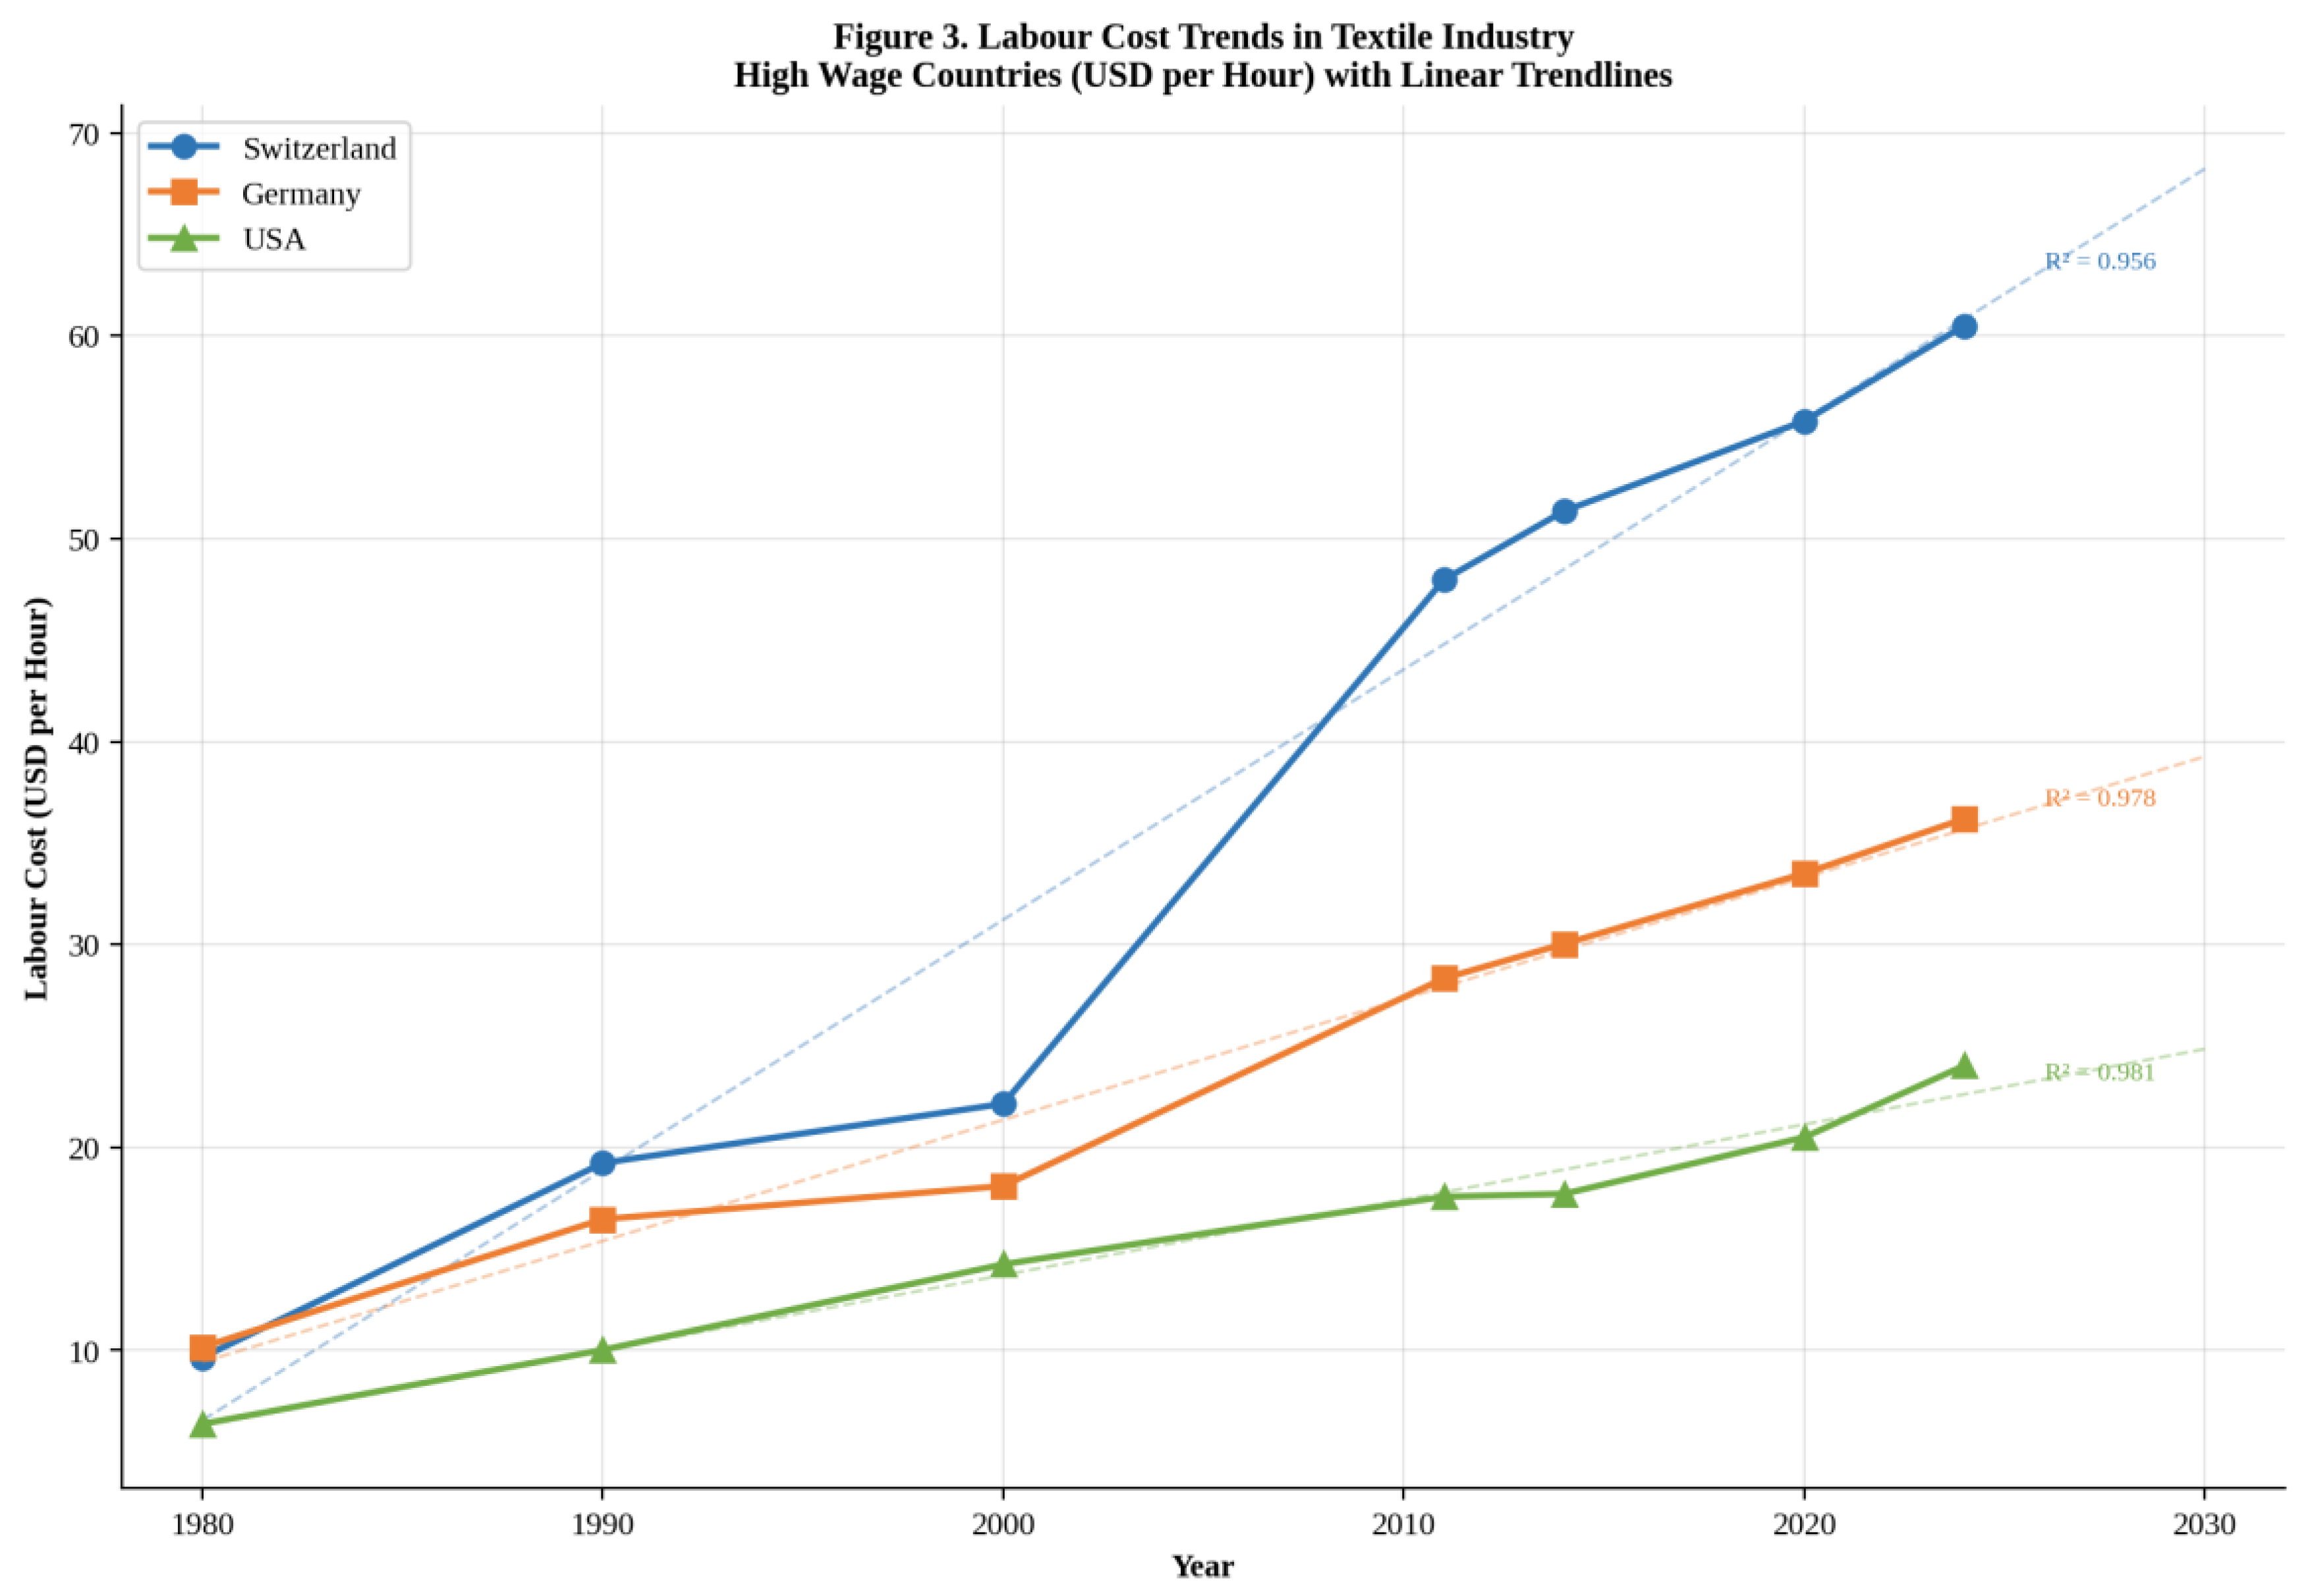
Figure 4.
Labor Cost Trends in Textile Industry for Low/Medium Wage Countries (USD per Hour) with Linear Trendlines and R² Values.
Figure 4.
Labor Cost Trends in Textile Industry for Low/Medium Wage Countries (USD per Hour) with Linear Trendlines and R² Values.
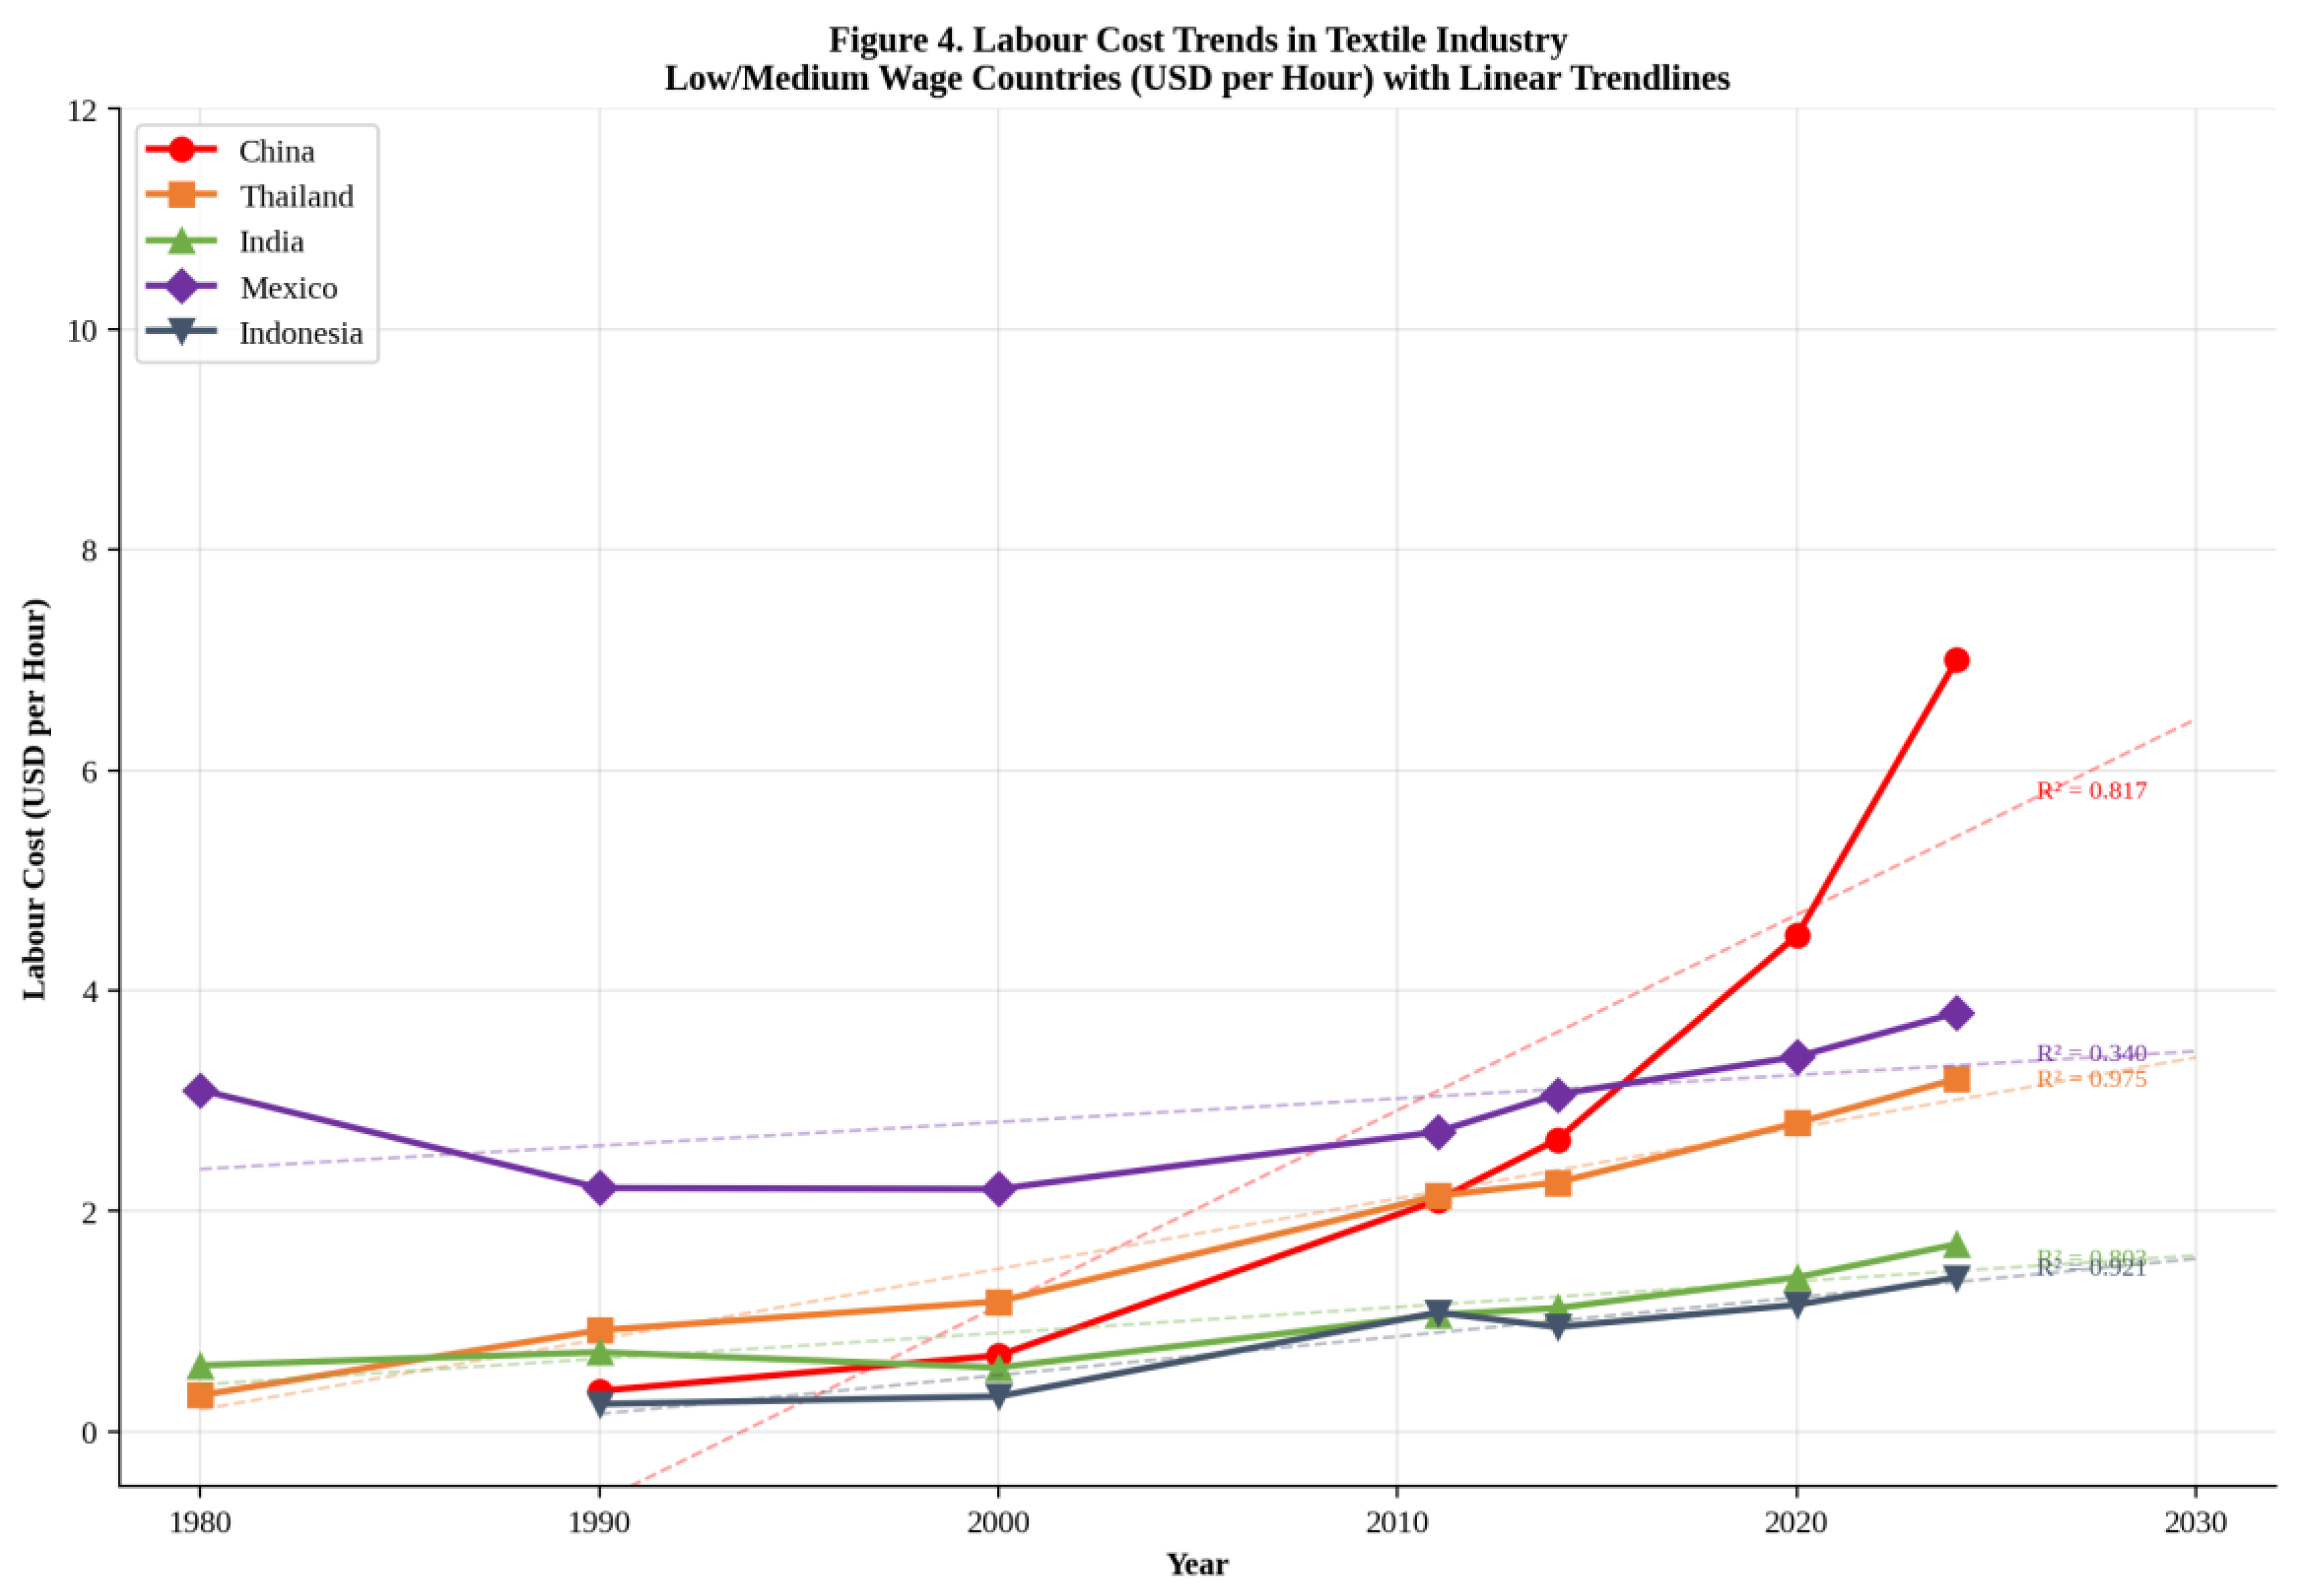
The updated data through 2024 confirms that the R-squared values remain high (above 0.8) for Switzerland, Germany, USA, and China. China’s hourly labor cost in the textile industry has risen dramatically from $0.69 in 2000 to an estimated $7.00 in 2024—a tenfold increase in 24 years (GlobalChinaSource, 2024). This trend has been a primary driver of the “China Plus One” diversification strategy adopted by many global brands.
China’s remarkable cost trajectory, shown in Figure 6, reflects its transition from a labor-abundant to a capital-abundant manufacturing economy. With manufacturing wages now averaging $7.00 per hour and reaching $8.00 per hour in developed coastal areas, China is no longer synonymous with “cheap labor.” The country is increasingly focused on higher-value and technical textiles, while lower-cost, basic apparel production shifts to Vietnam, Bangladesh, Cambodia, and Indonesia (Capital World Group, 2026).
India and Mexico continue to show lower rates of wage increase over the same time, though the updated data shows somewhat improved R-squared values compared to the original analysis. Indonesia has shown steady growth from $0.25/hour in 1990 to approximately $1.40/hour in 2024.
4. Distinguishing Low Wage Countries from High Wage Countries and Effects on Location Decisions
The stiff competition in clothing manufacture demands lower product cost. In the entire manufacturing operation, costs are influenced by several factors including raw materials, machinery, operating costs, labor costs, and compliance requirements. Labor cost has a higher impact when there is an increased requirement for labor. Furthermore, several factors differ from one country to another due to differences in cost of living, government policy, and infrastructure.
The landscape of apparel sourcing has evolved substantially since the original paper. Several major developments have reshaped location decisions for garment manufacturing:
First, the US-China trade tensions and 2025 reciprocal tariffs have had dramatic effects. Tariffs on Chinese apparel imports reached approximately 35% by late 2025, and new tariffs were announced on multiple Asian producers. Vietnam faced an initial 46% tariff threat (negotiated down to 20%), Bangladesh was subject to 37%, and Cambodia faced 49% (negotiated to 19%). These tariff disruptions have accelerated supply chain diversification away from single-country reliance (Cosmo Sourcing, 2025; Just-Style, 2025).
Second, the “China Plus One” strategy has become mainstream. Rising wages in China (garment workers in coastal hubs now earning $500–$800/month) combined with geopolitical tensions have pushed many brands to diversify production to Vietnam, Bangladesh, Cambodia, Indonesia, and India. However, this diversification is primarily for basic apparel, while complex, high-SKU, and fast-turn production often remains in China due to its superior infrastructure and skilled workforce (Capital World Group, 2026).
Third, automation and technology adoption are increasingly influencing location decisions. The ILO reports that established production hubs in Asia-Pacific are progressively integrating automation to offset rising labor costs. In China, factories that have invested in automation have seen labor costs compensated by efficiency gains, while factories still relying on labor-intensive methods face closure pressure (GlobalChinaSource, 2024).
Fourth, sustainability and compliance requirements now play a significant role. Concerns for environmental pollution, worker safety, and ethical manufacturing practices have become critical factors in sourcing decisions. The Rana Plaza disaster in Bangladesh (2013) catalyzed global attention to safety standards, and increasingly stringent EU and US regulations on supply chain due diligence are reshaping where brands choose to produce.
Fifth, Vietnam has emerged as a major manufacturing hub, with apparel exports reaching an estimated $44–$46 billion in 2024–2025. The country offers a competitive balance of cost, quality, compliance, and trade agreement access, though its heavy reliance on imported fabrics (particularly from China) remains a limitation (Cosmo Sourcing, 2025).
Indonesia has also gained momentum, with foreign direct investment in its textile sector jumping 107% to $903 million in 2024, driven by the US-China trade war and Vietnam reaching capacity constraints (Capital World Group, 2026).
5. Conclusions
The updated labor cost projections through 2025 confirm and extend the original paper’s central finding: global labor costs continue to rise across both developing and developed countries. The linear regression model used to analyze the labor cost data continues to show strong fit, with R-squared values greater than 0.8 for Switzerland, Germany, USA, China, Thailand, and Indonesia. India and Mexico show lower rates of wage increase but have also demonstrated upward trajectories.
Several significant conclusions emerge from the updated analysis:
The global gap in labor costs, while narrowing in relative terms, remains enormous in absolute terms. In 2024, the highest hourly textile labor cost (Switzerland at $60.50/hour) was approximately 43 times higher than the lowest among the countries studied (Indonesia at $1.40/hour). This compares to a ratio of approximately 82 times reported by Werner International in 2014 when comparing Switzerland to Bangladesh, suggesting that the gap is gradually narrowing.
China’s labor cost trajectory has been the most transformative development since the original paper. The tenfold increase from $0.69/hour in 2000 to $7.00/hour in 2024 has fundamentally altered global supply chain geography. China is no longer competitive for basic, labor-intensive apparel production and is transitioning to higher-value manufacturing.
The ILO Global Wage Report 2024–25 confirms that global real wages grew by 2.7% in the first half of 2024, the largest increase in over 15 years. However, the report also highlights a persistent and concerning decoupling between productivity and wages: in high-income countries, productivity rose 29% between 1999 and 2024 while real wages rose only 15%.
The apparel industry now operates in a significantly more complex environment than at the time of the original paper. US tariff policies (particularly the 2025 reciprocal tariffs), geopolitical tensions, pandemic-related supply chain disruptions, automation pressures, and sustainability compliance requirements have all added layers of complexity to sourcing decisions. The era of simple cost-based location decisions has given way to multi-factor analysis considering cost, tariff exposure, compliance risk, infrastructure quality, and supply chain resilience.
To compensate for the increase in cost of wages, it remains essential to increase average labor productivity. Increasing the competency of the workforce by education and training will enable developing countries to strengthen garment manufacturing. A supportive policy framework, including annual (rather than sporadic) minimum wage reviews as recommended by the ILO, would strengthen these efforts while providing more predictable cost trajectories for manufacturers and brands alike.
However, the calculations and forecasts do not account for political changes, sudden economic downturns or upturns, or unforeseen circumstances such as pandemics. The dramatic impact of COVID-19 on global wages in 2020–2022 demonstrated this limitation vividly. Additionally, currency values, GDP values, trade laws, and tariff policies framed by different countries may impact the forecasted values. It can be concluded that labor costs will continue to rise in both developing and developed countries, with the rate of convergence between them being shaped by automation adoption, trade policy, and sustainability requirements.
References
- ASEAN Briefing (2024). Cambodia Raises Minimum Wage for Garment and Footwear Sectors in 2025. Retrieved from https://www.aseanbriefing.com/news/cambodia-raises-minimum-wage-for-garment-and-footwear-sectors-in-2025/.
- Bardhan, P. (2006). Does globalization help or hurt the World’s poor? Scientific American, 294(4), 84–91. [CrossRef]
- Benjamin, W. P., & Skarbek, D. B. (2004). Sweatshops and Third World Living Standards: Are the Jobs Worth the Sweat? The Independent Institute.
- Cambridge Journal of Economics (2004). Global apparel production and sweatshop labor: can raising retail prices finance living wages? Cambridge Journal of Economics, 28(2), 153–171. [CrossRef]
- Capital World Group (2026). Top 10 Biggest Clothing Manufacturing Countries 2025. Retrieved from https://capitalworldgroup.com/clothing-manufacturing-countries/.
- Cosmo Sourcing (2025). Top Clothing, Garment, and Apparel Manufacturing Countries Guide. Retrieved from https://www.cosmosourcing.com/blog/the-top-12-countries-for-clothing-garment-and-apparel-manufacturing.
- Customcy (2026). Global Apparel Industry Statistics for 2026. Retrieved from https://customcy.com/blog/apparel-industry-statistics/.
- GlobalChinaSource (2024). China 2024 Manufacturing Hourly Labor Cost: Latest Data & Trends. Retrieved from https://globalchinasource.com/Blog/10771.html.
- Grand View Research (2025). Apparel Market Size, Share & Trends Analysis Report. [CrossRef]
- IBISWorld (2025). Global Apparel Manufacturing Industry Analysis, 2025. Retrieved from https://www.ibisworld.com/global/industry/global-apparel-manufacturing/470/.
- ILO (2022). Employment, wages and productivity trends in the Asian garment sector: Data and policy insights for the future of work. International Labor Organization.
- ILO (2024). Global Wage Report 2024–25: Is wage inequality decreasing globally? International Labor Organization, Geneva.
- ITUC (2024). ILO Global Wage Report: Uneven wage recovery shows urgent need for fair pay and living wages. International Trade Union Confederation.
- Just-Style (2025). Cambodia government sets new minimum wage for garment sector. Retrieved from https://www.just-style.com/news/cambodia-garment-workers-wage/.
- Cornell ILR Global Labor Institute (2025). Waiting Game: Minimum wage-setting. GLI Policy Brief, February 2025. Cornell University.
- Onada Corporation (2015). Average Exchange Rates. Retrieved from http://www.oanda.com/currency/average.
- Pettinger, T. (2014). UK Labor Productivity. Economics Help. Retrieved from http://www.economicshelp.org/blog/5887/economics/uk-labour-productivity/.
- Robertson, R., & Lopez-Acevedo, G. (2012). Sewing Success? Employment, Wages, and Poverty Following the End of the Multi-Fiber Arrangement. Washington, D.C.: The World Bank.
- The Business Standard (2025). Ensuring fair wages while keeping Bangladesh’s RMG sector competitive. Retrieved from https://www.tbsnews.net/.
- Textile Outlook International (2015). Trends in world textile and clothing trade. Textile Outlook International, (2), No. 173–P112.
- U.S. Bureau of Labor Statistics (2025). Average hourly wage for apparel manufacturing industry, August 2025. Retrieved from https://www.bls.gov/.
- Wages and Working Hours in the Textiles, Clothing, Leather and Footwear Industries (2014). Issues Paper for discussion at the Global Dialogue Forum, Geneva. International Labor Organization.
- Werner International (2014). International Comparison of Hourly Labor Cost in the Primary Textile Industry. Werner International Management Consulting.
- Worker Rights Consortium (2013). Global Wage Trends for Apparel Workers, 2001–2011. Center for American Progress.
- Worker Rights Consortium (2023). Bangladesh Minimum Wage Negotiations Put Brands’ Living Wage “Commitments” to the Test. Retrieved from https://www.workersrights.org/.
Figure 5.
Global Real Wage Growth (%), 2019–2024. Source: ILO Global Wage Report 2024–25.
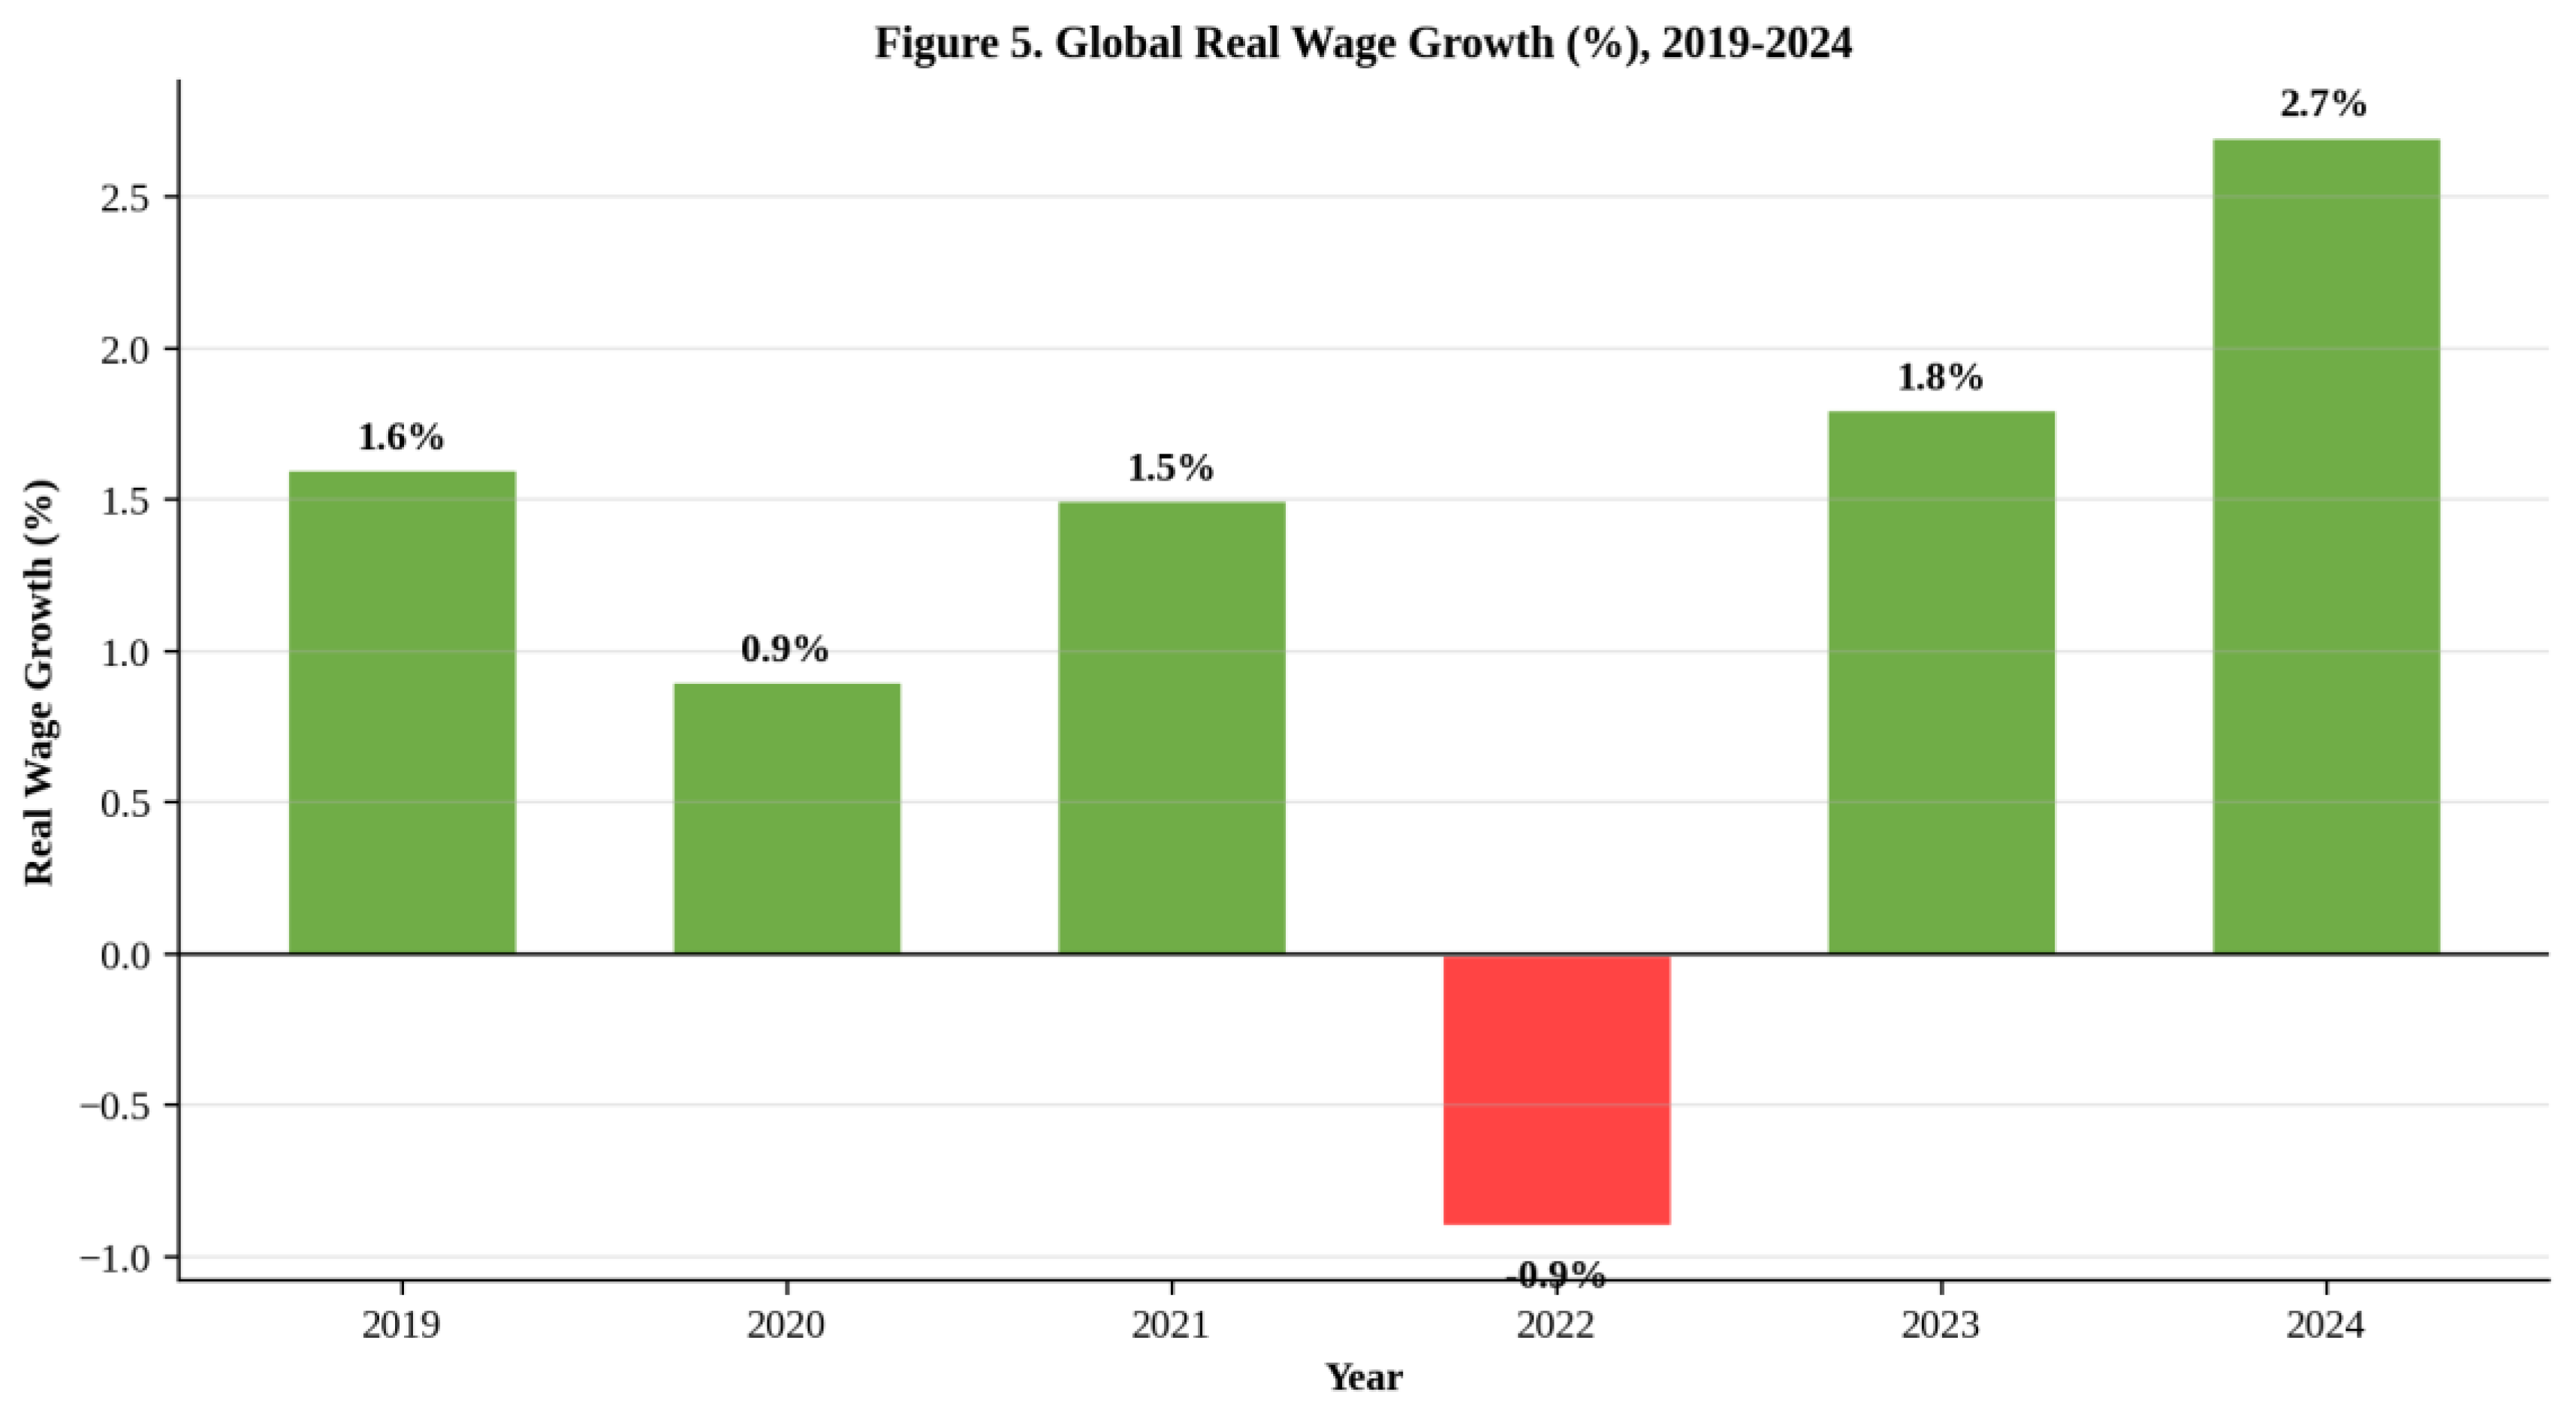
Figure 1.
Comparison of Monthly Minimum Wages for Garment Workers in Selected Countries (2015 vs 2025).
Figure 1.
Comparison of Monthly Minimum Wages for Garment Workers in Selected Countries (2015 vs 2025).
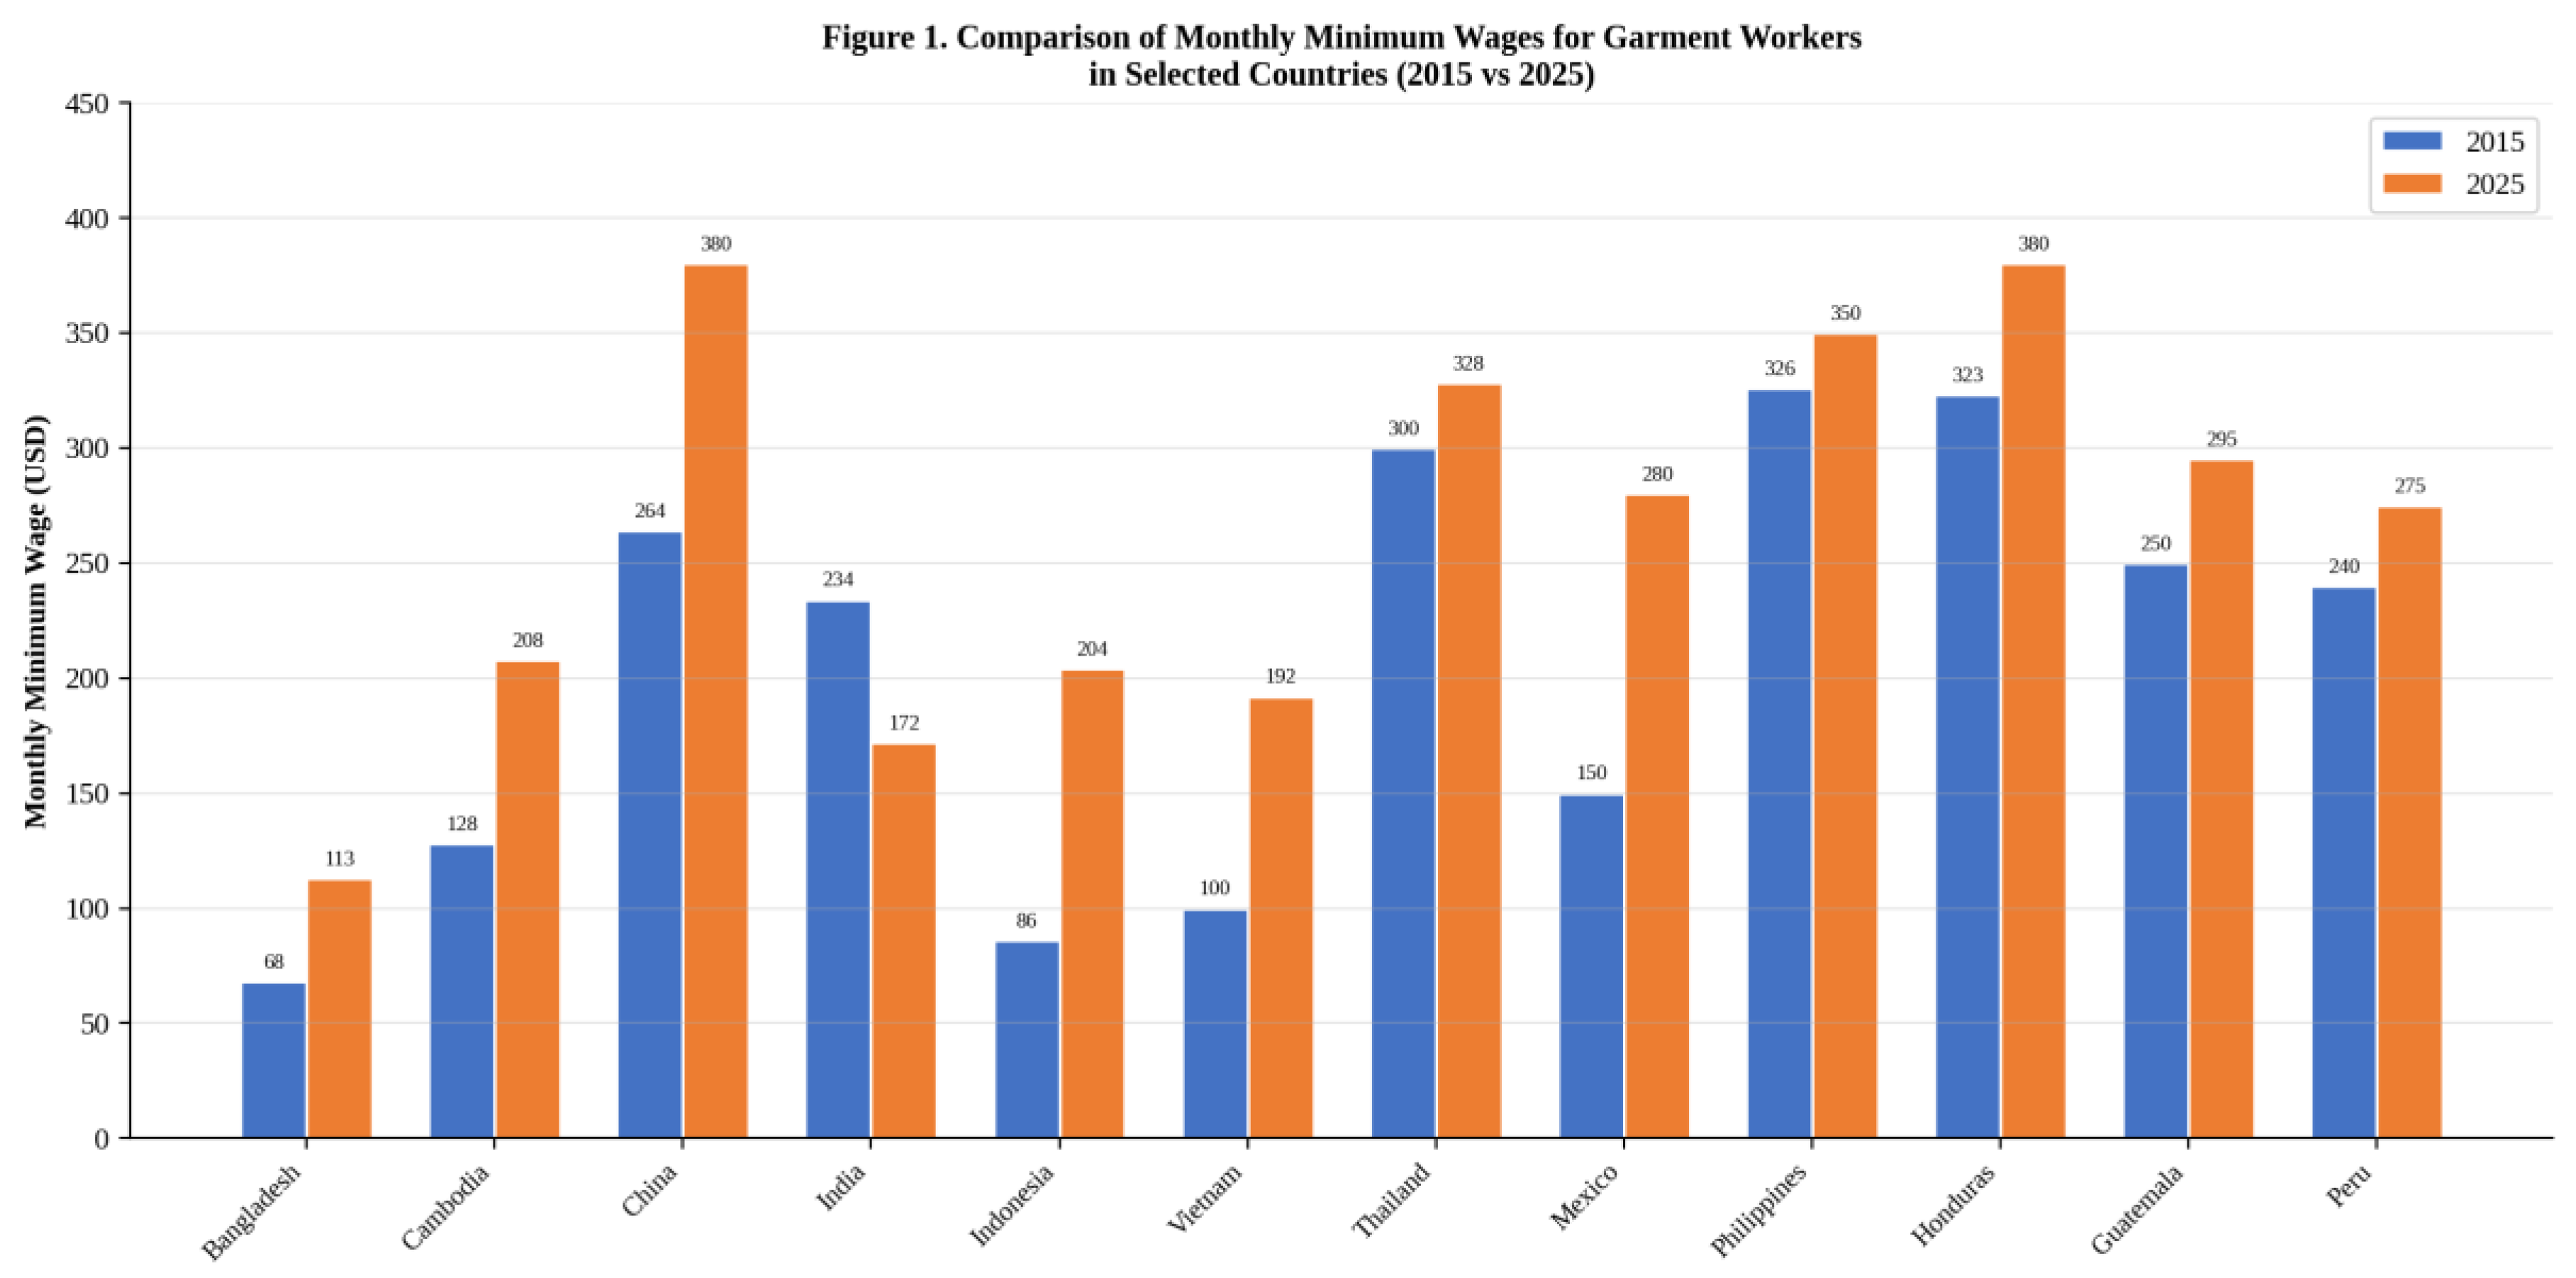
Figure 6.
China’s Textile Industry Hourly Labor Cost Growth (2000–2024).
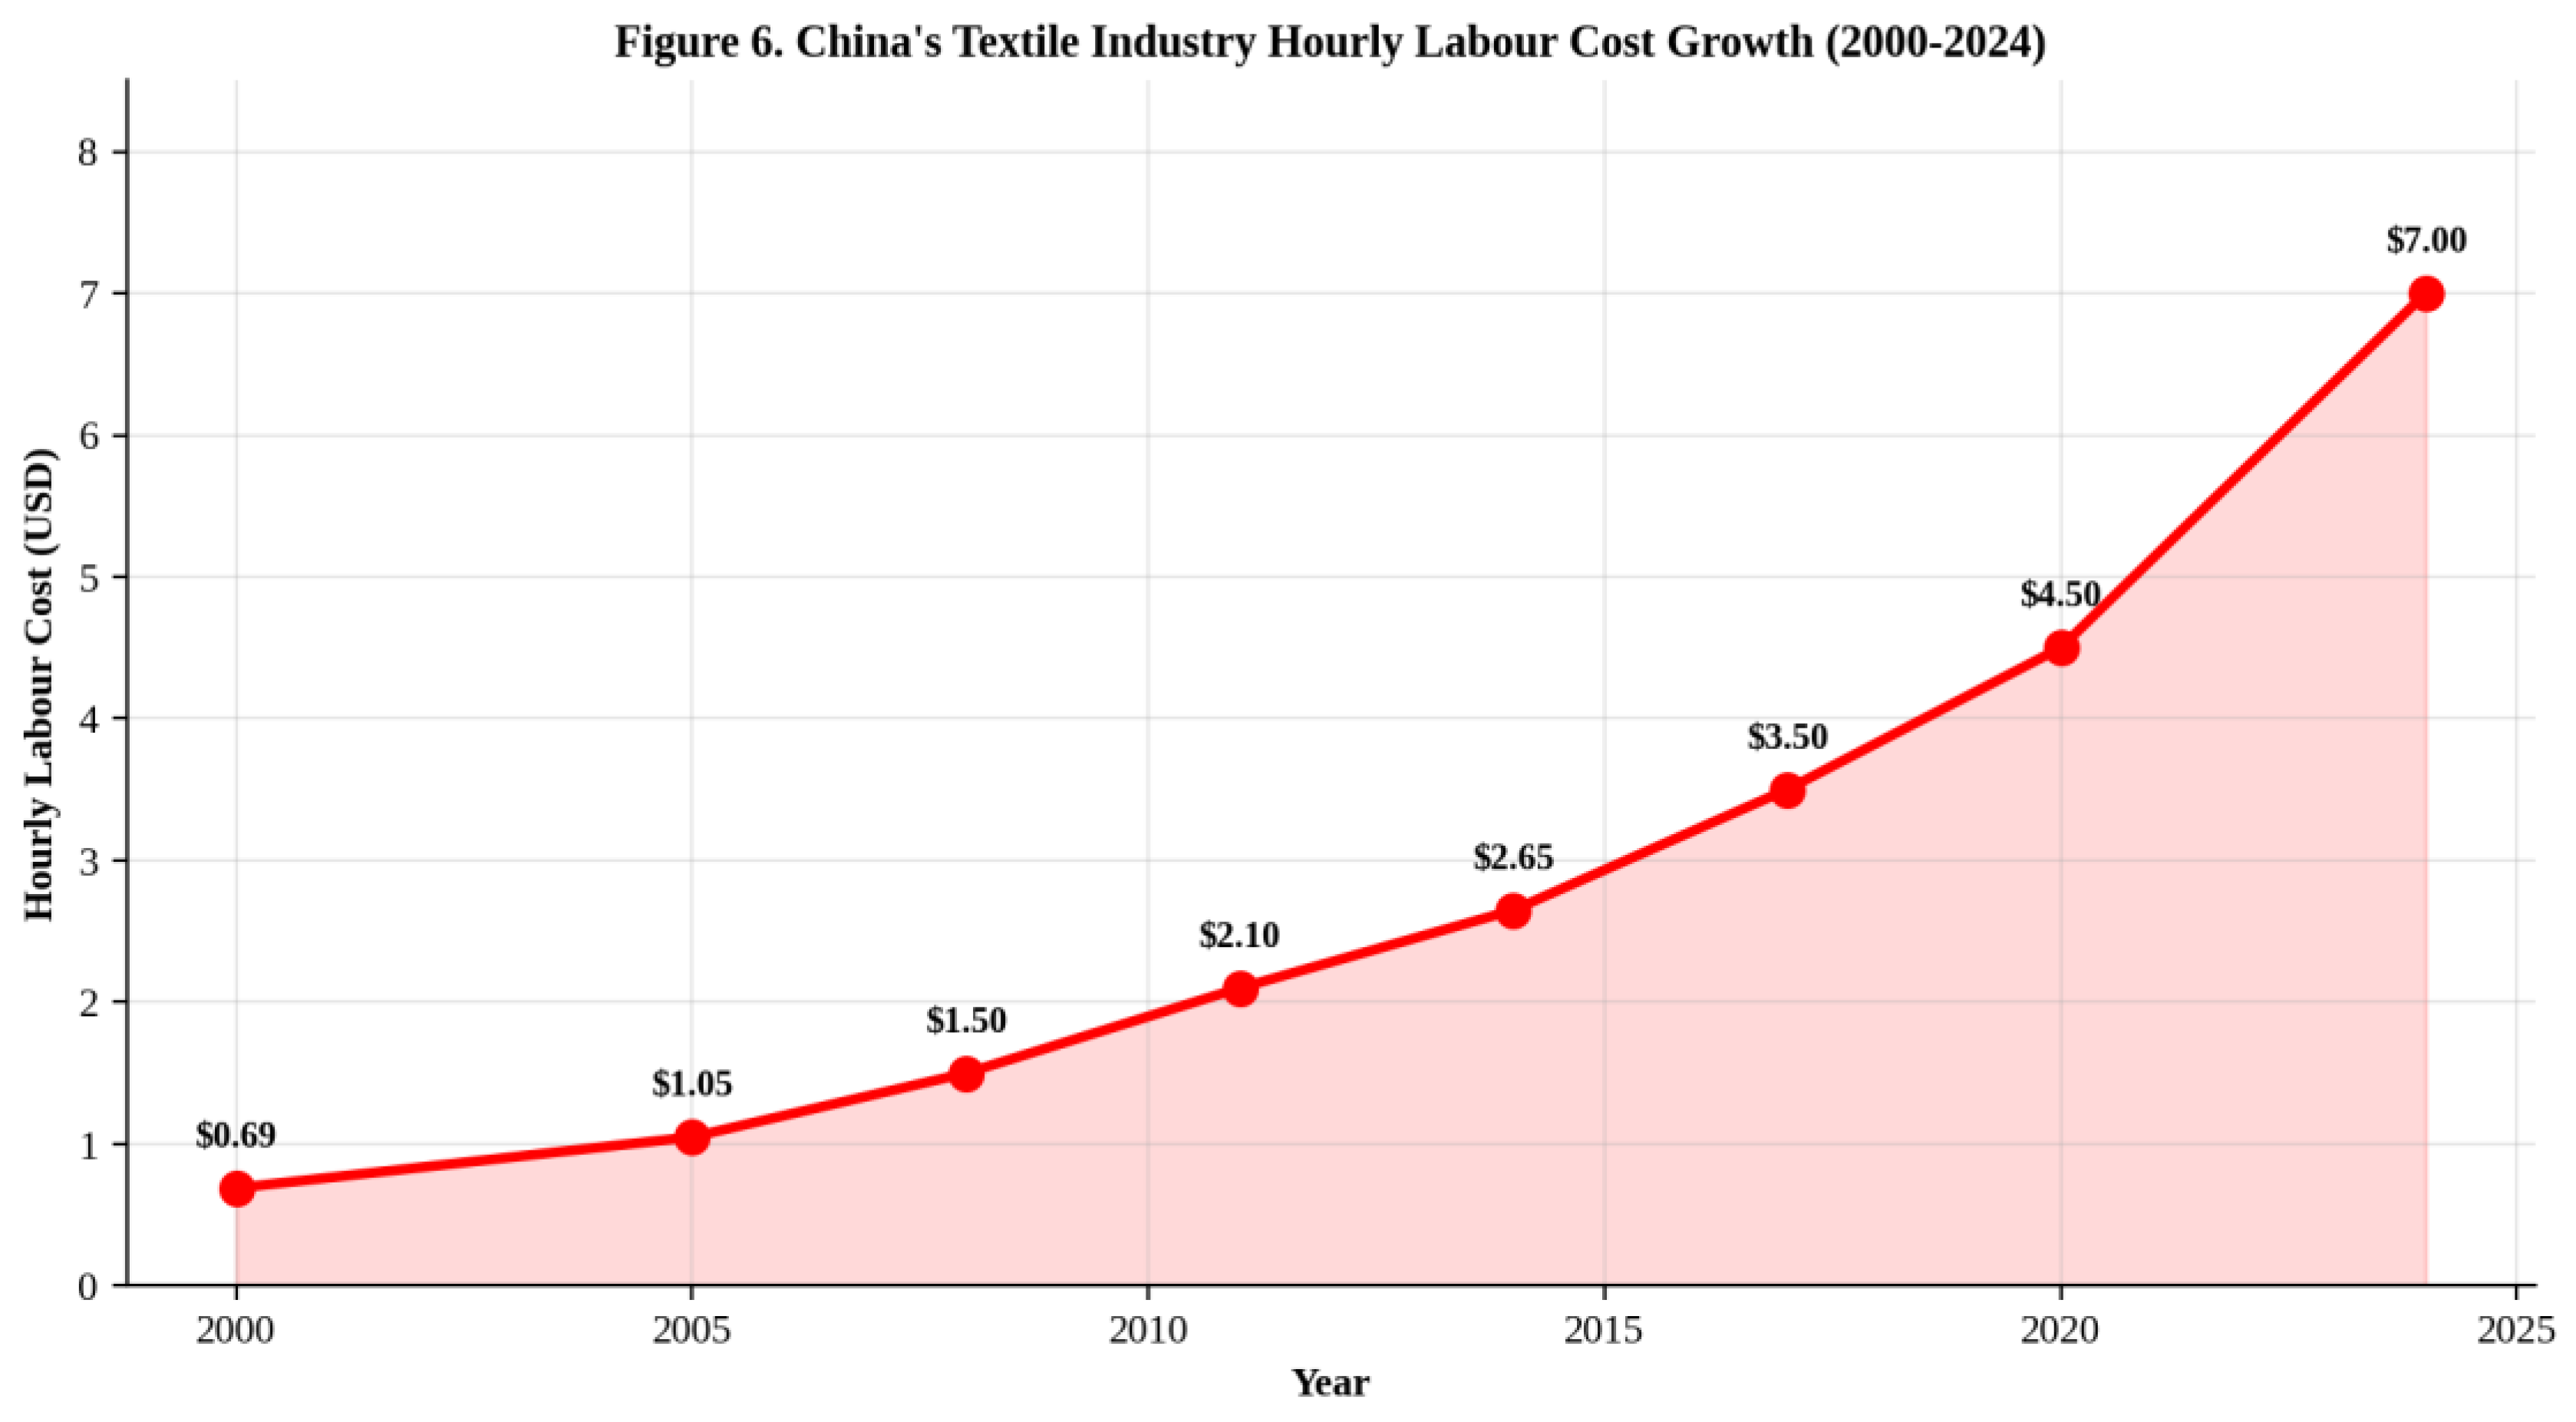

Table 1.
Comparison of Monthly Wages for Different Time Periods: Real Wages, Prevailing Wages and Minimum Wages in Selected Countries (USD).
Table 1.
Comparison of Monthly Wages for Different Time Periods: Real Wages, Prevailing Wages and Minimum Wages in Selected Countries (USD).
| Sr. | Country | 2001 Wages (USD/month) | 2011 Wages (USD/month) | Min Wage 2015 (USD) | Min Wage 2020 (USD) | Min Wage 2025 (USD) | % Change 2015-2025 | % Change 2001-2025 |
|---|---|---|---|---|---|---|---|---|
| 1 | Bangladesh | 44 | 58 | 68 | 95 | 113 | +66% | +157% |
| 2 | Cambodia | 51 | 70 | 128 | 190 | 208 | +63% | +308% |
| 3 | China | 58 | 207 | 264 | 310 | 380 | +44% | +555% |
| 4 | India | 43 | 99 | 234 | 176 | 172 | -26% | +300% |
| 5 | Indonesia | 42 | 143 | 86 | 181 | 204 | +137% | +386% |
| 6 | Vietnam | 50 | 118 | 100 | 155 | 192 | +92% | +284% |
| 7 | Thailand | 139 | 230 | 300 | 310 | 328 | +9% | +136% |
| 8 | Mexico | 521 | 421 | 150 | 185 | 280 | +87% | -46% |
| 9 | Philippines | 122 | 107 | 326 | 210 | 350 | +7% | +187% |
| 10 | Honduras | 182 | 251 | 323 | 340 | 380 | +18% | +109% |
| 11 | Guatemala | 221 | 300 | 250 | 270 | 295 | +18% | +33% |
| 12 | Peru | 166 | 261 | 240 | 250 | 275 | +15% | +66% |
| 13 | El Salvador | 18 | 25 | 211 | 215 | 220 | +4% | +1122% |
| 14 | Haiti | 61 | 144 | 184 | 190 | 200 | +9% | +228% |
| 15 | Dominican Rep. | 177 | 170 | 130 | 175 | 195 | +50% | +10% |
Sources: Center for American Progress/Worker Rights Consortium (2013); BGMEA (2025); ASEAN Briefing (2024); ILO (2024); Cosmo Sourcing (2025); Capital World Group (2026); The Business Standard (2025); Just-Style (2025).
Table 2.
Range of Monthly Wages in Clothing Industry in 2025 in Selected Countries (USD).
| Range of Wages (USD/Month) | Countries |
|---|---|
| Up to 150 | Myanmar, Sri Lanka, Bangladesh, Pakistan, Ethiopia |
| 150–250 | Vietnam, India, Cambodia, Indonesia, Egypt, Mexico, El Salvador, Tunisia |
| 250–400 | China, Thailand, Guatemala, Peru, Philippines, Honduras, Malaysia, Morocco |
| 400–600 | Turkey, Colombia, Dominican Republic |
| 600–900 | Taiwan, Korea, Panama |
| 900–1500 | Portugal, Spain, Greece |
| 1500+ | USA, Germany, Italy, Japan, Switzerland, France |
Sources: ILO (2024); Cosmo Sourcing (2025); Capital World Group (2026); The Business Standard (2025); ASEAN Briefing (2024).
Table 3.
Labor Cost for Textile Industry for Selected Countries in USD per Hour (1980–2024).
| Sr. | Country | 1980 | 1990 | 2000 | 2011 | 2014 | 2020 | 2024 |
|---|---|---|---|---|---|---|---|---|
| 1 | Switzerland | 9.65 | 19.23 | 22.15 | 47.98 | 51.36 | 55.80 | 60.50 |
| 2 | Germany | 10.16 | 16.46 | 18.10 | 28.33 | 30.03 | 33.50 | 36.20 |
| 3 | USA | 6.37 | 10.02 | 14.24 | 17.57 | 17.71 | 20.50 | 24.03 |
| 4 | Mexico | 3.10 | 2.21 | 2.20 | 2.72 | 3.06 | 3.40 | 3.80 |
| 5 | China | — | 0.37 | 0.69 | 2.10 | 2.65 | 4.50 | 7.00 |
| 6 | Thailand | 0.33 | 0.92 | 1.18 | 2.14 | 2.26 | 2.80 | 3.20 |
| 7 | India | 0.60 | 0.72 | 0.58 | 1.06 | 1.12 | 1.40 | 1.70 |
| 8 | Indonesia | — | 0.25 | 0.32 | 1.08 | 0.95 | 1.15 | 1.40 |
Sources: Textile Outlook International (2015) for 1980–2014 data; Werner International; U.S. Bureau of Labor Statistics (2025); GlobalChinaSource (2024); industry estimates for 2020 and 2024 values.
Disclaimer/Publisher’s Note: The statements, opinions and data contained in all publications are solely those of the individual author(s) and contributor(s) and not of MDPI and/or the editor(s). MDPI and/or the editor(s) disclaim responsibility for any injury to people or property resulting from any ideas, methods, instructions or products referred to in the content. |
© 2026 by the authors. Licensee MDPI, Basel, Switzerland. This article is an open access article distributed under the terms and conditions of the Creative Commons Attribution (CC BY) license (http://creativecommons.org/licenses/by/4.0/).
Copyright: This open access article is published under a Creative Commons CC BY 4.0 license, which permit the free download, distribution, and reuse, provided that the author and preprint are cited in any reuse.