

Submitted:
02 October 2026
Posted:
05 October 2026
You are already at the latest version
Abstract
Prior research links wealth transfers to reduced labour force participation, but their effects on intra-household allocation of domestic tasks remain unexplored. This paper explores how inheritances impact gender differences in time use within the household among heterosexual couples older than 50 years in Europe. We use panel data from the Survey of Health, Ageing and Retirement in Europe (SHARE) to analyse the time spent on paid work, unpaid work, and leisure. We employ a Pooled Ordinary Least Squares (OLS) model with fixed effects to estimate the impact of inheritances greater than €5,000 on time allocation to different activities within the household. Specifically, we adopt the intra-household approach to assess ownership, where we consider inheritances as individual assets, rather than the mainstream approach of inheritance pooling that considers inheritances as household assets. Our results show that women significantly reduce their time spent on unpaid work, specially when they are the inheritance owners and when they are aged between 50 and 70 years. Robustness analyses support these results, we find that the mechanism behind the decline in unpaid work is outsourcing to the market, and the results are mainly driven by liquidity constrained households. Our findings suggest that intergenerational wealth transfers in ageing societies shift intra-household dynamics, enhancing women’s bargaining power and reducing inequality in unpaid work among the poorest households.
Keywords:
intra-household bargaining
; time allocation
; wealth shocks
1. Introduction
The objective of this article is to analyse how inheritances affect time allocation by gender within the household among the population older than 50 years in Europe. Significant disparities persist: women spend more time on unpaid domestic care work, while men allocate more time to the labour market. Women perform over three-quarters (76.4%) of unpaid domestic work globally, spending on average 2 hours and 48 minutes more per day on these tasks than their male counterparts (Hanna et al., 2023; UNDP, 2024). This contributes to the under-representation of women in higher-paid positions, which is associated with poorer economic outcomes, lower labour market opportunities, and lower wealth accumulation (WEF, 2022). Although overall gender gaps have narrowed, labour market participation remains the main challenge, with the lowest level of parity (Campaña et al., 2023; WEF, 2023).
Over the last decades, women have been reducing their time devoted to domestic tasks and increasing their labour force participation through the adoption of technologies (Greenwood et al., 2005), but financial constraints (lack of liquidity, income or wealth) are still a barrier to this transition. Monetary transfers, such as inheritances, are (exogenous) wealth shocks that influence individual time allocation (Browning & Chiappori, 1998), thereby affecting bargaining power within the household (Jayachandran & Voena, 2026; Molina et al., 2023). The effects of monetary transfers on labour supply are well-documented: large monetary transfers disincentivise labour market participation (Holtz-Eakin
et al., 1993; Imbens et al., 2001; Kaplan, 1987), especially for women (Belloc et al., 2025; Malo & Sciulli, 2021), and positive effects have been identified for specific population groups (Cox, 2014). Belloc et al. (2025) find a 5.3 percentage-point reduction in female labour participation after an unexpected inheritance. However, there is limited knowledge about the effect of wealth transfers on domestic tasks by gender (Malo & Sciulli, 2021).
Using longitudinal data from waves 7, 8, and 9 (2017-2022) of the Survey of Health, Ageing and Retirement in Europe (SHARE), we examine how inheritances exceeding €5,000 affect the intra-household time reallocation among older European adults. We rely on self-reported stylized data on time allocation to paid work, unpaid work, and leisure, alongside information on inheritance receipt. Our methodology estimates a Pooled Ordinary Least Squares (OLS) model with fixed effects, including control variables to address potential omitted variable bias (Bertrand et al., 2004; Roth & Sant’Anna, 2023). Inheritance ownership is assigned to the individual most closely related to the deceased, following the methodology of Belloc et al. (2025). Robustness checks include alternative model specifications and subsamples, exploring an inheritance pooling unitary model, inheritance expectations, liquidity constraints, and underlying mechanisms.
We find that women significantly reduce their unpaid work, especially those aged between 50 and 70 years who receive an inheritance, although the results persist when the husband receives the inheritance or the recipient is unknown. This result is mainly driven by liquidity-constrained households, which strongly reduce their unpaid work time compared to slight reductions among unconstrained households. We identify outsourcing (increase in spending eating outside) as a mechanism. Finally, we observe that men’s time allocation remains rigid across most specifications, consistent with gender differences in altruism and egoism (Molina et al., 2023; Moro, 2025; Schulz & Raab, 2023), which carry relevant policy implications.
Our contribution is twofold. First, we extend the analysis of gender differences beyond the traditional focus on the labour market by incorporating unpaid work and leisure. Second, we adopt an individual approach to inheritance ownership and analyse how the intra-household reallocation of time in response to wealth transfers affects the time use gender gap and bargaining power within the household.
2. Literature Review
2.1. Theoretical Framework of Time Allocation and Wealth Shocks
Traditional unitary models of time allocation formalize the trade-off between market work, home production, and leisure. The theoretical framework by Becker (1965) conceptualizes these decisions as a utility maximization problem, distinguishing between market work and leisure consumption, assuming a household income pooling restriction. Gronau (1977) later extended this model, including home production and care activities, providing a framework to evaluate women’s time allocation decisions. This model divides non-market time into leisure (activities with poor market substitutes) and home production, defined as those activities that have market substitutes and can be performed by someone else. Within this framework the introduction of technology has historically liberated women from domestic tasks and allowed them to participate in the labour market, acting as an engine of liberation (Cavalcanti & Tavares, 2008; Greenwood et al., 2005). However, the capacity to adopt or consume these technologies relies heavily on household income and wealth.
In traditional life-cycle models, an exogenous wealth shock leads to higher consumption and potentially more leisure time. However, Hubbard et al. (1995) show that exogenous wealth shocks have heterogeneous effects on savings and consumption over the life-cycle depending on liquidity and financial restrictions. Financially constrained households may react to wealth shocks, such as inheritances, while wealthier households have already smoothed their consumption over time. Wealthier households can fully or partially insure against transitory income shocks (Blundell et al.,
2008), or even permanent shocks such as the death of the breadwinner (Fadlon & Nielsen, 2021), showing no changes, while low-wealth, liquidity-constrained households show significant sensitivity to these shocks. This is crucial in the context of older populations, where time allocation does not merely respond to a work-leisure trade-off but functions as an intra-household insurance mechanism, and a exogenous wealth transfer, such as an inheritance, affects time allocation within the household.
Cooperative bargaining models provide a more realistic framework for intra-household decisions by treating the individual, rather than the household, as the unit of interest. Browning and Chiappori (1998) empirically rejected the income-pooling hypothesis, showing that intra-household allocation is based on a complex decision-making process, individual preferences and bargaining power, which can be defined as the degree of influence over choices that the household makes (Jayachandran & Voena, 2026). Within this framework, efficient outcomes are achieved through a Nash-bargaining solution, where decisions depend on a distribution index (generally including prices, total expenditure, and factor distribution). Thus, individual responses to wealth transfers depend on their relative position within the household. Within collective bargaining models, inheritances represent a shift in these factors (Blau & Kahn, 2007), producing a vertical shift in the home production curve (Eder, 2016). For women, income shocks yield mixed results, but increasing control over earnings provides strong positive effects on bargaining power (Jayachandran & Voena, 2026). Furthermore, for individuals not participating in market work prior to inheritance receipt (due to low wage rates, for example), models predict that time allocation across all activities would remain unchanged (Gronau, 1977).1
2.2. Gender Differences in Time Allocation
The literature shows systematic gender differences in time allocation, with the partner with higher earnings (usually men) spending more time on paid work, while the partner with lower earnings (women) spends more time on unpaid household activities. Rubiano Matulevich and Viollaz (2019) found that men spend 2.7 more hours per day on paid work than women, while women spend 3.2 more hours per day on unpaid domestic work. While unitary household frameworks suggest labour specialization to maximize a single household utility function (Becker, 1965), alternative cooperative and collective bargaining models propose individual utility functions for spouses, leading to potential conflicts of interest and the need for intra-household bargaining (Browning & Chiappori, 1998; Molina et al., 2023). Empirical evidence consistently shows that household chores and caregiving activities are among the most stressful and least enjoyable daily tasks (Kahneman & Krueger, 2006; Kahneman et al., 2004). This disutility arises not only from the physical demands of home production but also from the “double burden” of balancing labour market participation and domestic work, which negatively impacts women’s mental health and well-being (Giménez-Nadal et al., 2025; Gimenez-Nadal & Sevilla-Sanz, 2011).
However, there is evidence that women with high education and earnings still devote more time to housework than men with lower education and earnings (Gimenez-Nadal, 2022). These disparities persist across countries, age groups, and educational levels (García-Mainar et al., 2011), suggesting that social determinants and welfare state characteristics heavily influence task division. Balancing labour market participation and domestic work often requires individuals to use sleep quantity and quality as a primary adjustment mechanism (Biddle & Hamermesh, 1990). These dynamics were further exposed during the COVID-19 pandemic, which significantly impacted intra-household bargaining with highly heterogeneous effects across countries (Augustine & Prickett, 2022; Collins et al., 2021; Elsner et al., 2024; Knize et al., 2022). Consequently, the intra-household allocation of time serves as a direct manifestation of bargaining power, where domestic tasks often reflect gender roles or the “price” for marital stability. IN this context, when a household receives an exogenous wealth shock, the recipient’s bargaining power increases (Jayachandran & Voena, 2026) as outside options (e.g., divorce, outsourcing) become more attractive, especially for financially constrained households.
2.3. Wealth Transfers and Labour Supply
Inheritances have been the most extensively studied source of wealth transfer, with substantial literature examining their effects on labour market participation. Holtz-Eakin et al. (1993) discuss Carnegie’s conjecture2, and provide a life-cycle framework to explain that, ceteris paribus, the receipt of an inheritance reduces both labour supply and earnings, with the magnitude of the effect varying according to inheritance size. Nonetheless, the empirical evidence remains mixed and highlights important gender and geographical differences. Tur-Sinai et al. (2022) confirm the negative effect of inheritances on economic activity, although other studies find no significant labour market response, and some even identify positive effects among men, particularly in cases of expected inheritances (Suari-Andreu, 2023). Doorley and Pestel (2016) suggest that when decisions are made at the household level, inheritances can be anticipated, allowing individuals to adjust their labour supply smoothly over their life cycle, mitigating the impact of wealth transfers. Consequently, responses may be different depending on assumptions, such as perfect/imperfect inheritance anticipation, and liquidity constraints. Doorley and Pestel (2016) find empirical evidence supporting a reduction in women’s labour market participation by 1.5 hours of work per week following an inheritance. Belloc et al. (2025) similarly find that inheritances reduce labour participation among European women by 5.3 percentage point. In Japan, inheritance reduces labour supply only among women, with no significant effect for men, and little evidence of anticipation (Niizeki & Hori, 2019).
Beyond inheritances, exogenous monetary windfalls can arise from other sources, such as lottery winnings. Studies examining lottery winners find similar results, using a source of wealth transfer that is randomly assigned. Kaplan (1987) found that, in a sample of 576 lottery winners from 12 U.S. states, with prizes ranging from $50,000 to millions, some of them retired earlier than expected, while those engaged in psychologically and financially rewarding jobs continued to work regardless of the prize size. Later, Imbens et al. (2001) confirmed these findings, studying a sample of lottery winners in Massachusetts in the mid-1980s. They concluded that the marginal propensity to earn money after winning a prize was negative (-11%), mainly due to reduced labour supply. The empirical evidence shows that the intensity of the effect on labour participation depends on the size of the wealth transfer, with stronger effects for larger inheritances, as well as the timing of to retirement (Eder, 2016). However, some researchers offer alternative perspectives. Cox (2014) argues that inheritances may have positive effects by stimulating young people’s ambition to enter entrepreneurship, and thus increasing hours worked in self-employment. The role of expectations is crucial to control for anticipation effects (Tur-Sinai et al., 2022); we distinguish between the type of donor (family or non-family) to account for the level of inheritance expectation.
Gender differences in the effects of wealth transfers on time allocation patterns remain largely unexplored. Malo and Sciulli (2021) observe significant differences in labour market participation by gender after receiving a wealth transfer, using the type of donor as an instrumental variable to infer the level of anticipation. Although their study relies on a cross-sectional database, they specifically found a strong decrease in female labour market participation and a non-significant effect for men. Additionally, Belloc et al. (2025) tested the inheritance pooling hypothesis and showed that inheritance ownership has different effects on labour participation by gender. Inheritances play a crucial role in reducing gender gaps (Black et al., 2022, 2025), but they do not consider the effect of inheritances on labour participation. Further attention to the caregiving dynamics is needed in the context of wealth transfers to analyse the evolution of the gender gap in time use; moreover, as caregivers tend to be women, it is crucial to consider the interplay between inheritances, care responsibilities, and labour supply (Cox, 2014).
Although there has been a long-term convergence in labour force participation between men and women over the last century (Greenwood et al., 2005), a significant gender gap remains. This persistent gap is not necessarily the result of explicit discrimination, but rather of structural features of the labour market, gender roles, and bargaining power. Understanding how wealth transfers interact with intra-household time allocation patterns by gender provides insights for policy design aimed at reducing gender inequalities in both time use and the labour market.
3. Data and Descriptive Statistics
3.1. Data and Variables
This research employs the Survey of Health, Ageing and Retirement in Europe (SHARE)3, a longitudinal multidisciplinary panel study conducted every two years since 2004 across 27 European countries plus Israel. The survey targets individuals aged 50 and older, and their partners (regardless of their age), including those in residential care and nursing homes (Bergmann & Börsch-Supan, 2021; Börsch-Supan et al., 2013).). The database contains comprehensive information on health, socio-economic status, and behaviours of older European citizens. The same individuals are interviewed across waves for as long as possible, including periodic refreshment samples to address attrition due to mortality and non-response. We construct a panel dataset by merging Wave 7 (2017), Wave 8 (2019), and Wave 9 (2022) of the SHARE to track individuals over time and to analyse the effects of inheritances on time allocation to different activities by gender. Questionnaires are standardized and anonymized to allow for comparison of responses.
Our baseline sample is restricted to heterosexual couples living together, observed for at least two waves, and with complete information. Our analysis excludes refreshment samples from Wave 9, which leaves 29,826 observations with 13,188 individuals (6,594 couples) from 18 countries4. Furthermore, to capture the trade-offs between market work and home production, we restrict the sample to individuals aged 50 to 70, who are more likely to be still attached to the labour market. While our primary focus is on the time expenditure and financial transfers modules, we draw on other modules to complete the set of covariates (SHARE-ERIC, 2017, 2019, 2022). Since time use variables are only available for Waves 8 and 9, Wave 7 is included to provide at least one lag for control variables.
The Financial Transfers module provides information on monetary transfers. We identify whether the individual (or spouse) received a wealth transfer larger than €5,000 since the previous interview (an inheritance)5. The inheritance variable is a dummy taking a value of 1 if the transfer was received, and 0 otherwise. We then classify inheritance ownership within couples based on family relationships into three categories: own, spouse and unknown6. Following Belloc et al. (2025), inheritances from direct relatives are assigned to the respondent (“Mother”, “Father”, “Stepmother”, “Stepfather”, “Brother”, or “Sister”), those from parents-in-law to the spouse (“Mother-in-law” or “Father-in-law”), and those from extended family members (“Son-in law”, “Daughter-in-law”, “Grandchild”, “Grandparent”, “Aunt” or “Uncle”) as “unknown” due to insufficient information. This ownership assignment allows us to test directly for shifts in intra-household bargaining power rather than relying on a unitary household assumption. For robustness, we also construct an expectations measure7 based on family relations: inheritances from close family members are considered “expected” while inheritances from non-family members are “unexpected”. Finally, we control for the death of parents in previous periods to isolate the effect of the wealth transfer on time allocation as it is clearly correlated with caregiving.
The Time Expenditure module, conducted during the last two waves of the SHARE, Wave 8 and Wave 9, captures information on daily time allocation. Individuals are interviewed to record their time use during the day before the interview by answering the following question: “How much time did you spend yesterday on...?”, where they were asked about different daily activities: chores, personal care, help children, helping parents, helping partner, helping other family members, leisure, administrative chores, paid work, voluntary work, travelling to work, napping, and sleep at night (SHARE-ERIC, 2019, 2022). For our baseline model, we aggregate them into three categories: paid work, unpaid work (chores, help children, parents, partner or other family members, administrative chores, voluntary work, and commuting to work), and leisure (personal care, leisure, napping and sleeping), but we also exploit all these categories at a disaggregated level. Table 1 summarizes the main variables employed in this study, and Annex Appendix A describes all of them in detail. The sample composition is shown in Annex Appendix B.
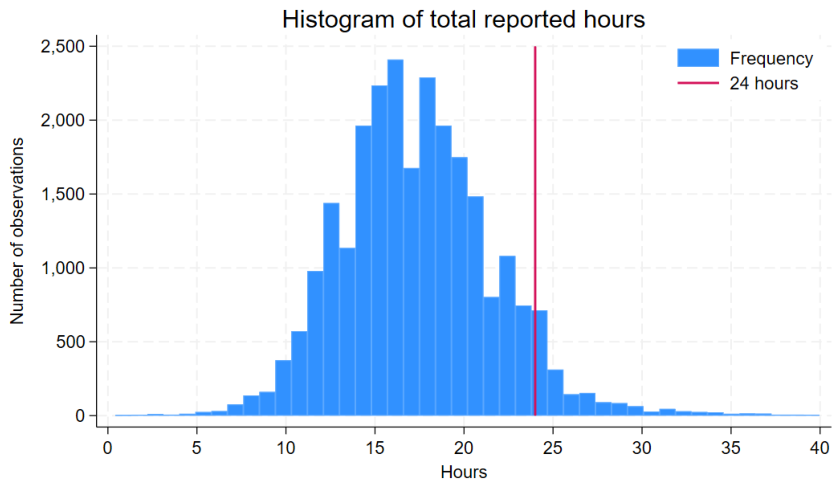
This source of data allows us to construct a panel dataset to analyse the effects of wealth transfers on time allocation by gender. We mainly study the effect of receiving an inheritance larger than €5,000 on three outcomes: time spent on paid work, unpaid work, and leisure. However, relying on self-reported retrospective time data introduces limitations, such as recall bias and measurement error. Our analysis of reported daily hours reveals that most respondents report fewer than 24 hours of activity (see Annex Appendix C), suggesting incomplete coverage of all daily tasks and potential multitasking that the survey structure cannot fully capture. Some studies report that multitasking (doing a secondary activity) is important and varies from 2h 46min in Luxembourg to 7h in Hungary (EUROSTAT, 2019). Diary-based information on time use may improve the time use estimation and reduce biases (Bonke, 2005; Juster et al., 2003; Kan & Pudney, 2008; Klevmarken, 2005). Furthermore, the time allocation module is only available for two waves, and inheritances are recorded using a fixed €5,000 threshold. These data constraints restrict our robustness checks; consequently, we cannot implement difference-in-differences or event-study specifications to test for parallel pre-trends, nor can we analyse the effects of varying inheritance sizes or the long-term persistence of the effects. Future waves of SHARE will enhance the methodological possibilities for identifying causal effects.
3.2. Descriptive Statistics
Our longitudinal sample comprises couples who completed the time expenditure and financial transfers modules in two waves, consisting of 13,188 individuals (a total of 29,826 observations across the two waves). Table 2 shows the main summary statistics for the longitudinal sample with non-missing values for all variables used in the analysis. The average age is approximately 70 years, and a large majority (73.1%) are retired. The high proportion of retired individuals explains the low average time spent on paid work (49 minutes) compared to unpaid work (220 minutes) and leisure (764 minutes). Furthermore, 2.6% of respondents report having received a wealth transfer larger than €5,000, which shows that it is an uncommon event. We observe that women spend significantly more time than men on unpaid work, while men spend significantly more time on leisure; both differences are statistically significant at the 1% level. Additionally, men devote more time to paid work than women, but the difference is not statistically significant, reflecting the high average retirement rate of the sample. These statistics confirm the gender disparities discussed in Section 2: men spend more time in the labour market, and women in domestic tasks.
Retirement completely changes individuals’ daily routines (Sprod et al., 2017), so we restrict the sample to individuals between 50–70 years, who are more likely to be attached to the labour market. This allows us to better capture the bargaining dynamics and the work-leisure trade-offs (see Annex Appendix D for statistics by retirement status). In Table 3 we observe that time spent on paid work is higher and retirement rates drop, but the gender disparities persist. Women still perform significantly more unpaid work (74 minutes more per day) than men, while men continue to enjoy significantly more leisure time. We exclude partners younger than 50 years as may be asymmetric couples.
These descriptive statistics establish the baseline for our subsequent analysis. In summary, they show: 1) a high proportion of retired individuals, which explains why the average time spent on paid work is low, 2) men spend more time on paid work and significantly less time on unpaid work than women, 3) significant differences exist based on differences based on retirement status.
4. Methodology
This section presents the empirical framework to analyse how inheritance receipt affects time allocation patterns by gender among couples older than 50 years in Europe. We estimate a Poleed OLS model with fixed effects that exploits household variation in inheritance receipt, while controlling for unobserved time-invariant characteristics, including covariates to reduce omitted variable bias, and clustering standard errors at the individual level 8 (Bertrand et al., 2004). We run the models separately for husbands and wives to capture the potential gender-specific responses to wealth shocks, following Belloc et al. (2025).
Following this empirical strategy, our main explanatory variable is a binary indicator for inheritance receipt (taking a value of 1 if received, and 0 otherwise), while the outcome variables measure the daily time spent on various activities. The baseline econometric model is specified as follows:
Where i identifies the household, j denotes the spouse (: husband, : wife), c indicates the country, and k represents the lags. represents the time allocation outcome for spouse j in household i at time t. , , and are dummy variables where takes value 1 if the individual j received the inheritance, takes value 1 if their spouse received it, and takes value 1 if the owner is unknown (all are 0 otherwise). For our control variables, as the log household earnings, as the log household non-labour income, and a vector of additional covariates , explained in detail in Annex Appendix A. Additionally, we include country fixed effects () to capture time-invariant country differences, and wave fixed effects () to control for unobserved factors that vary uniformly across countries over time. The standard errors are clustered at individual level.
In our robustness analysis, we estimate a unitary model, pooling inheritances within the household to the assumptions of intra-household decision-making. This model, which treats the household as a single economic unit and aggregates wealth transfers, is derived from Equation 1, and is specified as follows:
Where represents the inheritance received by any member of the household. We then estimate a model to capture the inheritance expectations using the relationship to donor as a proxy:
In this specification, we divide the wealth transfer into expected inheritances (), received from direct family members such as parents, and unexpected inheritances (). Further robustness checks explore the heterogeneity in the effects across subsamples based on financial constraints and examine the outsourcing of domestic tasks as a potential mechanism.
However, our data has some limitations; it follows a stylized time use measurement rather than diary-based measurement, where the individuals are more engaged in the measurement process and provide more detail of their time use. This may introduce measurement errors and subjectivity into time use reports. Improving time use measurement to a diary-based approach would yield higher data quality and fewer biases (Bonke, 2005; Juster et al., 2003; Kan & Pudney, 2008; Klevmarken, 2005). Additionally, our time use variable is only available in the last two waves of the SHARE. Availability of information for longer periods of time could allow researchers to conduct difference-in-differences models or event study designs to examine the long run effects and study how inheritors behave compared to non-inheritors.
5. Results
Men and women show disparities in time use, and to analyse the effects of wealth shocks (inheritances) on intra-household time allocation decisions, we estimate a pooled OLS model with fixed effects for both wives and husbands. Inheritances are treated as individual assets identified based on specific relationship with donors, which allows us to test the inheritance pooling hypothesis. We present the results for the full sample and a restricted sample of couples between 50–70 years who are more likely to remain active in the labour market and face time allocation trade-offs between paid work and domestic tasks.
Table 4 presents the baseline estimates of the effect of inheritances on time allocated to paid work, unpaid work, and leisure for the full sample. This sample includes retired individuals, less likely to be active in the labour market, and non-retired individuals, and the effects are attenuated due to lower market-home trade-offs. For paid work, we observe a modest reduction of 14 minutes (significant at the 5% level) for women receiving an unknown inheritance, consistent with the literature on negative income effects on labour supply (Holtz-Eakin et al., 1993), which are stronger for women (Belloc et al., 2025; Malo & Sciulli, 2021), and the role anticipation (Doorley & Pestel, 2016). Then, we find a reduction in women’s unpaid work. Wives experience a significant decrease in domestic chores when they are the direct inheritance recipients (24 minutes, 5% significance), with effects appearing with a one-period lag9. Finally, the effects on leisure are heterogeneous: husbands’ leisure increases by 25 minutes when their wives inherit, yet drops by 40 minutes following an unknown inheritance.
In Table 5 we restrict the analysis to couples between 50 and 70 years old, who are more likely to remain active in the labour market. Compared to the full sample we find stronger effects. Wives reduce their time spent on paid work by 29 minutes when the source is unknown (10% significance). Regarding leisure, the baseline effects largely disappear in this restricted sample; the only significant result is a 59-minute decrease for wives following an unknown inheritance (10% significance). However, we still find reductions in women’s unpaid work, and the effects are stronger. Wives significantly reduce their daily unpaid work by 40 minutes (5% significance) when they are the direct inheritance owners, and by 42 minutes (10% significance) when the inheritance source is unknown. Furthermore, we observe a lagged reduction of 32 minutes (5% significance) when their husband receive the inheritance. This reduction in female domestic labour is not compensated by their spouses; husbands reduce time spent in unpaid work (30 minutes, 10% significance) when their wives inherit. Full estimates for both the full sample and restricted sample are detailed in Annex Appendix E, and the models showing the interaction of inheritance receipt of both spouses are shown in Annex Appendix F.
In summary, we find heterogeneous effects on leisure across specifications, and slight reductions in paid work, especially for women. We consistently find declines in wives’ unpaid work. This reduction is stronger among women aged between 50-70, and is not compensated by an increase in husbands’ domestic tasks. Time allocation remains highly rigid to shocks among husbands. Wives and husbands reduce their time spent on unpaid work, which suggests that shifts in household bargaining power do not merely reorganize tasks within the household (Jayachandran & Voena, 2026). Additionally, wives’ inheritance ownership is the main driver of the results, rather than their husbands’, and it is women who adapt to a shock rather than men, consistent with Moro (2025); Schulz and Raab (2023). We check how these results hold under different specifications in the following sections.
We present a battery of alternative specifications in the Annexes, where our results remain mainly unchanged. First, excluding individuals who report zero minutes provide consistent results in Annex Appendix G, with similar coefficients but lack of statistical power. Second, we excluded sleep from leisure to verify potential adjustments through sleep patterns rather than activities, and we excluded help provided to parents (Annexes Appendix H and Appendix I, respectively), with similar results. Third, we restrict the analysis to households with at least one of their members working, with stronger results for younger cohorts (Annex Appendix J). Finally, we compute a full model (for men and women together) with interactions in Annex Appendix K, where the only significant result is a reduction of unpaid work for the interaction between self inheritance and women. Additional fixed-effects specifications in Annex Appendix L further support the results.
6. Robustness
To assess the robustness of the baseline results to alternative specifications we contrast our individual ownership approach against the traditional inheritance pooling approach and we examine the role of anticipation comparing expected and unexpected inheritances.
6.1. Unitary Model
Following Belloc et al. (2025), we first test the inheritance pooling hypothesis by estimating a household-level unitary model. Panel A of Table 6 presents the results for the full sample under the inheritance pooling assumption. The only statistically significant finding is the reduction in women’s unpaid work: 24 minutes after the household receives an inheritance (significant at the 1% level, with a one-period lag). Panel B presents the estimates for the restricted sample of individuals aged 50–70, with consistent results: wives reduce their time on unpaid work by 31 minutes per day when the household receives an inheritance (with one lag and statistically significant at 1%).
Under the inheritance pooling assumption, the only result that persists is the reduction in wives’ unpaid work. These results are consistent with those in Section 5, but this unitary approach fails to capture other heterogeneous adjustments observed under the individual ownership approach. This confirms that the traditional inheritance pooling hypothesis masks intra-household bargaining dynamics (Belloc et al., 2025).
6.2. Inheritance Expectations
Theoretical models suggest that the anticipation of an inheritance has effects on behaviour prior to receiving the wealth transfer (Doorley & Pestel, 2016; Tur-Sinai et al., 2022). Following Malo and
Sciulli (2023), we classify inheritances from family members as “expected” and those from non-family members as “unexpected” to test for anticipation. The results, presented in Table 7, confirm the differences by gender and expectations. Women’s unpaid work consistently declines: the largest effect follows an expected inheritance (a reduction of 25 minutes in the full sample and 33 minutes in the restricted sample). Furthermore, unexpected inheritances show a decline in women’s paid work and reductions in husbands’ leisure. The responses to unexpected shocks confirm that wealth transfers have distinct impacts on anticipation.
Overall, individual inheritance ownership provides a more detailed understanding of intra-household dynamics than the traditional pooling approach, with the critical role of expectations. The reduction in women’s unpaid work remains robust across specifications, mainly when they are the direct recipients within the 50–70 age cohort. Paid work and leisure show patterns of anticipation (stronger effects under unexpected inheritances), but domestic work only declines following an expected transfer, suggesting different mechanisms. Unlike labour supply decisions, substituting domestic chores requires liquidity to acquire technology or outsource tasks (Greenwood et al., 2005), specifically when husbands do not compensate for this reduction. Finally, we report the estimates restricting to unknown inheritances in Annex Appendix M.
7. Mechanisms: Drivers of Wives’ Unpaid Work Decline
To understand the drivers behind the reduction of wives’ unpaid work after a wealth shock we explore: disaggregated time-use categories, market outsourcing mechanisms, and heterogeneous effects driven by household liquidity constraints.
7.1. Disaggregated Time Use Categories
SHARE provides time use categories that we previously aggregated into paid work, unpaid work, and leisure. In this section we disaggregate unpaid work into chores, administrative tasks, and help (which includes help provided to children, partners, parents or other family members). Table 8 presents the effects of individual inheritances on these disaggregated time use categories, alongside personal care. In the full sample, the decline in women’s unpaid work is driven by reduction in domestic chores following a direct inheritance receipt. Including administrative chores in the analysis, which are often perceived as male-dominated tasks, the results remain unchanged. Regarding the “help” category, women experience a reduction of around 25 minutes following an inheritance received by either themselves or their spouse. Finally, there are no statistically significant effects of inheritances on personal care.
These results confirm a reduction in tasks related to the care economy (chores and help) for women after a wealth transfer. The decline in chores occurs exclusively when wives are the direct inheritance recipients. Meanwhile, husbands maintain a constant, rigid time allocation across daily activities, consistent with previous findings (Moro, 2025). Further results for all disaggregated categories are shown in Annex Appendix N.
7.2. Market Outsourcing
There are persistent reductions in women’s unpaid work, especially among working age women, and there is a lack of compensation from husbands. This suggests that households are substituting this domestic time with market services. In Table 9 we analyse the effects of an inheritance on household spending on eating outside10. The estimates show a market substitution pattern, household spending on eating out significantly increases by 15 to 25 euros per month following a wealth transfer, while expenditure on food consumed at home remains largely unaffected.
These results provide a mechanism for the decline in wives’ unpaid work and the absence of an increase in husbands’ time on unpaid work. Rather than reallocating tasks within the household, women reduce time spent on chores, such as cooking and meal preparation, and outsource domestic production to the market (e.g., eating out).
7.3. Heterogeneity: Liquidity Constraints
Finally, we explore how these intra-household dynamics vary across different socioeconomic environments. As Hubbard et al. (1995) explains, liquidity-constrained households have savings and behavioural patterns that deviate from what is expected in traditional life-cycle theory, and systematically respond to shocks. To analyse the effects across different liquidity constraints, we exploit a question from the SHARE regarding the household’s ability to make ends meet11. Table 10 presents the results for the 50–70 age sample, splitting the sample into financially constrained households that make ends meet with difficulty (Panel A) and unconstrained households that do so easily (Panel B).
The results show that within financially constrained households (Panel A), women’s unpaid work drops by 142 minutes (over two hours per day, statistically significant at the 1% level). This reduction only appears when wives are the direct inheritance recipients, reinforcing the hypothesis that individual asset ownership strongly affects intra-household bargaining power. In contrast, in Panel B, this reduction almost disappears among unconstrained households, showing the vast differences based on financial restrictions and capacity to make ends meet.
These findings indicate that the reduction in female unpaid work is driven almost entirely by financially constrained households. Wealth transfers provide women with the means (and bargaining power) to outsource some domestic tasks. Financially unconstrained households have already adapted their behaviours and we do not observe major effects. Results for the full sample show smaller significant effects and are shown in Annex Appendix O. Finally, the intra-household gender gap in unpaid work narrows significantly following an inheritance, but exclusively among these financially restricted families (see effects on gender gaps in Annex Appendix P).
8. Discussion
While previous literature analysing the impact of wealth transfers has systematically focused on labour market outcomes (Belloc et al., 2025; Holtz-Eakin et al., 1993; Imbens et al., 2001; Kaplan, 1987; Malo & Sciulli, 2021), and particularly for men, the intra-household allocation of domestic time has remained largely unexplored. Our findings show that wealth transfers do not merely affect labour participation; they shift time allocation to unpaid work within the household. Specifically, women significantly reduce their time spent on domestic tasks after receiving an inheritance. This effect is stronger among women aged between 50 and 70 years, who are more likely to face work-home trade-offs, and especially when they are the direct inheritance owners. This highlights how individual wealth transfers have effects on the recipient’s bargaining power over household time allocation decisions. Additionally, this reduction in female unpaid work is not compensated by an increase in husbands’ chores, which is observed even under the inheritance pooling hypothesis and when including inheritance expectations.
To explain the persistent reduction in wives’ unpaid work and the absence of domestic labour compensation from husbands, we propose a market outsourcing mechanism. Households offset the decline in female domestic activities (e.g., meal preparation) by increasing their expenditure on food to be consumed outside homes. However, these effects are highly heterogeneous; the reduction in women’s unpaid work is driven almost entirely by financially constrained families. Consistent with the literature on liquidity constraints (Hubbard et al., 1995), a wealth transfer provides women in these households with the resources to outsource tasks, effectively increasing their intra-household bargaining power. While expenditure on eating outside provides an outsourcing substitution mechanism, future research should explore other potential outsourcing mechanisms, such as hiring caregivers or domestic help.
As domestic tasks are effectively outsourced to the market, husbands are not forced to increase their time devoted to unpaid work, which explains the systematic rigidity observed in male time allocation. Following an inheritance, time use is highly elastic for women but remains rigid for men, who are particularly reticent to increase time allocation to caregiving. This stickiness aligns with recent literature demonstrating that, following different household shocks, mothers significantly adjust their routines while fathers’ time allocation remains largely unchanged (Moro, 2025; Schulz & Raab, 2023). The absence of compensation in male unpaid work suggests different gender-specific utility functions, a generalized division of labour, and a stronger altruistic behaviour among women and egoistic behaviour among men within the household (Molina et al., 2023).
Beyond these behaviours, we point to sociological factors constraining intra-household time reallocation. Although women may report greater motivation and enjoyment in their work (Bryson et al., 2014), gender norms and stereotypes systematically undervalue their voice and contributions within the labour market (Heilman, 2001; Pearse & Connell, 2016). This double burden of work (balancing working at the labour market and responsibilities in domestic work) creates different trade-offs for men and women (Piekkola & Leijola, 2004), making women more likely to leave the labour market under shocks. These factors may explain why the reduction in unpaid work does not translate into an increase in paid work for women, or a compensation of domestic tasks by men. Dismantling this rigid division of labour requires a fundamental shift in bargaining dynamics, and, it may seem surprisingly, but convincing men to share power within the household (concede on some time use decisions) also works as an altruistic behaviour toward a more equal distribution of time (Jayachandran & Voena, 2026).
Research-based policies must account for the impact of inheritances on intra-household daily routines and division of activities by gender within the household, specifically in unpaid work. Our results suggest that taxes on inheritances may worsen gender equity in liquidity-constrained households. Wealth shocks empower women in liquidity-constrained households to outsource domestic activities, and taxing poor household or small intergenerational transfers could prevent women from accessing the mechanisms that improve their bargaining power in time allocation decisions. Therefore, policies should be targeted by income level and gender to avoid unexpected results. Furthermore, while men often secure higher earnings in the labour market, their choices are also constrained by social norms that expect them to be the primary breadwinners and discourage them from caregiving. Thus, to achieve true equality within the household, economic policies alone are not enough. They must be combined with educational and social efforts to break down traditional gender roles and actively encourage men to take on domestic responsibilities.
9. Conclusion
While previous research has extensively studied the impact of wealth transfers on labour market participation (Holtz-Eakin et al., 1993;Imbens et al., 2001; Kaplan, 1987), their effects on other daily activities, such as unpaid work and leisure, have remained largely unexplored. To address this gap, this paper analyses how inheritances affect the intra-household allocation of time across paid work, unpaid work, and leisure. Using panel data from SHARE, we estimate fixed-effects models to capture these impacts by adopting an individual inheritance ownership approach. By treating inheritances over €5,000 as individual -rather than household- assets, we directly observe how inheritance ownership shapes bargaining power and drives time reallocation within the household.
Our main finding shows that women significantly reduce the time they spend on unpaid work after receiving an inheritance. This decline is stronger among working-age women (50-70 years), especially when they are the direct inheritance owners, and is not compensated by an increase in their husbands’ domestic tasks. We identify that the mechanism for households to adapt to the lower time spent on unpaid work is outsourcing, specifically increasing spending on eating out. These results remain robust across alternative specifications, including inheritance pooling and expectations. Furthermore, our heterogeneity analysis shows that the reduction in unpaid work is driven almost entirely by liquidity-constrained households, which suggests that for these families, inheritances increase wives’ bargaining power.
This article contributes to understanding how wealth transfers affect the gendered dynamics of intra-household time allocation beyond the labour market within the household. Inheritances, as individual assets, shift intra-household bargaining and decision-making, empowering women to narrow the persistent gender gap in domestic time. After receiving an inheritance, women reduce their time spent on unpaid work, narrowing the gap with their husbands. While Black et al. (2022,2025) conclude that wealth transfers tend to reduce gender gaps in income, this effect is heterogeneous depending on liquidity constraints; the reduction in the unpaid work gap is mainly driven by financially constrained households. Furthermore, our results align with the literature on labour supply responses to wealth shocks by gender (Belloc et al., 2025; Malo & Sciulli, 2021).
Although the reduction in female unpaid work narrows the gender gap in financially constrained households, men do not compensate by increasing their domestic tasks. This presents two main policy implications. First, general inheritance taxes could have unexpected regressive effects on gender equity. In liquidity-constrained households, these wealth transfers act as a relief from caregiving responsibilities for women through market outsourcing; consequently, taxing small inheritances might weaken wives’ bargaining power within the household. Second, the rigidity of male time use highlights the stickiness of traditional gender roles and the inequality within the household. Economic shocks alone cannot fully close the gap. Fiscal policies must be complemented by educational and social initiatives that actively involve men in caregiving and domestic responsibilities.
Carnegie’s conjecture proposes that “the parent who leaves his son enormous wealth generally deadens the talents and energies of the son, and tempts him to lead a less useful and less worthy life than otherwise would”. As shown in this paper, our results and broader empirical evidence tend to confirm this premise. However, this statement lacks a gender perspective, ignores intra-household dynamics, and relies exclusively on labour market participation. Our findings show that for women, an exogenous wealth shock does not simply “deaden” their energies; instead, it provides the crucial financial means to reduce their time spent on domestic tasks and outsource home production. Recognizing these gender disparities, the traditional Carnegie conjecture can be updated with a gender perspective: “the parent who leaves his daughter enormous wealth rebalances her bargaining power within the household, providing her the financial means to escape the disproportionate and stressful burden of unpaid domestic chores”.
Acknowledgments
Ángel Sánchez-Daniel is supported by the Junta de Castilla & León [Grant PR-2023 “Ayudas para financiar la contratación predoctoral de personal investigador (PREDOC)”, co-funded by the European Social Fund (FSE+) (2023), Orden EDU/1009/2024, BDNS: 730937]. This paper uses data from SHARE Waves 7, 8, and 9 (DOIs: 10.6103/SHARE.w7.900, 10.6103/SHARE.w8.900, 10.6103/SHARE.w9.900 ). See Bergmann and Börsch-Supan (2021) for methodological details. The SHARE data collection has been funded by the European Commission, DG RTD through FP5 (QLK6-CT-2001-00360), FP6 (SHARE-I3: RII-CT-2006-062193, COMPARE: CIT5-CT-2005-028857, SHARELIFE: CIT4-CT-2006-028812), FP7 (SHARE-PREP: GA N°211909, SHARE-LEAP: GA N°227822, SHARE M4: GA N°261982, DASISH: GA N°283646) and Horizon 2020 (SHARE-DEV3: GA N°676536, SHARE-COHESION: GA N°870628, SERISS: GA N°654221, SSHOC: GA N°823782, SHARE-COVID19: GA N°101015924) and by DG Employment, Social Affairs & Inclusion through VS 2015/0195, VS 2016/0135, VS 2018/0285, VS 2019/0332, VS 2020/0313, SHARE-EUCOV: GA N°101052589 and EUCOVII: GA N°101102412. Additional funding from the German Federal Ministry of Research, Technology and Space (01UW1301, 01UW1801, 01UW2202), the Max Planck Society for the Advancement of Science, the U.S. National Institute on Aging (U01_AG09740-13S2, P01_AG005842, P01_AG08291, P30_AG12815, R21_AG025169, Y1-AG-4553-01, IAG_BSR06-11, OGHA_04-064, BSR12-04, R01_AG052527-02, R01_AG056329-02, R01_AG063944, HHSN271201300071C, RAG052527A) and from various national funding sources is gratefully acknowledged (see www.share-eric.eu).
Appendix A. Annex I: Variables Definition

Table A1.
Summary of variables.
| Variable | Type | Description |
|---|---|---|
| Main Outcomes | ||
| Time use on paid work | Numeric | Minutes spent on paid work during the previous day (0-1440) |
| Time use on unpaid work | Numeric | Minutes spent on unpaid work during the previous day (0-1440) |
| Time use on leisure | Numeric | Minutes spent on leisure during the previous day (0-1440) |
| Other daily activities | Numeric | Minutes spent on other activities during the previous day (0-1440) |
| Treatment variables | ||
| Self-Inheritance (≥ €5,000) | Dummy | (1 = respondent received inheritance ≥ €5,000; 0 = Otherwise) |
| Spouse-Inheritance (≥ €5,000) | Dummy | (1 = spouse received inheritance ≥ €5,000; 0 = Otherwise) |
| Unknown-Inheritance (≥ €5,000) | Dummy | (1 = couple received an inheritance ≥ €5,000 but recipient is unknown; 0 = Otherwise) |
| Control variables | ||
| Age | Numeric | Age of respondent |
| Age | Numeric | Squared age of respondent |
| Self-employment | Dummy | (1: Individual is self-employed; 0: Otherwise) |
| Spouse self-employment | Dummy | (1: Spouse is self-employed; 0: Otherwise) |
| Secondary education | Dummy | (1: Individual has secondary education; 0: otherwise. Ref = primary) |
| Tertiary education | Dummy | (1: Individual has tertiary education; 0: otherwise. Ref = primary) |
| General health | Dummy | Your health is... (1 = Excellent/Very Good/Good; 0 = Fair/Poor) |
| Health improved | Dummy | (1: Health improved since previous wave; 0: Otherwise) |
| Health worsened | Dummy | (1: Health worsened since previous wave; 0: otherwise) |
| Network satisfaction | Numeric | How satisfied are you with the relationships you have? (0-10) |
| Household size | Numeric | Number of people living in the same household |
| Number of children | Numeric | How many children do you have that are still alive? |
| Unusual bad day | Dummy | (1: Unusual bad day; 0: Otherwise) |
| Unusual good day | Dummy | (1: Unusual good day; 0: Otherwise) |
| Log household earnings | Numeric | Logarithm of annual household labour income |
| Log household non-labour income | Numeric | Logarithm of annual non-labour income |
| Country | Dummy | Country ID (1-27) |
| Father deceased | Dummy | (1: Father deceased since previous interview; 0: Otherwise) |
| Mother deceased | Dummy | (1: Mother deceased since previous interview; 0: Otherwise) |
Source: Own elaboration.
Appendix B. Annex II: Sample Composition
Table A2.
Sample composition: Full sample.
| N observations | Percent | |
|---|---|---|
| Austria | 1160 | 3.9 |
| Germany | 2950 | 9.9 |
| Sweden | 1926 | 6.5 |
| Spain | 1380 | 4.6 |
| Italy | 2518 | 8.4 |
| France | 2232 | 7.5 |
| Denmark | 2060 | 6.9 |
| Greece | 2810 | 9.4 |
| Switzerland | 1670 | 5.6 |
| Belgium | 1716 | 5.8 |
| Israel | 292 | 1.0 |
| Czech Republic | 2306 | 7.7 |
| Poland | 1122 | 3.8 |
| Luxembourg | 420 | 1.4 |
| Hungary | 444 | 1.5 |
| Slovenia | 1804 | 6.0 |
| Estonia | 1988 | 6.7 |
| Croatia | 1028 | 3.4 |
| Total | 29826 | 100.0 |
Source: SHARE and own calculations.
Table A3.
Sample composition: Ages 50-70.
| N observations | Percent | |
|---|---|---|
| Austria | 294 | 2.6 |
| Germany | 1210 | 10.7 |
| Sweden | 514 | 4.5 |
| Spain | 416 | 3.7 |
| Italy | 816 | 7.2 |
| France | 956 | 8.4 |
| Denmark | 1000 | 8.8 |
| Greece | 1086 | 9.6 |
| Switzerland | 546 | 4.8 |
| Belgium | 750 | 6.6 |
| Israel | 72 | 0.6 |
| Czech Republic | 774 | 6.8 |
| Poland | 516 | 4.5 |
| Luxembourg | 220 | 1.9 |
| Hungary | 168 | 1.5 |
| Slovenia | 744 | 6.6 |
| Estonia | 772 | 6.8 |
| Croatia | 504 | 4.4 |
| Total | 11358 | 100.0 |
Source: SHARE and own calculations.
Appendix C. Annex III: Time Use Histogram
Figure A1.
Histogram of total reported hours. Source: SHARE and own calculations.
Appendix D. Annex IV: Summary Statistics by Retirement Status
Table A4.
Summary statistics by retirement status. Full sample.
| Retired | Non-retired | ||||
|---|---|---|---|---|---|
| Mean | Std. Dev. | Mean | Std. Dev. | Diff. | |
| Individual variables | |||||
| Minutes on paid work | 7.011 | (52.273) | 165.531 | (231.272) | 158.520 |
| Minutes on unpaid work | 213.986 | (203.737) | 234.969 | (206.141) | 20.982 |
| Minutes on leisure | 782.862 | (200.227) | 711.508 | (192.274) | -71.355 |
| Inheritance receipt | 0.023 | (0.149) | 0.036 | (0.186) | 0.013 |
| Age of respondent | 72.499 | (6.664) | 63.413 | (7.346) | -9.086 |
| Retirement | 1.000 | (0.000) | 0.000 | (0.000) | -1.000 |
| Primary education | 0.307 | (0.461) | 0.332 | (0.471) | 0.025 |
| Secondary education | 0.442 | (0.497) | 0.430 | (0.495) | -0.012 |
| Tertiary education | 0.251 | (0.434) | 0.238 | (0.426) | -0.013 |
| Self-employment | 0.018 | (0.132) | 0.101 | (0.302) | 0.084 |
| Good health | 0.421 | (0.494) | 0.387 | (0.487) | -0.033 |
| Health improved since previous interview | 0.209 | (0.407) | 0.209 | (0.406) | -0.001 |
| Health worsened since previous interview | 0.247 | (0.431) | 0.244 | (0.430) | -0.003 |
| Network satisfaction | 9.044 | (1.170) | 9.050 | (1.157) | 0.006 |
| Father death since the previous interview | 0.001 | (0.035) | 0.004 | (0.061) | 0.003 |
| Mother death since the previous interview | 0.001 | (0.033) | 0.004 | (0.065) | 0.003 |
| Observations | 21,816 | 8,010 | |||
| Mean | Std. Dev. | ||||
| Household variables | |||||
| Household size | 2.213 | (0.637) | |||
| Number of children | 2.215 | (1.182) | |||
| Inheritance owner: Unknown | 0.012 | (0.109) | |||
| Household earnings | 8,415.330 | (20,804.430) | |||
| Household non labor income | 24,739.264 | (35,709.037) | |||
| Household difficulty making ends meet | 0.291 | (0.454) | |||
| Couples | 6,594 | ||||
Source: SHARE and own calculations.
Table A5.
Summary statistics by retirement status. Ages 50-70.
| Retired | Non-retired | ||||
|---|---|---|---|---|---|
| Mean | Std. Dev. | Mean | Std. Dev. | Diff. | |
| Individual variables | |||||
| Minutes on paid work | 13.098 | (74.174) | 204.487 | (242.760) | 191.389 |
| Minutes on unpaid work | 242.212 | (215.348) | 231.580 | (211.902) | -10.632 |
| Minutes on leisure | 777.783 | (195.874) | 700.437 | (190.124) | -77.346 |
| Inheritance receipt | 0.040 | (0.196) | 0.046 | (0.209) | 0.006 |
| Age of respondent | 65.575 | (2.819) | 60.494 | (3.640) | -5.081 |
| Retirement | 1.000 | (0.000) | 0.000 | (0.000) | -1.000 |
| Primary education | 0.251 | (0.434) | 0.244 | (0.430) | -0.007 |
| Secondary education | 0.498 | (0.500) | 0.482 | (0.500) | -0.015 |
| Tertiary education | 0.251 | (0.434) | 0.273 | (0.446) | 0.022 |
| Self-employment | 0.030 | (0.170) | 0.114 | (0.318) | 0.084 |
| Good health | 0.444 | (0.497) | 0.388 | (0.487) | -0.056 |
| Health improved since previous interview | 0.231 | (0.422) | 0.213 | (0.410) | -0.018 |
| Health worsened since previous interview | 0.234 | (0.424) | 0.240 | (0.427) | 0.006 |
| Network satisfaction | 9.071 | (1.103) | 9.072 | (1.119) | 0.001 |
| Father death since the previous interview | 0.003 | (0.055) | 0.004 | (0.059) | 0.001 |
| Mother death since the previous interview | 0.002 | (0.041) | 0.005 | (0.071) | 0.003 |
| Observations | 5,981 | 5,377 | |||
| Mean | Std. Dev. | ||||
| Household variables | |||||
| Household size | 2.313 | (0.716) | |||
| Number of children | 2.163 | (1.141) | |||
| Inheritance owner: Unknown | 0.013 | (0.112) | |||
| Household earnings | 17,539.808 | (28,058.152) | |||
| Household non labor income | 19,200.168 | (39,213.001) | |||
| Couples | 2,635 | ||||
Source: SHARE and own calculations.
Table A6.
Summary statistics by retirement status x gender. Full sample.
| Retired | Non-retired | ||||
|---|---|---|---|---|---|
| Mean | Std. Dev. | Mean | Std. Dev. | Diff. | |
| Individual variables | |||||
| Minutes on paid work | 7.011 | (52.273) | 165.531 | (231.272) | 158.520 |
| Minutes on unpaid work | 213.986 | (203.737) | 234.969 | (206.141) | 20.982 |
| Minutes on leisure | 782.862 | (200.227) | 711.508 | (192.274) | -71.355 |
| Inheritance receipt | 0.023 | (0.149) | 0.036 | (0.186) | 0.013 |
| Age of respondent | 72.499 | (6.664) | 63.413 | (7.346) | -9.086 |
| Retirement | 1.000 | (0.000) | 0.000 | (0.000) | -1.000 |
| Primary education | 0.307 | (0.461) | 0.332 | (0.471) | 0.025 |
| Secondary education | 0.442 | (0.497) | 0.430 | (0.495) | -0.012 |
| Tertiary education | 0.251 | (0.434) | 0.238 | (0.426) | -0.013 |
| Self-employment | 0.018 | (0.132) | 0.101 | (0.302) | 0.084 |
| Good health | 0.421 | (0.494) | 0.387 | (0.487) | -0.033 |
| Health improved since previous interview | 0.209 | (0.407) | 0.209 | (0.406) | -0.001 |
| Health worsened since previous interview | 0.247 | (0.431) | 0.244 | (0.430) | -0.003 |
| Network satisfaction | 9.044 | (1.170) | 9.050 | (1.157) | 0.006 |
| Father death since the previous interview | 0.001 | (0.035) | 0.004 | (0.061) | 0.003 |
| Mother death since the previous interview | 0.001 | (0.033) | 0.004 | (0.065) | 0.003 |
| Observations | 21,816 | 8,010 | |||
| Mean | Std. Dev. | ||||
| Household variables | |||||
| Household size | 2.213 | (0.637) | |||
| Number of children | 2.215 | (1.182) | |||
| Inheritance owner: Unknown | 0.012 | (0.109) | |||
| Household earnings | 8,415.330 | (20,804.430) | |||
| Household non labor income | 24,739.264 | (35,709.037) | |||
| Household difficulty making ends meet | 0.291 | (0.454) | |||
| Couples | 6,594 | ||||
Source: SHARE and own calculations.
Table A7.
Summary statistics by retirement status x gender. Ages 50-70.
| Retired | Non-retired | |||||||
|---|---|---|---|---|---|---|---|---|
| Husbands | Wives | Husbands | Wives | |||||
| Mean | Std. Dev. | Mean | Std. Dev. | Mean | Std. Dev. | Mean | Std. Dev. | |
| Individual variables | ||||||||
| Minutes on paid work | 14.380 | (76.623) | 11.266 | (70.505) | 259.725 | (250.019) | 167.451 | (230.514) |
| Minutes on unpaid work | 211.616 | (209.302) | 285.930 | (216.369) | 180.786 | (181.742) | 265.637 | (223.577) |
| Minutes on leisure | 783.357 | (197.782) | 769.819 | (192.883) | 702.115 | (193.364) | 699.313 | (187.947) |
| Inheritance receipt | 0.039 | (0.193) | 0.041 | (0.199) | 0.048 | (0.214) | 0.044 | (0.205) |
| Age of respondent | 66.077 | (2.654) | 64.858 | (2.893) | 61.534 | (3.317) | 59.795 | (3.680) |
| Retirement | 1.000 | (0.000) | 1.000 | (0.000) | 0.000 | (0.000) | 0.000 | (0.000) |
| Primary education | 0.259 | (0.438) | 0.240 | (0.427) | 0.211 | (0.408) | 0.267 | (0.442) |
| Secondary education | 0.495 | (0.500) | 0.502 | (0.500) | 0.496 | (0.500) | 0.473 | (0.499) |
| Tertiary education | 0.247 | (0.431) | 0.258 | (0.438) | 0.293 | (0.455) | 0.260 | (0.439) |
| Self-employment | 0.038 | (0.191) | 0.019 | (0.135) | 0.185 | (0.389) | 0.066 | (0.248) |
| Good health | 0.437 | (0.496) | 0.454 | (0.498) | 0.392 | (0.488) | 0.385 | (0.487) |
| Health improved since previous interview | 0.229 | (0.420) | 0.235 | (0.424) | 0.213 | (0.410) | 0.213 | (0.410) |
| Health worsened since previous interview | 0.234 | (0.423) | 0.235 | (0.424) | 0.253 | (0.435) | 0.231 | (0.422) |
| Network satisfaction | 9.021 | (1.141) | 9.144 | (1.042) | 9.022 | (1.160) | 9.106 | (1.090) |
| Father death since the previous interview | 0.004 | (0.061) | 0.002 | (0.045) | 0.002 | (0.048) | 0.004 | (0.066) |
| Mother death since the previous interview | 0.002 | (0.045) | 0.001 | (0.035) | 0.003 | (0.053) | 0.007 | (0.081) |
| Observations | 3,517 | 2,464 | 2,162 | 3,215 | ||||
Source: SHARE and own calculations.
Appendix E. Annex V: Full Baseline Estimates
Table A8.
Impact of inheritances on Time use: Full sample.
| Paid work | Unpaid work | Leisure | ||||
|---|---|---|---|---|---|---|
| Husbands | Wives | Husbands | Wives | Husbands | Wives | |
| Self-inheritance receipt | 1.681 | 17.254 | 4.881 | -14.882 | 10.979 | 17.581 |
| (10.05) | (13.27) | (12.05) | (17.95) | (13.50) | (14.89) | |
| Spouse inheritance receipt | -4.393 | 2.393 | -20.897 | 21.158 | 24.894 | 8.257 |
| (8.32) | (11.68) | (14.55) | (15.20) | (14.74) | (13.96) | |
| Unknown inheritance receipt | -12.068 | -14.391 | 17.764 | 25.737 | -40.450 | -8.613 |
| (8.92) | (6.31) | (20.09) | (20.32) | (19.37) | (18.39) | |
| Past self-inheritance receipt | 9.572 | -0.084 | 0.368 | -24.473 | 16.787 | -13.481 |
| (8.26) | (8.60) | (11.26) | (11.79) | (12.12) | (10.50) | |
| Past spouse inheritance receipt | -1.054 | -6.339 | -15.195 | -17.089 | 6.062 | 11.073 |
| (8.02) | (8.39) | (11.42) | (11.24) | (12.68) | (11.74) | |
| Past unknown inheritance receipt | 17.967 | 5.720 | -1.406 | -17.921 | -21.363 | -30.140 |
| (11.88) | (9.00) | (16.69) | (17.47) | (18.36) | (18.55) | |
| Father death since the previous interview | -25.125 | 14.812 | 72.200 | -70.752 | 155.016 | -5.951 |
| (18.16) | (50.54) | (46.93) | (60.26) | (122.21) | (39.30) | |
| Mother death since the previous interview | -11.073 | -14.597 | 31.092 | 156.217 | -118.241 | -78.339 |
| (15.73) | (22.41) | (60.61) | (85.08) | (50.61) | (34.58) | |
| Age of respondent | -38.777 | -28.780 | 12.866 | 13.627 | 12.720 | 7.860 |
| (3.93) | (3.57) | (4.61) | (4.26) | (4.98) | (3.94) | |
| Age | 0.248 | 0.187 | -0.106 | -0.112 | -0.068 | -0.047 |
| (0.03) | (0.02) | (0.03) | (0.03) | (0.03) | (0.03) | |
| Self-employment status | 91.266 | 96.975 | 0.408 | -0.136 | -27.962 | -37.677 |
| (11.61) | (16.87) | (11.26) | (14.22) | (10.18) | (14.62) | |
| Spouse self-employment status | -7.260 | -40.161 | -10.372 | 13.775 | -10.616 | 10.556 |
| (12.90) | (9.51) | (13.78) | (10.49) | (13.33) | (10.38) | |
| Secondary education | 4.384 | 4.865 | 3.475 | 8.269 | 2.218 | -5.958 |
| (3.09) | (2.84) | (5.76) | (5.90) | (6.09) | (5.38) | |
| Tertiary education | 13.324 | 16.844 | 19.214 | 13.764 | -15.323 | -12.097 |
| (3.50) | (3.96) | (6.30) | (7.00) | (6.71) | (6.38) | |
| Network satisfaction | 0.770 | -1.536 | 0.549 | 3.275 | 2.416 | 6.960 |
| (0.89) | (1.04) | (2.00) | (1.92) | (1.98) | (1.92) | |
| Good health | 2.395 | 7.516 | 12.555 | 8.495 | -19.092 | -3.578 |
| (2.40) | (2.60) | (4.44) | (4.54) | (4.45) | (4.29) | |
| Unusual bad day | 2.590 | 4.660 | 12.730 | 15.844 | -9.856 | -36.579 |
| (7.02) | (6.22) | (12.20) | (11.80) | (13.52) | (11.42) | |
| Unusual good day | -21.815 | -19.536 | 26.322 | 18.601 | 26.664 | 31.151 |
| (3.53) | (3.33) | (7.08) | (7.13) | (7.03) | (6.44) | |
| Health improved since previous interview | 0.167 | 2.186 | 13.555 | 6.424 | -6.926 | -4.145 |
| (2.90) | (3.17) | (5.85) | (5.77) | (5.79) | (5.36) | |
| Health worsened since previous interview | -4.341 | -0.898 | 0.836 | -1.067 | 8.532 | 6.067 |
| (2.67) | (2.83) | (4.81) | (5.29) | (5.11) | (5.15) | |
| Household size | -0.768 | -0.987 | 4.508 | 20.357 | 0.951 | -11.153 |
| (2.48) | (2.72) | (4.10) | (4.78) | (4.29) | (3.95) | |
| Number of children | 0.901 | 2.159 | 5.107 | 7.939 | -2.533 | -0.942 |
| (1.16) | (1.12) | (1.96) | (2.07) | (2.14) | (1.99) | |
| Log of household earnings | 6.849 | 8.811 | -0.121 | -1.675 | -2.726 | -2.241 |
| (0.54) | (0.54) | (0.82) | (0.91) | (0.77) | (0.77) | |
| Log of household non-labor income | -8.983 | -4.761 | -0.456 | -0.956 | 3.190 | 3.292 |
| (1.18) | (1.10) | (1.27) | (1.23) | (1.27) | (1.14) | |
| Log of past household earnings | 0.469 | 0.868 | 1.658 | 1.020 | 0.510 | 0.127 |
| (0.36) | (0.38) | (0.79) | (0.82) | (0.71) | (0.69) | |
| Log of past household non-labor income | -2.593 | -1.042 | 1.915 | 1.809 | 1.115 | 0.911 |
| (0.90) | (0.98) | (1.08) | (1.11) | (1.05) | (1.07) | |
| Constant | 1597.808 | 1149.968 | -267.959 | -269.813 | 219.887 | 410.525 |
| (148.76) | (130.67) | (174.55) | (155.35) | (183.24) | (140.23) | |
| Observations | 8,319 | 8,319 | 8,319 | 8,319 | 8,319 | 8,319 |
| R-squared | 0.329 | 0.287 | 0.048 | 0.050 | 0.082 | 0.065 |
Source: SHARE and own calculations.
Table A9.
Impact of inheritances on Time use: Ages 50-70.
| Paid work | Unpaid work | Leisure | ||||
|---|---|---|---|---|---|---|
| Husbands | Wives | Husbands | Wives | Husbands | Wives | |
| Self-inheritance receipt | 5.919 | 28.988 | 3.149 | -39.619 | 1.015 | -2.507 |
| (15.80) | (20.18) | (15.72) | (17.49) | (17.36) | (18.49) | |
| Spouse inheritance receipt | 0.171 | -1.504 | -30.800 | 32.922 | 25.721 | 16.465 |
| (13.30) | (18.10) | (16.31) | (21.02) | (18.83) | (15.38) | |
| Unknown inheritance receipt | -18.733 | -29.652 | 16.549 | -41.570 | -38.678 | 11.266 |
| (25.37) | (16.21) | (33.41) | (25.01) | (36.39) | (35.75) | |
| Past self-inheritance receipt | 21.449 | 5.186 | 3.014 | -16.744 | 7.266 | -4.565 |
| (12.75) | (14.78) | (15.76) | (16.00) | (14.76) | (13.18) | |
| Past spouse inheritance receipt | -7.115 | -6.203 | -15.532 | -31.720 | 2.303 | 15.765 |
| (13.43) | (13.06) | (15.87) | (14.00) | (17.57) | (14.94) | |
| Past unknown inheritance receipt | 29.694 | 9.980 | -2.796 | -14.336 | -3.450 | -59.821 |
| (23.39) | (18.81) | (26.30) | (26.49) | (26.64) | (30.12) | |
| Father death since the previous interview | -30.945 | -50.341 | 30.645 | 21.720 | 190.019 | 102.585 |
| (22.81) | (57.44) | (45.53) | (68.61) | (141.66) | (64.12) | |
| Mother death since the previous interview | -20.035 | 34.402 | 53.823 | 80.006 | -121.137 | -105.097 |
| (28.61) | (45.83) | (95.54) | (64.87) | (47.13) | (47.72) | |
| Age of respondent | -122.708 | -8.314 | 105.323 | 40.715 | 10.559 | -36.366 |
| (34.26) | (22.38) | (29.55) | (26.41) | (30.69) | (22.03) | |
| Age | 0.869 | 0.004 | -0.811 | -0.331 | -0.046 | 0.309 |
| (0.26) | (0.18) | (0.23) | (0.21) | (0.24) | (0.18) | |
| Self-employment status | 107.304 | 93.267 | -9.668 | -27.195 | -27.345 | -28.942 |
| (14.50) | (21.38) | (12.87) | (16.85) | (11.99) | (18.69) | |
| Spouse self-employment status | 5.684 | -32.051 | -18.713 | 25.868 | -12.960 | 6.597 |
| (17.61) | (12.87) | (17.06) | (13.15) | (15.36) | (11.63) | |
| Secondary education | 4.584 | 17.681 | 8.551 | -3.207 | -8.182 | -19.575 |
| (7.27) | (6.73) | (9.82) | (10.81) | (10.22) | (9.33) | |
| Tertiary education | 23.633 | 39.788 | 17.373 | 7.320 | -18.472 | -24.674 |
| (8.55) | (9.07) | (11.23) | (12.63) | (11.36) | (10.99) | |
| Good health | 7.035 | 20.063 | 14.052 | 9.299 | -18.300 | -2.692 |
| (5.68) | (6.15) | (7.46) | (7.91) | (7.26) | (7.24) | |
| Health improved since previous interview | 5.140 | 8.168 | 3.858 | 5.119 | 1.543 | 6.586 |
| (6.82) | (7.30) | (9.71) | (9.33) | (8.89) | (9.07) | |
| Health worsened since previous interview | -12.348 | -1.321 | 0.646 | 1.438 | 15.360 | 16.938 |
| (6.74) | (7.12) | (8.78) | (10.19) | (8.44) | (8.70) | |
| Network satisfaction | 0.801 | -2.691 | 1.555 | 9.471 | 2.964 | 5.588 |
| (2.42) | (2.80) | (3.44) | (3.43) | (3.35) | (3.59) | |
| Household size | -2.476 | -1.911 | 8.351 | 23.255 | 0.725 | -13.287 |
| (4.71) | (5.12) | (5.62) | (6.51) | (5.52) | (5.18) | |
| Number of children | 2.192 | 1.965 | 8.453 | 13.304 | -7.119 | -2.456 |
| (2.79) | (2.40) | (3.66) | (3.95) | (3.60) | (3.54) | |
| Unusual bad day | -4.410 | 10.224 | -7.943 | 20.653 | -27.302 | -62.658 |
| (16.38) | (15.98) | (23.18) | (21.45) | (21.73) | (19.02) | |
| Unusual good day | -46.753 | -41.579 | 35.440 | 35.305 | 41.010 | 28.396 |
| (7.63) | (7.54) | (11.67) | (12.48) | (10.90) | (10.58) | |
| Log of household earnings | 7.890 | 10.612 | -1.297 | -2.668 | -3.966 | -3.319 |
| (0.80) | (0.81) | (1.17) | (1.25) | (1.01) | (0.99) | |
| Log of household non-labor income | -10.002 | -3.718 | -1.549 | -1.663 | 3.142 | 4.247 |
| (1.71) | (1.60) | (1.60) | (1.53) | (1.56) | (1.44) | |
| Log of past household earnings | 0.415 | 0.957 | 1.496 | -0.232 | 1.008 | 0.606 |
| (0.62) | (0.64) | (1.16) | (1.17) | (0.98) | (0.99) | |
| Log of past household non-labor income | -1.558 | -0.264 | 1.835 | 1.923 | -0.104 | -0.891 |
| (1.22) | (1.33) | (1.29) | (1.34) | (1.24) | (1.32) | |
| Constant | 4379.421 | 533.084 | -3297.100 | -1126.202 | 273.459 | 1796.615 |
| (1118.48) | (713.43) | (943.58) | (834.20) | (978.48) | (690.65) | |
| Observations | 3,044 | 3,044 | 3,044 | 3,044 | 3,044 | 3,044 |
| R-squared | 0.325 | 0.245 | 0.054 | 0.068 | 0.096 | 0.085 |
Source: SHARE and own calculations.
Appendix F. Annex VI: Inheritance Receipt Interactions
Table A10.
Impact of inheritances on time use: Full sample.
| Paid work | Unpaid work | Leisure | ||||
|---|---|---|---|---|---|---|
| Husbands | Wives | Husbands | Wives | Husbands | Wives | |
| Inheritance recipient | ||||||
| Self | -0.521 | 18.845 | 7.335 | -14.207 | 9.537 | 12.265 |
| (10.09) | (13.68) | (12.67) | (18.75) | (14.01) | (15.30) | |
| Spouse | -6.728 | 3.950 | -18.331 | 21.357 | 23.895 | 3.269 |
| (8.27) | (11.84) | (15.23) | (15.79) | (15.30) | (14.39) | |
| Both | 43.804 | -29.408 | -44.889 | -9.545 | 21.301 | 90.868 |
| (52.87) | (56.95) | (43.45) | (53.60) | (51.12) | (58.67) | |
| Unknown | -12.063 | -14.411 | 17.812 | 25.878 | -40.294 | -8.735 |
| (8.94) | (6.31) | (20.11) | (20.32) | (19.37) | (18.41) | |
| Lagged inheritance recipient | ||||||
| Self | 11.047 | -0.449 | -2.633 | -30.318 | 12.489 | -5.438 |
| (8.95) | (9.03) | (11.80) | (12.49) | (11.80) | (11.00) | |
| Spouse | 0.652 | -6.519 | -18.434 | -23.069 | 2.035 | 18.676 |
| (8.66) | (8.82) | (11.92) | (11.84) | (12.51) | (12.52) | |
| L.Inheritance: Self × L.Inheritance: Spouse | -12.935 | 1.342 | 27.782 | 55.267 | 40.079 | -70.760 |
| (20.47) | (28.29) | (39.49) | (37.31) | (56.93) | (33.48) | |
| Unknown | 18.021 | 5.654 | -1.397 | -17.656 | -21.083 | -30.270 |
| (11.87) | (9.01) | (16.70) | (17.47) | (18.37) | (18.58) | |
| Observations | 8,319 | 8,319 | 8,319 | 8,319 | 8,319 | 8,319 |
| R-squared | 0.330 | 0.287 | 0.048 | 0.051 | 0.082 | 0.066 |
Source: SHARE and own calculations.
Table A11.
Impact of inheritances on time use: Ages 50-70.
| Paid work | Unpaid work | Leisure | ||||
|---|---|---|---|---|---|---|
| Husbands | Wives | Husbands | Wives | Husbands | Wives | |
| Inheritance recipient | ||||||
| Self | 3.501 | 34.707 | 5.042 | -40.158 | -1.894 | -12.495 |
| (16.37) | (21.55) | (17.04) | (18.43) | (18.42) | (19.19) | |
| Spouse | -2.023 | 4.194 | -28.929 | 30.335 | 23.475 | 8.779 |
| (13.67) | (18.95) | (17.35) | (22.46) | (20.07) | (16.01) | |
| Both | 25.528 | -64.100 | -20.660 | 10.340 | 26.543 | 107.308 |
| (54.83) | (56.80) | (45.06) | (53.11) | (54.54) | (63.16) | |
| Unknown | -18.818 | -29.598 | 16.591 | -41.546 | -38.691 | 11.099 |
| (25.41) | (16.23) | (33.41) | (25.09) | (36.38) | (35.77) | |
| Lagged inheritance recipient | ||||||
| Self | 20.360 | 4.845 | 3.462 | -27.387 | 3.719 | 9.084 |
| (13.79) | (15.68) | (16.66) | (16.48) | (15.23) | (13.81) | |
| Spouse | -8.000 | -5.647 | -15.328 | -41.413 | -1.258 | 26.743 |
| (14.77) | (13.61) | (16.78) | (14.03) | (18.49) | (15.87) | |
| L.Inheritance: Self × L.Inheritance: Spouse | 11.615 | -5.994 | -4.823 | 97.997 | 36.445 | -110.204 |
| (28.86) | (46.34) | (51.61) | (58.03) | (57.54) | (36.55) | |
| Unknown | 29.957 | 9.656 | -2.969 | -13.258 | -2.934 | -60.533 |
| (23.39) | (18.88) | (26.32) | (26.52) | (26.67) | (30.26) | |
| Observations | 3,044 | 3,044 | 3,044 | 3,044 | 3,044 | 3,044 |
| R-squared | 0.325 | 0.246 | 0.054 | 0.069 | 0.097 | 0.087 |
Source: SHARE and own calculations.
Appendix G. Annex VII: Excluding Zeros
Table A12.
Impact of inheritances on time use: Excluding zeros.
| Panel A: Full sample | ||||||
|---|---|---|---|---|---|---|
| Paid work | Unpaid work | Leisure | ||||
| Husbands | Wives | Husbands | Wives | Husbands | Wives | |
| Inheritance recipient | ||||||
| Self | -19.975 | 37.729 | 8.224 | -17.432 | 10.913 | 17.581 |
| (31.10) | (47.02) | (12.19) | (18.21) | (13.50) | (14.89) | |
| Spouse | -38.930 | -27.984 | -15.849 | 21.162 | 24.846 | 8.257 |
| (31.71) | (34.15) | (15.38) | (15.33) | (14.74) | (13.96) | |
| Unknown | -67.472 | -57.496 | 3.549 | 18.942 | -40.338 | -8.613 |
| (123.52) | (63.18) | (20.50) | (20.23) | (19.36) | (18.39) | |
| Lagged inheritance recipient | ||||||
| Self | 6.137 | -3.546 | -6.152 | -27.903 | 16.576 | -13.481 |
| (19.27) | (22.33) | (11.60) | (11.80) | (12.11) | (10.50) | |
| Spouse | -25.431 | -13.962 | -12.582 | -18.002 | 5.918 | 11.073 |
| (23.89) | (19.94) | (11.89) | (11.26) | (12.67) | (11.74) | |
| Unknown | 16.493 | 0.864 | 6.189 | -19.294 | -21.506 | -30.140 |
| (32.96) | (32.04) | (17.67) | (17.63) | (18.37) | (18.55) | |
| Observations | 801 | 810 | 7,029 | 7,984 | 8,317 | 8,319 |
| R-squared | 0.264 | 0.133 | 0.038 | 0.051 | 0.082 | 0.065 |
| Panel B: Ages 50-70 | ||||||
| Paid work | Unpaid work | Leisure | ||||
| Husbands | Wives | Husbands | Wives | Husbands | Wives | |
| Inheritance recipient | ||||||
| Self | -17.263 | 53.619 | 1.303 | -43.408 | 1.059 | -2.507 |
| (31.97) | (46.30) | (15.92) | (17.15) | (17.35) | (18.49) | |
| Spouse | -34.217 | -21.728 | -25.257 | 34.631 | 25.777 | 16.465 |
| (33.59) | (39.93) | (16.91) | (21.43) | (18.84) | (15.38) | |
| Unknown | -16.588 | -68.216 | -4.174 | -58.175 | -38.453 | 11.266 |
| (192.28) | (61.33) | (34.33) | (25.14) | (36.35) | (35.75) | |
| Lagged inheritance recipient | ||||||
| Self | -1.512 | -15.870 | -2.779 | -15.549 | 7.161 | -4.565 |
| (18.72) | (23.86) | (16.09) | (15.85) | (14.76) | (13.18) | |
| Spouse | -21.044 | -12.300 | -16.867 | -32.159 | 2.255 | 15.765 |
| (27.94) | (20.32) | (16.53) | (14.00) | (17.56) | (14.94) | |
| Unknown | 2.576 | 42.571 | 3.231 | -14.491 | -3.513 | -59.821 |
| (44.10) | (38.99) | (27.62) | (26.81) | (26.65) | (30.12) | |
| Observations | 613 | 626 | 2,722 | 2,954 | 3,043 | 3,044 |
| R-squared | 0.174 | 0.112 | 0.059 | 0.071 | 0.095 | 0.085 |
Source: SHARE and own calculations.
Appendix H. Annex VIII: Excluding Sleep from Leisure
Table A13.
Impact of inheritances on time use: Excluding sleep.
| Panel A: Full sample | ||||||||
|---|---|---|---|---|---|---|---|---|
| Paid work | Unpaid work | Leisure | Sleep | |||||
| Husbands | Wives | Husbands | Wives | Husbands | Wives | Husbands | Wives | |
| Inheritance recipient | ||||||||
| Self | 1.681 | 17.254 | 4.881 | -14.882 | 5.303 | 22.502 | 5.545 | -4.838 |
| (10.05) | (13.27) | (12.05) | (17.95) | (11.53) | (12.00) | (7.43) | (8.73) | |
| Spouse | -4.393 | 2.393 | -20.897 | 21.158 | 24.417 | -3.811 | 0.554 | 12.793 |
| (8.32) | (11.68) | (14.55) | (15.20) | (12.80) | (11.20) | (7.70) | (9.76) | |
| Unknown | -12.068 | -14.391 | 17.764 | 25.737 | -28.217 | -4.810 | -12.361 | -2.614 |
| (8.92) | (6.31) | (20.09) | (20.32) | (14.95) | (15.40) | (11.23) | (10.06) | |
| Lagged inheritance recipient | ||||||||
| Self | 9.572 | -0.084 | 0.368 | -24.473 | 18.832 | -6.432 | -1.960 | -7.266 |
| (8.26) | (8.60) | (11.26) | (11.79) | (10.86) | (8.82) | (5.45) | (6.04) | |
| Spouse | -1.054 | -6.339 | -15.195 | -17.089 | 0.445 | 4.542 | 5.439 | 6.301 |
| (8.02) | (8.39) | (11.42) | (11.24) | (11.27) | (9.36) | (6.87) | (6.83) | |
| Unknown | 17.967 | 5.720 | -1.406 | -17.921 | -22.111 | -8.967 | 0.956 | -21.034 |
| (11.88) | (9.00) | (16.69) | (17.47) | (13.39) | (14.90) | (11.06) | (9.42) | |
| Observations | 8,319 | 8,319 | 8,319 | 8,319 | 8,319 | 8,319 | 8,319 | 8,319 |
| R-squared | 0.329 | 0.287 | 0.048 | 0.050 | 0.062 | 0.062 | 0.059 | 0.040 |
| Panel B: Ages 50-70 | ||||||||
| Paid work | Unpaid work | Leisure | Sleep | |||||
| Husbands | Wives | Husbands | Wives | Husbands | Wives | Husbands | Wives | |
| Inheritance recipient | ||||||||
| Self | 5.919 | 28.988 | 3.149 | -39.619 | -4.927 | 12.839 | 6.215 | -15.336 |
| (15.80) | (20.18) | (15.72) | (17.49) | (15.01) | (15.76) | (9.98) | (9.98) | |
| Spouse | 0.171 | -1.504 | -30.800 | 32.922 | 21.491 | -0.350 | 4.331 | 17.141 |
| (13.30) | (18.10) | (16.31) | (21.02) | (16.28) | (13.43) | (10.12) | (9.07) | |
| Unknown | -18.733 | -29.652 | 16.549 | -41.570 | -9.430 | 39.290 | -30.294 | -26.932 |
| (25.37) | (16.21) | (33.41) | (25.01) | (28.31) | (31.91) | (23.08) | (17.06) | |
| Lagged inheritance recipient | ||||||||
| Self | 21.449 | 5.186 | 3.014 | -16.744 | 10.643 | -0.279 | -3.351 | -4.243 |
| (12.75) | (14.78) | (15.76) | (16.00) | (13.12) | (11.63) | (6.34) | (7.19) | |
| Spouse | -7.115 | -6.203 | -15.532 | -31.720 | 0.417 | 2.198 | 1.889 | 13.267 |
| (13.43) | (13.06) | (15.87) | (14.00) | (15.94) | (12.20) | (8.42) | (8.41) | |
| Unknown | 29.694 | 9.980 | -2.796 | -14.336 | -21.243 | -30.282 | 18.008 | -30.845 |
| (23.39) | (18.81) | (26.30) | (26.49) | (21.13) | (24.95) | (14.27) | (15.60) | |
| Observations | 3,044 | 3,044 | 3,044 | 3,044 | 3,044 | 3,044 | 3,044 | 3,044 |
| R-squared | 0.325 | 0.245 | 0.054 | 0.068 | 0.085 | 0.084 | 0.049 | 0.045 |
Source: SHARE and own calculations.
Appendix I. Annex IX: Excluding Help Provided to Parents
Table A14.
Impact of inheritances on time use: Excluding help to parents.
| Panel A: Full sample | ||||||
|---|---|---|---|---|---|---|
| Paid work | Unpaid work | Leisure | ||||
| Husbands | Wives | Husbands | Wives | Husbands | Wives | |
| Inheritance recipient | ||||||
| Self | 1.681 | 17.254 | 6.080 | -15.438 | 10.979 | 17.581 |
| (10.05) | (13.27) | (11.88) | (17.66) | (13.50) | (14.89) | |
| Spouse | -4.393 | 2.393 | -21.634 | 16.815 | 24.894 | 8.257 |
| (8.32) | (11.68) | (14.46) | (14.72) | (14.74) | (13.96) | |
| Unknown | -12.068 | -14.391 | 18.604 | 22.825 | -40.450 | -8.613 |
| (8.92) | (6.31) | (19.90) | (20.14) | (19.37) | (18.39) | |
| Lagged inheritance recipient | ||||||
| Self | 9.572 | -0.084 | 2.774 | -18.334 | 16.787 | -13.481 |
| (8.26) | (8.60) | (11.27) | (11.65) | (12.12) | (10.50) | |
| Spouse | -1.054 | -6.339 | -13.741 | -15.800 | 6.062 | 11.073 |
| (8.02) | (8.39) | (11.35) | (11.13) | (12.68) | (11.74) | |
| Unknown | 17.967 | 5.720 | -2.115 | -16.556 | -21.363 | -30.140 |
| (11.88) | (9.00) | (16.48) | (17.46) | (18.36) | (18.55) | |
| Observations | 8,319 | 8,319 | 8,319 | 8,319 | 8,319 | 8,319 |
| R-squared | 0.329 | 0.287 | 0.046 | 0.046 | 0.082 | 0.065 |
| Panel B: Ages 50-70 | ||||||
| Paid work | Unpaid work | Leisure | ||||
| Husbands | Wives | Husbands | Wives | Husbands | Wives | |
| Inheritance recipient | ||||||
| Self | 5.919 | 28.988 | 4.174 | -43.092 | 1.015 | -2.507 |
| (15.80) | (20.18) | (15.50) | (16.62) | (17.36) | (18.49) | |
| Spouse | 0.171 | -1.504 | -31.137 | 30.133 | 25.721 | 16.465 |
| (13.30) | (18.10) | (16.05) | (20.28) | (18.83) | (15.38) | |
| Unknown | -18.733 | -29.652 | 20.683 | -47.969 | -38.678 | 11.266 |
| (25.37) | (16.21) | (33.28) | (23.65) | (36.39) | (35.75) | |
| Lagged inheritance recipient | ||||||
| Self | 21.449 | 5.186 | 7.268 | -7.993 | 7.266 | -4.565 |
| (12.75) | (14.78) | (15.80) | (15.61) | (14.76) | (13.18) | |
| Spouse | -7.115 | -6.203 | -13.076 | -27.244 | 2.303 | 15.765 |
| (13.43) | (13.06) | (15.79) | (13.73) | (17.57) | (14.94) | |
| Unknown | 29.694 | 9.980 | -5.899 | -13.161 | -3.450 | -59.821 |
| (23.39) | (18.81) | (25.64) | (26.20) | (26.64) | (30.12) | |
| Observations | 3,044 | 3,044 | 3,044 | 3,044 | 3,044 | 3,044 |
| R-squared | 0.325 | 0.245 | 0.056 | 0.066 | 0.096 | 0.085 |
Source: SHARE and own calculations.
Appendix J. Annex X: At Least One Working Household Member
Table A15.
Impact of inheritances on time use: At least one working household member.
| Panel A: Full sample | ||||||
|---|---|---|---|---|---|---|
| Paid work | Unpaid work | Leisure | ||||
| Husbands | Wives | Husbands | Wives | Husbands | Wives | |
| Inheritance recipient | ||||||
| Self | 13.056 | 29.713 | -8.548 | -28.636 | 6.366 | -11.593 |
| (23.27) | (27.20) | (19.40) | (22.18) | (21.50) | (20.17) | |
| Spouse | -3.446 | 0.760 | -31.382 | 9.879 | 24.096 | 27.741 |
| (18.77) | (26.86) | (19.19) | (25.46) | (22.87) | (20.10) | |
| Unknown | -33.322 | -34.572 | 24.897 | 18.762 | -26.625 | -4.302 |
| (32.81) | (22.08) | (44.51) | (24.38) | (41.77) | (36.54) | |
| Lagged inheritance recipient | ||||||
| Self | 29.730 | 3.278 | 10.765 | -15.077 | 7.527 | -0.374 |
| (18.50) | (18.73) | (20.21) | (17.03) | (16.82) | (15.73) | |
| Spouse | -3.055 | -9.642 | -16.002 | -24.441 | 18.634 | 7.141 |
| (17.67) | (20.19) | (18.53) | (16.69) | (19.79) | (17.49) | |
| Unknown | 83.576 | 32.038 | 30.369 | -41.908 | -37.100 | -38.117 |
| (32.37) | (24.28) | (37.28) | (24.35) | (34.19) | (33.48) | |
| Observations | 2,306 | 2,306 | 2,306 | 2,306 | 2,306 | 2,306 |
| R-squared | 0.255 | 0.172 | 0.054 | 0.055 | 0.099 | 0.088 |
| Panel B: Ages 50-70 | ||||||
| Paid work | Unpaid work | Leisure | ||||
| Husbands | Wives | Husbands | Wives | Husbands | Wives | |
| Inheritance recipient | ||||||
| Self | 8.078 | 34.173 | -12.166 | -60.519 | -3.170 | -1.942 |
| (26.51) | (30.94) | (19.43) | (17.33) | (22.44) | (22.21) | |
| Spouse | -7.729 | -4.735 | -36.824 | 34.179 | 30.584 | 26.843 |
| (20.99) | (30.26) | (21.26) | (28.01) | (24.92) | (20.31) | |
| Unknown | -30.170 | -49.780 | 41.316 | 9.818 | -36.245 | 2.974 |
| (48.24) | (29.78) | (56.15) | (30.78) | (59.39) | (50.30) | |
| Lagged inheritance recipient | ||||||
| Self | 30.232 | 6.183 | 3.856 | -2.478 | 8.691 | -2.097 |
| (20.33) | (21.48) | (21.83) | (19.54) | (17.87) | (16.36) | |
| Spouse | -10.839 | -15.690 | -16.044 | -35.784 | 29.605 | 21.111 |
| (19.60) | (21.59) | (20.51) | (16.91) | (22.36) | (17.46) | |
| Unknown | 75.571 | 24.473 | 12.803 | -37.808 | 11.849 | -53.433 |
| (42.09) | (33.50) | (43.36) | (28.84) | (39.92) | (41.43) | |
| Observations | 1,755 | 1,755 | 1,755 | 1,755 | 1,755 | 1,755 |
| R-squared | 0.263 | 0.171 | 0.073 | 0.066 | 0.115 | 0.098 |
Source: SHARE and own calculations.
Appendix K. Annex XI: Full Model with Gender Interactions
Table A16.
Impact of inheritances on time use: Full model, full sample.
| Paid Work | Unpaid Work | Leisure | |
|---|---|---|---|
| Inheritance recipient: Self | 3.556 | 12.252 | 10.773 |
| (10.653) | (11.842) | (13.617) | |
| Inheritance recipient: Spouse | -1.979 | -8.387 | 13.406 |
| (9.066) | (13.603) | (14.911) | |
| Inheritance recipient: Unknown | -17.768 | 30.326 | -45.706 |
| (10.276) | (20.270) | (19.437) | |
| Self × Female | 13.220 | -41.863 | 13.675 |
| (16.491) | (20.612) | (19.943) | |
| Spouse × Female | 1.439 | 14.793 | 7.405 |
| (14.703) | (20.309) | (20.491) | |
| Unknown × Female | -1.580 | -18.345 | 45.716 |
| (12.325) | (29.233) | (27.104) | |
| Observations | 16,638 | 16,638 | 16,638 |
| Chow Test (F-stat) | 0.22 | 1.64 | 1.18 |
| p-value | 0.881 | 0.179 | 0.317 |
Source: SHARE and own calculations.
Table A17.
Impact of inheritances on time use: Full model, ages 50-70.
| Paid Work | Unpaid Work | Leisure | |
|---|---|---|---|
| Inheritance recipient: Self | 26.387 | 0.428 | 2.754 |
| (15.997) | (11.500) | (13.112) | |
| Inheritance recipient: Spouse | 12.974 | -6.352 | 17.732 |
| (14.103) | (11.357) | (13.654) | |
| Inheritance recipient: Unknown | -27.634 | 14.303 | 2.016 |
| (21.177) | (22.395) | (24.063) | |
| Self × Female | 24.167 | -36.545 | 0.718 |
| (23.195) | (16.893) | (18.429) | |
| Spouse × Female | -13.602 | 13.640 | -0.998 |
| (19.909) | (18.271) | (18.354) | |
| Unknown × Female | 25.709 | -14.223 | -15.825 |
| (32.337) | (33.005) | (35.256) | |
| Observations | 9,864 | 9,864 | 9,864 |
| Chow Test (F-stat) | 0.69 | 1.78 | 0.07 |
| p-value | 0.560 | 0.149 | 0.976 |
Source: SHARE and own calculations.
Appendix L. Annex XII: Alternative Fixed-Effects Specifications
Table A18.
Impact of inheritances on female unpaid work: Alternative fixed-effects specifications.
| Pooled OLS | Pooled OLS + cohort |
Pooled OLS + ind. averages |
TWFE | |
|---|---|---|---|---|
| Panel A: Full sample | ||||
| Inheritance recipient | ||||
| Self | -14.882 | -16.647 | -14.348 | 1.219 |
| (17.95) | (17.21) | (17.87) | (41.80) | |
| Spouse | 21.158 | 19.787 | 21.478 | 16.299 |
| (15.20) | (15.58) | (15.18) | (28.98) | |
| Unknown | 25.737 | 20.400 | 25.108 | 57.861 |
| (20.32) | (20.85) | (20.54) | (37.75) | |
| Lagged inheritance recipient | ||||
| Self | -24.473 | -23.854 | -24.689 | -37.667 |
| (11.79) | (11.77) | (11.77) | (29.52) | |
| Spouse | -17.089 | -18.475 | -17.455 | -10.713 |
| (11.24) | (11.11) | (11.25) | (30.65) | |
| Unknown | -17.921 | -24.161 | -19.607 | 15.692 |
| (17.47) | (17.78) | (17.47) | (37.31) | |
| Observations | 8,319 | 8,315 | 8,319 | 3,450 |
| R-squared | 0.050 | 0.056 | 0.052 | 0.637 |
| Panel B: Ages 50-70 | ||||
| Inheritance recipient | ||||
| Self | -35.980 | -40.115 | -39.438 | 1.391 |
| (17.46) | (16.32) | (17.15) | (68.04) | |
| Spouse | 35.517 | 31.766 | 32.292 | 26.712 |
| (22.36) | (21.23) | (21.03) | (54.23) | |
| Unknown | -42.940 | -42.466 | -42.306 | -88.112 |
| (28.23) | (26.16) | (24.89) | (69.64) | |
| Lagged inheritance recipient | ||||
| Self | -11.454 | -15.209 | -16.345 | -29.611 |
| (17.42) | (16.18) | (15.85) | (44.73) | |
| Spouse | -36.915 | -31.956 | -31.809 | -26.934 |
| (13.66) | (13.68) | (13.85) | (49.10) | |
| Unknown | -16.291 | -16.212 | -14.025 | -53.062 |
| (28.04) | (26.64) | (26.40) | (57.83) | |
| Observations | 2,811 | 3,094 | 3,095 | 824 |
| R-squared | 0.072 | 0.073 | 0.068 | 0.640 |
Source: SHARE and own elaboration.
Appendix M. Annex XIII: Unknown Inheritances
Table A19.
Impact of inheritances on time use: Unknown ownership.
| Panel A: Full sample | ||||||
|---|---|---|---|---|---|---|
| Paid work | Unpaid work | Leisure | ||||
| Husbands | Wives | Husbands | Wives | Husbands | Wives | |
| Unknown inheritance receipt | -12.659 | -14.316 | 17.431 | 25.949 | -41.333 | -9.738 |
| (8.90) | (6.26) | (20.10) | (20.34) | (19.29) | (18.49) | |
| Past unknown inheritance receipt | 17.944 | 5.783 | -1.375 | -17.810 | -21.337 | -30.025 |
| (11.88) | (8.98) | (16.69) | (17.50) | (18.38) | (18.50) | |
| Observations | 8,319 | 8,319 | 8,319 | 8,319 | 8,319 | 8,319 |
| R-squared | 0.329 | 0.287 | 0.047 | 0.049 | 0.082 | 0.065 |
| Panel B: Ages 50-70 | ||||||
| Paid work | Unpaid work | Leisure | ||||
| Husbands | Wives | Husbands | Wives | Husbands | Wives | |
| Unknown inheritance receipt | -21.267 | -30.184 | 17.526 | -37.445 | -40.518 | 9.447 |
| (25.42) | (16.09) | (33.33) | (24.94) | (36.20) | (35.75) | |
| Past unknown inheritance receipt | 29.892 | 9.471 | -2.566 | -14.313 | -3.748 | -59.521 |
| (23.34) | (18.83) | (26.24) | (26.37) | (26.59) | (29.92) | |
| Observations | 3,044 | 3,044 | 3,044 | 3,044 | 3,044 | 3,044 |
| R-squared | 0.324 | 0.245 | 0.053 | 0.065 | 0.096 | 0.084 |
Source: SHARE and own calculations.
Appendix N. Annex XIV: Disaggregated Time-Use Categories
Table A20.
Impact of inheritances on time use.
| Chores | Pers. care | Help child | Help par. | Help part. | Help fam. | Leisure | Admin. | Paid work | Voluntary | Travel | Nap/Rest | Sleep | Other | |||||||||||||||
|---|---|---|---|---|---|---|---|---|---|---|---|---|---|---|---|---|---|---|---|---|---|---|---|---|---|---|---|---|
| H | W | H | W | H | W | H | W | H | W | H | W | H | W | H | W | H | W | H | W | H | W | H | W | H | W | H | W | |
| Inh recipient | ||||||||||||||||||||||||||||
| Self | 6.954 | -19.930 | -2.078 | 0.124 | -1.130 | -2.545 | -2.306 | -0.021 | -8.725 | 2.432 | -0.568 | -1.930 | 7.672 | 21.836 | 3.676 | 1.998 | 1.681 | 17.254 | 0.402 | 2.746 | 2.376 | 1.704 | -3.460 | 3.031 | 8.676 | -7.557 | 1.421 | 1.273 |
| (7.23) | (7.07) | (2.68) | (4.68) | (7.90) | (10.16) | (1.26) | (2.20) | (3.52) | (8.98) | (3.34) | (4.28) | (11.51) | (10.78) | (2.84) | (1.84) | (10.05) | (13.27) | (4.01) | (3.91) | (2.67) | (1.69) | (4.15) | (4.92) | (5.80) | (6.75) | (4.46) | (5.50) | |
| Spouse | -4.222 | 4.479 | 1.927 | -0.703 | -8.307 | -4.540 | 0.551 | 4.569 | -1.677 | -2.627 | -3.223 | 7.279 | 21.630 | -2.438 | 2.364 | -0.122 | -4.393 | 2.393 | -4.560 | 2.644 | -1.539 | 6.642 | 1.039 | 13.465 | 0.191 | -0.510 | 8.836 | 3.651 |
| (7.40) | (8.07) | (4.79) | (3.16) | (5.95) | (8.18) | (1.63) | (3.54) | (8.88) | (4.90) | (2.67) | (5.73) | (11.87) | (10.72) | (3.27) | (2.25) | (8.32) | (11.68) | (2.77) | (3.51) | (1.54) | (5.37) | (4.53) | (6.12) | (5.81) | (7.39) | (6.96) | (4.40) | |
| Unknown | 9.736 | 23.591 | -3.426 | 8.830 | 8.762 | -3.364 | -0.177 | 2.269 | -0.370 | 12.477 | 1.033 | -6.715 | -25.092 | -12.855 | -0.375 | 2.788 | -12.068 | -14.391 | -1.053 | -6.240 | 1.384 | -1.255 | -0.078 | -7.017 | -11.503 | 4.714 | 18.462 | 8.009 |
| (10.15) | (12.28) | (3.74) | (7.30) | (11.58) | (9.43) | (1.38) | (3.70) | (8.60) | (10.26) | (5.68) | (2.07) | (14.31) | (14.41) | (2.98) | (3.21) | (8.92) | (6.31) | (4.15) | (1.31) | (3.75) | (2.06) | (5.61) | (4.18) | (10.12) | (8.94) | (8.87) | (5.55) | |
| Lag inh recipient | ||||||||||||||||||||||||||||
| Self | -4.328 | -2.710 | 2.373 | -0.864 | -5.130 | -14.326 | -2.292 | -5.893 | -5.114 | -2.751 | -0.895 | -3.116 | 16.186 | -5.833 | 3.907 | 5.521 | 9.572 | -0.084 | 7.916 | -0.011 | 6.344 | -0.717 | -3.698 | -7.113 | 1.954 | -0.281 | -0.145 | 3.387 |
| (4.80) | (7.26) | (4.59) | (2.40) | (5.77) | (6.01) | (0.94) | (1.65) | (3.52) | (4.99) | (2.75) | (2.51) | (9.75) | (8.63) | (3.90) | (2.21) | (8.26) | (8.60) | (4.19) | (2.32) | (4.54) | (1.44) | (3.25) | (2.91) | (4.34) | (5.20) | (3.74) | (3.52) | |
| Spouse | -4.010 | 4.355 | 6.001 | -1.284 | -7.148 | -5.096 | -1.239 | -0.842 | -4.175 | -10.097 | -2.410 | -2.799 | -5.955 | 5.326 | -3.925 | -1.601 | -1.054 | -6.339 | 6.121 | -2.340 | 2.476 | 1.114 | 0.864 | 7.272 | 4.444 | -1.059 | -0.234 | 0.822 |
| (4.65) | (6.76) | (5.55) | (2.25) | (5.28) | (6.95) | (1.11) | (2.12) | (5.18) | (2.55) | (2.73) | (2.12) | (9.18) | (9.04) | (2.07) | (1.48) | (8.02) | (8.39) | (4.10) | (1.96) | (2.14) | (1.43) | (4.24) | (4.47) | (4.77) | (5.30) | (4.59) | (3.43) | |
| Unknown | -2.631 | -14.447 | 1.450 | 0.917 | -7.127 | -4.753 | 0.557 | -1.096 | -3.812 | 5.393 | 14.149 | 4.042 | -22.798 | -10.080 | 1.762 | -4.632 | 17.967 | 5.720 | -2.760 | -2.373 | -1.733 | -0.490 | 5.657 | -6.777 | -3.346 | -12.858 | -2.815 | -4.958 |
| (8.85) | (9.12) | (5.00) | (4.22) | (6.59) | (8.92) | (1.51) | (1.94) | (6.03) | (11.30) | (7.71) | (5.93) | (12.75) | (14.47) | (4.01) | (1.25) | (11.88) | (9.00) | (2.99) | (2.19) | (1.98) | (1.05) | (6.99) | (3.78) | (8.39) | (8.29) | (5.47) | (2.80) | |
| Observations | 8,319 | 8,319 | 8,319 | 8,319 | 8,319 | 8,319 | 8,319 | 8,319 | 8,319 | 8,319 | 8,319 | 8,319 | 8,319 | 8,319 | 8,319 | 8,319 | 8,319 | 8,319 | 8,319 | 8,319 | 8,319 | 8,319 | 8,319 | 8,319 | 8,319 | 8,319 | 8,319 | 8,319 |
| R-squared | 0.078 | 0.097 | 0.051 | 0.036 | 0.042 | 0.051 | 0.032 | 0.026 | 0.022 | 0.022 | 0.017 | 0.019 | 0.064 | 0.066 | 0.044 | 0.031 | 0.329 | 0.287 | 0.025 | 0.017 | 0.077 | 0.085 | 0.105 | 0.082 | 0.034 | 0.034 | 0.027 | 0.024 |
| Chores | Pers. care | Help child | Help par. | Help part. | Help fam. | Leisure | Admin. | Paid work | Voluntary | Travel | Nap/Rest | Sleep | Other | |||||||||||||||
| H | W | H | W | H | W | H | W | H | W | H | W | H | W | H | W | H | W | H | W | H | W | H | W | H | W | H | W | |
| Inh recipient | ||||||||||||||||||||||||||||
| Self | 2.373 | -14.391 | -2.762 | 0.485 | 1.645 | -14.803 | -2.654 | 3.010 | -8.733 | -11.731 | 2.433 | -10.879 | -1.785 | 12.271 | 0.622 | 4.081 | 5.919 | 28.988 | -0.947 | 2.462 | 3.946 | 0.318 | -2.812 | -0.277 | 9.206 | -14.121 | 3.365 | 0.644 |
| (8.69) | (9.79) | (3.07) | (5.49) | (11.86) | (10.15) | (1.66) | (3.77) | (4.32) | (4.64) | (4.98) | (1.87) | (15.04) | (14.28) | (3.14) | (2.67) | (15.80) | (20.18) | (4.73) | (4.86) | (4.32) | (2.45) | (5.49) | (4.75) | (7.73) | (8.54) | (5.87) | (8.70) | |
| Spouse | -4.839 | 7.404 | -1.859 | 1.549 | -9.814 | -7.022 | 0.568 | 2.005 | -8.641 | 1.033 | -7.191 | 12.097 | 23.127 | -1.460 | 3.595 | -1.241 | 0.171 | -1.504 | -2.242 | 4.634 | -1.822 | 10.113 | 5.478 | 12.108 | -1.604 | 6.125 | 10.104 | 0.370 |
| (9.40) | (9.82) | (2.78) | (3.73) | (8.71) | (11.22) | (2.33) | (3.56) | (4.79) | (6.58) | (3.10) | (8.11) | (15.94) | (12.87) | (4.24) | (2.94) | (13.30) | (18.10) | (4.16) | (4.89) | (2.53) | (8.81) | (6.59) | (6.59) | (6.97) | (8.07) | (11.58) | (4.51) | |
| Unknown | 7.644 | -4.681 | 0.614 | 8.675 | -11.474 | -28.669 | -3.052 | 6.042 | -5.160 | -12.363 | 7.564 | -13.623 | -10.194 | 30.684 | 7.553 | 6.886 | -18.733 | -29.652 | 10.345 | -3.070 | 10.224 | 4.112 | -7.527 | -10.573 | -22.972 | -13.175 | 21.700 | 4.022 |
| (14.48) | (15.76) | (8.14) | (17.03) | (16.01) | (15.63) | (3.59) | (10.03) | (6.27) | (4.48) | (13.33) | (3.24) | (26.94) | (27.25) | (6.44) | (6.03) | (25.37) | (16.21) | (9.86) | (2.82) | (6.84) | (5.03) | (11.55) | (5.94) | (21.42) | (14.55) | (16.45) | (7.88) | |
| Lag inh recipient | ||||||||||||||||||||||||||||
| Self | -1.666 | -7.422 | -1.326 | -0.495 | -5.335 | -10.903 | -3.647 | -9.066 | -9.201 | 7.802 | -2.880 | -3.788 | 11.751 | 0.103 | 6.620 | 5.598 | 21.449 | 5.186 | 9.937 | 0.367 | 8.759 | -0.091 | -5.504 | -7.173 | 2.233 | 1.209 | -0.392 | 5.331 |
| (6.00) | (8.61) | (2.47) | (3.02) | (8.65) | (9.12) | (1.06) | (3.09) | (4.03) | (7.23) | (3.65) | (2.87) | (13.13) | (11.62) | (6.25) | (2.98) | (12.75) | (14.78) | (5.58) | (3.23) | (7.24) | (1.86) | (4.18) | (3.81) | (5.22) | (6.23) | (5.57) | (5.47) | |
| Spouse | -0.880 | -2.745 | 5.524 | -2.057 | -7.316 | -7.357 | -2.746 | -4.062 | 0.706 | -12.132 | -3.078 | -4.324 | -4.763 | 4.135 | -3.703 | -2.465 | -7.115 | -6.203 | 2.404 | -0.347 | -0.665 | 1.691 | -2.171 | 4.393 | 4.512 | 8.516 | 5.280 | -2.515 |
| (6.26) | (8.06) | (5.70) | (2.41) | (7.51) | (9.37) | (1.55) | (2.54) | (6.68) | (3.16) | (4.16) | (2.98) | (13.73) | (11.75) | (2.82) | (1.72) | (13.43) | (13.06) | (5.04) | (2.57) | (2.72) | (2.03) | (5.08) | (4.89) | (6.28) | (6.31) | (8.20) | (4.22) | |
| Unknown | -6.304 | -9.244 | -4.891 | 2.417 | -1.851 | 4.658 | 2.219 | -0.879 | -3.249 | -13.875 | 20.646 | 13.758 | -16.388 | -32.547 | -7.187 | -2.969 | 29.694 | 9.980 | -6.494 | -2.520 | -2.279 | -0.763 | 6.057 | -8.464 | 11.618 | -21.446 | -2.358 | -4.947 |
| (10.76) | (15.42) | (3.40) | (6.54) | (12.51) | (18.35) | (3.81) | (4.61) | (6.32) | (3.80) | (12.07) | (13.05) | (20.93) | (24.53) | (2.57) | (2.32) | (23.39) | (18.81) | (4.37) | (2.88) | (3.12) | (2.13) | (8.89) | (5.74) | (9.65) | (14.68) | (8.79) | (4.63) | |
| Observations | 3,044 | 3,044 | 3,044 | 3,044 | 3,044 | 3,044 | 3,044 | 3,044 | 3,044 | 3,044 | 3,044 | 3,044 | 3,044 | 3,044 | 3,044 | 3,044 | 3,044 | 3,044 | 3,044 | 3,044 | 3,044 | 3,044 | 3,044 | 3,044 | 3,044 | 3,044 | 3,044 | 3,044 |
| R-squared | 0.102 | 0.137 | 0.079 | 0.065 | 0.043 | 0.056 | 0.046 | 0.038 | 0.035 | 0.028 | 0.023 | 0.029 | 0.089 | 0.088 | 0.046 | 0.039 | 0.325 | 0.245 | 0.031 | 0.027 | 0.073 | 0.080 | 0.078 | 0.074 | 0.033 | 0.037 | 0.033 | 0.036 |
Appendix O. Annex XV: Liquidity Constraints: Full Sample
Table A21.
Impact of inheritances on time use by liquidity constraints: Full sample.
| Panel A: Financially constrained | ||||||
|---|---|---|---|---|---|---|
| Paid work | Unpaid work | Leisure | ||||
| Husbands | Wives | Husbands | Wives | Husbands | Wives | |
| Inheritance recipient | ||||||
| Self | 4.325 | 70.660 | -3.392 | -49.885 | 17.997 | 76.360 |
| (27.85) | (54.31) | (31.47) | (35.26) | (42.55) | (66.19) | |
| Spouse | -20.359 | -0.392 | 18.834 | 15.791 | 63.822 | 39.335 |
| (16.92) | (24.04) | (42.89) | (36.75) | (58.04) | (38.39) | |
| Unknown | -34.324 | -29.863 | 17.992 | 87.763 | 2.878 | 68.360 |
| (18.68) | (21.22) | (33.68) | (54.72) | (33.71) | (62.73) | |
| Lagged inheritance recipient | ||||||
| Self | -22.101 | 18.189 | -10.312 | -48.115 | 51.700 | 15.768 |
| (18.96) | (22.38) | (28.13) | (22.12) | (32.37) | (35.25) | |
| Spouse | 14.868 | -5.687 | -61.770 | -15.870 | 52.565 | 18.558 |
| (18.23) | (18.27) | (19.13) | (33.70) | (33.50) | (33.99) | |
| Unknown | -25.589 | 19.138 | -56.494 | 66.521 | 17.290 | -73.113 |
| (14.31) | (29.15) | (49.66) | (59.51) | (59.94) | (42.23) | |
| Observations | 2,350 | 2,350 | 2,350 | 2,350 | 2,350 | 2,350 |
| R-squared | 0.324 | 0.269 | 0.075 | 0.053 | 0.119 | 0.111 |
| Panel B: Financially unconstrained | ||||||
| Paid work | Unpaid work | Leisure | ||||
| Husbands | Wives | Husbands | Wives | Husbands | Wives | |
| Inheritance recipient | ||||||
| Self | -0.782 | 10.344 | 4.520 | -11.716 | 12.844 | 9.818 |
| (10.88) | (13.59) | (13.09) | (19.32) | (14.05) | (15.28) | |
| Spouse | -4.722 | 0.846 | -24.358 | 20.729 | 21.737 | 6.728 |
| (8.94) | (12.94) | (15.20) | (16.52) | (15.31) | (15.38) | |
| Unknown | -9.563 | -12.887 | 23.910 | 17.578 | -46.045 | -18.356 |
| (9.67) | (6.70) | (22.10) | (21.74) | (21.35) | (19.33) | |
| Lagged inheritance recipient | ||||||
| Self | 14.850 | -4.038 | 2.609 | -20.232 | 12.542 | -18.435 |
| (9.15) | (9.39) | (12.65) | (13.35) | (12.86) | (10.87) | |
| Spouse | -3.993 | -4.765 | -8.326 | -17.048 | -1.103 | 8.043 |
| (9.00) | (9.13) | (12.92) | (12.02) | (13.69) | (12.64) | |
| Unknown | 21.613 | 2.793 | 6.308 | -24.755 | -24.539 | -26.512 |
| (12.92) | (9.23) | (17.65) | (18.13) | (19.33) | (19.83) | |
| Observations | 5,940 | 5,940 | 5,940 | 5,940 | 5,940 | 5,940 |
| R-squared | 0.339 | 0.304 | 0.042 | 0.053 | 0.075 | 0.058 |
Source: SHARE and own calculations.
Appendix P. Annex XVI: Intra-Household Gender Gaps
Table A22.
Impact of inheritances on gender disparities: Full sample.
| Gap Paid work | Gap Unpaid work | Gap Leisure | |
|---|---|---|---|
| Inheritance recipient | |||
| Husband | 2.715 | -16.244 | 1.928 |
| (15.17) | (17.43) | (15.30) | |
| Wife | -20.434 | -3.031 | 3.481 |
| (14.59) | (16.08) | (18.10) | |
| Unknown | 2.383 | -9.436 | -29.830 |
| (10.43) | (25.34) | (21.57) | |
| Lagged inheritance recipient | |||
| Husband | 19.260 | 19.582 | 4.265 |
| (11.31) | (13.38) | (12.96) | |
| Wife | 3.948 | 8.487 | 17.528 |
| (11.59) | (13.92) | (14.27) | |
| Unknown | 15.352 | 17.991 | 5.622 |
| (13.30) | (21.10) | (20.60) | |
| Observations | 8,319 | 8,319 | 8,319 |
| R-squared | 0.063 | 0.026 | 0.020 |
Source: SHARE and own calculations.
Table A23.
Impact of inheritances on gender disparities + Interaction: Full sample.
| Gap Paid work | Gap Unpaid work | Gap Leisure | |
|---|---|---|---|
| Inheritance recipient | |||
| Husband | -1.514 | -14.167 | 6.140 |
| (15.13) | (18.16) | (15.73) | |
| Wife | -24.943 | -1.253 | 8.420 |
| (14.68) | (16.78) | (18.70) | |
| Both | 84.761 | -33.440 | -81.643 |
| (85.71) | (47.07) | (58.33) | |
| Unknown | 2.401 | -9.540 | -29.568 |
| (10.46) | (25.35) | (21.58) | |
| Lagged inheritance recipient | |||
| Husband | 21.459 | 22.281 | -7.585 |
| (12.01) | (14.20) | (12.86) | |
| Wife | 6.584 | 10.861 | 5.436 |
| (12.27) | (14.80) | (14.59) | |
| Both | -18.823 | -24.990 | 110.061 |
| (35.10) | (43.10) | (54.47) | |
| Unknown | 15.458 | 17.763 | 5.991 |
| (13.31) | (21.11) | (20.64) | |
| Observations | 8,319 | 8,319 | 8,319 |
| R-squared | 0.064 | 0.026 | 0.021 |
Source: SHARE and own calculations.
Table A24.
Impact of inheritances on intra-household gender gaps by financial constraints: Full sample.
Table A24.
Impact of inheritances on intra-household gender gaps by financial constraints: Full sample.
| Panel A: Financially constrained | |||
|---|---|---|---|
| Gap Paid work | Gap Unpaid work | Gap Leisure | |
| Inheritance recipient | |||
| Self | -91.391 | 86.338 | -27.905 |
| (60.59) | (43.82) | (78.33) | |
| Spouse | 10.291 | -16.605 | -19.254 |
| (34.38) | (39.20) | (45.84) | |
| Unknown | -6.935 | -66.789 | -76.847 |
| (16.90) | (40.06) | (67.88) | |
| Lagged inheritance recipient | |||
| Self | -1.942 | -12.478 | 45.481 |
| (30.37) | (25.50) | (40.14) | |
| Spouse | -11.536 | 13.598 | 33.459 |
| (26.70) | (38.95) | (31.59) | |
| Unknown | -42.696 | -117.585 | 80.938 |
| (39.12) | (62.15) | (50.51) | |
| Observations | 2,350 | 2,350 | 2,350 |
| R-squared | 0.105 | 0.042 | 0.030 |
| Panel B: Financially unconstrained | |||
| Gap Paid work | Gap Unpaid work | Gap Leisure | |
| Inheritance recipient | |||
| Self | -13.851 | -10.233 | 7.718 |
| (15.18) | (17.03) | (18.51) | |
| Spouse | 2.401 | -16.375 | 4.314 |
| (16.75) | (19.23) | (16.31) | |
| Unknown | 2.564 | 5.842 | -24.163 |
| (11.76) | (27.47) | (22.90) | |
| Lagged inheritance recipient | |||
| Self | 6.794 | 9.389 | 13.976 |
| (12.75) | (15.71) | (15.26) | |
| Spouse | 23.706 | 21.357 | 2.075 |
| (12.50) | (14.58) | (13.93) | |
| Unknown | 23.891 | 32.137 | -2.284 |
| (13.57) | (21.58) | (21.83) | |
| Observations | 5,940 | 5,940 | 5,940 |
| R-squared | 0.059 | 0.022 | 0.019 |
Source: SHARE and own calculations.
Table A25.
Impact of inheritances on gender gaps by financial constraints. Ages 50-70.
| Panel A: Financially constrained | |||
|---|---|---|---|
| Gap Paid work | Gap Unpaid work | Gap Leisure | |
| Inheritance recipient | |||
| Self | -164.101 | 168.348 | 26.856 |
| (112.61) | (60.65) | (126.32) | |
| Spouse | -3.205 | 6.156 | -15.204 |
| (48.74) | (33.10) | (55.23) | |
| Unknown | 10.079 | -6.428 | -142.642 |
| (32.47) | (53.45) | (119.62) | |
| Lagged inheritance recipient | |||
| Self | -1.794 | -52.974 | 51.966 |
| (59.43) | (38.67) | (46.87) | |
| Spouse | -31.441 | 104.908 | 3.755 |
| (44.02) | (47.33) | (40.61) | |
| Unknown | -9.106 | -160.463 | 127.129 |
| (52.53) | (95.65) | (78.88) | |
| Observations | 892 | 892 | 892 |
| R-squared | 0.152 | 0.087 | 0.079 |
| Panel B: Financially unconstrained | |||
| Gap Paid work | Gap Unpaid work | Gap Leisure | |
| Inheritance recipient | |||
| Self | -25.705 | -3.680 | 30.702 |
| (23.13) | (19.66) | (21.16) | |
| Spouse | 10.086 | -32.990 | -20.150 |
| (27.95) | (26.58) | (19.61) | |
| Unknown | 7.965 | 61.537 | -20.172 |
| (35.67) | (37.36) | (49.05) | |
| Lagged inheritance recipient | |||
| Self | 2.608 | -0.830 | 1.799 |
| (21.41) | (20.27) | (19.62) | |
| Spouse | 41.707 | 21.650 | -3.557 |
| (19.66) | (19.41) | (16.42) | |
| Unknown | 43.339 | 20.996 | 39.536 |
| (29.31) | (32.11) | (36.25) | |
| Observations | 2,144 | 2,144 | 2,144 |
| R-squared | 0.069 | 0.033 | 0.029 |
Source: SHARE and own calculations.
References
- Augustine, J. M., and K. Prickett. 2022. Gender Disparities in Increased Parenting Time During the COVID-19 Pandemic: A Research Note. Demography 59, 4: 1233–1247. [Google Scholar] [CrossRef]
- Becker, G. S. 1965. A Theory of the Allocation of Time. The Economic Journal 75, 299: 493–517. [Google Scholar] [CrossRef]
- Belloc, I., J. A. Molina, and J. Velilla. 2025. Unexpected Inheritances and Household Labor Supply: Does the Identity of the Recipient Matter? Review of Income and Wealth 71, 1: e12723. [Google Scholar] [CrossRef]
- |||Bertrand et al.]bertrandhow2004, M. Bertrand, E. Duflo, and S. Mullainathan 2004. How Much Should We Trust Differences-In-Differences Estimates? The Quarterly Journal of Economics 119, 1: 249–275. [Google Scholar] [CrossRef]
- Biddle, J., and D. Hamermesh. 1990. Sleep and the Allocation of Time. Journal of Political Economy 98, 5: 922–43. [Google Scholar] [CrossRef]
- Black, S. E., P. J. Devereux, F. Landaud, and K. G. Salvanes. 2022. Gender and Inheritances. AEA Papers and Proceedings 112: 68–72. [Google Scholar] [CrossRef]
- Black, S. E., P. J. Devereux, F. Landaud, and K. G. Salvanes. 2025. The (Un)Importance of Inheritance. Journal of the European Economic Association 23, 3: 1060–1094. [Google Scholar] [CrossRef]
- Blau, F. D., and L. M. Kahn. 2007. Changes in the Labor Supply Behavior of Married Women: 1980–2000. Journal of Labor Economics 25, 3: 393–438. [Google Scholar] [CrossRef]
- Blundell, R., L. Pistaferri, and I. Preston. 2008. Consumption Inequality and Partial Insurance. American Economic Review 98, 5: 1887–1921. [Google Scholar] [CrossRef]
- Bonke, J. 2005. Paid Work and Unpaid Work: Diary Information Versus Questionnaire Information. Social Indicators Research 70, 3: 349–368. [Google Scholar] [CrossRef]
- Brandt, A., M. Hunkler, C. Kneip, T. Korbmacher, J. Malter, F. Schaan, B. Stuck, S. Zuber, S, and SHARE Central Coordination Team. 2013. Data Resource Profile: The Survey of Health, Ageing and Retirement in Europe (SHARE). International Journal of Epidemiology 42, 4: 992–1001. [Google Scholar] [CrossRef]
- Browning, M., and P. A. Chiappori. 1998. Efficient Intra-Household Allocations: A General Characterization and Empirical Tests. Econometrica 66, 6: 1241–1278. [Google Scholar] [CrossRef]
- Bryson, J., J. Wilson, G. Plimmer, S. Blumenfeld, N. Donnelly, B. Ku, and B. Ryan. 2014. Women Workers: Caring, Sharing, Enjoying Their Work – or Just Another Gender Stereotype? Labour and Industry 24, 4: 258–271. [Google Scholar] [CrossRef]
- Campaña, J. C., J. I. Gimenez-Nadal, and J. Velilla. 2023. Measuring Gender Gaps in Time Allocation in Europe. Social Indicators Research 165, 2: 519–553. [Google Scholar] [CrossRef]
- Cavalcanti, d. V. T. V., and J. Tavares. 2008. Assessing the "Engines of Liberation": Home Appliances and Female Labor Force Participation. The Review of Economics and Statistics 90, 1: 81–88. [Google Scholar] [CrossRef]
- Collins, C., L. C. Landivar, L. Ruppanner, and W. J. Scarborough. 2021. COVID-19 and the Gender Gap in Work Hours. Gender, Work & Organization 28, S1: 101–112. [Google Scholar] [CrossRef]
- Cox, D. 2014. Inheritance, Bequests, and Labor Supply. IZA World of Labor, September. [Google Scholar] [CrossRef]
- Doorley, K., and N. Pestel. 2016. Labour Supply after Inheritances and the Role of Expectations. (IZA Discussion Papers No. 9822). [Google Scholar]
- Eder, A. 2016. The Impact of Inheritances on the Retirement Behavior of Older Europeans. Empirica 43, 2: 299–331. [Google Scholar] [CrossRef]
- Elsner, B., M. Jindal, M. Mascherini, and S. Nivakoski. 2024. Gender Gaps in Time Use: Pan-European Evidence from School Closures during the COVID-19 Pandemic. The Economic and Social Review 55, 3. [Google Scholar]
- EUROSTAT. 2019. How do women and men use their time - statistics. (Statistics Explained). EUROSTAT. [Google Scholar]
- Fadlon, I., and T. H. Nielsen. 2021. Family Labor Supply Responses to Severe Health Shocks: Evidence from Danish Administrative Records. American Economic Journal: Applied Economics 13, 3: 1–30. [Google Scholar] [CrossRef]
- García-Mainar, I., J. A. Molina, and V. M. Montuenga. 2011. Gender Differences in Childcare: Time Allocation in Five European Countries. Feminist Economics 17, 1: 119–150. [Google Scholar] [CrossRef]
- Molina, J. I., J. A. Velilla, and J. 2025. Work from Home, Time Allocation, and Well-Being: The Impact of Lockdowns. Review of Economics of the Household 23, 2: 505–549. [Google Scholar] [CrossRef]
- elfsymboland Sevilla-Sanz]gimenez-nadaltimecrunch2011 Gimenez-Nadal, J. I., and A. Sevilla-Sanz. 2011. The Time-Crunch Paradox. Social Indicators Research 102, 2: 181–196. [Google Scholar] [CrossRef]
- Gimenez-Nadal, J. I. M. 2022. The Gender Gap in Time Allocation. IZA World of Labor, July. [Google Scholar] [CrossRef]
- Goldin, C. 2014. A Grand Gender Convergence: Its Last Chapter. American Economic Review 104, 4: 1091–1119. [Google Scholar] [CrossRef]
- Greenwood, J., A. Seshadri, and M. Yorukoglu. 2005. Engines of Liberation. The Review of Economic Studies 72, 1: 109–133. [Google Scholar] [CrossRef]
- Gronau, R. 1977. Leisure, Home Production, and Work–the Theory of the Allocation of Time Revisited. Journal of Political Economy 85, 6: 1099–1123. [Google Scholar] [CrossRef]
- Hanna, T., C. Meisel, J. Moyer, G. Azcona, A. Bhatt, S. Duerto Valero, and A. Meagher. 2023. Forecasting time spent in unpaid care and domestic work (Technical Brief). Frederick S. Pardee Center & UN WOMEN. [Google Scholar]
- Heilman, M. E. 2001. Description and Prescription: How Gender Stereotypes Prevent Women’s Ascent Up the Organizational Ladder. Journal of Social Issues 57, 4: 657–674. [Google Scholar] [CrossRef]
- Holtz-Eakin, D., D. Joulfaian, and H. S. Rosen. 1993. The Carnegie Conjecture: Some Empirical Evidence. The Quarterly Journal of Economics 108, 2: 413–435. [Google Scholar] [CrossRef]
- Hubbard, R. G., J. Skinner, and S. P. Zeldes. 1995. Precautionary Saving and Social Insurance. Journal of Political Economy 103, 2: 360–399. [Google Scholar] [CrossRef]
- Imbens, G., D. B. Rubin, and B. I. Sacerdote. 2001. Estimating the Effect of Unearned Income on Labor Earnings, Savings, and Consumption: Evidence from a Survey of Lottery Players. American Economic Review 91, 4: 778–794. [Google Scholar] [CrossRef]
- Jayachandran, S., and A. Voena. 2026. Women’s Power in the Household. Journal of Economic Literature 64, 2: 447–497. [Google Scholar] [CrossRef]
- Juster, F. T., H. Ono, and F. P. Stafford. 2003. An Assessment of Alternative Measures of Time Use. Sociological Methodology 33, 1: 19–54. [Google Scholar] [CrossRef]
- Kahneman, D., and A. B. Krueger. 2006. Developments in the Measurement of Subjective Well-Being. Journal of Economic Perspectives 20, 1: 3–24. [Google Scholar] [CrossRef]
- Kahneman, D., A. B. Krueger, D. A. Schkade, N. Schwarz, and A. A. Stone. 2004. A Survey Method for Characterizing Daily Life Experience: The Day Reconstruction Method. Science 306, 5702: 1776–1780. [Google Scholar] [CrossRef]
- Kan, M. Y., and S. Pudney. 2008. Measurement Error in Stylized and Diary Data on Time Use. Sociological Methodology 38, 1: 101–132. [Google Scholar] [CrossRef]
- Kaplan, H. R. 1987. Lottery Winners: The Myth and Reality. Journal of Gambling Behavior 3, 3: 168–178. [Google Scholar] [CrossRef]
- Klevmarken, N. A. 2005. Estimates of a Labour Supply Function Using Alternative Measures of Hours of Work. European Economic Review 49, 1: 55–73. [Google Scholar] [CrossRef]
- Knize, V., L. Tobler, B. Christoph, L. Fervers, and M. Jacob. 2022. Workin’ Moms Ain’t Doing so Bad: Evidence on the Gender Gap in Working Hours at the Outset of the COVID-19 Pandemic. Journal of Family Research 34, 1: 161–192. [Google Scholar] [CrossRef]
- Malo, M. Á., and D. Sciulli. 2021. Wealth Transfers and Labour Supply: Impact of Inheritances and Gifts by Gender in Europe. International Journal of Manpower 42, 8: 1450–1478. [Google Scholar] [CrossRef]
- Malo, M. Á., and D. Sciulli. 2023. Expected Wealth Transfers and Consumption across the Wealth Distribution in Europe. Economic Modelling 126: 106416. [Google Scholar] [CrossRef]
- Molina, J. A., J. Velilla, and H. Ibarra. 2023. Intrahousehold Bargaining Power in Spain: An Empirical Test of the Collective Model. Journal of Family and Economic Issues 44, 1: 84–97. [Google Scholar] [CrossRef]
- Moro, B. R. 2025. The Unchanging Divide: Housework and Labor Responsibilities in Late Family Stages. SERIEs, August. [Google Scholar] [CrossRef]
- Niizeki, T., and M. Hori. 2019. The Effect of Inheritance Receipt on Individual Labor Supply: Evidence from Japanese Microdata. Japan and the World Economy 49: 176–186. [Google Scholar] [CrossRef]
- Pearse, R., and R. Connell. 2016. Gender Norms and the Economy: Insights from Social Research. Feminist Economics 22, 1: 30–53. [Google Scholar] [CrossRef]
- Piekkola, H., and L. Leijola. 2004. Time Use, Health and Retirement (SSRN Scholarly Paper No. 2005174). [Google Scholar] [CrossRef]
- Roth, J., and P. H. C. Sant’Anna. 2023. When Is Parallel Trends Sensitive to Functional Form? Econometrica 91, 2: 737–747. [Google Scholar] [CrossRef]
- Rubiano Matulevich, E. C., and M. Viollaz. 2019. Gender Differences in Time Use: Allocating Time between the Market and the Household (SSRN Scholarly Paper No. 3437824). [Google Scholar] [CrossRef]
- Schulz, F., and M. Raab. 2023. When the Last Child Moves out: Continuity and Convergence in Spouses’ Housework Time. Journal of Marriage and Family 85, 1: 305–320. [Google Scholar] [CrossRef]
- SHARE-ERIC. 2017. SHARE Release Guide 7.1.1 (Release Guide). SHARE. [Google Scholar] [CrossRef]
- SHARE-ERIC. 2019. SHARE Release Guide 8.0.0 (Release Guide). SHARE. [Google Scholar] [CrossRef]
- SHARE-ERIC. 2022. SHARE Release Guide 9.0.0 (Release Guide). SHARE. [Google Scholar] [CrossRef]
- Sprod, J., T. Olds, W. Brown, N. Burton, J. van Uffelen, K. Ferrar, and C. Maher. 2017. Changes in Use of Time across Retirement: A Longitudinal Study. Maturitas 100: 70–76. [Google Scholar] [CrossRef]
- Suari-Andreu, E. 2023. Labour Supply, Retirement, and Consumption Responses of Older Europeans to Inheritance Receipt. Empirical Economics 64, 1: 33–75. [Google Scholar] [CrossRef]
- Tur-Sinai, A., H. Künemund, and C. Vogel. 2022. Inheritances and Work for Pay — Will the Expected Wave of Bequests Undermine Active Ageing Policies? European Journal of Ageing 19, 4: 1251–1261. [Google Scholar] [CrossRef]
- UNDP. 2024. Bridging Gender Gaps with a Sustainable Care Economy: Investment Opportunities and Challenges. Development Futures Series(80). [Google Scholar] [CrossRef]
- WEF. 2022. Global Gender Gap Report 2022 (Insight Report). World Economic Forum. [Google Scholar]
- WEF. 2023. Global Gender Gap Report 2023 (Insight Report). World Economic Forum. [Google Scholar]
| 1 | For details on different economic models of household decision-making see Jayachandran and Voena (2026) |
| 2 | “The parent who leaves his son enormous wealth generally deadens the talents and energies of the son, and tempts him to lead a less useful and less worthy life than otherwise would...” |
| 3 | This paper uses data from SHARE Waves 7, 8, and 9, (DOIs: 10.6103/SHARE.w7.900, 10.6103/SHARE.w8.900, 10.6103/SHARE.w9.900). See Bergmann and Börsch-Supan (2021) for methodological details (www.share-project.org for the full list of funding institutions). |
| 4 | Austria, Germany, Sweden, Spain, Italy, France, Denmark, Greece, Switzerland, Belgium, Israel, Czech Republic, Poland, Luxembourg, Hungary, Slovenia, Estonia, and Croatia. |
| 5 | Question “FT015” (Ever received gift or inherited money 5000 or more): “Not counting any large gift we may have already talked about/Since our interview in, have you or your partner received a gift or inherited money, goods, or property worth more than €5,000? Not including any gifts you have already mentioned.”
|
| 6 | Question “FT017”: “From whom did you or your partner receive this gift or inheritance?”
|
| 7 | SHARE previously measured the subjective probability of receiving an inheritance within 10 years; however, this variable was not included after Wave 5. The sample size for this question in Waves 7, 8, and 9 is too small for incorporation in the analysis. |
| 8 | Note that as we are running the models separately for men and women, clustering standard errors at household or at individual level yields the same results |
| 9 | Given SHARE’s biennial interview structure, this means approximately two years after the wealth transfer |
| 10 | Question “CO003” (Amount spent on food outside the home): How much did your household spend in a typical month on food to be consumed outside home?
|
| 11 | Question “CO007” (Is household able to make ends meet): “Thinking of your household’s total monthly income, would you say that your household is able to make ends meet... (with great difficulty / with somedifficulty / fairly easily / easily)?” |
Table 1.
Summary of variables.
| Type of Variable | Dimensions |
|---|---|
| Main Outcome | Time use on paid work |
| Time use on unpaid work | |
| Time use on leisure | |
| Other daily activities | |
| Explanatory variable | Inheritance (≥ €5,000) |
| Control variables | Demographics (age, country) |
| Socio-economic (education, hh size, n children) | |
| Labour market status (self-employed, retired) | |
| Household’ income (earnings, non labour income) | |
| Other (network satisfaction, weekday, death parents) | |
| Source: Own elaboration. | |
Table 2.
Summary statistics: Full sample.
| Full Sample | Husbands | Wives | |||||
|---|---|---|---|---|---|---|---|
| Mean | Std. Dev. | Mean | Std. Dev. | Mean | Std. Dev. | Diff. | |
| Individual variables | |||||||
| Minutes on paid work | 49.411 | (145.705) | 50.936 | (148.206) | 47.887 | (143.150) | 3.049 |
| Minutes on unpaid work | 219.598 | (204.589) | 180.878 | (193.292) | 258.319 | (208.222) | -77.441 |
| Minutes on leisure | 763.777 | (200.629) | 778.933 | (205.636) | 748.621 | (194.323) | 30.311 |
| Inheritance receipt | 0.026 | (0.160) | 0.025 | (0.157) | 0.027 | (0.163) | -0.002 |
| Age of respondent | 70.059 | (7.949) | 71.608 | (7.722) | 68.511 | (7.872) | 3.097 |
| Retirement | 0.731 | (0.443) | 0.826 | (0.379) | 0.637 | (0.481) | 0.189 |
| Primary education | 0.314 | (0.464) | 0.297 | (0.457) | 0.331 | (0.471) | -0.035 |
| Secondary education | 0.439 | (0.496) | 0.443 | (0.497) | 0.435 | (0.496) | 0.008 |
| Tertiary education | 0.247 | (0.432) | 0.261 | (0.439) | 0.234 | (0.423) | 0.027 |
| Self-employment | 0.040 | (0.196) | 0.054 | (0.225) | 0.027 | (0.161) | 0.027 |
| Good health | 0.412 | (0.492) | 0.412 | (0.492) | 0.412 | (0.492) | -0.000 |
| Health improved since previous interview | 0.209 | (0.407) | 0.210 | (0.408) | 0.208 | (0.406) | 0.002 |
| Health worsened since previous interview | 0.246 | (0.431) | 0.252 | (0.434) | 0.240 | (0.427) | 0.012 |
| Network satisfaction | 9.046 | (1.166) | 8.990 | (1.205) | 9.101 | (1.124) | -0.110 |
| Father death since the previous interview | 0.002 | (0.044) | 0.002 | (0.042) | 0.002 | (0.046) | -0.000 |
| Mother death since the previous interview | 0.002 | (0.044) | 0.001 | (0.036) | 0.003 | (0.051) | -0.001 |
| Observations | 29,826 | 14,913 | 14,913 | ||||
| Household variables | |||||||
| Household size | 2.213 | (0.637) | |||||
| Number of children | 2.215 | (1.182) | |||||
| Inheritance owner: Unknown | 0.012 | (0.109) | |||||
| Household earnings | 8,415.330 | (20,804.430) | |||||
| Household non labor income | 24,739.264 | (35,709.037) | |||||
| Couples | 6,594 | ||||||
Source: SHARE and own elaboration.
Table 3.
Summary statistics: Ages 50-70.
| Full Sample | Husbands | Wives | |||||
|---|---|---|---|---|---|---|---|
| Mean | Std. Dev. | Mean | Std. Dev. | Mean | Std. Dev. | Diff. | |
| Individual variables | |||||||
| Minutes on paid work | 103.496 | (199.663) | 107.405 | (203.740) | 99.587 | (195.443) | 7.817 |
| Minutes on unpaid work | 237.191 | (213.783) | 199.926 | (199.843) | 274.455 | (220.681) | -74.528 |
| Minutes on leisure | 741.251 | (196.992) | 752.553 | (200.022) | 729.948 | (193.275) | 22.605 |
| Inheritance receipt | 0.043 | (0.202) | 0.042 | (0.201) | 0.043 | (0.202) | -0.001 |
| Age of respondent | 63.170 | (4.110) | 64.348 | (3.663) | 61.992 | (4.195) | 2.356 |
| Retirement | 0.527 | (0.499) | 0.619 | (0.486) | 0.434 | (0.496) | 0.185 |
| Primary education | 0.248 | (0.432) | 0.241 | (0.428) | 0.255 | (0.436) | -0.014 |
| Secondary education | 0.490 | (0.500) | 0.495 | (0.500) | 0.486 | (0.500) | 0.009 |
| Tertiary education | 0.262 | (0.440) | 0.264 | (0.441) | 0.259 | (0.438) | 0.005 |
| Self-employment | 0.070 | (0.255) | 0.094 | (0.292) | 0.045 | (0.208) | 0.049 |
| Good health | 0.417 | (0.493) | 0.420 | (0.494) | 0.415 | (0.493) | 0.005 |
| Health improved since previous interview | 0.223 | (0.416) | 0.223 | (0.416) | 0.223 | (0.416) | 0.000 |
| Health worsened since previous interview | 0.237 | (0.425) | 0.241 | (0.428) | 0.233 | (0.423) | 0.009 |
| Network satisfaction | 9.072 | (1.111) | 9.021 | (1.148) | 9.122 | (1.069) | -0.101 |
| Father death since the previous interview | 0.003 | (0.057) | 0.003 | (0.056) | 0.003 | (0.058) | -0.000 |
| Mother death since the previous interview | 0.003 | (0.057) | 0.002 | (0.048) | 0.004 | (0.065) | -0.002 |
| Observations | 11,358 | 5,679 | 5,679 | ||||
| Household variables | |||||||
| Household size | 2.313 | (0.716) | |||||
| Number of children | 2.163 | (1.141) | |||||
| Inheritance owner: Unknown | 0.013 | (0.112) | |||||
| Household earnings | 17,539.808 | (28,058.152) | |||||
| Household non labor income | 19,200.168 | (39,213.001) | |||||
| Couples | 2,635 | ||||||
Source: SHARE and own elaboration.
Table 4.
Impact of inheritances on time use: Full sample.
| Paid work | Unpaid work | Leisure | ||||
|---|---|---|---|---|---|---|
| Husbands | Wives | Husbands | Wives | Husbands | Wives | |
| Inheritance recipient | ||||||
| Self | 1.681 | 17.254 | 4.881 | -14.882 | 10.979 | 17.581 |
| (10.05) | (13.27) | (12.05) | (17.95) | (13.50) | (14.89) | |
| Spouse | -4.393 | 2.393 | -20.897 | 21.158 | 24.894 | 8.257 |
| (8.32) | (11.68) | (14.55) | (15.20) | (14.74) | (13.96) | |
| Unknown | -12.068 | -14.391 | 17.764 | 25.737 | -40.450 | -8.613 |
| (8.92) | (6.31) | (20.09) | (20.32) | (19.37) | (18.39) | |
| Lagged inheritance recipient | ||||||
| Self | 9.572 | -0.084 | 0.368 | -24.473 | 16.787 | -13.481 |
| (8.26) | (8.60) | (11.26) | (11.79) | (12.12) | (10.50) | |
| Spouse | -1.054 | -6.339 | -15.195 | -17.089 | 6.062 | 11.073 |
| (8.02) | (8.39) | (11.42) | (11.24) | (12.68) | (11.74) | |
| Unknown | 17.967 | 5.720 | -1.406 | -17.921 | -21.363 | -30.140 |
| (11.88) | (9.00) | (16.69) | (17.47) | (18.36) | (18.55) | |
| Observations | 8,319 | 8,319 | 8,319 | 8,319 | 8,319 | 8,319 |
| R-squared | 0.329 | 0.287 | 0.048 | 0.050 | 0.082 | 0.065 |
Source: SHARE and own calculations.
Table 5.
Impact of inheritances on time use: Ages 50-70.
| Paid work | Unpaid work | Leisure | ||||
|---|---|---|---|---|---|---|
| Husbands | Wives | Husbands | Wives | Husbands | Wives | |
| Inheritance recipient | ||||||
| Self | 5.919 | 28.988 | 3.149 | -39.619 | 1.015 | -2.507 |
| (15.80) | (20.18) | (15.72) | (17.49) | (17.36) | (18.49) | |
| Spouse | 0.171 | -1.504 | -30.800 | 32.922 | 25.721 | 16.465 |
| (13.30) | (18.10) | (16.31) | (21.02) | (18.83) | (15.38) | |
| Unknown | -18.733 | -29.652 | 16.549 | -41.570 | -38.678 | 11.266 |
| (25.37) | (16.21) | (33.41) | (25.01) | (36.39) | (35.75) | |
| Lagged inheritance recipient | ||||||
| Self | 21.449 | 5.186 | 3.014 | -16.744 | 7.266 | -4.565 |
| (12.75) | (14.78) | (15.76) | (16.00) | (14.76) | (13.18) | |
| Spouse | -7.115 | -6.203 | -15.532 | -31.720 | 2.303 | 15.765 |
| (13.43) | (13.06) | (15.87) | (14.00) | (17.57) | (14.94) | |
| Unknown | 29.694 | 9.980 | -2.796 | -14.336 | -3.450 | -59.821 |
| (23.39) | (18.81) | (26.30) | (26.49) | (26.64) | (30.12) | |
| Observations | 3,044 | 3,044 | 3,044 | 3,044 | 3,044 | 3,044 |
| R-squared | 0.325 | 0.245 | 0.054 | 0.068 | 0.096 | 0.085 |
Source: SHARE and own calculations.
Table 6.
Impact of inheritances on time use: Unitary model.
| Panel A: Full sample | ||||||
|---|---|---|---|---|---|---|
| Paid work | Unpaid work | Leisure | ||||
| Husbands | Wives | Husbands | Wives | Husbands | Wives | |
| Household inheritance receipt | -5.879 | 6.089 | -2.450 | 8.456 | 7.858 | 5.158 |
| (5.78) | (7.71) | (9.14) | (10.90) | (9.49) | (9.36) | |
| Lagged household inheritance receipt | 6.991 | -2.996 | -8.639 | -24.314 | 4.267 | -0.414 |
| (5.44) | (5.44) | (7.75) | (8.16) | (8.39) | (7.78) | |
| Observations | 8,319 | 8,319 | 8,319 | 8,319 | 8,319 | 8,319 |
| R-squared | 0.329 | 0.287 | 0.047 | 0.050 | 0.081 | 0.064 |
| Panel B: Ages 50-70 | ||||||
| Paid work | Unpaid work | Leisure | ||||
| Husbands | Wives | Husbands | Wives | Husbands | Wives | |
| Household inheritance receipt | -2.615 | 12.055 | -11.169 | -9.738 | 7.381 | 1.187 |
| (10.13) | (12.92) | (11.72) | (13.45) | (13.13) | (12.32) | |
| Lagged household inheritance receipt | 10.369 | -1.302 | -6.253 | -30.725 | 2.585 | 6.937 |
| (9.27) | (9.43) | (11.31) | (10.84) | (11.39) | (10.48) | |
| Observations | 3,044 | 3,044 | 3,044 | 3,044 | 3,044 | 3,044 |
| R-squared | 0.323 | 0.244 | 0.053 | 0.067 | 0.096 | 0.082 |
Source: SHARE and own calculations.
Table 7.
Impact of inheritances on time use: Inheritance expectations.
| Panel A: Full sample | ||||||
|---|---|---|---|---|---|---|
| Paid work | Unpaid work | Leisure | ||||
| Husbands | Wives | Husbands | Wives | Husbands | Wives | |
| Expected inheritance receipt | -3.979 | 11.300 | -7.459 | 3.891 | 20.207 | 8.648 |
| (6.77) | (9.42) | (10.21) | (12.49) | (10.71) | (10.57) | |
| Unexpected inheritance receipt | -12.905 | -13.471 | 16.752 | 25.853 | -39.688 | -8.988 |
| (8.92) | (6.28) | (20.11) | (20.30) | (19.28) | (18.49) | |
| Past expected inheritance receipt | 3.912 | -5.432 | -10.072 | -25.168 | 10.196 | 7.121 |
| (6.02) | (6.32) | (8.58) | (8.93) | (9.15) | (8.36) | |
| Past unexpected inheritance receipt | 18.338 | 5.152 | -2.190 | -20.121 | -20.689 | -29.508 |
| (11.88) | (9.03) | (16.71) | (17.54) | (18.36) | (18.52) | |
| Observations | 8,319 | 8,319 | 8,319 | 8,319 | 8,319 | 8,319 |
| R-squared | 0.329 | 0.287 | 0.048 | 0.050 | 0.082 | 0.065 |
| Panel B: Ages 50-70 | ||||||
| Paid work | Unpaid work | Leisure | ||||
| Husbands | Wives | Husbands | Wives | Husbands | Wives | |
| Expected inheritance receipt | -0.197 | 18.000 | -15.223 | -5.245 | 14.433 | 0.482 |
| (10.80) | (14.43) | (12.19) | (14.68) | (13.75) | (12.62) | |
| Unexpected inheritance receipt | -20.771 | -28.381 | 15.340 | -40.171 | -38.536 | 10.800 |
| (25.55) | (16.11) | (33.35) | (25.21) | (36.23) | (35.85) | |
| Past expected inheritance receipt | 6.385 | -3.283 | -6.842 | -33.092 | 3.831 | 19.551 |
| (9.87) | (10.40) | (12.13) | (11.46) | (12.27) | (10.77) | |
| Past unexpected inheritance receipt | 30.644 | 9.137 | -3.523 | -18.558 | -3.207 | -57.081 |
| (23.35) | (18.98) | (26.39) | (26.53) | (26.62) | (29.93) | |
| Observations | 3,044 | 3,044 | 3,044 | 3,044 | 3,044 | 3,044 |
| R-squared | 0.324 | 0.245 | 0.053 | 0.067 | 0.096 | 0.085 |
Source: SHARE and own calculations.
Table 8.
Impact of inheritances on time use: Other activities.
| Panel A: Full sample | ||||||||
|---|---|---|---|---|---|---|---|---|
| Chores | Chores (+ admin. chores) | Help | Personal care | |||||
| Husbands | Wives | Husbands | Wives | Husbands | Wives | Husbands | Wives | |
| Inheritance recipient | ||||||||
| Self | 6.954 | -19.930 | 10.648 | -17.886 | -8.811 | 1.610 | -2.078 | 0.124 |
| (7.23) | (7.07) | (7.60) | (7.34) | (9.76) | (16.32) | (2.68) | (4.68) | |
| Spouse | -4.222 | 4.479 | -1.272 | 4.383 | -17.691 | 8.511 | 1.927 | -0.703 |
| (7.40) | (8.07) | (7.96) | (8.38) | (11.96) | (11.67) | (4.79) | (3.16) | |
| Unknown | 9.736 | 23.591 | 9.311 | 26.214 | 6.843 | -0.599 | -3.426 | 8.830 |
| (10.15) | (12.28) | (10.39) | (12.66) | (17.24) | (14.55) | (3.74) | (7.30) | |
| Lagged inheritance recipient | ||||||||
| Self | -4.328 | -2.710 | -0.991 | 2.760 | -5.481 | -26.686 | 2.373 | -0.864 |
| (4.80) | (7.26) | (6.28) | (7.50) | (8.52) | (8.90) | (4.59) | (2.40) | |
| Spouse | -4.010 | 4.355 | -7.845 | 2.894 | -8.910 | -21.558 | 6.001 | -1.284 |
| (4.65) | (6.76) | (5.23) | (6.94) | (9.64) | (8.67) | (5.55) | (2.25) | |
| Unknown | -2.631 | -14.447 | -0.795 | -18.979 | 0.423 | 1.420 | 1.450 | 0.917 |
| (8.85) | (9.12) | (9.71) | (9.32) | (13.54) | (15.56) | (5.00) | (4.22) | |
| Observations | 8,319 | 8,319 | 8,319 | 8,319 | 8,319 | 8,319 | 8,319 | 8,319 |
| R-squared | 0.078 | 0.097 | 0.064 | 0.081 | 0.036 | 0.042 | 0.051 | 0.036 |
| Panel B: Ages 50-70 | ||||||||
| Chores | Chores (+ admin. chores) | Help | Personal care | |||||
| Husbands | Wives | Husbands | Wives | Husbands | Wives | Husbands | Wives | |
| Inheritance recipient | ||||||||
| Self | 2.373 | -14.391 | 3.075 | -10.091 | -4.923 | -29.712 | -2.762 | 0.485 |
| (8.69) | (9.79) | (9.39) | (10.04) | (13.77) | (13.62) | (3.07) | (5.49) | |
| Spouse | -4.839 | 7.404 | -1.149 | 5.859 | -28.485 | 15.281 | -1.859 | 1.549 |
| (9.40) | (9.82) | (10.33) | (9.91) | (12.14) | (15.52) | (2.78) | (3.73) | |
| Unknown | 7.644 | -4.681 | 15.427 | 3.064 | -7.780 | -50.498 | 0.614 | 8.675 |
| (14.48) | (15.76) | (14.70) | (17.08) | (29.09) | (19.31) | (8.14) | (17.03) | |
| Lagged inheritance recipient | ||||||||
| Self | -1.666 | -7.422 | 4.830 | -1.758 | -12.658 | -15.437 | -1.326 | -0.495 |
| (6.00) | (8.61) | (9.02) | (9.05) | (11.34) | (12.83) | (2.47) | (3.02) | |
| Spouse | -0.880 | -2.745 | -4.550 | -4.622 | -10.132 | -29.167 | 5.524 | -2.057 |
| (6.26) | (8.06) | (6.84) | (8.16) | (13.45) | (11.23) | (5.70) | (2.41) | |
| Unknown | -6.304 | -9.244 | -13.536 | -12.135 | 12.634 | -0.013 | -4.891 | 2.417 |
| (10.76) | (15.42) | (10.78) | (15.65) | (23.18) | (23.85) | (3.40) | (6.54) | |
| Observations | 3,044 | 3,044 | 3,044 | 3,044 | 3,044 | 3,044 | 3,044 | 3,044 |
| R-squared | 0.102 | 0.137 | 0.079 | 0.121 | 0.045 | 0.058 | 0.079 | 0.065 |
Source: SHARE and own calculations.
Table 9.
Impact of inheritances on outsourcing: Spending eating out.
| Panel A: Full sample | ||
|---|---|---|
| Spend Eat Out (€) | Food at home (€) | |
| Inheritance recipient | ||
| Husband | 19.476 | -4.502 |
| (9.87) | (15.96) | |
| Wife | 15.898 | -3.110 |
| (7.00) | (16.52) | |
| Unknown | -1.631 | 15.636 |
| (9.99) | (18.62) | |
| Lagged inheritance recipient | ||
| Husband | 15.198 | 6.548 |
| (7.48) | (13.05) | |
| Wife | 15.678 | -9.755 |
| (6.36) | (11.92) | |
| Unknown | 7.281 | -18.057 |
| (9.99) | (15.24) | |
| Observations | 7,953 | 7,513 |
| R-squared | 0.201 | 0.356 |
| Panel B: Ages 50-70 | ||
| Spend Eat Out (€) | Food at home (€) | |
| Inheritance recipient | ||
| Husband | 19.310 | 0.945 |
| (12.42) | (20.26) | |
| Wife | 25.192 | -33.520 |
| (9.25) | (19.04) | |
| Unknown | 3.837 | -9.844 |
| (14.84) | (29.13) | |
| Lagged inheritance recipient | ||
| Husband | 11.517 | 16.073 |
| (10.43) | (16.26) | |
| Wife | 12.808 | -3.683 |
| (8.92) | (16.68) | |
| Unknown | 4.515 | -23.141 |
| (18.07) | (23.63) | |
| Observations | 2,914 | 2,771 |
| R-squared | 0.193 | 0.365 |
Source: SHARE and own calculations.
Table 10.
Impact of inheritances on time use by household financial constraints: Ages 50-70.
| Panel A: Financially constrained | ||||||
|---|---|---|---|---|---|---|
| Paid work | Unpaid work | Leisure | ||||
| Husbands | Wives | Husbands | Wives | Husbands | Wives | |
| Inheritance recipient | ||||||
| Self | 1.643 | 126.412 | -8.928 | -141.665 | 23.260 | 66.791 |
| (41.39) | (96.85) | (31.95) | (34.90) | (58.88) | (97.99) | |
| Spouse | -27.314 | 8.643 | -26.606 | -5.975 | 122.097 | 32.006 |
| (25.82) | (36.43) | (54.09) | (45.76) | (81.88) | (41.84) | |
| Unknown | -49.271 | -42.971 | 19.521 | 37.452 | 35.064 | 155.966 |
| (30.11) | (33.83) | (61.85) | (67.05) | (64.55) | (83.59) | |
| Lagged inheritance recipient | ||||||
| Self | -36.787 | 22.687 | 11.611 | 1.440 | 47.104 | 6.701 |
| (27.29) | (44.78) | (39.20) | (35.81) | (39.54) | (41.89) | |
| Spouse | 30.046 | -0.611 | -20.661 | -87.073 | 49.134 | 41.490 |
| (33.04) | (30.63) | (25.25) | (46.07) | (44.14) | (42.92) | |
| Unknown | -2.508 | 7.642 | -112.985 | 54.821 | 58.029 | -78.017 |
| (23.46) | (34.23) | (49.75) | (85.16) | (107.75) | (63.66) | |
| Observations | 892 | 892 | 892 | 892 | 892 | 892 |
| R-squared | 0.348 | 0.242 | 0.087 | 0.087 | 0.175 | 0.147 |
| Panel B: Financially unconstrained | ||||||
| Paid work | Unpaid work | Leisure | ||||
| Husbands | Wives | Husbands | Wives | Husbands | Wives | |
| Inheritance recipient | ||||||
| Self | 4.544 | 18.643 | 2.771 | -29.757 | -0.855 | -11.117 |
| (17.44) | (20.22) | (17.69) | (18.95) | (17.32) | (18.32) | |
| Spouse | 0.121 | -3.573 | -31.856 | 38.457 | 20.687 | 22.301 |
| (14.31) | (20.39) | (17.08) | (23.40) | (19.24) | (17.46) | |
| Unknown | -11.722 | -24.248 | 16.076 | -43.990 | -47.484 | -18.286 |
| (28.95) | (18.42) | (36.62) | (25.81) | (42.28) | (36.20) | |
| Lagged inheritance recipient | ||||||
| Self | 32.880 | 1.113 | 0.186 | -17.306 | 4.216 | -6.829 |
| (14.21) | (15.67) | (17.73) | (17.94) | (15.95) | (14.12) | |
| Spouse | -13.121 | -2.292 | -12.408 | -22.703 | -6.500 | 9.540 |
| (14.95) | (14.34) | (17.95) | (14.72) | (19.35) | (16.41) | |
| Unknown | 33.573 | 7.245 | 11.890 | -14.910 | -9.043 | -54.825 |
| (26.14) | (21.24) | (28.81) | (28.27) | (27.84) | (32.66) | |
| Observations | 2,144 | 2,144 | 2,144 | 2,144 | 2,144 | 2,144 |
| R-squared | 0.328 | 0.257 | 0.060 | 0.073 | 0.083 | 0.076 |
Source: SHARE and own calculations.
Disclaimer/Publisher’s Note: The statements, opinions and data contained in all publications are solely those of the individual author(s) and contributor(s) and not of MDPI and/or the editor(s). MDPI and/or the editor(s) disclaim responsibility for any injury to people or property resulting from any ideas, methods, instructions or products referred to in the content. |
© 2026 by the authors. Licensee MDPI, Basel, Switzerland. This article is an open access article distributed under the terms and conditions of the Creative Commons Attribution (CC BY) license.
Copyright: This open access article is published under a Creative Commons CC BY 4.0 license, which permit the free download, distribution, and reuse, provided that the author and preprint are cited in any reuse.