
Submitted:
01 October 2026
Posted:
05 October 2026
You are already at the latest version
Abstract
Resistance training produces hypertrophy that decelerates as muscle mass increases. Disuse produces atrophy that decelerates as muscle mass decreases. These two trajectories are routinely attributed to separate biological mechanisms – anabolic resistance, sarcopenia, saturation of signaling, adaptive downregulation of proteolysis. The present commentary argues that neither requires a direction-specific explanation for its baseline trajectory. Both follow from a single geometric constraint: protein synthesis capacity scales with the surface area available for the synthetic machinery, while protein maintenance scales with volume. As a myofiber grows, its surface-to-volume ratio falls, and synthesis capacity per unit mass declines. As it shrinks, the ratio rises, and degradation capacity per unit mass falls. The two trajectories are mirror images of the same relation. Muscle memory is presented as the natural empirical test of the framework: myonuclei retained after atrophy constitute a residual that accelerates regrowth beyond the geometric baseline. Geometry sets the baseline; adaptive physiology explains the residual. The argument extends the mass-balance framework previously developed for whole-body mass change to the cellular level, and generates quantitative predictions that distinguish geometric necessity from biological regulation.
Keywords:
skeletal muscle
; hypertrophy
; atrophy
; surface-to-volume ratio
; myonuclear domain
; muscle memory
; mass balance
1. The Two Curves
Two empirical curves have shaped muscle physiology for decades. They are usually treated as separate phenomena, with separate literatures and separate explanatory vocabularies.
The hypertrophy curve. Resistance training produces rapid growth in the first months, followed by a progressive slowing. The majority of the increase in muscle size occurs within three to six months, with substantially less thereafter [1]. The curve bends toward a plateau. The standard explanation is direction-specific: anabolic resistance, saturation of mTOR signaling, or a maximal hypertrophic capacity that varies between individuals [2].
The atrophy curve. Disuse—immobilization, bed rest, spaceflight—produces rapid loss in the first days and weeks, followed by a progressive slowing. The half-life of fiber size during disuse is approximately ten days, with most of the loss concentrated in the early phase [3]. This curve also bends. The standard explanation is also direction-specific: adaptive downregulation of proteolysis, or an equilibrium being reached between synthesis and degradation [4].
Two curves. Two mechanisms. Two explanatory vocabularies. And yet the two curves have the same shape.
This is not a coincidence. It is a consequence of the fact that both are trajectories of the same kind of object: a mass reservoir whose inflow and outflow are not symmetric in how they scale.
2. Why Surface and Volume Cannot Scale Together
The geometric constraint on a muscle fiber can be stated in three premises, each grounded in established muscle physiology.
Surface supports synthesis. The machinery of protein synthesis—nuclei, ribosomes, and the signaling apparatus that initiates translation—is concentrated near the sarcolemma. Muscle DNA scales with the surface area of the fiber, not with its volume. Nuclear number N adheres to the relationship N = aVb), where V is cytoplasmic volume and b < 1, meaning that larger fibers are progressively more DNA-scarce [5]. In adult humans, N scales linearly to cell surface [5]. The transcriptional capacity available per unit of cytoplasm therefore declines as the fiber grows.
Volume demands maintenance. Every sarcomere in the myofibril is subject to turnover. The total rate of protein degradation is proportional to the mass of protein present, not to the surface area enclosing it. When the fiber is large, there is more protein to maintain and more substrate for degradation. When the fiber is small, there is less.
The ratio changes with size. For a cylindrical myofiber of radius r, surface area scales as r and volume as r2. The ratio A/V scales as 1/r. As the fiber hypertrophies, the ratio falls. As it atrophies, the ratio rises.
These three premises are sufficient. No additional biological postulate is required for the baseline result.
A necessary clarification: chronic, not acute. The constraint is on chronic transcriptional capacity, not on acute synthesis rate. Acutely, existing myonuclei can upregulate transcription to meet increased demand. But over longer periods, the total capacity for protein synthesis is limited by the number of available nuclei, and the number of nuclei scales with surface area, not with volume. It is this chronic limitation, not an acute one, that shapes the trajectory.
3. Mass Balance in the Myofiber
Let M denote the mass of a muscle fiber or muscle group. Let MPS(M) be the rate of myofibrillar protein synthesis and MPB(M) the rate of myofibrillar protein breakdown. Net mass balance is
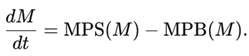
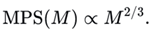
The geometric argument specifies the scaling of these terms. Protein synthesis capacity scales with the surface available for the synthetic machinery:
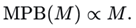
Protein breakdown scales with the volume of protein present:
The equilibrium mass M* satisfies MPS(M*) = MPB(M*). Rewriting:

Two consequences follow immediately.
- -
- If M < M*, then MPS(M) exceeds MPB(M), and mass increases. Because MPS grows more slowly than MPB as M rises, the net gain shrinks. The trajectory decelerates.
- -
- If M > M*, then MPB(M) exceeds MPS(M), and mass decreases. Because MPB falls more slowly than MPS as M falls, the net loss shrinks. The trajectory decelerates.
Under sustained anabolic stimulus the solution is decelerating hypertrophy. Under sustained disuse the solution is decelerating atrophy. The two are the same solution viewed from opposite sides of M*.
Illustrative case. For the simplest choice MPS(M) = k1M2/3 and MPB(M) = k2M, the equilibrium mass is M* = (k1/k2). The dynamics near equilibrium are exponential with time constant 1/(k2 + frac{1}{3}k1 M-1/3, but the qualitative deceleration in both directions follows from the scaling alone, without solving the equation.
4. Muscle Memory Is the Residual
The geometric model does not exclude biological regulation. It specifies the baseline trajectory against which any adaptive component must be detected as a residual. And muscle physiology has, in muscle memory, a natural experiment that tests the framework directly.
The phenomenon. When a muscle atrophies and is then retrained, regrowth is faster than initial growth from the same starting mass [6]. This is now well established in both rodent and human studies [6,7].
Why it matters for the framework. If the geometric baseline alone determined the rate of mass change, regrowth after atrophy should follow the same trajectory as initial growth from the same starting mass. It does not. Regrowth is faster. Something has changed that geometry cannot account for.
What has changed. Myonuclei are retained during atrophy [8]. Bruusgaard and colleagues demonstrated that new myonuclei are added before any major increase in fiber size during overload, and that these nuclei survive subsequent severe atrophy [8]. The myonuclei appear to be protected from the elevated apoptotic activity observed in atrophying muscle tissue [9]. Gundersen proposed that this lasting elevation in myonuclear number constitutes a cellular memory of previous hypertrophy, enabling faster regrowth when the muscle is subjected to overload again [9].
Why this is the residual. The retained myonuclei provide transcriptional capacity beyond what the shrunken fiber’s surface area would predict. When retraining begins, synthesis can proceed at a rate higher than the geometric baseline for that mass. The fiber grows faster. The residual is positive and measurable.
The framework predicts it. The muscle memory phenomenon is not a puzzle for the geometric account. It is the expected signature of a biological adaptation layered on a geometric constraint. Geometry sets the baseline; retained nuclei are the residual. The two are separable, and muscle memory is where they separate most cleanly.
5. What This Changes
The geometric account is not a rejection of molecular muscle biology. It is a reframing of what molecular muscle biology is for.
It changes what counts as a surprise. A model that omits surface-to-volume scaling will attribute the full deceleration to biology, because it has no geometric term with which to absorb any of it. Once the geometric term is included, the residual available for genuine adaptation is smaller, and its estimation becomes better posed. The same logic was applied to whole-body mass change in the companion framework [10]; the present commentary applies it to muscle.
It changes the interpretation of anabolic resistance. Age-related anabolic resistance is real [11], but its magnitude has been estimated against a baseline that does not include the geometric constraint. Once the constraint is included, the residual attributed to anabolic resistance shrinks—not to zero, but to a smaller and more precisely located quantity.
It changes the research question. The productive question is no longer “what limits hypertrophy?” as if a single brake needed to be found. It is: “what is the geometric baseline, and what remains after it is subtracted?” The first question has generated decades of candidate mechanisms. The second has a defined answer for the baseline and a defined target for the residual.
6. Predictions
If the geometric baseline dominates, five predictions follow.
Prediction 1: Relative growth rate scales as M-1/3. If two muscles of different initial mass receive the same anabolic stimulus, the ratio of their relative growth rates should be approximately (M2/M1)-1/3, because the surface-to-volume ratio scales as M-1/3. This is testable with unilateral training designs, where the same individual serves as their own control.
Prediction 2: Mirror-image time constants near equilibrium. In the linearized regime around M*, the hypertrophy trajectory from M*—∆ and the atrophy trajectory from M* + ∆ should decay with the same characteristic time, because the geometry is the same in both directions.
Prediction 3: Pennation effects are parametric, not qualitative. Differences in muscle architecture (pennate vs. fusiform) alter the relationship between fiber length, cross-sectional area, and whole-muscle geometry. They should reshape the quantitative trajectory without eliminating the geometric deceleration.
Prediction 4: Residual reduction after geometric subtraction. Models that include surface-to-volume scaling should leave a smaller residual for adaptive physiology than models that omit it. The residual—muscle memory, satellite cell dynamics, hormonal changes—remains real, but its estimated magnitude should shrink.
Prediction 5: Muscle memory scales with retained myonuclear number. The magnitude of the regrowth acceleration should correlate with the number of myonuclei retained after atrophy, not with the duration of the original hypertrophy. This directly tests the residual interpretation.
7. Conclusions
Muscle hypertrophy decelerates. Muscle atrophy decelerates. Neither requires a direction-specific biological explanation for its baseline trajectory. Both follow from the same surface-to-volume constraint: protein synthesis capacity scales with surface area, protein maintenance scales with volume, and the surface-to-volume ratio falls as mass rises and rises as mass falls. The reservoir empties more slowly as it empties; it also fills more slowly as it fills.
Muscle memory is not a counterexample to this account. It is the residual the account predicts. Retained myonuclei provide transcriptional capacity beyond what the shrunken fiber’s surface area would suggest, accelerating regrowth above the geometric baseline. The phenomenon is exactly what a mass-balance framework expects: a geometric baseline, with a biological residual layered on top.
Geometry sets the baseline; biology may explain the residual. The task ahead is not to defend the old, direction-specific attributions—“anabolic resistance,” “sarcopenia,” “plateau”—but to measure, with new accuracy, what biology actually contributes once geometry has been given its due.
Funding
This research did not receive any specific grant from funding agencies in the public, commercial, or not-for-profit sectors.
Ethics Approval and Consent to Participate
Not applicable.
Consent for Publication
Not applicable.
Availability of Data
data generated or analyzed during this study can be found in the sources cited in this article.
Acknowledgments
I thank colleagues for discussions on the geometric constraints on cell size, the muscle memory literature, and the separation of geometric and physiological contributions to tissue mass change.
Conflicts of Interest
The author declares no conflict of interest.
References
- Damas, F.; Phillips, S.M.; Libardi, C.A.; et al. Resistance training-induced changes in integrated myofibrillar protein synthesis are related to hypertrophy only after attenuation of muscle damage. J. Physiol. 2016, 594(18), 5209–22. [Google Scholar] [CrossRef] [PubMed] [PubMed Central]
- Roberts, M.D.; Haun, C.T.; Mobley, C.B.; et al. Physiological Differences Between Low Versus High Skeletal Muscle Hypertrophic Responders to Resistance Exercise Training: Current Perspectives and Future Research Directions. Front Physiol. 2018, 9, 834. [Google Scholar] [CrossRef] [PubMed] [PubMed Central]
- Wall, B.T.; Dirks, M.L.; Snijders, T.; et al. Substantial skeletal muscle loss occurs during only 5 days of disuse. Acta Physiol. (Oxf) 2014, 210(3), 600–11. [Google Scholar] [CrossRef] [PubMed]
- Phillips, S.M.; Glover, E.I.; Rennie, M.J. Alterations of protein turnover underlying disuse atrophy in human skeletal muscle. J. Appl. Physiol. (1985) 2009, 107(3), 645–54. [Google Scholar] [CrossRef] [PubMed]
- Hansson, K.A.; Eftestøl, E.; Bruusgaard, J.C.; et al. Myonuclear content regulates cell size with similar scaling properties in mice and humans. Nat. Commun. 2020, 11(1), 6288. [Google Scholar] [CrossRef] [PubMed] [PubMed Central]
- Pérez-Castillo, Í.M.; Ruiz-Caride, S.R.; Rueda, R.; et al. Skeletal muscle memory: implications for sports, aging and nutrition. Front Nutr. 2025, 12, 1701520. [Google Scholar] [CrossRef] [PubMed] [PubMed Central]
- Bagley, J.R.; Denes, L.T.; McCarthy, J.J.; et al. The myonuclear domain in adult skeletal muscle fibres: past, present and future. J. Physiol. 2023, 601(4), 723–741. [Google Scholar] [CrossRef] [PubMed] [PubMed Central]
- Bruusgaard, J.C.; Johansen, I.B.; Egner, I.M.; et al. Myonuclei acquired by overload exercise precede hypertrophy and are not lost on detraining. Proc. Natl. Acad. Sci. U S A 2010, 107(34), 15111–6. [Google Scholar] [CrossRef] [PubMed] [PubMed Central]
- Gundersen, K. Muscle memory and a new cellular model for muscle atrophy and hypertrophy. J. Exp. Biol. 2016, 219 Pt 2, 235–42. [Google Scholar] [CrossRef] [PubMed]
- Manninen, A.H. After Geometry: Isolating the Residual Physiological Component of Metabolic Adaptation. Preprints 2026, 2026100043. [Google Scholar] [CrossRef]
- Brook, M.S.; Wilkinson, D.J.; Mitchell, W.K.; et al. Synchronous deficits in cumulative muscle protein synthesis and ribosomal biogenesis underlie age-related anabolic resistance to exercise in humans. J. Physiol. 2016, 594(24), 7399–7417. [Google Scholar] [CrossRef] [PubMed] [PubMed Central]
Disclaimer/Publisher’s Note: The statements, opinions and data contained in all publications are solely those of the individual author(s) and contributor(s) and not of MDPI and/or the editor(s). MDPI and/or the editor(s) disclaim responsibility for any injury to people or property resulting from any ideas, methods, instructions or products referred to in the content. |
© 2026 by the authors. Licensee MDPI, Basel, Switzerland. This article is an open access article distributed under the terms and conditions of the Creative Commons Attribution (CC BY) license (http://creativecommons.org/licenses/by/4.0/).
Copyright: This open access article is published under a Creative Commons CC BY 4.0 license, which permit the free download, distribution, and reuse, provided that the author and preprint are cited in any reuse.