

Submitted:
27 September 2026
Posted:
01 October 2026
You are already at the latest version
Abstract
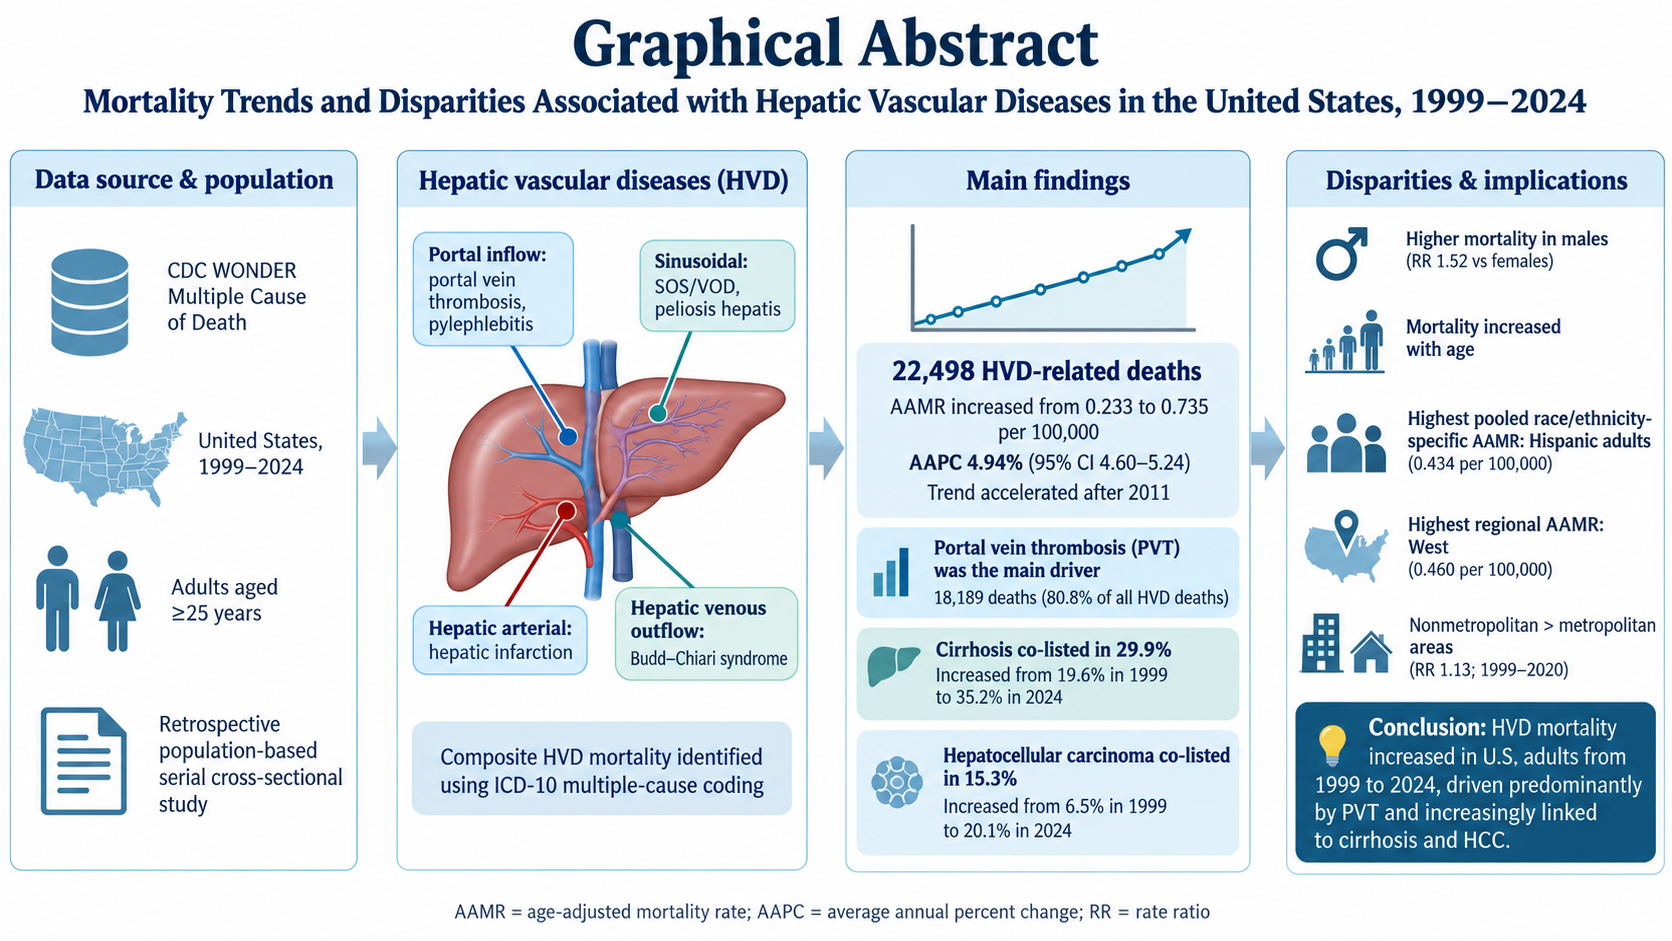
Background: Hepatic vascular diseases (HVDs)—encompassing portal inflow, sinusoidal microcirculatory, hepatic venous outflow, and hepatic arterial disorders—cause severe portal hypertension, liver failure, and death. Despite major therapeutic advances, national long-term mortality trends and demographic disparities across this spectrum of diseases remain undefined. Methods: In this nationwide, population-based serial cross-sectional study, we analyzed CDC WONDER Multiple Cause of Death records for U.S. decedents aged ≥25 years from 1999 through 2024. HVD-related deaths were identified by any mention of primary vascular lesions across the four vascular compartments (ICD-10 codes: I81, K75.1, I82.0, K76.5, K76.4, and K76.3). Age-adjusted mortality rates (AAMRs), standardized to the 2000 U.S. population, and Joinpoint regression models were used to estimate annual percent change (APC) and average annual percent change (AAPC). Results: Among 22,498 HVD-related deaths, annual fatalities increased 4.7-fold, from 433 in 1999 to 2,025 in 2024, while the AAMR rose from 0.233 to 0.735 per 100,000 (overall AAPC, 4.94% [95% CI, 4.60%–5.24%]). Following a decade of relative stability from 1999 to 2011 (APC, 0.85%), mortality underwent a steep upward inflection during 2011–2024 (APC, 8.87% [95% CI, 8.31%–9.52%]). Portal vein thrombosis (PVT) accounted for 80.8% of all deaths (n = 18,189) and increased rapidly (AAPC, 7.48%); notably, excluding PVT abolished the secular upward trend across the remaining HVDs (AAPC, −0.55% [95% CI, −1.62% to 0.60%]). Concurrent mentions of cirrhosis nearly doubled (19.6% to 35.2%), and co-listing of hepatocellular carcinoma more than tripled (6.5% to 20.1%). Persistent disparities were observed: males had higher mortality than females (rate ratio [RR], 1.52; 95% CI, 1.48–1.56), Hispanic individuals bore the highest racial and ethnic burden (AAMR, 0.434), the West had the highest regional mortality rate (AAMR, 0.460), and nonmetropolitan residents experienced excess mortality compared with metropolitan residents (RR, 1.13; 95% CI, 1.08–1.18). Mortality briefly exceeded pre-pandemic projections only in 2021. Conclusions: Mortality from hepatic vascular diseases in the United States has escalated rapidly since 2011, driven primarily by portal vein thrombosis amid increasing national burdens of cirrhosis and liver cancer. Marked sex, racial and ethnic, and rural–urban disparities highlight the urgent need for targeted vascular surveillance and equitable access to specialized multidisciplinary hepatology and endovascular care.
Keywords:
hepatic vascular disease
; portal vein thrombosis
; Budd-Chiari syndrome
; CDC WONDER
; mortality
; Joinpoint regression
; health disparities
Introduction
Hepatic vascular diseases (HVDs) comprise a heterogeneous spectrum of disorders affecting the liver’s portal inflow, sinusoidal microcirculation, hepatic venous outflow, and arterial supply. Major hepatology guidance classifies these conditions anatomically and clinically, including portal vein thrombosis (PVT) and pylephlebitis, sinusoidal obstruction syndrome/hepatic veno-occlusive disease (SOS/VOD) and peliosis hepatis, Budd-Chiari syndrome (BCS), and hepatic infarction [1,2,3,4]. Although their initiating mechanisms differ, these disorders may converge on portal hypertension, ischemic or congestive parenchymal injury, hepatic decompensation, and death.
PVT is the most common disorder within this family and has different epidemiology in cirrhotic and noncirrhotic populations. In a large population-based study, PVT occurred far more frequently than BCS [5], and meta-analytic evidence indicates that PVT is common in advanced cirrhosis, where reduced portal flow and a rebalanced hemostatic state create conditions favorable to thrombosis [12,13]. Management has also evolved. Contemporary guidance supports individualized anticoagulation according to thrombus chronicity, extent, bleeding risk, transplant candidacy, and clinical context [3,9], while meta-analytic evidence suggests anticoagulation can improve recanalization and survival in selected patients with cirrhosis and PVT [8]. Interventional approaches, including TIPS, are increasingly used in appropriate patients [10].
Other HVD components are substantially rarer. BCS has an estimated pooled incidence of approximately 1 per million population annually [11] and is strongly associated with systemic prothrombotic disorders, particularly myeloproliferative neoplasms [6]. SOS/VOD is a distinct toxic endothelial injury occurring predominantly after hematopoietic stem-cell transplantation or selected cytotoxic exposures and can carry high mortality when accompanied by multiorgan dysfunction [7]. The large etiologic differences across these disorders make it uncertain whether they share similar population-level mortality trajectories.
Recent CDC WONDER studies have examined individual fragments of this disease spectrum. Portal hypertension mortality has shown a recent acceleration with demographic and geographic heterogeneity [14]; splanchnic thrombosis mortality increased during the COVID-19 era [15]; and short-interval national analyses have described rising PVT mortality [16,17]. However, no national study has evaluated a prespecified composite of primary hepatic vascular lesions across a 26-year period while simultaneously comparing component-specific trends, deaths with and without recorded cirrhosis, co-listed HCC and myeloproliferative neoplasms, demographic and geographic disparities, database-splice robustness, and pandemic-era deviation from the pre-pandemic trajectory.
We therefore analyzed final CDC WONDER Multiple Cause of Death data from 1999 through 2024 among US adults aged ≥25 years. The primary objective was to quantify national HVD-related mortality and temporal trends. Secondary objectives were to characterize disparities by sex, age, race/ethnicity, region, urbanization, and state; compare HVD components; quantify co-listing of cirrhosis, HCC, and myeloproliferative neoplasms; and examine place of death and the share of deaths in which HVD was the underlying cause. We hypothesized that HVD-related mortality increased over time, primarily because of PVT; that males had higher mortality than females; that mortality differed across demographic and geographic strata; and that 2020-2021 mortality departed upward from the pre-pandemic trajectory.
Methods
Study Design and Data Source
We conducted a retrospective, population-based, serial cross-sectional analysis of national death-certificate data from 1999 through 2024. Data were obtained from CDC WONDER Multiple Cause of Death files maintained by the National Center for Health Statistics (NCHS) [18,19]. These files are compiled from death certificates for US residents in the 50 states and District of Columbia and contain one underlying cause of death and multiple contributing conditions coded using ICD-10 [20].
Because no single final release spans the full study period, the final Multiple Cause of Death, 1999-2020 database supplied data for 1999-2020, and the final Multiple Cause of Death, 2018-2024, Single Race database supplied data for 2021-2024 [18,19]. The provisional mortality file was not used. The releases overlap during 2018-2020, national and stratified overlap estimates were compared before splicing the series at 2020/2021. Queries were run on September 26, 2026.
Study Population and Case Definition
The study population comprised US residents aged ≥25 years who died between January 1, 1999, and December 31, 2024 and whose death certificate listed an HVD code anywhere among the causes of death. A multiple-cause approach was used because vascular liver disorders often coexist with advanced liver disease, malignancy, or systemic prothrombotic states and may not be selected as the underlying cause [21,22].
The primary composite comprised six WHO ICD-10 codes: PVT (I81), phlebitis of portal vein/pylephlebitis (K75.1), BCS (I82.0), hepatic veno-occlusive disease/SOS (K76.5), peliosis hepatis (K76.4), and infarction of liver (K76.3), consistent with the prespecified protocol and vascular-liver-disease guidance [1,2,3,4]. All six codes were selected together so a certificate listing more than one component was counted once in the composite. Portal hypertension (K76.6), chronic passive congestion (K76.1), and central hemorrhagic necrosis/ischemic hepatitis (K76.2) were excluded from the primary definition and examined only in sensitivity analyses.
Deaths below age 25 years and deaths with age not stated were excluded from primary analyses. All-age component counts were extracted separately to quantify the proportion of rare components, particularly SOS/VOD, occurring below age 25 years.
Variables and Stratification
Data were stratified by calendar year, sex, 10-year age group (25-34, 35-44, 45-54, 55-64, 65-74, 75-84, and ≥85 years), race/ethnicity, US Census region, state, urbanization, and place of death. Bridged-race categories in the 1999-2020 database and single-race categories in the 2018-2024 database were harmonized to non-Hispanic (NH) White, NH Black, Hispanic of any race, and NH Other. The NH Other category included American Indian/Alaska Native and Asian/Pacific Islander categories in the bridged data and additionally Native Hawaiian/Other Pacific Islander and more-than-one-race categories in the single-race data [23]. Deaths with Hispanic origin not stated were excluded only from race/ethnicity-specific analyses.
Urbanization was classified using the 2013 NCHS Urban-Rural Classification Scheme [24]. Large central, large fringe, medium, and small metropolitan counties were grouped as metropolitan; micropolitan and noncore counties were grouped as nonmetropolitan. Rate-based urbanization analyses were restricted to 1999-2020 because comparable post-2020 population denominators were unavailable for the required stratification in the final single-race release.
Core co-listed conditions were cirrhosis (K70.3, K74.3-K74.6), HCC (C22.0), and myeloproliferative neoplasms (D45, D47.1, D47.3). COVID-19 (U07.1) was assessed during 2020-2024. HVD deaths without recorded cirrhosis were derived by subtracting cirrhosis co-listed deaths from composite HVD deaths within each year and stratum. This group was not labeled clinically noncirrhotic because cirrhosis may have been present but omitted from the death certificate.
Mortality Measures
Crude mortality rates (CMRs) and age-adjusted mortality rates (AAMRs) were expressed per 100,000 population. Age-specific analyses used CMRs. AAMRs were calculated by direct standardization to the 2000 US standard population [25,26]. Annual rate confidence intervals and standard errors were obtained from CDC WONDER; gamma-based intervals are used for directly standardized rates when appropriate [27]. Full-period pooled AAMRs were calculated from pooled age-specific deaths and person-years with the same standard weights; standard errors followed established methods [28].
Disparities were summarized as rate ratios (RRs) of pooled AAMRs: male versus female; each race/ethnicity group versus NH White; each census region versus Northeast; and nonmetropolitan versus metropolitan. CDC WONDER suppresses counts of 1-9 and flags rates based on fewer than 20 deaths as unreliable. Suppressed values were not imputed for trend modeling.
Joinpoint Regression
Temporal trends were evaluated with the National Cancer Institute Joinpoint Regression Program [29]. Log-linear models were fitted to annual AAMRs (or CMRs for age groups), using heteroscedastic errors and the standard errors exported from WONDER. With 26 annual observations, a maximum of three joinpoints was allowed. Model selection used 4,499 Monte Carlo permutation tests with an overall two-sided alpha of 0.05 [30]. Segment-specific annual percent change (APC) and average annual percent change (AAPC) were calculated using established Joinpoint methods [31,32,33]. AAPCs were estimated for 1999-2024, 1999-2019, and 2019-2024. Trends were described as increasing or decreasing only when the corresponding APC or AAPC differed significantly from zero.
Joinpoint models were fitted only when no annual cell was suppressed and no more than three annual rates were flagged as unreliable. Sparse series were reported descriptively. Comparability tests of segmented models across subgroups were prespecified [34] and evaluated descriptively across Joinpoint segments.
Pandemic and Sensitivity Analyses
For the exploratory pandemic analysis, a log-linear model was fitted to national AAMRs for 2010-2019 and projected through 2024 with 95% prediction intervals, following established excess-mortality approaches [35]. Annual excess AAMR, percent excess, and the number and percentage of HVD deaths with COVID-19 were reported [36].
Prespecified sensitivity analyses were: S1, broad clinical definition adding K76.6 and K76.1; S2, addition of K76.2; S3, underlying-cause-only HVD; S4, exclusion of PVT; S6, D157-only analysis for 2018-2024, and S7, pre-pandemic analysis ending in 2019. Protocol sensitivity S5 (ending in 2023) was conditional on 2024 being provisional and was not triggered because the 2024 Multiple Cause of Death data used here are final [19]. E1 repeated component extraction across all ages.
Quality Control, Ethics, and Reporting
Query settings were prespecified, exports retained their query-criteria footers, and internal checks compared annual totals across sex, age, and region, verified co-listed counts did not exceed composite counts, and assessed the 2018-2020 database overlap. Race-specific comparisons were interpreted cautiously because race/Hispanic-origin classification on death certificates is less accurate for some groups and because bridged-race and single-race systems are not identical [37]. Stratified analyses were exploratory; no formal multiplicity correction was applied [38].
Results
Annual Trends
Between 1999 and 2024, a total of 22,498 deaths among U.S. adults aged ≥25 years had a hepatic vascular disease (HVD) recorded anywhere on the death certificate. Annual HVD-related deaths increased from 433 in 1999 to 2,025 in 2024. Over the same period, the age-adjusted mortality rate (AAMR) increased from 0.233 per 100,000 population in 1999 to 0.735 per 100,000 in 2024, with an overall pooled AAMR of 0.378 per 100,000 (95% CI, 0.373–0.383). The full-period average annual percent change (AAPC) was 4.94% (95% CI, 4.60%–5.24%; p<0.001) (Figure 1; Table 1 and Table 2).
Joinpoint regression identified a significant change in trajectory in 2011. From 1999 to 2011, the AAMR was relatively stable [APC, 0.85% (95% CI, −0.37% to 1.78%); p=0.152]. Thereafter, mortality increased sharply from 2011 through 2024 [APC, 8.87% (95% CI, 8.31%–9.52%); p<0.001]. Consistent with this acceleration, the AAPC was 3.98% (95% CI, 3.58%–4.30%) during 1999–2019 compared with 8.87% (95% CI, 8.31%–9.52%) during 2019–2024.
Sex-Stratified HVD-Related Mortality
During the study period, 12,747 HVD-related deaths occurred among males and 9,751 among females, representing 56.7% and 43.3% of all deaths, respectively. Annual deaths among males increased from 222 in 1999 to 1,170 in 2024, whereas deaths among females increased from 211 to 855. The pooled AAMR was higher among males than females [0.464 (95% CI, 0.456–0.473) vs 0.305 (95% CI, 0.299–0.311) per 100,000], corresponding to a male-to-female rate ratio of 1.52 (95% CI, 1.48–1.56) (Table 1).
Among males, the AAMR increased from 0.291 per 100,000 in 1999 to 0.853 per 100,000 in 2024 [AAPC, 5.32% (95% CI, 4.72%–5.82%); p<0.001]. The rate changed little during 1999–2011 [APC, 1.90% (95% CI, −0.15% to 3.39%); p=0.062], followed by a pronounced increase during 2011–2024 [APC, 8.58% (95% CI, 7.77%–9.69%); p<0.001].
Among females, the AAMR increased overall from 0.232 per 100,000 in 1999 to 0.569 per 100,000 in 2024 [AAPC, 4.22% (95% CI, 3.80%–4.66%); p<0.001]. In contrast to males, female mortality initially declined during 1999–2010 [APC, −1.96% (95% CI, −3.52% to −0.49%); p=0.014], after which the trend reversed markedly, increasing during 2010–2024 [APC, 9.35% (95% CI, 8.57%–10.28%); p<0.001] (Figure 1; Table 2).
Age-Stratified HVD-Related Mortality
HVD-related mortality varied substantially by age. Across the entire study period, the greatest numbers of deaths occurred among adults aged 65–74 years (n=6,459; 28.7%), followed by those aged 55–64 years (n=5,986; 26.6%) and 75–84 years (n=4,312; 19.2%). The pooled crude mortality rate (CMR) rose from 0.037 per 100,000 among adults aged 25–34 years to a peak of 1.166 per 100,000 among those aged 75–84 years; the corresponding pooled CMR among adults aged ≥85 years was 1.107 per 100,000 (Table 1).
Among adults aged 35–44 years, the CMR increased from 0.078 per 100,000 in 1999 to 0.160 per 100,000 in 2024 [AAPC, 3.31% (95% CI, 2.14%–4.56%); p<0.001]. The trend was non-significantly downward during 1999–2011 [APC, −3.01% (95% CI, −7.56% to 0.09%); p=0.066], followed by a marked increase during 2011–2024 [APC, 9.50% (95% CI, 7.02%–13.60%); p<0.001].
Among adults aged 45–54 years, the CMR increased from 0.134 to 0.483 per 100,000 [AAPC, 4.50% (95% CI, 3.78%–5.19%); p<0.001]. Mortality initially increased during 1999–2016 [APC, 2.32% (95% CI, 0.71%–3.46%); p=0.020] and accelerated thereafter [2016–2024 APC, 9.27% (95% CI, 6.92%–14.56%); p<0.001].
Among adults aged 55–64 years, the CMR increased from 0.425 per 100,000 in 1999 to 1.066 per 100,000 in 2024 [AAPC, 4.36% (95% CI, 3.67%–5.07%); p<0.001]. Rates were initially stable during 1999–2007 [APC, −1.21% (95% CI, −5.17% to 1.71%); p=0.390], increased substantially during 2007–2022 [APC, 8.82% (95% CI, 8.08%–10.17%); p<0.001], and showed a nonsignificant decrease during 2022–2024 [APC, −5.01% (95% CI, −9.68% to 3.62%); p=0.294].
The steepest late-period increases were observed among older adults. Among those aged 65–74 years, the CMR was essentially stable during 1999–2011 [APC, −0.02% (95% CI, −2.13% to 1.66%); p=0.906], followed by an increase of 10.54% annually during 2011–2024 (95% CI, 9.59%–11.73%; p<0.001), reaching 1.924 per 100,000 in 2024. Among adults aged 75–84 years, mortality increased during both 1999–2014 [APC, 2.07% (95% CI, 1.06%–2.85%); p<0.001] and, more rapidly, during 2014–2024 [APC, 10.13% (95% CI, 8.97%–11.40%); p<0.001], reaching 2.420 per 100,000 in 2024. Among adults aged ≥85 years, the CMR increased from 0.674 to 2.144 per 100,000; the trend before 2015 was not statistically significant [APC, 2.34% (95% CI, −0.13% to 4.09%); p=0.064], whereas mortality increased sharply during 2015–2024 [APC, 10.25% (95% CI, 7.53%–15.76%); p<0.001].
The 25–34-year group accounted for 413 deaths across the study period. Annual rates in this age group were not subjected to Joinpoint modeling because 3 annual cells were suppressed and 16 years had rates considered unreliable under the prespecified protocol criteria. The observed CMR increased descriptively from 0.030 per 100,000 in 1999 to 0.052 per 100,000 in 2024 (Figure 2; Table 1 and Table 2).
Race- and Ethnicity-Stratified HVD-Related Mortality
Among deaths with classifiable race and ethnicity, 16,535 occurred among non-Hispanic (NH) White adults, 2,397 among NH Black adults, 2,394 among Hispanic adults, and 1,099 among NH Other adults. Hispanic adults had the highest pooled AAMR at 0.434 per 100,000 (95% CI, 0.416–0.452), followed by NH Black adults at 0.392 (95% CI, 0.376–0.409), NH White adults at 0.372 (95% CI, 0.366–0.378), and NH Other adults at 0.350 (95% CI, 0.329–0.372). Relative to NH White adults, the pooled rate ratio was 1.17 (95% CI, 1.12–1.22) for Hispanic adults, 1.05 (95% CI, 1.01–1.10) for NH Black adults, and 0.94 (95% CI, 0.88–1.00) for NH Other adults (Table 1).
Among NH White adults, the AAMR increased from 0.231 per 100,000 in 1999 to 0.742 per 100,000 in 2024 [AAPC, 4.99% (95% CI, 4.65%–5.30%); p<0.001]. Rates were stable during 1999–2011 [APC, 0.79% (95% CI, −0.36% to 1.73%); p=0.186] but increased markedly during 2011–2024 [APC, 9.03% (95% CI, 8.45%–9.74%); p<0.001].
Among NH Black adults, the AAMR increased from 0.215 to 0.734 per 100,000 [AAPC, 4.70% (95% CI, 3.86%–5.47%); p<0.001]. No meaningful change was detected during 1999–2010 [APC, 0.02% (95% CI, −3.35% to 2.31%); p=0.988], followed by a pronounced increase during 2010–2024 [APC, 8.53% (95% CI, 7.39%–10.05%); p<0.001].
Among Hispanic adults, the AAMR increased overall from 0.267 per 100,000 in 1999 to 0.744 per 100,000 in 2024 [AAPC, 4.38% (95% CI, 2.98%–5.79%); p<0.001]. An initial nonsignificant decline was observed during 1999–2004 [APC, −8.62% (95% CI, −23.86% to 1.24%); p=0.096], followed by a sustained increase during 2004–2024 [APC, 7.91% (95% CI, 7.03%–9.17%); p<0.001]. NH Other adults were not modeled because one annual estimate was suppressed and seven were unreliable.
Because race classification changed from bridged-race to single-race categories at the database transition, the prespecified 2018–2020 overlap analysis was examined separately. National, sex, region, and Hispanic estimates were concordant across the overlapping databases, whereas race-specific differences were greater for some groups, particularly NH Other. Consequently, D157-only analyses for 2018–2024 were also examined. These showed increasing mortality among NH White [AAPC, 7.71% (95% CI, 6.24%–9.14%)], NH Black [7.75% (95% CI, 4.60%–11.27%)], Hispanic [4.69% (95% CI, 3.87%–5.50%)], and NH Other adults [8.07% (95% CI, 3.70%–12.93%); all p<0.001], supporting an increasing recent trend despite the race-coding transition (Figure 3; Table 1 and Table 2; Supplementary Table S1).
Geographic Region-Stratified HVD-Related Mortality
Between 1999 and 2024, 7,963 HVD-related deaths occurred in the South, 6,021 in the West, 4,861 in the Midwest, and 3,653 in the Northeast. The West had the highest pooled AAMR at 0.460 per 100,000 (95% CI, 0.448–0.471), followed by the Midwest at 0.373 (95% CI, 0.362–0.383), South at 0.360 (95% CI, 0.352–0.368), and Northeast at 0.325 (95% CI, 0.314–0.336). Relative to the Northeast, pooled rate ratios were 1.41 (95% CI, 1.36–1.47) in the West, 1.15 (95% CI, 1.10–1.20) in the Midwest, and 1.11 (95% CI, 1.06–1.15) in the South (Table 1).
The Northeast AAMR increased from 0.226 per 100,000 in 1999 to 0.628 in 2024 [AAPC, 4.83% (95% CI, 4.25%–5.42%); p<0.001]. Rates were stable during 1999–2011 [APC, 1.10% (95% CI, −1.31% to 2.72%); p=0.336], followed by a marked increase during 2011–2024 [APC, 8.40% (95% CI, 7.35%–9.83%); p<0.001].
In the Midwest, the AAMR increased from 0.225 to 0.751 per 100,000 [AAPC, 4.84% (95% CI, 4.31%–5.37%); p<0.001]. No statistically significant change was identified during 1999–2012 [APC, 0.58% (95% CI, −1.23% to 2.01%); p=0.454], after which mortality increased by 9.66% annually during 2012–2024 (95% CI, 8.47%–11.06%; p<0.001).
In the South, the AAMR increased from 0.221 to 0.684 per 100,000 [AAPC, 5.22% (95% CI, 4.62%–5.75%); p<0.001]. The 1999–2012 trend was not statistically significant [APC, 0.96% (95% CI, −1.25% to 2.40%); p=0.326], followed by a pronounced increase during 2012–2024 [APC, 10.04% (95% CI, 8.85%–11.50%); p<0.001].
The West displayed a different temporal pattern. AAMR increased from 0.269 per 100,000 in 1999 to 0.802 per 100,000 in 2024 [AAPC, 4.85% (95% CI, 4.49%–5.19%); p<0.001]. Mortality increased during 1999–2013 [APC, 1.94% (95% CI, 1.01%–2.74%); p<0.001], accelerated sharply during 2013–2019 [APC, 12.41% (95% CI, 10.37%–17.21%); p<0.001], and continued to increase, although more slowly, during 2019–2024 [APC, 4.37% (95% CI, 1.99%–6.11%); p=0.006] (Figure 4; Table 1 and Table 2).
Urban–Rural HVD-Related Mortality
Urbanization analyses were restricted to 1999–2020 in accordance with the prespecified protocol. During this period, 12,328 deaths occurred among residents of metropolitan counties and 2,764 among residents of nonmetropolitan counties. Despite the smaller number of deaths, nonmetropolitan counties had a higher pooled AAMR than metropolitan counties [0.339 (95% CI, 0.326–0.352) vs 0.300 (95% CI, 0.295–0.305) per 100,000], corresponding to a nonmetropolitan-to-metropolitan rate ratio of 1.13 (95% CI, 1.08–1.18).
In metropolitan counties, AAMR increased from 0.231 per 100,000 in 1999 to 0.540 per 100,000 in 2020 [AAPC, 4.39% (95% CI, 4.02%–4.73%); p<0.001]. A slower increase occurred during 1999–2012 [APC, 1.27% (95% CI, 0.33%–2.09%); p=0.012], followed by a substantially steeper increase during 2012–2020 [APC, 9.67% (95% CI, 8.49%–11.22%); p<0.001].
In nonmetropolitan counties, AAMR increased from 0.225 per 100,000 in 1999 to 0.626 per 100,000 in 2020 [AAPC, 4.99% (95% CI, 4.12%–5.95%); p<0.001]. The initial 1999–2011 trend was not statistically significant [APC, 1.95% (95% CI, −1.29% to 3.68%); p=0.150], whereas mortality increased sharply during 2011–2020 [APC, 9.19% (95% CI, 7.07%–13.56%); p<0.001] (Figure 5; Table 1 and Table 2).
Mortality by Hepatic Vascular Disease Component
Portal vein thrombosis (PVT) accounted for the largest component-specific burden, being recorded on 18,189 deaths, equivalent to 80.8% of all composite HVD-related deaths. Annual PVT-related deaths increased from 222 in 1999 to 1,819 in 2024, while its AAMR increased from 0.116 to 0.621 per 100,000. PVT-related mortality increased throughout the study period [AAPC, 7.48% (95% CI, 7.08%–7.90%); p<0.001], with acceleration after 2010: APC was 3.90% (95% CI, 2.03%–5.23%; p<0.001) during 1999–2010 and 10.37% (95% CI, 9.79%–11.07%; p<0.001) during 2010–2024.
Budd–Chiari syndrome was recorded on 2,933 deaths. Its annual death count was similar at the beginning and end of the study period (137 in 1999 and 140 in 2024), while AAMR declined from 0.053 to 0.040 per 100,000. No significant joinpoint was identified, and the overall trend was not statistically significant [AAPC, −1.17% (95% CI, −2.54% to 0.22%); p=0.096].
Infarction of the liver was recorded on 1,321 deaths. Because age-adjusted estimates were invalid in several annual cells, trends were evaluated using CMR. The CMR decreased during 1999–2014 [APC, −5.96% (95% CI, −7.64% to −4.64%); p<0.001] and subsequently increased during 2014–2024 [APC, 6.87% (95% CI, 3.90%–11.04%); p<0.001]. Across the full period, however, the AAPC remained negative [−1.03% (95% CI, −1.81% to −0.31%); p=0.006].
Sinusoidal obstruction syndrome/veno-occlusive disease was uncommon among adults aged ≥25 years (n=170), and pylephlebitis and peliosis hepatis produced extensive annual suppression. These sparse components therefore were not subjected to Joinpoint modeling under the prespecified reliability criteria (Figure 6; Table 3).
Co-Listed Cirrhosis, Hepatocellular Carcinoma, and Myeloproliferative Neoplasms
Cirrhosis was co-listed on 6,719 HVD-related death certificates, representing 29.9% of all HVD deaths. The AAMR for HVD deaths with recorded cirrhosis increased from 0.033 per 100,000 in 1999 to 0.242 per 100,000 in 2024 [AAPC, 10.03% (95% CI, 9.16%–10.94%); p<0.001]. The proportion of HVD-related deaths with cirrhosis increased from 19.63% in 1999 to 35.21% in 2024 [AAPC, 2.88% (95% CI, 2.59%–3.24%); p<0.001]. This proportion increased significantly during 1999–2021 [APC, 3.43% (95% CI, 3.13%–3.89%); p<0.001] but showed no significant change during 2021–2024 [APC, −1.06% (95% CI, −4.51% to 1.64%); p=0.408].
Hepatocellular carcinoma (HCC) was co-listed on 3,441 deaths, representing 15.3% of all HVD-related deaths. Because valid AAMRs were not available for all annual HCC strata, mortality trends were evaluated using CMR. The CMR increased from 0.016 per 100,000 in 1999 to 0.173 per 100,000 in 2024 [AAPC, 10.76% (95% CI, 10.08%–11.37%); p<0.001]. The proportion of all HVD deaths with co-listed HCC increased from 6.47% in 1999 to 20.10% in 2024 [AAPC, 4.83% (95% CI, 4.35%–5.42%); p<0.001]. The proportional increase was most pronounced during 1999–2017 [APC, 6.24% (95% CI, 5.44%–7.46%); p<0.001], followed by no statistically significant change during 2017–2024 [APC, 1.29% (95% CI, −0.75% to 2.64%); p=0.160].
Myeloproliferative neoplasms were co-listed on 315 HVD deaths (1.4%). Because six annual cells were suppressed and 18 annual rates were unreliable, temporal modeling was not performed for this subgroup.
A total of 15,779 deaths occurred without recorded cirrhosis. The AAMR in this group increased from 0.200 per 100,000 in 1999 to 0.493 per 100,000 in 2024 [AAPC, 3.70% (95% CI, 3.36%–4.03%); p<0.001]. Rates were initially stable during 1999–2011 [APC, −0.72% (95% CI, −2.01% to 0.24%); p=0.168], followed by a marked increase during 2011–2024 [APC, 7.94% (95% CI, 7.22%–8.76%); p<0.001] (Figure 7; Table 3).
Underlying Cause and Place of Death
Of the 22,498 HVD-related deaths identified through the multiple-cause definition, 4,285 (19.0%) had an HVD code designated as the underlying cause of death. Under an underlying-cause-only definition, the AAMR increased from 0.062 per 100,000 in 1999 to 0.085 per 100,000 in 2024, with no Joinpoint detected and a modest but statistically significant overall increase [AAPC, 1.15% (95% CI, 0.26%–2.04%); p=0.014] (Supplementary Figure S3).
The location of death also changed over time. Hospital inpatient deaths accounted for 78.2% of HVD-related deaths during 1999–2003 but 53.0% during 2020–2024. In contrast, the proportion occurring at home increased from 14.2% to 28.2%, while hospice facilities accounted for 9.0% of deaths during 2020–2024. The proportion occurring in nursing homes or long-term care facilities was comparatively stable (5.6% vs 5.2%), while outpatient/emergency department deaths increased from 0.6% to 2.0% (Table 1; Supplementary Figure S3; Supplementary Table S10).
State-Level Geographic Variation
Substantial geographic variation was observed at the state level, with the two database periods analyzed separately as prespecified. During 1999–2020, the highest pooled state AAMRs were observed in Colorado (0.659 per 100,000), Alaska (0.628), Montana (0.513), Oregon (0.500), and Idaho (0.499). The lowest were observed in New York (0.195), Louisiana (0.197), Mississippi (0.197), Nevada (0.202), and Illinois (0.207).
During 2021–2024, the highest pooled AAMRs were observed in Colorado (1.562 per 100,000), Oregon (1.368), Minnesota (1.282), Washington (1.124), and North Dakota (1.098). The lowest were observed in Louisiana (0.335), Maine (0.364), Illinois (0.387), Mississippi (0.390), and Connecticut (0.430). Because the state estimates for 1999–2020 and 2021–2024 were derived from different WONDER mortality databases and population denominator systems, rates from the two periods were not pooled directly (Supplementary Table S9). State estimates based on fewer than 20 deaths were flagged as unreliable and were not emphasized in ranking interpretations (Supplementary Figure S4; Supplementary Table S9).
Pandemic-Era Mortality
Using the 2010–2019 trend to project expected mortality, observed HVD-related AAMR exceeded the upper bound of the 95% prediction interval in only one of the five pandemic-era years examined. In 2020, the observed AAMR was 0.548 per 100,000 compared with an expected value of 0.523, corresponding to 4.8% excess mortality but remaining within the 95% prediction interval. In 2021, the observed AAMR reached 0.649 compared with an expected 0.566, representing 14.7% excess mortality and exceeding the upper 95% prediction limit of 0.609. Thereafter, observed rates were close to projected values: excess mortality was −0.2% in 2022, 4.7% in 2023, and 2.6% in 2024, with none exceeding the corresponding prediction interval.
COVID-19 was co-listed on 223 HVD-related deaths during 2020–2024, representing 2.5% of HVD deaths during this period. The annual proportion was 2.5% in 2020, peaked at 4.4% in 2021, remained 4.2% in 2022, and subsequently declined to 1.0% in 2023 and 0.9% in 2024 (Supplementary Figure S5; Supplementary Table S12).
Sensitivity and Exploratory Analyses
The increasing overall HVD mortality trend was preserved under most prespecified sensitivity definitions. Under the broad clinical definition incorporating portal hypertension and chronic passive congestion (S1), 64,996 deaths were identified and the full-period AAPC was 2.28% (95% CI, 2.05%–2.50%; p<0.001). This broader phenotype declined during 1999–2009 [APC, −2.49% (95% CI, −3.39% to −1.77%); p<0.001], increased during 2009–2018 [APC, 5.04% (95% CI, 3.84%–5.77%); p<0.001], accelerated during 2018–2021 [APC, 12.50% (95% CI, 9.33%–14.40%); p<0.001], and was subsequently stable during 2021–2024 [APC, 0.70% (95% CI, −2.27% to 2.79%); p=0.486].
Adding ischemic hepatic injury (S2) produced results nearly identical to the primary definition [AAPC, 4.96% (95% CI, 4.61%–5.27%); p<0.001]. Restriction to deaths in which an HVD was the underlying cause (S3) attenuated but did not eliminate the increase [AAPC, 1.15% (95% CI, 0.26%–2.04%); p=0.014].
In contrast, exclusion of PVT (S4) substantially changed the long-term pattern. The full-period AAPC was −0.55% (95% CI, −1.62% to 0.60%; p=0.294). Mortality decreased during 1999–2015 [APC, −4.24% (95% CI, −6.84% to −2.67%); p<0.001] but subsequently increased during 2015–2024 [APC, 6.36% (95% CI, 2.40%–14.45%); p=0.002]. Thus, the sustained full-period increase observed for the composite HVD definition was largely attributable to the PVT component.
The single-race 2018–2024 database-only analysis (S6) also demonstrated increasing mortality [AAPC, 8.26% (95% CI, 6.46%–10.11%); p<0.001], arguing against the 2020/2021 database splice as the sole explanation for the recent increase. Similarly, restriction to the pre-pandemic period of 1999–2019 (S7) preserved the increasing trend [AAPC, 3.92% (95% CI, 3.59%–4.28%); p<0.001]. Five of the six applicable sensitivity analyses therefore retained a statistically significant positive full-period trend, with exclusion of PVT being the principal exception (Supplementary Figure S2; Supplementary Table S11).
In the all-ages exploratory analysis (E1), inclusion of persons aged <25 years had little effect on PVT, Budd–Chiari syndrome, or hepatic infarction counts: individuals aged <25 years accounted for 1.1% of all PVT deaths, 4.8% of Budd–Chiari deaths, and 3.6% of hepatic infarction deaths. In contrast, 157 of 327 all-age sinusoidal obstruction syndrome/veno-occlusive disease deaths (48.0%) occurred among individuals aged <25 years, confirming that the primary ≥25-year population excludes a substantial pediatric component of this condition (Supplementary Table S2).
Discussion
This nationwide analysis of multiple-cause mortality data from 1999 through 2024 provides a comprehensive assessment of hepatic vascular disease (HVD)-related mortality in U.S. adults. Several findings are noteworthy. First, HVD-related mortality increased substantially over the 26-year study period, with the AAMR rising from 0.233 per 100,000 population in 1999 to 0.735 per 100,000 in 2024 and a significant overall AAPC of 4.94%. The trajectory was not uniform: mortality was comparatively stable through approximately 2011 and then increased rapidly thereafter. Second, this increase was predominantly attributable to portal vein thrombosis (PVT), which accounted for approximately four-fifths of HVD-related deaths; critically, exclusion of PVT eliminated the statistically significant positive full-period trend. Third, the proportion of HVD-related deaths accompanied by recorded cirrhosis or hepatocellular carcinoma (HCC) increased markedly over time, supporting an increasing intersection between HVD and advanced chronic liver disease. Fourth, important demographic and geographic heterogeneity was observed. Males had substantially higher mortality than females, mortality generally increased with age, Hispanic adults had the highest pooled race/ethnicity-specific AAMR, the West had the highest regional AAMR, and nonmetropolitan areas had higher mortality than metropolitan areas. Fifth, although mortality increased during the COVID-19 period, only the 2021 observed AAMR exceeded the upper 95% prediction limit derived from the pre-pandemic trajectory, and COVID-19 was recorded on only a small proportion of HVD-related death certificates. Finally, only approximately one fifth of HVD-related deaths identified through the multiple-cause approach had HVD designated as the underlying cause of death, emphasizing that vascular liver disease frequently contributes to death in the setting of broader hepatic or systemic illness rather than appearing as the single initiating cause.
HVD comprise a clinically heterogeneous group of disorders affecting portal inflow, the hepatic sinusoids, hepatic venous outflow, and hepatic arterial circulation. Contemporary AASLD and EASL guidance therefore approaches these conditions according to vascular territory, underlying liver disease, thrombotic risk factors, and clinical context rather than as a single homogeneous entity [3,4,41]. PVT differs fundamentally from relatively rare disorders such as Budd–Chiari syndrome, peliosis hepatis, and sinusoidal obstruction syndrome (SOS), because PVT commonly develops in patients with cirrhosis, portal hypertension, abdominal malignancy, inflammatory disease, or other acquired thrombotic risk states. A 2022 systematic review and meta-analysis estimated a pooled PVT prevalence of 13.9% and incidence of 10.4% among patients with cirrhosis, with greater risk associated with more advanced hepatic dysfunction, ascites, lower portal flow velocity, and other manifestations of portal hypertension [12]. These differences in background frequency provide an important context for the strong dominance of PVT in our composite HVD mortality endpoint.
The most important observation in our study was the pronounced rise in HVD-related mortality after approximately 2011. This finding should not be interpreted as evidence that a single clinical or environmental factor caused the increase. Instead, several concurrent changes may plausibly have contributed. First, the U.S. burden of advanced chronic liver disease has changed substantially during the study period. Recent national studies have documented substantial and changing chronic-liver-disease mortality in the United States, including marked sex and etiologic heterogeneity [42,43]. Because progression of cirrhosis and portal hypertension is closely associated with PVT development, an increasing population of patients with advanced liver disease would be expected to enlarge the population at risk for clinically recognized PVT. Mechanistically, PVT in cirrhosis reflects the interaction of markedly reduced portal venous flow, endothelial perturbation, and a complex rebalanced hemostatic state in which prothrombotic as well as bleeding tendencies are present [12,54]. Thus, the temporal rise in HVD mortality is biologically compatible with the changing national burden of advanced liver disease, although our death-certificate data cannot directly establish that relationship.
Second, ascertainment of PVT has likely improved over time. PVT may be asymptomatic and detected incidentally during ultrasonography, computed tomography, or magnetic resonance imaging performed for cirrhosis surveillance, HCC evaluation, transplant assessment, or unrelated abdominal indications. Earlier systematic reviews noted that modern imaging increasingly identifies previously asymptomatic thrombosis in patients with cirrhosis [13]. Improvements in cross-sectional imaging availability, radiologic resolution, and clinician awareness could therefore have increased recognition and subsequent recording of PVT on death certificates. Such ascertainment effects are particularly relevant to interpretation of a long-term mortality study: a rising recorded mortality rate can reflect both genuine changes in disease burden and improved detection or documentation. The present study cannot quantify the contribution of either mechanism.
The component-specific analyses strongly support PVT as the major driver of the composite trend. PVT accounted for 18,189 of 22,498 HVD-related deaths and demonstrated an AAPC of 7.48%, with acceleration after 2010. In contrast, Budd–Chiari syndrome contributed far fewer deaths and showed no significant long-term increase. Most importantly, when PVT was removed from the composite in the prespecified S4 sensitivity analysis, the overall AAPC became −0.55% and was no longer statistically significant. The remaining non-PVT HVD group declined through 2015 before increasing in the later period. This result materially strengthens the interpretation because it demonstrates statistically—not merely from relative counts—that the long-term composite increase was predominantly PVT-driven.
Our findings extend the limited national literature on PVT mortality. Mattiuzzi and Lippi recently reported increasing PVT-related mortality in the United States during 2018–2024, with clear age dependence [16]. Their study, however, focused specifically on PVT over a much shorter recent interval. Our analysis places this phenomenon in a 26-year temporal context, demonstrates an inflection in the early 2010s, and compares PVT with other vascular liver diseases using a unified analytic framework. Similarly, a recent CDC WONDER study of portal hypertension mortality reported a transition from earlier declining or stable mortality toward increasing mortality during the mid-2010s, with substantial demographic and geographic heterogeneity [14]. Although portal hypertension and primary HVD are distinct entities and were intentionally separated in our primary case definition, the temporal concordance is notable because portal hypertension is a central clinical environment in which PVT develops.
The increasing co-occurrence of cirrhosis provides further support for this interpretation. Nearly 30% of HVD-related deaths had cirrhosis recorded on the death certificate, and the proportion increased from approximately one fifth of HVD deaths in 1999 to more than one third by 2024. PVT is an established complication of cirrhosis, and its risk rises with advancing hepatic dysfunction and portal hypertension [12,54]. However, an important complementary finding was that mortality among HVD deaths without recorded cirrhosis also increased significantly after 2011. Therefore, the overall HVD trend cannot be reduced to recorded cirrhosis alone. Some deaths classified as having “no recorded cirrhosis” may nevertheless have had clinically unrecorded cirrhosis, while others may reflect malignancy, local inflammatory conditions, thrombophilia, myeloproliferative disease, postoperative states, or truly noncirrhotic PVT. Consequently, this category should be interpreted as HVD without cirrhosis recorded on the death certificate, rather than definitive noncirrhotic vascular disease.
The findings involving HCC are particularly important. HCC was co-listed in 15.3% of HVD-related deaths, while its recorded share increased from 6.5% in 1999 to approximately 20% in 2024. HCC and portal venous thrombosis are closely related clinically because patients may develop either bland PVT or portal vein tumor invasion. Portal vein tumor thrombosis is a common form of macrovascular invasion in advanced HCC and is associated with portal-hypertensive complications and poor prognosis [52]. Recent meta-analytic evidence also confirms a substantial thrombotic burden among patients with HCC, particularly when cirrhosis is present [53]. Nevertheless, CDC WONDER cannot distinguish bland thrombus from malignant portal vein invasion, determine whether PVT preceded HCC, or establish that HCC caused the thrombotic event. The increasing HCC co-listing observed here therefore identifies an increasingly important overlap between malignant liver disease and recorded HVD mortality rather than proving a specific causal pathway.
Myeloproliferative neoplasms (MPNs) represented only a small proportion of all HVD-related death certificates in our population. This should not be interpreted as evidence that MPNs are uncommon etiologies of classical noncirrhotic splanchnic thrombosis. In a meta-analysis of clinical cohorts, MPNs were identified in approximately 41% of patients with Budd–Chiari syndrome and 32% of patients with nonmalignant, noncirrhotic PVT; JAK2 V617F screening identified additional occult MPNs in patients without conventional hematologic features [6]. Our composite population, however, was dominated by PVT in the broader population, including cirrhosis- and malignancy-associated disease, whereas the MPN meta-analysis concerned selected clinical BCS and noncirrhotic PVT populations. Moreover, conditions that contribute to a vascular event may not necessarily be recorded on a death certificate. The low MPN co-listing proportion in the present study should consequently be considered a measure of documented co-listing at death, not population prevalence of MPN among patients with HVD.
Budd–Chiari syndrome displayed a substantially different epidemiologic pattern from PVT. Its mortality rate was comparatively low and did not significantly increase over the study period. This is consistent with the rarity of Budd–Chiari syndrome in population-based epidemiologic studies: a systematic review estimated a pooled annual incidence of approximately 1 per million and prevalence of approximately 11 per million, although geographic heterogeneity was considerable [11]. Contemporary multidisciplinary management—including identification of underlying prothrombotic disorders, anticoagulation, endovascular intervention, transjugular intrahepatic portosystemic shunting, and transplantation in selected patients—has also altered the natural history of Budd–Chiari syndrome [3,4,41]. Our mortality dataset cannot determine the contribution of these treatments, but the stability of BCS-related mortality despite the pronounced rise in PVT reinforces the conclusion that these vascular liver diseases should not be assumed to share identical national temporal dynamics.
SOS/VOD, peliosis hepatis, and pylephlebitis were too uncommon for reliable annual Joinpoint analysis. The age restriction of ≥25 years is especially relevant to SOS/VOD. SOS is an important complication of hematopoietic stem cell transplantation and can occur disproportionately in pediatric and young adult populations; severe disease can result in multiorgan failure and substantial mortality [7]. In our all-age exploratory analysis, nearly half of SOS/VOD deaths occurred below age 25 years. Consequently, the low adult SOS contribution should not be interpreted as evidence of negligible overall disease burden. Rather, it reflects the adult focus of the primary analysis and confirms the value of the prespecified all-age sensitivity assessment.
Sex differences were also substantial. Males accounted for 56.7% of HVD-related deaths and had a pooled AAMR approximately 52% higher than females. This pattern is compatible with the broader epidemiology of chronic liver disease, in which mortality remains higher among males, and with sex differences in major underlying conditions such as alcohol-associated liver disease and HCC [42,43]. However, the temporal patterns are informative: female HVD mortality declined initially and then reversed sharply after approximately 2010, while male mortality also accelerated after 2011. Therefore, the sex disparity should not be viewed as biologically fixed. Differences in liver-disease etiology, alcohol exposure, metabolic disease, malignancy, healthcare utilization, and competing causes of death may all contribute, but these variables are unavailable in WONDER at the individual level. Our study can establish a persistent sex difference in recorded HVD mortality but cannot determine its causal composition.
Age was another major determinant of burden. Mortality was low in younger adults and markedly higher in older age groups, with the highest pooled CMR observed among those aged 75–84 years. Importantly, the pattern was not simply a monotonic increase culminating in the ≥85-year group, since the 75–84-year group had a slightly higher pooled CMR. Older adults accumulate multiple HVD risk environments, including advanced cirrhosis, malignancy, systemic disease, hospitalization, immobility, and other thrombotic risk factors. PVT prevalence also increases with severity of cirrhosis rather than age alone [12]. The pronounced recent increase among the older groups therefore likely represents a combination of age-associated disease burden and changing prevalence of the underlying conditions that produce HVD. The very low counts and unreliable annual rates among adults aged 25–34 years appropriately precluded Joinpoint modeling, and these data should not be used to infer a reliable trend in the youngest primary-analysis group.
The race/ethnicity findings differ from patterns reported for several other cardiovascular and vascular mortality phenotypes and therefore deserve disease-specific interpretation. Hispanic adults had the highest pooled HVD AAMR, followed by NH Black, NH White, and NH Other adults. This pattern is broadly compatible with previous U.S. literature documenting substantial chronic liver disease and cirrhosis burden in Hispanic populations, although cirrhosis disparities vary markedly by etiology, location, age, and time period [44,45]. Recent county-level analyses have also demonstrated pronounced racial and ethnic heterogeneity in cirrhosis mortality across the United States rather than a single uniform national hierarchy [45]. The HVD disparity observed here may therefore reflect differences in underlying cirrhosis, metabolic liver disease, alcohol-associated liver disease, HCC, access to specialty care, or other unmeasured factors. Race and ethnicity in mortality data are social and demographic classifications and should not be interpreted as direct biological causes of vascular liver disease.
Interpretation of race-specific trends also requires particular caution because the mortality databases transition from bridged-race to single-race population classification. Our overlap analysis showed good concordance for several major strata but greater differences in some race categories, particularly NH Other. This is expected because the single-race system recognizes categories—including multiracial classification—not represented identically in the earlier bridged-race denominator. Importantly, the D157-only analysis from 2018–2024 continued to demonstrate increasing mortality among each harmonized racial/ethnic group. Thus, the recent upward trend is unlikely to be entirely an artifact of the database transition, although precise longitudinal comparisons for the NH Other category remain less secure than those for the larger harmonized groups.
Geographic heterogeneity was also pronounced. The West had the highest pooled regional AAMR, followed by the Midwest, South, and Northeast. Furthermore, the West differed temporally from the other regions, showing an earlier increase followed by substantial acceleration during 2013–2019 and continued, although slower, growth thereafter. These geographic patterns likely reflect a complex mixture of differences in chronic liver disease epidemiology, alcohol and metabolic risk, population composition, healthcare access, referral patterns, transplantation infrastructure, and certification practices. National analyses of liver disease have demonstrated marked county-level variation: Goldberg and colleagues found that race/ethnicity, poverty, uninsured status, obesity, diabetes, alcohol use, and distance to a liver-transplant center collectively explained a substantial proportion of geographic variation in U.S. liver-related mortality [46]. The clustering of high HVD rates in particular states should therefore be viewed as a signal for further investigation rather than evidence that geography itself causes HVD.
The urban–rural findings complement the state and regional results. During 1999–2020, nonmetropolitan areas had an HVD AAMR approximately 13% higher than metropolitan areas, and the increase became particularly pronounced after 2011. This resembles broader observations for several forms of liver disease in which rural or nonmetropolitan populations experience higher mortality or steeper recent increases [14,47]. Potential contributors include differences in socioeconomic conditions, prevalence of alcohol and metabolic risk factors, availability of gastroenterology and hepatology services, distance from tertiary and transplant centers, and delayed access to diagnostic imaging or interventional radiology. However, none of these mechanisms was measured directly in our study. Furthermore, urbanization data were only consistently available through 2020 under the 2013 NCHS classification; the analysis therefore cannot determine whether the observed rural–urban gap persisted, narrowed, or widened during 2021–2024.
The pandemic-era analysis provides additional context. COVID-19 can produce systemic inflammation and thromboinflammation, and splanchnic venous thrombosis has been reported in association with infection. A systematic review estimated that splanchnic vein thrombosis occurred in a small proportion of patients with COVID-19, although published clinical evidence was heterogeneous [48]. A recent U.S. mortality analysis also documented increased splanchnic thrombosis mortality during 2020–2023 compared with 2018–2019 but appropriately emphasized that temporal association does not establish causation [15]. In our study, the observed 2021 HVD AAMR exceeded the upper 95% prediction interval based on the 2010–2019 trajectory, whereas 2020, 2022, 2023, and 2024 did not. COVID-19 was co-listed on only 2.5% of HVD-related deaths during 2020–2024 and its annual proportion declined substantially after 2022. These findings suggest that the pandemic may have contributed to a temporary perturbation—particularly in 2021—but was unlikely to explain the broader long-term rise that had already begun approximately a decade earlier. This interpretation is also consistent with the recent PVT-specific U.S. analysis, which did not identify the pandemic peak as the principal explanation for the 2018–2024 mortality trajectory [16].
The underlying-cause analysis further illustrates why the multiple-cause approach was important. Only 19% of HVD-related deaths had an HVD code recorded as the underlying cause. Restricting the analysis to the underlying cause substantially attenuated the temporal increase, although a modest significant rise remained. HVD frequently occurs within complex clinical chains involving cirrhosis, HCC, infection, malignancy, hematologic disorders, transplantation, or multiorgan failure. Consequently, an underlying-cause-only analysis would capture only a subset of the mortality burden in which the vascular lesion was selected as the condition initiating the causal sequence. Multiple-cause analysis is therefore better suited to the objective of quantifying deaths in which HVD materially appeared anywhere on the certificate, while the underlying-cause sensitivity analysis provides a more restrictive estimate.
Place of death also changed considerably. The proportion of HVD-related deaths occurring during inpatient hospitalization fell, whereas deaths at home and in hospice facilities increased. Similar changes have been described among patients dying with cirrhosis in the United States, with inpatient facilities and the home representing major sites of death and increasing attention directed toward palliative and end-of-life care [49]. Several explanations are possible, including expansion of hospice services, greater outpatient management of advanced chronic disease, changes in preferences for end-of-life care, and healthcare delivery changes. However, death certificates do not provide information on patient preferences, hospice eligibility, palliative-care consultation, severity of disease, or preceding hospitalizations. The shift should therefore be interpreted descriptively rather than as evidence of improvement or deterioration in quality of end-of-life care.
The sensitivity analyses provide important evidence concerning the robustness and meaning of the primary endpoint. Adding portal hypertension and chronic passive congestion substantially increased the number of deaths but produced a lower full-period AAPC than the primary vascular definition, demonstrating that broadening the phenotype changes not only its magnitude but also its temporal behavior. This supports our decision to exclude secondary hemodynamic consequences from the primary HVD definition. Conversely, adding ischemic hepatic injury produced results very similar to the main analysis. The D157-only analysis preserved the steep recent increase, making a database-splice artifact an unlikely sole explanation. Likewise, restriction to 1999–2019 demonstrated that the upward trend preceded COVID-19. Most importantly, exclusion of PVT abolished the significant full-period increase. Collectively, these analyses indicate that the principal conclusion is robust to several alternative definitions while simultaneously demonstrating that the increasing national HVD burden is specifically concentrated within the PVT phenotype rather than representing uniform deterioration across every vascular disorder of the liver.
These findings have several clinical and public-health implications. The data do not support population-wide screening for rare vascular liver diseases. Rather, they emphasize the importance of identifying vascular complications within clinically defined high-risk populations, particularly patients with advanced cirrhosis, portal hypertension, HCC, transplantation-related risk, or recognized thrombophilic disorders. Contemporary AASLD, EASL, and Baveno guidance emphasizes individualized assessment of recently detected PVT, extent and chronicity of thrombosis, underlying cirrhosis, transplant candidacy, bleeding risk, and appropriate use of anticoagulation or interventional approaches [3,4,41]. The increasing mortality trajectory identified here indicates that the population-level burden of these clinical decisions is rising. At the same time, the strong component heterogeneity argues against treating “hepatic vascular disease” as a single therapeutic entity: prevention and management strategies for cirrhosis-associated PVT, Budd–Chiari syndrome, SOS/VOD, pylephlebitis, and hepatic infarction differ substantially.
Our findings also identify priorities for future research. Linkage of mortality records with longitudinal clinical datasets would be required to determine whether the rising PVT signal reflects increasing incidence, increased detection, changing cirrhosis severity, greater HCC burden, improved survival long enough to develop thrombosis, or changes in certification. Distinguishing bland PVT from portal vein tumor thrombosis is particularly important. Future analyses should also examine liver-disease etiology, anticoagulation use, transplantation status, thrombophilia, JAK2 testing, imaging utilization, and access to hepatology and interventional radiology. Finally, because our state-level results reveal large spatial differences, small-area studies incorporating socioeconomic conditions, liver-care availability, transplant-center proximity, and underlying liver-disease prevalence may clarify why HVD mortality is concentrated in particular regions.
Limitations
This study has several limitations. First, CDC WONDER is based on death certificates rather than adjudicated clinical records. HVD may be omitted, miscoded, or assigned incorrectly as an underlying or contributing cause of death. Death-certificate studies of chronic liver disease have demonstrated substantial under-ascertainment of specific etiologies, while broader systematic evidence shows that errors in cause-of-death certification remain common [50,51]. Consequently, the absolute burden of HVD is likely underestimated. Conversely, increased recognition, imaging availability, and documentation over time could inflate the apparent temporal rise even in the absence of an equivalent increase in true disease incidence. We cannot quantify the direction or magnitude of these competing effects.
Second, ICD-10 mortality codes provide limited clinical phenotyping. For PVT, we cannot determine thrombus extent, acute versus chronic disease, partial versus complete obstruction, symptomatic versus incidental detection, cavernous transformation, mesenteric extension, anticoagulation status, or recanalization. Critically, among patients with HCC, the database cannot reliably distinguish bland PVT from malignant portal venous tumor invasion. Similarly, hepatic infarction codes do not provide information on precipitating shock, surgery, arterial intervention, transplantation, or underlying vascular anatomy. These limitations prevent direct mechanistic interpretation of component-specific trends.
Third, the study cannot establish causality. Although increasing HVD mortality occurred alongside increasing co-listing of cirrhosis and HCC and was temporally compatible with broader changes in U.S. chronic liver disease, our aggregate design cannot determine whether these conditions caused the HVD increase. Individual-level information on alcohol consumption, metabolic risk, viral hepatitis, smoking, medication use, anticoagulation, cancer treatment, thrombophilia, transplantation, socioeconomic status, health insurance, imaging, hospitalization, and specialist care is unavailable. Associations by sex, race/ethnicity, region, and urbanization therefore describe disparities in mortality and should not be interpreted as causal effects of demographic characteristics or place of residence.
Fourth, the meaning of co-listed conditions requires caution. A condition appearing on the same death certificate as HVD does not necessarily precede, cause, or result from the vascular disease. Conversely, absence of a condition from the death certificate does not establish its clinical absence. This issue is particularly relevant to cirrhosis, HCC, and MPN. Accordingly, our derived “without cirrhosis” population represents deaths without recorded cirrhosis rather than a clinically confirmed noncirrhotic cohort.
Fifth, the transition between the D77 bridged-race mortality database and the D157 single-race database introduces the possibility of discontinuity beginning in 2021, especially for the harmonized NH Other category. Although the 2018–2020 overlap analysis and D157-only sensitivity analysis reduce concern that the overall recent increase is an artifact of the splice, they cannot eliminate all denominator and classification differences. Race/ethnicity-specific longitudinal comparisons—particularly for smaller categories—should therefore be interpreted cautiously.
Sixth, sparse counts limited evaluation of the rarest HVD components. CDC WONDER suppresses death counts below 10 and flags rates based on small numbers as unreliable. Pylephlebitis, peliosis hepatis, SOS/VOD, MPN co-listing, and some young-age strata therefore could not be modeled reliably with annual Joinpoint regression. Aggregating rare disorders would improve statistical stability but would obscure biologically distinct conditions, so these endpoints were retained descriptively in accordance with the prespecified protocol.
Seventh, restricting the primary population to adults aged ≥25 years improves comparability across the main demographic analyses but underestimates diseases that disproportionately affect younger populations. This was most evident for SOS/VOD, for which the all-age sensitivity analysis showed that a substantial fraction of deaths occurred below age 25 years. The adult SOS/VOD results therefore should not be generalized to the entire U.S. population.
Eighth, urban–rural analyses were limited to 1999–2020 because comparable 2013 NCHS urbanization classification was not available across the entire 1999–2024 analytic period in the datasets used. We therefore cannot determine whether the observed nonmetropolitan excess persisted after 2020. State estimates were likewise analyzed separately for 1999–2020 and 2021–2024 rather than pooled across database systems, limiting direct comparison of absolute state rates across the two periods.
Ninth, Joinpoint regression identifies statistically supported changes in population-level temporal slope but does not identify the events responsible for those changes. Joinpoints near 2010–2012 should not automatically be attributed to particular clinical guidelines, therapies, imaging technologies, or changes in liver-disease epidemiology without independent evidence. Furthermore, numerous subgroup models were examined without formal multiplicity correction. As prespecified, these analyses are exploratory and hypothesis-generating; isolated subgroup findings should therefore be interpreted with greater caution than the primary national trend and the major sensitivity analyses.
Finally, although the multiple-cause approach improves ascertainment of HVD as a contributing condition, it also means that the mortality rate should not be interpreted as disease-specific case fatality. CDC WONDER contains deaths and population denominators but not the number of living individuals with PVT, Budd–Chiari syndrome, or other HVD. Thus, increasing HVD-related AAMR could reflect increasing disease incidence, changing survival among affected patients, greater comorbidity burden, improved recognition, or changes in certification. Determining which mechanism predominates will require incidence cohorts and clinical longitudinal datasets.
Conclusions
From 1999 through 2024, HVD-related mortality among U.S. adults increased substantially, with a pronounced acceleration beginning in the early 2010s. This national increase was driven predominantly by PVT rather than by a uniform rise across all vascular liver diseases: exclusion of PVT eliminated the significant positive full-period trend, whereas Budd–Chiari syndrome remained comparatively stable and several rarer components were too sparse for reliable temporal modeling. The increasing proportions of HVD deaths with recorded cirrhosis and HCC demonstrate an expanding overlap between vascular complications and advanced chronic liver disease, although rising mortality was also observed among deaths without recorded cirrhosis.
Mortality burden varied meaningfully across the population, with higher rates among males, older adults, Hispanic individuals, residents of the Western United States, and persons living in nonmetropolitan areas during the period for which urbanization data were available. The 2021 mortality increase exceeded that predicted from the pre-pandemic trajectory, but the broader upward trend preceded COVID-19 by nearly a decade and persisted thereafter, arguing against the pandemic as its principal explanation. Considerable state-level variation and a shift from inpatient toward home and hospice deaths further demonstrate that HVD mortality is embedded within broader changes in chronic liver disease, healthcare access, and patterns of end-of-life care.
Taken together, these findings identify PVT as the principal population-level target for understanding the rising burden of hepatic vascular mortality in the United States. Future studies linking national mortality data with clinical information on cirrhosis severity, HCC, thrombosis phenotype, imaging, anticoagulation, transplantation, and access to specialty care are needed to distinguish true changes in disease incidence from changes in detection and documentation and to identify modifiable contributors to the observed demographic and geographic disparities.
Supplementary Materials
The following supporting information can be downloaded at the website of this paper posted on Preprints.org.
Author Contributions
KH: Conceptualization, Methodology, Writing – original draft. RB: Formal analysis, Data curation, Visualization. MS: Writing – review & editing, Supervision. All authors read and approved the final manuscript.
Funding
This research received no external funding.
Ethics approval and consent to participate:
This study used publicly available, de-identified aggregate data from CDC WONDER and did not involve identifiable human participants. Institutional review board approval and informed consent were therefore not required.
Consent for publication:
Not applicable.
Availability of data and materials:
CDC WONDER mortality data are publicly available from the National Center for Health Statistics.
Competing interests:
The authors declare that they have no competing interests.
Acknowledgments and AI-assisted technology disclosure:
OpenAI ChatGPT was used for language editing, manuscript organization and consistency checks. Human authors remain responsible for the study design, data extraction, statistical analyses, verification of numerical results and references, interpretation, and final manuscript content.
Abbreviations
AAMR, age-adjusted mortality rate; AAPC, average annual percent change; APC, annual percent change; BCS, Budd-Chiari syndrome; CI, confidence interval; CMR, crude mortality rate; HCC, hepatocellular carcinoma; HVD, hepatic vascular disease; MPN, myeloproliferative neoplasm; NCHS, National Center for Health Statistics; NH, non-Hispanic; PVT, portal vein thrombosis; RR, rate ratio; SOS/VOD, sinusoidal obstruction syndrome/hepatic veno-occlusive disease; TIPS, transjugular intrahepatic portosystemic shunt; WONDER, Wide-Ranging Online Data for Epidemiologic Research.
References
- DeLeve, L.D.; Valla, D.C.; Garcia-Tsao, G. Vascular disorders of the liver. Hepatology 2009, 49, 1729–1764. [Google Scholar] [CrossRef]
- European Association for the Study of the Liver. EASL Clinical Practice Guidelines: Vascular diseases of the liver. J. Hepatol. 2016, 64, 179–202. [Google Scholar] [CrossRef]
- Northup, P.G.; Garcia-Pagan, J.C.; Garcia-Tsao, G.; Intagliata, N.M.; Superina, R.A.; Roberts, L.N.; et al. Vascular liver disorders, portal vein thrombosis, and procedural bleeding in patients with liver disease: 2020 practice guidance by the American Association for the Study of Liver Diseases. Hepatology 2021, 73, 366–413. [Google Scholar] [CrossRef]
- de Franchis, R.; Bosch, J.; Garcia-Tsao, G.; Reiberger, T.; Ripoll, C. Baveno VII Faculty. Baveno VII - Renewing consensus in portal hypertension. J. Hepatol. 2022, 76, 959–974. [Google Scholar] [CrossRef]
- Ageno, W.; Dentali, F.; Pomero, F.; Fenoglio, L.; Squizzato, A.; Pagani, G.; et al. Incidence rates and case fatality rates of portal vein thrombosis and Budd-Chiari syndrome. Thromb. Haemost. 2017, 117, 794–800. [Google Scholar] [CrossRef]
- Smalberg, J.H.; Arends, L.R.; Valla, D.C.; Kiladjian, J.J.; Janssen, H.L.A.; Leebeek, F.W.G. Myeloproliferative neoplasms in Budd-Chiari syndrome and portal vein thrombosis: a meta-analysis. Blood 2012, 120, 4921–4928. [Google Scholar] [CrossRef]
- Coppell, J.A.; Richardson, P.G.; Soiffer, R.; et al. Hepatic veno-occlusive disease following stem cell transplantation: incidence, clinical course, and outcome. Biol. Blood Marrow Transplant. 2010, 16, 157–168. [Google Scholar] [CrossRef]
- Guerrero, A.; Del Campo, L.; Piscaglia, F.; et al. Anticoagulation improves survival in patients with cirrhosis and portal vein thrombosis: the IMPORTAL competing-risk meta-analysis. J. Hepatol. 2023, 79, 69–78. [Google Scholar] [CrossRef]
- Davis, J.P.E.; Lim, J.K.; Francis, F.F.; Ahn, J. AGA Clinical Practice Update on management of portal vein thrombosis in patients with cirrhosis: expert review. Gastroenterology 2025, 168, 396–404.e1. [Google Scholar] [CrossRef]
- Lv, Y.; Qi, X.; He, C.; et al. Covered TIPS versus endoscopic band ligation plus propranolol for prevention of variceal rebleeding in cirrhotic patients with portal vein thrombosis: a randomised controlled trial. Gut 2018, 67, 2156–2168. [Google Scholar] [CrossRef]
- Li, Y.; De Stefano, V.; Li, H.; Zheng, K.; Bai, Z.; Guo, X.; Qi, X. Epidemiology of Budd-Chiari syndrome: a systematic review and meta-analysis. Clin. Res. Hepatol. Gastroenterol. 2019, 43, 468–474. [Google Scholar] [CrossRef]
- Pan, J.; Wang, L.; Gao, F.; et al. Epidemiology of portal vein thrombosis in liver cirrhosis: a systematic review and meta-analysis. Eur. J. Intern Med. 2022, 104, 21–32. [Google Scholar] [CrossRef]
- Tsochatzis, E.A.; Senzolo, M.; Germani, G.; Gatt, A.; Burroughs, A.K. Systematic review: portal vein thrombosis in cirrhosis. Aliment Pharmacol. Ther. 2010, 31, 366–374. [Google Scholar] [CrossRef]
- Haward, R.; Duseja, N.; Hirpara, H.; et al. Portal hypertension mortality in the United States (1999-2023): insights from the CDC WONDER database. Medicine 2026, 105, e50127. [Google Scholar] [CrossRef]
- Alali, M.; Naveed, A.K. Impact of the COVID-19 pandemic on splanchnic thrombosis mortality: a United States national analysis (2018-2023). Cureus 2026, 18, e104562. [Google Scholar] [CrossRef]
- Mattiuzzi, C.; Lippi, G. Trends and demographic patterns of portal vein thrombosis mortality in the United States, 2018-2024. Blood Coagul. Fibrinolysis 2026, 37, 44–45. [Google Scholar] [CrossRef]
- Bano, S.; Akhtar, M.; Kamran, F.; et al. Rising mortality trends in portal vein thrombosis in U.S.: insights from CDC WONDER. J. Am. Coll. Cardiol. 2025, 85((12) Suppl, 2393. [Google Scholar] [CrossRef]
- Centers for Disease Control and Prevention; National Center for Health Statistics. National Vital Statistics System, Mortality 1999-2020 on CDC WONDER Online Database. Released. 2021. (accessed on 26 September 2026). [Google Scholar]
- Centers for Disease Control and Prevention; National Center for Health Statistics. National Vital Statistics System, Mortality 2018-2024, Single Race, on CDC WONDER Online Database. Released. 2026. (accessed on 26 September 2026). [Google Scholar]
- World Health Organization. ICD-10: International Statistical Classification of Diseases and Related Health Problems. 10th revision, 2nd ed.; World Health Organization: Geneva, 2004. [Google Scholar]
- Redelings, M.D.; Sorvillo, F.; Simon, P. A comparison of underlying cause and multiple causes of death: US vital statistics, 2000-2001. Epidemiology 2006, 17, 100–103. [Google Scholar]
- Redelings, M.D.; Wise, M.; Sorvillo, F. Using multiple cause-of-death data to investigate associations and causality between conditions listed on the death certificate. Am. J. Epidemiol. 2007, 166, 104–108. [Google Scholar] [CrossRef]
- Ingram, D.D.; Parker, J.D.; Schenker, N.; Weed, J.A.; Hamilton, B.; Arias, E.; et al. United States Census 2000 population with bridged race categories. Vital. Health Stat. 2 2003, (135), 1–55. [Google Scholar]
- Ingram, D.D.; Franco, S.J. 2013 NCHS Urban-Rural Classification Scheme for Counties. Vital. Health Stat. 2 2014, (166), 1–73. [Google Scholar]
- Anderson, R.N.; Rosenberg, H.M. Age standardization of death rates: implementation of the year 2000 standard. Natl. Vital. Stat. Rep. 1998, 47, 1–16. [Google Scholar]
- Klein, R.J.; Schoenborn, C.A. Age adjustment using the 2000 projected U.S. population. In Healthy People 2010 Statistical Notes; National Center for Health Statistics: Hyattsville, MD, 2001; Volume no. 20. [Google Scholar]
- Fay, M.P.; Feuer, E.J. Confidence intervals for directly standardized rates: a method based on the gamma distribution. Stat. Med. 1997, 16, 791–801. [Google Scholar] [CrossRef]
- Chiang, C.L. Standard error of the age-adjusted death rate. Vital. Stat.-Spec. Rep. 1961, 47, 271–285. [Google Scholar]
- National Cancer Institute. Joinpoint Regression Program. Surveillance Research Program, Division of Cancer Control and Population Sciences. Accessed. (accessed on 26 September 2026).
- Kim, H.J.; Fay, M.P.; Feuer, E.J.; Midthune, D.N. Permutation tests for joinpoint regression with applications to cancer rates. Stat. Med. 2000, 19, 335–351. [Google Scholar] [CrossRef]
- Clegg, L.X.; Hankey, B.F.; Tiwari, R.; Feuer, E.J.; Edwards, B.K. Estimating average annual percent change in trend analysis. Stat. Med. 2009, 28, 3670–3682. [Google Scholar] [CrossRef]
- Kim, H.J.; Luo, J.; Chen, H.S.; Green, D.; Buckman, D.; Byrne, J.; et al. Improved confidence interval for average annual percent change in trend analysis. Stat. Med. 2017, 36, 3059–3074. [Google Scholar] [CrossRef]
- Kim, H.J.; Chen, H.S.; Byrne, J.; Wheeler, B.; Feuer, E.J. Twenty years since Joinpoint 1.0: two major enhancements, their justification, and impact. Stat. Med. 2022, 41, 3102–3130. [Google Scholar] [CrossRef]
- Kim, H.J.; Fay, M.P.; Yu, B.; Barrett, M.J.; Feuer, E.J. Comparability of segmented line regression models. Biometrics 2004, 60, 1005–1014. [Google Scholar] [CrossRef]
- Woolf, S.H.; Chapman, D.A.; Sabo, R.T.; Weinberger, D.M.; Hill, L.; Taylor, D.D.H. Excess deaths from COVID-19 and other causes in the US, March 1, 2020, to January 2, 2021. JAMA 2021, 325, 1786–1789. [Google Scholar] [CrossRef]
- National Center for Health Statistics. 2020. Guidance for certifying deaths due to coronavirus disease 2019 (COVID-19). Vital Statistics Reporting Guidance, Report No. 3. NCHS: Hyattsville, MD. [Google Scholar]
- Arias, E.; Heron, M.; Hakes, J. The validity of race and Hispanic-origin reporting on death certificates in the United States: an update. Vital. Health Stat. 2 2016, (172), 1–21. [Google Scholar]
- Bender, R.; Lange, S. Adjusting for multiple testing - when and how? J. Clin. Epidemiol. 2001, 54, 343–349. [Google Scholar] [CrossRef]
- Benchimol, E.I.; Smeeth, L.; Guttmann, A.; Harron, K.; Moher, D.; Petersen, I.; et al. The REporting of studies Conducted using Observational Routinely-collected health Data (RECORD) statement. PLoS Med. 2015, 12, e1001885. [Google Scholar] [CrossRef]
- von Elm, E.; Altman, D.G.; Egger, M.; Pocock, S.J.; Gotzsche, P.C.; Vandenbroucke, J.P.; STROBE Initiative. The Strengthening the Reporting of Observational Studies in Epidemiology (STROBE) statement: guidelines for reporting observational studies. Lancet 2007, 370, 1453–1457. [Google Scholar] [CrossRef]
- European Association for the Study of the Liver. EASL Clinical Practice Guidelines on vascular diseases of the liver. J. Hepatol. 2026, 84, 399–456. [Google Scholar] [CrossRef]
- Kim, D.; Danpanichkul, P.; Wijarnpreecha, K.; Cholankeril, G.; Ahmed, A. Contemporary burden of mortality from chronic liver disease by sex and race/ethnicity in the United States. Clin. Mol. Hepatol. 2025, 31, e268–e272. [Google Scholar] [CrossRef]
- Karaye, I.M.; Maleki, N.; Hassan, N.; Yunusa, I. Trends in alcohol-related deaths by sex in the US, 1999-2020. JAMA Netw. Open 2023, 6, e2326346. [Google Scholar] [CrossRef]
- Carrion, A.F.; Ghanta, R.; Carrasquillo, O.; Martin, P. Chronic liver disease in the Hispanic population of the United States. Clin. Gastroenterol. Hepatol. 2011, 9, 834–841. [Google Scholar] [CrossRef]
- GBD US Health Disparities Collaborators. The burden of cirrhosis mortality by county, race, and ethnicity in the USA, 2000-19: a systematic analysis of health disparities. Lancet Public Health 2024, 9, e551–e563. [Google Scholar] [CrossRef]
- Goldberg, D.; Ross-Driscoll, K.; Lynch, R. County differences in liver mortality in the United States: impact of sociodemographics, disease risk factors, and access to care. Gastroenterology 2021, 160, 1140–1150.e1. [Google Scholar] [CrossRef]
- Zafar, Y.; Baker, M.; Muhammad, A.; et al. Rural-urban disparities in mortality from alcoholic liver disease in the United States, 1999 to 2020. Am. J. Med. Sci. 2026, 371, 41–46. [Google Scholar] [CrossRef]
- Zheng, X.; Gao, F.; Wang, L.; Meng, Y.; Ageno, W.; Qi, X. Incidence and outcomes of splanchnic vein thrombosis after diagnosis of COVID-19 or COVID-19 vaccination: a systematic review and meta-analysis. J. Thromb. Thrombolysis 2023, 55, 18–31. [Google Scholar] [CrossRef]
- Iftikhar, A.; Alam, F.N.; Ashraf, D.A.; et al. Where do patients with cirrhosis die? A CDC WONDER analysis from 1999 to 2020. JGH Open 2025, 9, e70205. [Google Scholar] [CrossRef]
- Manos, M.M.; Leyden, W.A.; Murphy, R.C.; Terrault, N.A.; Bell, B.P. Limitations of conventionally derived chronic liver disease mortality rates: results of a comprehensive assessment. Hepatology 2008, 47, 1150–1157. [Google Scholar] [CrossRef]
- Alipour, J.; Payandeh, A. Common errors in reporting cause-of-death statement on death certificates: a systematic review and meta-analysis. J. Forensic Leg. Med. 2021, 82, 102220. [Google Scholar] [CrossRef]
- Tao, Z.W.; Cheng, B.Q.; Zhou, T.; Gao, Y.J. Management of hepatocellular carcinoma patients with portal vein tumor thrombosis: a narrative review. Hepatobiliary Pancreat. Dis. Int. 2022, 21, 134–144. [Google Scholar] [CrossRef]
- Liu, L.; Liu, D.; He, W.; Zhang, W. Incidence of thrombosis in patients with hepatocellular carcinoma: systematic review and meta-analysis. J. Thromb. Thrombolysis 2025, 58, 925–936. [Google Scholar] [CrossRef]
- Anton, A.; Camprecios, G.; Perez-Campuzano, V.; Orts, L.; Garcia-Pagan, J.C.; Hernandez-Gea, V. The pathophysiology of portal vein thrombosis in cirrhosis: getting deeper into Virchow’s triad. J. Clin. Med. 2022, 11, 800. [Google Scholar] [CrossRef]
Figure 1.
Age-adjusted mortality rate (AAMR) for hepatic vascular disease (HVD)-related deaths per 100,000 population in the United States, overall and by sex, 1999-2024. Joinpoints indicate statistically supported changes in log-linear trend.
Figure 1.
Age-adjusted mortality rate (AAMR) for hepatic vascular disease (HVD)-related deaths per 100,000 population in the United States, overall and by sex, 1999-2024. Joinpoints indicate statistically supported changes in log-linear trend.
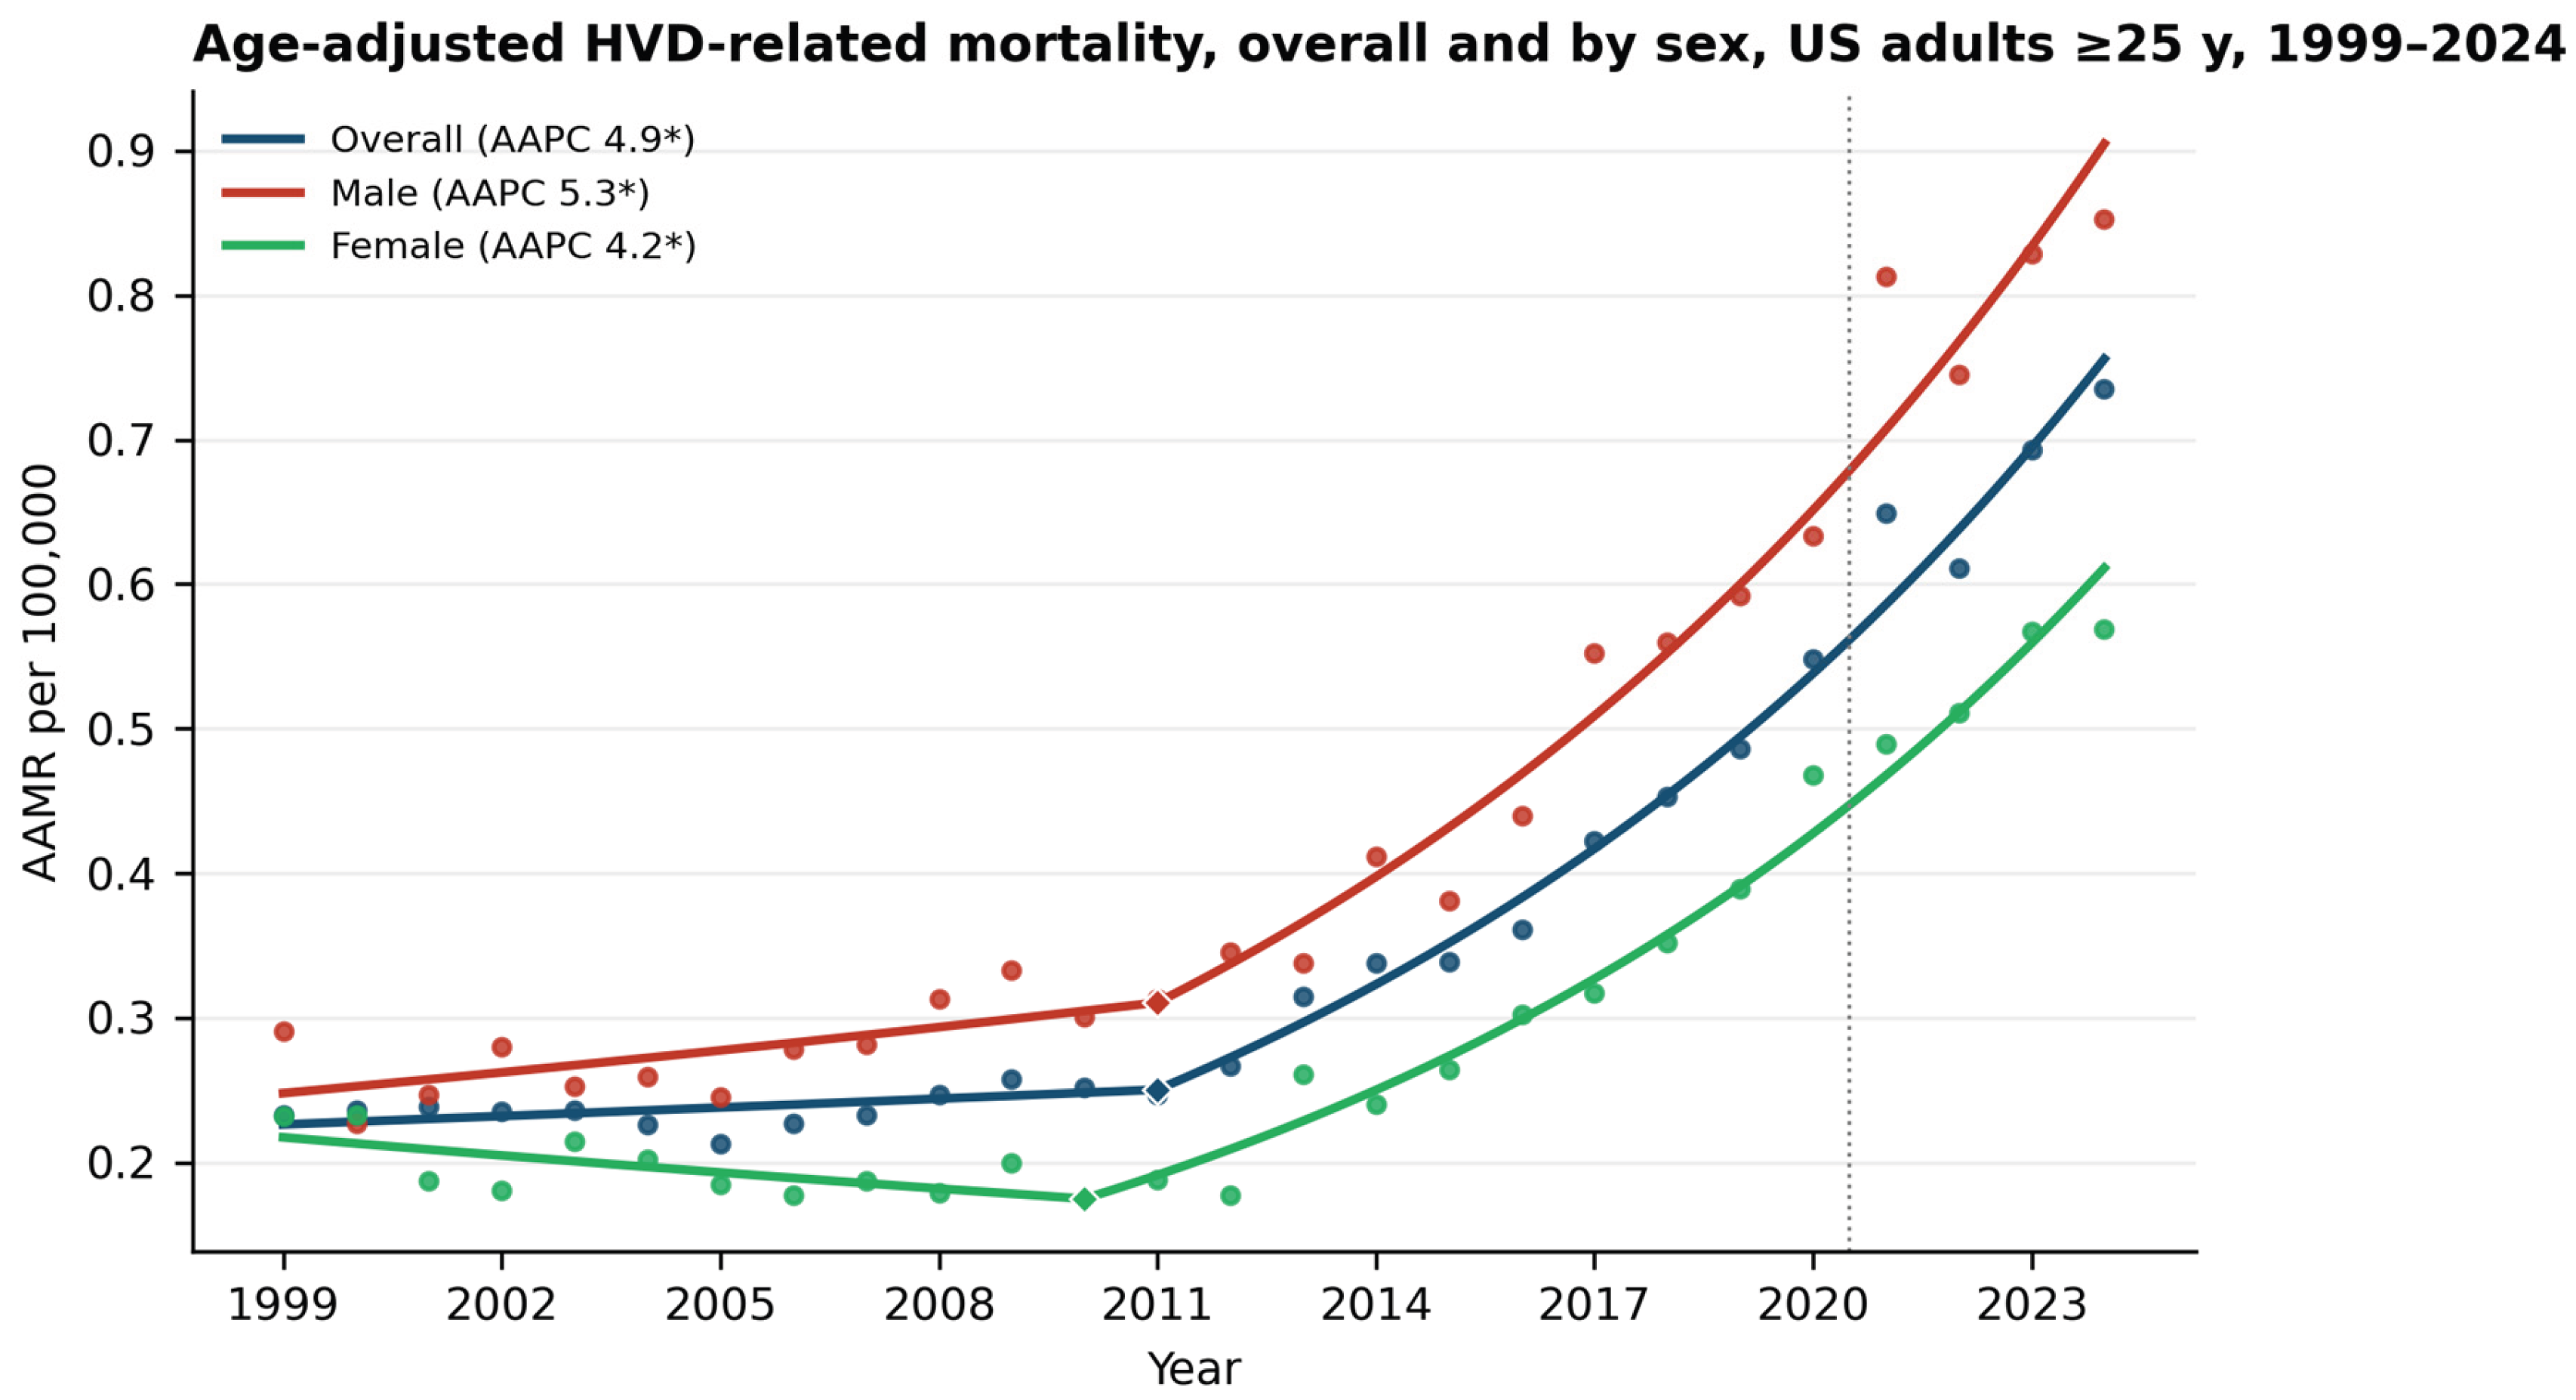
Figure 2.
Crude HVD-related mortality rates per 100,000 population by age group, United States, 1999-2024. Age-specific rates are crude rather than age adjusted. The 25-34-year series was not modeled because annual cells included suppression and extensive unreliability.
Figure 2.
Crude HVD-related mortality rates per 100,000 population by age group, United States, 1999-2024. Age-specific rates are crude rather than age adjusted. The 25-34-year series was not modeled because annual cells included suppression and extensive unreliability.
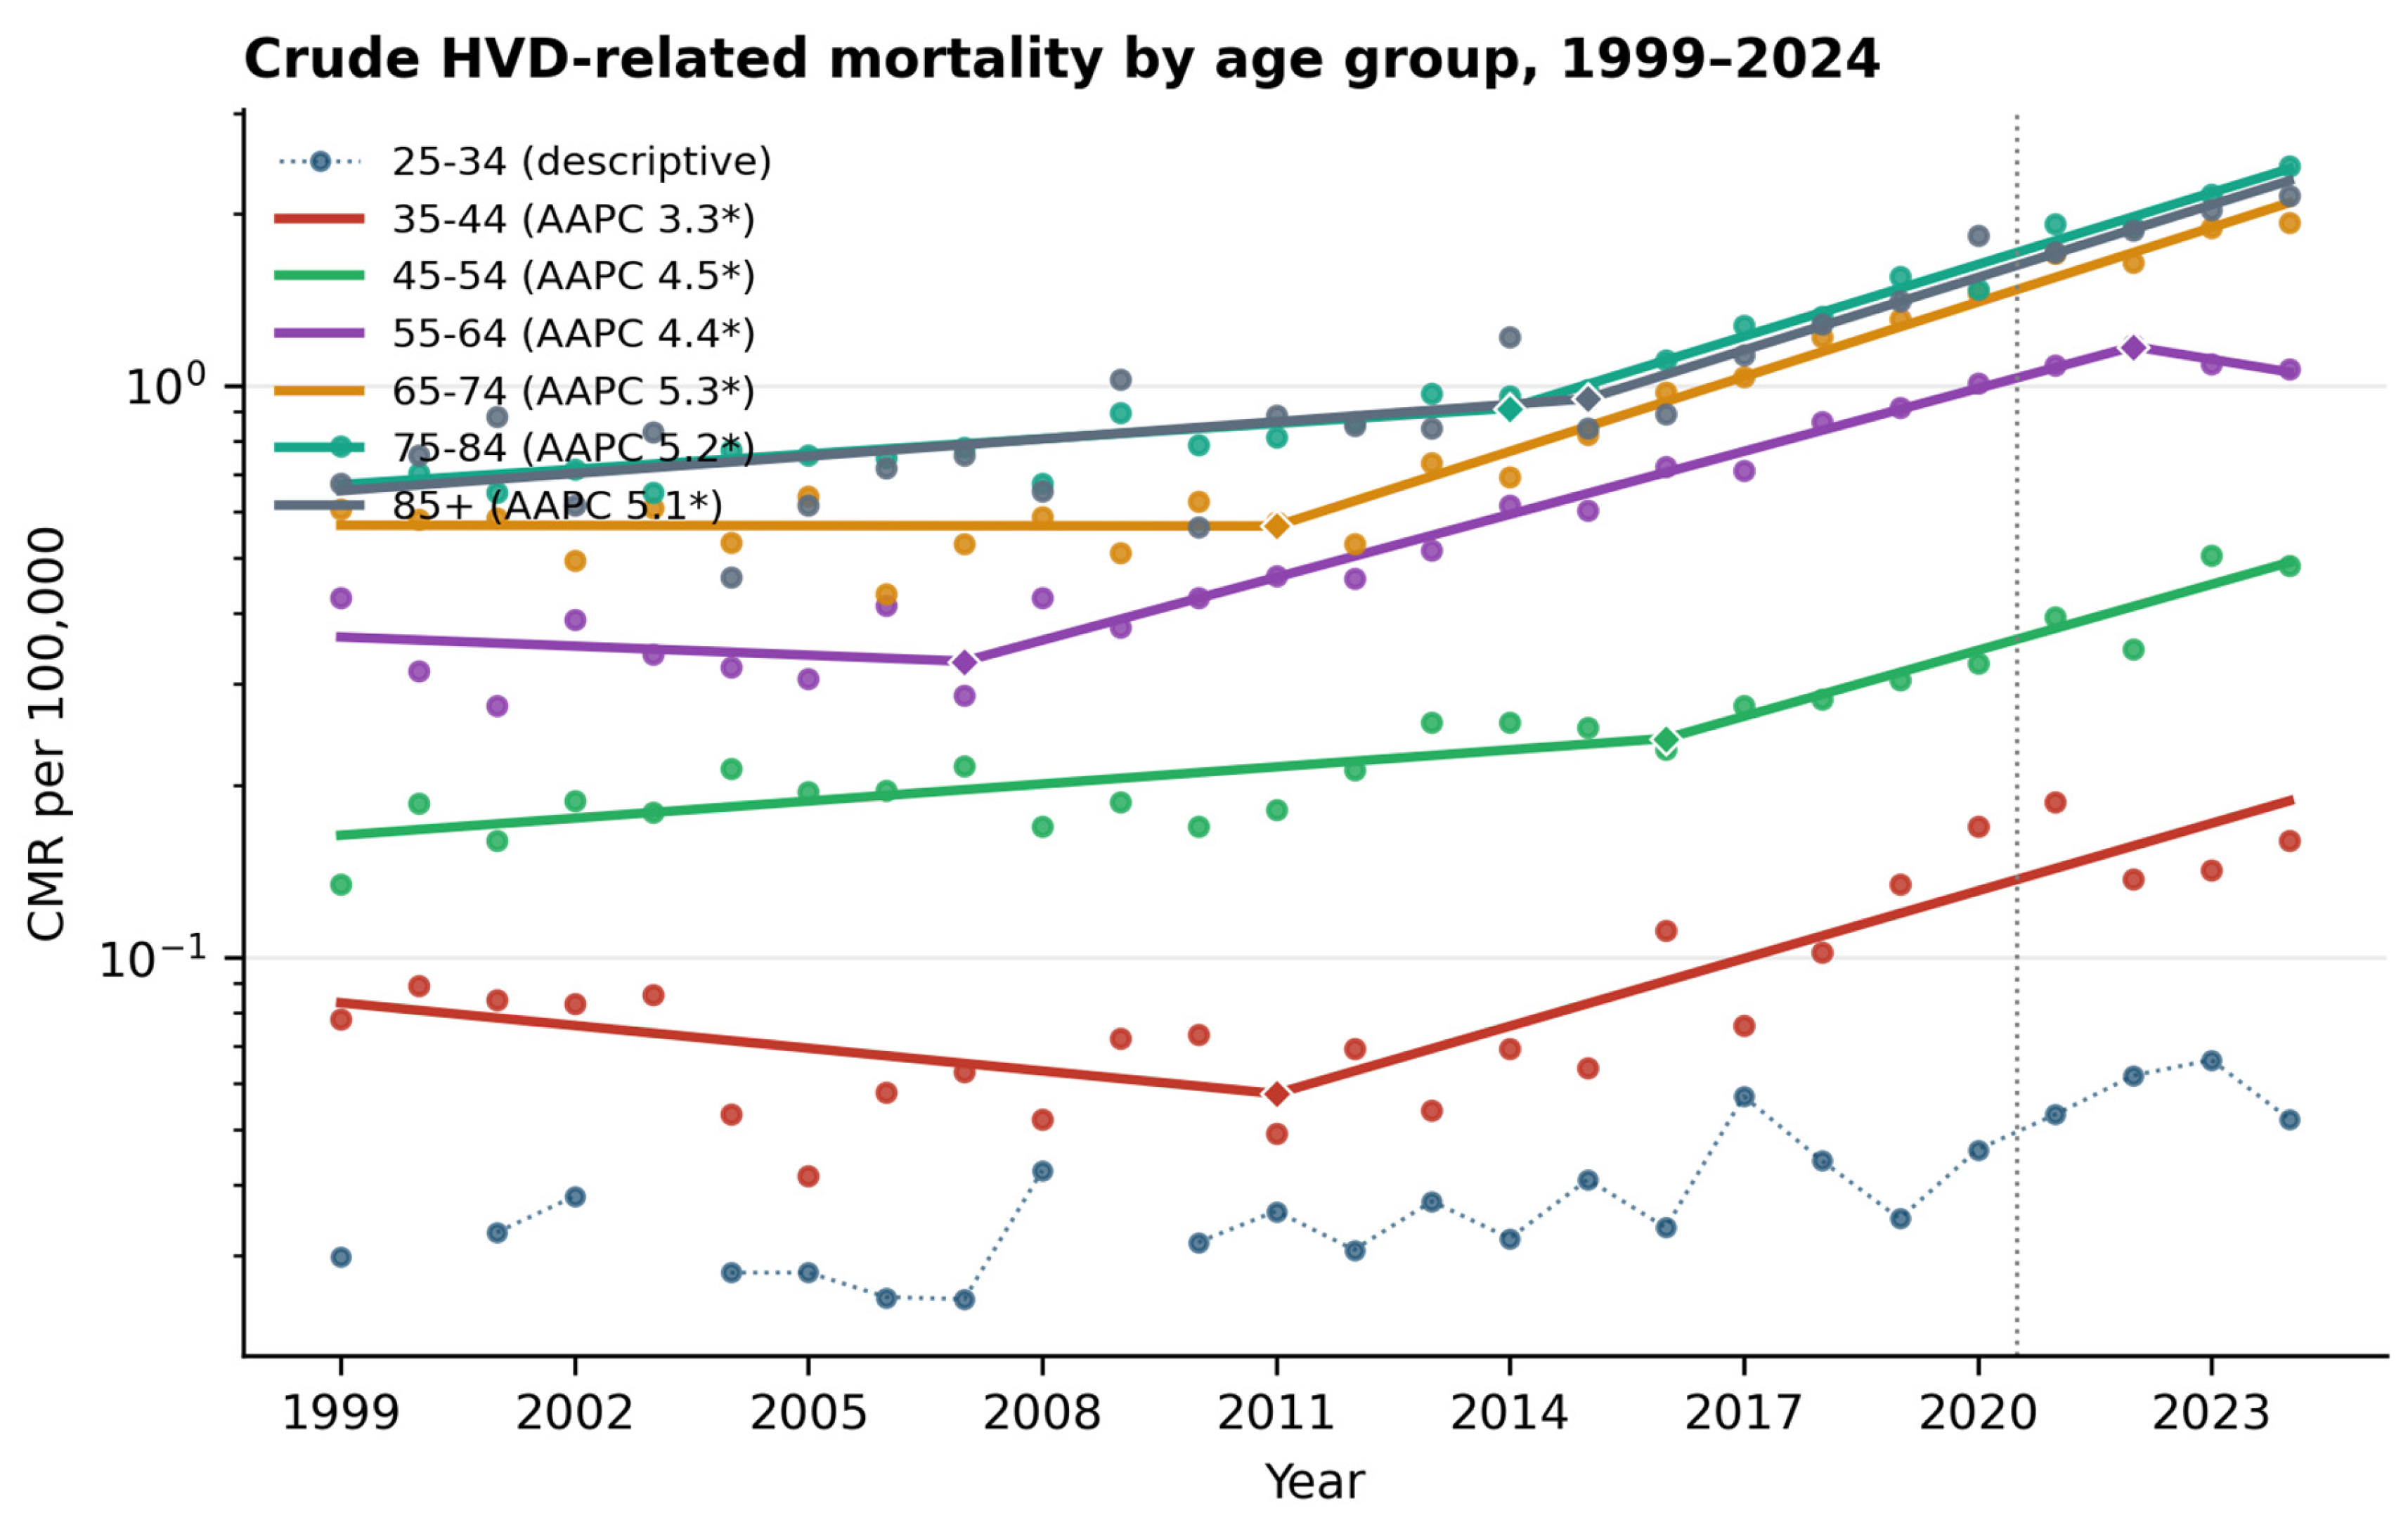
Figure 3.
HVD-related AAMR per 100,000 population by harmonized race/ethnicity, United States, 1999-2024. NH indicates non-Hispanic. Bridged-race and single-race categories were harmonized as specified in Methods.
Figure 3.
HVD-related AAMR per 100,000 population by harmonized race/ethnicity, United States, 1999-2024. NH indicates non-Hispanic. Bridged-race and single-race categories were harmonized as specified in Methods.
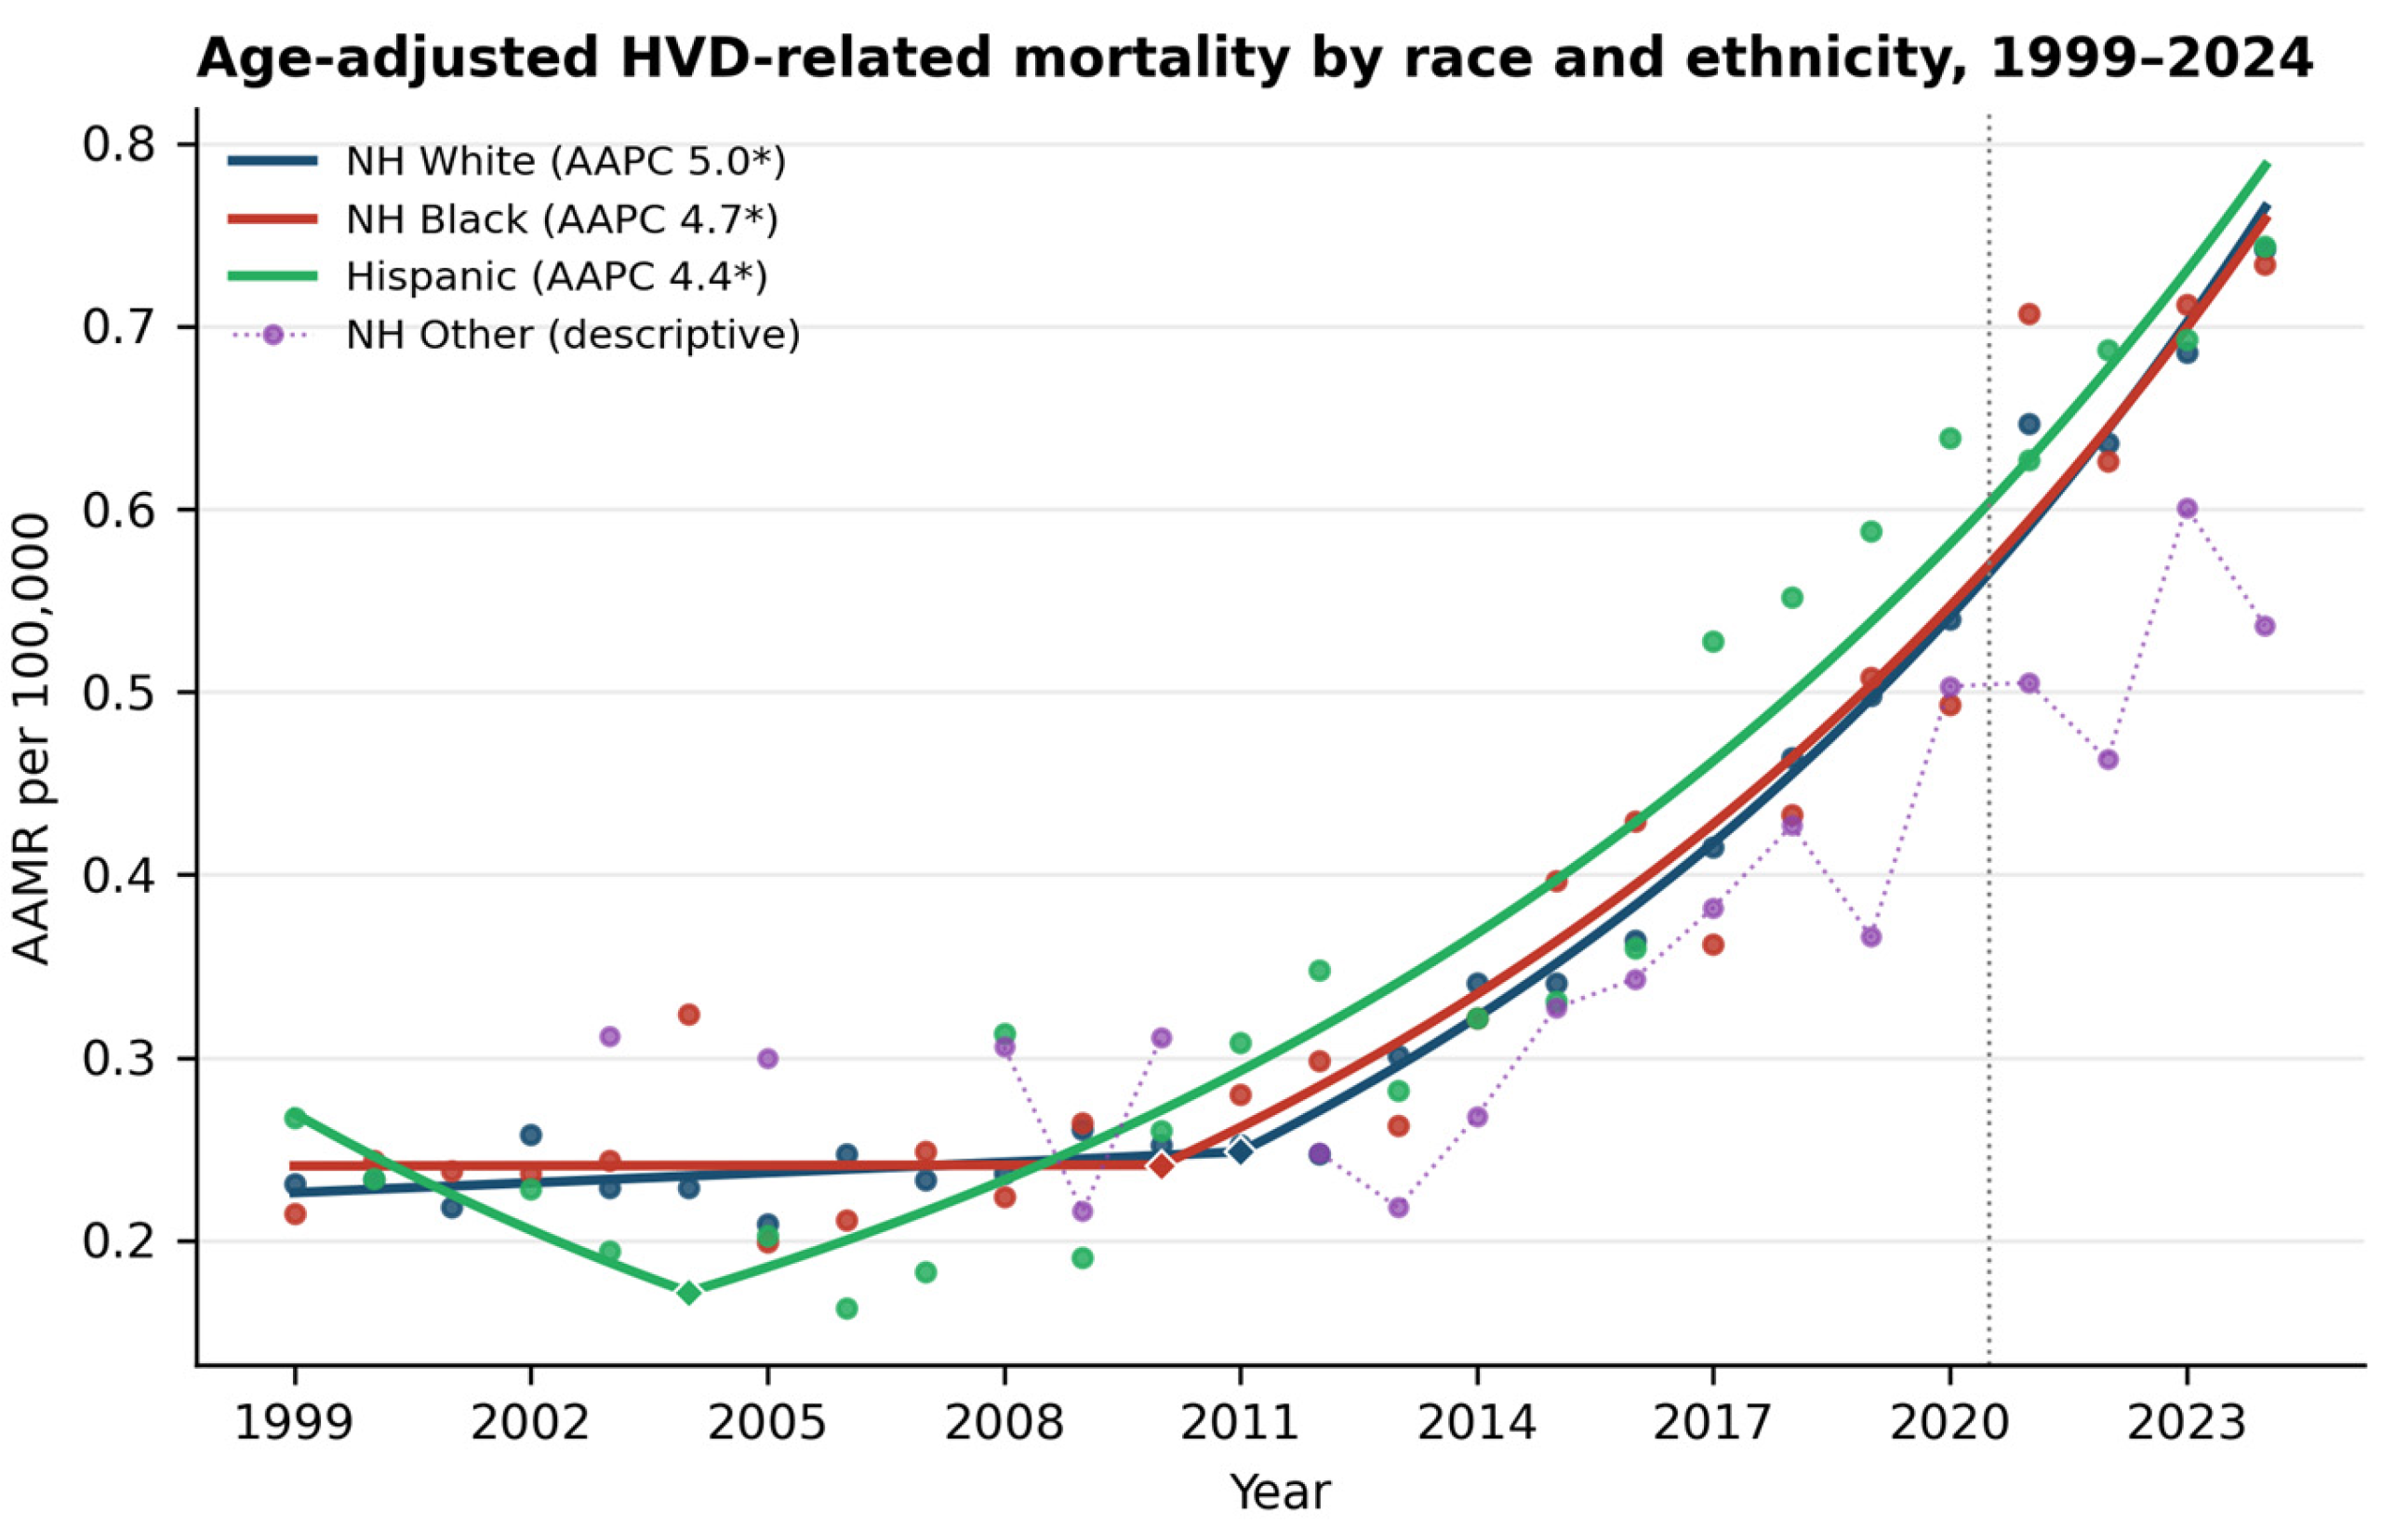
Figure 4.
HVD-related AAMR per 100,000 population by US Census region, 1999-2024.
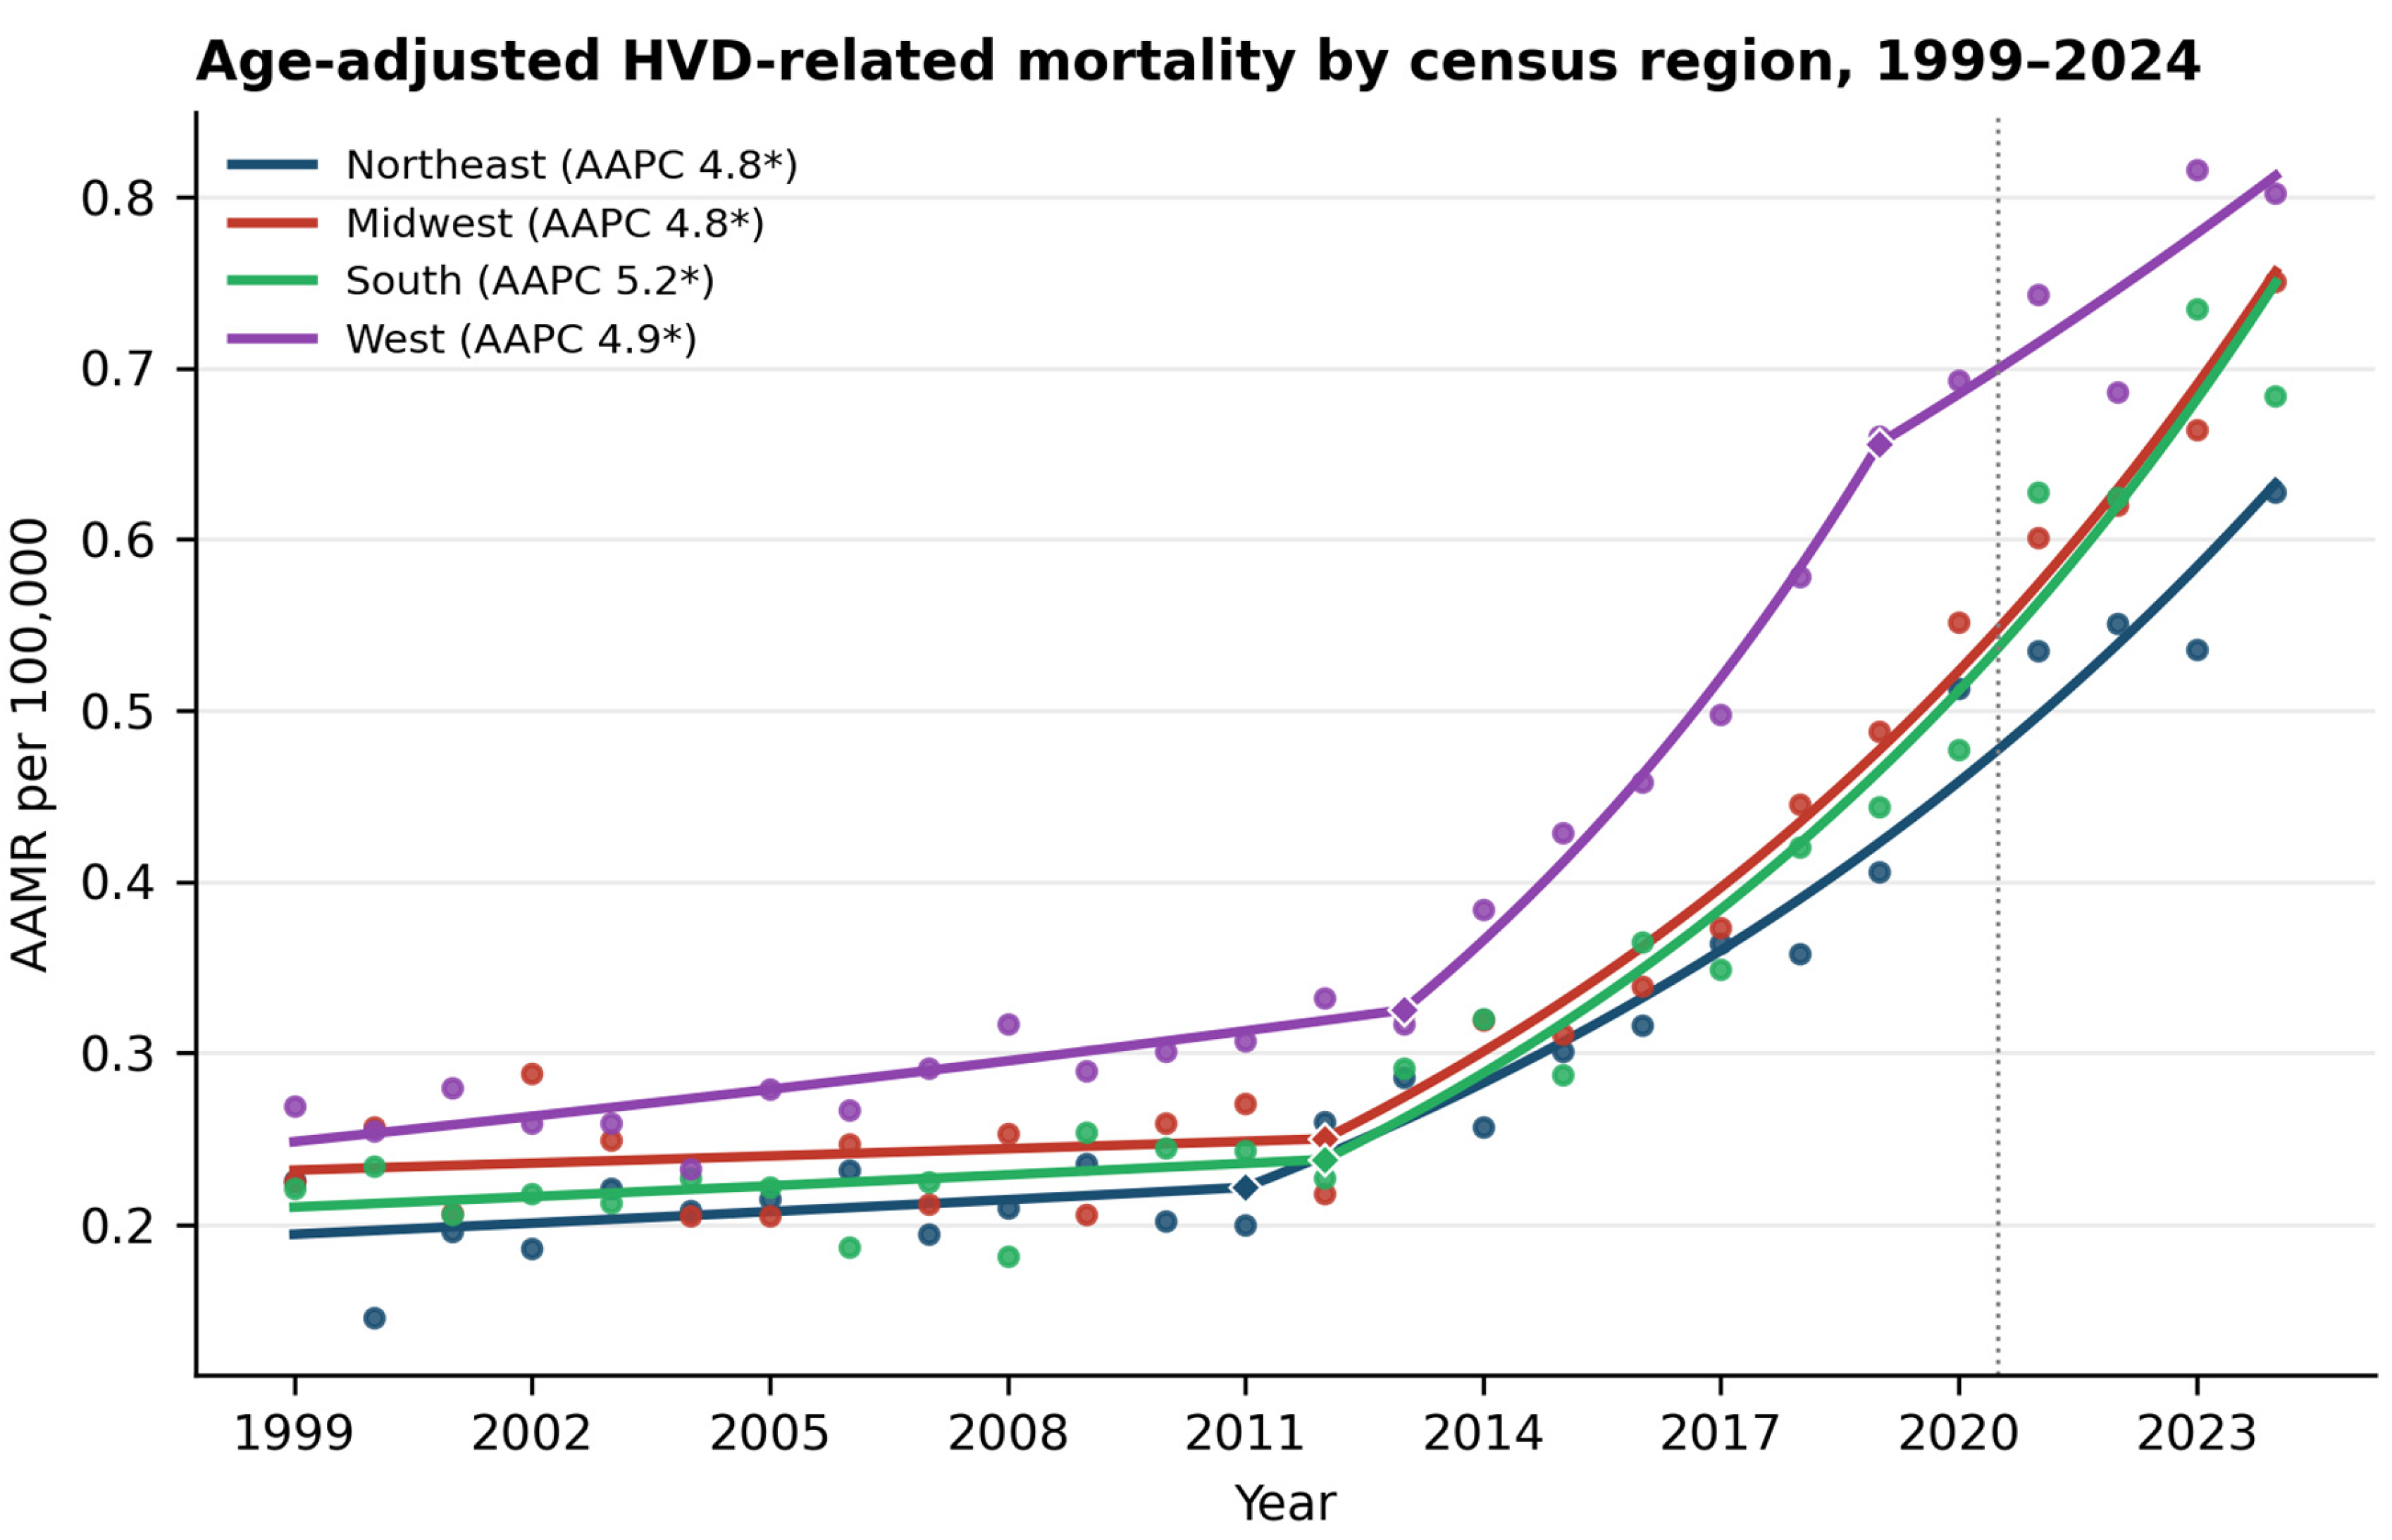
Figure 5.
HVD-related AAMR per 100,000 population by metropolitan versus nonmetropolitan county residence, 1999-2020.
Figure 5.
HVD-related AAMR per 100,000 population by metropolitan versus nonmetropolitan county residence, 1999-2020.
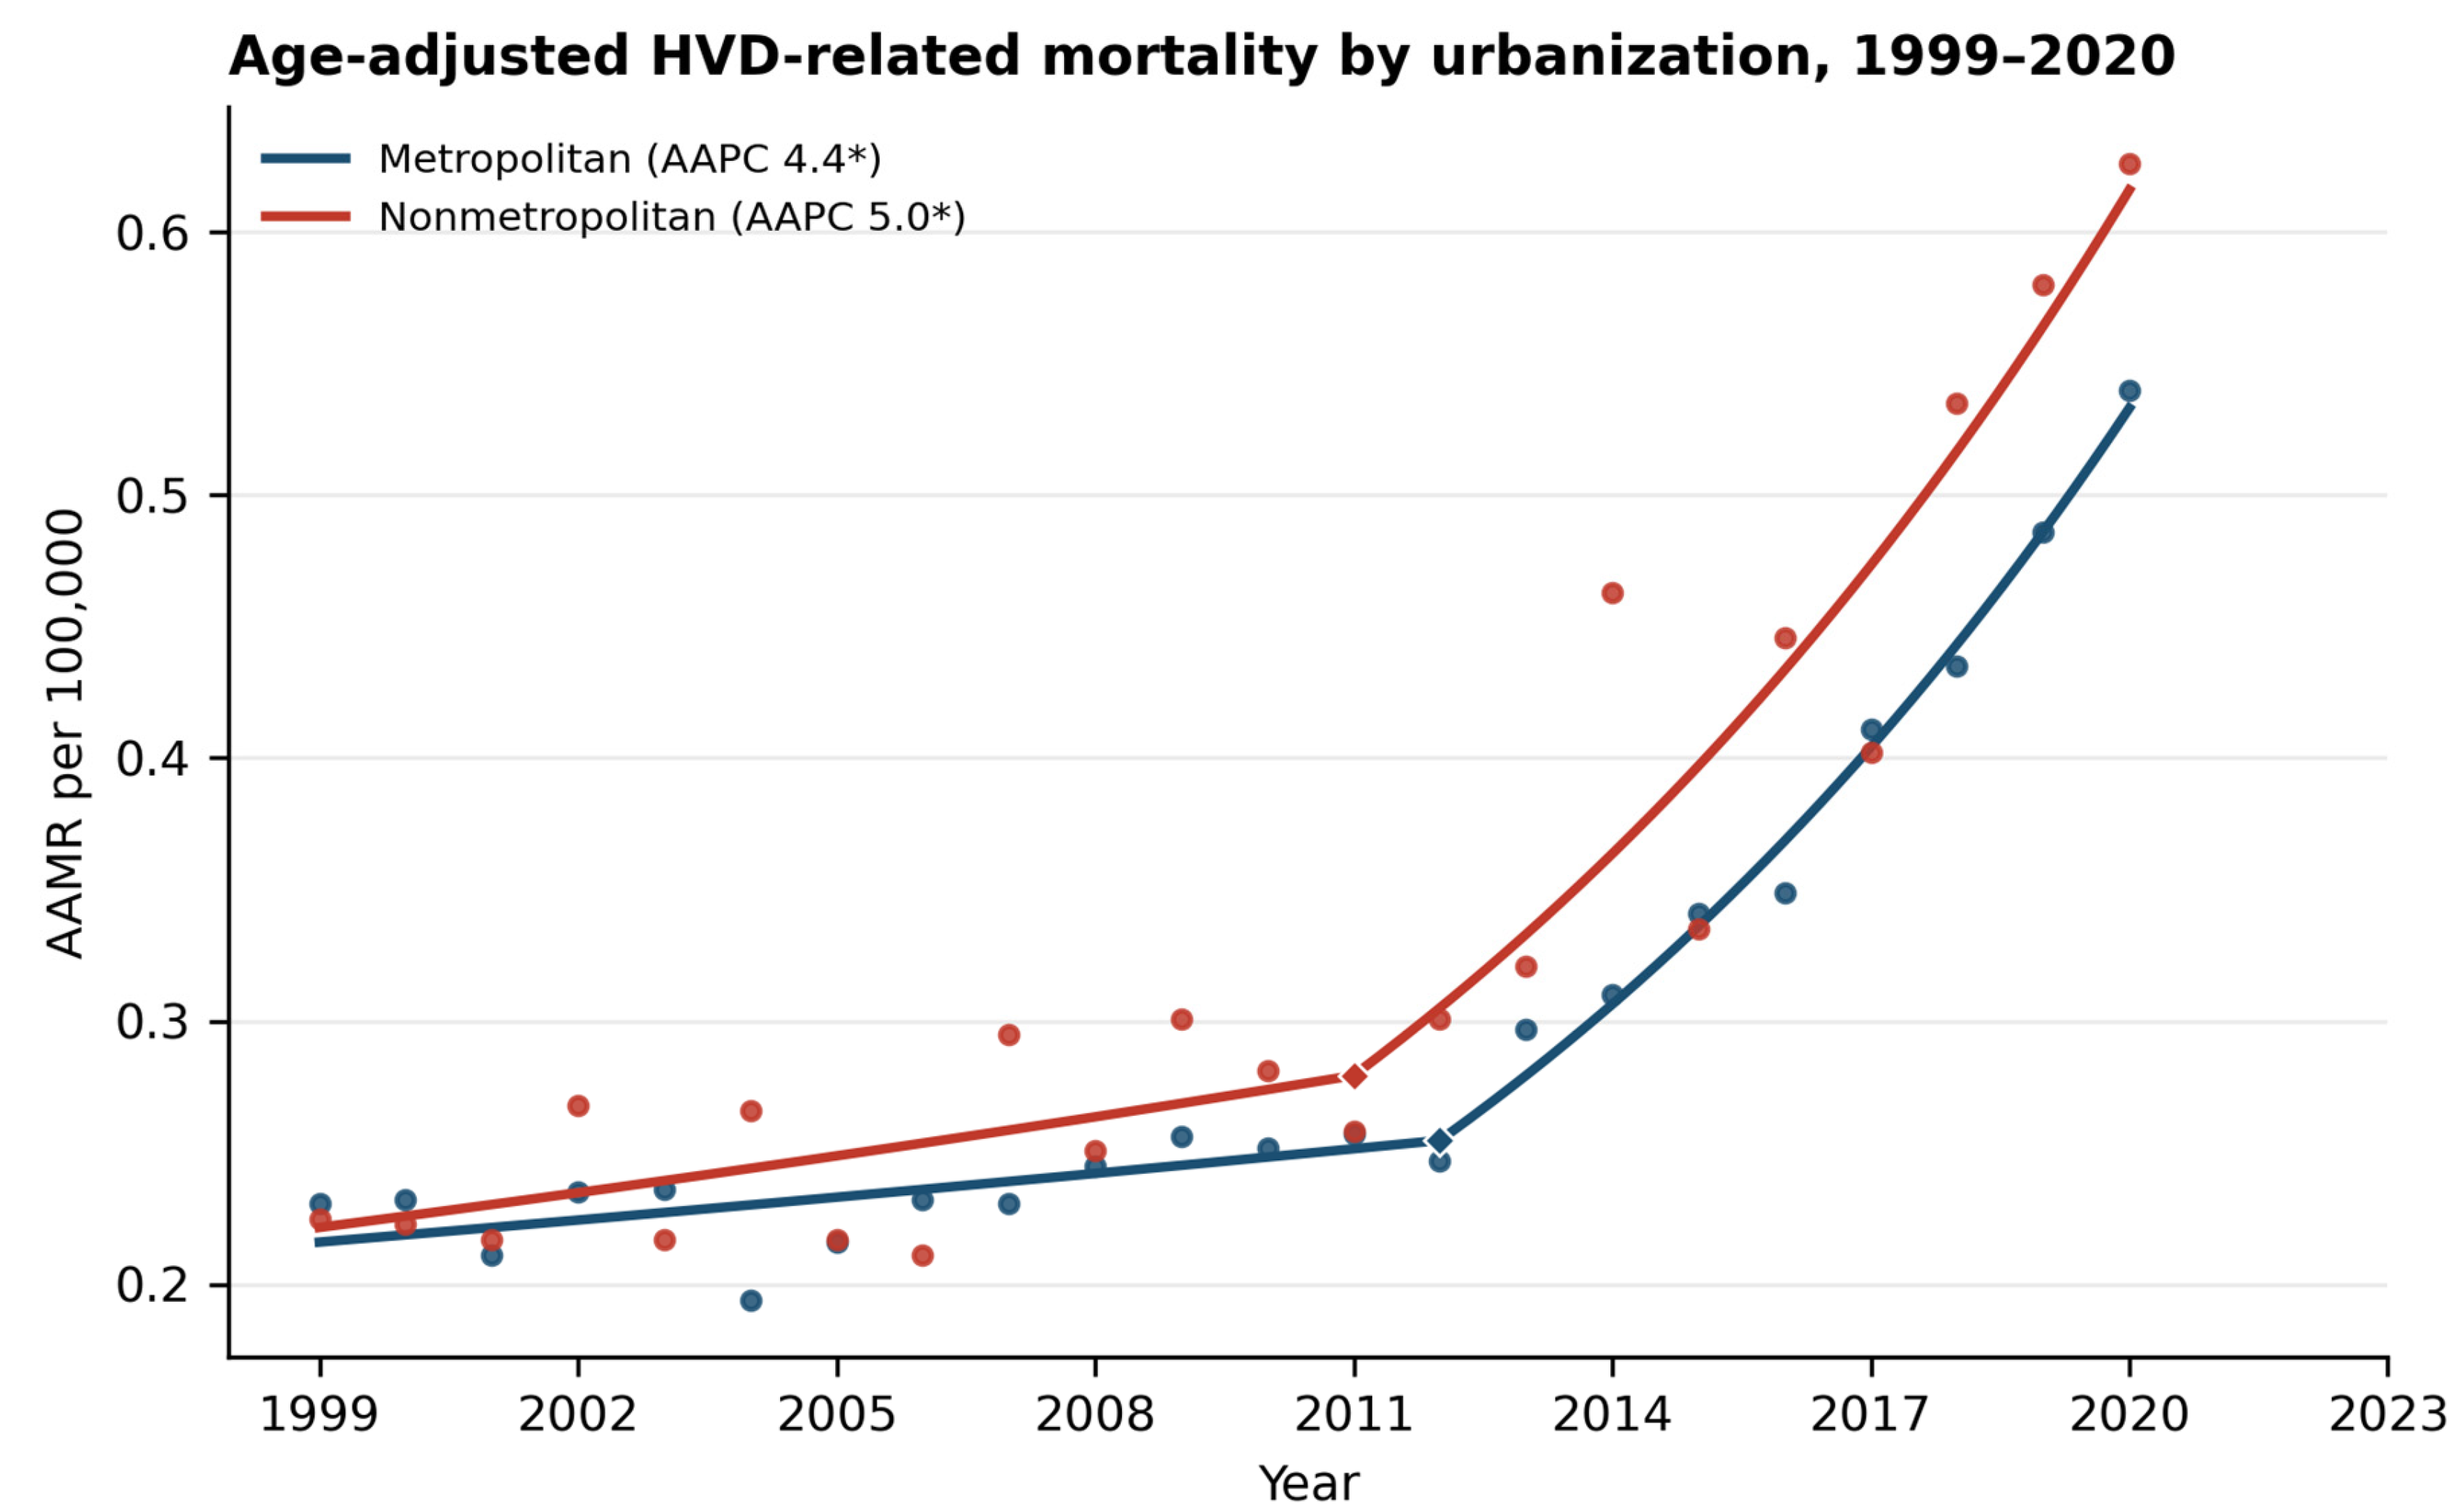
Figure 6.
Mortality trends for individual HVD components. PVT and BCS are displayed using AAMR; hepatic infarction is displayed using CMR because annual age-adjusted estimates were not valid across the series. Sparse components were not modeled.
Figure 6.
Mortality trends for individual HVD components. PVT and BCS are displayed using AAMR; hepatic infarction is displayed using CMR because annual age-adjusted estimates were not valid across the series. Sparse components were not modeled.
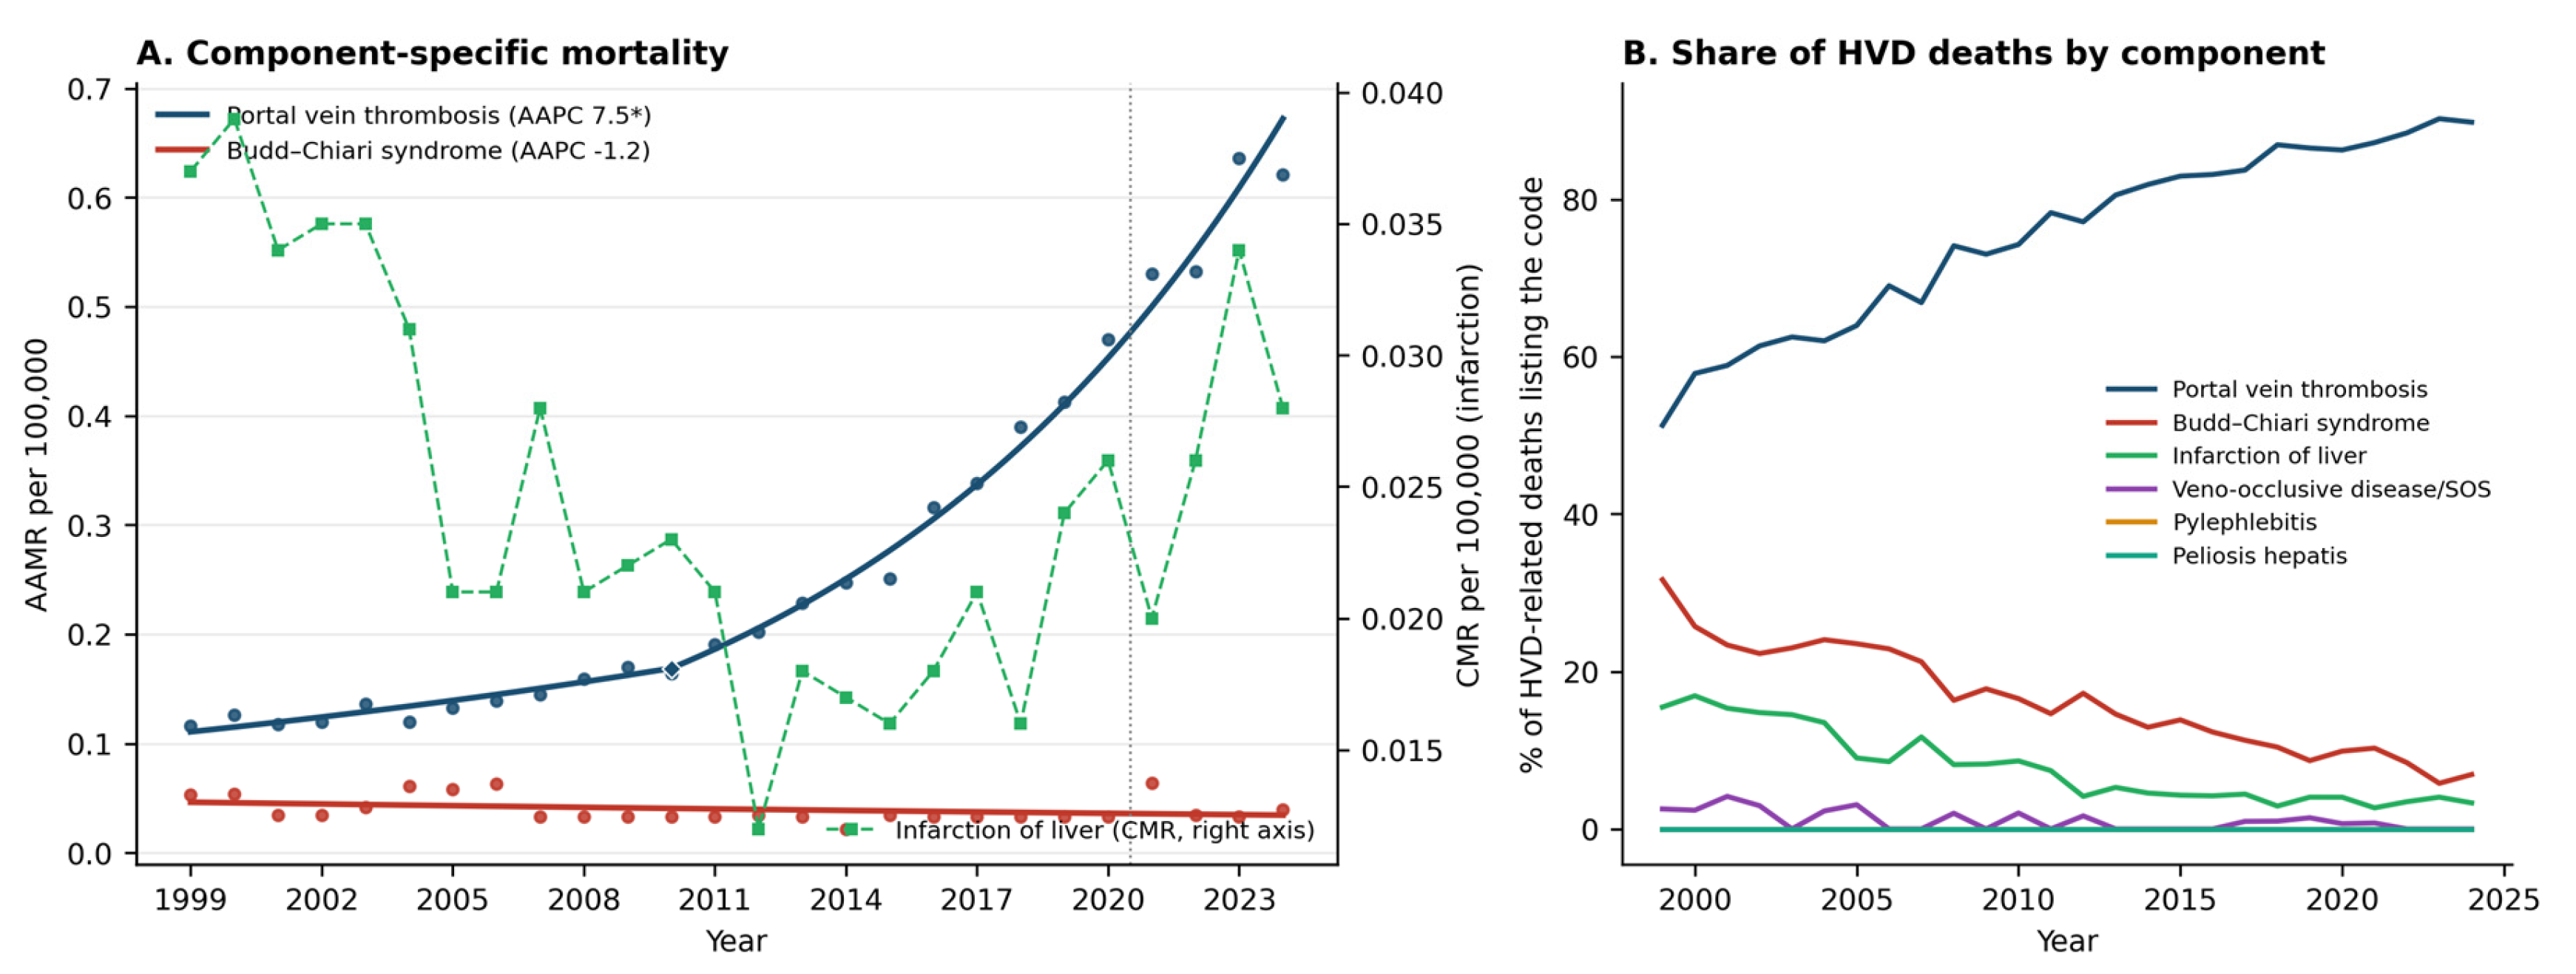
Figure 7.
Mortality trends and proportional burden of major co-listed conditions among HVD-related deaths, including cirrhosis and hepatocellular carcinoma.
Figure 7.
Mortality trends and proportional burden of major co-listed conditions among HVD-related deaths, including cirrhosis and hepatocellular carcinoma.
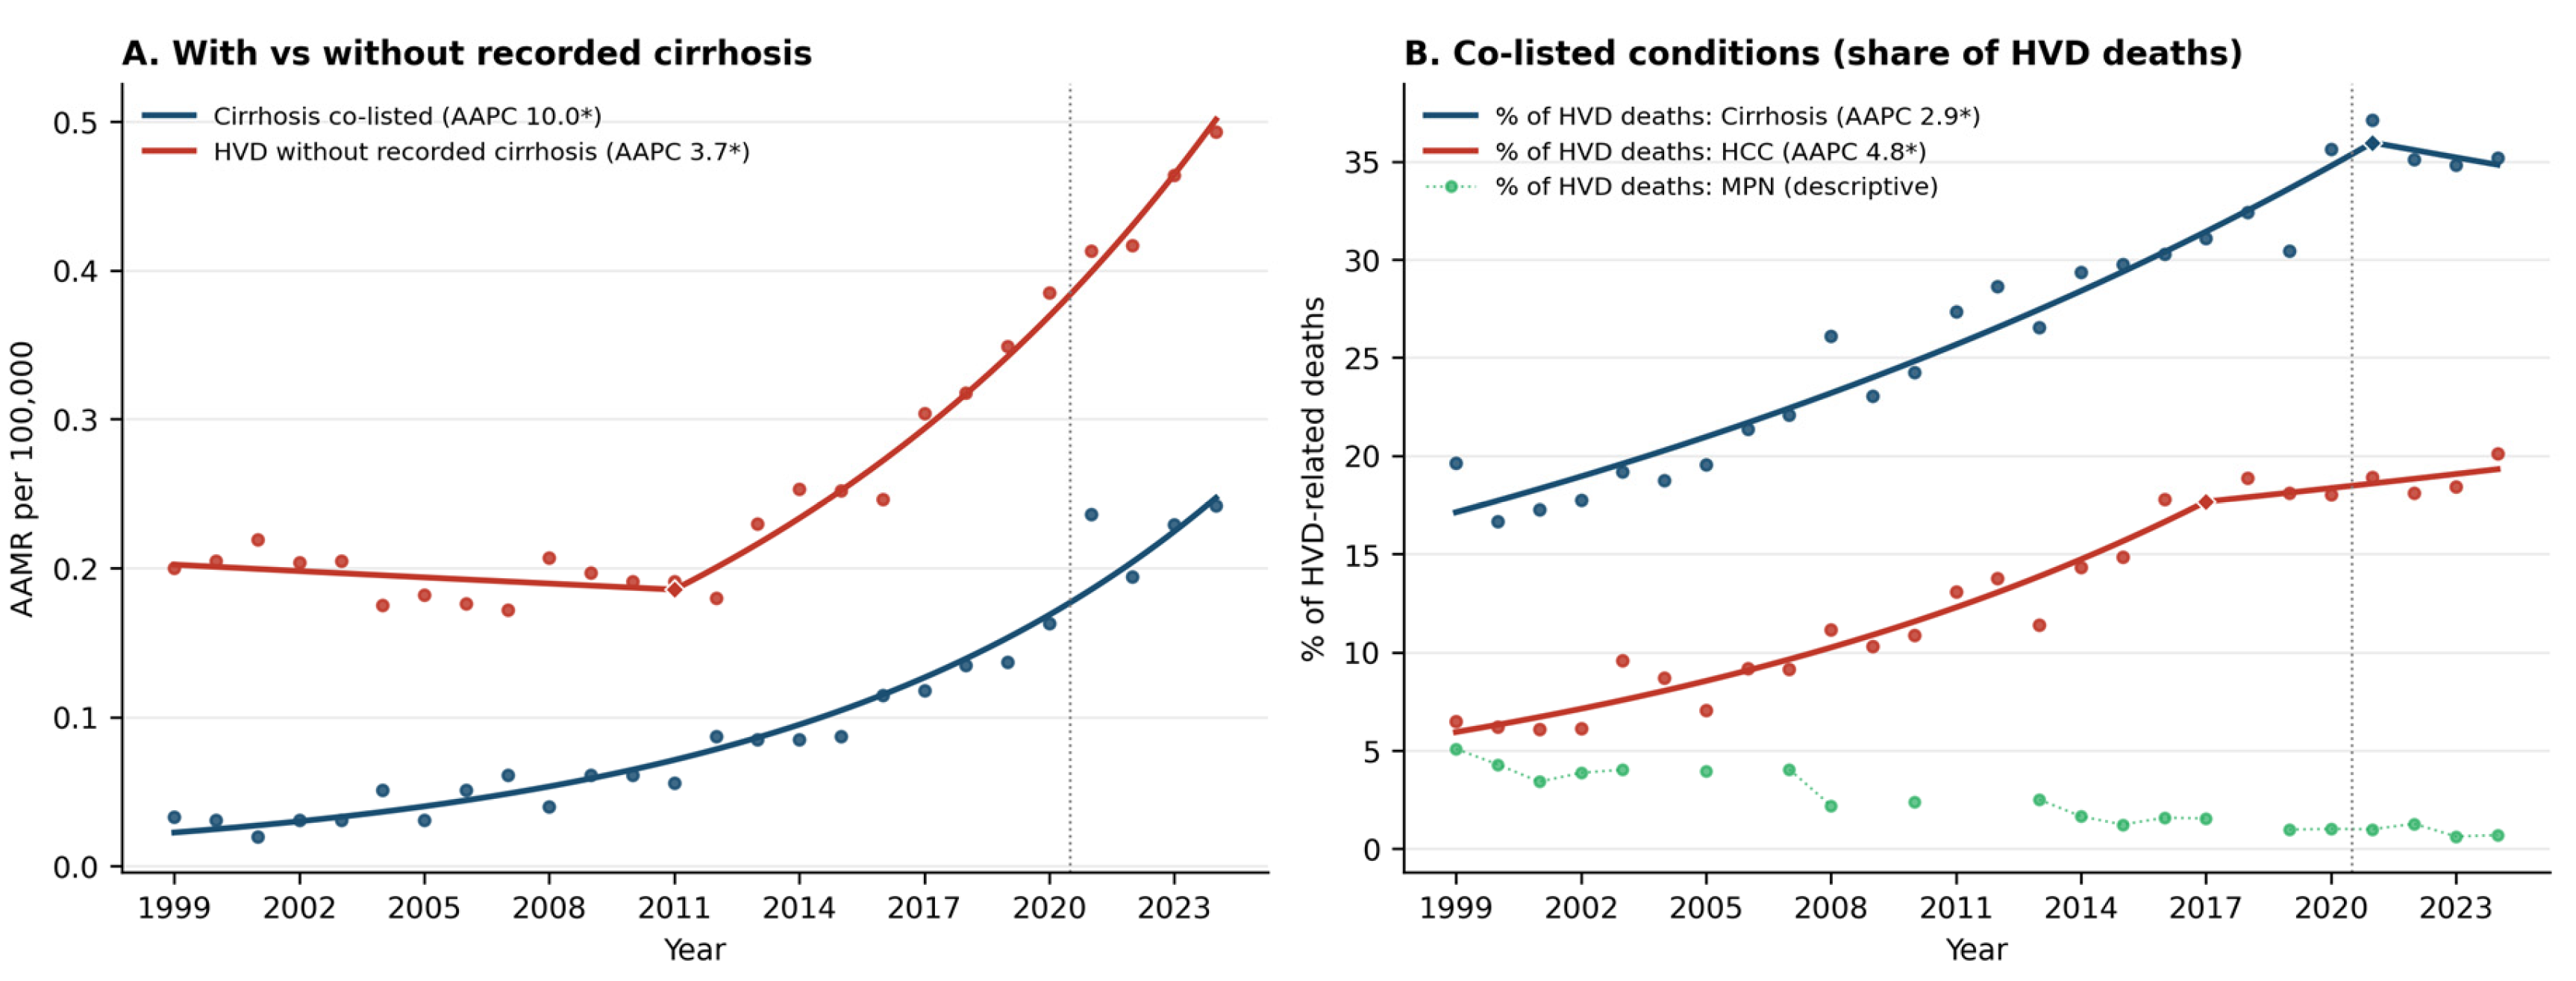

Table 1.
.
| Characteristic | Category | Deaths, n | % of deaths | AAMR per 100,000 (95% CI) | Rate ratio (95% CI) | Note |
|---|---|---|---|---|---|---|
| Overall | All adults ≥25 y | 22,498 | 100.0 | 0.378 (0.373–0.383) | ||
| Sex | Male | 12,747 | 56.7 | 0.464 (0.456–0.473) | 1.52 (1.48–1.56) | |
| Sex | Female | 9,751 | 43.3 | 0.305 (0.299–0.311) | Reference | |
| Race/ethnicity | NH White | 16,535 | 73.5 | 0.372 (0.366–0.378) | Reference | |
| Race/ethnicity | NH Black | 2,397 | 10.7 | 0.392 (0.376–0.409) | 1.05 (1.01–1.10) | |
| Race/ethnicity | Hispanic | 2,394 | 10.6 | 0.434 (0.416–0.452) | 1.17 (1.12–1.22) | |
| Race/ethnicity | NH Other | 1,099 | 4.9 | 0.350 (0.329–0.372) [range 0.349–0.351] | 0.94 (0.88–1.00) | bridged race 1999–2020, single race 2021–2024 |
| Census region | Northeast | 3,653 | 16.2 | 0.325 (0.314–0.336) | Reference | |
| Census region | Midwest | 4,861 | 21.6 | 0.373 (0.362–0.383) | 1.15 (1.10–1.20) | |
| Census region | South | 7,963 | 35.4 | 0.360 (0.352–0.368) | 1.11 (1.06–1.15) | |
| Census region | West | 6,021 | 26.8 | 0.460 (0.448–0.471) | 1.41 (1.36–1.47) | |
| Urbanization | Metropolitan | 12,328 | 81.7 | 0.300 (0.295–0.305) | Reference | 1999–2020 only; WONDER pooled AAMR |
| Urbanization | Nonmetropolitan | 2,764 | 18.3 | 0.339 (0.326–0.352) | 1.13 (1.08–1.18) | 1999–2020 only; WONDER pooled AAMR |
| Age group (crude rate) | 25-34 | 413 | 1.8 | CMR 0.037 (0.034–0.041) | ||
| Age group (crude rate) | 35-44 | 1,009 | 4.5 | CMR 0.091 (0.086–0.097) | ||
| Age group (crude rate) | 45-54 | 2,718 | 12.1 | CMR 0.249 (0.240–0.259) | ||
| Age group (crude rate) | 55-64 | 5,986 | 26.6 | CMR 0.640 (0.624–0.657) | ||
| Age group (crude rate) | 65-74 | 6,459 | 28.7 | CMR 0.997 (0.973–1.021) | ||
| Age group (crude rate) | 75-84 | 4,312 | 19.2 | CMR 1.166 (1.131–1.201) | ||
| Age group (crude rate) | 85+ | 1,601 | 7.1 | CMR 1.107 (1.054–1.163) |
Table 2.
.
| Group | Series | Measure | Value, first year | Value, last year | Years modelled | Joinpoints | Segments: APC (95% CI) | AAPC 1999–2019 | AAPC 2019–2024 | AAPC, full period (95% CI) |
|---|---|---|---|---|---|---|---|---|---|---|
| Overall | Overall | AAMR | 0.233 (1999) | 0.735 (2024) | 26 | 2011 | 1999–2011: 0.85 (-0.37 to 1.78); 2011–2024: 8.87 (8.31 to 9.52)* | 3.98 (3.58 to 4.30)* | 8.87 (8.31 to 9.52)* | 4.94 (4.60 to 5.24)* |
| Sex | Male | AAMR | 0.291 (1999) | 0.853 (2024) | 26 | 2011 | 1999–2011: 1.90 (-0.15 to 3.39); 2011–2024: 8.58 (7.77 to 9.69)* | 4.52 (3.83 to 5.06)* | 8.58 (7.77 to 9.69)* | 5.32 (4.72 to 5.82)* |
| Sex | Female | AAMR | 0.232 (1999) | 0.569 (2024) | 26 | 2010 | 1999–2010: -1.96 (-3.52 to -0.49)*; 2010–2024: 9.35 (8.57 to 10.28)* | 2.98 (2.48 to 3.42)* | 9.35 (8.57 to 10.28)* | 4.22 (3.80 to 4.66)* |
| Age group | 25-34 | CMR | 0.030 (1999) | 0.052 (2024) | not modelled | Descriptive only (3 suppressed / 16 unreliable years) | ||||
| Age group | 35-44 | CMR | 0.078 (1999) | 0.160 (2024) | 26 | 2011 | 1999–2011: -3.01 (-7.56 to 0.09); 2011–2024: 9.50 (7.02 to 13.60)* | 1.82 (0.59 to 2.91)* | 9.50 (7.02 to 13.60)* | 3.31 (2.14 to 4.56)* |
| Age group | 45-54 | CMR | 0.134 (1999) | 0.483 (2024) | 26 | 2016 | 1999–2016: 2.32 (0.71 to 3.46)*; 2016–2024: 9.27 (6.92 to 14.56)* | 3.34 (2.57 to 3.95)* | 9.27 (6.92 to 13.22)* | 4.50 (3.78 to 5.19)* |
| Age group | 55-64 | CMR | 0.425 (1999) | 1.066 (2024) | 26 | 2007, 2022 | 1999–2007: -1.21 (-5.17 to 1.71); 2007–2022: 8.82 (8.08 to 10.17)*; 2022–2024: -5.01 (-9.68 to 3.62) | 4.69 (3.88 to 5.51)* | 3.06 (1.08 to 5.40)* | 4.36 (3.67 to 5.07)* |
| Age group | 65-74 | CMR | 0.608 (1999) | 1.924 (2024) | 26 | 2011 | 1999–2011: -0.02 (-2.13 to 1.66); 2011–2024: 10.54 (9.59 to 11.73)* | 4.07 (3.47 to 4.67)* | 10.54 (9.59 to 11.73)* | 5.34 (4.80 to 5.87)* |
| Age group | 75-84 | CMR | 0.785 (1999) | 2.420 (2024) | 26 | 2014 | 1999–2014: 2.07 (1.06 to 2.85)*; 2014–2024: 10.13 (8.97 to 11.40)* | 4.03 (3.59 to 4.45)* | 10.13 (8.97 to 11.40)* | 5.22 (4.86 to 5.62)* |
| Age group | 85+ | CMR | 0.674 (1999) | 2.144 (2024) | 26 | 2015 | 1999–2015: 2.34 (-0.13 to 4.09); 2015–2024: 10.25 (7.53 to 15.76)* | 3.88 (2.80 to 4.72)* | 10.25 (7.53 to 15.07)* | 5.12 (4.13 to 6.11)* |
| Race/ethnicity | NH White | AAMR | 0.231 (1999) | 0.742 (2024) | 26 | 2011 | 1999–2011: 0.79 (-0.36 to 1.73); 2011–2024: 9.03 (8.45 to 9.74)* | 4.01 (3.64 to 4.33)* | 9.03 (8.45 to 9.74)* | 4.99 (4.65 to 5.30)* |
| Race/ethnicity | NH Black | AAMR | 0.215 (1999) | 0.734 (2024) | 26 | 2010 | 1999–2010: 0.02 (-3.35 to 2.31); 2010–2024: 8.53 (7.39 to 10.05)* | 3.76 (2.75 to 4.60)* | 8.53 (7.39 to 10.05)* | 4.70 (3.86 to 5.47)* |
| Race/ethnicity | Hispanic | AAMR | 0.267 (1999) | 0.744 (2024) | 25 | 2004 | 1999–2004: -8.62 (-23.86 to 1.24); 2004–2024: 7.91 (7.03 to 9.17)* | 3.52 (1.75 to 5.14)* | 7.91 (7.03 to 9.17)* | 4.38 (2.98 to 5.79)* |
| Race/ethnicity | NH Other | AAMR | — | 0.536 (2024) | not modelled | Descriptive only (1 suppressed / 7 unreliable years) | ||||
| Census region | Northeast | AAMR | 0.226 (1999) | 0.628 (2024) | 26 | 2011 | 1999–2011: 1.10 (-1.31 to 2.72); 2011–2024: 8.40 (7.35 to 9.83)* | 3.96 (3.28 to 4.57)* | 8.40 (7.35 to 9.83)* | 4.83 (4.25 to 5.42)* |
| Census region | Midwest | AAMR | 0.225 (1999) | 0.751 (2024) | 26 | 2012 | 1999–2012: 0.58 (-1.23 to 2.01); 2012–2024: 9.66 (8.47 to 11.06)* | 3.67 (3.08 to 4.23)* | 9.66 (8.47 to 11.06)* | 4.84 (4.31 to 5.37)* |
| Census region | South | AAMR | 0.221 (1999) | 0.684 (2024) | 26 | 2012 | 1999–2012: 0.96 (-1.25 to 2.40); 2012–2024: 10.04 (8.85 to 11.50)* | 4.04 (3.39 to 4.64)* | 10.04 (8.85 to 11.50)* | 5.22 (4.62 to 5.75)* |
| Census region | West | AAMR | 0.269 (1999) | 0.802 (2024) | 26 | 2013, 2019 | 1999–2013: 1.94 (1.01 to 2.74)*; 2013–2019: 12.41 (10.37 to 17.21)*; 2019–2024: 4.37 (1.99 to 6.11)* | 4.98 (4.44 to 5.37)* | 4.37 (3.11 to 6.27)* | 4.85 (4.49 to 5.19)* |
| Urbanization | Metropolitan | AAMR | 0.231 (1999) | 0.540 (2020) | 22 | 2012 | 1999–2012: 1.27 (0.33 to 2.09)*; 2012–2020: 9.67 (8.49 to 11.22)* | 4.14 (3.77 to 4.47)* | — | 4.39 (4.02 to 4.73)* |
| Urbanization | Nonmetropolitan | AAMR | 0.225 (1999) | 0.626 (2020) | 22 | 2011 | 1999–2011: 1.95 (-1.29 to 3.68); 2011–2020: 9.19 (7.07 to 13.56)* | 4.78 (3.93 to 5.62)* | — | 4.99 (4.12 to 5.95)* |
| HVD component | Portal vein thrombosis | AAMR | 0.116 (1999) | 0.621 (2024) | 26 | 2010 | 1999–2010: 3.90 (2.03 to 5.23)*; 2010–2024: 10.37 (9.79 to 11.07)* | 6.76 (6.29 to 7.26)* | 10.37 (9.79 to 11.07)* | 7.48 (7.08 to 7.90)* |
| HVD component | Budd–Chiari syndrome | AAMR | 0.053 (1999) | 0.040 (2024) | 26 | none | 1999–2024: -1.17 (-2.54 to 0.22) | -1.17 (-2.54 to 0.22) | -1.17 (-2.54 to 0.22) | -1.17 (-2.54 to 0.22) |
| HVD component | Infarction of liver | CMR (AAMR invalid) | 0.037 (1999) | 0.028 (2024) | 26 | 2014 | 1999–2014: -5.96 (-7.64 to -4.64)*; 2014–2024: 6.87 (3.90 to 11.04)* | -2.91 (-3.69 to -2.18)* | 6.87 (3.90 to 11.04)* | -1.03 (-1.81 to -0.31)* |
| HVD component | Veno-occlusive disease/SOS | CMR (AAMR invalid) | 0.006 (1999) | — | not modelled | Descriptive only (12 suppressed / 14 unreliable years) | ||||
| HVD component | Pylephlebitis | CMR (AAMR invalid) | — | — | not modelled | Descriptive only (21 suppressed / 5 unreliable years) | ||||
| HVD component | Peliosis hepatis | CMR (AAMR invalid) | — | — | not modelled | Descriptive only (23 suppressed / 3 unreliable years) | ||||
| Co-listed condition | Cirrhosis co-listed | AAMR | 0.033 (1999) | 0.242 (2024) | 26 | none | 1999–2024: 10.03 (9.16 to 10.94)* | 10.03 (9.16 to 10.94)* | 10.03 (9.16 to 10.94)* | 10.03 (9.16 to 10.94)* |
| Co-listed condition | HCC co-listed | CMR (AAMR invalid) | 0.016 (1999) | 0.173 (2024) | 26 | 2013, 2018 | 1999–2013: 8.41 (6.62 to 9.77)*; 2013–2018: 20.01 (15.80 to 27.81)*; 2018–2024: 8.94 (5.72 to 10.97)* | 11.23 (10.37 to 11.97)* | 8.94 (6.61 to 10.97)* | 10.76 (10.08 to 11.37)* |
| Co-listed condition | MPN co-listed | CMR (AAMR invalid) | 0.012 (1999) | 0.006 (2024) | not modelled | Descriptive only (6 suppressed / 18 unreliable years) | ||||
| Co-listed condition | HVD without recorded cirrhosis | AAMR | 0.200 (1999) | 0.493 (2024) | 26 | 2011 | 1999–2011: -0.72 (-2.01 to 0.24); 2011–2024: 7.94 (7.22 to 8.76)* | 2.66 (2.29 to 3.03)* | 7.94 (7.22 to 8.76)* | 3.70 (3.36 to 4.03)* |
| Co-listed share | % of HVD deaths: Cirrhosis | % of HVD deaths | 19.630 (1999) | 35.210 (2024) | 26 | 2021 | 1999–2021: 3.43 (3.13 to 3.89)*; 2021–2024: -1.06 (-4.51 to 1.64) | 3.43 (3.13 to 3.85)* | 0.71 (-0.44 to 1.78) | 2.88 (2.59 to 3.24)* |
| Co-listed share | % of HVD deaths: HCC | % of HVD deaths | 6.467 (1999) | 20.099 (2024) | 26 | 2017 | 1999–2017: 6.24 (5.44 to 7.46)*; 2017–2024: 1.29 (-0.75 to 2.64) | 5.74 (5.21 to 6.42)* | 1.29 (-0.45 to 2.64) | 4.83 (4.35 to 5.42)* |
| Co-listed share | % of HVD deaths: MPN | % of HVD deaths | 5.081 (1999) | 0.691 (2024) | not modelled | Descriptive only (6 suppressed / 18 unreliable years) | ||||
| Sensitivity | S1 broad definition | AAMR | 1.024 (1999) | 1.709 (2024) | 26 | 2009, 2018, 2021 | 1999–2009: -2.49 (-3.39 to -1.77)*; 2009–2018: 5.04 (3.84 to 5.77)*; 2018–2021: 12.50 (9.33 to 14.40)*; 2021–2024: 0.70 (-2.27 to 2.79) | 1.55 (1.32 to 1.82)* | 5.26 (4.17 to 6.18)* | 2.28 (2.05 to 2.50)* |
| Sensitivity | S2 + ischemic hepatitis | AAMR | 0.233 (1999) | 0.737 (2024) | 26 | 2011 | 1999–2011: 0.99 (-0.30 to 1.89); 2011–2024: 8.76 (8.16 to 9.47)* | 4.03 (3.62 to 4.37)* | 8.76 (8.16 to 9.47)* | 4.96 (4.61 to 5.27)* |
| Sensitivity | S3 underlying cause only | AAMR | 0.062 (1999) | 0.085 (2024) | 26 | none | 1999–2024: 1.15 (0.26 to 2.04)* | 1.15 (0.26 to 2.04)* | 1.15 (0.26 to 2.04)* | 1.15 (0.26 to 2.04)* |
| Sensitivity | S4 excluding PVT | AAMR | 0.139 (1999) | 0.080 (2024) | 26 | 2015 | 1999–2015: -4.24 (-6.84 to -2.67)*; 2015–2024: 6.36 (2.40 to 14.45)* | -2.21 (-3.28 to -1.42)* | 6.36 (2.40 to 13.87)* | -0.55 (-1.62 to 0.60) |
| Sensitivity | S5 D157 only (2018–2024) | AAMR | 0.453 (2018) | 0.735 (2024) | 7 | none | 2018–2024: 8.26 (6.46 to 10.11)* | — | 8.26 (6.46 to 10.11)* | 8.26 (6.46 to 10.11)* |
| Sensitivity | S6 1999–2019 | AAMR | 0.233 (1999) | 0.486 (2019) | 21 | 2011 | 1999–2011: 0.81 (-0.01 to 1.58); 2011–2019: 8.75 (7.64 to 10.04)* | 3.92 (3.59 to 4.28)* | — | 3.92 (3.59 to 4.28)* |
| Sensitivity (race) | S5 NH White (D157 only) | AAMR | 0.474 (2018) | 0.742 (2024) | 7 | none | 2018–2024: 7.71 (6.24 to 9.14)* | — | 7.71 (6.24 to 9.14)* | 7.71 (6.24 to 9.14)* |
| Sensitivity (race) | S5 NH Black (D157 only) | AAMR | 0.468 (2018) | 0.734 (2024) | 7 | none | 2018–2024: 7.75 (4.60 to 11.27)* | — | 7.75 (4.60 to 11.27)* | 7.75 (4.60 to 11.27)* |
| Sensitivity (race) | S5 Hispanic (D157 only) | AAMR | 0.552 (2018) | 0.744 (2024) | 7 | none | 2018–2024: 4.69 (3.87 to 5.50)* | — | 4.69 (3.87 to 5.50)* | 4.69 (3.87 to 5.50)* |
| Sensitivity (race) | S5 NH Other (D157 only) | AAMR | 0.368 (2018) | 0.536 (2024) | 7 | none | 2018–2024: 8.07 (3.70 to 12.93)* | — | 8.07 (3.70 to 12.93)* | 8.07 (3.70 to 12.93)* |
Disclaimer/Publisher’s Note: The statements, opinions and data contained in all publications are solely those of the individual author(s) and contributor(s) and not of MDPI and/or the editor(s). MDPI and/or the editor(s) disclaim responsibility for any injury to people or property resulting from any ideas, methods, instructions or products referred to in the content. |
© 2026 by the authors. Licensee MDPI, Basel, Switzerland. This article is an open access article distributed under the terms and conditions of the Creative Commons Attribution (CC BY) license (http://creativecommons.org/licenses/by/4.0/).
Copyright: This open access article is published under a Creative Commons CC BY 4.0 license, which permit the free download, distribution, and reuse, provided that the author and preprint are cited in any reuse.