

Submitted:
29 September 2026
Posted:
30 September 2026
You are already at the latest version
Abstract
Breath-by-breath gas exchange is required to characterise the oxygen uptake (V̇O₂) response at exercise onset, limiting repeated assessment outside the laboratory. In this single-centre study, 36 collegiate athletes completed an incremental cycling test and two 30-min constant-load tests at 60–70% of peak work rate, at least 7 days apart, while sweat lactate was recorded continuously from the upper arm with a wearable biosensor. We examined whether the time to peak sweat lactate (sLApeak time) was associated with two indices of that response — the phase 2 time constant (τ), a rate parameter, and the time to the software-defined end of phase 2 (fin2), a duration marker — and whether any association was reproduced on a separate day. sLApeak time showed moderate-to-strong correlations with fin2 at both tests (r = 0.63 and 0.69), stronger and more consistent than its correlations with τ (r = 0.44 and 0.32), and fin2 remained independently associated after adjustment for τ and peak V̇O₂. In contrast, sLApeak time was only weakly correlated with the accumulated oxygen deficit (r = 0.33 and 0.34). Continuous sweat lactate monitoring may therefore provide a field-deployable marker of the duration of the exercise-onset transition, rather than of its rate or its magnitude.
Keywords:
sweat lactate
; wearable biosensor
; oxygen uptake kinetics
; exercise-onset transition
; constant-load exercise
; eccrine sweat gland
1. Introduction
For athletes and coaches, the value of a physiological assessment depends not only on what it measures but on how often it can be repeated: training loads are adjusted weekly, whereas laboratory assessment of aerobic function is usually possible only a few times per season. An index obtainable during ordinary training, without a face mask or a metabolic cart, would therefore address a need that peak oxygen uptake alone does not meet.
Peak oxygen uptake (peak V̇O₂) describes maximal aerobic capacity, whereas the pulmonary V̇O₂ response at exercise onset describes how rapidly oxidative metabolism adapts to a step increase in work rate; the two provide complementary information about aerobic function [1,2,3]. When this adaptation is slow, the non-steady-state period is prolonged and transient reliance on non-oxidative energy provision increases [2]. The phase 2 time constant (τ) is the conventional rate parameter for V̇O₂ kinetics, quantifying how rapidly V̇O₂ rises after the cardiodynamic phase [4,5,6]. In this study, we also examined fin2 (finish of phase 2), the interval from exercise onset to the software-defined end of phase 2 — an operational marker of the transition toward phase 3 that, unlike τ, may additionally be shaped by the phase 1 delay and the amplitude of the primary response; the two measures should not be assumed interchangeable [2,4].
Both τ and fin2 require breath-by-breath gas exchange measurement. In practice, cardiopulmonary exercise testing is difficult to repeat frequently because it requires specialised equipment, trained personnel, and a controlled environment [7,8]. For athletes, the face mask and laboratory setting further limit repeated assessment under training-like conditions. The exercise-onset transition is therefore seldom monitored in the field.
We previously developed a flexible wearable biosensor that records sweat lactate continuously and non-invasively during exercise. During incremental exercise, the sweat lactate threshold shows close agreement with blood and ventilatory thresholds, although the onset of sweating influences threshold identification [9,10,11]. Its behaviour during constant-load exercise is less well understood. Sweat lactate is thought to arise largely from glycolytic metabolism within the eccrine sweat gland rather than directly from plasma, so the signal recorded at the skin surface reflects local production together with secretion, transport, and progressive dilution by rising sweat flow [12,13]. The sudomotor and cutaneous vascular responses that govern this dilution are engaged over the same period in which oxidative metabolism is still adjusting to the new load. The point at which the surface signal turns from rising to falling may therefore mark the end of that transition, so that the timing — rather than the magnitude — of the sweat lactate response could carry information about its duration.
The link to muscle metabolism is nevertheless indirect: sweat lactate is generated locally within the eccrine gland’s secretory cells by anaerobic glycolysis rather than filtered from plasma [12,13], so its concentration cannot be assumed to mirror blood lactate. What connects the two is that gland activity and muscle metabolic rate are driven by the same exercise stimulus — as work rate and whole-body metabolic strain rise, sympathetic cholinergic outflow to the sweat glands intensifies in parallel, increasing both local lactate production and the sweat flow that dilutes it. Sweat and blood lactate consequently rise together across a progressive increase in intensity [14], although they can dissociate when sweat rate or skin temperature changes independently of metabolic rate [15,16] — a pattern more consistent with shared autonomic drive than with direct exchange between compartments. Because V̇O₂ kinetics indexes how quickly oxidative metabolism stabilises after exercise onset, this shared drive gives a physiological basis for expecting the time course of the sweat lactate signal, rather than its absolute concentration, to parallel the time course of the V̇O₂ response.
Beyond its physiological interpretation, establishing a robust, algorithmically defined time-domain feature — sLApeak time — from the continuous output of a wearable electrochemical biosensor is also a signal-processing question relevant to sensor and actuator network design. Unlike the amplitude-based sweat lactate threshold used during incremental exercise, a time-to-peak marker requires no external calibration against blood lactate and can in principle be computed on-device or in near real time from the raw sensor current alone. Demonstrating that this single-sensor, time-domain output tracks an established physiological reference (V̇O₂ kinetics) supports its use as a lightweight feature for continuous, field-deployable athlete-monitoring systems that combine wearable biosensors with automated signal-processing pipelines, rather than requiring laboratory-grade gas-exchange instrumentation for each assessment.
We hypothesised that the time to peak sweat lactate (sLApeak time) during constant-load exercise would be associated with V̇O₂ kinetics and, as a time-domain marker, would relate more closely and consistently to fin2 than to τ. We therefore characterised the sweat lactate time course during constant-load cycling and repeated the protocol on a separate day to test whether the same association was obtained on a second occasion.
2. Materials and Methods
2.1. Study Design
This was a prospective, single-centre observational study conducted at Keio University School of Medicine, Tokyo, Japan, and comprising three exercise testing sessions (Tests 1–3). In Test 1, participants performed an incremental exercise test to determine peak V̇O₂ and peak work rate (peak WR). In Tests 2 and 3, constant-load exercise tests were performed at 60–70% of the peak WR determined in Test 1. The same work-rate profile used in Test 2 was reproduced in Test 3 for each participant. Tests 2 and 3 were separated by at least 7 days; the target was to complete all measurements for each participant within 31 days. Participants were instructed to avoid caffeine, alcohol, and strenuous exercise for 12 h before each session. To reduce observer-related variation, the principal time points were assessed independently by two assessors with third-assessor adjudication.
The study was conducted in accordance with the Declaration of Helsinki and the Ethical Guidelines for Life Science and Medical Research Involving Human Subjects in Japan, was approved by the Institutional Review Board of Keio University School of Medicine (approval number 20251030), and was registered with the University Hospital Medical Information Network Clinical Trials Registry (UMIN000058083). Electronic informed consent was obtained from all participants.
2.2. Participants
Participants were university students belonging to collegiate athletic clubs. They were recruited through direct invitation to their athletic clubs. The inclusion criterion was the ability to complete 30 min of constant-load cycling at the prescribed intensity. Exclusion criteria were investigator-determined unsuitability; inability to complete the protocol because of injury or physical impairment; regular medication for conditions other than allergic disorders, insomnia, or anxiety disorders; and inability to understand the study procedures adequately because of dementia or a psychiatric disorder. Habitual sport or training was recorded using a self-report questionnaire.
2.3. Incremental Exercise Test (Test 1)
Body composition was assessed by bioelectrical impedance analysis (InBody 470, InBody Japan, Tokyo, Japan). Exercise was performed on an electromagnetically braked cycle ergometer (Strength Ergo, Fukuda Denshi, Tokyo, Japan). After 2 min of seated rest, participants completed a 120-s warm-up at 50 W; the work rate then began at 50 W and was increased every 60 s by 25 W in men and 20 W in women. Participants were asked to maintain a cadence of 70 rpm, and the test was terminated at volitional exhaustion or when the target cadence could no longer be sustained. A 3-min recovery period was recorded. Because the work rate was increased in discrete 1-min steps, the protocol is described here as an incremental step test rather than a ramp test.
Pulmonary gas exchange was measured breath-by-breath with a metabolic cart (Aeromonitor AE-301S, Minato Medical Science, Osaka, Japan) and heart rate was monitored continuously with a chest strap monitor (Polar H10, Polar Electro, Kempele, Finland). Peak V̇O₂ was defined as the highest 30-s average V̇O₂. Peak WR was defined as the work rate of the final completed 1-min step. Blood lactate was sampled from earlobe capillary blood with a portable analyser (Lactate Pro 2, ARKRAY, Kyoto, Japan) at rest and during exercise.
2.4. Constant-Load Exercise Tests (Tests 2 and 3)
The same ergometer, metabolic cart, and heart rate monitor were used as in Test 1. After approximately 5 min of warm-up, participants cycled for 30 min at 60 rpm at a work rate corresponding to 60–70% of peak WR, which was intended to elicit approximately 70–80% of peak V̇O₂ (the values actually achieved are given in Table 2). For each participant, the same work rate used in Test 2 was reproduced in Test 3 to ensure identical exercise-load conditions across the two tests.
Blood lactate was measured at rest and every 5 min after exercise onset with the same portable analyser and earlobe capillary sampling. From these values, the difference between the maximum and baseline concentration (ΔbLA) and the interval from exercise onset to the maximum concentration (bLApeak time) were derived.
2.5. Sweat Lactate Measurement
Sweat lactate was measured continuously with a wearable enzymatic biosensor (Grace Imaging, Tokyo, Japan) attached to the lateral aspect of the upper arm. The sensor output, an electrochemical current expressed in μA, was sampled at 1 Hz and transmitted by Bluetooth Low Energy to a dedicated mobile application. This sensor chip has previously been calibrated and validated against blood lactate across a wide range of concentrations: in vitro chronoamperometric testing against lactate standards from 0 to 20 mmol/L showed a linear current response over the 0–5 mmol/L physiological range (sensitivity ≈2.4 μA/mM) that remained stable across the pH (5–8), temperature (25–36 °C), and electrolyte (Na⁺, K⁺, Cl⁻) conditions typical of human sweat [9,17], and in vivo the sensor-derived threshold agreed closely with blood-lactate- and ventilatory-derived thresholds in healthy adults (r = 0.92) [9] and in patients with heart failure (r = 0.651) [10]. The output was analysed as an uncalibrated current signal and was not converted to a lactate concentration; sweat and blood lactate values therefore cannot be compared directly. Because the primary index was peak timing rather than signal amplitude, the analysis did not require concentration calibration. Before peak identification, the device output was smoothed by a firmware-implemented simple moving average. The moving-average window was not disclosed by the manufacturer. The change from baseline to the maximum sweat lactate signal (ΔsLA) was also recorded.
2.6. Determination of the Time Constant and of the Time to the End of Phase 2
The phase 2 time constant (τ) and fin2 were obtained using the V̇O₂ kinetics analysis module of the metabolic cart. Two assessors independently identified the end of phase 1 (the start of phase 2) and the software-defined end of phase 2 on the system display. fin2 was defined as the interval from exercise onset to the latter point. A third experienced assessor adjudicated any disagreement. The numerical criterion used internally by the proprietary software to define the end of phase 2 was not available to the investigators.
The software fitted the V̇O₂ response over the selected phase 2 interval and returned τ. Breath-by-breath data were not subjected to additional pre-processing beyond the automated handling performed by the metabolic cart, and one exercise transition was analysed per test. When the end of phase 2 could not be identified clearly, fin2 and τ were classified as indeterminate and excluded from the analysis for that test (Figure 1).
2.7. Determination of sLApeak Time
sLApeak time was defined as the interval from the onset of constant-load exercise to the peak of the sweat lactate signal. The continuous sweat lactate trace was assessed visually: exercise onset was taken as the starting point, and the time at which the signal changed from an increasing to a decreasing trend was identified as the peak (Figure 2). Where the signal did not decrease clearly after rising but instead reached a plateau, the time at which the plateau was attained was taken as sLApeak time. Where no adequate sweat lactate signal was obtained, or where no discernible change occurred during exercise, the test was classified as indeterminate and excluded from the analysis for that test; the reason for each exclusion was recorded. sLApeak time was determined independently by two assessors experienced with the sensor, with adjudication by a third assessor in the event of disagreement.
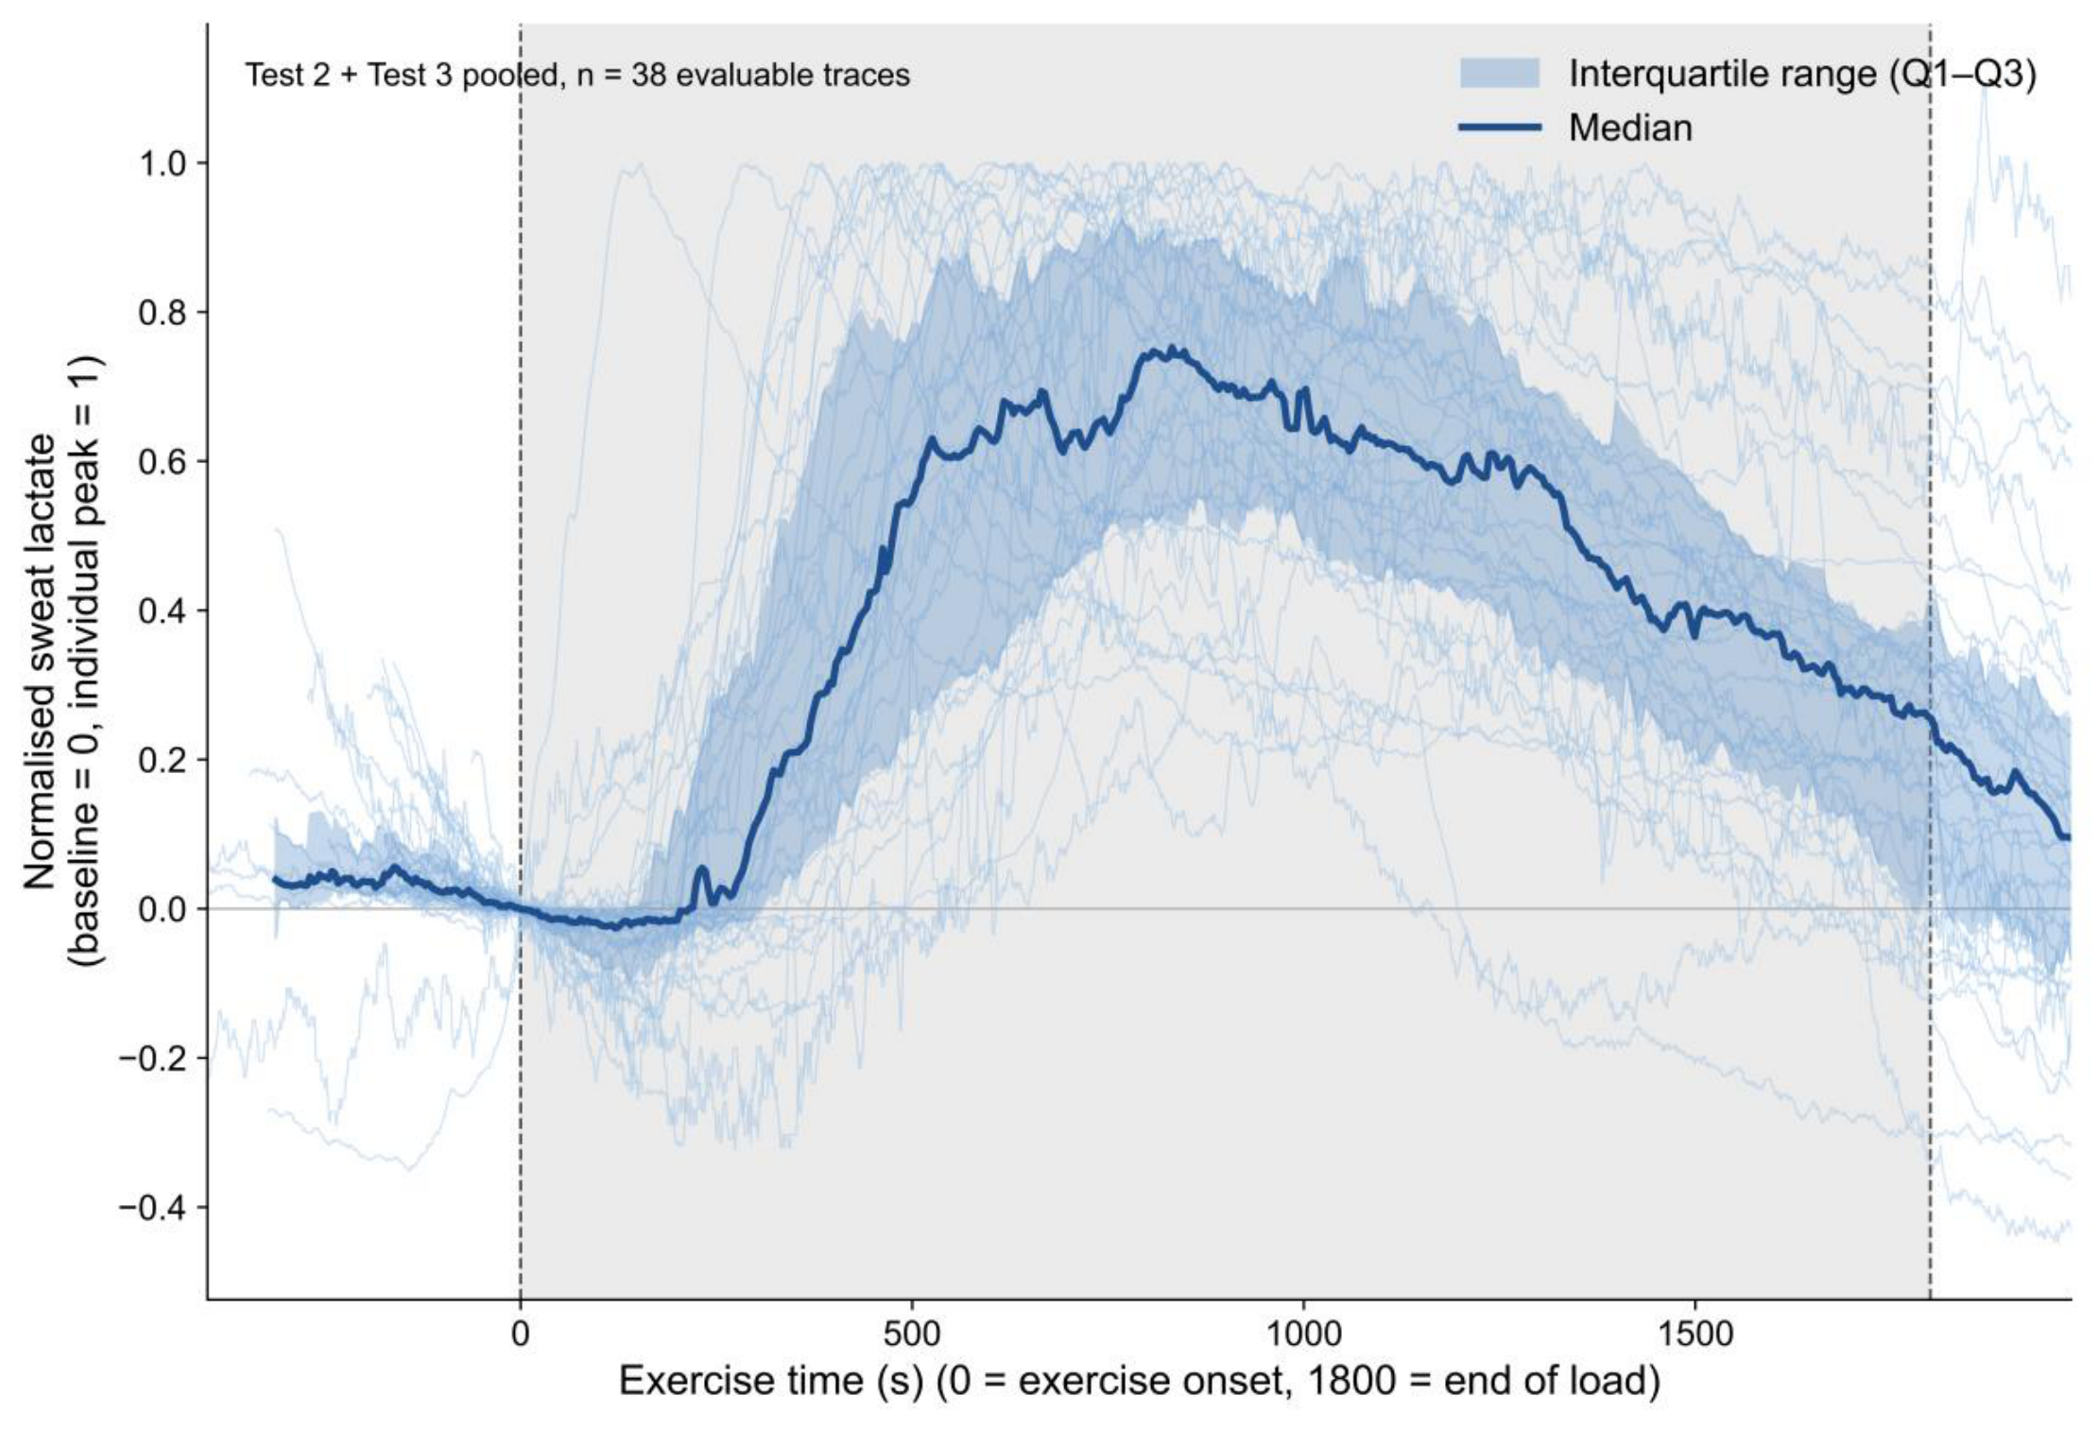
2.8. Group-Level Display of Sweat Lactate Time Courses
For the primary group-level display, each evaluable trace was normalised in amplitude (baseline = 0, individual peak = 1) and shown in absolute exercise time (0 = exercise onset), without aligning individual peaks; traces are shown up to 3 min beyond the end of the prescribed load (1800 s) (Figure 4). The median and interquartile range were then calculated at each time point across tests. A peak-aligned display, in which the time axis was rescaled to align individual sLApeak times, is shown in Figure S1. Because peak alignment is imposed by construction, Figure S1 is used only to compare response shape among tests in which a peak was identifiable, not to establish the prevalence or timing of a peak.
2.9. Statistical Analysis
Continuous variables are presented as mean ± standard deviation. The distribution of each variable was examined with the Shapiro–Wilk test.
The primary analysis assessed the associations of sLApeak time with fin2 and τ using Pearson's correlation coefficient. Univariable linear regression was then used to examine each candidate correlate of sLApeak time (fin2, τ, peak WR, peak V̇O₂, sex, skeletal muscle mass, ΔsLA, ΔbLA and bLApeak time). A multivariable linear regression model was fitted with sLApeak time as the dependent variable and fin2, τ and peak V̇O₂ as independent variables, and multicollinearity was assessed with the variance inflation factor (VIF). All association analyses were performed separately for Tests 2 and 3 as an internal replication; because the same participants contributed to both tests, the two analyses are not statistically independent. As an exploratory post hoc analysis, the accumulated oxygen deficit was approximated for each test by integrating, from exercise onset to fin2, the difference between the V̇O₂ near fin2 (the median V̇O₂ within ±15 s of fin2) and the measured breath-by-breath V̇O₂, without fitting an exponential model, and its correlation with sLApeak time was examined using Pearson's coefficient. Also exploratory, the between-test difference in τ (Test 3 minus Test 2) was tested with a paired t-test, and the between-test change in fin2 was correlated with the between-test change in sLApeak time using Pearson's coefficient, in participants with both measures available at both tests.
Between-test agreement of sLApeak time was assessed in participants for whom the index was obtained at both tests (Figure 1), using Bland–Altman analysis with 95% limits of agreement (mean difference ± 1.96 SD) and by testing for proportional bias by regressing the between-test difference on the between-test mean. Absolute agreement was quantified with the intraclass correlation coefficient (two-way random effects, absolute agreement, single measurement: ICC(2,1)) with its 95% confidence interval.
The sample size was based on feasibility, and no a priori sample-size calculation was performed. Analyses used available cases; no missing values were imputed. No sensitivity analysis was prespecified. A two-sided p value below .05 was considered statistically significant. No adjustment was made for multiple comparisons; the analyses of candidate correlates comprise 18 tests and are therefore exploratory. Correlation and regression analyses were performed using R version 4.6.1 (R Foundation for Statistical Computing, Vienna, Austria).
3. Results
3.1. Participants and Data Availability
Thirty-six collegiate athletes (30 men and 6 women) were enrolled. Their characteristics are summarised in Table 1. A record was available for 32 participants at Test 2 and 30 at Test 3. sLApeak time was determined in 31 of 32 recorded tests (97%) at Test 2 and 28 of 30 (93%) at Test 3. The V̇O₂ kinetics indices were obtained in 24 of 32 tests (75%) at Test 2 and 25 of 30 tests (83%) at Test 3. Both sLApeak time and the V̇O₂ kinetics indices were available in 23 participants at each test. Twenty-six participants had valid sLApeak time measurements at both tests and were included in the agreement analysis (Figure 1). Descriptive statistics for sLApeak time, fin2, τ, and the other constant-load-test measures are shown in Table 2. The same statistics restricted to the subgroup with complete V̇O₂ kinetics data (n = 23 per test) are shown in Table S1. Group-level distributions of sLApeak time were nearly identical between the two constant-load tests (719 ± 272 s and 718 ± 287 s; Table 2), whereas within participants the two values differed considerably (mean difference +21 s; 95% limits of agreement −547 to +588 s; ICC(2,1) 0.49, 95% CI 0.14 to 0.73; Figure 3, Figure S2). Between-session ICCs were also low for fin2 (0.26, 95% CI −0.23 to 0.64) and for τ (−0.04, 95% CI −0.49 to 0.42) in the 18 participants with paired V̇O₂ kinetics data (Table 3). The mean interval between Test 2 and Test 3 was 22.7±7.3 days.

Table 1.
Participant characteristics.
| Variable | Total (n = 36) |
|---|---|
| Demographics and anthropometry | |
| Age (years)‡ | 20.3 ± 1.3 (18.0–23.0) |
| Height (cm)‡ | 170.0 ± 7.3 (148.0–181.0) |
| Body mass (kg) | 61.8 ± 8.2 (42.6–77.7) |
| Body mass index (kg/m²)‡ | 21.3 ± 1.9 (18.0–26.1) |
| Body composition | |
| Body fat (%)‡ | 17.3 ± 5.3 (9.9–30.9) |
| Fat-free mass (kg)† | 51.2 ± 7.8 (31.6–65.6) |
| Skeletal muscle mass (kg) | 48.3 ± 7.4 (29.8–61.7) |
| Cardiopulmonary exercise test | |
| Peak V̇O₂ (L/min) | 2.60 ± 0.92 (0.82–4.58) |
| Peak V̇O₂ (mL/kg/min)‡ | 42.0 ± 14.2 (19.3–67.0) |
| Peak work rate (W)‡ | 254.9 ± 107.1 (80.0–452.0) |
| Peak work rate (W/kg)‡ | 4.12 ± 1.71 (1.88–7.26) |
| Habitual sport or training, n (%) | |
| Cycling | 12 (33.3) |
| Running | 9 (25.0) |
| Golf | 8 (22.2) |
| Team sports | 3 (8.3) |
| Other club sports | 2 (5.6) |
| Not reported | 2 (5.6) |
Values are mean ± SD (range), unless otherwise indicated. ‡Non-normally distributed (Shapiro–Wilk p < 0.05). Sport or training categories are n (%) and were derived from self-reported habitual exercise; Not reported denotes participants who left this item blank. †One participant: fat-free mass corrected from 493.1 to 49.3 kg (decimal entry error); derived variables were recomputed. V̇O₂, oxygen uptake.
Table 2.
Descriptive statistics for the constant-load tests (Test 2 and Test 3).
| Variable | Test 2 (n=23) | Test 3 (n=23) |
|---|---|---|
| sLApeak time (s) | 719.0 ± 271.7 | 718.3 ± 286.5 |
| fin2 (s) | 316.2 ± 122.9 | 313.4 ± 75.0 |
| τ (s) | 107.9 ± 59.8 | 79.5 ± 22.9 |
| V̇O₂ near fin2 (L/min) | 1.93 ± 0.57 | 2.05 ± 0.71 |
| V̇O₂ near fin2 (% peak V̇O₂) | 75.8 ± 9.1 | 74.6 ± 11.3 |
| ΔsLA (μA) | 6.3 ± 6.8 | 4.8 ± 2.9 |
| ΔbLA (mmol/L) | 5.5 ± 2.4 | 5.4 ± 1.6 |
| bLApeak time (s) | 1191.2 ± 481.4 | 1254.5 ± 488.7 |
Values are mean ± SD. Denominators differ across variables because of test-specific missing data (see Figure 1 and Results section 3.1). sLApeak time, time to peak sweat lactate; fin2, software-defined time to the end of phase 2; τ, phase 2 time constant; ΔsLA, change from baseline to peak sweat lactate sensor current; ΔbLA, change from baseline to peak blood lactate concentration; bLApeak time, interval from exercise onset to peak blood lactate concentration. V̇O₂ near fin2, the median V̇O₂ within ±15 s of fin2, in L/min and as a percentage of peak V̇O₂ (from breath-by-breath data; Table 4);.
Table 3.
Test–retest reliability of sLApeak time, fin2, and τ between Test 2 and Test 3.
| Variable | n | Mean difference (Test 3 − Test 2) | 95% limits of agreement | ICC(2,1) (95% CI) |
|---|---|---|---|---|
| sLApeak time (s) | 26 | +20.7 | −546.9 to 588.2 | 0.49 (0.14, 0.73) |
| fin2 (s) | 18 | +1.1 | −173.8 to 175.9 | 0.26 (−0.23, 0.64) |
| τ (s) | 18 | −23.7 | −119.8 to 72.4 | −0.04 (−0.49, 0.42) |
ICC(2,1), two-way random-effects, absolute-agreement, single-measurement intraclass correlation coefficient. Mean difference is Test 3 minus Test 2; 95% limits of agreement are the mean difference ± 1.96 × SD of the difference (Bland–Altman). n is the number of participants with a valid paired value at both tests; the same 26 participants as in the sLApeak time agreement analysis (Figure 3, Figure S2) for the first row, and the subset of 18 participants with valid V̇O₂ kinetics indices at both tests for fin2 and τ.
3.2. Sweat Lactate Time Course and Associations with V̇O₂ Kinetics
Representative responses from participants with relatively short and long sLApeak times are shown in Figure 2. In both examples, the sweat lactate signal rose after exercise onset, but the peak occurred at markedly different times relative to fin2. At the group level, without aligning individual peaks, the median sweat lactate signal rose, reached a maximum during the exercise bout, and declined thereafter (Figure 4). The peak-aligned display is shown in Figure S1 and is presented only to compare response shape among evaluable traces. sLApeak time occurred substantially later than fin2 (mean 719 s vs. 316 s at Test 2; Table 2).
Figure 4.
Sweat lactate time courses for evaluable constant-load tests (Test 2 and Test 3 pooled; n = 38 of the 59 tests with a determined sLApeak time), shown in absolute exercise time from before exercise onset through 3 min beyond the end of the prescribed load, capturing the recorded warm-up and recovery periods. Each trace was normalised in amplitude within that trace (baseline = 0, individual peak = 1); individual peaks were not aligned. Individual traces (thin lines) are shown with the median (bold line) and, calculated at each 1-s time point across the pooled traces, the interquartile range (Q1–Q3, blue band). This point-by-point interquartile range is distinct from the grey band, which marks the prescribed load period (0 to 1800 s from exercise onset); vertical dashed lines mark the start and end of this period. Because each trace is normalised to its own baseline and peak, values can fall below 0 where the signal declines during recovery to below the level recorded at exercise onset. Because individual peaks were not aligned, the pointwise median — computed across traces whose peaks occur at different times — never reaches 1 even though every trace does so individually, and instead reaches a maximum of approximately 0.75. Tests with a determined peak but without continuous, artefact-free recording through this extended window were not included in this display.
sLApeak time showed moderate-to-strong correlations with fin2 at both tests (r = 0.63, 95% CI 0.30 to 0.82; r = 0.69, 95% CI 0.41 to 0.85), whereas correlations with τ were weaker and less consistent (r = 0.44, 95% CI 0.04 to 0.72; r = 0.32, 95% CI −0.09 to 0.63) (Figure 5). The accumulated oxygen deficit was only weakly correlated with sLApeak time at both tests (r = 0.33, 95% CI −0.12 to 0.67, n = 21; r = 0.34, 95% CI −0.10 to 0.67, n = 22; Table 4). In the 16 participants with fin2 and sLApeak time available at both tests, the between-test change in fin2 (Test 3 minus Test 2) was correlated with the between-test change in sLApeak time (r = 0.56, 95% CI 0.09 to 0.83, p = 0.024; Figure S3).
Table 4.
Association between the accumulated oxygen deficit (AOD) and sLApeak time.
| Test | n | r | 95% CI |
|---|---|---|---|
| Test 2 | 21 | 0.33 | −0.12, 0.67 |
| Test 3 | 22 | 0.34 | −0.10, 0.67 |
r, Pearson correlation coefficient between AOD and sLApeak time. AOD was approximated for each test by integrating, from exercise onset to fin2, the difference between the V̇O₂ near fin2 (the median V̇O₂ within ±15 s of fin2) and the measured breath-by-breath V̇O₂, without fitting an exponential model. Of the 23 participants with valid fin2, τ, and sLApeak time at each test (Table 5), a valid V̇O₂ near fin2 could not be computed for 2 participants at Test 2 and 1 at Test 3 because of missing or unusable breath-by-breath data; results above are shown for the remaining 21 and 22 participants, respectively.
3.3. Factors Associated with sLApeak Time
In univariable analyses, fin2 was positively associated with sLApeak time at both tests (Test 2: β = 1.3, 95% CI 0.6 to 2.0, p = 0.001; Test 3: β = 2.6, 95% CI 1.3 to 3.8, p < 0.001). τ was positively associated with sLApeak time at Test 2 (β = 1.8, 95% CI 0.1 to 3.5, p = 0.036) but not at Test 3. Peak WR and peak V̇O₂ were inversely associated with sLApeak time at Test 3, whereas the corresponding estimates at Test 2 did not reach statistical significance. Sex, skeletal muscle mass, ΔsLA, ΔbLA, and bLApeak time were not associated with sLApeak time at either test (Table 5).
Table 5.
Univariable linear regression analyses for the time to peak sweat lactate (sLApeak time).
| Test 22. | Test 3 (second constant-load test) | |||||||
|---|---|---|---|---|---|---|---|---|
| Variable | n | β (95% CI) | p | R² | n | β (95% CI) | p | R² |
| V̇O₂ kinetics | ||||||||
| fin2 (s) | 23 | 1.3 (0.6, 2.0) | .001 | 0.40 | 23 | 2.6 (1.3, 3.8) | < .001 | 0.48 |
| V̇O₂ τ (s) | 23 | 1.8 (0.1, 3.5) | .036 | 0.19 | 23 | 3.6 (−1.3, 8.4) | .14 | 0.10 |
| Exercise capacity | ||||||||
| Peak work rate (W) | 31 | −1.0 (−2.0, 0.0) | .052 | 0.12 | 28 | −1.6 (−2.6, −0.5) | .005 | 0.27 |
| Peak V̇O₂ (mL·kg⁻¹·min⁻¹) | 31 | −6.3 (−13.6, 1.0) | .089 | 0.10 | 28 | −11.1 (−19.2, −3.1) | .009 | 0.24 |
| Participant characteristics | ||||||||
| Sex (male vs. female) | 31 | −143.8 (−441.6, 154.0) | .33 | 0.03 | 28 | −135.3 (−572.3, 301.6) | .53 | 0.01 |
| Skeletal muscle mass (kg) | 31 | −3.7 (−18.9, 11.4) | .62 | 0.01 | 28 | −4.4 (−22.9, 14.1) | .63 | 0.01 |
| Lactate responses | ||||||||
| ΔsLA (μA) | 31 | −3.1 (−18.2, 12.0) | .68 | 0.01 | 28 | −13.6 (−56.9, 29.7) | .52 | 0.02 |
| ΔbLA (mmol/L) | 31 | 3.6 (−41.0, 48.1) | .87 | 0.00 | 28 | −6.1 (−79.3, 67.1) | .86 | 0.00 |
| bLApeak time (s) | 31 | 0.1 (−0.1, 0.3) | .40 | 0.02 | 28 | −0.1 (−0.3, 0.1) | .33 | 0.04 |
Values are β (95% CI), where β is the change in sLApeak time (s) per unit change in the predictor. R², coefficient of determination. Bold indicates p < 0.05. Tests 2 and 3 were the first and second constant-load exercise tests, respectively. fin2, time from exercise onset to the software-defined end of phase 2; τ, time constant of the phase 2 V̇O₂ response; ΔsLA, change in the sweat lactate signal from baseline to maximum; ΔbLA, change in blood lactate from baseline to maximum; bLApeak time, time from exercise onset to peak blood lactate. The number of participants differs between rows: fin2 and τ were analysed only in participants in whom the V̇O₂ kinetics indices could be derived (n = 23 at each test), whereas the remaining variables were analysed in all participants with a valid sLApeak time (n = 31 at Test 2 and n = 28 at Test 3). Sex was coded with female as the reference category. These analyses comprise 18 tests and were not adjusted for multiplicity; they should be interpreted as exploratory.
In the multivariable models, fin2 remained independently associated with sLApeak time at Test 2 (β = 1.8, 95% CI 0.7 to 2.9, p = 0.003) and Test 3 (β = 1.8, 95% CI 0.2 to 3.5, p = 0.032). Peak V̇O₂ was inversely associated with sLApeak time at Test 2 (β = −7.7, 95% CI −14.6 to −0.7, p = 0.032) and showed a similar estimate at Test 3 that did not reach statistical significance (p = 0.053). τ was not significant in either model. The models explained approximately half of the variance in sLApeak time (Test 2: R² = 0.54, adjusted R² = 0.47; Test 3: R² = 0.57, adjusted R² = 0.51), and all variance inflation factors were < 3 (Table 6).
4. Discussion
In this study, sLApeak time during constant-load exercise was consistently associated with fin2 at both tests, persisting after adjustment for τ and peak V̇O₂, whereas its association with τ was reproduced at only one test and its association with the accumulated oxygen deficit was weak. These findings suggest that sLApeak time corresponds less to the initial rate of the V̇O₂ response or the magnitude of the oxygen deficit than to the duration of the V̇O₂ transition after exercise onset.
Between-session agreement was modest for sLApeak time and lower still for fin2 and τ (Table 3), so the limited repeatability was not specific to the sweat lactate sensor. The two constant-load tests were separated by an average of 22.7 days, an interval over which training load and day-to-day condition are expected to change, and no same-day repeat was performed; measurement error and genuine biological variation therefore cannot be separated [18]. Despite this, the fin2–sLApeak time association recurred at similar strength at both tests (r = 0.63 and 0.69), exceeding the ceiling implied by each measure's own reliability (√(0.49 × 0.26) ≈ 0.36), indicating shared genuine physiological variation rather than pure measurement error. Consistent with this, the between-test change in fin2 correlated with the between-test change in sLApeak time (r = 0.56, 95% CI 0.09 to 0.83, p = 0.024, n = 16). τ showed essentially no between-session agreement and tended to be lower at Test 3 (paired t-test p = 0.099), so its inconsistent link with sLApeak time reflects τ's own instability rather than a failure of sLApeak time to track it. These findings support sLApeak time for group-level and association analyses rather than for tracking individual change.
A possible explanation is that fin2 reflects a longer timescale of the V̇O₂ response than τ: whereas τ is the rate of rise of the phase 2 primary component, fin2 is additionally shaped by the phase 1 delay and by the amplitude of that component, and can be shifted later when an emerging slow component blurs the phase 2–phase 3 boundary [2,4,6,19]. sLApeak time is likewise an end-point marker — the point at which the sudomotor signal reaches its maximum and declines — so it may track fin2 more closely than τ, a rate constant. The same logic applies to the oxygen deficit, which depends jointly on the amplitude and rate of the V̇O₂ response, whereas sLApeak time carries no amplitude information: a moderate-to-strong link with fin2 alongside only a weak one with the oxygen deficit fits sLApeak time marking duration rather than rate or magnitude.
ΔbLA and bLApeak time were not associated with sLApeak time, consistent with sweat lactate being produced locally within the eccrine sweat gland rather than simply reflecting blood lactate, and being subject to dilution and washout related to sweat flow [12,13,14,15,16,20]. Blood lactate's coarser 5-minute sampling interval, relative to the continuously measured sweat signal, may also have weakened the association.
Participants with higher peak V̇O₂ tended to show shorter sLApeak times, plausibly because faster oxygen delivery and oxidative metabolism after exercise onset shorten fin2 and let peripheral metabolic status stabilise earlier [2,3,5]. Training also enhances sweat gland secretory capacity and is associated with higher sweat rate [21,22], and with faster cutaneous blood flow responses [23,24], so a fitter sudomotor and circulatory response could likewise cause earlier dilution and washout of sweat lactate. This association with peak V̇O₂ was significant at Test 2 but only borderline at Test 3, and because sweating onset, sweat rate, skin blood flow, and temperature were not measured, the interpretation remains exploratory.
This study has several limitations. Both sLApeak time and V̇O₂ kinetics indices were available for only 23 participants at each test; without a priori sample-size calculation or multiplicity correction, the associated-factors analysis is hypothesis-generating, and missing sLApeak time or fin2 values in some tests raise the possibility of selection bias. Sweat rate, skin blood flow, temperature, and environmental conditions were not measured, so metabolic and thermoregulatory contributions could not be separated. The sensor's in-use stability and the firmware's moving-average window width were not disclosed, so instrumental drift or smoothing-related lag cannot be excluded, although a device-intrinsic decay would be expected to produce a similar peak time in every participant rather than the several-fold variation observed. The oxygen deficit was approximated without an exponential fit, integrated only as far as fin2, and is therefore neither a formally determined oxygen deficit nor independent of fin2. Finally, load was set relative to peak WR rather than a physiological threshold, so exercise-intensity domain could not be confirmed; few women were included, and the sample was limited to collegiate athletes. Future work should use threshold-based load prescription, simultaneous measurement of sweating and cutaneous circulation, independent verification of fin2, and testing across repeated transitions and cohorts.
5. Conclusions
During constant-load cycling, representative and group responses showed a rise–peak–decline profile. Although a single sLApeak time value was not precise enough to track change within an individual, the association between sLApeak time and fin2, the software-defined time to the end of phase 2, was reproduced on a second day, whereas its association with τ was not. Continuous sweat lactate monitoring may therefore offer a field-deployable marker of the duration of the exercise-onset transition.
Supplementary Materials
The following supporting information can be downloaded at the online version of this article: Figure S1: Peak-aligned sweat lactate time courses for evaluable constant-load tests; Figure S2: Test–retest scatter plot of sLApeak time at Tests 2 and 3; Figure S3: Scatter plot of the between-test change in fin2 against the between-test change in sLApeak time; Table S1: Descriptive statistics for the constant-load tests, restricted to the subgroup with complete V̇O₂ kinetics data.
Author Contributions
Author initials: Y.Ma., Yoshihiro Maruko; R.H., Rintaro Hirata; Y.Mu., Yuki Muramoto; E.M., Emi Minaguchi; K.Su., Kazuhisa Sugai; Y.I., Yuji Iwasawa; D.N., Daisuke Nakashima; K.Sa., Kazuki Sato; Y.K., Yoshinori Katsumata (two-letter forms are used for Y.Ma./Y.Mu. and K.Su./K.Sa. because the standard single-letter initials collide). Conceptualization, Y.K.; methodology, Y.Mu. and Y.K.; formal analysis, Y.Ma. and R.H.; investigation, Y.Mu., E.M., K.Su. and Y.I.; resources, D.N.; data curation, Y.Ma. and R.H.; writing—original draft preparation, Y.Ma., R.H. and Y.Mu.; writing—review and editing, Y.Mu., K.Sa. and Y.K.; visualization, Y.Ma. and R.H.; supervision, Y.K.; project administration, Y.Mu. All authors have read and agreed to the published version of the manuscript.
Funding
This research received no external funding.
Institutional Review Board Statement
The study protocol was approved by the Institutional Review Board of Keio University School of Medicine (approval number 20251030) and was conducted in accordance with the principles of the Declaration of Helsinki and the Ethical Guidelines for Life Science and Medical Research Involving Human Subjects in Japan. The study was registered with the University Hospital Medical Information Network Clinical Trials Registry (UMIN000058083).
Informed Consent Statement
Informed consent was obtained from all participants involved in the study.
Data Availability Statement
Data is contained within the article or supplementary material.
Acknowledgments
The authors sincerely thank all participants for their time and commitment to this study.
Conflicts of Interest
D. Nakashima is a board member and shareholder of Grace Imaging Inc., which provided the sweat lactate sensors and related equipment used in this study. Grace Imaging Inc. had no role in the study design, data collection, data analysis, interpretation of the results, preparation of the manuscript, or the decision to submit. The remaining authors declare no competing interests.
References
- Bourdon, P.C.; Cardinale, M.; Murray, A.; Gastin, P.; Kellmann, M.; Varley, M.C.; Gabbett, T.J.; Coutts, A.J.; Burgess, D.J.; Gregson, W.; Cable, N.T. Monitoring athlete training loads: consensus statement. Int. J. Sports Physiol. Perform. 2017, 12 Suppl. 2, S2161–S2170. [Google Scholar] [CrossRef]
- Poole, D.C.; Jones, A.M. Oxygen uptake kinetics. Compr. Physiol. 2012, 2, 933–996. [Google Scholar] [CrossRef]
- Bassett, D.R., Jr.; Howley, E.T. Limiting factors for maximum oxygen uptake and determinants of endurance performance. Med. Sci. Sports Exerc. 2000, 32, 70–84. [Google Scholar] [CrossRef]
- Burnley, M.; Jones, A.M. Oxygen uptake kinetics as a determinant of sports performance. Eur. J. Sport Sci. 2007, 7, 63–79. [Google Scholar] [CrossRef]
- Koppo, K.; Bouckaert, J.; Jones, A.M. Effects of training status and exercise intensity on phase II V̇O₂ kinetics. Med. Sci. Sports Exerc. 2004, 36, 225–232. [Google Scholar] [CrossRef]
- Jones, A.M.; Burnley, M. Oxygen uptake kinetics: an underappreciated determinant of exercise performance. Int. J. Sports Physiol. Perform. 2009, 4, 524–532. [Google Scholar] [CrossRef]
- Aldhahi, M.I.; Alqahtani, A.S.; Al-Hazzaa, H.M. Revisiting the clinical utilization of cardiopulmonary exercise testing in Saudi Arabia after 2 decades: a cross-sectional study. Saudi Med. J. 2024, 45, 154–162. [Google Scholar] [CrossRef]
- Dores, H.; Mendes, M.; Abreu, A.; Durazzo, A.; Rodrigues, C.; Vilela, E.; Cunha, G.; Gomes Pereira, J.; Bento, L.; Moreno, L.; Dinis, P.; Amorim, S.; Clemente, S.; Santos, M. Cardiopulmonary exercise testing in clinical practice: principles, applications, and basic interpretation. Rev. Port. Cardiol. 2024, 43, 525–536. [Google Scholar] [CrossRef]
- Seki, Y.; Nakashima, D.; Shiraishi, Y.; Ryuzaki, T.; Ikura, H.; Miura, K.; Suzuki, M.; Watanabe, T.; Nagura, T.; Matsumoto, M.; Nakamura, M.; Sato, K.; Fukuda, K.; Katsumata, Y. A novel device for detecting anaerobic threshold using sweat lactate during exercise. Sci. Rep. 2021, 11, 4929. [Google Scholar] [CrossRef]
- Katsumata, Y.; Muramoto, Y.; Ishida, N.; Takemura, R.; Nagashima, K.; Ikoma, T.; Kawamatsu, N.; Araki, M.; Goda, A.; Okawara, H.; Sawada, T.; Ichihara, Y.K.; Hattori, O.; Yamaoka, K.; Seki, Y.; Ryuzaki, T.; Ikura, H.; Nakashima, D.; Nagura, T.; Nakamura, M.; Sato, K.; Shiraishi, Y. Sweat lactate sensor for detecting anaerobic threshold in heart failure: a prospective clinical trial (LacS-001). Sci. Rep. 2024, 14, 18985. [Google Scholar] [CrossRef]
- Maeda, Y.; Okawara, H.; Sawada, T.; Nakashima, D.; Nagahara, J.; Fujitsuka, H.; Ikeda, K.; Hoshino, S.; Kobari, Y.; Katsumata, Y.; Nakamura, M.; Nagura, T. Implications of the onset of sweating on the sweat lactate threshold. Sensors 2023, 23, 3378. [Google Scholar] [CrossRef]
- Baker, L.B.; Wolfe, A.S. Physiological mechanisms determining eccrine sweat composition. Eur. J. Appl. Physiol. 2020, 120, 719–752. [Google Scholar] [CrossRef]
- Derbyshire, P.J.; Barr, H.; Davis, F.; Higson, S.P. Lactate in human sweat: a critical review of research to the present day. J. Physiol. Sci. 2012, 62, 429–440. [Google Scholar] [CrossRef]
- Ament, W.; Huizenga, J.R.; Mook, G.A.; Gips, C.H.; Verkerke, G.J. Lactate and ammonia concentration in blood and sweat during incremental cycle ergometer exercise. Int. J. Sports Med. 1997, 18, 35–39. [Google Scholar] [CrossRef]
- Klous, L.; de Ruiter, C.J.; Scherrer, S.; Gerrett, N.; Daanen, H.A.M. The (in)dependency of blood and sweat sodium, chloride, potassium, ammonia, lactate and glucose concentrations during submaximal exercise. Eur. J. Appl. Physiol. 2021, 121, 803–816. [Google Scholar] [CrossRef]
- Takei, N.; Inaba, T.; Morita, Y.; Kakinoki, K.; Hatta, H.; Kitaoka, Y. Differential patterns of sweat and blood lactate concentration response during incremental exercise in varied ambient temperatures: a pilot study. Temperature 2024, 11, 247–253. [Google Scholar] [CrossRef]
- Muramoto, Y.; Nakashima, D.; Amano, T.; Harita, T.; Sugai, K.; Daigo, K.; Iwasawa, Y.; Ichihara, G.; Okawara, H.; Sawada, T.; Kinoda, A.; Yamada, Y.; Kimura, T.; Sato, K.; Katsumata, Y. Estimation of maximal lactate steady state using the sweat lactate sensor. Sci. Rep. 2023, 13, 10366. [Google Scholar] [CrossRef]
- Bland, J.M.; Altman, D.G. Statistical methods for assessing agreement between two methods of clinical measurement. Lancet 1986, 1, 307–310. [Google Scholar] [CrossRef]
- Poole, D.C.; Schaffartzik, W.; Knight, D.R.; Derion, T.; Kennedy, B.; Guy, H.J.; Prediletto, R.; Wagner, P.D. Contribution of exercising legs to the slow component of oxygen uptake kinetics in humans. J. Appl. Physiol. 1991, 71, 1245–1260. [Google Scholar] [CrossRef]
- Green, J.M.; Bishop, P.A.; Muir, I.H.; McLester, J.R., Jr.; Heath, H.E. Effects of high and low blood lactate concentrations on sweat lactate response. Int. J. Sports Med. 2000, 21, 556–560. [Google Scholar] [CrossRef]
- Buono, M.J.; Sjoholm, N.T. Effect of physical training on peripheral sweat production. J. Appl. Physiol. 1988, 65, 811–814. [Google Scholar] [CrossRef]
- Lee, J.B.; Kim, T.W.; Min, Y.K.; Yang, H.M. Long distance runners present upregulated sweating responses than sedentary counterparts. PLoS ONE 2014, 9, e93976. [Google Scholar] [CrossRef]
- Charkoudian, N. Skin blood flow in adult human thermoregulation: how it works, when it does not, and why. Mayo Clin. Proc. 2003, 78, 603–612. [Google Scholar] [CrossRef]
- Simmons, G.H.; Wong, B.J.; Holowatz, L.A.; Kenney, W.L. Changes in the control of skin blood flow with exercise training: where do cutaneous vascular adaptations fit in? Exp. Physiol. 2011, 96, 822–828. [Google Scholar] [CrossRef]
Figure 1.
Participant and measurement flow. Numbers of participants enrolled; constant-load tests for which a record was available; tests in which sLApeak time could be determined; tests in which fin2 and τ could be derived; and participants for whom both measurements were available at Tests 2 and 3. Denominators below each constant-load test are the numbers of recorded tests, not the number enrolled. Participants with no record of a test are shown separately from recorded tests in which a measurement could not be determined. The final box shows the number of participants included in the test–retest agreement analysis.
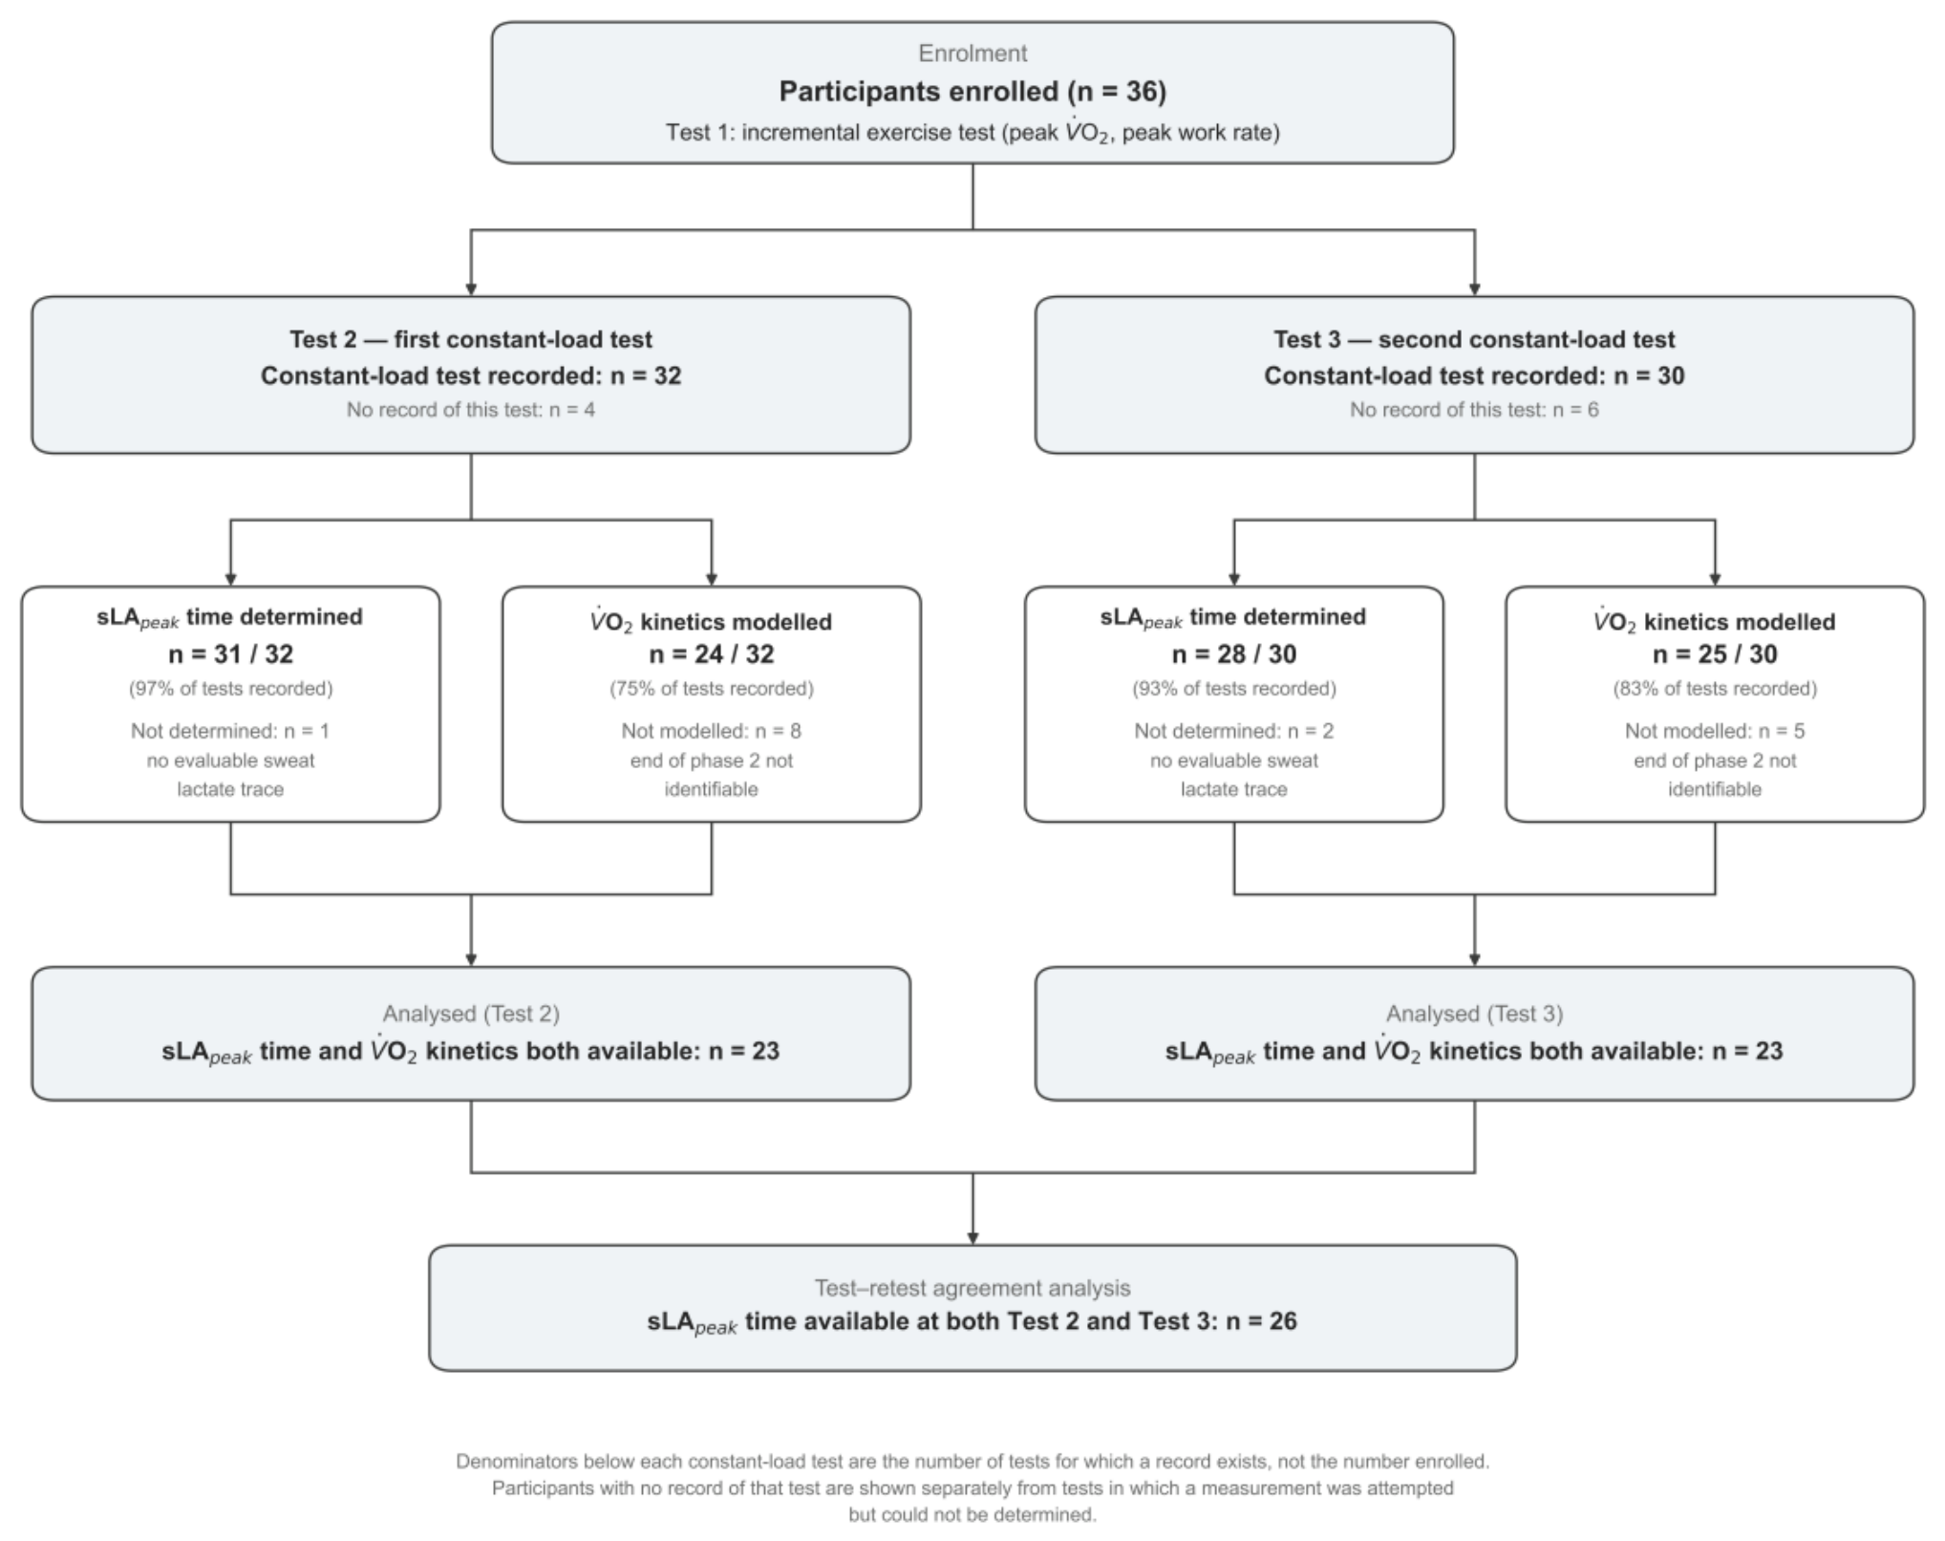
Figure 2.
Representative V̇O₂, sweat lactate, and blood lactate responses during constant-load exercise in participants with (A) a relatively short and (B) a relatively long sLApeak time. Green points and the green line show breath-by-breath and monoexponential-fit V̇O₂, respectively, plotted against the right-hand V̇O₂ axis; blue shows the sweat lactate sensor current, plotted against its own right-hand axis; and red points show capillary blood lactate, plotted against the left-hand axis. Blood lactate (mmol·L⁻¹) and sweat sensor current (μA) are on different axes and should not be compared numerically. Vertical markers identify the software-defined end of phase 2 (fin2) and sLApeak time; τ is a rate constant rather than a point in time and is therefore reported as a value in each panel.
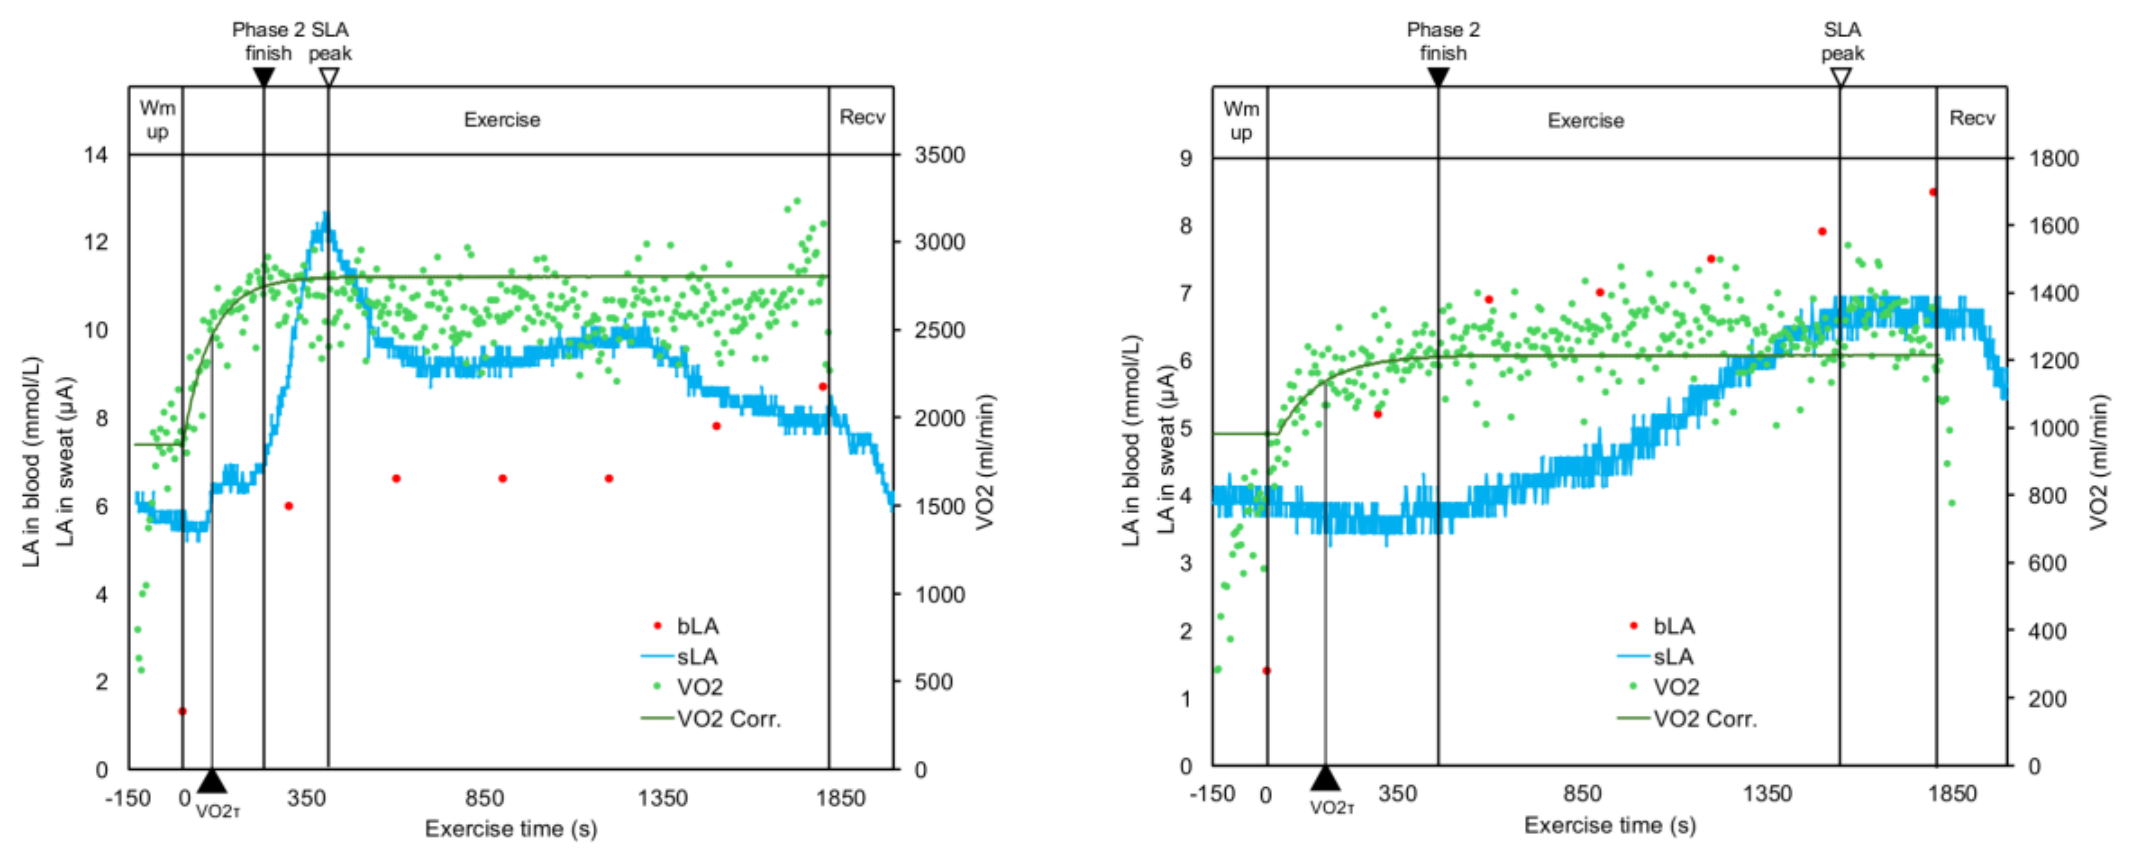
Figure 3.
Bland–Altman plot of sLApeak time measured at Tests 2 and 3. The solid line indicates the mean Test 3 minus Test 2 difference, and the dashed lines indicate the 95% limits of agreement. The regression test for proportional bias is shown in the plot.
Figure 3.
Bland–Altman plot of sLApeak time measured at Tests 2 and 3. The solid line indicates the mean Test 3 minus Test 2 difference, and the dashed lines indicate the 95% limits of agreement. The regression test for proportional bias is shown in the plot.
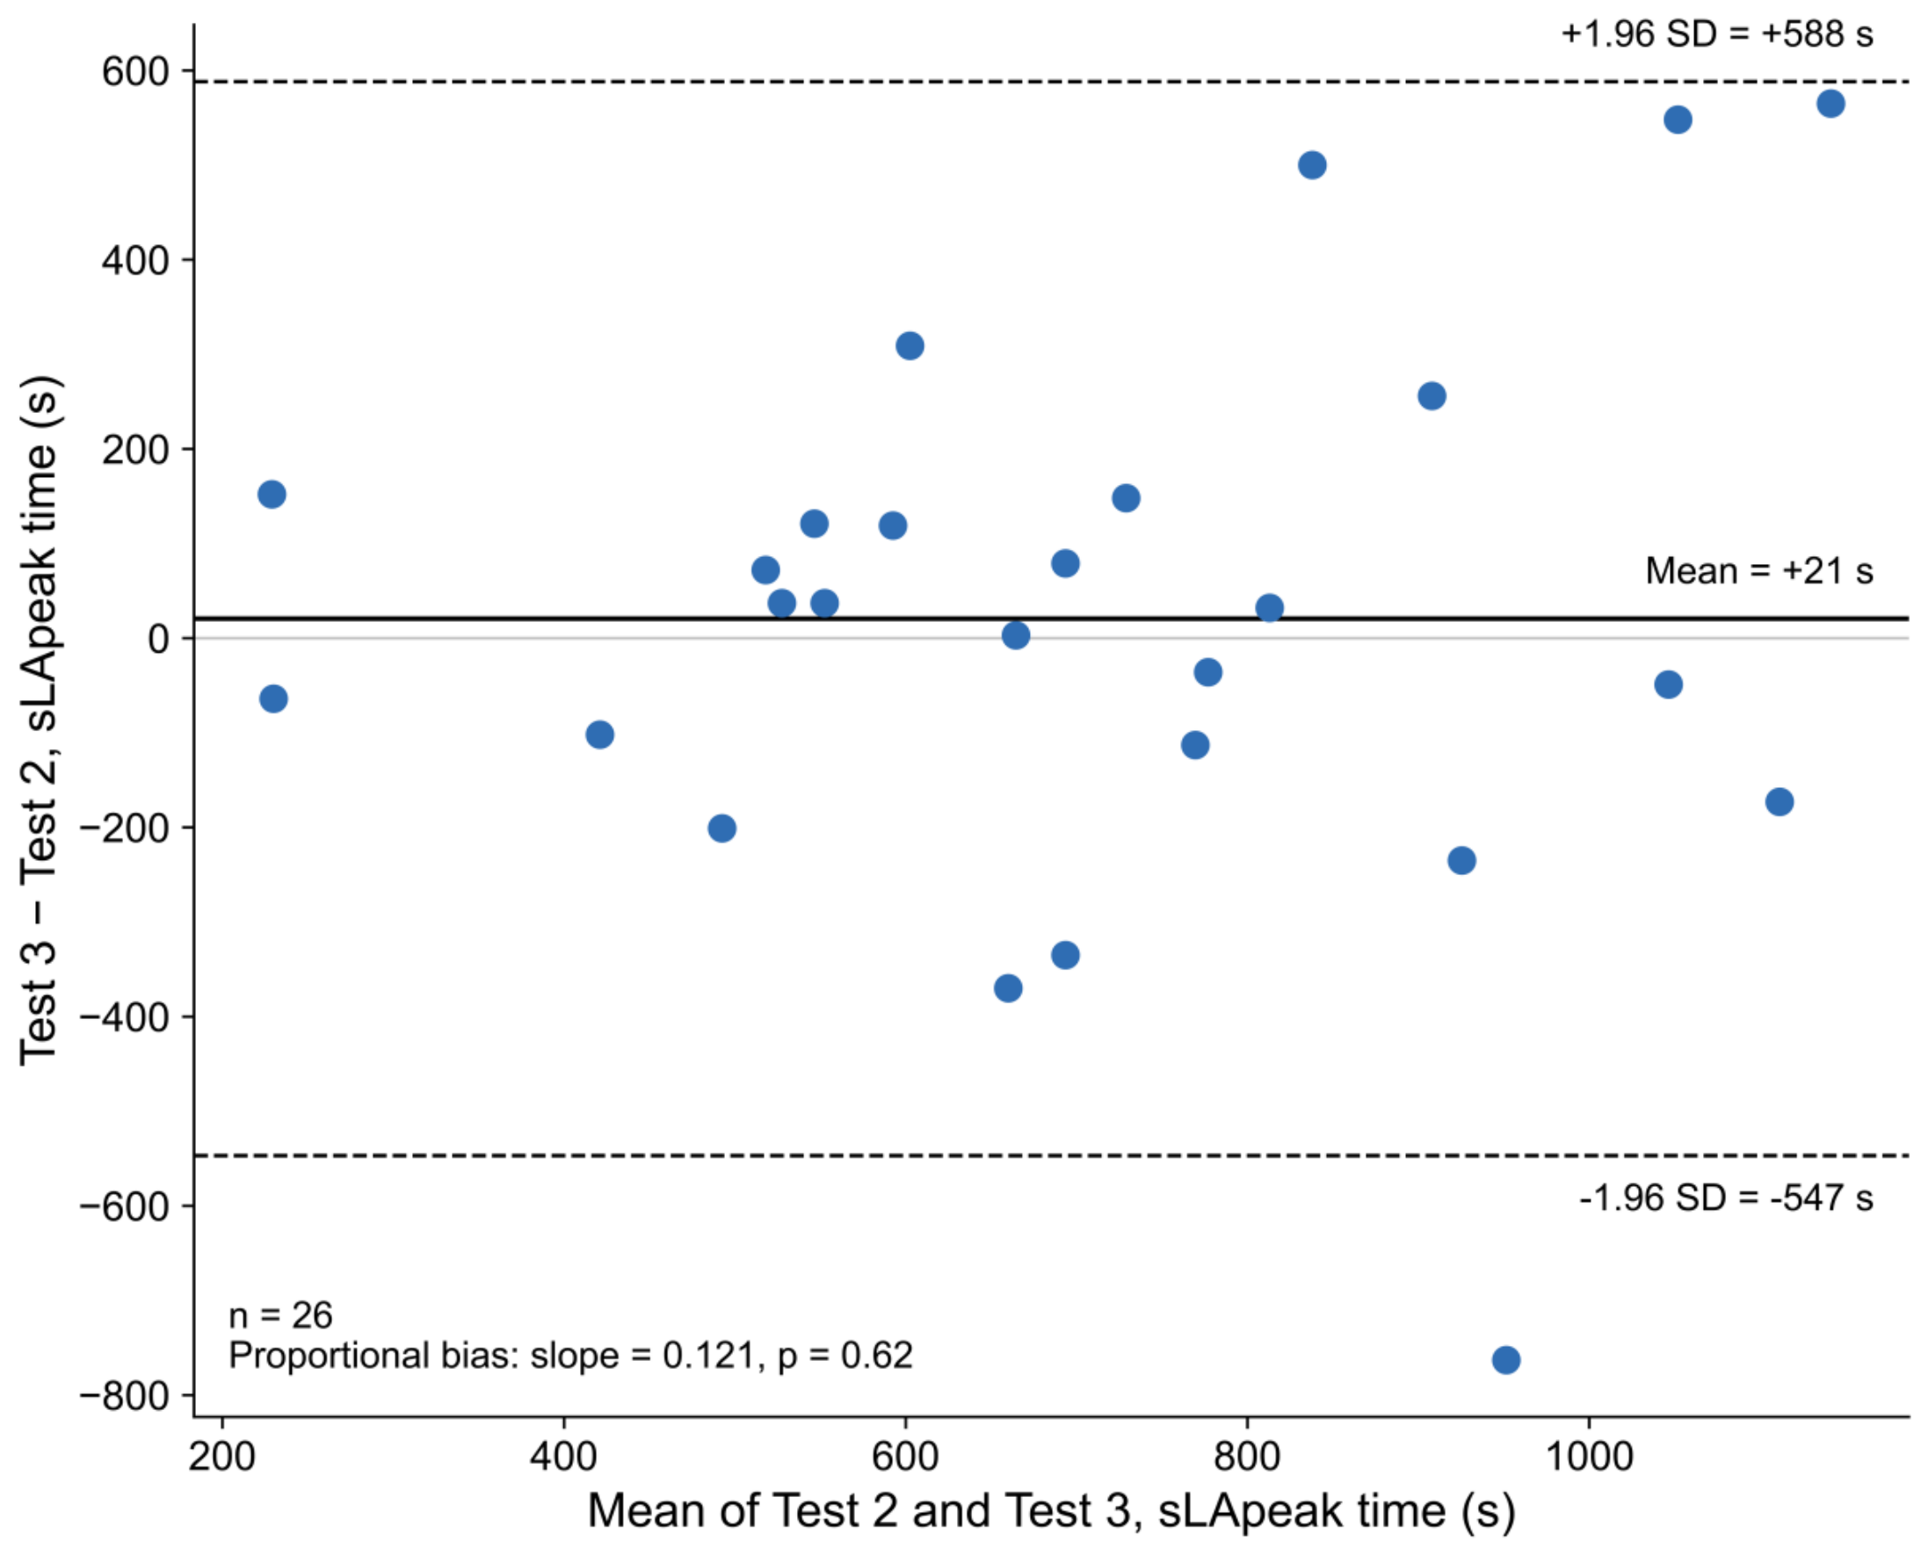
Figure 5.
Associations between sLApeak time and V̇O₂ kinetics indices. (A) fin2 and (B) τ at Test 2; (C) fin2 and (D) τ at Test 3. Dashed lines show least-squares regression fits. Pearson correlation coefficients, 95% confidence intervals, and sample sizes are shown in each panel.
Figure 5.
Associations between sLApeak time and V̇O₂ kinetics indices. (A) fin2 and (B) τ at Test 2; (C) fin2 and (D) τ at Test 3. Dashed lines show least-squares regression fits. Pearson correlation coefficients, 95% confidence intervals, and sample sizes are shown in each panel.
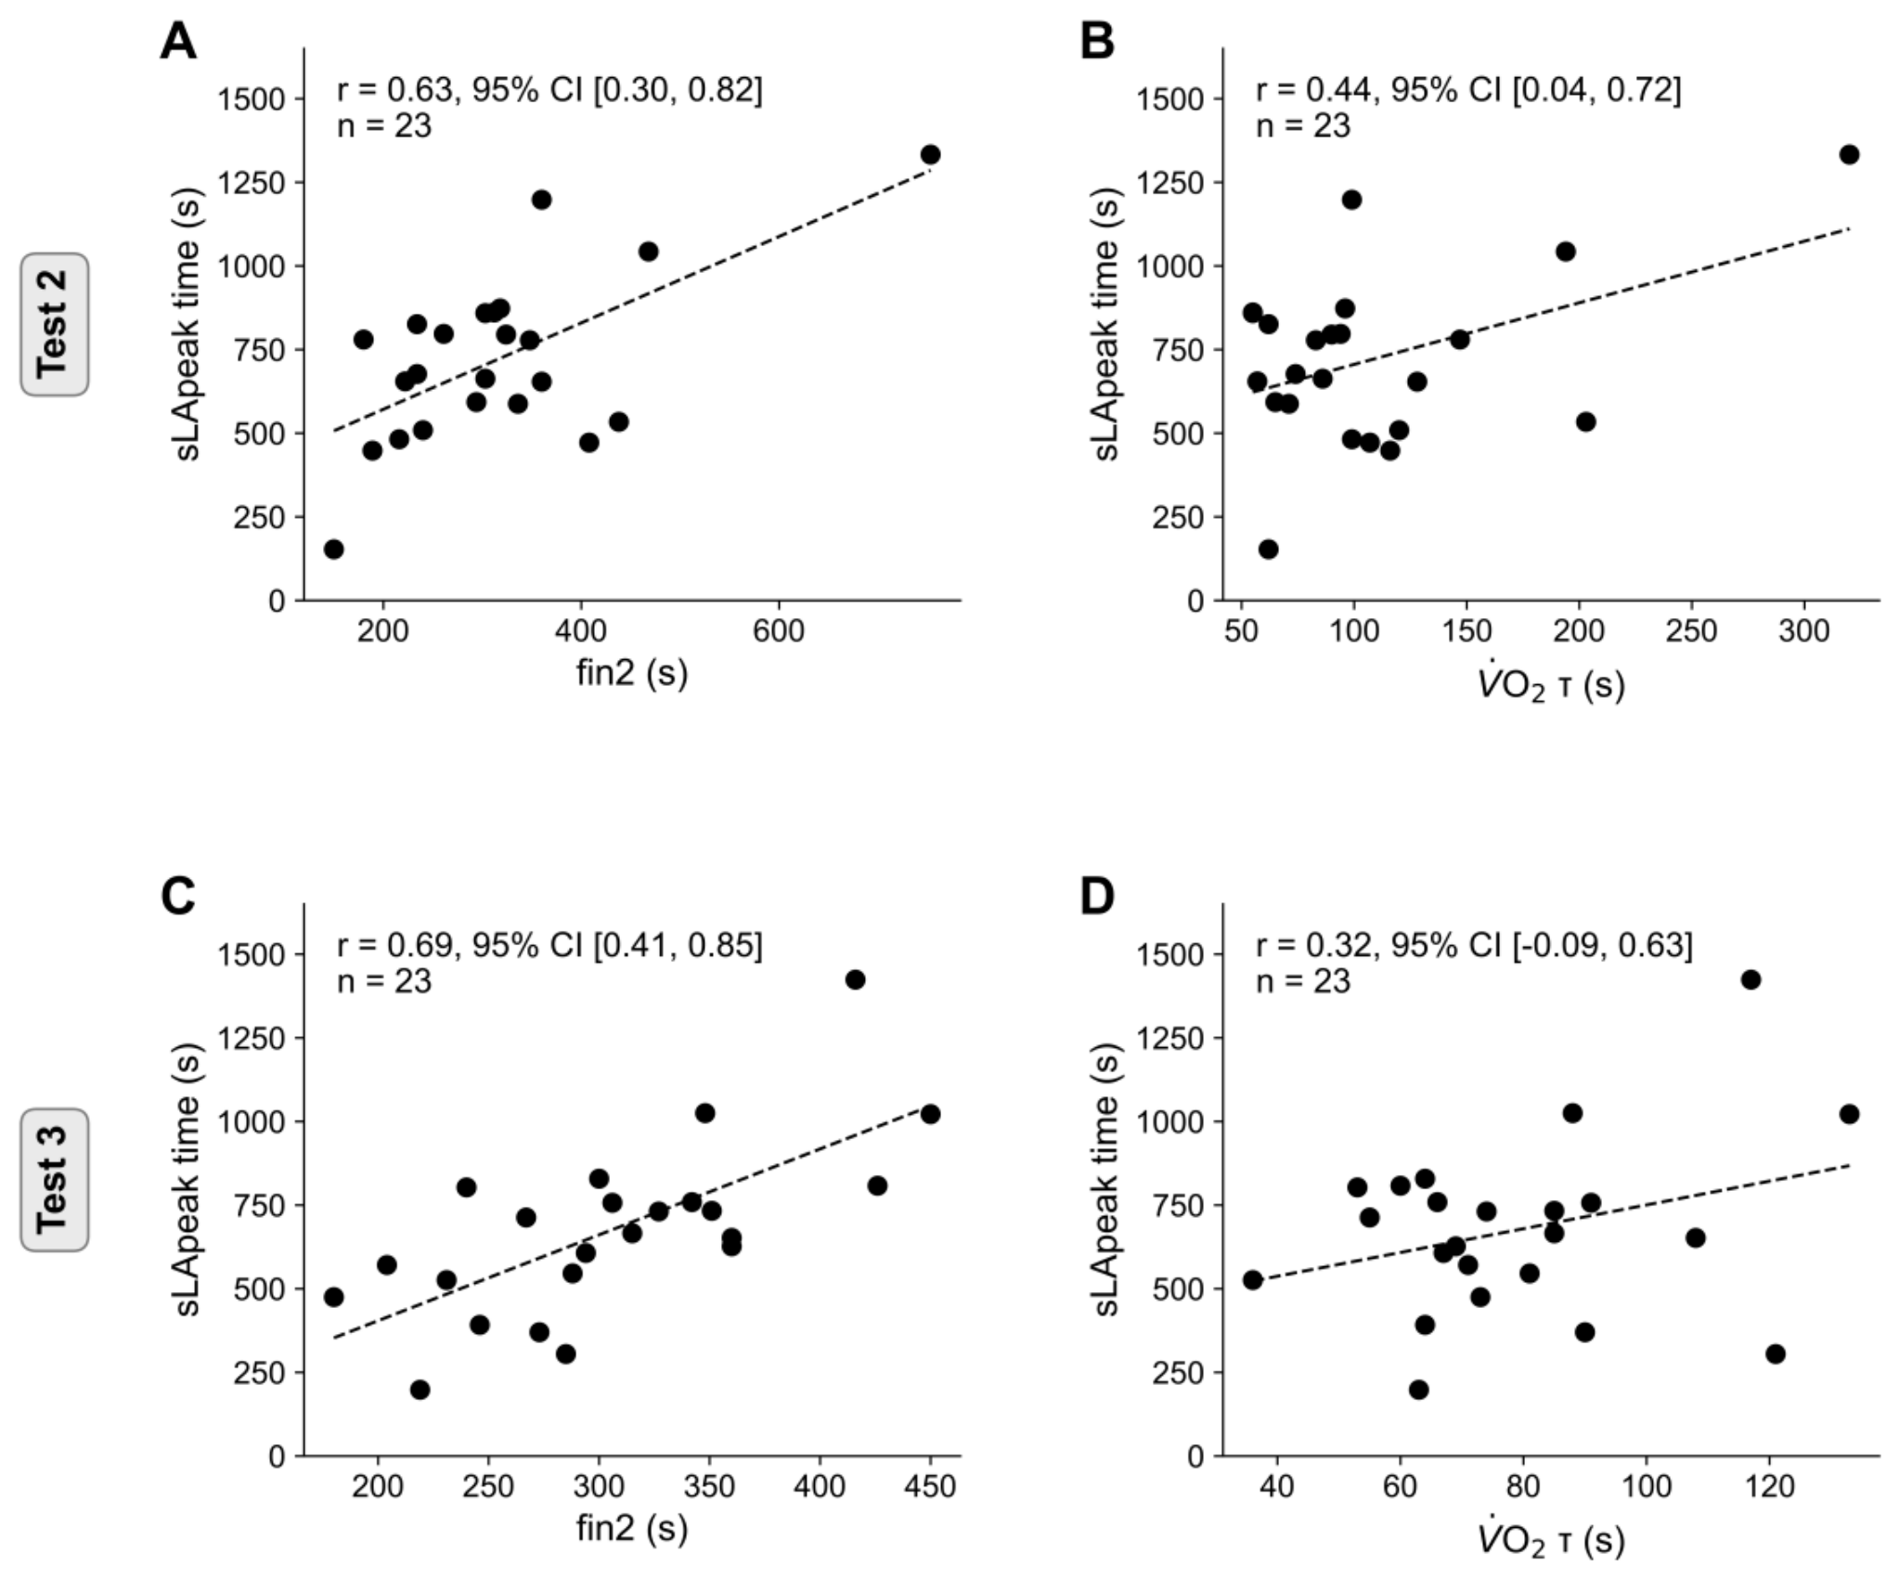
Table 6.
Multivariable linear regression analyses for the time to peak sweat lactate (sLApeak time).
Table 6.
Multivariable linear regression analyses for the time to peak sweat lactate (sLApeak time).
| Test 2 (n = 23) | Test 3 (n = 23) | |||
|---|---|---|---|---|
| Variable | β (95% CI) | p | β (95% CI) | p |
| fin2 (s) | 1.8 (0.7, 2.9) | .003 | 1.8 (0.2, 3.5) | .032 |
| Peak V̇O₂ (mL·kg⁻¹·min⁻¹) | −7.7 (−14.6, −0.7) | .032 | −8.5 (−17.2, 0.1) | .053 |
| V̇O₂ τ (s) | −0.8 (−3.0, 1.4) | .44 | 0.5 (−3.9, 4.8) | .83 |
Values are β (95% CI). Bold indicates p < 0.05. Model fit — Test 2: R² = 0.54, adjusted R² = 0.47; Test 3: R² = 0.57, adjusted R² = 0.51. All variance inflation factors were < 3, indicating no substantial multicollinearity. Abbreviations as in Table 2. The coefficient for τ was positive in the univariable analysis (Table 5) but negative at Test 2 after adjustment for fin2, indicating that the univariable association was largely shared with fin2.
Disclaimer/Publisher’s Note: The statements, opinions and data contained in all publications are solely those of the individual author(s) and contributor(s) and not of MDPI and/or the editor(s). MDPI and/or the editor(s) disclaim responsibility for any injury to people or property resulting from any ideas, methods, instructions or products referred to in the content. |
© 2026 by the authors. Licensee MDPI, Basel, Switzerland. This article is an open access article distributed under the terms and conditions of the Creative Commons Attribution (CC BY) license (http://creativecommons.org/licenses/by/4.0/).
Copyright: This open access article is published under a Creative Commons CC BY 4.0 license, which permit the free download, distribution, and reuse, provided that the author and preprint are cited in any reuse.