

Submitted:
28 September 2026
Posted:
29 September 2026
You are already at the latest version
Abstract
In ancient Japan, wet-rice agriculture is thought to have been introduced around 1000 BC, followed by sustained population growth. In 1978, Shuichi Koyama estimated the populations of the Jomon and Yayoi periods (ca. 8100 BC–AD 200) on the basis of the number of archaeological sites. However, the number of sites identified and excavated has since increased severalfold, making it desirable to reassess Koyama’s population estimates. In this study, we provide revised population estimates for the Early, Middle, and Late Yayoi periods (ca. 400 BC–AD 200), for which relevant data are relatively readily available. The estimates are based on the latest available nationwide survey conducted by Japan’s Agency for Cultural Affairs in 2021 and follow the basic framework of Koyama’s population estimation method. The results suggest that, over approximately 1,200 years from ca. 400 BC to AD 800, the population growth rate remained relatively constant at approximately 0.35% per year, corresponding to an approximate doubling of the population every 200 years. This pattern indicates that the population of ancient Japan may have increased approximately exponentially during this period. The estimated population for the Late Yayoi period (ca. AD 200) was approximately 600,000, broadly consistent with Koyama’s original estimate. An important exception, however, was observed in Tohoku and Kyushu, where the estimated population declined during the Late Yayoi period. In addition to a cooling climate, this decline may have been linked to social and political upheavals, such as the "Civil War of Wa" in the second century and the turmoil that ensued following the death of Himiko—the queen of Yamatai—in the third century. Fukuoka Prefecture in northern Kyushu is estimated to have had the largest Late Yayoi population, suggesting that Yamatai, a major polity of the period, may have been located there.
Keywords:
Yayoi
; rice
; population
; Japan
; Yamatai
; Himiko
1. Introduction
1.1. Methods for Population Estimation
Previous studies estimating the populations of the Jomon and Yayoi periods can be broadly classified into three categories according to the methods employed: (1) studies estimating absolute population size from the number of archaeological sites; (2) studies statistically reconstructing population changes based on the spread of wet-rice agriculture and radiocarbon dating; and (3) studies estimating effective population size from ancient DNA data.
The first approach represents a traditional method based primarily on archaeological evidence. Since the beginning of the twenty-first century, however, new approaches, including the second and third methods, have emerged owing to improvements in the accuracy and resolution of radiocarbon dating through accelerator mass spectrometry (AMS), as well as advances in genomic analysis enabled by next-generation sequencing technologies.
1.2. Population Estimates by Koyama
One of the most frequently cited studies remains that published by Koyama in 1978 [1], based on his doctoral dissertation submitted to the University of California in 1976 (Table 1; hereafter, “Koyama 1978”). Koyama used prefectural archaeological site inventories to estimate the populations of the Jomon and Yayoi periods. His estimates were derived from the relationship between population size and the number of archaeological sites during historical periods, together with archaeological indicators such as the estimated number of dwellings per site.
Koyama et al. subsequently updated this site-count-based approach in 1984 [2]. The population estimates presented in that work (Table 2; hereafter, “Koyama 1984”) continue to be widely cited as standard benchmark estimates in studies of Jomon- and Yayoi-period population.
To examine this pattern, settlement locations from the Late Jomon through Yayoi periods in the 2011 database of the National Museum of Japanese History (hereafter “Rekihaku 2011”) [3,4] were mapped with QGIS [5] (Figure 1).
Orange dots representing Jomon settlements are concentrated in eastern Japan, whereas green dots representing Yayoi settlements are prominent in western Japan. This pattern is consistent with the westward shift in the population center reported by Koyama. Yayoi settlements associated with wet-rice cultivation also show a stronger tendency than Jomon settlements to occupy coastal alluvial plains.
1.3. Koyama’s Estimation Method
Koyama 1978 compared counts of Jomon, Yayoi, and Haji-period sites on the premise that periods and regions with more sites probably had larger populations [1]. Because population per site varied by period, he calibrated the estimates against the population [6] and site count of the Haji period, which approached the Nara period. For the Haji period (ca. AD 250–1000), encompassing the Kofun through Nara and Heian periods, Koyama first calculated:
population from historical records (household registers, ca. AD 750) / number of sites.
This yielded a benchmark of approximately 170 persons per Haji site in Kanto: approximately 943,000 people in the mid-eighth century divided by 5,549 sites. On the basis of average settlement sizes then available, he assigned approximate relative populations per site as follows:
- Jomon phase 1: 1/20 of the Haji-period value
- Jomon phases 2–4: 1/7
- Yayoi: 1/3
The resulting calibrated values were:
- Yayoi: 56.7 persons per site
- Early through Final Jomon: 24.3 persons per site
- Initial Jomon: 8.5 persons per site
Estimated populations were obtained by multiplying these values by the site counts for each period. The 1984 study likewise described the basic approach as “number of sites × population per site” [2].
Thus, the model can be expressed as:
Population ≈ number of sites × population per site × adjustments for period duration and other factors
1.4. Limitations of Site-Count Methods
The number of recorded sites has increased substantially since Koyama’s study. Registers available in the 1970s contained approximately 28,000 Jomon and 10,000 Yayoi sites. Subsequent industrial development, expressway construction, and agricultural land improvement greatly expanded rescue excavation. The 2021 Japan’s Agency for Cultural Affairs survey (hereafter “ACA 2021”) recorded approximately three times as many sites [7].
A threefold increase in recorded sites does not, however, imply a threefold increase in the estimated ancient population. Newly recorded sites include:
- Small sites identified during development
- Different phases of the same settlement counted separately
- Artifact scatters
- Cemeteries
- Temporary activity locations
Excavation intensity also differs markedly between metropolitan and other areas. Since the 1970s, industrial estates, roads, and farmland improvement have expanded beyond Tokyo and Osaka. National recorded site counts rose by factors of 3.01 for Jomon, 3.28 for Yayoi, and 3.67 for Kofun, while some prefectures outside metropolitan areas recorded increases exceeding 100-fold [1,2,7].
Simply inserting modern totals into the Koyama 1978 formula could therefore measure modern excavation intensity rather than ancient population, producing substantial errors. A 2026 genomic study of Jomon demography likewise notes that Koyama 1978 remains a major nationwide benchmark and calls for a new nationwide estimate incorporating recent archaeological and genetic evidence [8].
1.5. Limitations of Site-Count Methods
Crema et al. (2016) analyzed 1,433 AMS radiocarbon dates from Kanto, Aomori, and Hokkaido, using the temporal density of dates as a population proxy [9].
They identified the following broad sequence:
- Growth from the Early to Middle Jomon
- Aa peak around the Middle Jomon
- Decline during the Late and Final Jomon
This independently supports the broad trajectory of Koyama’s estimates. It does not verify this absolute peak figure of approximately 260,000, but it supports the shape of the demographic curve.
Crema et al. (2020) further combined:
- Counts of pit dwellings;
- Ceramic chronology;
- Bayesian chronological models;
- Summed probability distributions (SPDs) of calibrated radiocarbon dates.
Their study area comprised of western Kanto and the central highlands. Both dwelling counts and radiocarbon dates showed a broad Middle Jomon rise and subsequent decline [13]. Crema et al. (2021) further concluded that rice cultivation spread across prehistoric Japan from approximately 1000 BC, but at markedly different rates among regions [11]. They applied an advanced Bayesian model to 294 radiocarbon dates from charred rice grains (90% credible intervals):
- Northern Kyushu: the earliest introduction occurred between 1176 and 845 BC
- Chugoku and Kansai: spread reached up to 4 km per year
- Eastern Japan: spread slowed substantially to less than 1 km per year
- Aomori, northern Honshu: discontinuous spread occurred between 709 and 203 BC
The variation in spread is attributed to:
- Mixed diffusion, involving both movement of farmers and adoption of farming by local hunter-gatherers
- Social networks, which could facilitate or impede adoption
- Environmental constraints, including regional differences in terrain and climate
1.6. Limitations of Site-Count Methods
Crema et al. (2024; hereafter “Crema 2024”) improved on Koyama 1984 in two respects when calculating reference estimates for Yayoi population [12]
- Used relatively recent 2016 Japan’s Agency for Cultural Affairs site counts (hereafter “ACA 2016”) [13]
- Calibrated each region by its own Haji-period population-to-site ratio rather than using Kanto as a nationwide standard
Crucially, they also
- 3.
- Adjusted for regional differences in the duration of the Yayoi period.
Dividing the archipelago into eight regions, the study combined:
The results indicate a marked rise in growth following the introduction of wet-rice cultivation. In some regions, annual growth reached approximately 0.2–0.5% during the first 500 years after its introduction. The three Yayoi population estimates calculated with this approach are shown in Table 3 [15,16]. The estimates differ as follows:
No corresponding Jomon estimate was calculated because ACA 2016 does not contain the five Jomon phases used by Koyama.
1.7. Population Size Inferred from Genomic Analysis
Genomic approaches provide an independent line of evidence. As shown in Figure 2, Watanabe et al. (2019) analyzed the paternally inherited Y chromosome and inferred:
- Decline in the male population in the Late and Final Jomon
- Increase around the beginning of the Yayoi period
Mizuno et al. (2021) likewise inferred substantial population growth beginning in the Yayoi period from maternally inherited mitochondrial genomes [18]. Ancient-genome studies have estimated the Jomon effective population size (Ne) at no more than several thousand, and in some studies at approximately 1,000 [19]. Note that effective population size is distinct from census population; an Ne of 1,000 does not mean that only 1,000 Jomon people lived throughout Japan. It measures the effective breeding population contributing to genetic diversity.
1.8. Synthesis and Outstanding Questions
Thus, the currently supported demographic sequence is summarized in Table 4.
Archaeology, radiocarbon dates, dwelling remains, and DNA broadly agree on a Middle Jomon peak, Late–Final Jomon contraction, and rapid growth after the adoption of rice farming. An outstanding question is how Koyama’s population estimates change when recalculated using current archaeological site data. Although Crema and colleagues made substantial progress in estimating growth rates, a consistent nationwide table of absolute population across the five Jomon phases and the Yayoi period based on the latest site counts remains unavailable. The 2026 genomic study also identifies this gap [8].
2. Evaluation of a Revised Population Estimation Method
2.1. Regional Differences in Site Discovery
Koyama’s estimate uses Haji-period population and site counts in Kanto as its baseline. In the ACA 2016 survey [13], however, population per Haji site in Kanto exceeded the corresponding values in other regions by more than threefold. Regional estimates based on a single ratio may therefore contain substantial errors.
One possible explanation is that the difficulty of detecting and excavating sites differs considerably between the Haji period and earlier periods. As noted above, Haji population per recorded site calculated from Koyama 1978 and ACA 2021 differs more than tenfold among regions (21.0 in Kanto versus 211.9 in Shikoku) [15].
Between Koyama 1978 and ACA 2021, regional Jomon site counts increased by factors of 1.62–8.05 (mean 3.31); Yayoi counts increased by factors of 1.64–5.03 (mean 3.38). The regional spread is smallest for the Yayoi period. This study therefore focuses on the Yayoi period, for which this source of error appears relatively sumaller.
2.2. Regional Differences in Site Discovery
Ancient Japan has relatively few skeletal remains bearing signs of violence compared with other contemporaneous regions [20,21,22], perhaps in part because its insular location limited external invasions. An exponential model driven by advances in wet-rice agriculture and its geographic spread may thus provide a useful approximation of archipelago-wide growth. This interpretation is broadly consistent with Koyama 1978 and Crema 2024.
Crema 2024 suggests that growth in northern Kyushu is visible in radiocarbon data by approximately 800 BC, whereas settlement data show a clearer increase only around 400 BC. The onset of growth is therefore chronologically uncertain. The Yayoi period addressed here extends approximately from 1000 BC to AD 250, with regional variation in the arrival of cultivation. For modeling purposes, sustained population growth associated with wet-rice cultivation is assumed to begin around 400 BC.
Koyama 1978 and 1984 estimate approximately 76,000 people at the end of the Jomon period, which may also approximate the population around 400 BC. Koyama’s Haji-period estimate for ca. AD 750 is approximately 5.4 million. Because that estimate draws on contemporary household registers, it may have relatively smaller errors.
Whether growth continued to ca. AD 750 is uncertain. Nevertheless, the Yamato court promoted paddy-field expansion through measures: (1) the Sanze Isshin Act of AD 723, which granted rights to newly reclaimed land for three generations or for one lifetime, and (2) the Privatization of Reclaimed Lands in Perpetuity Act (Konden Einen Shizai Hō) of AD 743. Therefore, it can be said that the population growth continued until that time.
The genomic studies discussed above also suggest exponential growth beginning in the Yayoi period. Because all available datasets have substantial uncertainty, a simple model is appropriate. We adopt an exponential growth model suggested by Koyama 1978 and genomic findings [17,18], and compare its predictions with changes in recorded site counts.
3. Population Estimation Methods
3.1. Model Specification
On the basis of the foregoing discussion, the model uses the following assumptions:
- Analysis is restricted to the Yayoi period, for which variation in prefectural discovery rates is thought to be relatively small
- Early, Middle, and Late Yayoi phases are treated as approximately 200 years each
- Site counts for these phases are analyzed using available chronological data
- To reduce prefectural variation in discovery rates, observations are aggregated into the nine regions used by Koyama.
Crema 2024 estimates annual growth of 0.2–0.5%; the midpoint, approximately 0.35%, is adopted here. The initial population is assumed to equal Koyama’s Final Jomon estimate of approximately 76,000. At 0.35% per year, population approximately doubles every 200 years. Thus, the model implies successive doublings across the Early (ca. 400–200 BC), Middle (ca. 200 BC–AD 1), and Late Yayoi (ca. AD 1–200) phases.
An important qualification is that Koyama’s Yayoi estimate of 595,000 does not directly represent the population at the end of the period, 1800 BP (ca. AD 200). It is better understood as an average or representative population inferred from sites across the Yayoi period.
3.2. Data Used
To keep the model simple, the analysis uses site counts assigned to the Early, Middle, and Late Yayoi phases under specified criteria.
ACA 2021 does not provide the chronological detail needed to derive phase-specific counts. We therefore use the 2011 settlement data of the National Museum of Japanese History (Rekihaku 2011), the largest accessible dataset with chronological assignments [3,4]. Table 5 compares site-count trends in the available sources.
As Table 6 indicates, national site totals reported by the Agency for Cultural Affairs have changed comparatively little since 2000. The 2011 data may therefore be reasonably comparable in overall scale to more recent records. This pattern may partly reflect slower economic growth after the 1990s. Accordingly, Rekihaku 2011 supplies the phase-specific Yayoi counts in this study.
Comparing the three phases within a region may cancel some differences in regional discovery rates, but it cannot remove differences in their rates of increase. The principal temporal comparison therefore uses national totals rather than regional growth rates.
3.3. Classification Procedure
Rekihaku 2011 includes chronological assignments. Records clearly classified as Early, Middle, or Late Yayoi are counted in the respective phase; ambiguous or undated records are omitted. The data may nevertheless include:
- Small sites found during development
- Different phases of the same settlement counted separately
- Artifact scatters
- Cemeteries
- Temporary activity locations
Duplicate records are also possible. The analysis therefore aggregates recorded observations without distinguishing site types; using national totals for each phase may moderate regional differences in the growth of recorded sites.
3.4. Adjusting Site Counts for Yayoi Population Growth
Population increased severalfold after the introduction of wet-rice cultivation. As discussed above, estimates derived from period-wide site counts using Koyama’s or Crema’s approach represent an average across the Yayoi period rather than its terminal population.
With annual growth of approximately 0.35%, population nearly doubles every 200 years and increases approximately eightfold over the 600 years from 400 BC to AD 200. Recorded sites accumulated across that span represent a time-integrated quantity. The following integral is used to relate this quantity to the modeled terminal population:
Integral of an exponential function:
from which
the integral equals approximately 2042.5. This represents the cumulative quantity corresponding to 600 years of growth at 0.35% annually from an initial value of one. 1.0035600 = 8.14.
As shown in Figure 3, setting initial population to one gives a cumulative value of approximately 2042.5; the period average is 2042.5/600 = 3.40, whereas the terminal index is 8.14. Estimating the terminal population from a period average therefore requires a factor of 8.14/3.40 = 2.39.
Presumably taking this point into account, Koyama (1978) estimates the date of the Yayoi period as 1800 BP (ca. AD 200). Similar issues arise in cases of population decline. If the population during the Final Jomon period had dropped to half of that in the Late Jomon period, the population at the end of the Final Jomon might have fallen below the figure of approximately 76,000 estimated by Koyama for the transition from the Final Jomon to the Initial Yayoi period; however, this specific point has not been explicitly examined.
In this model, as in Koyama (1984), the population at the end of the Yayoi period is tentatively set at approximately 600,000. Since no valid correction factor is available for the population figures spanning the Final Jomon to the Initial Yayoi period, Koyama’s (1984) figure of 75,800 is adopted directly as the starting value.
3.5. GIS Mapping
Rekihaku 2011 provides site coordinates. We plot 5,514 Yayoi records onto a GIS to examine geographic distribution. Because site types and regional discovery rates are not controlled, these maps are treated as descriptive evidence.
4. Results
4.1. Nationwide Population Estimates
Hokkaido and Okinawa are excluded to match Koyama 1978 and 1984. Given considerable numerical uncertainty, benchmark years are set at convenient 200-year intervals, corresponding approximately to successive doublings. Table 7 presents the estimates. The 0.35% annual-growth curve is broadly consistent with the population estimates and site counts shown in Figure 4.

Table 8.
Changes and Percentage Changes in Recorded Site Counts.
| Region | Early Yayoi (A) |
Middle Yayoi (B) | Late Yayoi (C) |
Middle/Early (B/A) |
Late/Middle (C/B) |
Overall (C/A) |
|---|---|---|---|---|---|---|
| Tohoku | 64 | 98 | 51 | 153% | 52% | 80% |
| Kanto | 128 | 265 | 719 | 207% | 271% | 562% |
| Hokuriku | 188 | 260 | 581 | 138% | 223% | 309% |
| Chubu | 67 | 160 | 235 | 239% | 147% | 351% |
| Tokai | 89 | 169 | 253 | 190% | 150% | 284% |
| Kinki | 245 | 516 | 633 | 211% | 123% | 258% |
| Chugoku | 123 | 258 | 402 | 210% | 156% | 327% |
| Shikoku | 158 | 228 | 333 | 144% | 146% | 211% |
| Kyushu | 270 | 695 | 614 | 257% | 88% | 227% |
| Total | 1,332 | 2,649 | 3,821 | 199% | 144% | 287% |
Note: Red indicates values above 200%; blue indicates a decrease.
To estimate regional populations, differences in discovery rates are adjusted using the ratio between Rekihaku 2021 and ACA 2021 Yayoi settlement/artifact-scatter counts. Table 9 presents the resulting adjustment factors.
4.2. GIS Results
Figure 5 maps 5,514 recorded sites of Yayoi-period settlements and artifact scatters. Yellow dots indicate sites spanning both the Jomon and Yayoi periods, while green dots represent sites belonging solely to the Yayoi period. Figure 6 presents a heat map of western Japan. In northern Kyushu, continuous areas of high population density are observed along the plains (within the red circle), whereas in the Kinai region, concentrations are found around the Yamato River delta—facing the former Kawachi (Osaka) Bay—and in the vicinity of the Makimuku site (within the blue circle).
5. Discussion
5.1. Comparison with Semiconductor Technology
“Moore’s Law,” which describes the level of integration in integrated circuits, is a familiar example of an exponential model. As summarized in Table 12 and Figure 7, it is an empirical observation that the number of transistors on an integrated circuit doubles approximately every 18 to 24 months.
This model suggests that the population increased at a nearly exponential rate from the introduction of wet-rice cultivation through the Nara period (AD 710–794). The author argue that technological changes in food production, occurring amidst relatively limited external disturbances, contributed to this trend. However, the formal resemblance to Moore’s Law does not imply an equivalence in established causal relationships; it is an analogy.
5.2. Regional Exceptions
While the estimated population generally shows an upward trend, Table 8 indicates a likely population decline in the Tohoku and Kyushu regions during the Late Yayoi period. Regarding the Tohoku region, the impact of a cooling climate has been cited as a factor; for the Kyushu region, the decline may have been influenced by the “Civil of Wa” in the second century or the internal strife that followed the death of Himiko in the third century. However, as these estimates involve a degree of uncertainty, they remain within the realm of hypothesis.
5.3. Comparison with Semiconductor Technology
An analogy between Moore’s law and ancient Japanese civil engineering can be expressed as:
Improved civil engineering -> Expanded cultivated land -> Increased food supply
-> Population growth → Larger and more sophisticated civil engineering…
Positive feedback may be involved in both processes. As shown in Table 13 and Figure 8, the volume (scale) of the largest civil engineering projects undertaken in ancient Japan may have doubled over a timescale of approximately one century. If the level of technology remained constant, the capacity to execute civil engineering projects would tend to expand in proportion to the available labor force. Therefore, the observed increase in earthwork volume reflects not only changes in population but also changes in technology and organization. Since this trend exceeds the modeled annual population growth rate of approximately 0.35%, it appears broadly consistent when technological progress is taken into account.
5.4. Location of Yamatai
Yamatai, a major third-century polity in the Japanese archipelago ruled by Queen Himiko, is described in the Chinese historical account known as the Wei Zhi. Regarding the interpretation of the itinerary, directions, and distances described in the text, there has long been a fierce debate between two main theories concerning the location of Yamatai: the “Kyushu theory” and the “Kinai theory.”
Currently, the leading candidate location under the Kyushu theory is Fukuoka Prefecture, while Nara Prefecture is the leading candidate under the Kinai (Kinki) theory. Table 14 and Figure 9 and Figure 10 present data on the distribution of Yayoi-period archaeological sites—based on ACA 2021—used in this study. The number of such sites serves as a proxy for regional population size; Fukuoka Prefecture has more than five times the number of sites found in Nara Prefecture. This might suggest a probability that Yamatai was located in northern Kyushu, where Fukuoka Prefecture is situated.
Furthermore, Fukuoka Prefecture significantly surpasses Nara Prefecture in terms of the bronze mirrors and weapons mentioned in the text [41,42]. Judging by the number of archaeological sites and excavated artifacts, it is likely that Yamatai existed in northern Kyushu.
Of the records from ACA2011, 4,402 entries were successfully plotted on the GSI Maps (Figure 9 and Figure 10). In the Kyushu region, several areas with dense clusters of settlements extend across the plains. In the Kinki region, dense settlement clusters are observed in the Yamato River delta zone—which once faced the ancient Lake Kawachi—and at the Makimuku site.
In both regions, it is evident that many archaeological sites are distributed at elevations of 5 to 10 meters. Given that many of the rice paddies of that era are believed to have been located along the coast, and taking into account the sediment accumulation that has occurred since then, the coastline at that time may have been situated in this vicinity.
6. Conclusions
The model in this study suggests a nearly constant exponential population growth rate of approximately 0.35% per year (a pace that doubles the population every 200 years) from around 400 BC to AD 80. One exception is a population decline observed in the Tohoku and Kyushu regions during the late Yayoi period, which may be linked to climatic cooling or political instability. The estimated population at the end of the Yayoi period is approximately 600,000, a figure close to the estimate proposed by Koyama. The comparison to “Moore’s Law” is merely an intuitive analogy. It should be noted that these figures are based on simplified assumptions. Furthermore, while the study relies primarily on data from the Yayoi period—for which estimates are relatively straightforward to derive—several parameters remain subject to uncertainty.
The estimates indicate that the Kyushu region—specifically Fukuoka Prefecture in northern Kyushu—held the largest population during the Yayoi period. This finding may serve as circumstantial evidence supporting the hypothesis that Yamataikoku was located in northern Kyushu.
Future progress depends on the deepening of research into ancient history, the availability of accessible and well-organized public data, and methodological innovation.
Acknowledgments
The author expresses sincere gratitude to Yamataikoku Society for its helpful advice on how to conduct this study. The author expresses sincere gratitude to Biten Yasumoto.
Conflicts of Interest
The author declares no conflict of interest.
Appendix A
Table A1.
Koyama’s Regional Classification.
| Region | Prefectures |
|---|---|
| Tohoku | Aomori, Iwate, Miyagi, Akita, Yamagata, Fukushima |
| Kanto | Ibaraki, Tochigi, Gunma, Saitama, Chiba, Tokyo, Kanagawa |
| Hokuriku | Niigata, Toyama, Ishikawa, Fukui |
| Chubu | Yamanashi, Nagano, Gifu |
| Tokai | Shizuoka, Aichi |
| Kinki | Mie, Shiga, Kyoto, Osaka, Hyogo, Nara, Wakayama |
| Chugoku | Tottori, Shimane, Okayama, Hiroshima, Yamaguchi |
| Shikoku | Tokushima, Kagawa, Ehime, Kochi |
| Kyushu | Fukuoka, Saga, Nagasaki, Kumamoto, Oita, Miyazaki, Kagoshima |
References
- Koyama, S. Jomon subsistence and population. Senri Ethnol. Stud. 1978, 2, 1–65. Available online: https://minpaku.repo.nii.ac.jp/record/3481/files/SES02_002.pdf.
- Koyama, S.; et al. Jomon population simulation. Bull. Natl. Mus. Ethnol. 1984, 9(1), 1–39. Available online: https://minpaku.repo.nii.ac.jp/record/4444/files/KH_009_1_001.pdf.
- National Museum of Japanese History. Jomon and Yayoi Settlement Database. Available online: https://www.rekihaku.ac.jp/up-cgi/login.pl?p=param/jomo/db_param.
- Available online: https://github.com/ercrema/yayoi_demo/blob/main/data/site_raw.csv.
- Available online: https://www.qgis.org/.
- Sawada, G. A Quantitative Study of Civil Administration and Economy in the Nara Period; Fuzanbo: Tokyo, 1927. [Google Scholar]
- Agency for Cultural Affairs. Supplementary material: Number of known buried cultural-property sites in FY2021, Section II, settlement remains and artifact scatters, B, by period. ACA, 2022. Available online: https://www.bunka.go.jp/seisaku/bunkazai/shokai/pdf/93717701_02.pdf.
- Yoshida, K.; et al. Demographic history of the Jomon people: insights from whole-mitogenome analysis. Anthropol. Sci. 2026, 134(1), 15–28. [Google Scholar] [CrossRef] [PubMed]
- Crema, E.R.; et al. Summed Probability Distribution of 14C Dates Suggests Regional Divergences in the Population Dynamics of the Jomon Period in Eastern Japan. PLoS ONE 2016, 11(4), e0154809. [Google Scholar] [CrossRef] [PubMed]
- Crema, E.R.; et al. A multi-proxy inference of Jōmon population dynamics using bayesian phase models, residential data, and summed probability distribution of 14C dates. J. Archaeol. Sci. 2020, 17, 105136. [Google Scholar] [CrossRef]
- Crema, E.R.; et al. Bayesian analyses of direct radiocarbon dates reveal geographic variations in the rate of rice farming dispersal in prehistoric Japan. Sci. Adv. 2022, 8, eadc9171. [Google Scholar] [CrossRef] [PubMed]
- Crema, E.R.; et al. Regional variations in the demographic response to the arrival of rice farming in prehistoric Japan. Antiquity 2024, 98(401), 1290–1305. [Google Scholar] [CrossRef]
- Agency for Cultural Affairs. Statistics on buried cultural properties, FY2016. ACA. 2017. Available online: https://www.bunka.go.jp/seisaku/bunkazai/shokai/pdf/h29_03_maizotokei.pdf.
- Available online: https://github.com/ercrema/yayoi_demo/blob/main/data/prefecture_data.csv.
- Available online: https://github.com/ercrema/yayoi_demo/blob/main/results/pop_estimate_compare.csv.
- Available online: https://static.cambridge.org/content/id/urn%3Acambridge.org%3Aid%3Aarticle%3AS0003598X24001467/resource/name/S0003598X24001467sup001.docx.
- Watanabe, Y.; et al. Analysis of whole Y-chromosome sequences reveals the Japanese population history in the Jomon period. Sci. Rep. 2019, 9, 8556. [Google Scholar] [CrossRef] [PubMed]
- Mizuno, F.; et al. Population dynamics in the Japanese Archipelago since the Pleistocene revealed by the complete mitochondrial genome sequences. Sci. Rep. 2021, 11, 12018. [Google Scholar] [CrossRef] [PubMed]
- Cooke, N.P.; et al. Ancient genomics reveals tripartite origins of Japanese populations. Sci. Adv. 2021, 7, eabh2419. [Google Scholar] [CrossRef] [PubMed]
- Kawahata, H.; et al. Changes of environments and human activity at the Sannai-Maruyama ruins in Japan during the mid-Holocene Hypsithermal climatic interval. In Quaternary Science Reviews; 2009. [Google Scholar] [CrossRef]
- Kawahata, H.; et al. Violence in the prehistoric period of Japan: the spatio-temporal pattern of skeletal evidence for violence in the Jomon period. Biol. Lett. 2016, 12(3), 20160028. [Google Scholar] [CrossRef] [PubMed]
- Nakagawa, T.; et al. Violence and warfare in prehistoric Japan. Lett. Evol. Behav. Sci. 2017, 8(1), 8–11. [Google Scholar] [CrossRef]
- Nakagawa, T.; et al. Population pressure and prehistoric violence in the Yayoi period of Japan. J. Archaeol. Sci. 2021, 132, 105420. [Google Scholar] [CrossRef]
- Available online: https://www.bunka.go.jp/tokei_hakusho_shuppan/hakusho_nenjihokokusho/archive/pdf/93768901_01.pdf (accessed on June 1971).
- History of Cultural Administration. Available online: https://www.bunka.go.jp/tokei_hakusho_shuppan/hakusho_nenjihokokusho/archive/pdf/r1402577_02.pdf (accessed on June 1978).
- History of Cultural Administration. Available online: https://www.bunka.go.jp/tokei_hakusho_shuppan/hakusho_nenjihokokusho/archive/pdf/93969801_07.pdf (accessed on June 1978).
- Available online: https://www.city.yonezawa.yamagata.jp/material/files/group/35/bunkazainenpo2002.pdf.
- Available online: https://www.bunka.go.jp/tokei_hakusho_shuppan/hakusho_nenjihokokusho/archive/pdf/94064101_03.pdf (accessed on May 1995).
- Available online: https://www.bunka.go.jp/tokei_hakusho_shuppan/hakusho_nenjihokokusho/archive/pdf/93887001_01.pdf (accessed on April 2001).
- Nara National Research Institute for Cultural Properties. Available online: https://www.nabunken.go.jp/nabunkenblog/2014/06/tanken23.html.
- GSI Maps, Geospatial Information Authority of Japan. Available online: Https://Maps.gsi.go.jp/. [CrossRef]
- Available online: https://bunkazai.city.fukuoka.lg.jp/cultural_properties/detail/430.
- Available online: https://online.bunka.go.jp/heritages/detail/138834.
- Available online: https://www.yoshinogari.jp/introduction/qa/.
- Available online: https://kunishitei.bunka.go.jp/heritage/detail/401/00003969.
- Ishikawa, N. Studies on the Construction of Keyhole-Shaped Tumuli; Rokko Publishing: Tokyo, 1989. [Google Scholar]
- Available online: https://www.city.habikino.lg.jp/soshiki/shougaigakushu/bunka-sekai/bunkazainikansurukoto/bunkazai_shokai/kaisetsu/2328.html.
- Obayashi Corporation. Available online: https://www.obayashi.co.jp/kikan_obayashi/detail/digest_kikan_20_idea.html.
- Takeda, M. A Study of the Fujiwara Capital; Doseisha: Tokyo, 2022. [Google Scholar]
- Takeda, M. A Study of the Fujiwara Capital. In Kokugakuin University Academic Repository K-RAIN; 2025. [Google Scholar] [CrossRef]
- Yasumoto, B. Data Science Resolves Yamatai: The Northern Kyushu Theory Remains Strong; Asahi Shinbun Publishing: Tokyo, 2021. [Google Scholar]
- Kanazawa, M. Five-meter Accuracy 3D Maps and Generative AI Illuminate Ancient Japan 1,800 Years Ago: Yamatai Queendom and First Emperor Jimmu. MDPI 2026. [Google Scholar] [CrossRef]
Figure 1.
Distribution of Settlements from the Late Jomon through the Yayoi period.
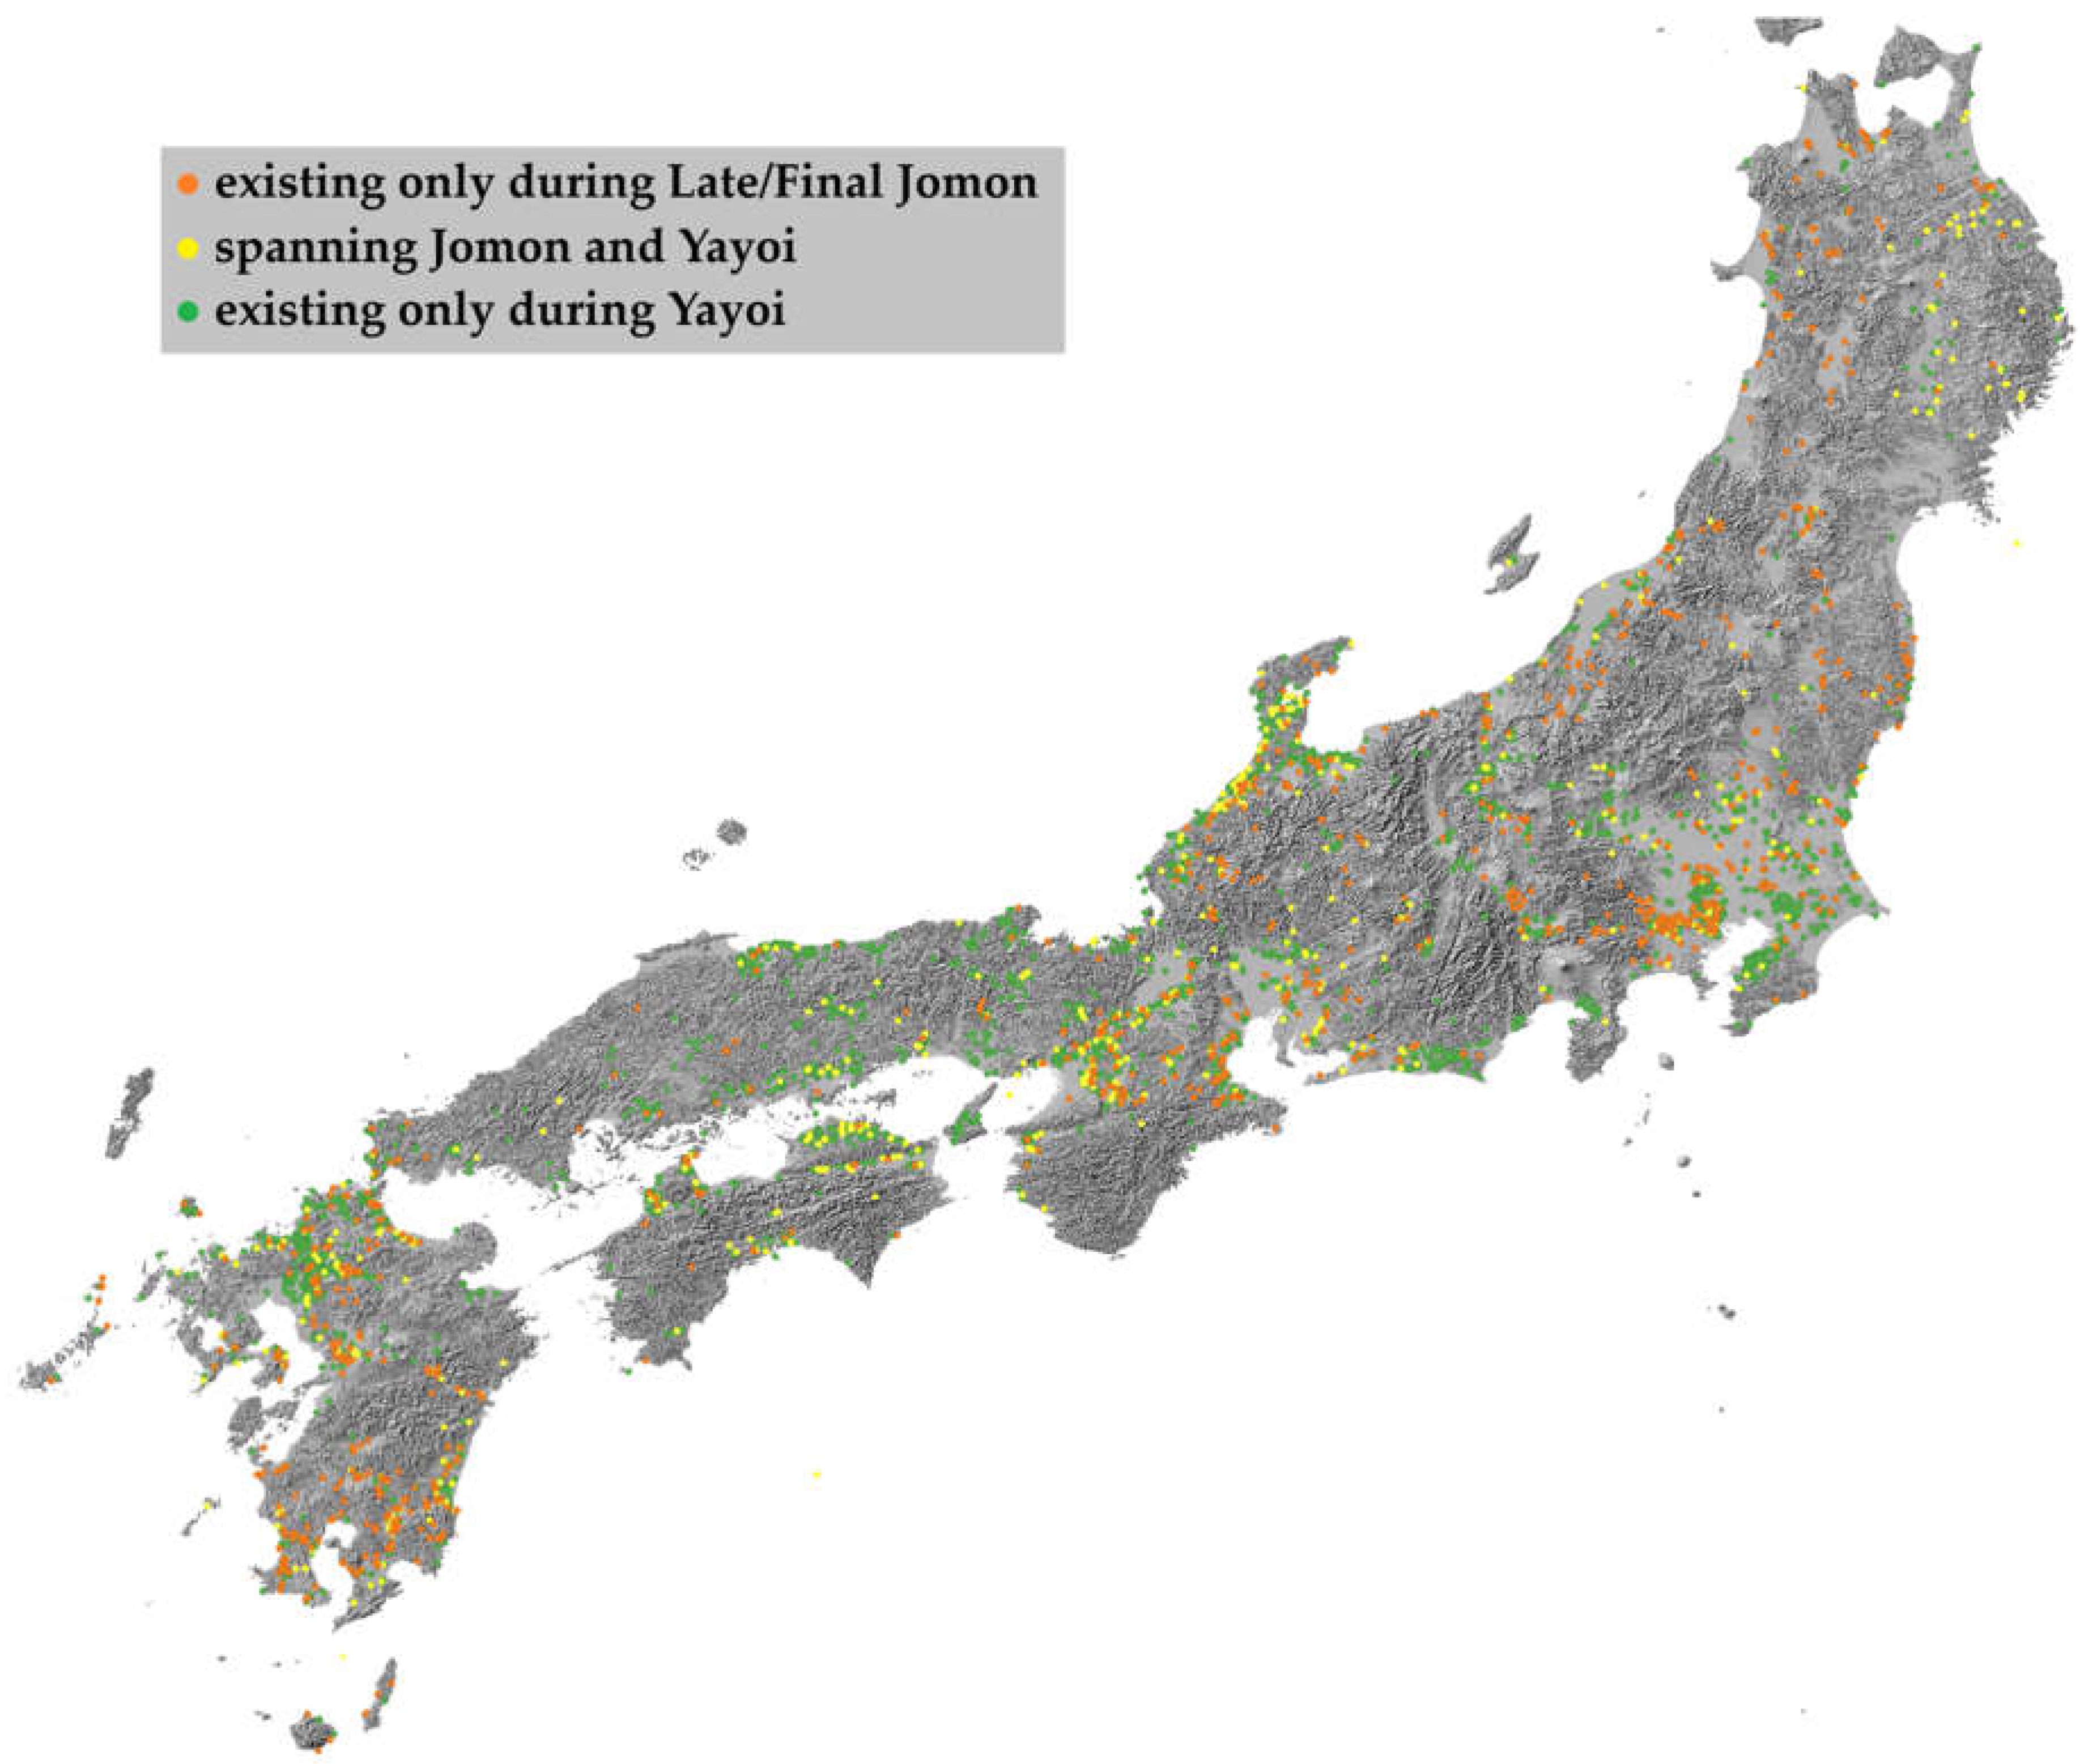
Figure 2.
Population Size from Watanabe et al. (modefied) [17].
Figure 2.
Population Size from Watanabe et al. (modefied) [17].
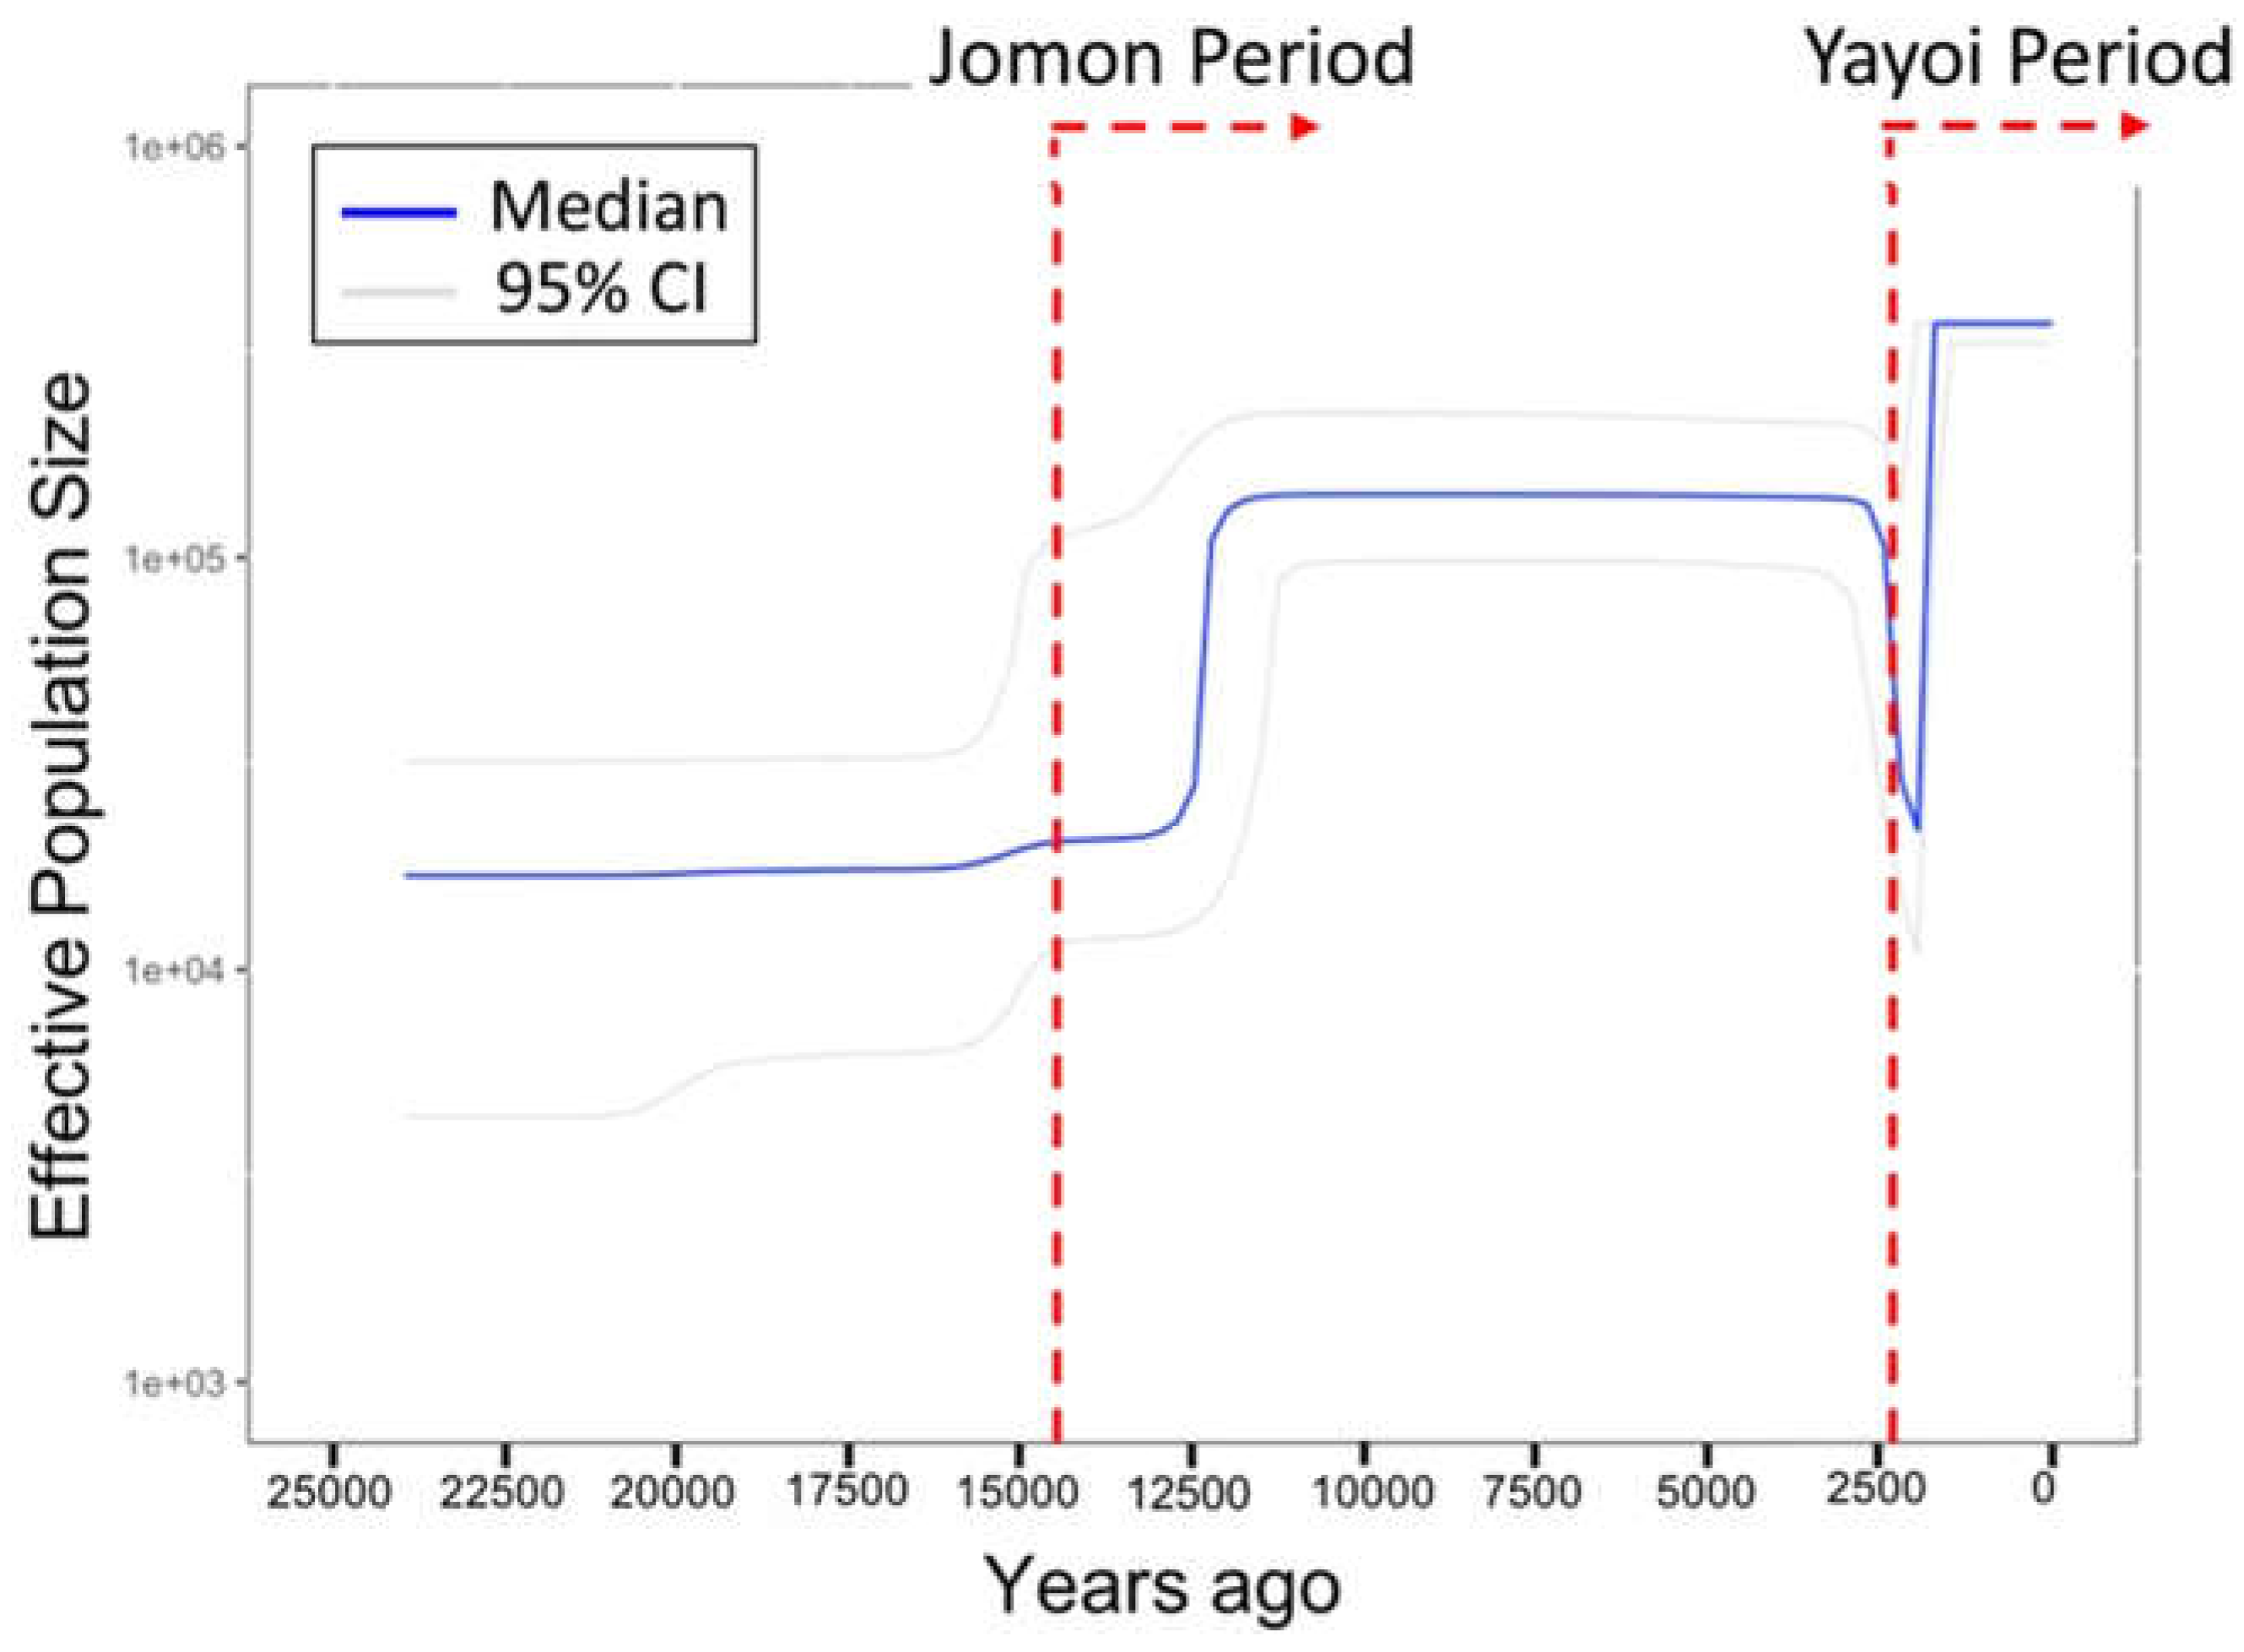
Figure 3.
Relationship between Site Counts and Population Growth.
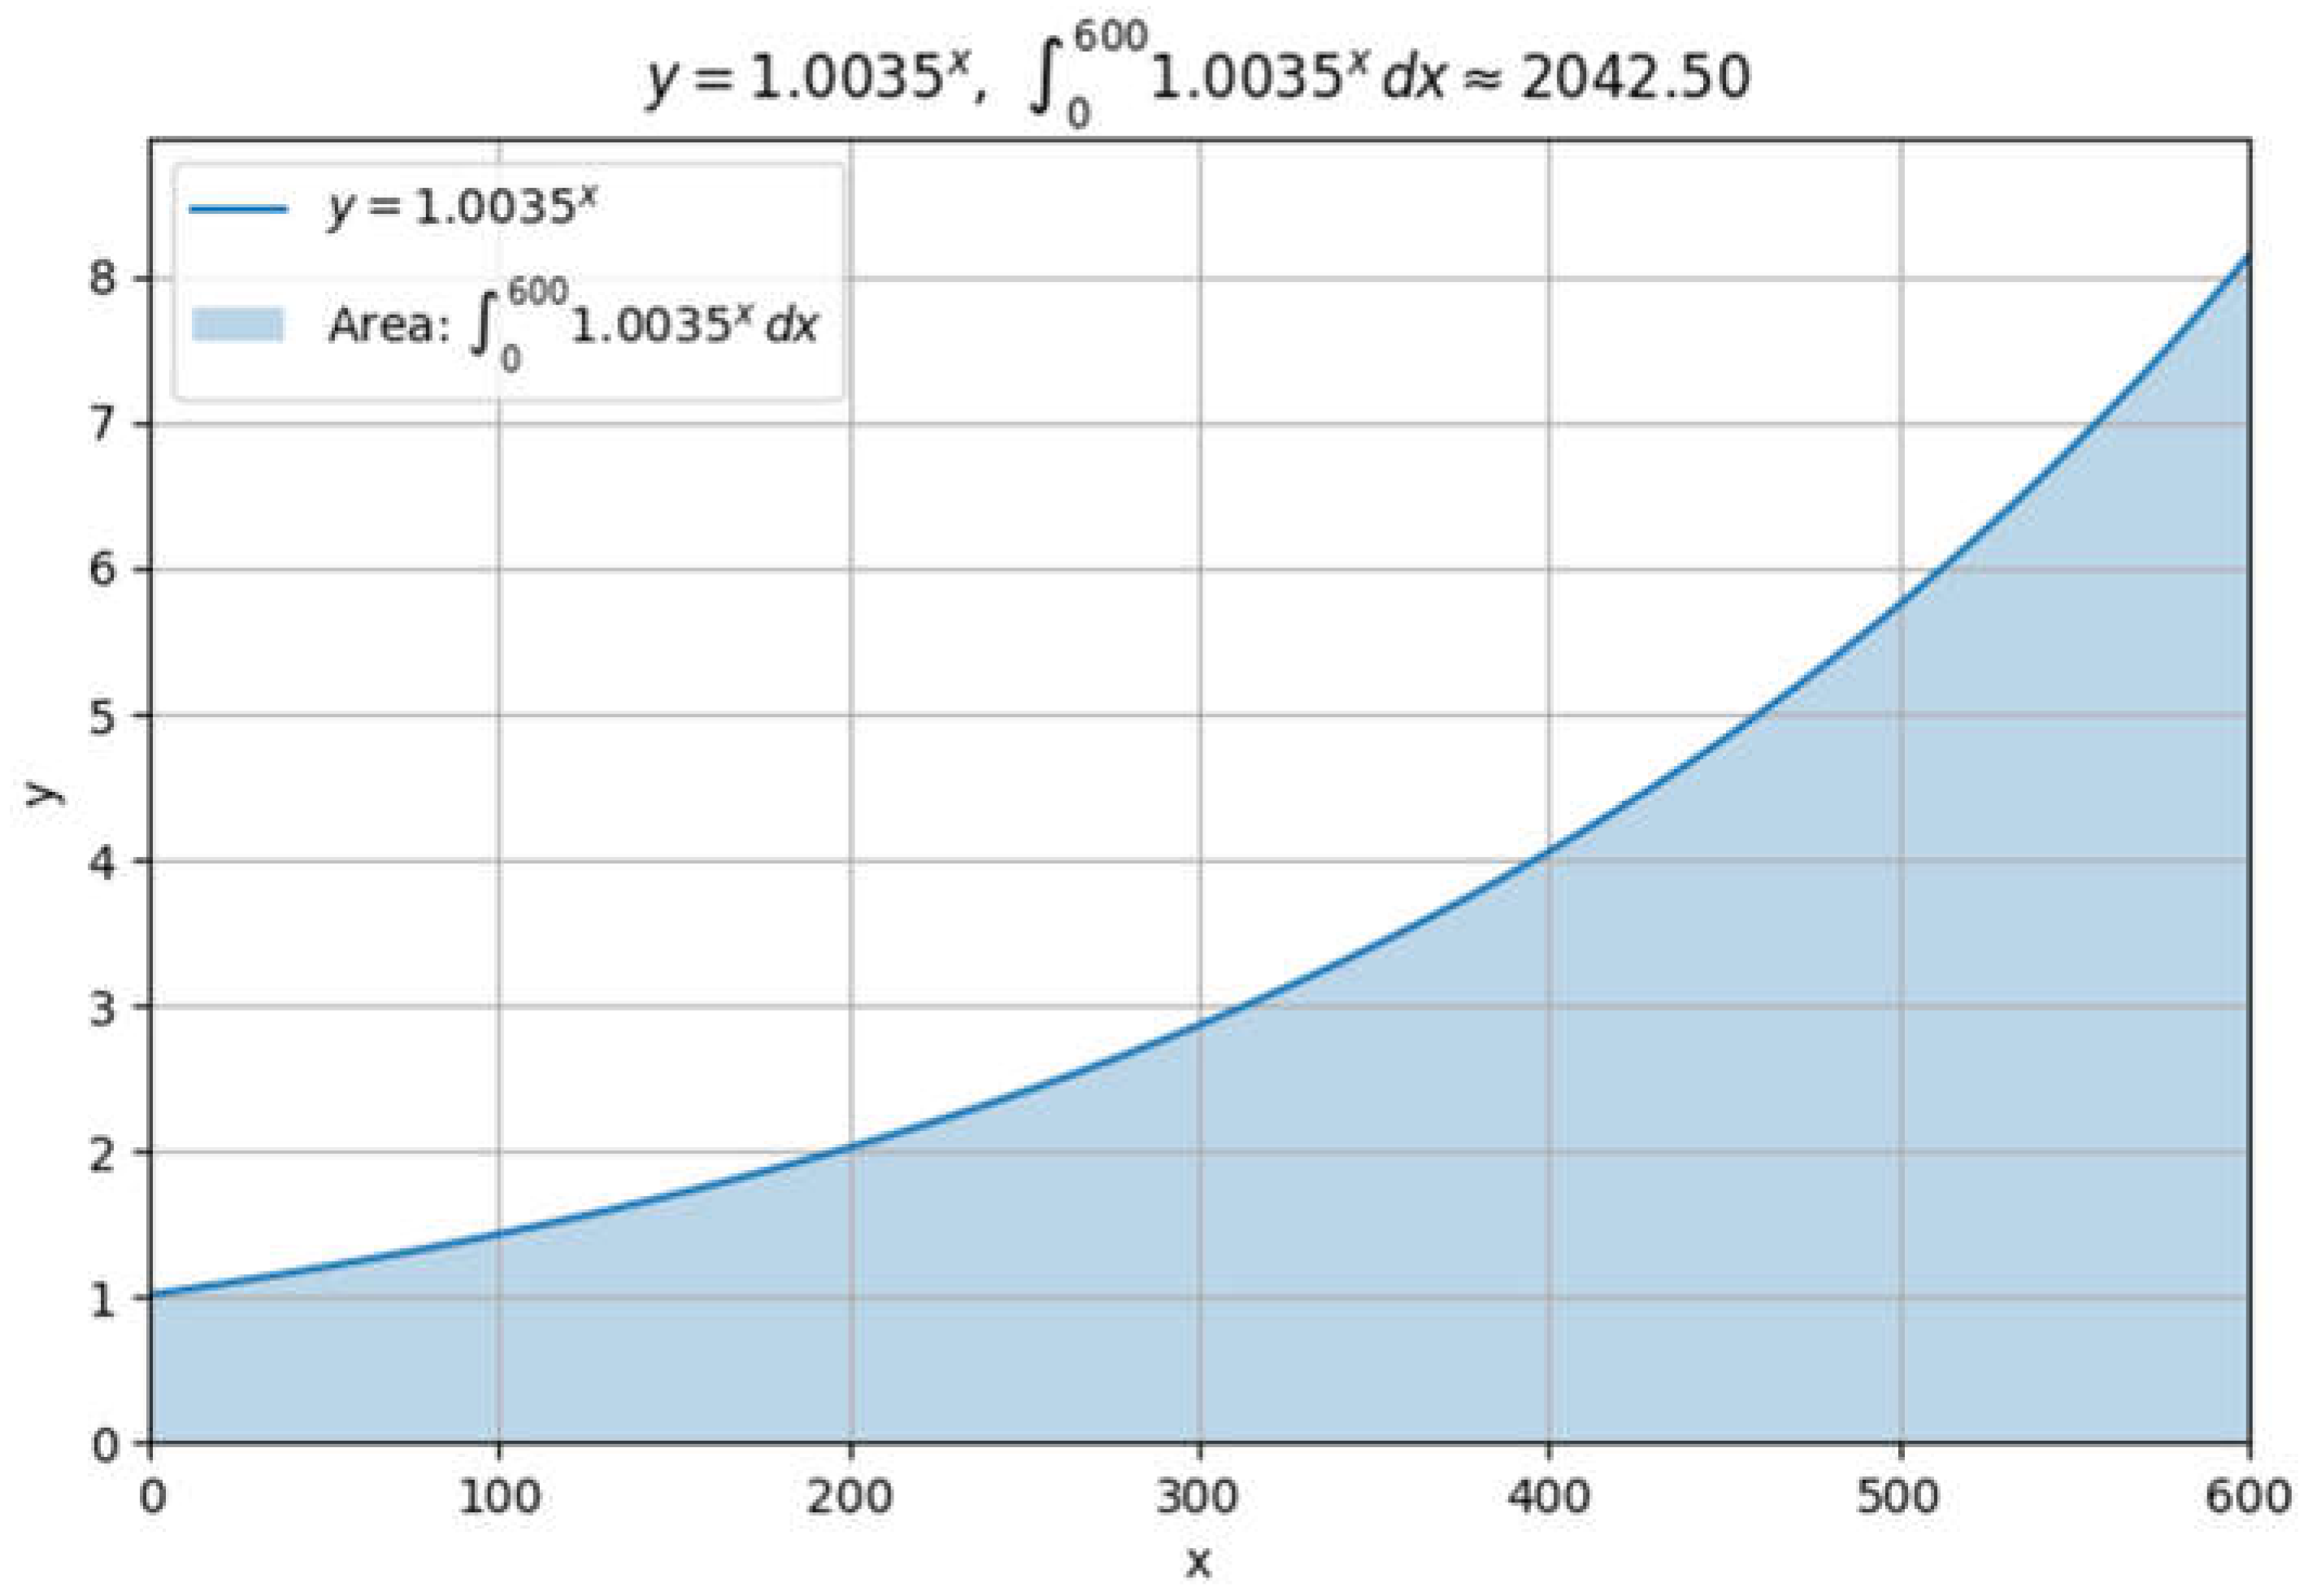
Figure 4.
Comparison with Previous Studies. Note: “×” indicates an extrapolation based on the number of sites in 200 BC in this study.
Figure 4.
Comparison with Previous Studies. Note: “×” indicates an extrapolation based on the number of sites in 200 BC in this study.
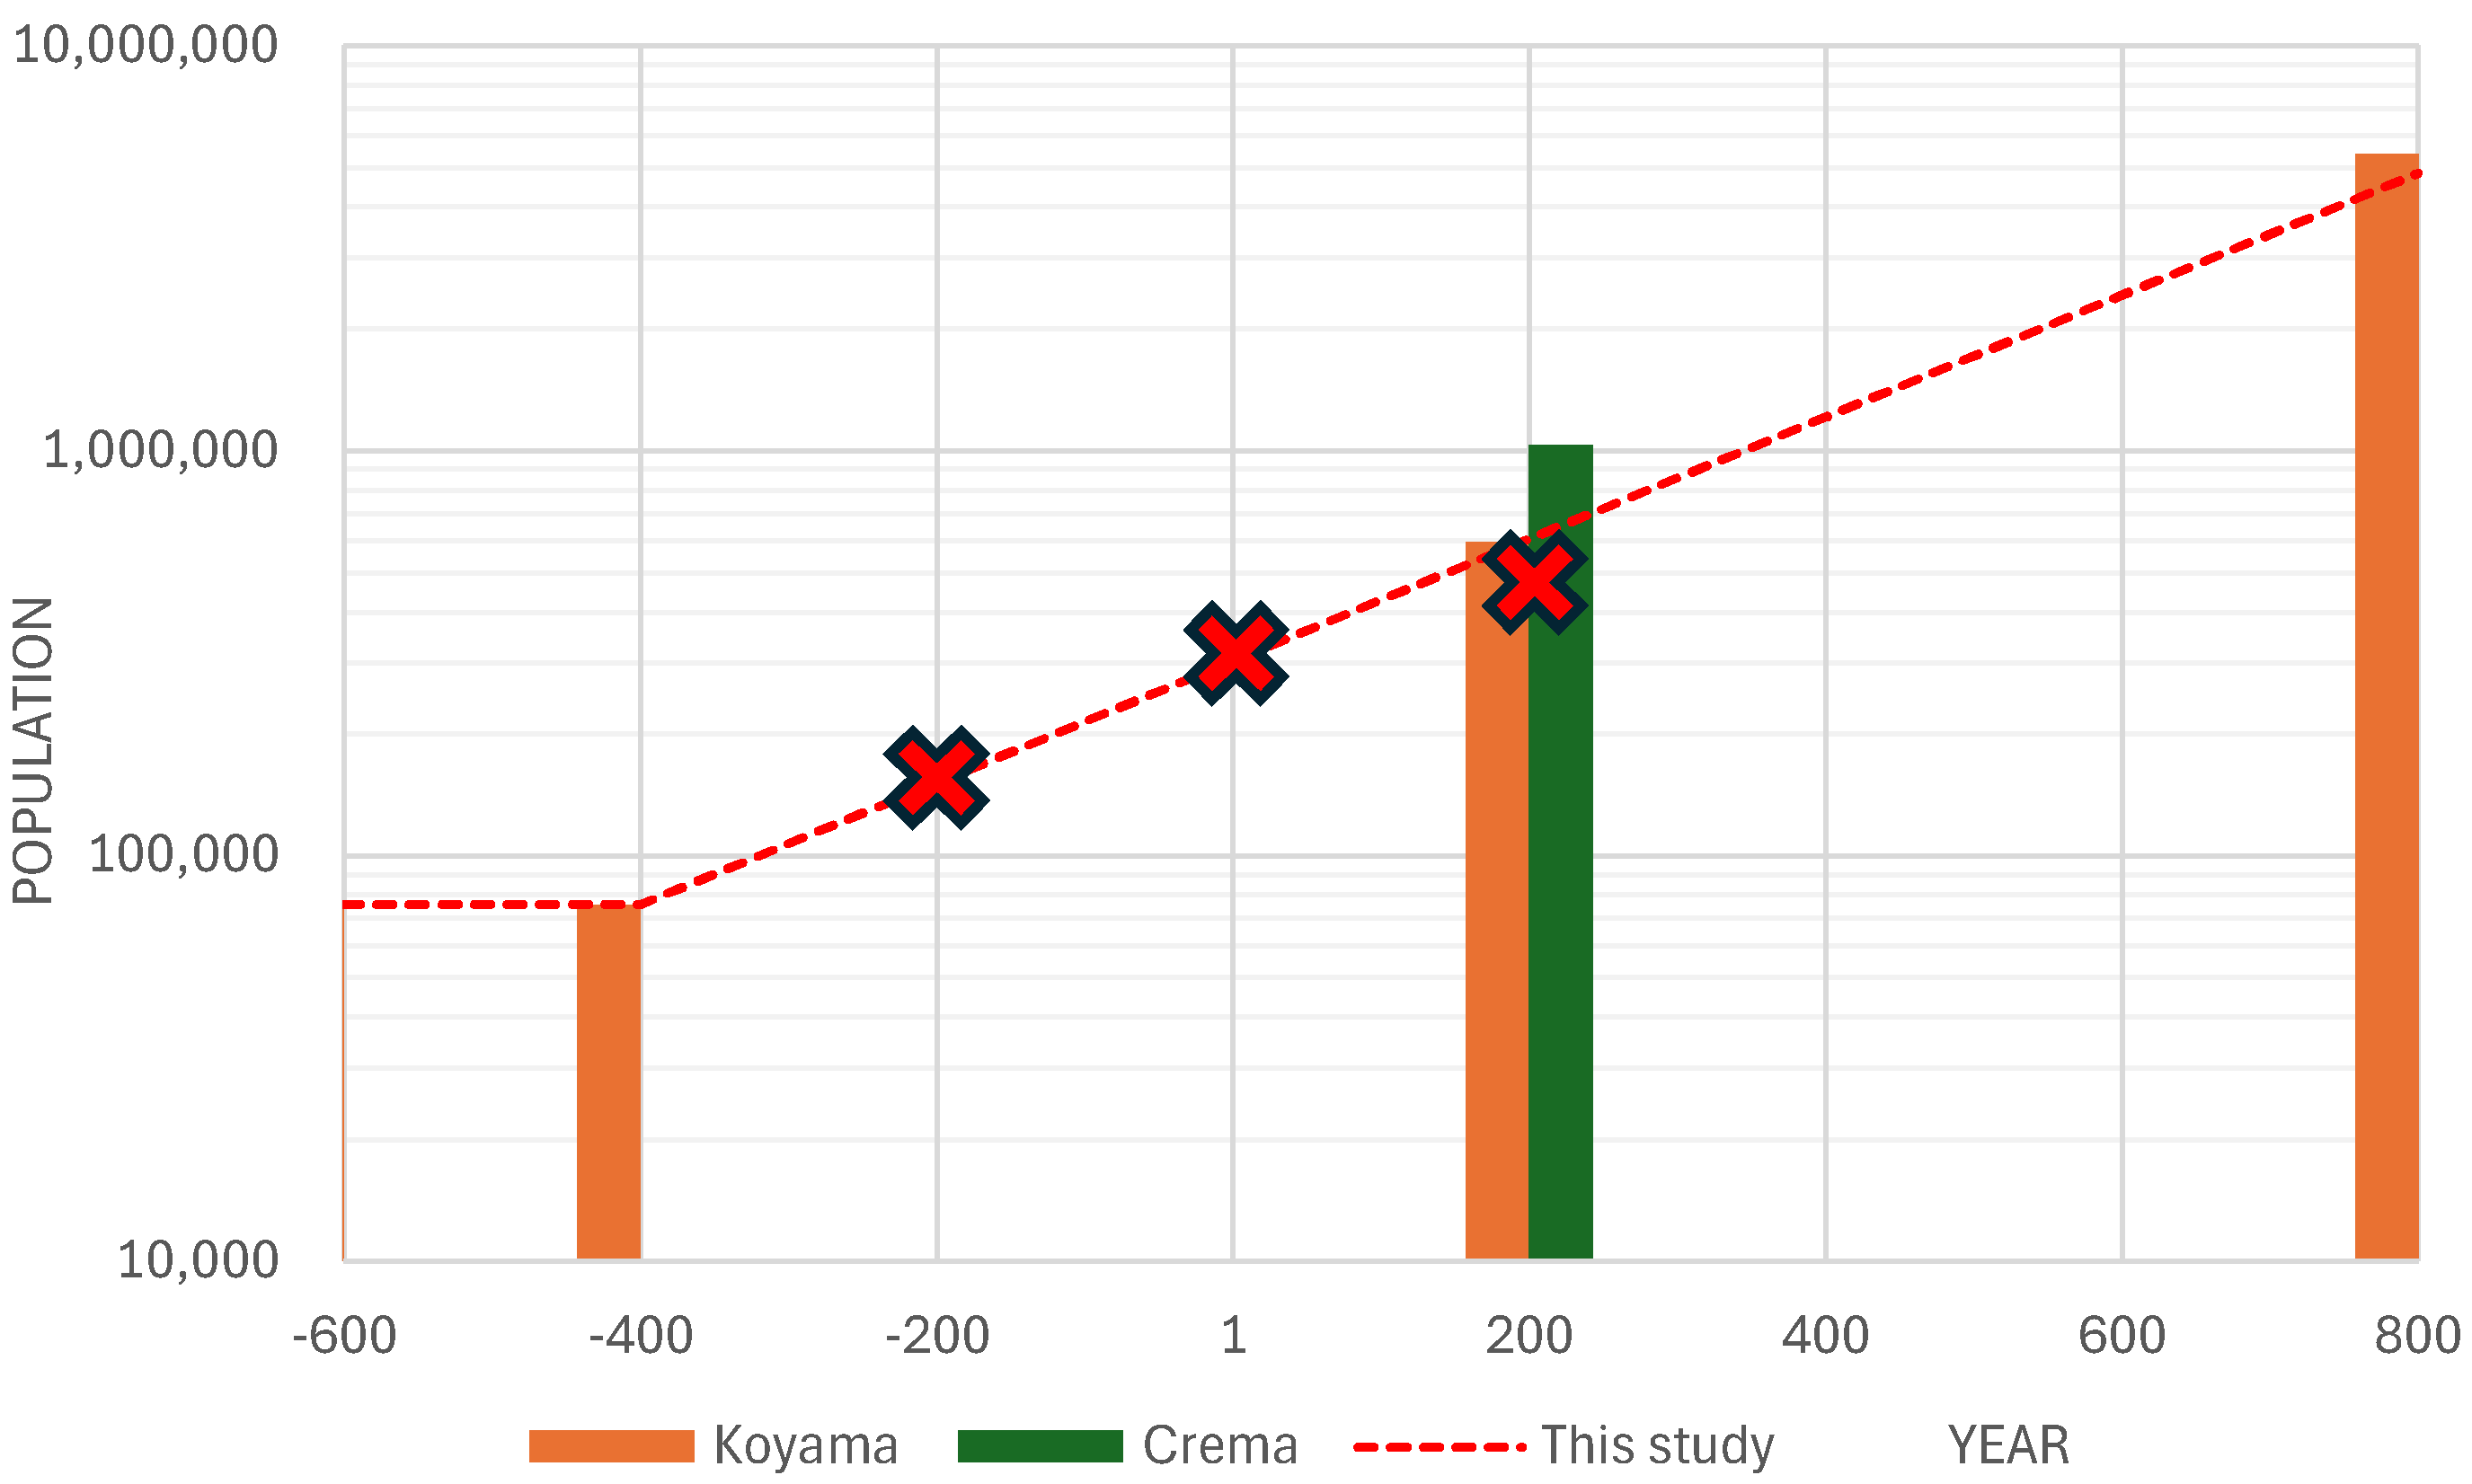
Figure 5.
Distribution of Yayoi Settlements.
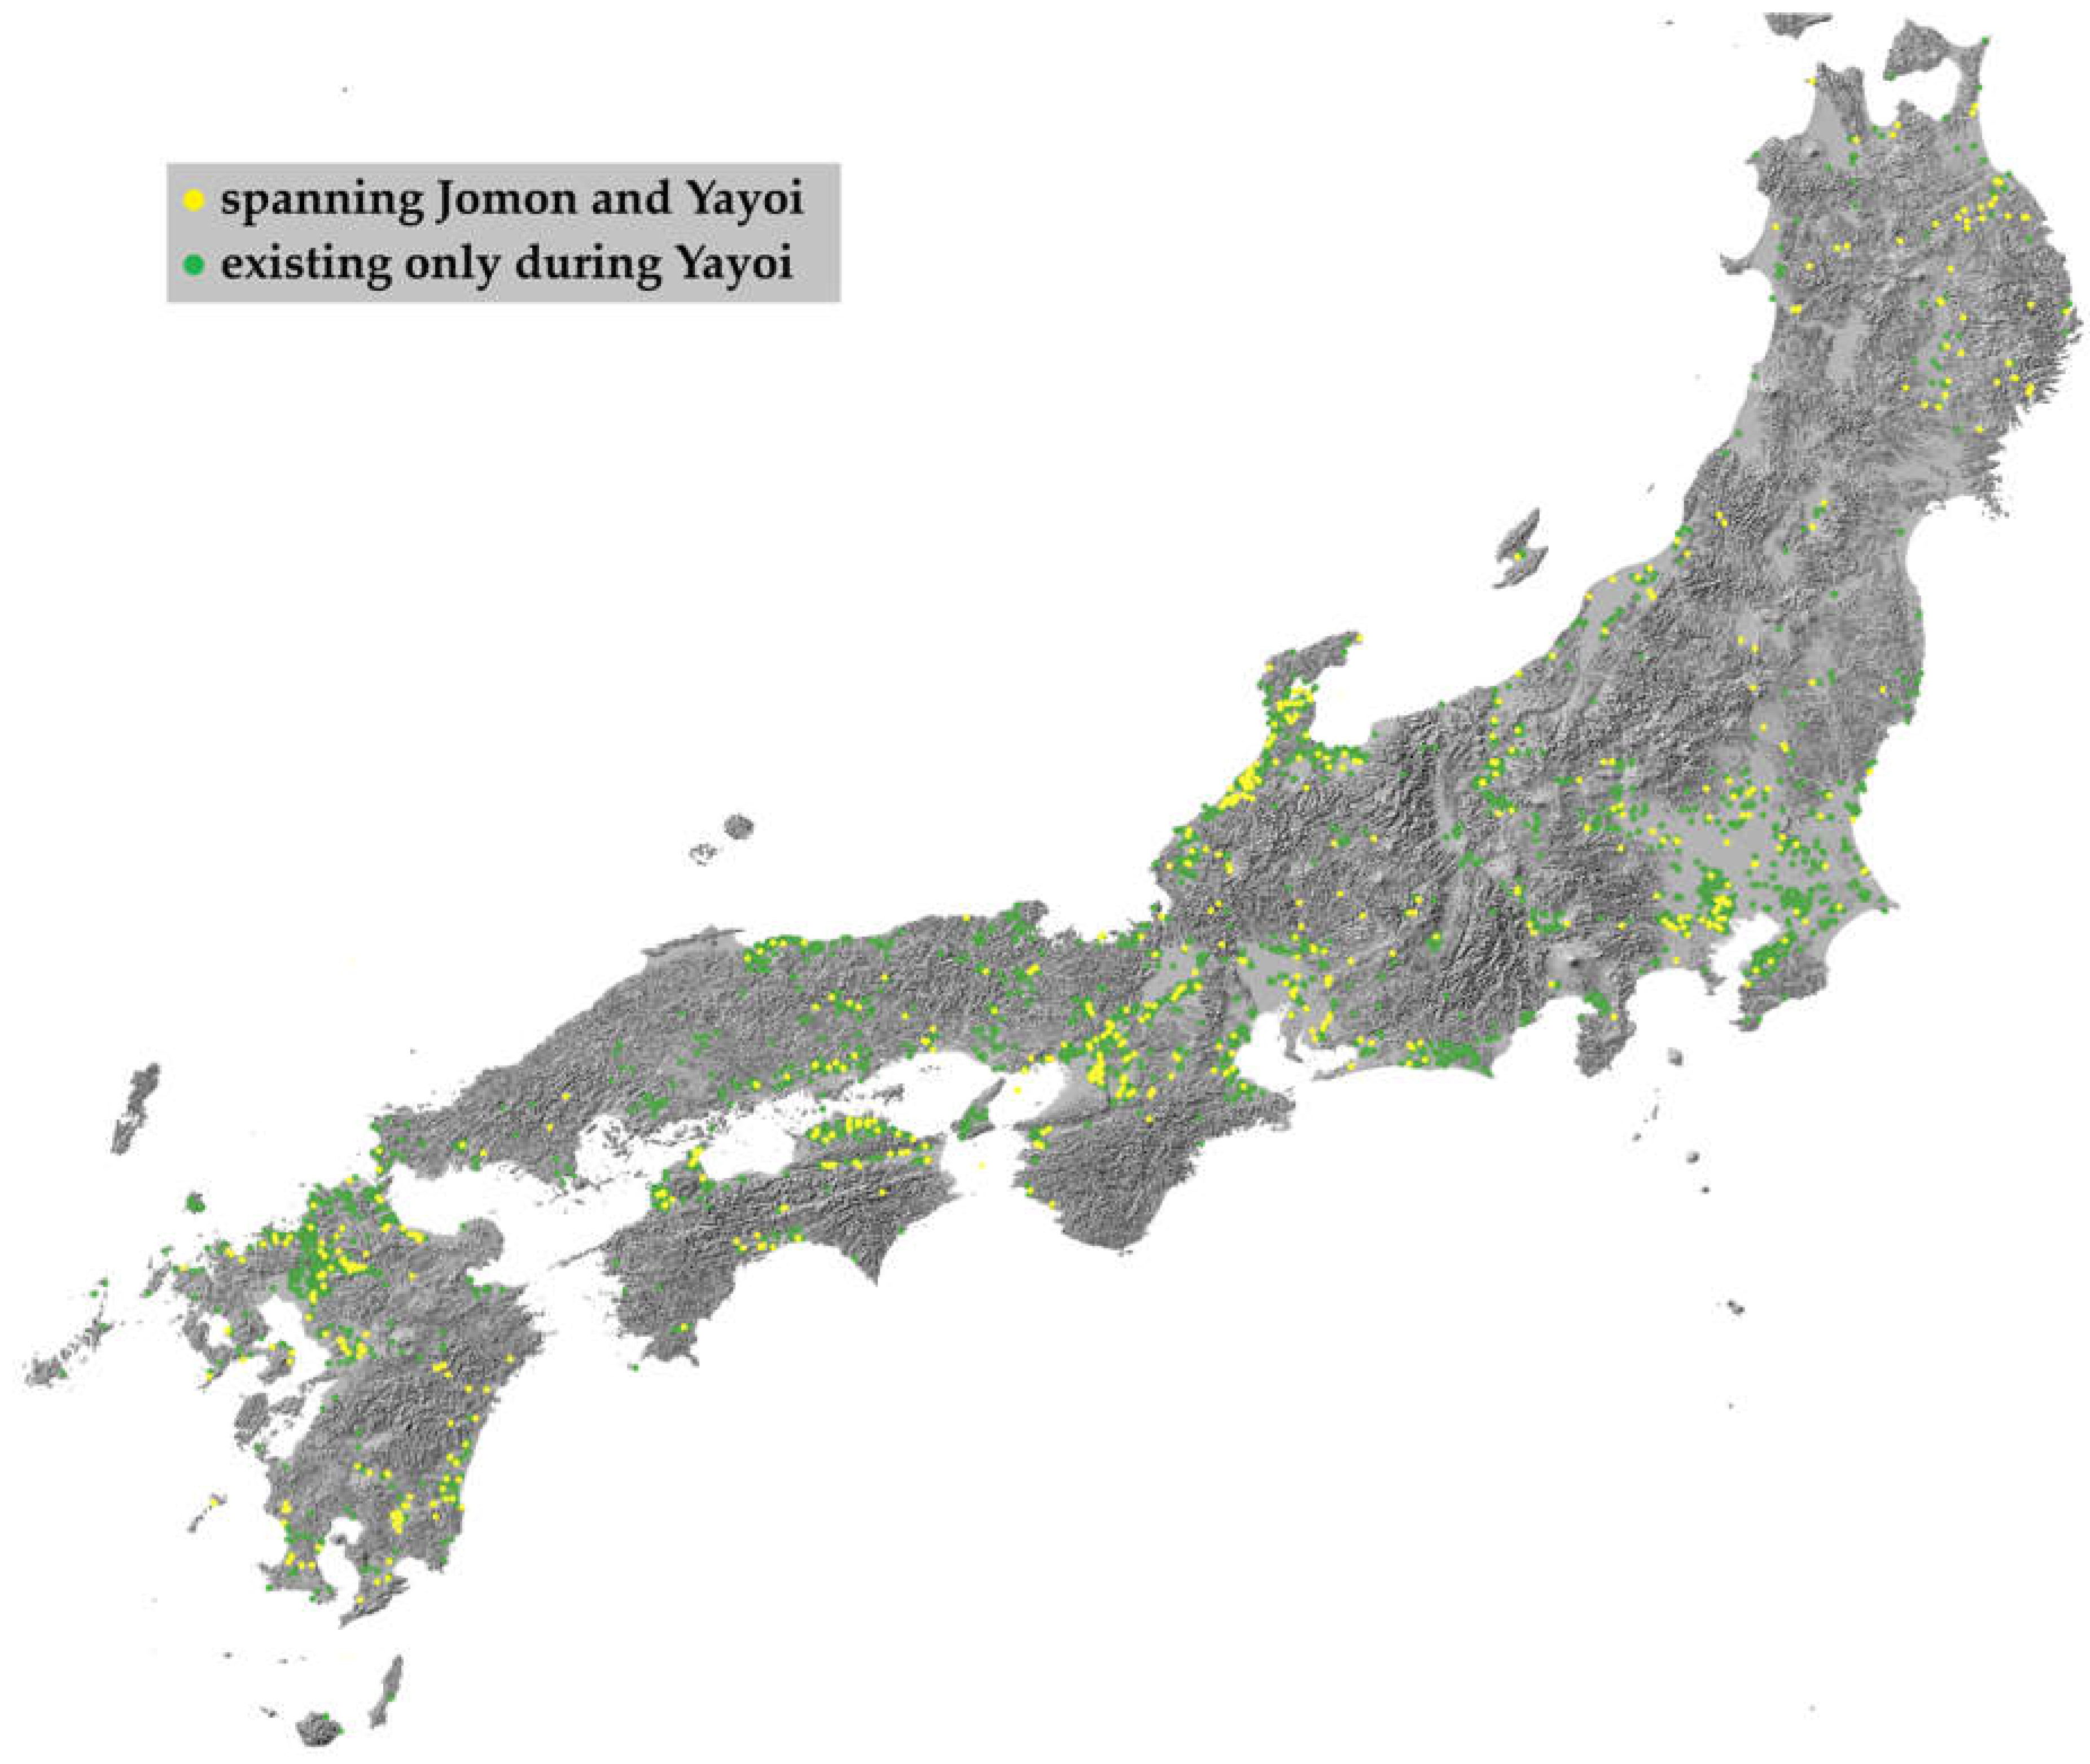
Figure 6.
Heat Map of Yayoi Settlements in Western Japan.
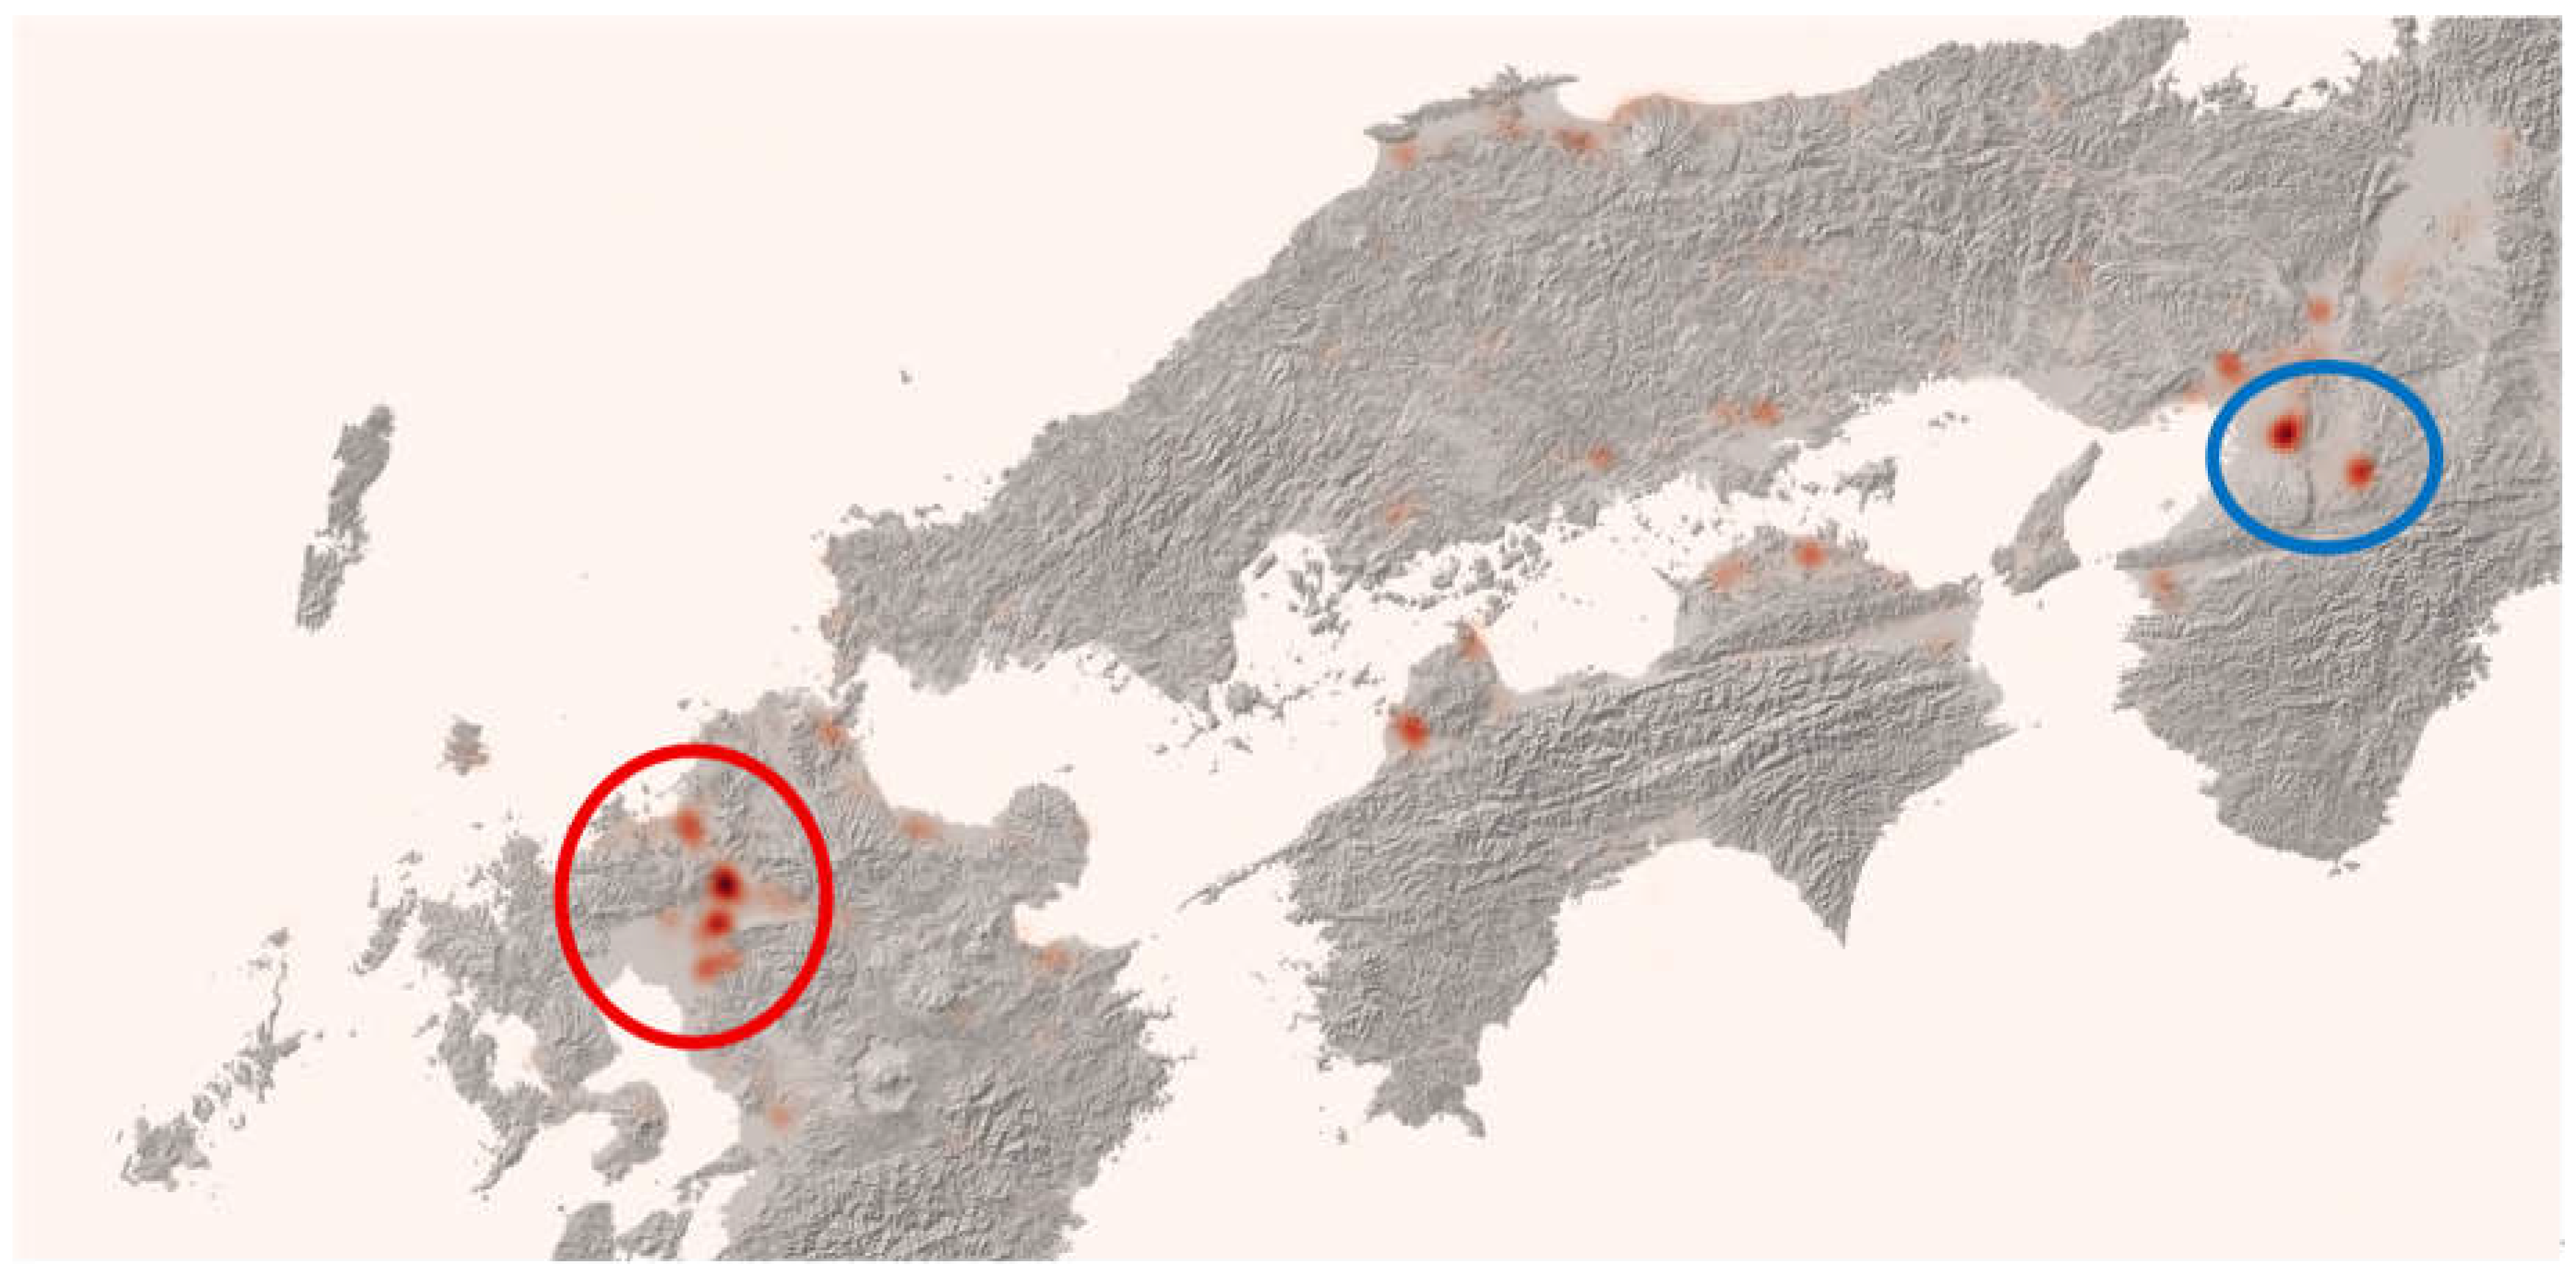
Figure 7.
Overview of Moore’s law.
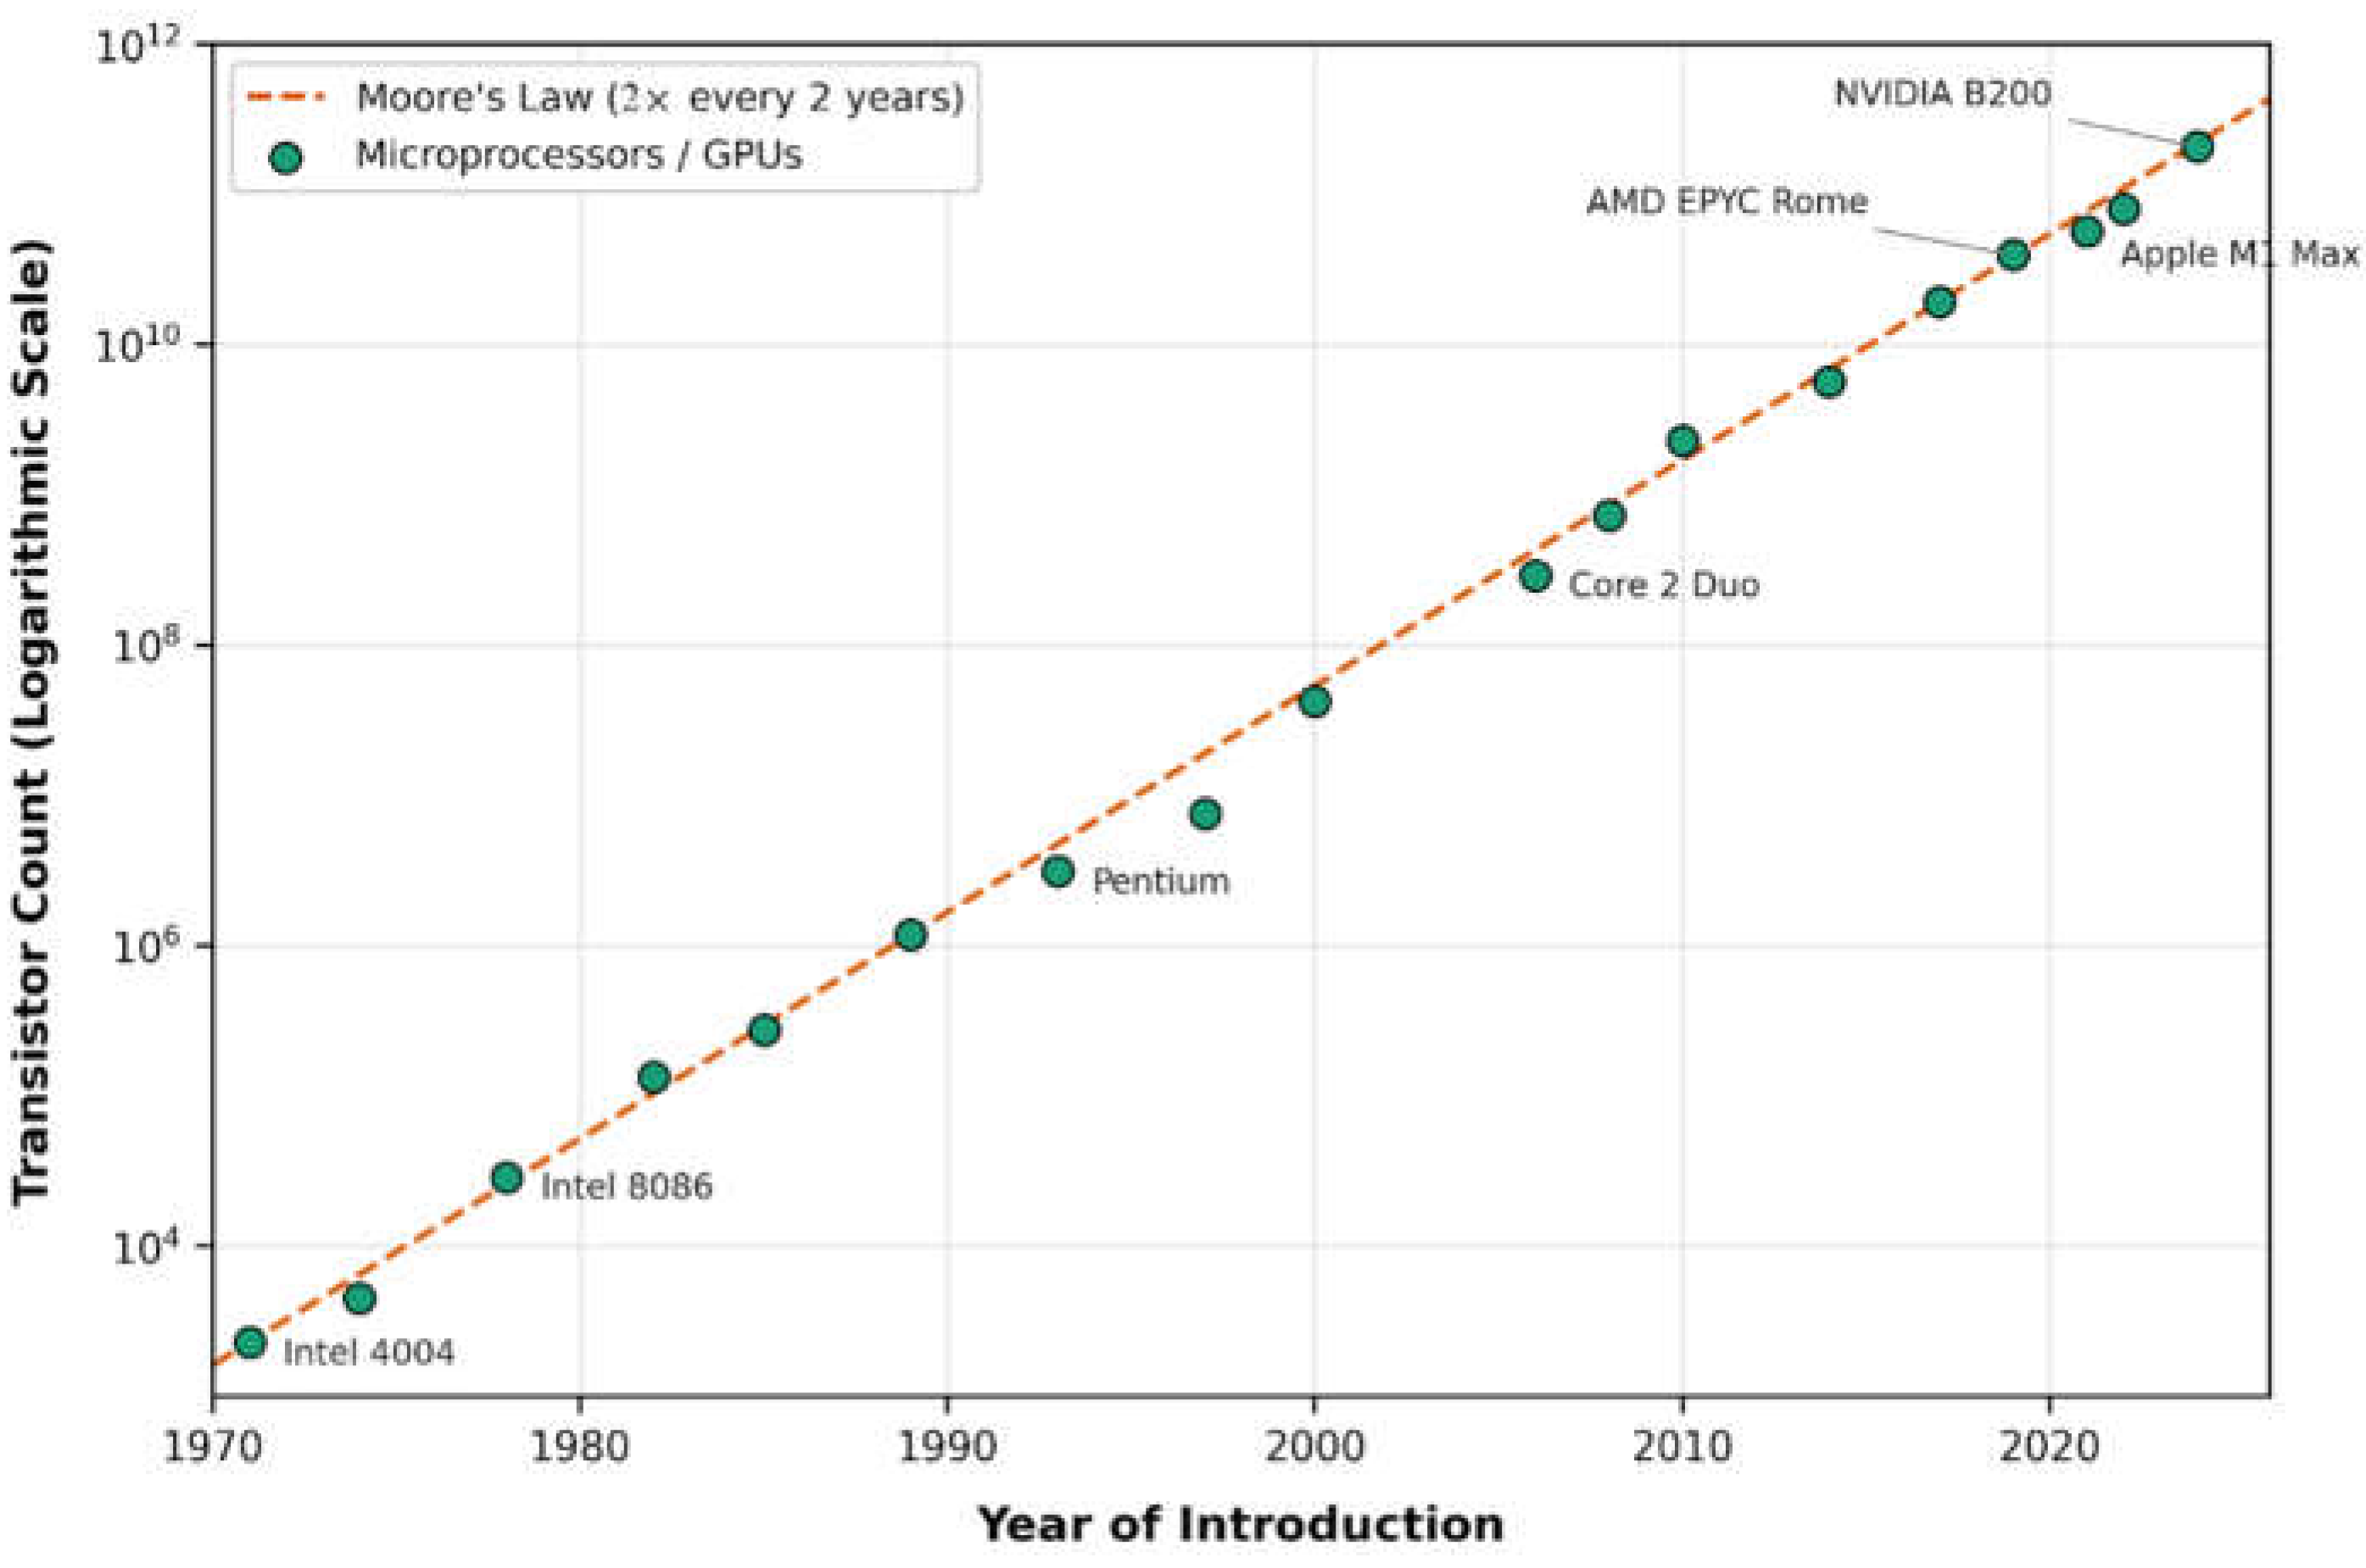
Figure 8.
Examples of Large Earthwork Volumes in Ancient Japan.
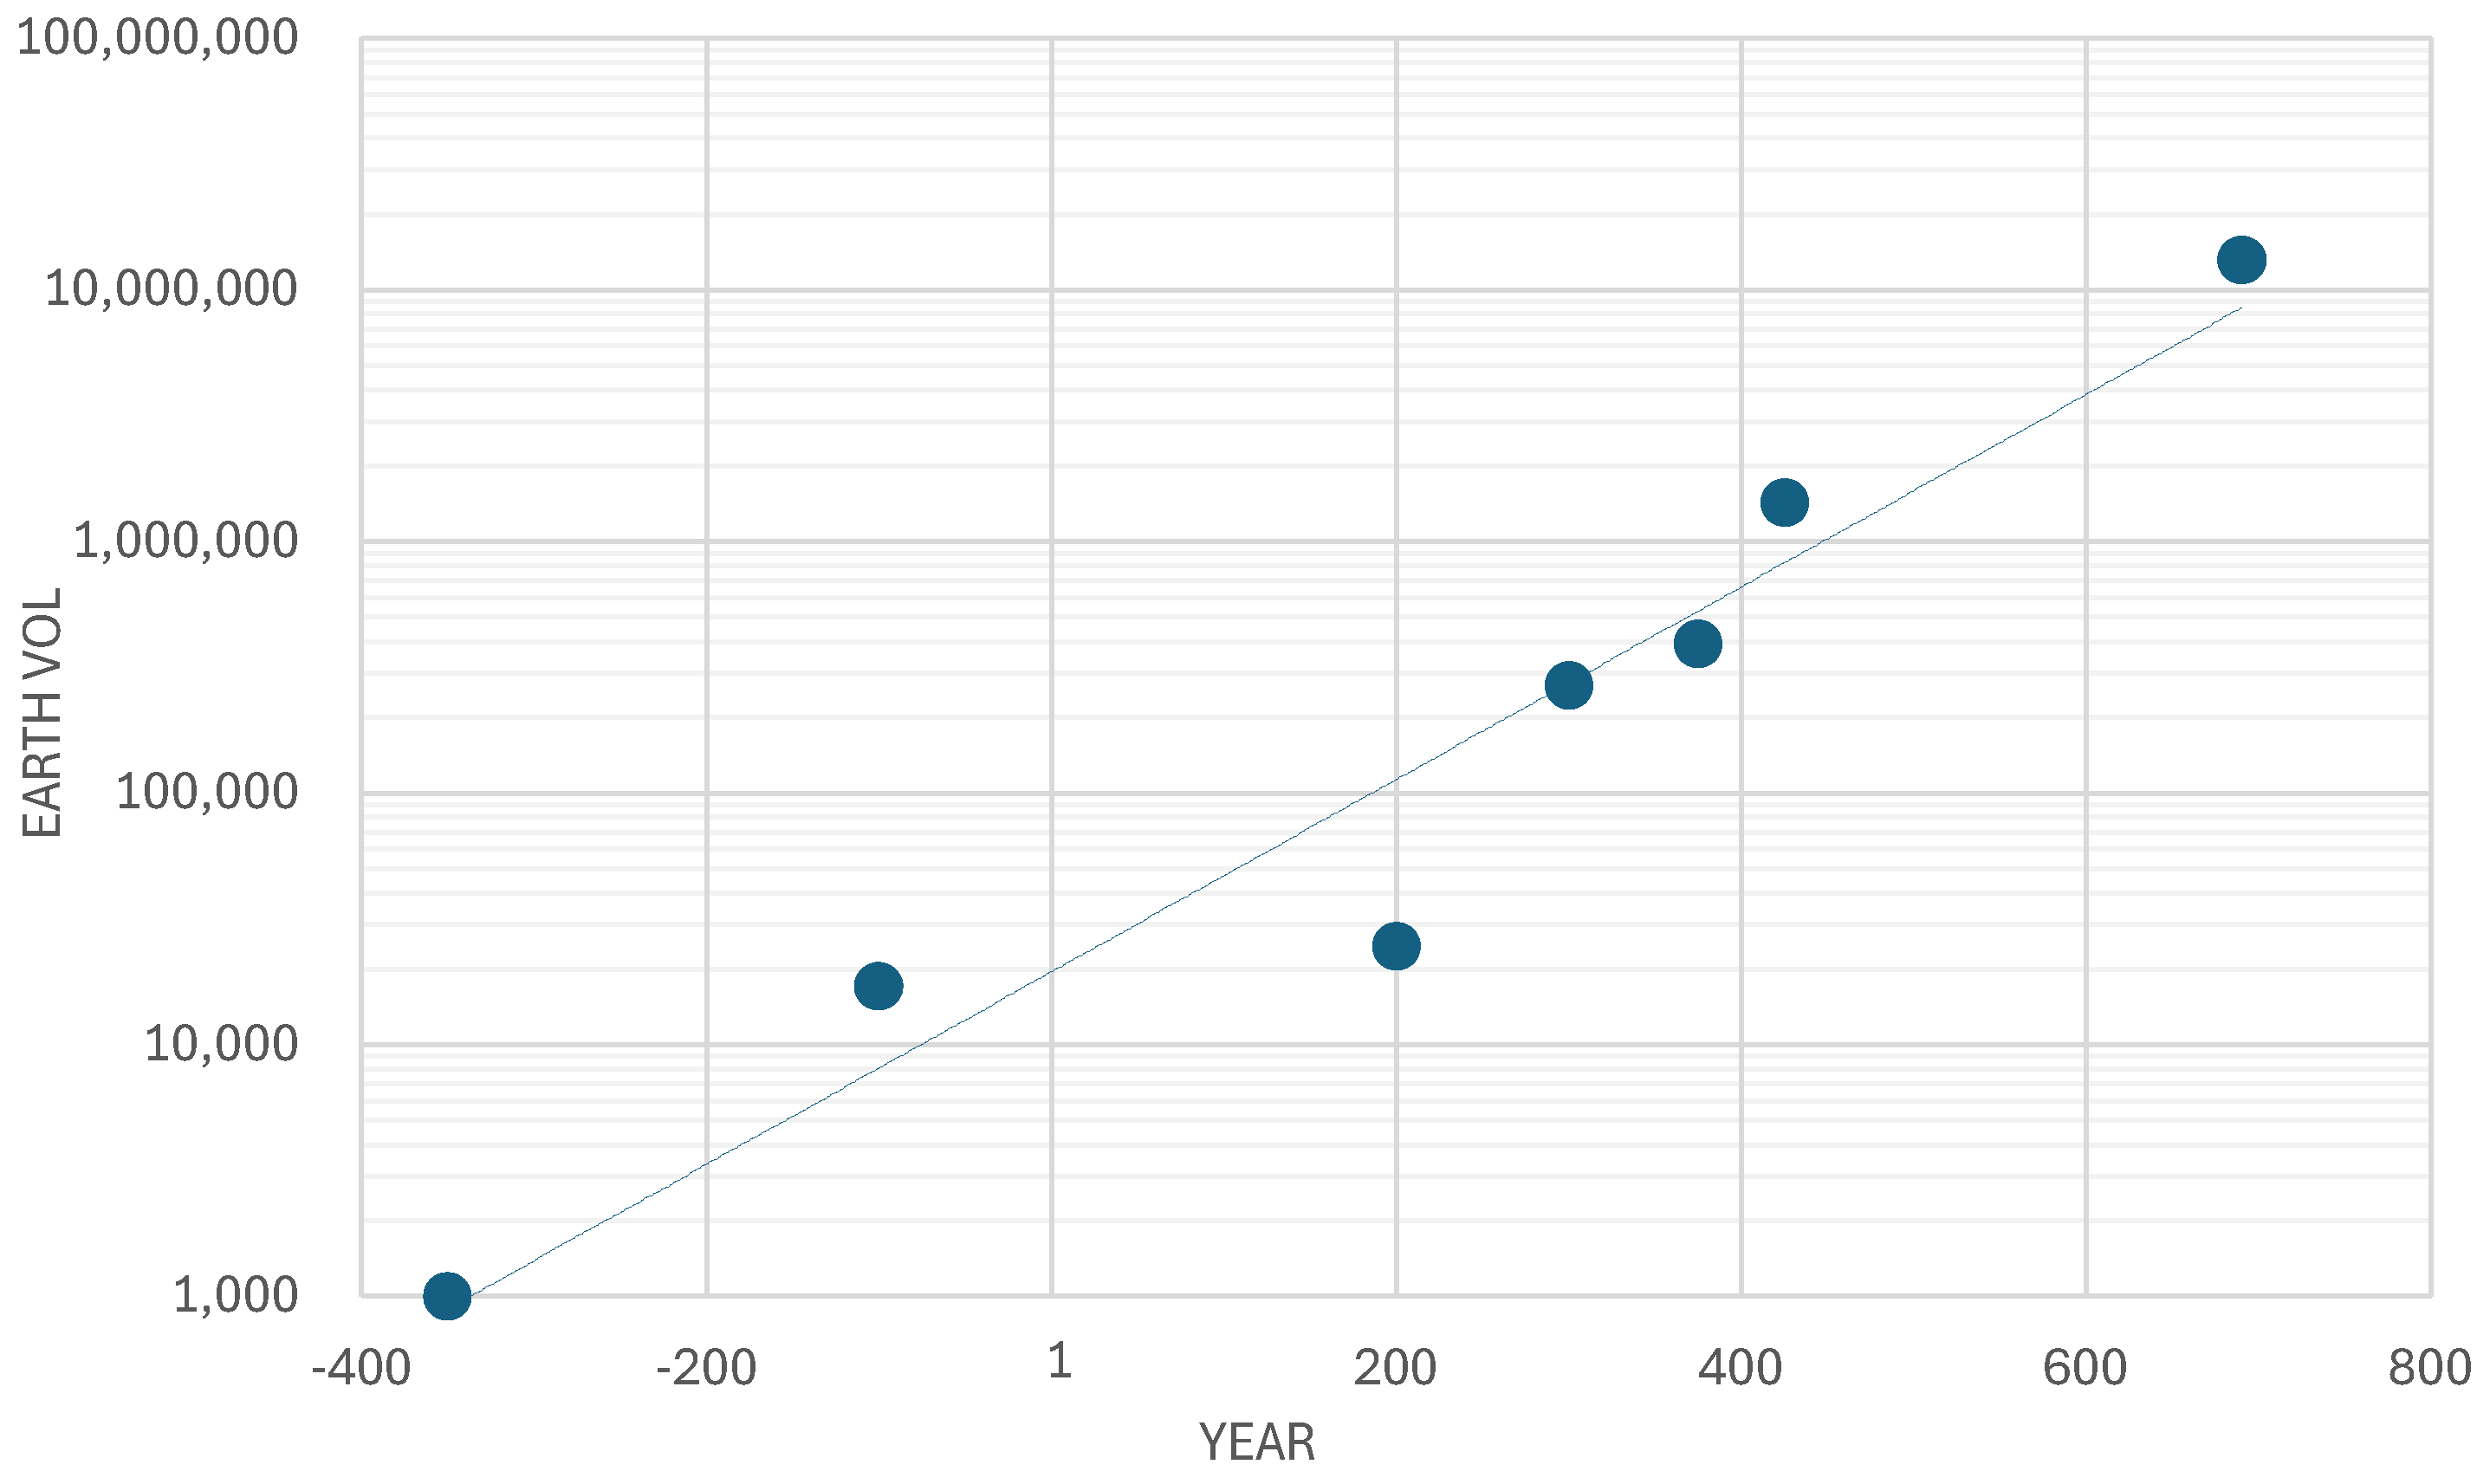
Figure 9.
Yayoi Settlements in Northern Kyushu.
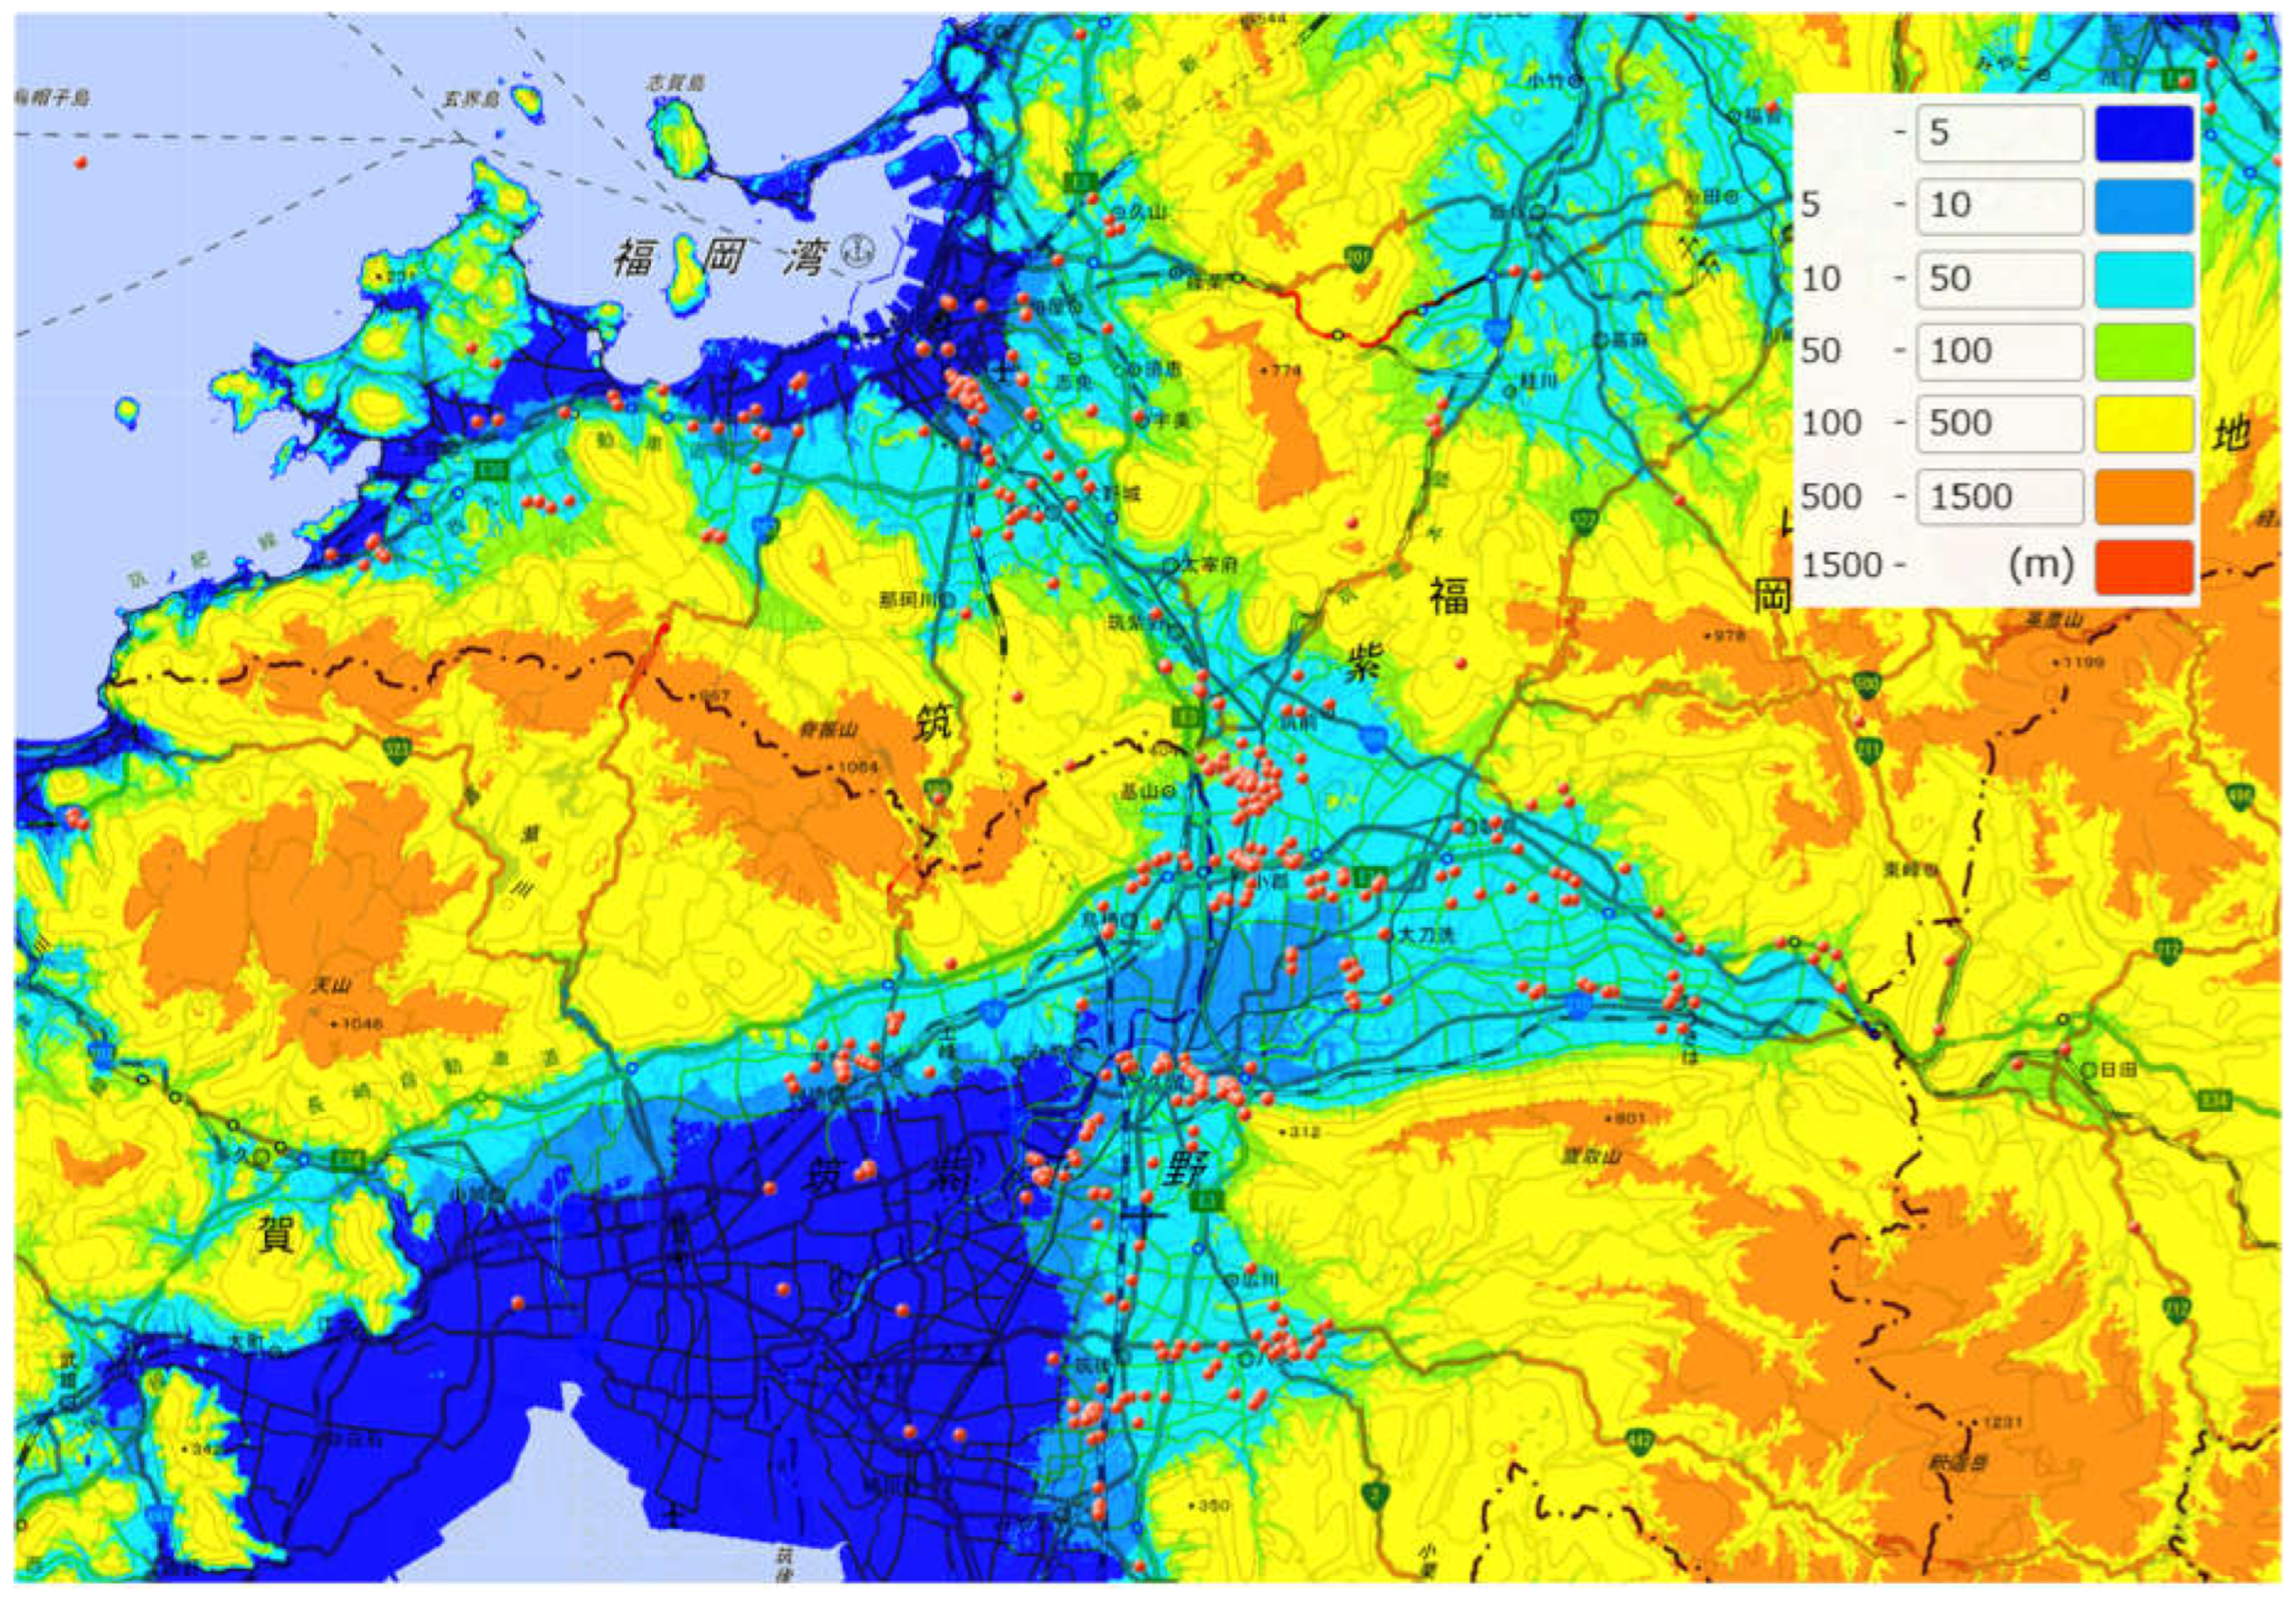
Figure 10.
Yayoi Settlements in Kinai (Rekihaku 2011).
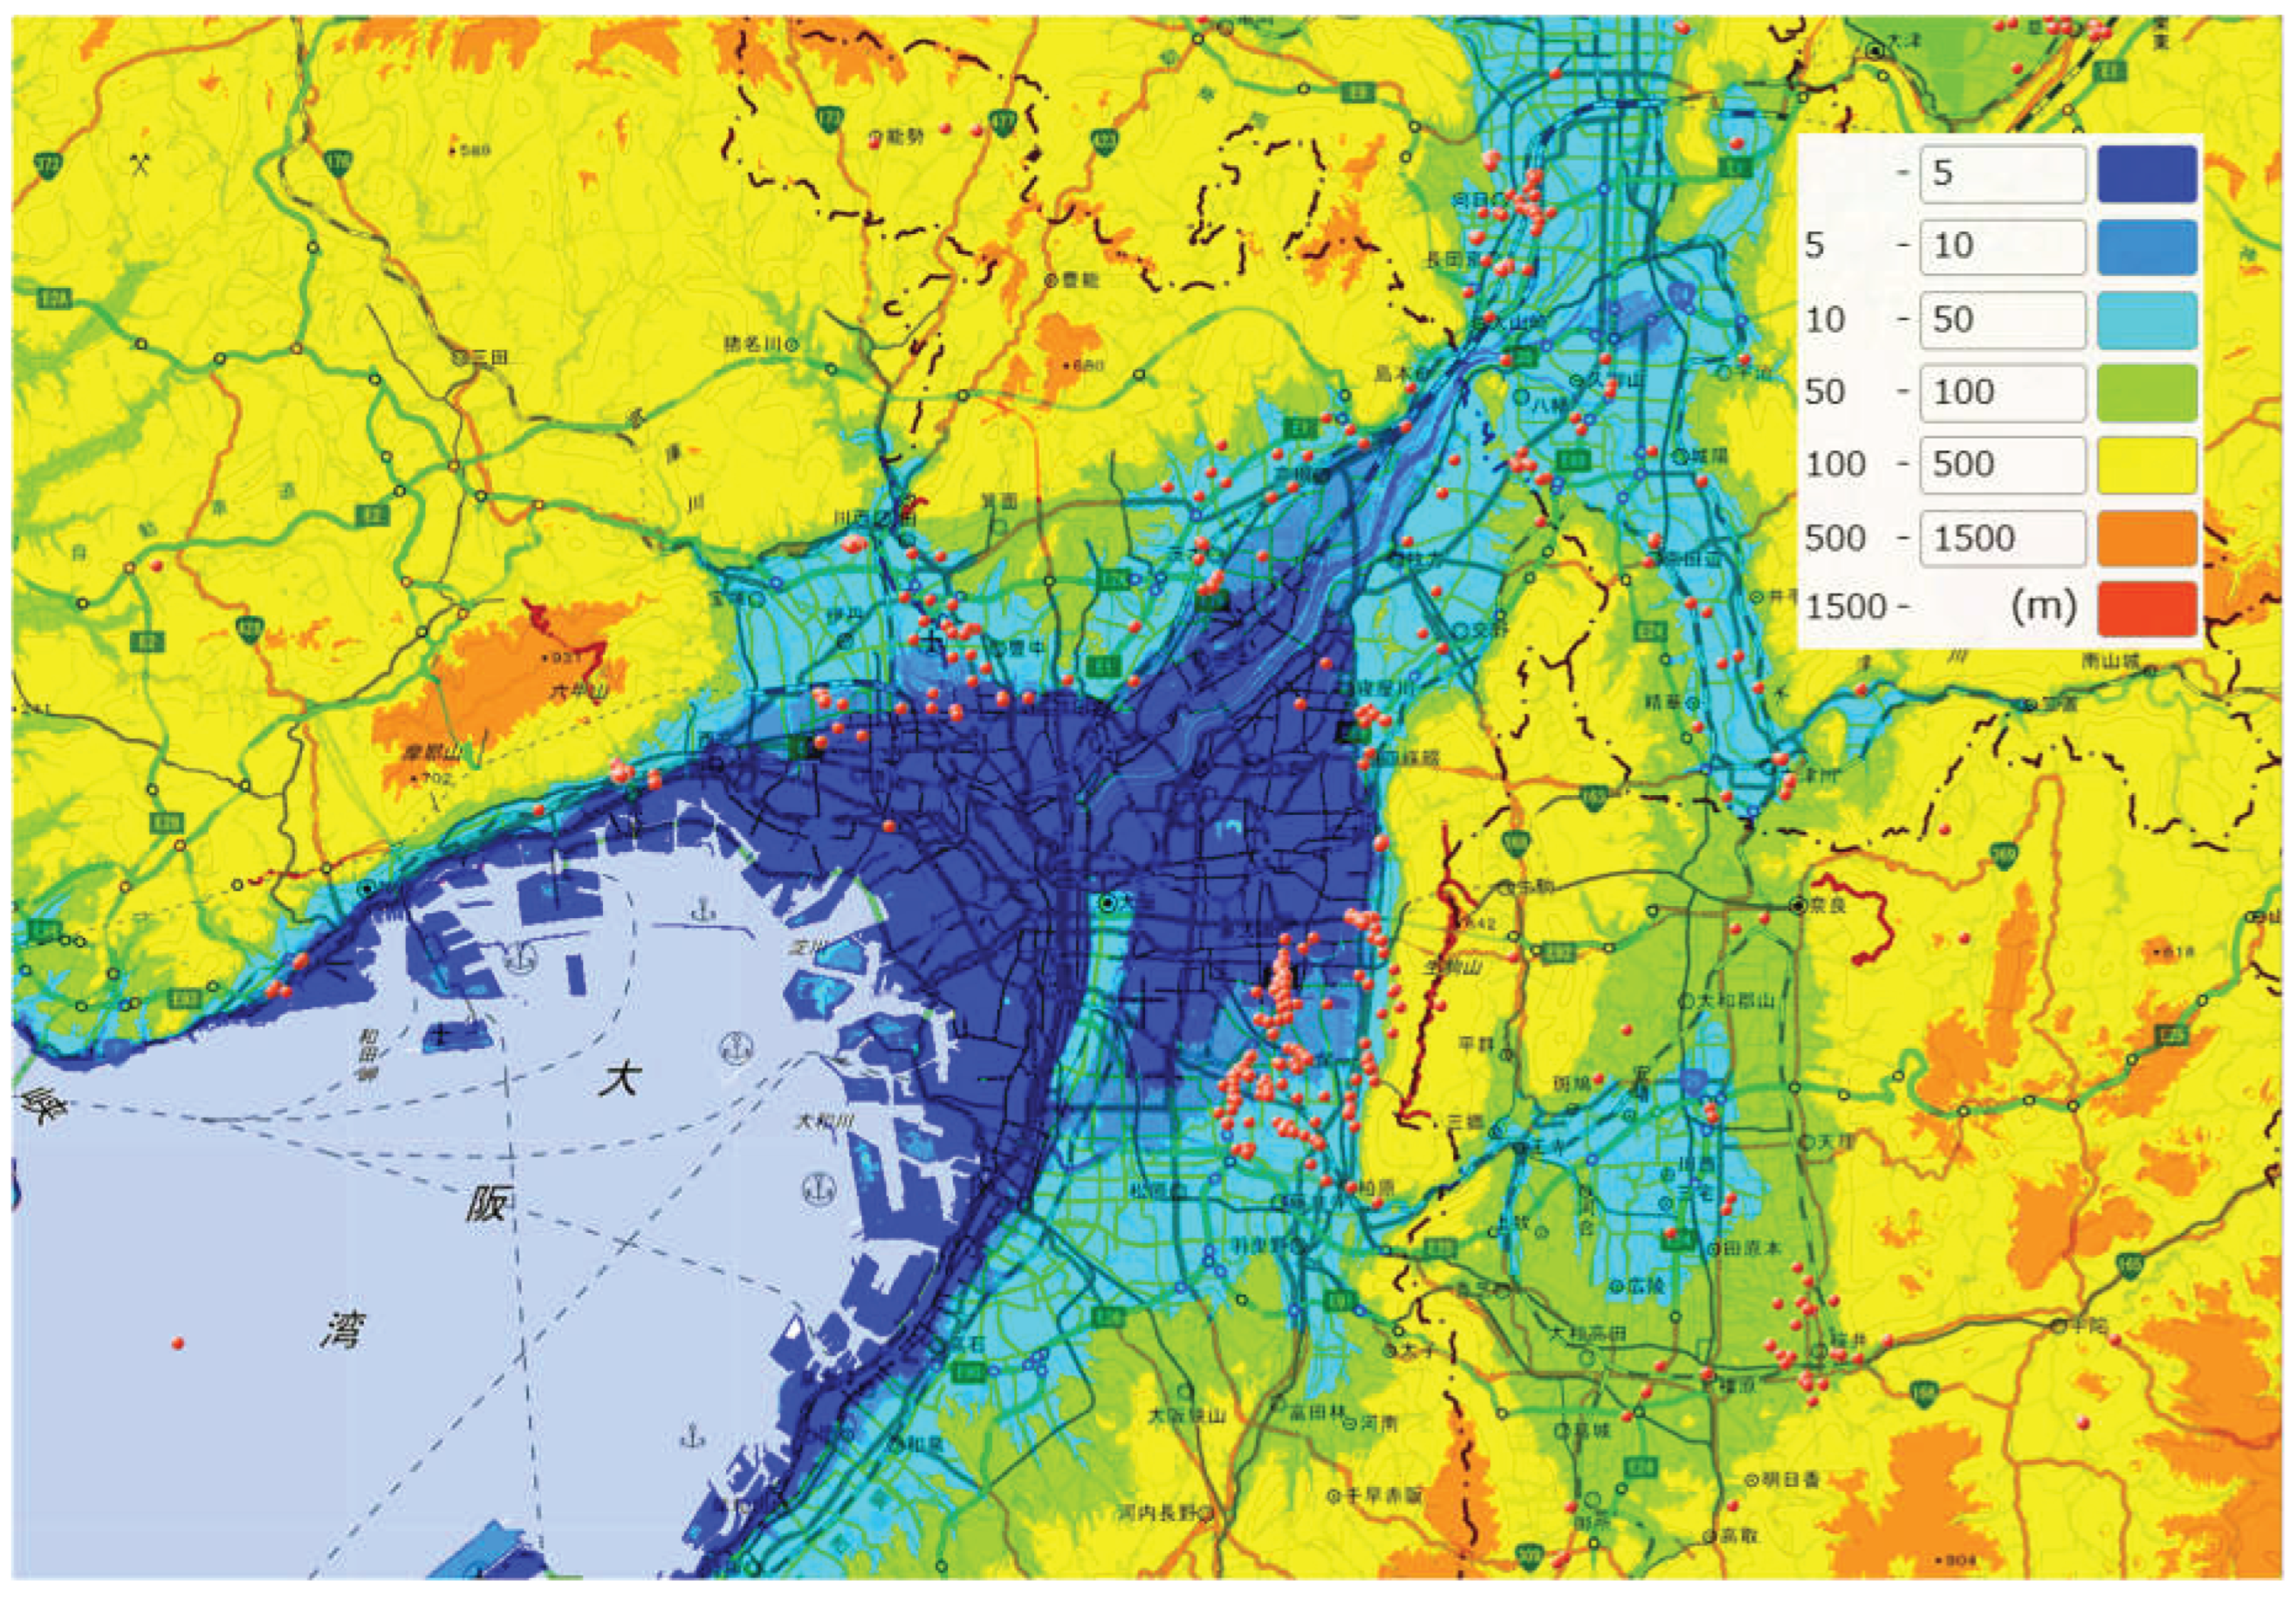
Table 1.
Population Estimates by Koyama (1978).
| Region | Initial Jomon J-1 8100BP |
Early Jomon J-2 5200BP |
Middle Jomon J-3 4300BP |
Late Jomon J-4 3300BP |
Final Jomon J-5 2900BP |
Yayoi 1800BP |
Haji 1250BP |
|---|---|---|---|---|---|---|---|
| Tohoku | 2,100 | 19,200 | 46,700 | 43,800 | N/A | 33,800 | 288,600 |
| Kanto | 10,300 | 43,300 | 96,600 | 52,100 | N/A | 100,000 | 943,300 |
| Hokuriku | 400 | 4,200 | 24,600 | 15,700 | N/A | 21,000 | 491,800 |
| Chubu | 3,200 | 25,300 | 71,900 | 22,000 | N/A | 85,100 | 289,700 |
| Tokai | 2,400 | 5,000 | 13,200 | 7,600 | N/A | 55,900 | 298,700 |
| Kinki | 300 | 1,700 | 2,800 | 4,400 | N/A | 109,400 | 1,217,300 |
| Chugoku | 500 | 1,300 | 1,200 | 2,700 | N/A | 59,400 | 839,400 |
| Shikoku | 600 | 400 | 200 | 2,700 | N/A | 30,500 | 320,600 |
| Kyushu | 2,100 | 5,600 | 5,300 | 10,000 | N/A | 106,300 | 710,400 |
| Total | 29,100 | 106,000 | 262,500 | 161,000 | N/A | 601,500 | 5,399,800 |
Table 2.
Updated Population Estimates by Koyama (1984).
| Region | Initial Jomon J-1 8100BP |
Early Jomon J-2 5200BP |
Middle Jomon J-3 4300BP |
Late Jomon J-4 3300BP |
Final Jomon J-5 2900BP |
Yayoi 1800BP |
Haji 1250BP |
|---|---|---|---|---|---|---|---|
| Tohoku | 2,000 | 19,200 | 46,700 | 43,800 | 39,500 | 33,400 | 288,600 |
| Kanto | 9,700 | 42,800 | 95,400 | 51,600 | 7,700 | 99,000 | 943,300 |
| Hokuriku | 400 | 4,200 | 24,600 | 15,700 | 5,100 | 20,700 | 491,800 |
| Chubu | 3,000 | 25,300 | 71,900 | 22,000 | 6,000 | 84.200 | 289,700 |
| Tokai | 2,200 | 5,000 | 13,200 | 7,600 | 6,600 | 55,300 | 298,700 |
| Kinki | 300 | 1,700 | 2,800 | 4,400 | 2,100 | 108,300 | 1,217,300 |
| Chugoku | 400 | 1,300 | 1,200 | 2,400 | 2,000 | 5,8800 | 839,400 |
| Shikoku | 200 | 400 | 200 | 2,700 | 500 | 30,100 | 320,600 |
| Kyushu | 1,900 | 5,600 | 5,300 | 10,100 | 6,300 | 105,100 | 710,400 |
| Total | 20,100 | 105,500 | 261,300 | 160,300 | 75,800 | 594,900 | 5,399,800 |
A notable finding was a major shift in the population center from eastern to western Japan. Middle Jomon (4300 BP): Most of the estimated peak population of approximately 261,000 lived in eastern Japan; approximately 95,000 in Kanto, 72,000 in Chubu, and 47,000 in Tohoku. Yayoi period (1800 BP): Most of the estimated average population of approximately 595,000 lived in western Japan; approximately 108,000 in Kinki, 105,000 in Kyushu, and 99,000 in Kanto.
Table 3.
Population estimates by Crema et al. (2024).
| Region | Koyama 1984 | Estimate 1 | Estimate 2 | Estimate 3 |
|---|---|---|---|---|
| Tohoku | 33,400 | 18,137 | 16,005 | 22,864 |
| Kanto | 99,000 | 45,703 | 45,703 | 130,579 |
| Hokuriku | 20,700 | 12,770 | 41,303 | 65,561 |
| Chubu | 84,200 | 19,792 | 28,409 | 37,878 |
| Tokai | 55,300 | 17,448 | 47,882 | 63,843 |
| Kinki | 108,300 | 32,221 | 166,849 | 185,388 |
| Chugoku | 58,800 | 38,768 | 186,115 | 195,911 |
| Shikoku | 30,100 | 14,741 | 131,517 | 138,439 |
| Kyushu | 105,100 | 70,387 | 200,724 | 191,380 |
| Total | 594,900 | 269,963 | 864,507 | 1,031,843 |
Table 4.
Population Trends in Ancient Japan.
| Period | Approximate chronology | Description |
|---|---|---|
| Initial Jomon | 9500BC–5000BC | Starting population of approximately 20,000 |
| Early Jomon | 5000BC–3500BC | Rapid increase with warming [1,2,20] |
| Middle Jomon | 3500BC–2400BC | Population peak Koyama 1984: approx. 260,000, concentrated in eastern Japan |
| Late–Final Jomon | 2400BC–400BC | Marked decline with cooling [1,2,20] Koyama 1984: approximately 76,000 in the Final Jomon Crema 2024: wet-rice cultivation began in northern Kyushu ca. 1000 BC [15,16] |
| Yayoi period | 400BC–AD250 | Rice cultivation spread eastward at different times; Crema 2024: annual population growth approx. 0.2–0.5% [15,16] Koyama 1984: approx. 595,000 |
| Haji period | AD250– | Further rapid increase |
Table 5.
Changes in recorded site counts.
| Source | Jomon | Yayoi | Haji equivalent | Ratio to 1978 |
|---|---|---|---|---|
| Koyama 1978 | 27,996 | 10,624 | 11,803 | 1.00 |
| ACA 2016 | 83,611 | 34,101 | Kofun 42,966 Ancient 59,267 Ttotal 102,233 |
Jomon 2.99× Yayoi 3.21× Haji equivalent 8.66× |
| ACA 2021 | 84,299 | 34,841 | Kofun 42,821 Ancient 59,076 Total 101,897 |
Jomon 3.01× Yayoi 3.28× Haji equivalent 8.63× |
Note: Hokkaido and Okinawa are excluded for comparability with Koyama 1978.
Table 6.
National Archaeological Site Counts in Agency for Cultural Affairs Surveys.
| Year | Site Count | Evidence and reliability |
|---|---|---|
| 1960-62 | Approx. 140,000 | National site distribution survey [24] |
| 1974ca. | Approx. 200,000 –300,000 |
Contemporary Agency for Cultural Affairs explanation |
| 1978 | Approx. 300,000 | Agency for Cultural Affairs, History of Cultural Administration [25] |
| 1980 | Approx. 300,000 | Approximate level indicated by 1978 and 1984 records |
| 1985 | Approx. 300,000 | Agency for Cultural Affairs FY1984 material reports: approx. 300,000 nationally [26] |
| 1990 | Approx. 300,000 | 1989 material also reports approximately 300,000 nationally [27] |
| 1995 | Approx. 370,000 | Agency for Cultural Affairs Monthly Report, May 1995 [28] |
| 2000 | Approx. 440,000 | Agency for Cultural Affairs Monthly Report, April 2001 [29] |
| ca.2009 | Approx. 460,000 | Nara National Research Institute for Cultural Properties [30] |
| ca.2013 | Approx. 465,000 | Nara National Research Institute for Cultural Properties [30] |
| 2022 | 472,071 | Agency for Cultural Affairs tabulation [7] |
Table 7.
Estimates under an Annual Growth Rate of 0.35%.
| Period | Year | Estimated population | Index | Growth rate / Yr | Rekihaku 2011 | RekihakuIndex |
|---|---|---|---|---|---|---|
|
Final Jomon Initial Yayoi |
400BC | 75,800 (Koyama) | 1.0 | - | - | - |
| Early Yayoi | 200BC | 151,600 (Author) | 2.0 | 0.35% | 1,332 | 1.0 |
| Middle Yayoi | AD 1 | 303,200 (Author) | 4.0 | 0.35% | 2,649 | 2.0 |
| Late Yayoi 1 | AD 200 | 594,900 (Koyama) | 7.8 | 0.35% | - | - |
| Late Yayoi 2 | AD 200 | 1,031,843 (Crema) | 13.6 | 0.62% | - | - |
| Late Yayoi 3 | AD 200 | 606,400 (Author) | 8.0 | 0.35% | - | - |
| Haji period1 | AD 750 | 5,399,000 (Koyama) | 71.2 | 0.39% | 3,821 | 2.9 |
| Haji period2 | AD 750 | 4,851,200 (Note) | 64.0 | 0.35% | - | - |
Note: Starting from Koyama’s Final Jomon/initial Yayoi figure of 75,800 and assuming annual exponential growth of approximately 0.35% gives 4,851,200 by AD 800 (64 times the starting value).
Table 9.
Regional Adjustment Factors.
| Region | Rekihaku 2011 (D) | ACA 2021 (E) |
Adjustment factor (E/D) |
|---|---|---|---|
| Tohoku | 162 | 2,252 | 13.90 |
| Kanto | 866 | 5,127 | 5.92 |
| Hokuriku | 699 | 1,631 | 2.33 |
| Chubu | 330 | 2,677 | 8.11 |
| Tokai | 379 | 3,222 | 8.50 |
| Kinki | 1,011 | 3,645 | 3.61 |
| Chugoku | 517 | 4,860 | 9.40 |
| Shikoku | 464 | 1,986 | 4.28 |
| Kyushu | 1,086 | 9,441 | 8.69 |
| Total | 5,514 | 34,841 | 6.32 |
Table 10.
Regional Populations Apportioned according to Adjusted Site Counts.
| Region | Early Yayoi (A*E/D) |
Middle Yayoi (B*E/D) | Late Yayoi (C*E/D) |
Early Yayoi population |
Middle Yayoi population |
Late Yayoi population |
|---|---|---|---|---|---|---|
| Tohoku | 890 | 1,362 | 709 | 23,251 | 35,604 | 18,528 |
| Kanto | 758 | 1,569 | 4,257 | 19,805 | 41,002 | 111,247 |
| Hokuriku | 439 | 607 | 1,356 | 11,464 | 15,855 | 35,430 |
| Chubu | 544 | 1,298 | 1,906 | 14,204 | 33,921 | 49,822 |
| Tokai | 757 | 1,437 | 2,151 | 19,774 | 37,548 | 56,211 |
| Kinki | 883 | 1,860 | 2,282 | 23,085 | 48,620 | 59,644 |
| Chugoku | 1,156 | 2,425 | 3,779 | 30,218 | 63,384 | 98,761 |
| Shikoku | 676 | 976 | 1,425 | 17,674 | 25,504 | 37,250 |
| Kyushu | 2,347 | 6,042 | 5,338 | 61,343 | 157,902 | 139,499 |
| Total | 8,449 | 17,576 | 23,203 | 220,819 | 459,340 | 606,392 |
Table 11.
Comparison with Previous Estimates (ca. 200AD).
| Region | Koyama 1984 | Crema 2024 | This study |
|---|---|---|---|
| Tohoku | 33,400 | 22,864 | 18,528 |
| Kanto | 99,000 | 130,579 | 111,247 |
| Hokuriku | 20,700 | 65,561 | 35,430 |
| Chubu | 84,200 | 37,878 | 49,822 |
| Tokai | 55,300 | 63,843 | 56,211 |
| Kinki | 108,300 | 185,388 | 59,644 |
| Chugoku | 58,800 | 195,911 | 98,761 |
| Shikoku | 30,100 | 138,439 | 37,250 |
| Kyushu | 105,100 | 191,380 | 139,499 |
| Total | 594,900 | 1,031,843 | 606,392 |
Table 12.
Summary of Moore’s law.
| Category | Description |
|---|---|
| Proponent | Proposed in 1965 by Gordon Moore, a cofounder of Intel. |
| Description | Increasing transistor density raises computing capacity and reduces cost. |
| Impact | This observation guided technological development over approximately 50 years. |
Table 13.
Examples of Large Earthwork Volumes in Ancient Japan.
| Project | Period | Earth vol. | Notes |
|---|---|---|---|
| Itazuke site, moat | Early Yayoi | 1,000 m³ | Approximation from an 80 × 110 m ellipse, 2–4 m wide and approximately 2–3 m deep, with a V-shaped section [32]. |
| Ikegami Sone site, moat | Middle Yayoi | 17,000 m³ | Approximation from a 300 × 400 m ellipse, 7 m wide and 5 m deep, assuming a V-shaped section [33]. |
| Yoshinogari site, outer moat | Late Yayoi | 25,000 m³ | Official illustrative calculation for a 2.5 km moat [34]. |
| Hashihaka tumulus | 3-4 C | 268,000 m³ | Mound length approximately 280–290 m; another estimate is 300,000 m³ [35]. |
| Shibutani Mukoyama tumulus | 4 C | 391,000 m³ | Ishikawa’s estimate for the traditionally attributed tomb of Emperor Keiko [36,37]. |
| Daisenryo tumulus | 5 C | 1,406,000 m³ | Obayashi estimate for the traditionally attributed tomb of Emperor Nintoku; transported material approximately 1,998,000 m³ [38]. |
| Fujiwara capital | Late 7 C | 13,140,000 m³ | Takeda’s estimate including grid roads, grading, and canals [39,40]. |
Table 14.
Number of Yayoi-period Sites.
| Prefecture | Site count | Share |
|---|---|---|
| Fukuoka | 3,084 | 8.6% |
| Nara | 585 | 1.6% |
| Japan total | 35,946 | 100.0% |
Disclaimer/Publisher’s Note: The statements, opinions and data contained in all publications are solely those of the individual author(s) and contributor(s) and not of MDPI and/or the editor(s). MDPI and/or the editor(s) disclaim responsibility for any injury to people or property resulting from any ideas, methods, instructions or products referred to in the content. |
© 2026 by the authors. Licensee MDPI, Basel, Switzerland. This article is an open access article distributed under the terms and conditions of the Creative Commons Attribution (CC BY) license (http://creativecommons.org/licenses/by/4.0/).
Copyright: This open access article is published under a Creative Commons CC BY 4.0 license, which permit the free download, distribution, and reuse, provided that the author and preprint are cited in any reuse.