

Submitted:
27 September 2026
Posted:
29 September 2026
You are already at the latest version
Abstract
A useful reading of supplier finance disclosures keeps three things apart: how much of an arrangement a buyer discloses, how much suppliers have been paid, and the buyer's own payment terms. Part of that separation is arithmetic — the financed-to-payables ratio equals the paid share of coverage times the coverage-to-payables ratio, so substituting total coverage for paid financing mechanically inflates any exposure measure. The contribution is empirical: comparing 2024–2025 consolidated reports from five European consumer groups (Carlsberg, Haleon, Heineken, Nestlé, Unilever) shows where these identities meet disclosure practice in ways the algebra alone would not predict. In 2025 the paid share of covered liabilities ranged from 54.5% at Haleon to 85.0% at Carlsberg; scaling by trade payables flipped the Heineken–Unilever ranking; Heineken disclosed an identical 7–180-day range for arrangement and comparator payables despite an 8–11-day gap between weighted averages; and Nestlé's buckets showed roughly 53 percentage points more balances beyond 120 days inside the arrangement than outside it. A comparability check finds one company's ratio numerator and denominator not drawn from the same accounting population. The findings support a defensible, stepwise reading without claiming non-compliance, forecasting a liquidity shortfall, or generalising beyond the five cases examined.
Keywords:
supplier finance arrangements
; reverse factoring
; IAS 7
; IFRS 7
; disclosure comparability
; trade payables
; payment-term analysis
; cash-scaled exposure ratios
1. Introduction
A supplier finance arrangement sits between a buyer’s procurement obligations and financing made available to its suppliers, and what it means for financial reporting depends on exactly which obligation is being measured and whose liquidity is actually affected. An invoice can already belong to an arrangement before any finance provider has paid the supplier. In the opposite direction, a supplier can be paid early while the buyer’s own contractual due date stays exactly where it was. Collapsing these two situations into one obscures the connection between what gets reported and the question an outside reader is actually trying to answer.
The amendments to IAS 7 Statement of Cash Flows and IFRS 7 Financial Instruments: Disclosures give us a chance to look at this problem with more explicit public information than was previously available. Issued in May 2023 and effective for annual periods beginning on or after 1 January 2024, they require companies to disclose the liabilities covered by supplier finance arrangements, the subset of those liabilities suppliers have already been paid for, payment due dates, and relevant non-cash changes (International Accounting Standards Board [IASB], 2023). What the amendments do is strengthen disclosure. What they do not do is turn every covered trade payable into a borrowing by rule, or fix a single statistic — a range, a mean, or a set of buckets — as the required way to report payment terms.
That distinction is not academic to a financial statement user. The total stock of invoices in an arrangement tells you its reporting scope; the paid subset tells you how much financing has actually reached suppliers against invoices the buyer has not yet settled. The buyer’s cash balance gives a sense of scale for potential cash demands, but it is neither the whole of its liquidity capacity nor proof that those invoices need to be settled right away. Whether these stocks could turn into a timing problem depends on payment terms and contractual rights, not on the disclosures by themselves — which describe exposure but do not establish that a problem exists.
None of this is a new observation. Gelsomino et al. (2026) look at 673 firms between 2011 and 2021 and find that disclosure and reporting behaviour tracked financing needs and outside scrutiny well before any common disclosure requirement existed. A later thematic review by the Financial Reporting Council (FRC, 2025) checked the new disclosures across ten selected UK companies and found that most gave the required information, though its keyword-based selection could not have caught programmes that went entirely undisclosed. So this article is not claiming to have discovered supplier finance opacity, or to be the first assessment of the revised rules. What it offers instead is a transparent, source-traceable look at how the newly available structured information changes specific, named analytical comparisons — and an honest account of where that information still falls short of what a real comparison would need.
Two of the relationships used later in this paper are mathematical identities, not empirical findings, and saying so plainly is itself part of what this paper contributes. First, once coverage, paid financing and payables are all expressed as ratios, the financed-to-payables ratio is simply the paid share of coverage multiplied by the coverage-to-payables ratio (Equation (2) in Section 3.3); the two factors are not two separate pieces of evidence, just two ways of decomposing the same number. Second, swapping the paid subset for total coverage in any exposure ratio raises the reported figure by an amount that follows algebraically from how far paid financing falls short of total coverage (Equation (3)) — that is not a finding about any particular company either. What is not fixed by identity is whether these two quantities differ enough in practice, and in which direction, to actually change a comparative judgement about real companies. Because neither IAS 7 nor ordinary practice specifies a single default numerator for comparing companies, a reader who is not alert to this distinction has no signal in the text that the choice matters at all. The five cases examined here are used to show exactly where it does.
That sets up three research questions. Given the arithmetic relationship between coverage, paid financing and trade payables, how large is the gap between the two natural numerators once real companies’ numbers are plugged in, and does that gap change a comparative ranking based on trade payables? Beyond a bare minimum–maximum payment-term range, what do weighted averages and monetary buckets actually add, and can two populations share an identical range while differing sharply on either of those statistics? And given what companies disclose about whether early-payment programmes affect their own due dates, do conditional acceleration scenarios tell us anything beyond restating, at a fixed multiplier, a ranking that reported cash and paid-financing balances already establish?
The evidence behind these questions is ten annual consolidated observations for Carlsberg, Haleon, Heineken, Nestlé and Unilever across 2024 and 2025. These five groups vary in programme scale, in how they format payment-term disclosures, and in how stable their reporting perimeter is, while all sharing a calendar year-end; Section 3.1 sets out the selection criteria and is candid about the limits of how systematically the wider population was actually screened. This is a purposive comparative case study, and it does not attempt to estimate population-wide adoption rates, the effect of mandatory disclosure, or the determinants of corporate default.
What we find is that measurement choices and disclosure format carry real, non-trivial consequences. In 2025, Heineken had greater arrangement coverage relative to trade payables than Unilever did, yet a smaller paid subset on that same denominator — an empirical reversal, not something Equation (2) would predict. Heineken also reported identical minimum and maximum terms inside and outside its arrangements, while its weighted averages differed materially. Nestlé, for its part, disclosed amount-weighted payment-term buckets that let us compare how concentrated the longer terms are, not just where the boundaries sit. Cash-scaled exposure moved independently of financed amounts in several cases, simply because cash itself moved for reasons unrelated to the programme. And a systematic check of what is and is not comparable across the five notes turns up at least one case — Nestlé — where the financed amounts are measured against a trade-payables sub-total narrower than the total payables figure in the same note. Together, these observations support working through the evidence in a particular order: scope, payment status and comparability first, payment timing and contractual consequences after — not collapsing everything into one composite risk score.
The rest of the article follows that sequence: a literature and regulatory discussion that positions the study against its closest neighbours (Section 2), a reproducible extraction and verification protocol (Section 3), comparative results organised around measurement, comparability and payment-term inference (Section 4), and a discussion that keeps accounting-analysis implications separate from treasury-practice implications (Section 5). What it leaves behind is a small, auditable dataset — fully re-verified against the primary financial statements during this revision — along with a framework for using it that does not turn disclosure into a presumption of misclassification or financial distress.
2. Literature and Regulatory Framework
2.1. Trade Credit and Financing Within Supply Chains
Trade credit is both a source of financing and a feature of ordinary commercial relationships. Petersen and Rajan (1997) show that firms lean more heavily on trade credit precisely when credit from financial institutions is harder to get, which helps explain why it matters who the creditor is and what kind of transaction lies underneath. A supplier’s willingness to extend payment terms can reflect information, commercial incentives and financing constraints quite different from whatever drives a bank’s lending decision.
Factoring brings a financial intermediary into the receivables relationship. Klapper (2006) looks at how factoring can finance smaller enterprises by drawing on the quality of their receivables and the creditworthiness of their customers. Reverse factoring flips this around, putting the ordering party at the centre of the arrangement in a way that can widen suppliers’ access to financing. From a banking perspective, arrangements like these sit within the broader set of services through which financial institutions support payments, credit and trade-finance transactions for business clients (Mihaylov et al., 2003). Kouvelis and Xu (2021) formalise the trade-off in a supply-chain model where reverse factoring eases a supplier’s financing constraint, but who actually captures the resulting surplus — supplier or buyer — depends on relative bargaining power and how the financier prices the arrangement; the benefit to the supplier is conditional, not guaranteed. It should also be kept separate from an extension of the buyer’s own contractual payment period: one can happen without the other, and a buyer disclosure that reports only a financed amount, with no payment-term information, cannot on its own tell you which of Kouvelis and Xu’s (2021) conditional outcomes actually describes a given programme.
Gelsomino et al. (2016) split the literature into finance-oriented and supply-chain-oriented perspectives: the former emphasises financing instruments tied to payables and receivables, the latter looks at broader working-capital optimisation. Wuttke et al. (2013) show, through case evidence, the organisational and interfirm dimensions of financial supply chain management. Wetzel and Wagner (2025) go further and develop a supply chain financing theory linking trade-payables policy to firm performance, in which the scale and structure of payables management — supplier finance participation included — can be tied to operating outcomes through several distinct mechanisms rather than one single channel. Taken together, these studies suggest that a balance-sheet classification alone cannot capture an arrangement’s full operational role, and that coverage (A) and paid financing (F) mark, in principle, different mechanisms rather than interchangeable labels for the same thing.
Lekkakos and Serrano’s (2016) analytical model shows why the benefit to suppliers depends on financing conditions and how far payment terms are extended — favourable financing does not mean that any extension of credit terms comes free to the supplier. Their work is part of why this study looks at the distribution of payment terms rather than relying on narrative descriptions of early-payment benefits alone. This study itself does not measure supplier welfare, financing costs, bargaining power or inventory decisions; what it asks is whether buyer disclosures supply the information those mechanisms would need as inputs.
2.2. Disclosure Quality and Analytical Usefulness
The disclosure literature ties corporate reporting to information asymmetry and capital allocation (Healy & Palepu, 2001), and the broader shift from conventional financial statements toward integrated reporting reflects a similar demand for a connected presentation of financial and non-financial information (Luchkov, 2021). More text, in this setting, is not necessarily more decision-useful information. A description that mentions a programme without separating its total coverage from its paid subset can leave a basic financing question unanswered, whereas a compact table can settle it directly. Writing in this journal, Haj-Salem and Hussainey (2021) find that firms’ risk disclosure is positively associated with the trade credit they get from suppliers — tying disclosure practice to an actual trade-credit outcome rather than just a narrative-quality score. Their evidence, drawn from general risk-disclosure indices before the amendments, raises the question of whether the structured, item-specific supplier-finance disclosures now available carry comparable informational content; this study answers that through direct measurement of five cases rather than an association test on a larger sample. Related work on corporate social responsibility reporting makes a similar point: the analytical value of a corporate report depends on the reporting model and how the information reaching stakeholders is structured (Nikolov & Stanev, 2018).
Beattie et al. (2004) develop a way of analysing annual-report narratives across multiple disclosure attributes, supporting the idea that quality is a multidimensional construct. The attributes that matter here are narrower: can a reader identify the reporting scope, see financing already supplied, compare payment terms, and connect those facts to their contractual cash-flow consequences? No general-purpose disclosure-quality score is imposed on the five companies. Evidence from public companies’ periodic reporting points the same way — formal disclosure and genuinely good disclosure practice are analytically distinct questions (Dimitrova, 2017). Similar concerns run through the expanding EU sustainability-reporting framework and digitally enabled ESG reporting, where data structure, indicator consistency and accounting judgement keep shaping how usable and comparable the disclosed information actually is (Moneva, 2025; Krasteva-Hristova & Moneva, 2026).
Gelsomino et al.’s (2026) recent findings explain why the pre-amendment reporting environment deserves attention, but they are not a causal benchmark for this dataset — the companies, the selection process, the time period and what is observed all differ. The FRC (2025) similarly found that most of its ten selected UK companies gave the required disclosures and acknowledged that materiality plays a role in what gets omitted, while its keyword-based selection could not catch programmes left out entirely. That same limitation shapes the present design: a sample built from observable disclosures cannot tell you how common unreported arrangements are, a boundary Section 3.1 makes explicit again.
So the gap this paper addresses is operational rather than conceptual. It is about the distance between an available disclosure and a conclusion you can actually defend. The study asks whether different reported quantities lead to different exposure comparisons, whether payment-term detail changes what a bare range would suggest, and whether the accounting populations behind a ratio’s numerator and denominator are genuinely comparable across the five notes. None of this claims to be untrodden ground; it extends existing reporting research rather than announcing a previously unexplored subject.
2.3. Positioning Relative to the Closest Studies
Table 1 sets the present study against the research it draws on most directly, summarising each study’s data, method and central result alongside the specific question this analysis takes further. The comparison is deliberately narrow — it is not a survey of the whole supply-chain-finance literature, which Gelsomino et al. (2016) already provide, but a selection of the studies whose data, period or mechanism overlap most closely with the disclosures examined here.
Put together, these studies point toward a measurement-first contribution rather than a large-sample or theoretical one. Gelsomino et al. (2026) and the FRC (2025) show that disclosure practice and content vary; Haj-Salem and Hussainey (2021) tie disclosure to a real trade-credit outcome; Kouvelis and Xu (2021) and Wetzel and Wagner (2025) give theoretical reasons why coverage, paid financing and payment terms could move independently of each other. None of the five asks directly whether the specific quantities the 2023 amendments now require — A, F and the payment-term disclosures — are, on their own, sufficient and comparable across companies. That is the question this study answers, for five cases, with arithmetic a reader can trace back to its source.
2.4. Recognition, Presentation and Disclosure Requirements
The IFRS Interpretations Committee’s December 2020 agenda decision spells out how existing standards apply to reverse factoring, covering presentation of liabilities, derecognition, cash-flow presentation and risk disclosures. What informs presentation is a payable’s nature and function, the normal operating cycle, and the terms of the arrangement. Derecognition is assessed under IFRS 9, and a mere change in who receives the cash does not by itself show that the original obligation has been extinguished (IFRS Interpretations Committee, 2020).
The 2023 amendments then add specific disclosure requirements. IAS 7 paragraph 44G covers arrangements that give the buyer extended payment terms or give suppliers early payment, excluding instruments that are purely credit enhancements and instruments used to settle directly with suppliers, such as credit cards. Paragraph 44H requires disclosure of the covered liabilities and the paid subset, their statement-of-financial-position line items, relevant terms, payment-date ranges and non-cash changes (IASB, 2023).

Table 2.
Regulatory provisions and their analytical use.
| Provision | Disclosure or Accounting Issue | Application in this Study |
|---|---|---|
| IAS 7.44F–44G | Scope and disclosure objective | Separate supplier early payment from buyer payment extension. |
| IAS 7.44H(a), (b)(i)–(ii) | Terms, covered liabilities and paid subset | Extract A and F; identify their balance-sheet location. |
| IAS 7.44H(b)(iii) | Ranges for SFA and comparable payables | Preserve ranges; analyse means or buckets only when disclosed. |
| IAS 7.44H(c), 62–63 | Non-cash changes, effective date and transition | Do not treat missing pre-application comparatives as zeros. |
| IFRS 7.39(c), B11F(j) | Liquidity-risk management and access to SFA | Distinguish observed terms from hypothetical acceleration. |
| IFRS IC decision, 2020 | Presentation, derecognition and cash flows | Do not infer automatic borrowing classification. |
* SFA = supplier finance arrangement. The table is an analytical mapping, not a legal compliance opinion. Source: IASB (2023), European Commission (2024) and IFRS Interpretations Committee (2020).
For EU reporting entities, Commission Regulation (EU) 2024/1317 amended the endorsed standards and set application from the first financial year starting on or after 1 January 2024 at the latest (European Commission, 2024). The UK Endorsement Board adopted the amendments for the corresponding UK reporting framework (UK Endorsement Board, 2023). It is worth keeping these two endorsement routes apart: the EU regulation is not the legal basis for every European-headquartered company. Nestlé is analysed here under its own stated IFRS basis, not on the assumption that Switzerland is an EU Member State.
Transition rules matter too. IAS 7 paragraph 63 relieves entities of comparative disclosures for periods before first application, and of beginning-of-period information on the paid subset and payment-date ranges in the first application year, along with first-year interim relief. It does not exempt every beginning-of-period disclosure. So this article draws no adverse compliance conclusion from a missing 2023 comparative, and it does not treat that absence as a zero.
3. Materials and Methods
3.1. Design, Selection and Reporting Boundary
The study draws on publicly accessible consolidated annual financial reports, retrieved on 9 September 2026 and re-verified on 10 September 2026. Four sampling criteria were applied together: a European-headquartered, listed, non-financial group with substantial consumer-facing operations; a 31 December year-end, so the 2024 and 2025 observations come from the same twelve-month reporting cycle in every case; English-language consolidated annual reports covering both 2024 and 2025; and an identifiable supplier finance note that discloses both the covered liabilities (A) and the paid subset (F), rather than just a qualitative description of the programme. Five cases met all four criteria and were retained: Carlsberg A/S, Haleon plc, Heineken N.V., Nestlé S.A. and Unilever PLC.
Two things about this selection are worth stating plainly rather than reconstructing after the fact. First, the calendar year-end criterion is not a neutral technicality — it mechanically rules out several otherwise comparable, large, European-headquartered consumer-facing groups that report on non-calendar fiscal years, such as Diageo plc and Pernod Ricard SA, both of which close their financial year on 30 June (Diageo plc, 2025; Pernod Ricard SA, 2025). Keeping those companies in would have meant either treating a June year-end balance as comparable to a December one, which this study avoids, or building synthetic calendar-year figures from interim reports, which brings its own estimation error. Second, the five retained cases came from the authors’ review of large, well-known consumer-facing groups’ 2025 annual reports, not from an exhaustive, documented screening of the full population of European-headquartered consumer companies with a recorded log of every candidate considered and excluded. This is a purposive, availability-oriented sample, and it is described that way rather than dressed up as the output of a pre-registered or fully reconstructed screening funnel. One consequence is that the study cannot say how many disclosing European consumer groups exist beyond these five, or what share of a larger population they represent — only that, together, these five are informative for the comparative and measurement questions posed in Section 1.
That the screening funnel is not fully documented does not mean the five cases were picked at random within the criteria above. Each contributes a distinct source of variation the analysis actually uses, rather than standing in for a different industry or geography treated as an explanatory variable. Carlsberg has the highest utilisation ratio in the sample (Section 4.1) and is the case where a documented revision between reporting vintages, discussed below, coincides with a material 2025 acquisition (Britvic) that can be examined against the same disclosure. Haleon has the smallest programme in both absolute and relative terms, which tests whether the ratio-based comparisons used here still say something useful at low materiality, and shows how whole-currency-unit rounding can exaggerate percentage changes (Section 4.6). Heineken is the case where identical minimum–maximum ranges sit alongside materially different weighted averages (Section 4.3), and, together with Unilever, the case where the ranking based on total coverage reverses once the paid subset is used instead (Section 4.1). Nestlé has the largest programme and the only monetary payment-term buckets in the sample, which allow a distributional comparison a range simply cannot give, together with an explicit disclosed qualification on how reliable F is and a payables denominator narrower than the total trade-and-other-payables figure in the same note (Section 4.2). Unilever offers the clearest example of a disclosure format changing between reporting years for the same underlying note, alongside a 2025 change in group perimeter — the ice cream demerger — that complicates any naïve year-to-year reading of its balances. None of these features says anything about a company’s economic risk on its own; what they determine is what the company’s disclosure lets an analyst learn, which is exactly what this study is about.
The unit of observation is the consolidated group at year-end, and the two observations for each company are not treated as independent firms. Annual-report labels refer to the financial year, while references identify the year of publication, so a 2024 annual report is normally cited as a 2025 publication. Source locations in Appendix A separate printed page numbers from PDF page positions.
The dataset treats the 2025 report and its comparative columns as the controlling numerical version, while keeping the separate 2024 report on hand to see what was disclosed in that year. Doing so turned up one relevant revision: Carlsberg’s 2024 trade payables were DKK 23,317 million in the 2024 report and DKK 23,295 million in the 2025 comparative. The main calculations use the latter figure; Table 6 in Section 4.2 records this revision alongside the study’s other comparability boundaries. The arrangement amounts and paid subsets themselves agree across both reporting vintages.
Consolidation changes can also affect comparisons. Carlsberg acquired Britvic in January 2025, and Unilever’s 2025 report reflects the ice cream demerger. The study works with reported group boundaries rather than constructing pro forma constant-perimeter figures, so year-to-year changes cannot be read as organic programme growth, a deliberate response to the amendments, or a pure financing-policy effect (Carlsberg A/S, 2026; Unilever PLC, 2026).
3.2. Extraction and Verification
The extraction protocol searched each report for supplier finance, supply chain finance, reverse factoring and related payment-status language, then read the relevant note alongside its surrounding accounting-policy text, the corresponding balance-sheet items and cash disclosures. Tabular values were checked against the rendered source pages to catch errors from column order, line wrapping and PDF text extraction. The resulting observations and their source locations are given in the accompanying reproducibility files.
The process combined AI-assisted document retrieval and extraction with a separate source re-extraction from the original report pages and deterministic calculations. It did not involve independent human double coding, and no inter-coder reliability statistic is claimed, which limits how much weight the interpretive coding can bear. To reduce reliance on subjective scoring, the comparisons reported here use explicit amounts and observable disclosure features rather than a composite index or an inferred compliance rating. This emphasis on traceable information, verification and monitoring also echoes the information-and-communication and monitoring components of the COSO internal-control framework discussed by Luchkov (2022).
For this revision, all five cases went through a separate re-extraction from their original financial statements rather than just a check against the inherited reproducibility package. Nestlé’s Note 7.2 in the Financial statements 2025 (Nestlé S.A., 2026) was re-extracted in the first verification pass; every A, F, TP, C and payment-term bucket used in the study was reproduced exactly, and the total trade and other payables line — CHF 21,807 million in 2024, CHF 20,023 million in 2025 — was recovered for the boundary analysis in Table 6. In a second pass, the 2024 and 2025 reports of Carlsberg, Haleon, Heineken and Unilever were opened again from scratch. A, F, TP, C, payment-term ranges or averages, source locations and classification statements were transcribed from the relevant note and statement pages before comparison with data.json, and every recorded amount and payment-term fact matched. The standalone 2024 reports were also cross-checked against the 2024 comparative columns in the 2025 reports, confirming the sole source-version difference already disclosed: Carlsberg’s TP moved from DKK 23,317 million in the 2024 report to DKK 23,295 million in the 2025 comparative, and the analysis uses the latter. A freshly retrieved copy of Heineken’s 2025 report reproduced the registered SHA-256 hash. The supplemental verification_register.json, source_verification.md and verification script record the report hashes, pages, re-extracted values and comparison outcome. This was, again, an AI-assisted source-verification pass, not an independent human audit or double-coding exercise.
Four monetary variables were collected. A is the year-end liabilities covered by supplier finance arrangements. F is the subset of A for which suppliers have already been paid by finance providers. TP is reported trade payables, and C is cash and cash equivalents on the consolidated statement of financial position. All amounts stay in millions of the company’s own reporting currency; cross-company comparisons use ratios, and no DKK, GBP, CHF and EUR amounts are added together.
A is a stock of covered liabilities, not a programme credit limit, committed financing capacity or annual transaction volume. F is also a stock — it does not measure the annual value of early payments, and it does not show that the buyer received extra financing for an equivalent period. In Nestlé’s reports, F is described as approximate and based on information supplied by financial institutions, subject to qualifications, and that uncertainty is carried through into how the figure is interpreted here.
TP is kept separate from the broader trade-and-other-payables line, which can include taxes, accruals and other obligations. Nestlé’s arrangement disclosure refers to invoices from suppliers of goods and services within trade and other payables, so comparing it with TP is a scale measure, not proof that numerator and denominator represent exactly the same accounting population — Section 4.2 quantifies this boundary using the total trade-and-other-payables figures recovered during the Section 3.2 re-verification. C is taken before bank-overdraft netting and excludes separately disclosed short-term investments; it is a common, limited cash benchmark, not freely transferable group liquidity.
3.3. Exposure Measures, Identities and the Interpretive Method
The calculations separate three things: utilisation of the disclosed invoice stock, arrangement coverage, and financed exposure. The four primary ratios appear in equation 1; multiplying by 100 turns them into percentages:
U = F/A; P = A/TP; E = F/TP; L = F/C
U is the proportion of disclosed arrangement liabilities already paid to suppliers. P scales the programme-covered liabilities against trade payables. E scales only the paid subset against trade payables. L compares the paid subset with balance-sheet cash — an exposure-to-cash ratio, not a liquidity-coverage ratio with any established regulatory meaning, and it is not treated as one anywhere in this article.
Expressed as ratios rather than percentages, U, P and E satisfy the identity in equation 2:
this is simply a consequence of the ratios sharing a common term — A sits in U’s denominator and P’s numerator — and it holds for every observation in the dataset by construction; it is not itself an empirical finding. Its use here is diagnostic: because E factors into U and P, a comparison based on E can always be broken down into “how much of coverage is paid” and “how large coverage is relative to trade payables,” which helps interpretation but adds nothing beyond what U and P already contain on their own.
E = U × P
A second, related identity concerns what happens when A is substituted for F in an exposure measure. Equation 3 gives the proportional excess that substitution produces:
whether the resulting difference deserves the label “overstatement” depends on intent: if the analyst’s construct is the amount already financed, calling it an overstatement is fair; if the intended construct is total programme coverage, A is the right measure and there is no overstatement at all. B is reported as a descriptive statistic in Table 5 (Section 4.1) — the proportional gap between the two natural numerators for each case — and, like equation 2, it is not by itself evidence of a reporting problem.
B = (A − F)/F = A/F − 1
Table 3 keeps these two identities separate from the empirical findings that depend on the actual disclosed figures for the five companies and could not have been deduced from equations 2 and 3 alone. That distinction runs through Section 4: something is described as a mathematical consequence when it would hold for any positive A, F, TP and C satisfying F ≤ A, and as an empirical finding when it depends on the specific numbers the five companies actually reported.
Table 3.
Mathematical identities versus empirical findings.
| Type | Expression / Example | Status | Where Evidenced |
|---|---|---|---|
| Ratio decomposition | E = U × P | Mathematical identity: true by construction whenever A, F, TP > 0. | Confirmed numerically for every observation in Table 5; not itself evidence of a reporting pattern. |
| Numerator substitution | B = A/F − 1 | Mathematical identity: the proportional excess from using A instead of F follows deterministically from how far F falls short of A. | Reported as B (%) in Table 5; a large B signals a wide coverage–financing gap, not an error. |
| Ranking on P vs. E | rank(P) ≠ rank(E) for Heineken vs. Unilever, 2025 | Empirical finding: not implied by equation 2; depends on the companies’actual reported A, F and TP. | Section 4.1 |
| Equal range, unequal mean | range(SFA) = range(non-SFA) but mean(SFA) ≠ mean(non-SFA), Heineken | Empirical finding: a range alone does not determine a weighted mean. | Section 4.3 |
| Divergent bucket concentration | share(>120 days): SFA ≈ 55% vs. comparator ≈ 2–3%, Nestlé | Empirical finding: specific to Nestlé’s reported invoice population. | Section 4.3 |
| Divergent ΔF vs. ΔC | Heineken 2024→2025: F falls 4.0%, C rises 103.1% | Empirical finding: driven by cash management and reporting-perimeter events, not by any identity. | Section 4.4 |
3.4. Payment-Term Analysis and the Term-Versus-Maturity Boundary
Payment-term analysis keeps the form each company chose to disclose. A minimum–maximum range is not converted into a mean by taking its midpoint. Where weighted averages are disclosed, the difference between them is computed directly. Where monetary buckets are disclosed, the share of invoice balances with terms beyond 120 days is calculated within each disclosed population — this avoids inventing a distribution for an open-ended bucket.
For Nestlé, the first two bucket labels are reproduced exactly as reported, including the wording around the 60-day boundary. No observation is assigned to an unreported boundary category; the calculation uses only the unambiguous sum of the 121–180 and above-180-day buckets divided by the disclosed total. These are contractual payment terms attached to outstanding invoices, not evidence that the invoices are overdue.
Section 4.3 keeps two time concepts apart that are easy to conflate. The disclosed ranges, weighted averages and buckets describe the contractual term from invoice date to the contractual or expected payment date attached to outstanding balances — they are not a remaining-maturity schedule counted from the reporting date, which would instead show how much of each balance falls due within, say, the next 30, 60 or 90 days from year-end. None of the five notes provides that. For this reason, the term “maturity bucket,” which some commentary applies loosely to disclosures like these, is avoided here in favour of “payment-term bucket”: the buckets partition invoices by their contractual term length, not by remaining time to the balance-sheet date or to cash settlement.
3.5. Conditional Scenarios and Accounting Adjustments
The scenario analysis asks a narrow question: what fraction of reported cash would be needed if a stated share of F had to be settled earlier and the buyer covered that entirely out of existing cash? Two deliberately uncalibrated severities are used, α = 0.25 and α = 0.50. Equation 4 defines the accelerated payment amount and its scale relative to cash:
because Q(α) is linear in α for a fixed F and C, the ordering of the five companies at α = 0.50 is, by construction, identical to their ordering at α = 0.25, simply doubling every value; Section 4.5 and Appendix B come back to this when presenting the corresponding table. These severities are chosen by the analyst, not estimated — they are not probabilities, actual termination terms, observed cash outflows or forecasts. A buyer whose invoice due dates stay unchanged need not make any accelerated payment when a supplier’s early-payment option ends; in that contractual case the immediate acceleration channel is zero, though future supplier negotiations or supply disruption could still matter. The positive-α scenarios illustrate an additional contractual or commercial change, not programme cessation on its own.
S(α) = αF; Q(α) = αF/C
The calculations leave out replacement financing, operating inflows, available credit lines, investment liquidation and differences in the legal availability of cash — and, in the other direction, they leave out simultaneous demands from other creditors too. What results is a transparent sensitivity benchmark, not a complete treasury stress test. Balance-sheet cash, accordingly, should be read within the wider system of financing sources and financial relationships rather than treated as a full measure of financial capacity (Blagoeva, 2026).
An analytical debt adjustment of the form D* = D + βF — where D is a clearly defined borrowing measure and β is the share of the paid subset an analyst chooses to treat as debt-like — is a presentation sensitivity, not a claim that the accounts should be restated, and it only makes sense once you have checked that the same amount is not already sitting inside D. Rating-agency practice offers a template for this kind of adjustment: Kraft (2015) shows that credit rating agencies routinely adjust reported GAAP figures, including reclassifying certain off-balance-sheet and hybrid obligations, and that these adjustments carry a measurable association with assigned ratings and credit spreads. No adjusted company debt totals are estimated in this article, because the disclosures do not establish a common classification rule across the five arrangements; the point is raised only so that an analyst adapting this framework knows where such an adjustment would enter.
Reclassification and payment also need to be told apart. If an amount moves from current trade payables to current borrowings, total current liabilities, cash and the current ratio do not change. If cash is used to extinguish an existing current payable, both current assets and current liabilities fall. With x denoting the cash settlement, the current ratio becomes (CA − x)/(CL − x), provided CL exceeds x; subtracting x from cash while leaving liabilities unchanged would misstate that settlement. These identities set the boundaries of what the scenario table in Appendix B actually means.
3.6. Reproducibility, Precision and Inference
Calculations use Python and the standard library only — no random sampling, fitted regression, resampling or imputed observations. The accompanying script reads a documented JSON dataset and reproduces all exposure ratios, changes, payment-bucket shares and sensitivity results. Figures are rounded only after calculation, to one decimal place throughout; this is coarser than the two decimal places used in the previous draft, reflecting the whole-currency-unit rounding already present in the smallest programme in the sample (Haleon, Section 4.6) and avoiding a false impression of precision the underlying disclosures cannot support. The software version used for the delivered computations is recorded in the supplementary README.
With five selected groups and two reporting dates, a statistical significance test would only create a false impression of population inference, and the sample size will not support regression modelling either, so none is fitted. Bolting a regression onto ten observations to make the analysis look more formal would be misleading about how far it generalises, so the study deliberately stays within descriptive and comparative analysis. Consistency checks require F not to exceed A, positive cash and trade-payables denominators, and agreement between Nestlé’s SFA buckets and its reported arrangement total. One version-specific sensitivity repeats the Carlsberg calculation using the original 2024 trade-payables balance; a separate ±5% sensitivity illustrates the effect of uncertainty in Nestlé’s approximate paid subset — it is a sensitivity check, not a confidence interval.
4. Results
Three caveats hold throughout this section and are not repeated at every table. None of the reported ratios establishes reporting non-compliance — the mapping in Table 2 is analytical, not a compliance opinion. None of them predicts a liquidity shortfall — L and the scenarios in Section 4.5 are exposure-scale measures, not forecasts. And none of the cross-company comparisons generalises beyond the five selected cases (Section 3.1). Caveats specific to one table or comparison are given where that comparison comes up.
4.1. Observed Balances, Financed Exposure and the Identities in Practice
Table 4 gives the source amounts, and the scale differences are substantial: in 2025 Haleon disclosed GBP 11 million of covered liabilities, while the other cases reported figures in the billions of their respective currencies. These absolute amounts are not ranked across currencies; their role is to keep an auditable link between each source and the dimensionless comparisons that follow.
Every case discloses an F smaller than A. In 2025, the paid proportion ran from 54.5% at Haleon to 85.0% at Carlsberg, with Heineken at 55.1% and Nestlé and Unilever both close to 78%. So programme coverage and realised early payment describe observably different positions even among companies using very similar accounting labels.
Table 5 reports the primary ratios together with B, the proportional excess from Equation (3). For 2025, substituting A for F raises the measured amount already financed by 17.7% at Carlsberg, 83.3% at Haleon, 81.6% at Heineken, 28.5% at Nestlé and 29.1% at Unilever. Table 3 already flags these as a mathematical consequence of each company’s own U, and they are reported here to show how far from trivial that consequence is in size, not as a separate discovery. The identity in Equation (2) can also be checked directly against Table 5: for Heineken in 2025, U × P = 0.551 × 30.2% ≈ 16.6%, matching E to within rounding, and the same holds row by row.
Table 5.
Distinct measures of programme use and financed exposure.
| Group | Year | U = F/A (%) | P = A/TP (%) | E = F/TP (%) | L = F/C (%) | B = A/F − 1 (%) |
|---|---|---|---|---|---|---|
| Carlsberg | 2024 | 89.5 | 11.3 | 10.1 | 20.5 | 11.8 |
| Carlsberg | 2025 | 85.0 | 11.8 | 10.0 | 28.1 | 17.7 |
| Haleon | 2024 | 53.3 | 0.8 | 0.4 | 0.4 | 87.5 |
| Haleon | 2025 | 54.5 | 0.5 | 0.3 | 0.5 | 83.3 |
| Heineken | 2024 | 55.9 | 30.1 | 16.9 | 42.9 | 78.8 |
| Heineken | 2025 | 55.1 | 30.2 | 16.6 | 20.3 | 81.6 |
| Nestlé | 2024 | 77.6 | 37.2 | 28.9 | 86.7 | 28.9 |
| Nestlé | 2025 | 77.8 | 36.8 | 28.7 | 100.8 | 28.5 |
| Unilever | 2024 | 86.5 | 21.5 | 18.6 | 31.1 | 15.7 |
| Unilever | 2025 | 77.5 | 24.2 | 18.8 | 52.4 | 29.1 |
1 Source: calculations from Table 4 using equations 1–3. TP-based measures are scale comparisons; see Section 4.2 for the Nestlé population boundary. L is not a measure of immediately payable obligations or total available liquidity. B is a mathematical identity (Table 3), not an empirical result.
Which numerator you pick also changes relative positions, and unlike B, this reversal is an empirical finding — nothing in equations 1–3 requires it. Heineken’s 2025 programme coverage is 30.2% of TP, against Unilever’s 24.2%; using the paid subset instead gives 16.6% and 18.8%. The ordering flips. It is a concrete illustration of why a ranking labelled “supplier-finance dependence” is incomplete unless it says whether it is measuring covered invoices or financing already supplied.
Among the five cases, the largest F/TP scale measure is Nestlé’s 28.7% in 2025, and the smallest is Haleon’s 0.3%. These figures should not be read as default probabilities — they describe the size of identified financing within each buyer’s own reporting context, subject to the numerator–denominator limitation examined next.
4.2. Comparability Boundaries Across the Five Cases
The ratios in Table 5 assume that each numerator and denominator come from a comparable accounting population and a stable reporting perimeter. Table 6 checks that assumption case by case, drawing on the source register in Appendix A and the full source re-extraction described in Section 3.2.
Table 6.
Comparability qualifications by company.
| Group | A / F Scope (Note) | Perimeter Change in Period | Denominator / Reliability Qualification |
|---|---|---|---|
| Carlsberg | Liabilities/paid subset under supplier finance arrangements (Section 1.3/1.4); no boundary mismatch identified between the A/F population and TP. | Britvic acquired January 2025; the 2025 group perimeter therefore differs from 2024. | 2024 TP revised between reporting vintages (DKK 23,317m → 23,295m); the main analysis uses the revised comparative (Section 3.1). |
| Haleon | Note 18; A and F reported in whole GBP million; no boundary mismatch identified. | No consolidation change flagged in the note. | Small absolute values mean rounding to the nearest GBP million materially affects displayed percentage changes (Section 4.6). |
| Heineken | Note 7.3; no boundary mismatch identified between the A/F population and TP. | No material consolidation change flagged in the note. | Weighted-average payment terms are company-calculated; the note does not disclose the weighting method. |
| Nestlé | Note 7.2; A and F cover invoices from suppliers of goods and services within trade and other payables. | No acquisition or disposal flagged for the SFA note itself. | TP used here (CHF 16,097m in 2025; CHF 16,685m in 2024) is a narrower trade-payables sub-total than the total trade and other payables reported in the same note (CHF 20,023m in 2025; CHF 21,807m in 2024, independently re-confirmed during this revision — Section 3.2). A/TP and F/TP are therefore scale comparisons against a narrower base than the full payables caption. F is separately qualified by the company as approximate and financier-supplied. |
| Unilever | Note 14; no boundary mismatch identified between the A/F population and TP. | Ice cream business demerger completed during 2025 changes the group perimeter. | The 2024 payment-term cell was presented in the 2024 report as a maximum only (180 days); the 2025 report itself supplies the full 0–180 range, which the present analysis follows explicitly (Section 4.3). |
1 Source: Appendix A source register and the Section 3.2 re-extraction. “No boundary mismatch identified” means that neither the note text nor the re-extracted values indicated a scope difference between the A/F population and TP for that company; it remains an interpretive source reading, not an independent audit opinion.
Nestlé’s row shows why this check matters beyond a footnote. A/TP and F/TP for Nestlé in Table 5 (36.8% and 28.7% in 2025) already read more like scale comparisons than exact shares, because the note itself refers to invoices from suppliers of goods and services within trade and other payables. The re-extraction done for this revision confirms that the TP figure used here (CHF 16,097 million) really is a sub-total of the CHF 20,023 million total trade and other payables reported in the same statement, rather than an error or rounding artefact: swap in the total figure as the denominator instead, and A/TP and F/TP fall to roughly 29.6% and 23.0% — materially lower than Table 5 reports, with no change to the numerator. Carlsberg’s and Unilever’s consolidation changes have a comparable, if less immediately quantifiable, effect on year-to-year readings — perimeter effects, not programme effects, and Section 4.4 returns to them when interpreting changes over time.
4.3. Information Added by Payment-Term Detail
Table 7 compares the form and content of the payment-term disclosures. All five groups give quantitative payment-term information, but that information supports different calculations depending on its shape. A minimum–maximum range marks out boundaries; a weighted average adds where balances actually sit within them; monetary buckets let a reader calculate specific portions of the distribution. Section 3.4 explains why these are contractual-term statistics rather than a remaining-maturity schedule.
Table 7.
Payment-term information and its analytical limits.
| Group | 2024 | 2025 | Additional Information |
|---|---|---|---|
| Carlsberg | SFA 60–180; comparator 15–140 | SFA 60–180; comparator 15–130 | Typical ranges; no weighted mean extracted. |
| Haleon | SFA 60–125; comparator 30–125 | SFA 60–125; comparator 30–125 | Ranges only; no midpoint imputed. |
| Heineken | Both 7–180; means 114 / 103 | Both 7–180; means 119 / 111 | Mean gaps: 11 and 8 days. |
| Nestlé | SFA >120 days: 54.6%; comparator: 2.1% | SFA >120 days: 55.5%; comparator: 2.6% | Shares calculated from four monetary buckets. |
| Unilever | 180 for each population, subsequently clarified as maximum | 0–180 for each population | 2024 minimum cannot be inferred from the maximum. |
1 Terms and weighted means are in days; slash-separated means are SFA / comparable non-SFA. Percentages are calculated shares of each disclosed invoice population. Sources: the ten reports in Appendix A. The above-120-day shares describe contractual terms, not overdue invoices or remaining time to maturity.
Heineken gives a particularly clean demonstration of the distinction Table 3 draws between an identity and an empirical finding. Both SFA and comparable non-SFA payment terms range from 7 to 180 days in each year, yet the weighted averages come out at 114 versus 103 days in 2024 and 119 versus 111 days in 2025 — an 11-day gap, then an 8-day gap. Equal boundaries plainly do not mean equal payment profiles, and the narrower gap does not imply that either average actually shortened.
Nestlé’s bucket data offer another comparison. In 2024, CHF 3,390 million of SFA invoices carried contractual terms above 120 days, against CHF 147 million in the disclosed non-SFA comparator population — shares of 54.6% and 2.1%. In 2025 the amounts are CHF 3,291 million and CHF 185 million, giving 55.5% and 2.6%. The gap is 52.5 percentage points in one year and 52.9 in the next. These numbers describe the disclosed populations; they do not show that joining an SFA caused longer terms — supplier, jurisdiction and purchasing characteristics can affect both participation and terms.
Unilever’s 2025 report explains directly that the 2024 disclosure only gave the maximum term of 180 days, while 2025 gives the full 0–180-day range. The 2024 figure should therefore not be read as a uniform 180-day payment period, or as evidence that its minimum was zero. The change makes the range easier to interpret without implying any change in the underlying contracts (Unilever PLC, 2026).
Carlsberg’s typical SFA range is 60–180 days in both years, while its comparator range moves from 15–140 to 15–130 days. Haleon reports 60–125 days inside its arrangements and 30–125 days outside them in both years. Neither pair of ranges supplies the weights needed to calculate an average extension, and assigning midpoint values would manufacture a statistic rather than extract an observed one.
Table 8 restates these five cases as a single inferential matrix — what each note discloses, what can legitimately be inferred from it, and what remains unknown even once the calculation is finished.
Table 8.
Payment-term disclosure, permissible inference and remaining unknowns.
| Group | What is Disclosed | What Can Be Inferred | What Remains Unknown |
|---|---|---|---|
| Carlsberg | Typical range only (SFA 60–180 both years; comparator 15–140 in 2024, 15–130 in 2025). | The comparator range narrowed at the top end between years; the SFA range is unchanged. | No weighted mean or bucket weighting; cannot say whether the narrowing reflects a shift in the balance-weighted average or only in the extremes. |
| Haleon | Typical range only (SFA 60–125; comparator 30–125, both years). | SFA terms are more compressed than comparator terms at the lower bound in both years. | No weighted mean; the population is small enough that a handful of invoices could move the range without being representative. |
| Heineken | Both ranges (7–180 days, both years) and weighted averages (114/103 days in 2024; 119/111 in 2025). | SFA balances are, on average, settled/financed later than comparator balances by 8–11 days, despite identical boundaries. | The weighting method (balance-weighted vs. count-weighted) and the underlying distribution shape between the reported boundaries and the mean. |
| Nestlé | Four monetary buckets each year, for both the SFA and comparator populations. | Share of balances beyond 120 days: SFA ≈55% vs. comparator ≈2–3%; concentration, not only central tendency, differs sharply. | No sub-division within the 121–180 and >180 buckets, and no explicit boundary treatment at exactly 60 days (Section 3.4). |
| Unilever | 2024: maximum only (180 days), later clarified by the company itself; 2025: full range (0–180 days), both populations. | The 2025 disclosure is more informative than the 2024 disclosure by design, not because terms changed. | The 2024 minimum cannot be recovered from the maximum alone and is not backfilled here. |
1 Source: Table 7 and the underlying notes in Appendix A. Rows summarise Section 4.3; none of the “inferred” entries treats a contractual-term statistic as a remaining-maturity or over-due-balance statistic.
Only Heineken, across the sample, provides the weighted averages used here, and only Nestlé supplies the monetary buckets behind the above-120-day calculation. These features are simply reported where they exist; their absence elsewhere is not scored as non-compliance, since IAS 7 does not demand one universal statistical format regardless of circumstances.
4.4. Cash-Scaled Exposure and Changes over Time
Figure 1 compares the paid subset with balance-sheet cash. In 2025, F/C runs from 100.8% at Nestlé down to 52.4% at Unilever, 28.1% at Carlsberg, 20.3% at Heineken and 0.5% at Haleon. The ratio uses stock amounts at a common date, but the cash and payable balances need not belong to the same legal entity or jurisdiction — so it is a first-stage scale comparison, not a test of funds actually available at settlement.
Looking at 2024–2025 changes separates movements in F from movements in C (Table 9). Nestlé’s paid subset falls 4.2%, but cash falls further still, by 17.6%, pushing F/C up by 14.1 percentage points. Unilever’s paid subset rises 8.2% while cash drops 35.8%, lifting the ratio by 21.3 points. Heineken runs the other way: F falls 4.0% while cash rises 103.1%, pulling F/C down by 22.6 points. None of this follows from Equations (1)–(3), as Table 3 notes — it follows only from how F and C actually moved, for reasons the disclosures do not fully explain (Section 4.2’s discussion of Carlsberg’s and Unilever’s perimeter changes is directly relevant here).
Haleon offers a useful scale check. Its F falls from GBP 8 million to GBP 6 million, but its cash balance falls faster still, so its already tiny F/C ratio actually rises, from 0.4% to 0.5%. A rising exposure ratio, in other words, does not necessarily mean supplier financing is growing. Carlsberg’s ratio rises even as its paid proportion U declines — different ratios answer different questions, and folding them into some undefined risk ranking would blur exactly those distinctions.
These changes are accounting-date comparisons, and they carry the fingerprints of cash management, acquisitions, disposals, currency translation and other group developments all at once. The dataset cannot separate out each driver’s contribution, and it cannot attribute any of these changes to the supplier finance disclosure amendments themselves.
4.5. Contractual Evidence and Illustrative Acceleration Scenarios
Whether an accelerated-payment scenario means anything for a given company depends first on the contractual evidence, not on the scenario arithmetic itself. Nestlé states that its arrangements include no conditions forcing aggregated pre-payment ahead of individual invoice maturities. Unilever and Haleon both describe unchanged buyer due dates when suppliers choose early payment. None of these disclosures supports treating programme termination as immediate settlement of F. Carlsberg goes further and states that termination would not pose a significant liquidity risk given the amounts and number of providers involved. These management assessments remain part of the evidence, and applying an arbitrary positive α does not overturn them.
If existing due dates stay enforceable, the immediate acceleration model gives α = 0. The positive scenarios instead stand in for an assumed renegotiation, acceleration right or other commercial change that brings settlement forward. They illustrate scale for contingency planning; they do not claim that such a trigger exists for any specific company. A fuller stress test would need maturity ladders, legal terms and cash resources broken down by entity.
Appendix B (Table B1) reports the corresponding numeric scenarios at α = 0.25 and α = 0.50 for completeness, but two features limit what it can add beyond Section 4.1 and Section 4.4. First, because Q(α) is linear in α (Equation (4)), the 50% column is, by construction, exactly twice the 25% column for every company, so the two columns can never disagree on ranking and do not amount to two independent pieces of evidence. Second, both columns are monotonic transformations of the F/C ratio already reported in Table 5, so the ranking Appendix B produces is the same ranking already visible in Section 4.1. Appendix B is presented here as an illustrative scale table tied to the contractual evidence discussed above, not as independent confirmation of the exposure ranking.
Using A instead of F in the same scenario would enlarge the base by the substitution percentages already reported in Table 5’s B column. That can be a deliberate, broader scenario if it is meant to include invoices not yet financed — but it has to be labelled that way. It cannot be presented as the withdrawal of financing already provided without explaining the difference in scope.
4.6. Sensitivity to Reporting Versions and Measurement Uncertainty
Swapping in Carlsberg’s original 2024 TP instead of the revised comparative moves F/TP from 10.15% to 10.14% — a difference of roughly 0.01 percentage point, and not one that changes any substantive comparison. The revision is documented in Table 6 anyway, because reproducing a ratio from a different report vintage would otherwise give a slightly different answer without anyone noticing why.
Nestlé’s reported paid subset is approximate, and an analyst-chosen ±5% swing around its 2025 F puts F/C anywhere between 95.8% and 105.8%. The sample ordering on this measure does not change, but whether the ratio lands just below or just above 100% is not robust to that swing. The right conclusion, then, is that this exposure sits at roughly the same scale as balance-sheet cash — not a sharp claim resting on whether it crosses the 100% line. That perturbation is not an estimate of the actual error in information supplied by financial institutions.
Haleon’s small programme values also call for care around rounding, which is why every percentage in this article is shown to one decimal place rather than two (Section 3.6). Amounts are reported in whole millions of GBP, so percentage changes can look large next to fairly modest absolute movements — a one-million-pound shift in F or C moves a ratio measured in tenths of a percentage point. Its place as the smallest exposure relative to cash and trade payables in this sample is clear, but any further decimal place would claim more precision than the published whole-million inputs can actually support.
5. Discussion
5.1. Comparability Gains and Their Limits
The headline result is that the revised disclosures allow for more than a yes/no identification of programme use — they allow invoices within the arrangement and invoices already financed to be measured separately. Across the five cases, these two stocks differ enough to change both amounts and comparative ordering, and that is an empirical result, not something implied by Equation (2) or (3) (Section 3.3, Table 3). It fits the financing perspective Gelsomino et al. (2016) identify and Kouvelis and Xu’s (2021) model, where a supplier’s realised benefit from reverse factoring is conditional on terms the buyer’s balance-sheet disclosure alone does not reveal; the payment-term evidence in Section 4.3 ties the same distinction to the broader working-capital perspective those studies also raise.
The study also clarifies what comparability actually means for this set of decisions. A user needs information that answers a specific question. If the question is about financier-paid invoices, F is what matters. If it is about the spread of payment terms, equal ranges do not by themselves establish equal distributions. If it is about acceleration risk, neither A nor F substitutes for contractual terms. If it is a cross-company ranking on a payables-scaled measure, that ranking first has to survive the comparability check in Table 6 — Nestlé’s narrower TP denominator being the clearest instance in this sample. These dimensions are complementary and are best kept visible rather than folded into one equally weighted score, in line with Haj-Salem and Hussainey’s (2021) finding that disclosure informativeness, not disclosure volume, is what actually relates to a real trade-credit outcome.
The evidence here is compatible with the broader concern about reporting heterogeneity that Gelsomino et al. (2026) raise, but it neither replicates their findings nor shows that the amendments have eliminated earlier problems — it looks at selected disclosers after the effective date. The FRC (2025) makes a similar point about descriptions of the arrangements, their effect on cash flows, and the management of liquidity risk. What this paper contributes is a demonstration of the specific numerical consequences of using different disclosed quantities and levels of payment-term detail, and, through Table 6, a case that a systematic comparability check is itself a necessary step before such quantities can be compared at all.
5.2. Implications for Accounting Analysis
An external analyst should start by mapping the note’s perimeter, following the format of Table 6. Receivables the reporting company has sold are a different thing from arrangements where its suppliers get early payment. Customer rebates, taxes and accruals can be buried inside broader payable captions, as Nestlé’s note shows directly. Programme limits, enrolled invoices, outstanding funded invoices and annual transaction volumes should not be treated interchangeably. This kind of separation follows the general accounting principle that economically different objects and transactions need to be identified before their recognition, classification and presentation can be settled (Dimitrova, 2024).
Once the perimeter is settled, an analytical debt adjustment needs a defined purpose. An analyst may reasonably treat some financier-paid obligations as debt-like for comparative credit analysis, in the spirit of the GAAP adjustments Kraft (2015) documents among rating agencies — but that does not determine IFRS recognition or presentation. Existing obligations cannot be added to both trade payables and borrowings when totalling liabilities, and current-to-current reclassification cannot mechanically move the current ratio. These constraints come straight from accounting identities and hold regardless of the analyst’s view of economic substance. More broadly, how a financing arrangement is treated in the accounts depends on its organisational form and substantive characteristics, not on the financing label alone (Georgieva, 2015).
Cash-flow interpretation demands the same discipline. F is a closing stock, so subtracting the full amount from annual operating cash flow would mix a balance with a flow. Even the change in F is not automatically a correction to operating cash flow — non-cash movements, consolidation changes and contractual cash-flow presentation can all matter, as Table 6 shows for Carlsberg and Unilever. What the available dataset supports, then, is exposure comparisons and conditional timing scenarios, not a reconstructed cash-flow statement.
The cross-company ranking reversal in Section 4.1 is useful precisely because it needs no contested restatement — it follows directly from two separate quantities the companies themselves publish. Analysts can report P and E side by side and explain what each means, using Table 3’s vocabulary to keep the definitional part of the comparison (E = U × P) separate from the empirical part (which company ranks where). That lets users see both programme reach and financing already supplied without implying that one accounting label settles risk on its own.
5.3. Implications for Treasury Management and Reporting Practice
Treasury teams need to separate immediate legal obligations from secondary commercial effects. If early-payment facilities end but invoice maturities stay the same, the buyer may face no accelerated outflow at all at first — as Section 4.5’s review of Nestlé’s, Unilever’s, Haleon’s and Carlsberg’s own contractual statements suggests. Suppliers may still push for revised terms, alternative financing or different commercial conditions, but that second channel depends on supplier resilience, bargaining power and how critical the procurement relationship is — the mechanisms Kouvelis and Xu (2021) formalise — none of which can be read off the year-end paid balance alone. This second channel can also be seen as a counterparty-risk problem, since shifts in how suppliers and other business partners act and react can create unexpected risk for the buyer (Ivanova, 2019).
For external reporting, extra detail is most useful when it resolves a genuine ambiguity. A stated range can be supplemented with a weighted average or amount-weighted buckets when those additions explain a wide or uneven distribution, as Heineken’s and Nestlé’s notes already do. Saying whether programme withdrawal changes the buyer’s due dates can tell a reader more than a generic statement that the arrangement supports suppliers. Describing the source and limitations of the paid-subset data, as Nestlé does, lets users calibrate how much precision to expect; spelling out the denominator’s exact scope — something Nestlé’s note does only partially — would remove the need for the kind of reconciliation performed in Table 6.
None of this means all five companies should publish the same volume of detail. Materiality and programme design differ substantially — Haleon’s small balances, for instance, sit in a very different context from the much larger arrangements elsewhere in the sample. A sensible reporting objective is proportionality paired with clarity: the disclosure should identify the relevant amount, timing mechanism, denominator scope and uncertainty at a level that fits the company’s own circumstances.
5.4. Limitations and Further Research
The first limitation is selection, and it is worth restating without softening it. The five groups were identified through the authors’ review of large, well-known consumer-facing disclosers, not through a fully documented, exhaustive screening of the European consumer-goods universe with a recorded exclusion log (Section 3.1). The evidence cannot identify undisclosed programmes, cannot say how many other disclosing European consumer groups exist, and cannot establish whether a typical European company has a comparable reporting profile. Large multinational consumer groups also differ from smaller firms and other sectors in procurement organisation, bargaining power and access to financing.
Second, the observation window is short. Two year-ends cannot show how stable a programme is over the course of a year, whether seasonal balances are representative, or whether a given change will persist. The data do not identify the causal effect of the amendments, which would need a different comparison design and a substantially larger dataset — and no causal language is warranted for the differences between SFA and non-SFA payment terms either.
Third, the analysis inherits the boundaries and uncertainties documented in Table 6: F can rest on financier-supplied information, cash can be restricted or sit in different jurisdictions, and total trade payables need not exactly match the invoice population in a programme note, as this revision confirms directly for Nestlé. Acquisitions and disposals complicate time comparisons specifically for Carlsberg and Unilever. These issues limit economic interpretation even where the extracted numbers themselves are arithmetically correct.
Fourth, the completed source verification is AI-assisted rather than an independent human audit. All five cases were re-extracted from their primary PDF pages in separate passes, and every monetary input and payment-term fact used in the analysis matched the coded dataset, subject to the documented Carlsberg source-version revision and Nestlé’s approximation caveat. The procedure did not include independent human double coding or an inter-coder reliability estimate. The supplemental verification register makes the comparison reviewable, but no verification procedure eliminates every interpretive error, which is why the case design leans on directly observable values, explicit denominators and sensitivity calculations.
Finally, the scenarios in Section 4.5 and Appendix B are deliberately conditional, and, as Table 3 makes clear, mechanically tied to the F/C ratio already reported in Section 4.1 rather than an independent check on it. They are not calibrated to legal acceleration provisions, behavioural probabilities or simultaneous funding shocks. A follow-up study could combine public disclosures with contract-level information or treasury interviews, separating immediate settlement changes from future procurement effects along the lines Kouvelis and Xu (2021) model theoretically. A larger firm panel could also look at programme use, market pricing and disclosure quality separately, in the spirit of Wetzel and Wagner (2025), while keeping the distinction between A and F established here — and, unlike the ten observations examined here, such a panel could support formal regression analysis, which this design deliberately avoids (Section 3.6).
6. Conclusions
The 2024–2025 reports of five European consumer groups show why supplier finance analysis has to separate arrangement coverage from amounts already paid to suppliers, and why that separation is empirical rather than just a restatement of the identity linking them (equations 2 and 3; Table 3). The financed share varies materially across the cases, and changing the numerator reverses a comparative ordering based on trade payables. Payment-term ranges can also hide differences that only become visible through weighted averages or monetary buckets, and a systematic comparability check — fully re-verified against the primary-source pages in this revision — shows that at least one of the five ratios compares numerators and denominators drawn from differently sized accounting populations.
So the new disclosures do carry practical analytical value, but they do not remove the need for accounting and financial judgement. Closing balances do not establish annual cash-flow effects. Cash-scaled exposure does not establish a liquidity shortfall. A supplier being paid early does not, by itself, establish a borrowing classification or an accelerated obligation for the buyer.
A defensible analysis moves from the reported perimeter to payment status and comparability, then to payment-term distribution and contractual consequences — not from a single composite score. The accompanying data and calculations show how that sequence can be carried out with public information alone, and the completed source-verification register makes the primary-source checks reviewable. The conclusions concern these five selected cases and the measurement problems they illustrate; they do not estimate population risk or claim to demonstrate that the amendments caused any particular effect.
Supplementary Materials
The following supporting information can be downloaded at the website of this paper posted on Preprints.org, File S1: data.json — extracted monetary inputs (A, F, TP, C), Nestlé payment-term bucket amounts, and data-boundary notes; File S2: source_register.json — official report URLs, note identifiers and printed/PDF page locations; File S3: source_sha256.json — checksums of the retrieved source reports; File S4: verification_register.json and verification_register.csv — source-page, value and cross-vintage results from the independent re-extraction; File S5: source_verification.md — readable verification summary and page map; File S6: verify_source_reextraction.py and verification_results.json — com-parison script and its output; File S7: analyze.py and results.json — calculation script and un-rounded results; File S8: plot.py and figure1.png — figure-generation script and the resulting image, reproduced as Figure 1 in the main text; File S9: codebook.md — variable definitions, payment-term facts and scenario rules. The independently recovered Nestlé total trade-and-other-payables figures used in Table 6 (Section 4.2) are included in data.json and the verification register. The underlying corporate reports remain available from the rights holders at the links in Appendix A and the References.
Author Contributions
Conceptualization, R.K.-H., R.P. and M.V.; methodology, R.K.-H.; software, M.V.; validation, R.P.; formal analysis, R.K.-H.; investigation, R.P.; resources, M.V.; data curation, M.V.; writing—original draft preparation, R.K.-H., R.P. and M.V.; writing—review and editing, R.K.-H., R.P. and M.V.; visualization, M.V.; supervision, R.P.; project administration, R.K.-H. and R.P.; funding acquisition, R.K.-H. All authors have read and agreed to the published version of the manuscript.
Funding
This research received no external funding.
Institutional Review Board Statement
Not applicable. The study analyses public corporate reports and does not involve research participants or person-al-level data.
Informed Consent Statement
Not applicable.
Data Availability Statement
The original contributions presented in this study are included in the article. Further inquiries can be directed to the corresponding author. All observations used in the calculations, the code required to reproduce the results, and the completed source-verification register are included in the accompanying supplementary package. Original financial reports are publicly accessible at the corporate URLs listed in Appendix A. No proprietary database or confidential company information is used. The Nestlé total trade-and-other-payables figures reported in Table 6 are included alongside the original observations in data.json.
Acknowledgments
During the preparation of this manuscript, the authors used Claude (Anthropic, web application, accessed September 2026) for technical formatting and adaptation to the journal template, and ChatGPT (OpenAI, web application, accessed September 2026) for language and editorial refinement and for improving the visual presentation of author-prepared figures. The authors re-viewed, verified, and edited all AI-assisted output and take full responsibility for the content of this publication.
Conflicts of Interest
The authors declare no conflicts of interest.
Abbreviations
The following abbreviations are used in this manuscript:
| SFA | supplier finance arrangement |
| SCF | supply chain finance |
| IFRS | International Financial Reporting Standards |
| IAS | International Accounting Standard |
| IASB | International Accounting Standards Board |
| FRC | Financial Reporting Council |
| TP | trade payables |
| C | balance-sheet cash and cash equivalents |
| A | arrangement-covered liabilities |
| F | the paid subset of arrangement liabilities |
Appendix A. Source Register and Data Boundaries
The report locations below identify the consolidated group information used in this study. Printed pages and one-based PDF page positions are distinguished because they differ in several of the reports. Comparative 2024 cash and trade-payables values are taken from the 2025 reports, and both annual reports were kept on hand to compare disclosure formats. All sources were retrieved on 9 September 2026; PDF positions are one-based, and the C and TP columns in the 2025 reports include the 2024 comparatives used in Table 4. Nestlé’s SFA narrative begins one printed page before the tabulated amounts. All report URLs appear in the References and the supplementary source register.
Table A1.
Exact locations of reported inputs.
| Group | 2024 SFA Note | 2025 SFA Note | 2025 Cash and TP |
|---|---|---|---|
| Carlsberg | Section 1.3; printed 121; PDF 122 | Section 1.4; printed 112; PDF 112 | C: printed 103, PDF 103. TP: printed 103, PDF 103. |
| Haleon | Note 18; printed 144; PDF 146 | Note 18; printed 144; PDF 146 | C: printed 123, PDF 125. TP: printed 143, PDF 145. |
| Heineken | Note 7.3; printed 97; PDF 97 | Note 7.3; printed 100; PDF 100 | C: printed 85, PDF 85. TP: printed 100, PDF 100. |
| Nestlé | Note 7.2; printed 105; PDF 31 | Note 7.2; printed 107; PDF 33 | C: printed 82, PDF 8. TP: printed 107, PDF 33. |
| Unilever | Note 14; printed 168; PDF 171 | Note 14; printed 160; PDF 163 | C: printed 131, PDF 134. TP: printed 160, PDF 163. |
The data file records original currency units. Nestlé’s reported paid subset is approximate, and Carlsberg’s 2024 TP follows the revised comparative, as explained in Section 3.1 and Table 6. The terms in Table 7 are contractual invoice terms, not overdue balances or estimates of days payable outstanding, and no credit-limit amounts, purchased customer receivables or undisclosed observations were inserted into A or F anywhere. All A, F, TP and C values, and all payment-term facts, for the five cases were separately re-extracted from primary-source pages during this revision; verification_register.json reports the source pages and comparison results. The Nestlé total trade and other payables figures used in Table 6 — CHF 21,807 million in 2024, CHF 20,023 million in 2025 — were recovered during the Nestlé pass and are included in the revised data.json file.
Appendix B. Conditional Acceleration Scenarios
Table B1 reports the numeric conditional-acceleration scenarios discussed in Section 4.5, showing the assumed early settlement of 25% and 50% of each company’s 2025 paid subset (F), funded out of existing cash. As Section 4.5 explains, the two columns of percentages are exact multiples of each other by construction (Equation (4)) and simply reproduce the F/C ranking already reported in Table 5; the table appears here, in the appendix, as an illustrative scale reference tied to the contractual evidence in Section 4.5, not as an independent finding. Amounts are in millions of the stated currency (source: Equation (4), applied to Table 4). These are assumed early settlements of 25% or 50% of F, funded from existing cash — not actual outflows, and not an automatic consequence of programme withdrawal. With buyer due dates unchanged, the immediate acceleration channel is zero (Section 4.5).
Table B1.
Conditional accelerated-payment scenarios using the 2025 paid subset.
| Group / Unit | 25% of F | 50% of F | 25% of F / C (%) | 50% of F / C (%) |
|---|---|---|---|---|
| Carlsberg / DKK | 673.8 | 1,347.5 | 7.0 | 14.1 |
| Haleon / GBP | 1.5 | 3.0 | 0.1 | 0.2 |
| Heineken / EUR | 242.3 | 484.5 | 5.1 | 10.2 |
| Nestlé / CHF | 1,154.0 | 2,308.0 | 25.2 | 50.4 |
| Unilever / EUR | 516.3 | 1,032.5 | 13.1 | 26.2 |
References
- Beattie, V., McInnes, B., & Fearnley, S. (2004). A methodology for analysing and evaluating narratives in annual reports: A comprehensive descriptive profile and metrics for disclosure quality attributes. Accounting Forum, 28(3), 205–236. [CrossRef]
- Blagoeva, N. (2026). Osnovi na finansite [Fundamentals of finance]. FastPrintBooks.
- Carlsberg A/S. (2025). Annual report 2024. https://www.carlsberggroup.com/media/zzfbaaxn/carlsberg-breweries-group_2024-annual-report.pdf.
- Carlsberg A/S. (2026). Annual report 2025. https://www.carlsberggroup.com/media/1tgf0wsy/carlsberg-group_2025-annual-report.pdf.
- Diageo plc. (2025). Preliminary results, year ended 30 June 2025. https://www.diageo.com/en/news-and-media/press-releases/2025/2025-preliminary-results-year-ended-30-june-2025.
- Dimitrova, P. (2017). Empirical examination of disclosure of information in periodical statements of public companies (Are the good practices of disclosure fulfilled?). New Knowledge Journal of Science, 6(3), 21–31.
- Dimitrova, P. (2024). Teoriya na schetovodstvoto [Accounting theory] (3rd rev. ed.). Academic Publishing House Talent.
- European Commission. (2024). Commission Regulation (EU) 2024/1317 of 15 May 2024 amending Regulation (EU) 2023/1803 as regards International Accounting Standard 7 and International Financial Reporting Standard 7. Official Journal of the European Union, L, 2024/1317, 16 May 2024. https://eur-lex.europa.eu/eli/reg/2024/1317/oj/eng.
- Financial Reporting Council. (2025). Supplier finance arrangement disclosures. In Annual review of corporate reporting 2024/25 (Appendix 2, pp. 45–48). https://www.frc.org.uk/documents/8917/Supplier_finance_arrangement_disclosures.pdf.
- Gelsomino, L. M., Mangiaracina, R., Perego, A., & Tumino, A. (2016). Supply chain finance: A literature review. International Journal of Physical Distribution & Logistics Management, 46(4), 348–366. [CrossRef]
- Gelsomino, L., Paananen, M., Papadopoulos, S., & Elliot, V. (2026). Reverse factoring: Accounting practices in a regulatory vacuum. Accounting Forum, 50(3), 447–480. [CrossRef]
- Georgieva, V. (2015). Schetovodni aspekti na finansiraneto na branshovite organizatsii v agrarniya sektor [Accounting aspects of the financing of branch organisations in the agricultural sector]. Scientific Papers of the Agricultural University – Plovdiv, 59(5), 241–249.
- Haj-Salem, I., & Hussainey, K. (2021). Does risk disclosure matter for trade credit? Journal of Risk and Financial Management, 14(3), 133. [CrossRef]
- Haleon plc. (2025). Annual report and form 20-F 2024. https://www.haleon.com/content/dam/haleon/corporate/documents/investors/oar-2024/haleon-annual-report-and-form-20F-2024.pdf.downloadasset.pdf.
- Haleon plc. (2026). Annual report and form 20-F 2025. https://www.haleon.com/content/dam/haleon/corporate/documents/investors/oar-2025/Annual-Report-and-Form-20-F-2025.pdf.downloadasset.pdf.
- Healy, P. M., & Palepu, K. G. (2001). Information asymmetry, corporate disclosure, and the capital markets: A review of the empirical disclosure literature. Journal of Accounting and Economics, 31(1–3), 405–440. [CrossRef]
- Heineken N.V. (2025). Annual report 2024. https://www.theheinekencompany.com/sites/heineken-corp/files/2025-02/heineken_n_v_annual_report_2024_final_20feb2025.pdf.
- Heineken N.V. (2026). Annual report 2025. https://www.theheinekencompany.com/sites/heineken-corp/files/2026-04/2025_Heineken_NV_Annual_Report_Interactive_100226_FINAL.pdf.
- IFRS Interpretations Committee. (2020). Supply chain financing arrangements—Reverse factoring. IFRIC Update, December 2020. https://www.ifrs.org/news-and-events/updates/ifric/2020/ifric-update-december-2020/.
- International Accounting Standards Board. (2023). Supplier finance arrangements: Amendments to IAS 7 and IFRS 7. IFRS Foundation. https://www.ifrs.org/projects/completed-projects/2023/supplier-finance-arrangements/.
- Ivanova, Z. (2019). Izsledvane na kontragentiya risk v industrialnite predpriyatiya po primera na pivovarniya bransh [Investigation of counterparty risk in industrial enterprises: Evidence from the brewing industry]. Scientific Research Almanac, 27(1), 187–219.
- Klapper, L. (2006). The role of factoring for financing small and medium enterprises. Journal of Banking & Finance, 30(11), 3111–3130. [CrossRef]
- Kouvelis, P., & Xu, F. (2021). A supply chain theory of factoring and reverse factoring. Management Science, 67(10), 6071–6088. [CrossRef]
- Kraft, P. (2015). Rating agency adjustments to GAAP financial statements and their effect on ratings and credit spreads. The Accounting Review, 90(2), 641–674. https://publications.aaahq.org/accounting-review/article/90/2/641/3710/Rating-Agency-Adjustments-to-GAAP-Financial.
- Krasteva-Hristova, R., & Moneva, I. (2026). Digitalization, ESG reporting, and circular economy: Accounting challenges for women-led SMEs. World, 7(6), 91. [CrossRef]
- Lekkakos, S. D., & Serrano, A. (2016). Supply chain finance for small and medium sized enterprises: The case of reverse factoring. International Journal of Physical Distribution & Logistics Management, 46(4), 367–392. [CrossRef]
- Luchkov, K. (2022). Aktualni aspekti na vatreshniya kontrol v nefinansovite predpriyatiya prez prizmata na integriranata ramka za vatreshen kontrol COSO [Current aspects of internal control in non-financial enterprises through the lens of the integrated COSO internal-control framework]. Odit, 4, 1–18.
- Luchkov, K. (2021). Finansov otchet ili integriran otchet [Financial statement or integrated report] [Conference paper]. Academic Publishing House “Tsenov”, 643–648.
- Mihaylov, E., Asenova, M., Georgiev, G., Kanaryan, N., Vatev, Z., Bozhinov, B., Krastev, B., & Linkova, M. (2003). Bankovo obsluzhvane na ikonomicheskite agenti [Banking services for economic agents]. Abagar.
- Moneva, I. (2025). Ramkata na Evropeyskiya sayuz za otchitane na ustoychivostta [The European Union framework for sustainability reporting]. In Stopanskite transformatsii v globalniya svyat: Proceedings of the International Scientific Conference, 20–21 June 2025 (pp. 196–204). Varna Free University “Chernorizets Hrabar”.
- Nestlé S.A. (2025). Financial statements 2024. https://www.nestle.com/sites/default/files/2025-02/2024-financial-statements-en.pdf.
- Nestlé S.A. (2026). Financial statements 2025. https://www.nestle.com/sites/default/files/2026-02/financial-statements-2025-en.pdf.
- Nikolov, E., & Stanev, Y. (2018). Dokladvane na korporativnata sotsialna otgovornost [Corporate social responsibility reporting]. Scientific Research Almanac, 25(2), 257–289.
- Pernod Ricard SA. (2025). FY25 sales and results, financial year ended 30 June 2025. https://www.pernod-ricard.com/sites/default/files/2025-08/Sales%20and%20Results%20FY25.pdf.
- Petersen, M. A., & Rajan, R. G. (1997). Trade credit: Theories and evidence. The Review of Financial Studies, 10(3), 661–691. [CrossRef]
- UK Endorsement Board. (2023). Supplier finance arrangements: Endorsement. https://www.endorsement-board.uk/projects/supplier-finance-arrangements-endorsement/.
- Unilever PLC. (2025). Annual report and accounts 2024. https://www.unilever.com/files/unilever-annual-report-and-accounts-2024.pdf.
- Unilever PLC. (2026). Annual report and accounts 2025. https://www.unilever.com/files/unilever-annual-report-and-accounts-2025.pdf.
- Wetzel, P., & Wagner, S. M. (2025). Supply chain financing theory of the trade payables–performance link. International Journal of Production Research, 63(8), 2806–2830. [CrossRef]
- Wuttke, D. A., Blome, C., & Henke, M. (2013). Focusing the financial flow of supply chains: An empirical investigation of financial supply chain management. International Journal of Production Economics, 145(2), 773–789. [CrossRef]
Figure 1.
Paid supplier-finance liabilities relative to balance-sheet cash in 2024 and 2025. Open circles de-note 2024 and filled diamonds denote 2025; labels show 2025 values. Source: calculations from Table 4. This is an exposure comparison, not a prediction of cash outflows.
Figure 1.
Paid supplier-finance liabilities relative to balance-sheet cash in 2024 and 2025. Open circles de-note 2024 and filled diamonds denote 2025; labels show 2025 values. Source: calculations from Table 4. This is an exposure comparison, not a prediction of cash outflows.
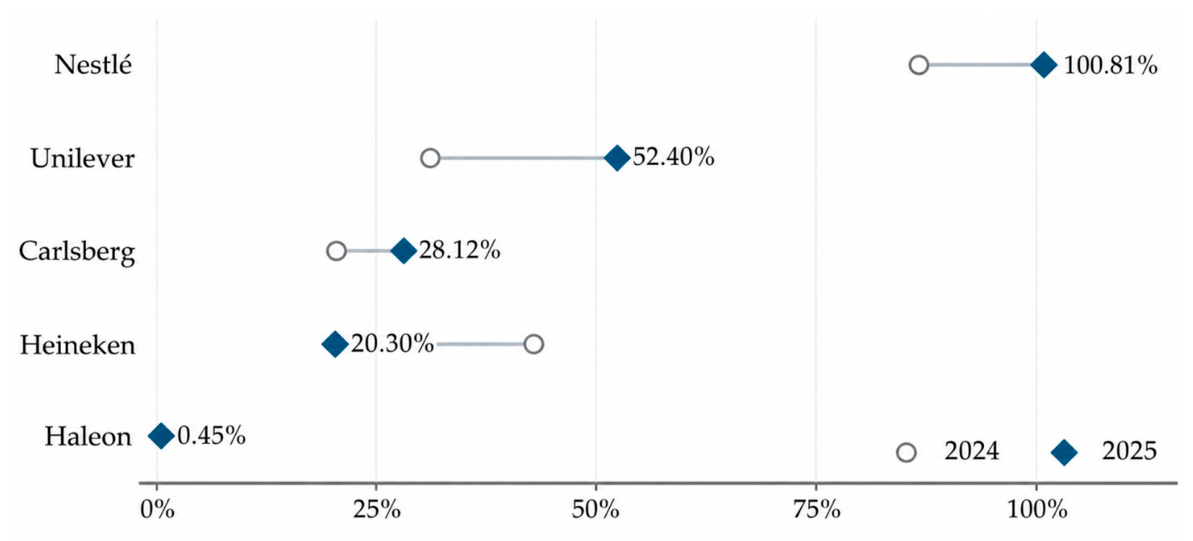
Table 1.
Positioning relative to the closest studies.
| Study | Data / Sample | Method | Key Result | What the Present Study Adds |
|---|---|---|---|---|
| Gelsomino et al. (2026) | 673 firms, 2011–2021; pre-amendment disclosure and reporting practices | Large-sample content analysis of reverse-factoring accounting practice under a regulatory vacuum | Disclosure and reporting behaviour vary with financing needs and external scrutiny, absent a common disclosure requirement | Examines five cases after the amendments took effect, when a common minimum item (A and F) exists, and asks whether the newly comparable figures still yield consistent conclusions once combined with trade payables and cash |
| Financial Reporting Council (2025) | 10 selected UK companies; post-amendment thematic review | Qualitative thematic review of disclosure presence and content | Most companies provided the required disclosures; keyword-based selection cannot identify undisclosed programmes; materiality drives omissions | Moves from documenting disclosure presence to a quantitative, reproducible comparative use of the disclosed figures across accounting boundaries |
| Haj-Salem and Hussainey (2021) | Firm-level sample, pre-amendment period; general risk-disclosure index | Regression of trade-credit measures on a risk-disclosure score | Risk-disclosure extent is positively associated with trade credit obtained from suppliers | Focuses on the post-amendment, item-specific supplier-finance note rather than a general index, and asks a measurement question (which numerator) rather than an association question |
| Kouvelis and Xu (2021) | None; analytical supply-chain model | Game-theoretic model of factoring and reverse factoring | Supplier benefit from reverse factoring is conditional on relative bargaining power and financier pricing, not automatic | Shows, from disclosed figures, that a buyer’s own reporting does not reveal which conditional outcome applies, since paid-financing and payment-term data are reported separately and must be combined by the analyst |
| Wetzel and Wagner (2025) | None; conceptual/theoretical development | Theory linking trade-payables policy, including SCF participation, to firm performance | Proposes mechanisms linking payables extension and financing structure to performance outcomes | Does not test performance; supplies the kind of disclosure-based measurement (separating A, F and payment terms) such a test would need as an input |
1 The comparison is restricted to the closest neighbours in data, period or mechanism; Section 2.1 and Section 2.2 situate the study within the broader literature.
Table 4.
Reported year-end inputs for the five consolidated groups.
| Group | Year | Unit | A | F | TP | C |
|---|---|---|---|---|---|---|
| Carlsberg | 2024 | DKK | 2,642 | 2,364 | 23,295 | 11,542 |
| Carlsberg | 2025 | DKK | 3,171 | 2,695 | 26,877 | 9,585 |
| Haleon | 2024 | GBP | 15 | 8 | 1,973 | 2,250 |
| Haleon | 2025 | GBP | 11 | 6 | 2,058 | 1,324 |
| Heineken | 2024 | EUR | 1,804 | 1,009 | 5,986 | 2,350 |
| Heineken | 2025 | EUR | 1,760 | 969 | 5,830 | 4,773 |
| Nestlé | 2024 | CHF | 6,211 | 4,817 | 16,685 | 5,556 |
| Nestlé | 2025 | CHF | 5,930 | 4,616 | 16,097 | 4,579 |
| Unilever | 2024 | EUR | 2,207 | 1,908 | 10,258 | 6,136 |
| Unilever | 2025 | EUR | 2,665 | 2,065 | 10,994 | 3,941 |
1 Amounts in millions of the indicated currency. A = liabilities covered by arrangements; F = the subset already paid to suppliers; TP = trade payables; C = balance-sheet cash and cash equivalents. Source: Carlsberg A/S (2025, 2026), Haleon plc (2025, 2026), Heineken N.V. (2025, 2026), Nestlé S.A. (2025, 2026) and Unilever PLC (2025, 2026); Appendix A gives locations. Carlsberg 2024 TP is the revised comparative; Nestlé F is approximate. No cross-currency totals are computed.
Table 9.
Changes in reported balances and cash-scaled exposure from 2024 to 2025.
| Group | ΔA (%) | ΔF (%) | ΔC (%) | ΔL (pp) |
|---|---|---|---|---|
| Carlsberg | 20.0 | 14.0 | −17.0 | 7.6 |
| Haleon | −26.7 | −25.0 | −41.2 | 0.1 |
| Heineken | −2.4 | −4.0 | 103.1 | −22.6 |
| Nestlé | −4.5 | −4.2 | −17.6 | 14.1 |
| Unilever | 20.8 | 8.2 | −35.8 | 21.3 |
Disclaimer/Publisher’s Note: The statements, opinions and data contained in all publications are solely those of the individual author(s) and contributor(s) and not of MDPI and/or the editor(s). MDPI and/or the editor(s) disclaim responsibility for any injury to people or property resulting from any ideas, methods, instructions or products referred to in the content. |
© 2026 by the authors. Licensee MDPI, Basel, Switzerland. This article is an open access article distributed under the terms and conditions of the Creative Commons Attribution (CC BY) license (http://creativecommons.org/licenses/by/4.0/).
Copyright: This open access article is published under a Creative Commons CC BY 4.0 license, which permit the free download, distribution, and reuse, provided that the author and preprint are cited in any reuse.