

Submitted:
24 September 2026
Posted:
28 September 2026
You are already at the latest version
Abstract
Personal healthcare expenditure in the United States exhibits substantial heterogeneity driven by non-modifiable demographic factors, modifiable behavioral risks, and regional pricing dynamics. Disentangling the marginal contributions of these overlapping parameters requires multivariable statistical adjustment to inform health economics and payor reimbursement structures. We analyzed an open-access individual-level health insurance claims cohort (n = 1,338). Bivariate explorations were conducted using scatterplots and boxplots across six explanatory covariates: age, body mass index (BMI), number of dependent children, tobacco smoking status, biological sex, and geographic region. To adjust for confounding, we specified an Ordinary Least Squares (OLS) multivariate linear regression model parameterizing individual annual medical charges as a continuous outcome. Geometric dual-plane dynamic surface modeling was constructed to illustrate the non-additive shifts induced by behavioral risk markers. The mean annual healthcare claim was $ 13,270. The OLS regression model demonstrated high explanatory power (R² = 0.751, adjusted R² = 0.749, p < 0.001). Tobacco smoking emerged as the primary contributor to personal health expenditure, accounting for an adjusted mean increase of $ 23,849 (95% CI: $ 23,038 to $ 24,659, p < 0.001) relative to non-smokers. Age (β = $ 257 per year, p < 0.001), BMI (β = $ 339 per kg/m², p < 0.001), and dependent children (β = $ 476 per child, p < 0.001) demonstrated significant positive linear trajectories. Biological sex exhibited no statistically significant association with charges (β = -$ 131 for males, p = 0.693). Regional variation was minor relative to behavioral factors. Behavioral modification, specifically tobacco smoking cessation and obesity mitigation, represents the dominant lever for reducing individual medical expenditure burdens. Unadjusted bivariate visualizations obscure true effect sizes, underscoring the vital necessity of multivariable regression frameworks in actuarial risk stratification and health policy planning.
Keywords:
health
; economics
; insurance
; actuarial
; statistics
; smoking
; obesity
; demographics
; reimbursement
; costs
1. Introduction
Personal healthcare expenditure in the United States is characterized by continuous growth and wide individual-level disparity. Broad economic evaluations demonstrate that healthcare expenditures are shaped by a complex interplay of non-modifiable demographic traits (e.g., age and biological sex), modifiable lifestyle parameters (e.g., body mass index (BMI) and tobacco use), and structural or geographic variation. Understanding the distinct marginal contributions of these factors is essential for health insurance payors, actuarial modeling, public health policymakers, and clinical translation strategies targeting cost mitigation.
While bivariate analyses including direct group comparisons or standard scatterplots, provide initial descriptive utility, they are inherently limited by confounding. For instance, tobacco smokers (1,2), may exhibit distinct age distributions or elevated mean BMIs (3,4) relative to non-smokers. Consequently, observed differences in crude, unadjusted expenditure comparisons fail to isolate the independent effect of individual health determinants. Multivariable statistical frameworks are required to control for mutual confounding and isolate the unique coefficient attributable to each risk factor.
In this study, we evaluate an individual-level health insurance cohort (n = 1338) to model the determinants of personal medical reimbursement claims. Using both primary descriptive exploratory plots and an adjusted Ordinary Least Squares (OLS) multivariate linear regression model, we quantify the independent financial burdens imposed by smoking, elevated BMI, aging, and dependency count. Furthermore, we utilize a geometric dual-plane regression surface model to map how behavioral risk profiles elevate baseline expenditure planes across continuous demographic parameters.
2. Methods
Cohort and Variable Definitions
The dataset evaluated in this study comprises 1338 complete individual records extracted from a public health insurance administrative billing repository (5). The primary continuous dependent variable, Yi (charges), represents total annual individual medical claims reimbursement in US dollars ($). The dataset incorporates 6 explanatory variables (Xk):
• Age (X1): Continuous variable measured in years.
• Body Mass Index (BMI) (X2): Continuous variable calculated as weight in kilograms divided by height in meters squared (kg/m2).
• Children (X3): Discrete numerical variable indicating the total number of dependent children covered under the health policy.
• Smoking Status (X4): Categorical binary variable indicating current tobacco smoking status (yes vs. no).
• Sex (X5): Categorical binary variable indicating biological sex (male vs. female).
• Geographic Region (X6): Categorical factor indicating primary US residential region (northeast, northwest, southeast, southwest).
Statistical Modeling
Bivariate descriptive analyses were conducted to examine unadjusted relationships. Scatterplots with continuous smoothing were generated for numerical predictors (age, BMI, and children) against annual charges. Categorical variables (smoking status, sex, and region) were visualized using box-and-whisker plots depicting medians, interquartile ranges (IQR), and empirical outliers.
To account for multivariable confounding, an Ordinary Least Squares (OLS) multiple linear regression model was specified:
Yi = β0 + β1(Age_i) + β2(BMI_i) + β3(Children_i) + β4(Smoker_i) + β5(Sex_i) + Σ γm(Region_m,i) + εi
• Smoking Status: Reference group = nonsmoker (no).
• Biological Sex: Reference group = female.
• Geographic Region: Reference group = northeast.
Model fit was assessed using the coefficient of determination (R2) and adjusted R2. Parameter estimates (β_k), standard errors (SE), 95% confidence intervals (95% CI), and two-sided p-values were calculated. Statistical significance was defined at α = 0.05. Dual 3D regression planes were rendered across Age and BMI axes to visualize behavioral shift vectors.
2. Results
The cohort contained 1338 individuals with a mean annual medical charge of $13,270 (SD = $12,110; range: $1121.87 to $63,770.43). The mean participant age was 39.2 years (SD = 14.0), and mean BMI was 30.7 kg/m2 (SD = 6.1). The sample contained 274 active smokers (20.5%) and 1064 non-smokers (79.5%).
Unadjusted bivariate visualizations revealed distinct baseline patterns (Figure 1). Annual charges demonstrated clear upward trajectories across advancing age and higher BMI tiers. However, charges exhibited substantial variance dispersion with increasing age or BMI, suggesting unadjusted interaction effects.
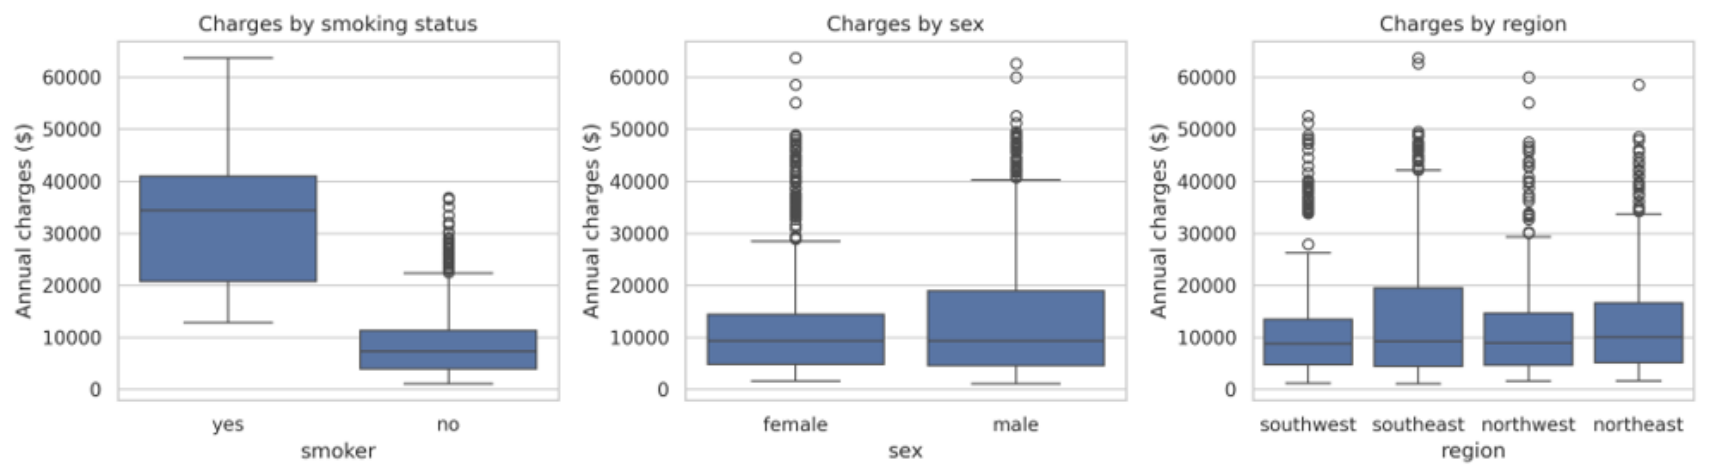
Categorical boxplots indicated that tobacco smoking status produced the most dramatic crude divergence in charge distribution, with smokers exhibiting a markedly elevated median expenditure compared to non-smokers. By contrast, unadjusted comparisons across biological sex and geographic region showed broad interquartile overlap.
Figure 2.
Unadjusted bivariate categorical relationships. Box-and-whisker distributions of annual medical charges stratified by tobacco smoking status (left), biological sex (center), and US geographic region (right). Outliers are depicted as open circles beyond 1.5 × IQR.
Figure 2.
Unadjusted bivariate categorical relationships. Box-and-whisker distributions of annual medical charges stratified by tobacco smoking status (left), biological sex (center), and US geographic region (right). Outliers are depicted as open circles beyond 1.5 × IQR.
The multivariable OLS regression model accounted for 75.1% of total variance in annual healthcare charges (R2 = 0.751, adjusted R2 = 0.749, p < 0.001). Parameter estimates and statistical inferential metrics are detailed in Table 1. After controlling for age, BMI, dependents, sex, and region, tobacco smoking demonstrated the single largest contribution to medical charges. Active smokers incurred an estimated adjusted average premium of $23,849 per year (95% CI: $23,038 to $24,659, p < 0.001) compared to non-smokers (Figure 3).
Continuous parameters showed consistent positive associations:
• Age: Each additional year of age was associated with an incremental increase of $257 per year (95% CI: $234 to $280, p < 0.001).
• BMI: Each 1 kg/m2 unit increase in BMI added $339 per year (95% CI: $283 to $395, p < 0.001).
• Children: Each additional dependent child increased charges by $476 per year (95% CI: $205 to $746, p < 0.001).
Biological sex showed no statistically significant association with annual charges after multivariable adjustment (β = −$131 for males vs. females, p = 0.693). Geographic region exhibited minor effects; compared to the Northeast reference group, residency in the Southeast (β = −$1035, p = 0.031) and Southwest (β = −$960, p = 0.045) was associated with slightly lower baseline charges, whereas Northwest residency showed no significant difference (β = −$353, p = 0.459) (Figure 3).
To conceptualize how behavioral variables modify continuous demographic charge surfaces, we constructed a 3D dual-plane regression space mapping age and BMI against predicted yearly charges, stratified by smoking status (Figure 4). The resulting visualization highlights the substantial vertical separation between the two regression planes. Smoking status introduces a large constant offset (ΔY ≈ +$23,849), elevating the entire expenditure surface across all age and BMI coordinates. Relative magnitude evaluations contextualize this offset against non-behavioral covariates, showing that demographic and regional adjustments induce minor positional shifts relative to tobacco smoking.
3. Discussion
Multivariable modeling of healthcare claims datasets provides crucial insights for health economists, actuarial underwriters, and public health strategists. In this analysis, an OLS regression framework accounted for three-quarters of total claim variance (R2 = 0.751), demonstrating that individual medical expenses are strongly structured by a small panel of demographic and behavioral risk factors.
The primary finding of this investigation is the major financial burden imposed by tobacco smoking. Holding age, BMI, family size, sex, and geographic region constant, active tobacco use adds nearly $24,000 in annual claims expenditure. This finding aligns with clinical literature documenting the broad multi-organ pathology, chronic systemic inflammation, and elevated oncologic and cardiovascular risks associated with chronic smoking.
Continuous non-behavioral determinants, age, BMI, and dependent count, demonstrated statistically significant, linear contributions to overall expenses. The observed age expansion coefficient (≈$257/year) aligns with expected lifetime disease accumulation and chronic illness management burdens in older populations. Similarly, the positive coefficient for BMI (≈$339 per kg/m2) reflects elevated clinical utilization associated with metabolic dysfunction, osteoarthritis, and cardiovascular comorbidities.
Importantly, unadjusted comparisons can mislead policy formulation. While crude visualizations suggested potential variance in charges across biological sexes, multivariable adjustment demonstrated that sex exerts no independent effect on charges (β = −$131, p = 0.693) when accounting for age, smoking status, and BMI. Geographic differences were similarly minor relative to lifestyle choices.
Several limitations should be noted when interpreting these results. First, health insurance charges are intrinsically right-skewed and non-negative, which can violate the homoscedasticity assumption of basic OLS linear regression. Future analyses could employ log-transformed dependent variables or Generalized Linear Models (GLM) with Gamma families and log link functions to better account for heavy-tailed cost distributions. Second, while the additive OLS model provides clear main-effect estimates, evidence suggests that behavioral risk factors interact non-linearly. Specifically, previous studies indicate a strong positive interaction between high BMI and smoking status (BMI × Smoker), where obesity accelerates healthcare costs at a steeper rate among active smokers than among non-smokers. Incorporating explicit multiplicative interaction terms into larger administrative claims cohorts represents a natural extension of this work. Finally, these cross-sectional statistical associations do not directly establish causal mechanisms or guarantee immediate claims reduction following behavioral modification. Unobserved confounding including pre-existing genetic liabilities, environmental exposures, or occupation, remains a factor in observational administrative data.
4. Conclusion
This analysis quantifies the determinants of personal health insurance charges using a multivariable regression framework. Tobacco smoking represents the dominant modifiable driver of annual medical expenditure, inducing an adjusted surcharge of approximately $23,849 per individual annually. Continuous risk factors, including age and BMI, contribute steady incremental increases, whereas biological sex and geographic region play minor roles after adjustment. These findings highlight the importance of targeted smoking cessation and metabolic health programs in managing healthcare expenditure.
References
- Kim, Y. The effects of smoking, alcohol consumption, obesity, and physical inactivity on healthcare costs: A longitudinal cohort study. BMC Public Health 2025, 25, 873. [Google Scholar] [CrossRef]
- Wootton, R.E.; Lawn, R.B.; Millard, A.C.; et al. The causal effect of cigarette smoking on healthcare costs: A Mendelian randomization study. medRxiv 2022. [Google Scholar] [CrossRef]
- Kent, S.; Fusco, F.; Gray, A.; et al. The healthcare costs of increased body mass index—evidence from multivariable and instrumental variable analyses. BMC Health Serv. Res. 2024, 24, 684. [Google Scholar] [CrossRef]
- Cawley, J.; Meyerhoefer, C. The medical care costs of obesity: An instrumental variables approach. J. Health Econ. 2012, 31, 219–230. [Google Scholar] [CrossRef] [PubMed]
- Available online: https://www.kaggle.com/datasets/mirichoi0218/insurance.
Figure 1.
Unadjusted bivariate numerical relationships. Scatterplots illustrating empirical distributions of annual healthcare reimbursement charges relative to individual patient age (left), BMI (center), and total dependent children (right).
Figure 1.
Unadjusted bivariate numerical relationships. Scatterplots illustrating empirical distributions of annual healthcare reimbursement charges relative to individual patient age (left), BMI (center), and total dependent children (right).
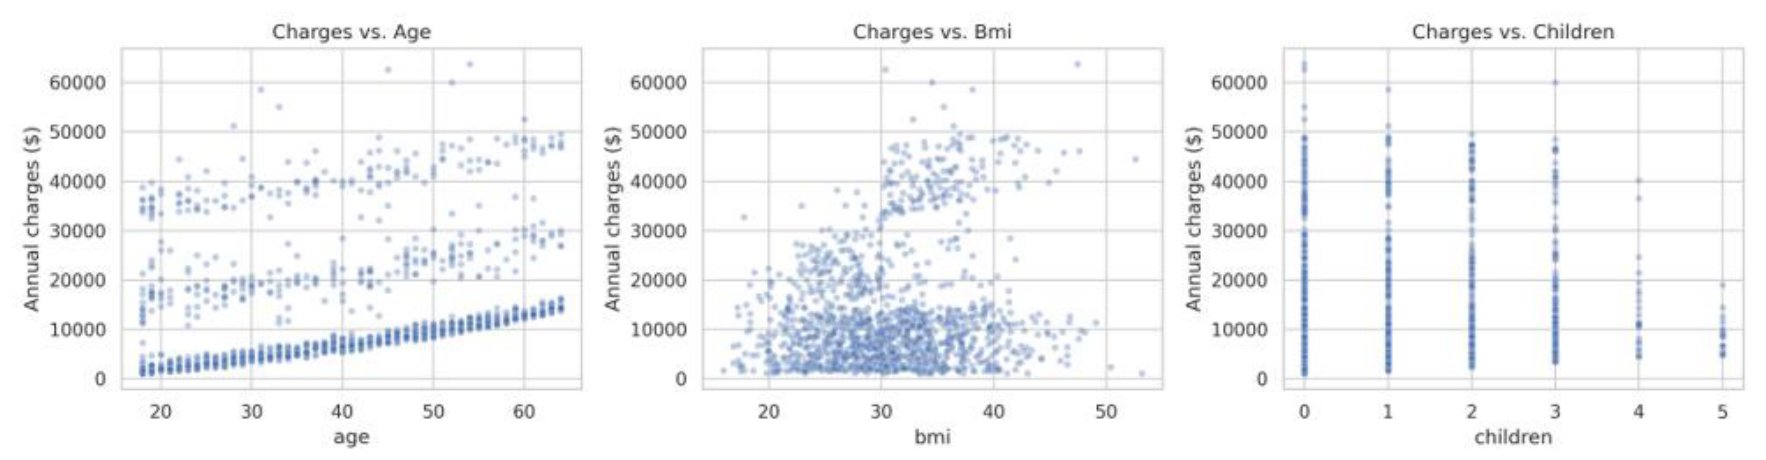
Figure 3.
Adjusted effect sizes from multivariate linear regression. Forest plot depicting point estimates (circles) and 95% confidence intervals (error bars) for changes in annual healthcare reimbursement charges associated with continuous unit increments and categorical comparisons.
Figure 3.
Adjusted effect sizes from multivariate linear regression. Forest plot depicting point estimates (circles) and 95% confidence intervals (error bars) for changes in annual healthcare reimbursement charges associated with continuous unit increments and categorical comparisons.
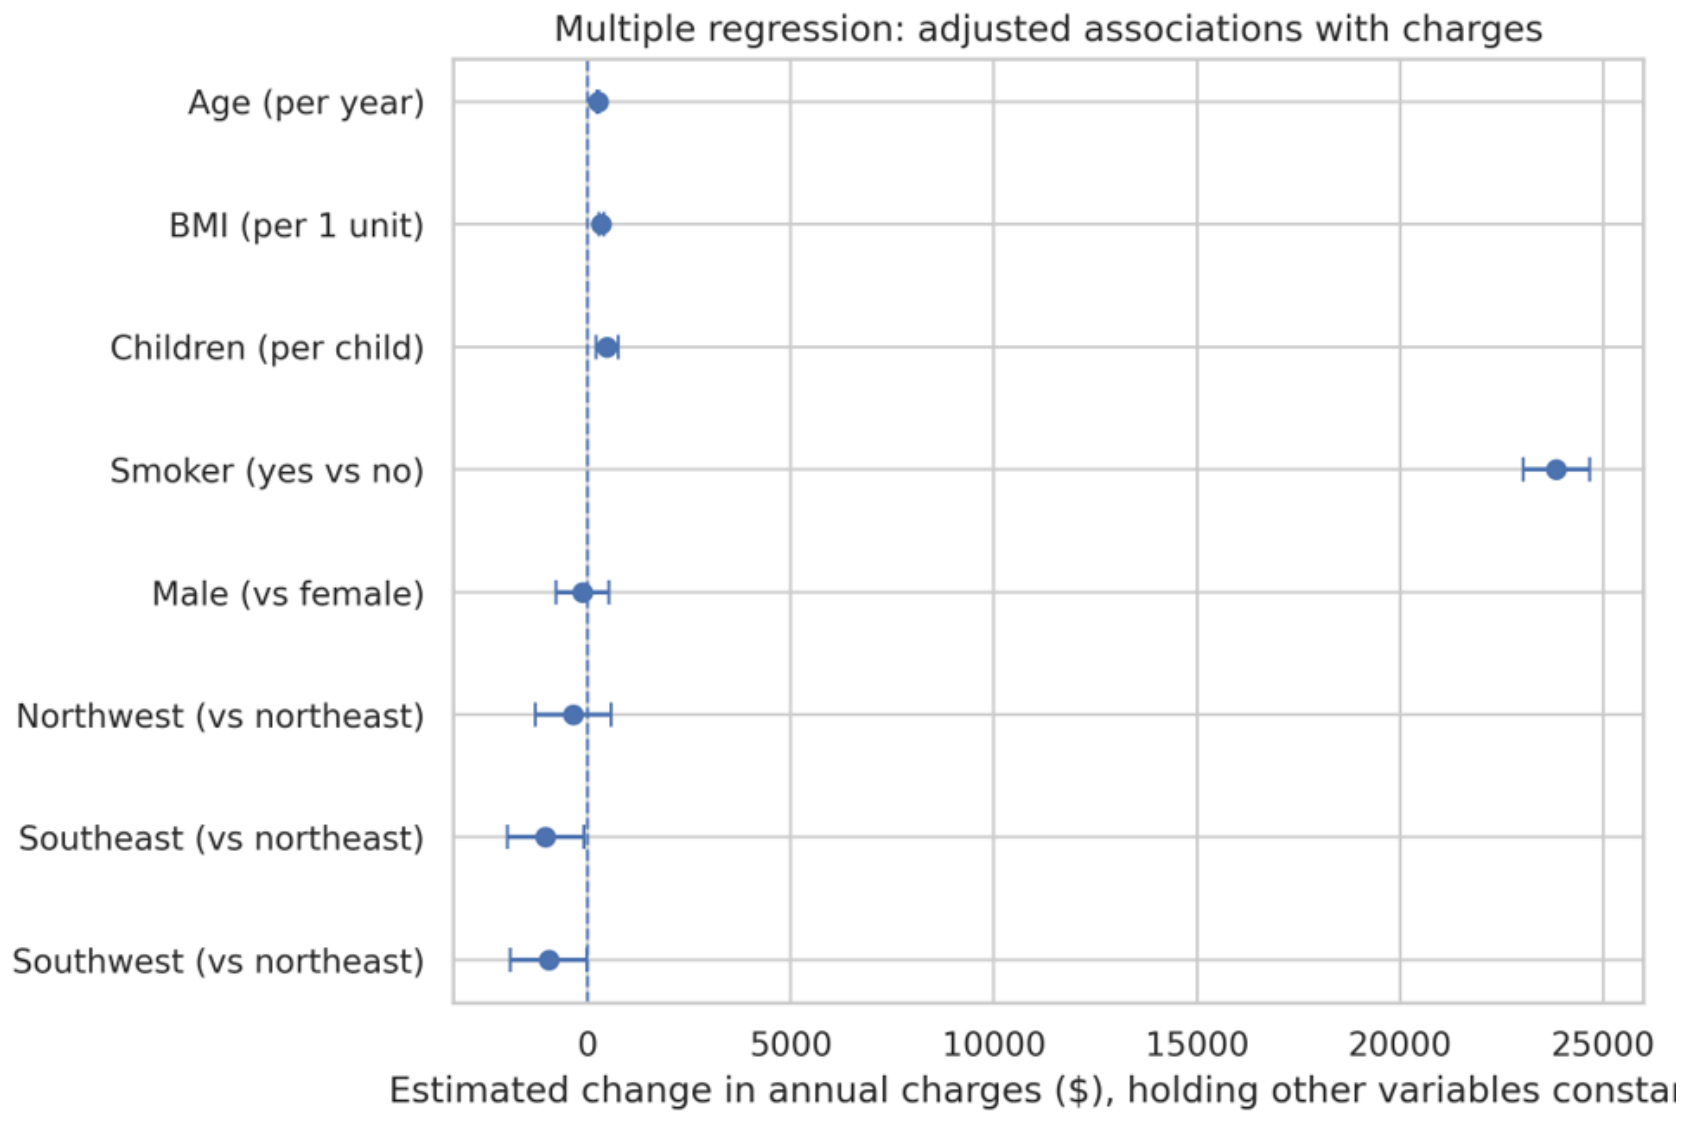
Figure 4.
Geometric dual-plane regression mapping and relative coefficient magnitudes. (A) 3D response surface depicting predicted annual healthcare charges across continuous age (20–60 years) and BMI (20–50 kg/m2) axes, stratified into distinct parallel planes for non-smokers (blue surface) and smokers (orange surface). Values for the omitted variables were children = 0, female, and Northeast. (B) Horizontal vector magnitude plot illustrating the relative displacement of the expenditure plane attributed to smoking status relative to continuous and categorical adjustments.
Figure 4.
Geometric dual-plane regression mapping and relative coefficient magnitudes. (A) 3D response surface depicting predicted annual healthcare charges across continuous age (20–60 years) and BMI (20–50 kg/m2) axes, stratified into distinct parallel planes for non-smokers (blue surface) and smokers (orange surface). Values for the omitted variables were children = 0, female, and Northeast. (B) Horizontal vector magnitude plot illustrating the relative displacement of the expenditure plane attributed to smoking status relative to continuous and categorical adjustments.
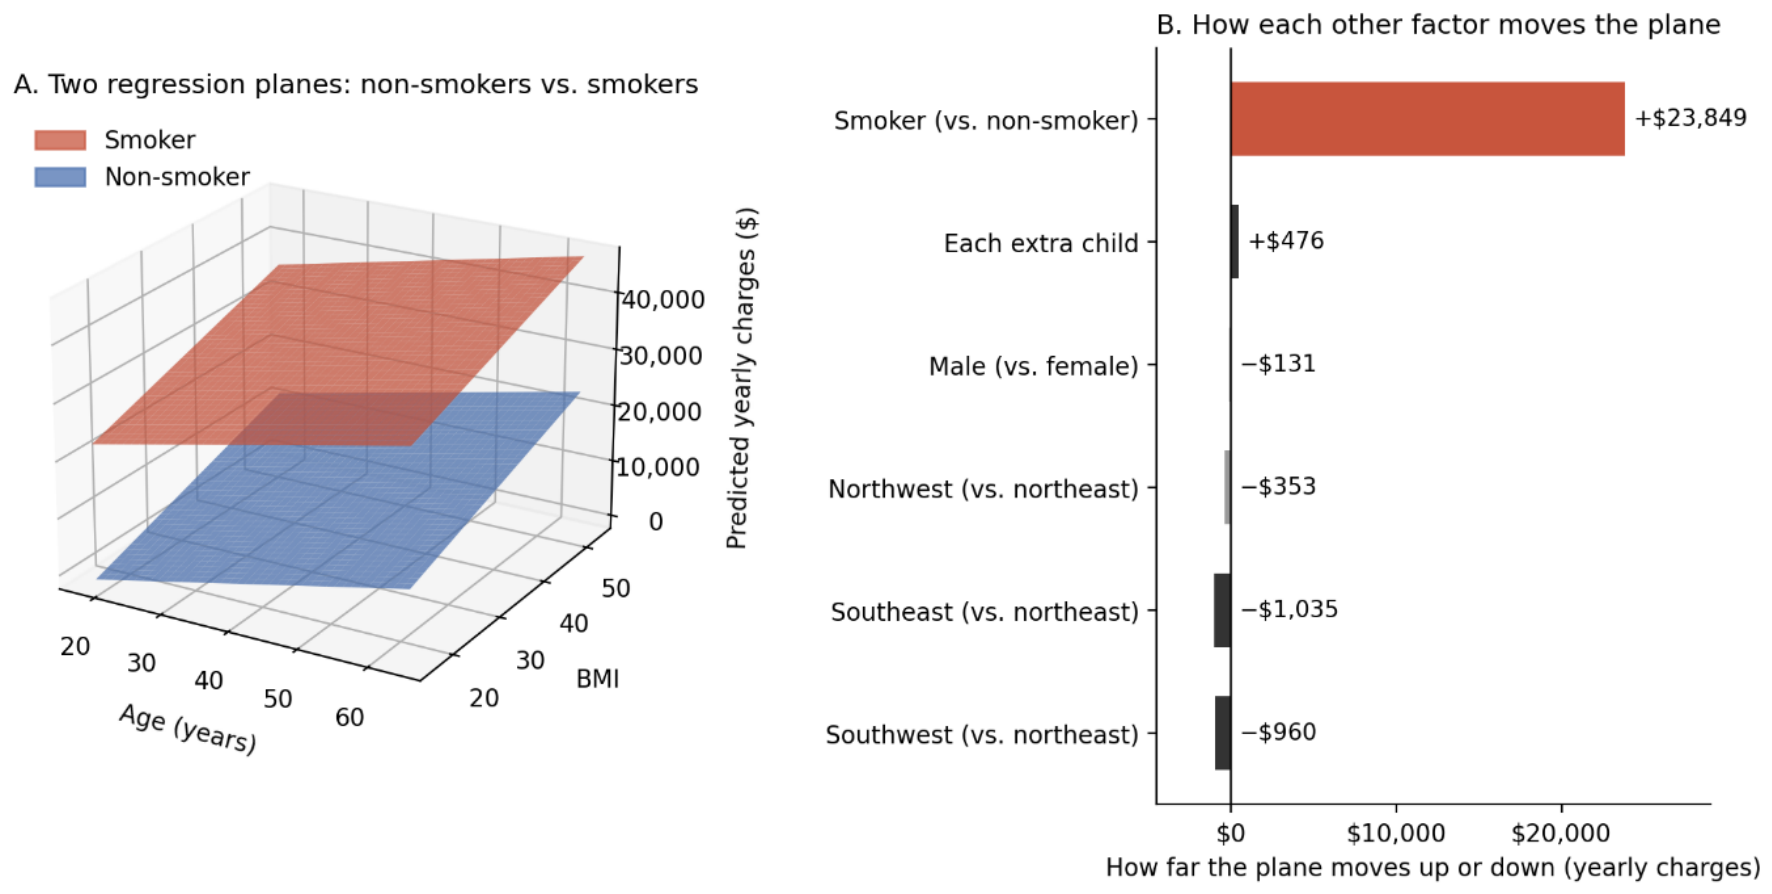

Table 1.
Ordinary Least Squares (OLS) multivariate regression parameter estimates for annual medical charges (N = 1338).
Table 1.
Ordinary Least Squares (OLS) multivariate regression parameter estimates for annual medical charges (N = 1338).
| Predictor Variable | Coefficient Estimate ($) | Standard Error ($) | 95% Confidence Interval ($) | p-Value | Baseline Reference |
|---|---|---|---|---|---|
| Age (per year) | +257 | 12 | +234 to +280 | <0.001 | — |
| BMI (per kg/m2) | +339 | 29 | +283 to +395 | <0.001 | — |
| Children (per dependent) | +476 | 138 | +205 to +746 | <0.001 | — |
| Smoking Status (Yes vs. No) | +23,849 | 413 | +23,038 to +24,659 | <0.001 | Nonsmoker |
| Sex (Male vs. Female) | −131 | 333 | −784 to +522 | 0.693 | Female |
| Region: Northwest | −353 | 476 | −1287 to +581 | 0.459 | Northeast |
| Region: Southeast | −1035 | 479 | −1974 to −96 | 0.031 | Northeast |
| Region: Southwest | −960 | 478 | −1898 to −22 | 0.045 | Northeast |
Note: Model R2 = 0.751, Adjusted R2 = 0.749. The regression intercept (β0 = −$11,815) is excluded as it represents an unphysical extrapolation.
Disclaimer/Publisher’s Note: The statements, opinions and data contained in all publications are solely those of the individual author(s) and contributor(s) and not of MDPI and/or the editor(s). MDPI and/or the editor(s) disclaim responsibility for any injury to people or property resulting from any ideas, methods, instructions or products referred to in the content. |
© 2026 by the authors. Licensee MDPI, Basel, Switzerland. This article is an open access article distributed under the terms and conditions of the Creative Commons Attribution (CC BY) license (http://creativecommons.org/licenses/by/4.0/).
Copyright: This open access article is published under a Creative Commons CC BY 4.0 license, which permit the free download, distribution, and reuse, provided that the author and preprint are cited in any reuse.