

Submitted:
24 September 2026
Posted:
25 September 2026
You are already at the latest version
Abstract
In autosomal dominant polycystic kidney disease (ADPKD), arginine vasopressin (AVP) and copeptin, a marker of AVP secretion, play important roles. This study aimed to investigate the associations between coffee consumption, serum copeptin levels, and echocardiographic parameters in patients with ADPKD. The study included 75 patients with ADPKD. Serum copeptin levels were measured, monthly coffee consumption was recorded in g/month, and transthoracic echocardiography was performed. Copeptin levels were lower in coffee consumers (262.73 vs. 331.28 ng/L; p = 0.009) and were inversely correlated with coffee consumption status (r = −0.329; p = 0.008). After adjustment, the negative association between coffee consumption and copeptin levels remained significant (B = −0.284, β = −0.306; p = 0.030). Mitral annular e′ velocity was higher in coffee consumers (0.92 vs. 0.69 m/s; p = 0.029) and was significantly associated with coffee consumption after adjustment (B = 0.226, β = 0.263; p = 0.033). No significant associations were found with eGFR, left ventricular mass index, ejection fraction, or the E/e′ ratio. Coffee consumption was associated with lower copeptin levels and higher e′ velocity. These findings are hypothesis-generating and do not demonstrate causality, further comparative studies are needed to determine whether these associations are specific to ADPKD.
Keywords:
autosomal dominant polycystic kidney disease
; coffee
; copeptin
; vasopressin
; diastolic function
; echocardiography
; e′ velocity
1. Introduction
Autosomal dominant polycystic kidney disease (ADPKD) is the most common inherited monogenic kidney disease and is characterized by progressive cyst formation, kidney enlargement, and gradual deterioration of renal function [1]. Beyond pathogenic variants in the PKD1 and PKD2 genes, arginine vasopressin (AVP)-mediated signaling plays an important role in disease progression [2]. Activation of the vasopressin V2 receptor stimulates intracellular cyclic adenosine monophosphate (cAMP) signaling, thereby promoting cyst growth and fluid secretion [2,3]. The clinical relevance of this pathway is supported by evidence that V2 receptor antagonism with tolvaptan slows kidney growth and decline in renal function in patients with ADPKD [4].
Because circulating AVP is unstable and technically challenging to measure, direct assessment of AVP activity is difficult. Copeptin, the C-terminal fragment of the AVP precursor peptide, is released in equimolar amounts with AVP and is substantially more stable in the circulation. It is therefore considered a useful surrogate biomarker of endogenous AVP secretion [5]. Circulating copeptin concentrations have been associated with renal outcomes in patients with chronic kidney disease and may provide clinically relevant information on AVP system activity [6]. In ADPKD, the established role of the AVP–V2 receptor–cAMP pathway further supports the potential relevance of copeptin as a measurable marker of AVP activity [2,7]. Indeed, higher copeptin concentrations have been associated with kidney function decline and increases in total kidney volume in patients with ADPKD, further supporting its potential relevance as a biomarker of disease progression [8,9].
Coffee is one of the most widely consumed beverages worldwide. Experimental studies have suggested that caffeine may increase intracellular cAMP accumulation in renal epithelial cells derived from patients with ADPKD, potentially promoting pathways involved in cyst epithelial cell proliferation and fluid secretion [3]. In addition, experimental studies in a Pkd1-deficient mouse model have suggested that caffeine consumption may accelerate cystic kidney disease, although renal cAMP levels did not differ between caffeine-treated and control animals [10]. However, clinical evidence regarding the effects of caffeine consumption on renal disease characteristics in ADPKD remains limited and inconsistent. For example, a study of 102 patients with ADPKD found no significant association between caffeine intake and renal volume [11]. The 2025 KDIGO Clinical Practice Guideline for ADPKD acknowledges that caffeine can accelerate cyst enlargement in experimental models, but caffeine restriction has not been shown to be effective in people with ADPKD. Accordingly, the guideline recommends limiting caffeine intake to less than 400 mg/day, consistent with recommendations for the general population [12]. More recently, an epidemiological and experimental study in the general population reported that higher coffee consumption was associated with lower plasma copeptin concentrations, while an experimental study in healthy volunteers showed a transient reduction in copeptin after consumption of 400 mL of coffee [13]. However, whether a similar association exists in patients with ADPKD has not been established. Despite these findings, the relationship between habitual coffee consumption and serum copeptin, a clinically measurable surrogate marker of AVP activity, remains insufficiently studied in patients with ADPKD. This question may be particularly relevant in ADPKD because the AVP–V2 receptor–cAMP axis is directly implicated in cyst epithelial cell proliferation and fluid secretion, while copeptin provides a stable circulating marker through which AVP system activity can be assessed. Therefore, investigating the relationship between habitual coffee consumption and serum copeptin may help characterize whether coffee intake is associated with a circulating marker of AVP system activity in a disease context in which this pathway has established pathophysiological relevance.
Cardiovascular disease is a major cause of morbidity and mortality in patients with ADPKD [14]. Left ventricular hypertrophy (LVH) is among the most common cardiovascular manifestations and has been associated with hypertension and declining renal function [14,15]. Previous echocardiographic studies have demonstrated structural and functional cardiac abnormalities in patients with ADPKD, including increased left ventricular mass [15,16]. In addition to its established role as a marker of AVP activity, copeptin has also been investigated in relation to cardiovascular stress and cardiac function. In patients with heart failure and preserved ejection fraction, the KaRen study reported that copeptin was positively correlated with E/e′ and negatively correlated with e′ among patients with diastolic dysfunction [17]. Similarly, copeptin concentrations have been reported to be independently associated with E/e′ in patients receiving hemodialysis [18]. These findings suggest that copeptin may be related not only to renal and fluid-regulatory pathways but also to myocardial function and filling hemodynamics [17,18]. However, the relationship between copeptin and echocardiographic measures of diastolic function has not been sufficiently investigated in patients with ADPKD.
Coffee consumption itself has also been investigated in relation to cardiac function. In the CARDIA study, low-to-moderate long-term coffee consumption was associated with a lower E/e′ ratio and some more favorable indices of cardiac function [19]. In contrast, in the Hamburg City Health Study including 9009 participants, different levels of coffee consumption were not significantly associated with any of the investigated echocardiographic parameters after adjustment for cardiovascular risk factors [20]. These inconsistent findings suggest that the relationship between coffee consumption and cardiac function may vary according to the population studied and the echocardiographic parameter evaluated[19,20]. In ADPKD, however, the potential relationships among coffee consumption, copeptin, and echocardiographic cardiac function have not been adequately investigated.
Therefore, the primary objective of this study was to investigate the association between habitual coffee consumption and serum copeptin concentrations in patients with ADPKD. Secondary objectives were to examine the relationships between serum copeptin and echocardiographic parameters and to compare cardiac structural and functional parameters according to coffee consumption status. These secondary analyses were considered exploratory and were intended to generate hypotheses regarding the potential relationships among coffee consumption, AVP system activity, and cardiac function in ADPKD rather than to establish causal relationships.
2. Materials and Methods
Between May 2026 and July 2026, a total of 124 patients with ADPKD registered in the Turkish Society of Nephrology Cystic Kidney Diseases Study Group database and evaluated at the Nephrology Outpatient Clinic of Bağcılar Training and Research Hospital were screened for eligibility. Patients who did not meet the inclusion criteria or fulfilled any predefined exclusion criterion were excluded, resulting in a final study population of 75 patients. Eligible participants were aged 18–75 years and were not receiving renal replacement therapy. Exclusion criteria were active infection, malignancy, rheumatologic disease, previous acute myocardial infarction, moderate or severe valvular heart disease, left ventricular ejection fraction (LVEF) <50%, and pregnancy. All clinical, laboratory, coffee consumption, and echocardiographic assessments were performed during the same study visit, and the analysis was based on cross-sectional data.
The study was conducted in accordance with the principles of the Declaration of Helsinki and was approved by the Clinical Research Ethics Committee of Medipol University Faculty of Medicine Hospital (Decision No. E-10840098-50.04-3293). Written informed consent was obtained from all participants before enrollment.
Venous blood samples were collected after at least 8 h of fasting and centrifuged at 3000 revolutions per minute for 10 min. Serum samples were stored at −80°C until analysis. Biochemical parameters were measured using an automated analyzer (Shenzhen Mindray Bio-Medical Electronics Co., Ltd., Shenzhen, China), hormone parameters were analyzed using an ADVIA 1800 automated analyzer (Siemens Healthineers, Tarrytown, NY, USA), and hematological parameters were assessed using an XN-1000 hematology analyzer (Sysmex Corporation, Kobe, Japan). Serum copeptin concentrations were determined using a commercially available enzyme-linked immunosorbent assay (ELISA) kit (Human Copeptin ELISA, CEA365Hu; Cloud-Clone Corp., Houston, TX, USA) according to the manufacturer's instructions. Spot urine samples were collected during the same visit, and the urinary albumin-to-creatinine ratio (UACR) was calculated. A UACR ≥30 mg/g was considered indicative of albuminuria [21].
Hypertension and diabetes mellitus were defined in accordance with current guidelines from the European Society of Cardiology (ESC) and the American Diabetes Association (ADA), respectively [22,23]. Blood pressure was recorded as the mean of two measurements obtained 15 min apart. Demographic characteristics, clinical information, smoking status, and concomitant medications were recorded during the study visit.
Coffee consumption was assessed using a standardized questionnaire administered during the study visit. Participants reported the frequency and amount of Turkish coffee, filter coffee, and instant coffee consumed [24]. Reported intake was converted to standardized amounts of dry coffee and expressed as grams per month (g/month). Because coffee consumption expressed solely in cups may vary according to cup size and preparation method, we standardized reported intake according to the type of coffee consumed [25]. For the purposes of this study, predefined conversion factors of 7 g of dry coffee per cup of Turkish coffee, 10 g per serving of filter coffee, and 2 g per serving of instant coffee were applied. The amounts consumed for each coffee type were summed to calculate total monthly coffee consumption. The resulting exposure variable was therefore expressed as standardized dry coffee intake (g/month) rather than estimated caffeine intake. As caffeine content varies according to coffee type and preparation method [26,27], the calculated coffee amount was not considered a direct measure of caffeine exposure. Accordingly, total monthly coffee consumption was used as the primary coffee exposure variable.
Transthoracic echocardiography was in accordance with the recommendations of the American Society of Echocardiography and the European Association of Cardiovascular Imaging by the same experienced cardiologist, who was blinded to the participants' clinical and laboratory data [28]. Left ventricular end-diastolic diameter (LVDd), left ventricular end-systolic diameter (LVSd), left ventricular end-diastolic volume (LVEDV), left ventricular end-systolic volume (LVESV), left atrial diameter (LAD), posterior wall thickness (PWT), interventricular septal thickness (IVST), LVEF, fractional shortening (FS), aortic root diameter (Ao), ascending aortic diameter (AscAo), early (e′) and late (a′) diastolic mitral annular velocities, peak transmitral flow velocity (E), tricuspid annular plane systolic excursion (TAPSE), and systolic pulmonary artery pressure (sPAP) were assessed [28,29].
Left ventricular mass (LVM) was calculated using the Devereux formula and indexed to body surface area (BSA) to obtain LVMI. BSA was calculated using the Mosteller formula. Increased LVMI was defined according to the sex-specific upper reference limits recommended by the American Society of Echocardiography (>115 g/m² in men and >95 g/m² in women) [28]. Participants were subsequently classified into groups with normal or increased LVMI.
Estimated glomerular filtration rate (eGFR) was calculated using the 2021 Chronic Kidney Disease Epidemiology Collaboration (CKD-EPI) creatinine equation, which does not include a race coefficient [30].
Statistical Analysis
Statistical analyses were performed using IBM SPSS Statistics for Windows, version 31.0 (IBM Corp., Armonk, NY, USA). Categorical variables were presented as numbers (n) and percentages (%), whereas continuous variables were presented as mean ± standard deviation and median (minimum–maximum). The normality of continuous variables was assessed using skewness and kurtosis coefficients. For the present sample size, absolute z-scores of skewness and kurtosis less than 3.29 were considered compatible with an approximately normal distribution [31]. The independent-samples t-test was used to compare normally distributed continuous variables between the two groups, whereas the Mann–Whitney U test was used for non-normally distributed variables. Pearson's chi-square test or Fisher's exact test was used for categorical variables. Effect sizes were calculated and expressed as Cohen's d for the independent-samples t-test and r = |Z|/√N for the Mann–Whitney U test.
Associations between coffee consumption status and clinical, laboratory, and echocardiographic variables were assessed using Spearman's correlation analysis. Correlations involving coffee consumption status were evaluated in the entire study population, whereas correlations involving monthly coffee consumption were assessed only among coffee consumers. Because serum copeptin levels showed a skewed distribution, a natural logarithmic transformation was applied before multivariable linear regression analysis. Coffee consumption status was included as the primary independent variable in the multivariable linear regression model for log-transformed serum copeptin levels, together with age, sex, smoking status, total daily fluid intake, and eGFR.
Separate multivariable linear regression models were also constructed with mitral annular e′ velocity and the mitral E/e′ ratio as dependent variables. Both models included age, sex, smoking status, hypertension, and eGFR as covariates.
All independent variables were entered simultaneously into the regression models using the Enter method. All statistical tests were two-sided, and p< 0.05 was considered statistically significant. Multiple secondary comparisons were considered exploratory, and unadjusted p values were reported.
3. Results
The demographic, clinical, lifestyle, and anthropometric characteristics of the study population according to coffee consumption status are presented in Table 1. A total of 75 patients with ADPKD were included, of whom 39 (52.0%) were non-coffee consumers and 36 (48.0%) were coffee consumers. The mean age of the study population was 48.00 ± 15.66 years. Overall, 43 patients (57.3%) were female, 13 (17.3%) had diabetes mellitus, 40 (53.3%) had hypertension, and 30 (40.0%) were smokers. No statistically significant differences were observed between coffee consumers and non-coffee consumers in terms of sex, age, diabetes mellitus, hypertension, disease duration, follow-up duration, total daily fluid intake, blood pressure, body mass index, height, body weight, total body water, or body surface area (all p> 0.05). Smoking was more frequent among coffee consumers than non-coffee consumers (55.6% vs. 25.6%, p = 0.008), and cumulative smoking exposure was also higher in coffee consumers (18.62 ± 14.88 vs. 9.70 ± 8.68 pack-years, p = 0.045). Among coffee consumers, the mean monthly coffee consumption was 119.17 ± 132.95 g, with a median of 55 g/month (range, 10–540 g/month).
The serum copeptin level and other laboratory parameters according to coffee consumption status are presented in Table 2. Serum copeptin levels were significantly lower in coffee consumers than in non-coffee consumers (median: 262.73 vs. 331.28 ng/L, p = 0.009; r = 0.330). As shown in Figure 1, serum copeptin levels were higher among non-coffee consumers.
No significant differences were observed between the groups in glucose, urea, creatinine, eGFR, uric acid, calcium, sodium, potassium, phosphate, parathyroid hormone, leukocyte count, hemoglobin, hematocrit, or spot urine albumin-to-creatinine ratio (all p > 0.05). Platelet counts tended to be lower among coffee consumers (232.16 ± 56.97 vs. 258.32 ± 57.24 × 10³/µL), although the difference was not statistically significant (p = 0.053; d = 0.458). Overall, no statistically significant between-group differences were observed for the laboratory parameters assessed, except for serum copeptin levels, which were lower among coffee consumers.
As shown in Figure 1, the distribution of serum copeptin levels was higher in non-coffee consumers.
Echocardiographic parameters according to coffee consumption status are presented in Table 3. Mitral annular early diastolic tissue velocity (e′) was significantly higher in coffee consumers than in non-consumers (0.92 ± 0.41 vs. 0.69 ± 0.43 m/s, p = 0.029; Cohen’s d = −0.53), corresponding to a moderate effect size. No statistically significant differences were observed between the groups in other cardiac structural measurements, other left ventricular systolic or diastolic function parameters, valvular or flow parameters, pulmonary artery pressure, left ventricular mass, or LVMI(all p> 0.05). The prevalence of mitral, aortic, and tricuspid regurgitation and increased LVMI also did not differ significantly between the groups (all p> 0.05). Selected cardiac functional and hemodynamic parameters are illustrated in Figure 2.
Figure 2 illustrates the distributions of selected cardiac functional and hemodynamic parameters according to coffee consumption status.
Correlation analyses were performed to further evaluate the relationships between coffee consumption and selected clinical, biochemical, and echocardiographic variables (Table 4). Coffee consumption status was positively correlated with smoking status (r = 0.305, p = 0.008) and mitral annular early diastolic tissue velocity (e′) (r = 0.304, p = 0.010), whereas inverse correlations were observed with serum copeptin levels (r = −0.329, p = 0.008) and the E/e′ ratio (r = −0.283, p = 0.020).
Among coffee consumers, monthly coffee consumption was positively correlated with smoking status (r = 0.409, p = 0.013), mitral regurgitation (r = 0.476, p = 0.003), age (r = 0.404, p = 0.015), follow-up duration (r = 0.446, p = 0.006), and serum copeptin levels (r = 0.440, p = 0.009). No significant correlations were observed between monthly coffee consumption and e′ (r = 0.021, p = 0.906) or the E/e′ ratio (r = −0.031, p = 0.866).
Given the skewed distribution of serum copeptin levels, a natural logarithmic transformation was applied before regression analysis. A multivariable linear regression model adjusted for age, sex, smoking status, total daily fluid intake, and eGFR was constructed to assess the association between coffee consumption and ln(copeptin) levels (Table 5). The analysis included 64 participants with complete data for all variables entered into the model. The model explained 15.6% of the variance in ln(copeptin) (R = 0.395, R² = 0.156, adjusted R² = 0.067), although the overall regression model was not statistically significant [F(6,57) = 1.754, p = 0.125].
After adjustment for potential confounders, coffee consumption remained negatively associated with ln(copeptin) levels (B = −0.284, β = −0.306, 95% CI: −0.539 to −0.029, p = 0.030). Exponentiation of the regression coefficient indicated that coffee consumption was associated with an approximately 24.7% lower adjusted serum copeptin level compared with no coffee consumption (adjusted geometric mean ratio = 0.753, 95% CI: 0.583–0.971). Age, sex, smoking status, total daily fluid intake, and eGFR were not independently associated with ln(copeptin) levels (all p > 0.05). Tolerance values ranged from 0.496 to 0.870 and VIF values from 1.149 to 2.014, indicating no important multicollinearity among the predictors. Given the lack of overall model significance and its limited explanatory capacity, the observed adjusted association between coffee consumption and serum copeptin should be interpreted cautiously rather than as definitive evidence of an independent effect.
Model summary: R = 0.395; R² = 0.156; adjusted R² = 0.067; F(6,57) = 1.754; p = 0.125; standard error of the estimate = 0.451. The model included 64 participants with complete data. Dependent variable: Natural log-transformed serum copeptin level [LN(copeptin)]. ¹ Sex: 0 = male, 1 = female. ² Coffee consumption: 0 = no consumption, 1 = consumption. ³ Smoking status: 0 = no, 1 = yes. Note: Data are presented as unstandardized regression coefficients (B), standard errors (SE), standardized regression coefficients (β), t-statistics, corresponding p-values, 95% confidence intervals (CI) for B, tolerance, and variance inflation factor (VIF). The multivariable linear regression model was adjusted for age, sex, coffee consumption, smoking status, total daily fluid intake, and eGFR. A natural logarithmic transformation was applied to serum copeptin levels because of their skewed distribution. Tolerance values >0.20 and VIF values <5 were considered indicative of no important multicollinearity. p< 0.05 was considered statistically significant.
In the multivariable model for mitral annular early diastolic tissue velocity (e′), the overall regression model was statistically significant (R² = 0.196, adjusted R² = 0.121, p = 0.026) and included 71 participants with complete data. After adjustment for age, sex, smoking status, hypertension, and eGFR, coffee consumption was independently associated with higher e′ velocity (B = 0.226, β = 0.263, 95% CI: 0.019–0.434, p = 0.033), whereas increasing age was independently associated with lower e′ velocity (B = −0.008, β = −0.294, 95% CI: −0.016–0.000, p = 0.048). Sex, smoking status, hypertension, and eGFR were not independently associated with e′ velocity (all p > 0.05).
The multivariable regression model for the mitral E/e′ ratio was not statistically significant (R² = 0.101, adjusted R² = 0.011, p = 0.361) and included 67 participants with complete data. Coffee consumption was associated with a lower E/e′ ratio, but this association did not reach statistical significance after adjustment (B = −1.664, β = −0.184, 95% CI: −4.045 to 0.718, p = 0.167). None of the other variables included in the model showed a statistically significant independent association with the E/e′ ratio (all p > 0.05). Across both models, tolerance values ranged from 0.587 to 0.867 and VIF values from 1.154 to 1.703, indicating no important multicollinearity (Table 6).
Model summaries: Mitral annular e′ velocity model: R = 0.443, R² = 0.196, adjusted R² = 0.121, F(6,64) = 2.603, p = 0.026. The e′ model included 71 participants with complete data. Mitral E/e′ ratio model: R = 0.317, R² = 0.101, adjusted R² = 0.011, F(6,60) = 1.121, p = 0.361. The E/e′ model included 67 participants with complete data.
4. Discussion
In this study, we evaluated the relationships between coffee consumption, serum copeptin levels, and cardiac parameters in patients with autosomal dominant polycystic kidney disease (ADPKD). Coffee consumers had significantly lower serum copeptin levels and higher mitral annular early diastolic tissue velocity (e′) than non-consumers. The association between coffee consumption and e′ remained statistically significant after multivariable adjustment, whereas no significant associations were observed with E/e′, left ventricular mass index (LVMI), left ventricular ejection fraction (LVEF), or other major echocardiographic parameters. Renal function parameters, including serum creatinine, eGFR, and urinary albumin-to-creatinine ratio, were comparable between coffee consumers and non-consumers. Smoking was more common among coffee consumers, and cumulative smoking exposure was also higher in this group. In addition, coffee consumption was inversely correlated with serum copeptin levels, whereas monthly coffee consumption was positively correlated with copeptin among coffee consumers. Taken together, these findings suggest that coffee consumption was associated with lower circulating copeptin levels and higher e′ velocity in this ADPKD cohort, while no consistent association was observed with other cardiac or renal parameters. Given the cross-sectional design, these findings should be interpreted as observational and hypothesis-generating rather than as evidence of a causal or therapeutic effect of coffee consumption.
In our study, serum copeptin levels were significantly lower in coffee-consuming patients with ADPKD than in non-consumers, suggesting a possible relationship between coffee consumption and the vasopressin system. This finding is consistent with the results recently reported by Schill et al. [13] in an epidemiological analysis of 3,270 participants from the Malmö Offspring Study, higher coffee consumption was associated with lower plasma copeptin concentrations, and this association remained significant after adjustment for total fluid intake and other potential confounding factors. In the experimental component of the same study, copeptin concentrations decreased significantly from 30 minutes after consumption of 400 mL of coffee, with the greatest reduction of approximately 27% observed at 150 minutes [13]. Notably, water consumption also produced a more modest reduction in copeptin concentrations, suggesting that the observed effect may not be attributable exclusively to caffeine [13]. In our study, caffeine intake was not directly quantified; therefore, the lower copeptin concentrations could not be specifically attributed to caffeine, other coffee components, or differences in fluid intake. Importantly, the positive correlation between monthly coffee consumption and serum copeptin levels among coffee consumers (r = 0.440, p = 0.009) does not support a simple linear dose–response relationship. This finding should be interpreted cautiously given the small number of coffee consumers (n = 36) and the observed differences in smoking exposure. Moreover, the higher prevalence and cumulative exposure to smoking among coffee consumers may represent an additional source of residual confounding, despite adjustment for smoking in the multivariable model. Overall, these findings support an association between coffee consumption and circulating copeptin concentrations but do not establish a causal or dose-dependent relationship.
The potential importance of copeptin in ADPKD is closely related to the established role of the vasopressin system in disease progression. Copeptin is released in equimolar amounts with arginine vasopressin (AVP) and, because of its greater stability in the circulation, is widely used as a surrogate marker of AVP secretion [5]. AVP activates the V2 receptor and increases intracellular cAMP signaling, thereby promoting cyst growth and fluid secretion in ADPKD [32]. Pharmacological inhibition of this pathway with the V2-receptor antagonist tolvaptan has been shown to slow kidney enlargement and loss of renal function [4]. Clinical studies have also associated higher copeptin concentrations with kidney enlargement and renal function decline in ADPKD [8,9,33]. Therefore, the lower copeptin concentrations observed among coffee consumers in our study are noteworthy in the context of a biomarker that has been associated with ADPKD progression. However, total kidney volume and longitudinal renal outcomes were not assessed in our study. Accordingly, lower copeptin concentrations cannot be interpreted as evidence of slower ADPKD progression or as an indication that coffee consumption has a protective effect on disease progression. Rather, the finding raises the possibility that coffee consumption may be associated with modulation of the vasopressin–copeptin axis in ADPKD, although the clinical relevance of this association remains uncertain. Importantly, because previous studies of coffee and copeptin have primarily been conducted in non-ADPKD populations, our findings should not be interpreted as evidence that this association is specific to ADPKD. Instead, the relevance of the finding to ADPKD may relate to the established pathophysiological importance of the vasopressin–V2 receptor–cAMP pathway in this disease.
Clinical evidence regarding the effects of coffee and caffeine consumption on renal outcomes in ADPKD has not demonstrated a consistent adverse effect on kidney function. Vendramini et al. found no significant association between caffeine consumption and renal volume or eGFR [11]. Similarly, Girardat-Rotar et al. reported no significant association between coffee consumption and height-adjusted total kidney volume (htTKV) or eGFR in a prospective longitudinal ADPKD cohort [34]. In a longer-term analysis of the CRISP cohort, caffeine consumption was associated with an approximately 0.6% annual increase in htTKV growth, but no significant associations were observed with measured GFR, end-stage kidney disease, or mortality [35]. Consistent with these previous human studies, we found no significant association between coffee consumption and eGFR, and renal function did not differ significantly between coffee consumers and non-consumers [11,34,35]. These findings do not support a clear cross-sectional relationship between coffee consumption and renal function in our cohort. However, given the relatively limited sample size and cross-sectional design, our findings cannot exclude either beneficial or adverse long-term renal effects of coffee or caffeine consumption.
In our study, coffee-consuming patients with ADPKD had higher e′ velocities than non-consumers, suggesting a possible association between coffee consumption and early diastolic myocardial relaxation. In a study evaluating the acute effects of 100 mg of caffeine in healthy individuals, caffeine alone did not significantly alter ventricular long-axis function, whereas smoking was associated with acute changes in ventricular diastolic function [36]. In contrast, the CARDIA study, which examined long-term coffee consumption, reported associations between low-to-moderate coffee consumption and more favorable indices of diastolic function, including lower E/e′ [19]. Similarly, in a large population-based study of 9009 participants from the Hamburg City Health Study, different levels of coffee consumption were not significantly associated with any of the investigated echocardiographic parameters after adjustment for cardiovascular risk factors [20]. These findings suggest that the relationship between coffee consumption and cardiac function has not been consistent across general populations and may vary according to the population studied and the echocardiographic parameter evaluated [19,20]. Although previous studies have demonstrated abnormalities in diastolic function among patients with ADPKD, direct evidence regarding the relationship between coffee consumption and tissue Doppler-derived e′ in this population is lacking [14,15,16]. To our knowledge, no previous study has directly examined the association between coffee consumption and e′ in patients with ADPKD. Although the underlying mechanism remains uncertain, coffee consumption may potentially influence myocardial relaxation through hemodynamic, autonomic, or endothelial pathways. However, because caffeine intake was not directly quantified in our study, these mechanisms cannot be specifically attributed to caffeine and should be considered speculative.
Nevertheless, this finding should be interpreted cautiously. In our study, coffee consumption was not significantly associated with E/e′, LVMI, LVEF, or other major echocardiographic parameters. The absence of consistent associations across multiple indices of cardiac structure and function suggests that the observed relationship with e′ may reflect a specific tissue Doppler finding rather than a generalized improvement in cardiac function. Therefore, the higher e′ velocity observed among coffee consumers should not be interpreted as evidence of a direct cardioprotective effect of coffee. Differences in age, blood pressure, smoking, physical activity, fluid intake, and other lifestyle factors may also contribute to this association, despite adjustment for selected potential confounders. Overall, the echocardiographic findings do not provide sufficient evidence to conclude that coffee consumption is associated with improved cardiac function. Prospective studies incorporating standardized assessment of coffee and caffeine intake and serial echocardiographic measurements are needed to determine whether this finding is reproducible and whether it has any clinical significance.
Several limitations should be considered when interpreting our findings. First, the cross-sectional design precludes establishing temporal or causal relationships between coffee consumption, copeptin concentrations, and cardiac parameters. Second, caffeine intake was not directly quantified, and coffee consumption was assessed according to the amount of dry coffee consumed; therefore, differences in caffeine content related to coffee type and preparation method could not be fully accounted for, and the effects of caffeine could not be distinguished from those of other coffee components. Other dietary sources of caffeine were also not systematically quantified. Third, total kidney volume and longitudinal measures of ADPKD progression were not available, limiting our ability to determine whether the lower copeptin concentrations observed in coffee consumers have any relationship with subsequent disease progression. Fourth, the relatively small sample size, particularly the limited number of coffee consumers included in the dose-related correlation analyses, may have reduced the statistical power to detect modest associations and increased the uncertainty of some estimates. Fifth, coffee consumption was based on self-reported intake and was assessed at a single time point; therefore, recall bias and changes in habitual coffee consumption over time cannot be excluded. Finally, residual confounding, particularly from lifestyle factors such as smoking, age, physical activity, and fluid intake, cannot be completely excluded despite adjustment for selected covariates. As this was a single-center study, the generalizability of the findings to other ADPKD populations may also be limited. In addition, the isolated association observed between coffee consumption and e′, in the absence of consistent changes in other echocardiographic parameters, limits the clinical interpretation of this finding.
Because the study did not include healthy individuals or a non-ADPKD chronic kidney disease comparison group, the specificity of the observed associations between coffee consumption and copeptin or echocardiographic parameters to ADPKD cannot be determined. Therefore, our findings should be interpreted as associations observed within an ADPKD cohort rather than as effects specific to ADPKD. In conclusion, coffee consumption in patients with ADPKD was associated with lower serum copeptin concentrations and higher mitral annular e′ velocity, whereas no consistent associations were observed with renal function, LVMI, LVEF, E/e′, or other major echocardiographic parameters. The lower copeptin concentrations observed among coffee consumers, together with the previously reported relationship between coffee intake and the vasopressin system in non-ADPKD populations, raise the possibility that coffee consumption may be associated with modulation of the vasopressin–copeptin axis in ADPKD. However, the isolated association with e′ and the absence of concordant changes in other cardiac parameters do not provide sufficient evidence for an overall improvement in cardiac function. Similarly, the absence of a cross-sectional association with renal function should not be interpreted as evidence of a beneficial or adverse effect on long-term ADPKD progression. Therefore, our findings should be regarded as hypothesis-generating rather than as evidence of a causal or therapeutic effect of coffee consumption. Larger, prospective studies with standardized assessment of coffee and caffeine exposure, fluid intake, copeptin, total kidney volume, and longitudinal renal and cardiac outcomes are warranted to determine whether the observed associations are reproducible and to clarify their underlying biological and clinical significance.
Author Contributions
Conceptualization, Bennur Esen and Ahmet Engin Atay; Methodology, Bennur Esen and Ahmet Engin Atay; Validation, Bennur Esen, Ahmet Engin Atay and İrfan Şahin; Formal analysis, Bennur Esen and Ahmet Engin Atay; Investigation, Bennur Esen, Ahmet Engin Atay and İrfan Şahin; Resources, Bennur Esen, Ahmet Engin Atay and Ferdi Karagoz; Data curation, Bennur Esen, Ahmet Engin Atay, Ferdi Karagoz and İrfan Şahin; Writing – original draft, Bennur Esen and Ahmet Engin Atay; Supervision, Bennur Esen and Ahmet Engin Atay; Project administration, Bennur Esen, Ahmet Engin Atay and Ferdi Karagoz. All authors have read and agreed to the published version of the manuscript.
Funding
This research received no external funding.
Institutional Review Board Statement
The study was conducted in accordance with the principles of the Declaration of Helsinki and was approved by the Clinical Research Ethics Committee of Medipol University Faculty of Medicine Hospital (Decision No. E-10840098-50.04-3293).
Informed Consent Statement
Written informed consent was obtained from all participants before enrollment.
Data Availability Statement
The original contributions presented in this study are included in the article. Further inquiries can be directed to the corresponding author.
Conflicts of Interest
The authors declare no conflict of interest.
References
- Torres, V.E.; Harris, P.C. Autosomal dominant polycystic kidney disease: the last 3 years. Kidney Int. 2009, 76(2), 149–68. [Google Scholar] [CrossRef] [PubMed] [PubMed Central]
- Chapman, A.B.; Devuyst, O.; Eckardt, K.U.; Gansevoort, R.T.; Harris, T.; Horie, S.; Kasiske, B.L.; Odland, D.; Pei, Y.; Perrone, R.D.; et al. Conference Participants. Autosomal-dominant polycystic kidney disease (ADPKD): executive summary from a Kidney Disease: Improving Global Outcomes (KDIGO) Controversies Conference. Kidney Int. 2015, 88(1), 17–27. [Google Scholar] [CrossRef] [PubMed] [PubMed Central]
- Belibi, F.A.; Wallace, D.P.; Yamaguchi, T.; Christensen, M.; Reif, G.; Grantham, J.J. The effect of caffeine on renal epithelial cells from patients with autosomal dominant polycystic kidney disease. J. Am. Soc. Nephrol. 2002, 13(11), 2723–9. [Google Scholar] [CrossRef] [PubMed]
- Torres, V.E.; Chapman, A.B.; Devuyst, O.; Gansevoort, R.T.; Grantham, J.J.; Higashihara, E.; Perrone, R.D.; Krasa, H.B.; Ouyang, J.; Czerwiec, F.S. TEMPO 3:4 Trial Investigators. Tolvaptan in patients with autosomal dominant polycystic kidney disease. N Engl. J. Med. 2012, 367(25), 2407–18. [Google Scholar] [CrossRef] [PubMed] [PubMed Central]
- Morgenthaler, N.G.; Struck, J.; Jochberger, S.; Dünser, M.W. Copeptin: clinical use of a new biomarker. Trends Endocrinol. Metab. 2008, 19(2), 43–9. [Google Scholar] [CrossRef] [PubMed]
- Velho, G.; Bouby, N.; Hadjadj, S.; Matallah, N.; Mohammedi, K.; Fumeron, F.; Potier, L.; Bellili-Munoz, N.; Taveau, C.; Alhenc-Gelas, F.; et al. Plasma copeptin and renal outcomes in patients with type 2 diabetes and albuminuria. Diabetes Care 2013, 36(11), 3639–45. [Google Scholar] [CrossRef] [PubMed] [PubMed Central]
- Zittema, D.; Boertien, W.E.; van Beek, A.P.; Dullaart, R.P.; Franssen, C.F.; de Jong, P.E.; Meijer, E.; Gansevoort, R.T. Vasopressin, copeptin, and renal concentrating capacity in patients with autosomal dominant polycystic kidney disease without renal impairment. Clin. J. Am. Soc. Nephrol. 2012, 7(6), 906–13. [Google Scholar] [CrossRef] [PubMed]
- Boertien, W.E.; Meijer, E.; Zittema, D.; van Dijk, M.A.; Rabelink, T.J.; Breuning, M.H.; Struck, J.; Bakker, S.J.; Peters, D.J.; de Jong, P.E.; et al. Copeptin, a surrogate marker for vasopressin, is associated with kidney function decline in subjects with autosomal dominant polycystic kidney disease. Nephrol. Dial. Transplant. 2012, 27(11), 4131–7. [Google Scholar] [CrossRef] [PubMed]
- Boertien, W.E.; Meijer, E.; Li, J.; Bost, J.E.; Struck, J.; Flessner, M.F.; Gansevoort, R.T.; Torres, V.E. Consortium for Radiologic Imaging Studies of Polycystic Kidney Disease CRISP. Relationship of copeptin, a surrogate marker for arginine vasopressin, with change in total kidney volume and GFR decline in autosomal dominant polycystic kidney disease: results from the CRISP cohort. Am. J. Kidney Dis. 2013, 61(3), 420–9. [Google Scholar] [CrossRef] [PubMed] [PubMed Central]
- Meca, R.; Balbo, B.E.; Ormanji, M.S.; Fonseca, J.M.; Iannuzzi, L.R.; Santana Costa, E.; Onuchic, L.F.; Heilberg, I.P. Caffeine accelerates cystic kidney disease in a Pkd1-deficient mouse model. Cell Physiol. Biochem. 2019, 52(5), 1061–1074. [Google Scholar] [CrossRef] [PubMed]
- Vendramini, L.C.; Nishiura, J.L.; Baxmann, A.C.; Heilberg, I.P. Caffeine intake by patients with autosomal dominant polycystic kidney disease. Braz. J. Med. Biol. Res. 2012, 45(9), 834–40. [Google Scholar] [CrossRef] [PubMed] [PubMed Central]
- Kidney Disease: Improving Global Outcomes (KDIGO) ADPKD Work Group. KDIGO 2025 Clinical Practice Guideline for the Evaluation, Management, and Treatment of Autosomal Dominant Polycystic Kidney Disease (ADPKD). Kidney Int. 2025, 107(2S), S1–S239. [CrossRef] [PubMed]
- Schill, F.; Timpka, S.; Hellstrand, S.; Melander, O.; Enhörning, S. Coffee intake and the vasopressin system: an epidemiological and experimental study. Endocr. Connect. 2025, 14(9), e250100. [Google Scholar] [CrossRef] [PubMed] [PubMed Central]
- Ecder, T. Cardiovascular complications in autosomal dominant polycystic kidney disease. Curr. Hypertens. Rev. 2013, 9(1), 2–11. [Google Scholar] [CrossRef] [PubMed]
- Chapman, A.B.; Johnson, A.M.; Rainguet, S.; Hossack, K.; Gabow, P.; Schrier, R.W. Left ventricular hypertrophy in autosomal dominant polycystic kidney disease. J. Am. Soc. Nephrol. 1997, 8(8), 1292–7. [Google Scholar] [CrossRef] [PubMed]
- Chen, H.; Watnick, T.; Hong, S.N.; Daly, B.; Li, Y.; Seliger, S.L. Left ventricular hypertrophy in a contemporary cohort of autosomal dominant polycystic kidney disease patients. BMC Nephrol. 2019, 20(1), 386. [Google Scholar] [CrossRef] [PubMed] [PubMed Central]
- Hage, C.; Lund, L.H.; Donal, E.; Daubert, J.C.; Linde, C.; Mellbin, L. Copeptin in patients with heart failure and preserved ejection fraction: a report from the prospective KaRen-study. Open Heart 2015, 2(1). [Google Scholar] [CrossRef] [PubMed]
- Lupa, M.; Pardała, A.; Bednarek, A.; Mrochem-Kwarciak, J.; Deja, R.; Mizia-Stec, K.; Kolonko, A. The association between echocardiographic parameters of heart failure with preserved ejection fraction and fluid status biomarkers in hemodialysis patients. Diagnostics 2024, 14(12), 1310. [Google Scholar] [CrossRef] [PubMed]
- Nwabuo, C.C.; Betoko, A.S.; Reis, J.P.; Moreira, H.T.; Vasconcellos, H.D.; Guallar, E.; Cox, C.; Sidney, S.; Ambale-Venkatesh, B.; Lewis, C.E.; et al. Coffee and tea consumption in the early adult lifespan and left ventricular function in middle age: the CARDIA study. ESC Heart Fail 2020, 7(4), 1510–1519. [Google Scholar] [CrossRef] [PubMed] [PubMed Central]
- Senftinger, J.; Nikorowitsch, J.; Borof, K.; Ojeda, F.; Aarabi, G.; Beikler, T.; Mayer, C.; Behrendt, C.A.; Walther, C.; Zyriax, B.C.; et al. Coffee consumption and associations with blood pressure, LDL-cholesterol and echocardiographic measures in the general population. Sci. Rep. 2023, 13, 4668. [Google Scholar] [CrossRef] [PubMed]
- Kidney Disease: Improving Global Outcomes (KDIGO) CKD Work Group. KDIGO 2024 Clinical Practice Guideline for the Evaluation and Management of Chronic Kidney Disease. Kidney Int. 2024, 105(4S), S117–S314. [CrossRef] [PubMed]
- McEvoy, J.W.; McCarthy, C.P.; Bruno, R.M.; Brouwers, S.; Canavan, M.D.; Ceconi, C.; Christodorescu, R.M.; Daskalopoulou, S.S.; Ferro, C.J.; Gerdts, E.; ESC Scientific Document Group. 2024 ESC Guidelines for the management of elevated blood pressure and hypertension. Eur. Heart J. Erratum in: Eur Heart J. 2025 Apr 7;46(14):1300. doi: 10.1093/eurheartj/ehaf031. Erratum in: Eur Heart J. 2025 Dec 1;46(45):4949. doi: 10.1093/eurheartj/ehaf659. PMID: 39210715. 2024, 45(38), 3912–4018. [Google Scholar] [CrossRef]
- American Diabetes Association Professional Practice Committee for Diabetes. 2. Diagnosis and classification of diabetes: Standards of Care in Diabetes—2026. Diabetes Care 2026, 49 (Suppl 1). [Google Scholar] [CrossRef] [PubMed]
- Sääksjärvi, K.; Knekt, P.; Männistö, S.; Heliövaara, M. Self-administered questionnaire is a reliable measure of coffee consumption. J. Epidemiol. 2010, 20(5), 363–9. [Google Scholar] [CrossRef] [PubMed]
- Poole, R.; Ewings, S.; Parkes, J.; Fallowfield, J.A.; Roderick, P. Misclassification of coffee consumption data and the development of a standardised coffee unit measure. BMJ Nutr. Prev. Health 2019, 2(1), 11–19. [Google Scholar] [CrossRef] [PubMed] [PubMed Central]
- Bell, L.N.; Wetzel, C.R.; Grand, A.N. Caffeine content in coffee as influenced by grinding and brewing techniques. Food Res. Int. 1996, 29(8), 785–789. [Google Scholar] [CrossRef]
- Heckman, M.A.; Weil, J.; Gonzalez de Mejia, E. Caffeine (1, 3, 7-trimethylxanthine) in foods: a comprehensive review on consumption, functionality, safety, and regulatory matters. J. Food Sci. 2010, 75(3), R77–87. [Google Scholar] [CrossRef] [PubMed]
- Lang, R.M.; Badano, L.P.; Mor-Avi, V.; Afilalo, J.; Armstrong, A.; Ernande, L.; Flachskampf, F.A.; Foster, E.; Goldstein, S.A.; Kuznetsova, T.; et al. Recommendations for cardiac chamber quantification by echocardiography in adults: an update from the American Society of Echocardiography and the European Association of Cardiovascular Imaging. J. Am. Soc. Echocardiogr. 2015, 28(1), 1–39.e14. [Google Scholar] [CrossRef] [PubMed]
- Nagueh, S.F.; Smiseth, O.A.; Appleton, C.P.; Byrd, B.F., 3rd; Dokainish, H.; Edvardsen, T.; Flachskampf, F.A.; Gillebert, T.C.; Klein, A.L.; Lancellotti, P.; et al. Recommendations for the Evaluation of Left Ventricular Diastolic Function by Echocardiography: An Update from the American Society of Echocardiography and the European Association of Cardiovascular Imaging. J. Am. Soc. Echocardiogr. 2016, 29(4), 277–314. [Google Scholar] [CrossRef] [PubMed]
- Inker, L.A.; Eneanya, N.D.; Coresh, J.; Tighiouart, H.; Wang, D.; Sang, Y.; Crews, D.C.; Doria, A.; Estrella, M.M.; Froissart, M.; et al. New Creatinine- and Cystatin C-Based Equations to Estimate GFR without Race. N Engl. J. Med. 2021, 385(19), 1737–1749. [Google Scholar] [CrossRef] [PubMed] [PubMed Central]
- Kim, H.Y. Statistical notes for clinical researchers: assessing normal distribution (2) using skewness and kurtosis. Restor. Dent. Endod. 2013, 38(1), 52–4. [Google Scholar] [CrossRef] [PubMed] [PubMed Central]
- Torres, V.E.; Harris, P.C. Strategies targeting cAMP signaling in the treatment of polycystic kidney disease. J. Am. Soc. Nephrol. 2014, 25(1), 18–32. [Google Scholar] [CrossRef] [PubMed] [PubMed Central]
- Gansevoort, R.T.; van Gastel, M.D.A.; Chapman, A.B.; Blais, J.D.; Czerwiec, F.S.; Higashihara, E.; Lee, J.; Ouyang, J.; Perrone, R.D.; Stade, K. TEMPO 3:4 Investigators. Plasma copeptin levels predict disease progression and tolvaptan efficacy in autosomal dominant polycystic kidney disease. Kidney Int. 2019, 96(1), 159–169. [Google Scholar] [CrossRef] [PubMed] [PubMed Central]
- Girardat-Rotar, L.; Puhan, M.A.; Braun, J.; Serra, A.L. Long-term effect of coffee consumption on autosomal dominant polycystic kidney disease progression: results from the Suisse ADPKD, a Prospective Longitudinal Cohort Study. J. Nephrol. 2018, 31(1), 87–94. [Google Scholar] [CrossRef] [PubMed] [PubMed Central]
- McKenzie, K.A.; El Ters, M.; Torres, V.E.; Harris, P.C.; Chapman, A.B.; Mrug, M.; Rahbari-Oskoui, F.F.; Bae, K.T.; Landsittel, D.P.; Bennett, W.M.; et al. Relationship between caffeine intake and autosomal dominant polycystic kidney disease progression: a retrospective analysis using the CRISP cohort. BMC Nephrol. 2018, 19(1), 378. [Google Scholar] [CrossRef] [PubMed] [PubMed Central]
- Giacomin, E.; Palmerini, E.; Ballo, P.; Zacà, V.; Bova, G.; Mondillo, S. Acute effects of caffeine and cigarette smoking on ventricular long-axis function in healthy subjects. Cardiovasc Ultrasound 2008, 6, 9. [Google Scholar] [CrossRef] [PubMed] [PubMed Central]
Figure 1.
The distribution of serum copeptin levels.
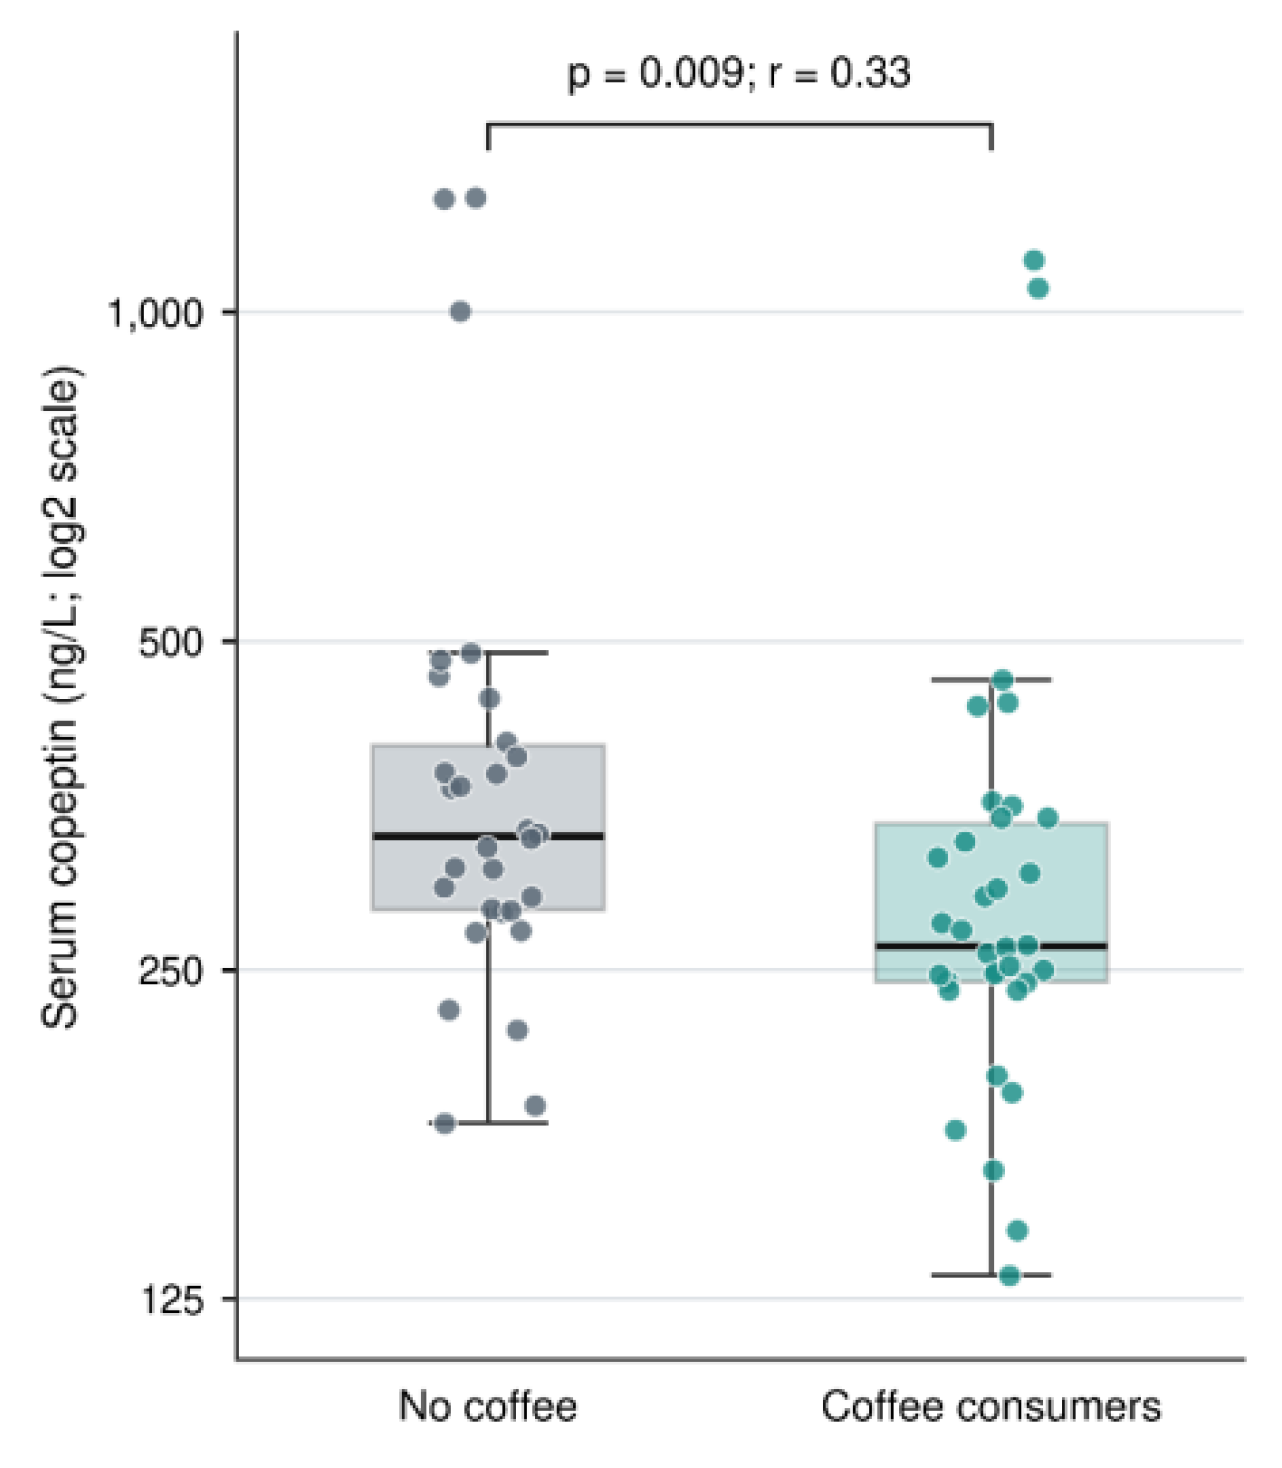
Figure 2.
The distribution of selected cardiac functional and hemodynamic parameters according to coffee consumption status.
Figure 2.
The distribution of selected cardiac functional and hemodynamic parameters according to coffee consumption status.
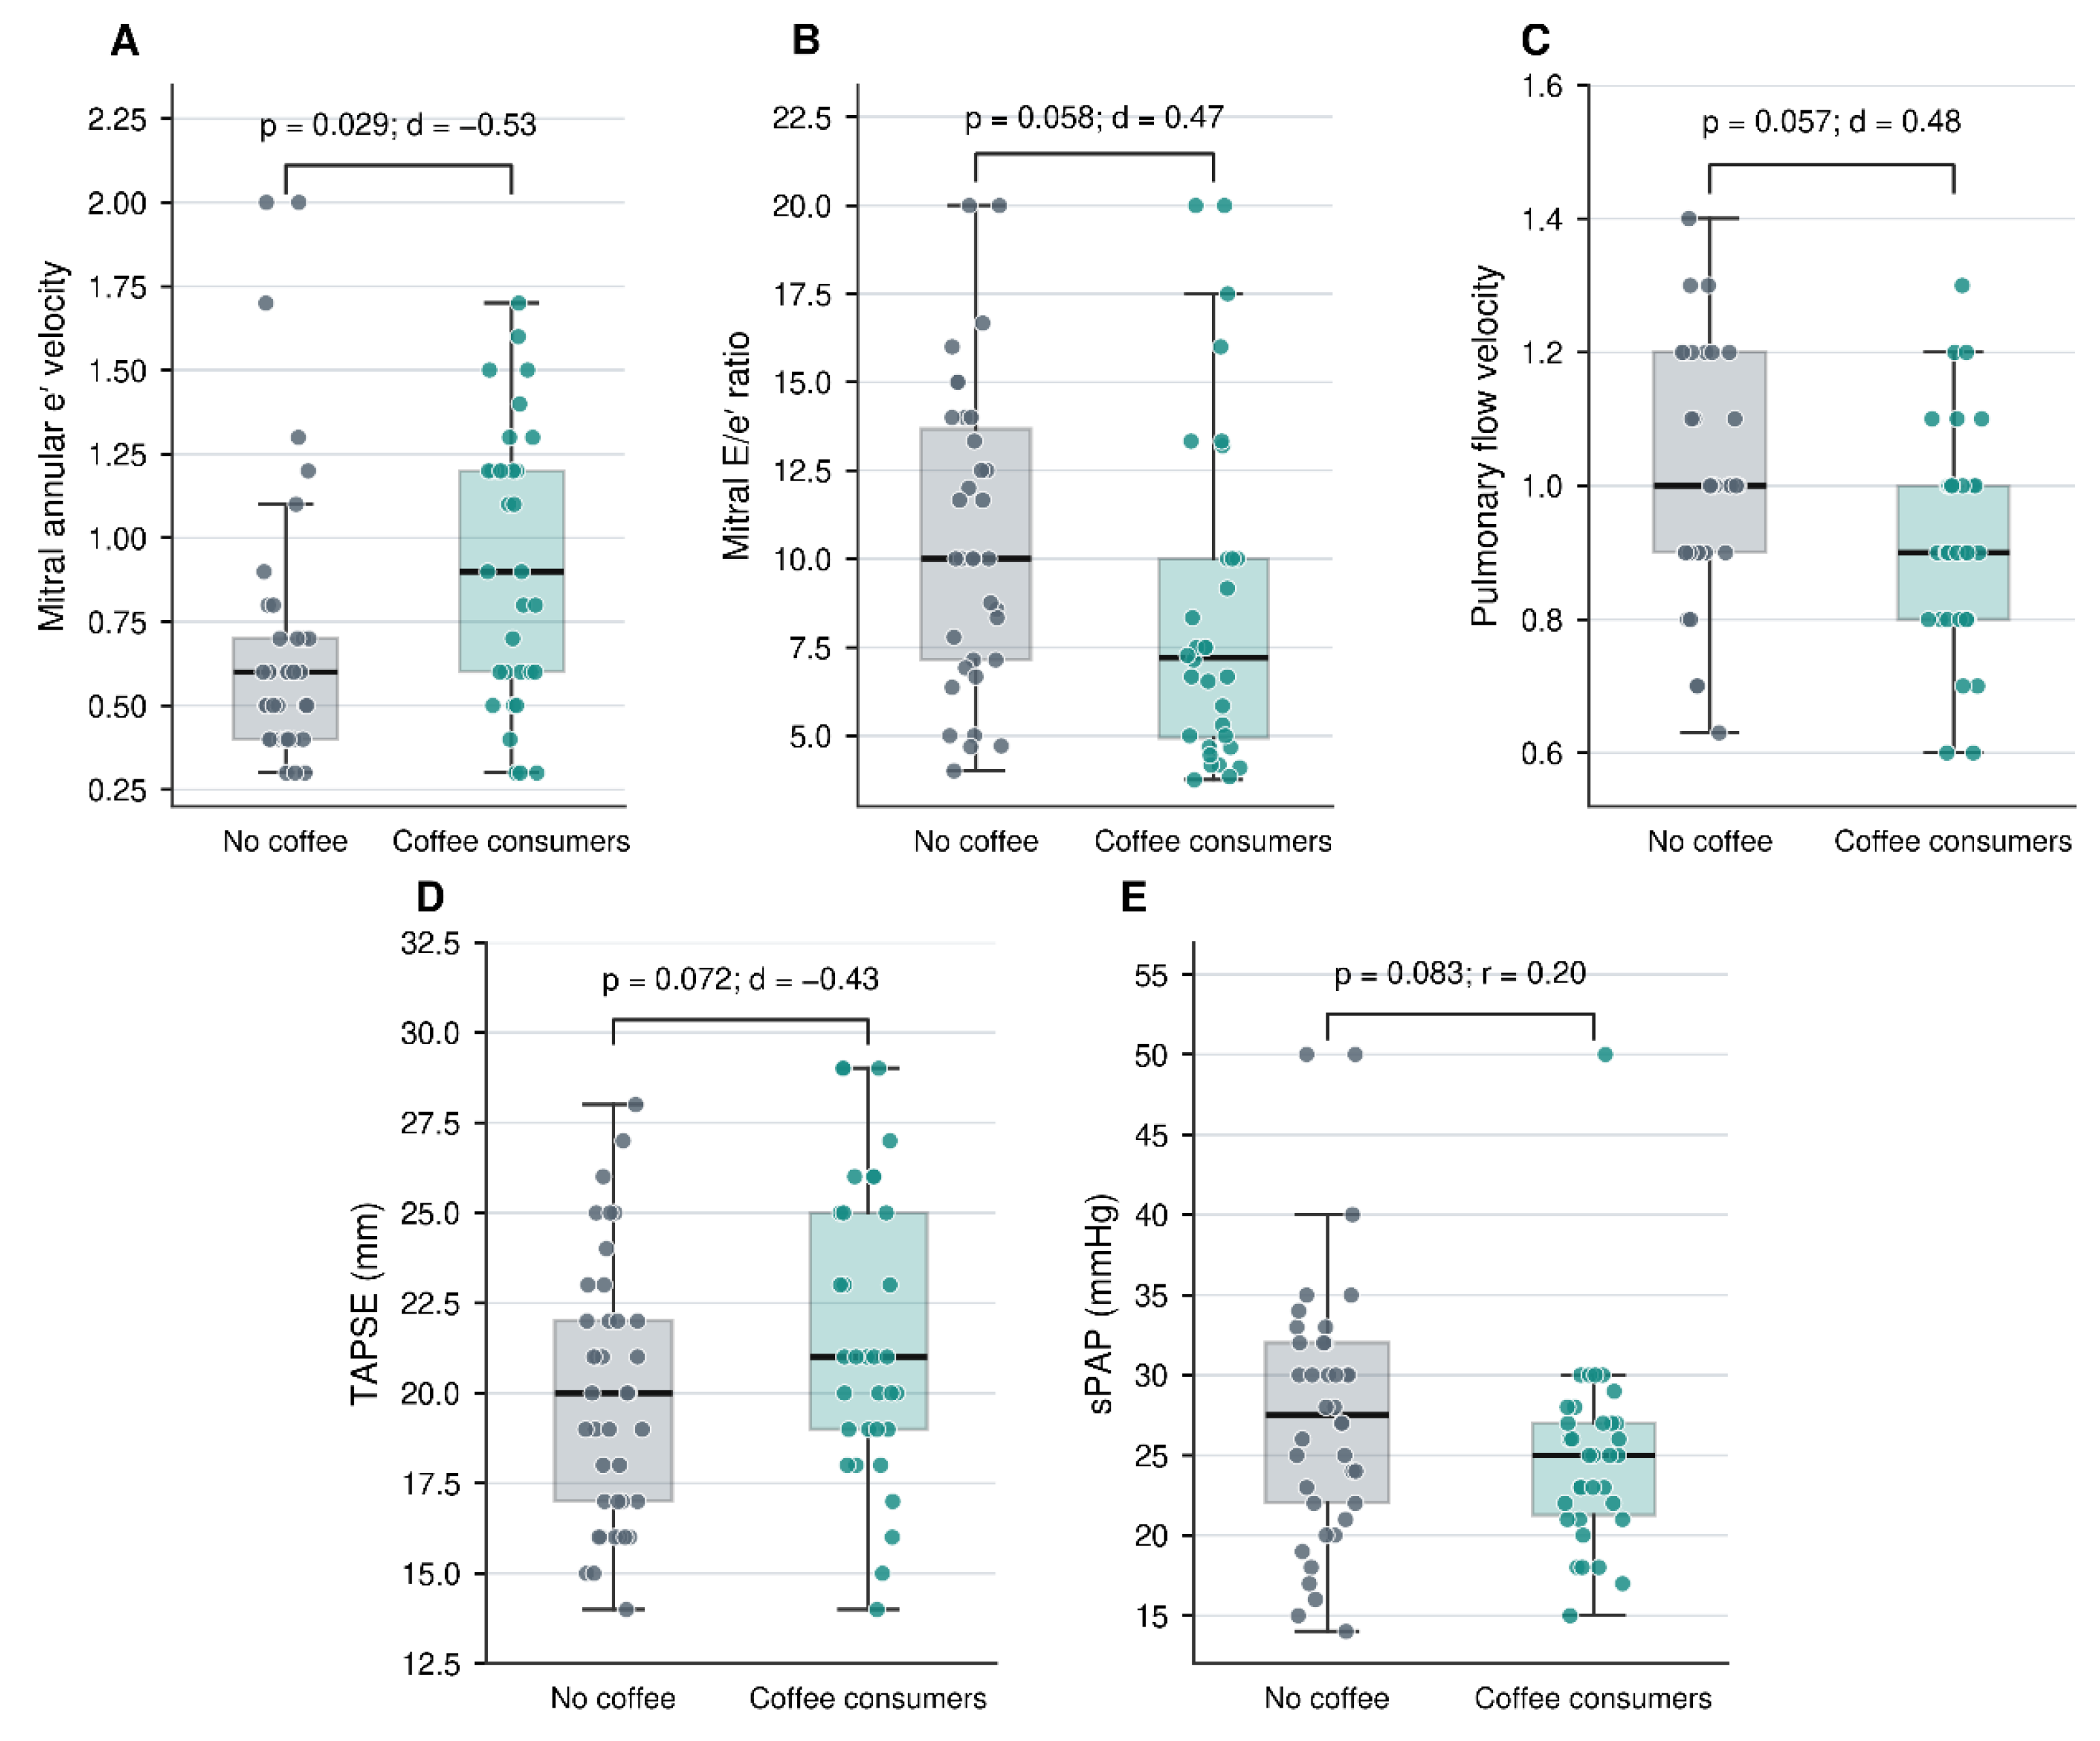

Table 1.
Comparison of demographic, clinical, lifestyle, and anthropometric characteristics of patients with autosomal dominant polycystic kidney disease according to coffee consumption status.
Table 1.
Comparison of demographic, clinical, lifestyle, and anthropometric characteristics of patients with autosomal dominant polycystic kidney disease according to coffee consumption status.
| Variable | Group | Total (n=75) | Non-coffee consumers (n=39) |
Coffee consumers (n=36) |
p |
|---|---|---|---|---|---|
| Sex | Male | 32 (42.7) | 16 (41.0) | 16 (44.4) | 0.765 |
| Female | 43 (57.3) | 23 (59.0) | 20 (55.6) | ||
| Diabetes mellitus | No | 62 (82.7) | 30 (76.9) | 32 (88.9) | 0.171 |
| Yes | 13 (17.3) | 9 (23.1) | 4 (11.1) | ||
| Hypertension | No | 35 (46.7) | 16 (41.0) | 19 (52.8) | 0.308 |
| Yes | 40 (53.3) | 23 (59.0) | 17 (47.2) | ||
| Smoking status | No | 45 (60.0) | 29 (74.4) | 16 (44.4) | 0.008* |
| Yes | 30 (40.0) | 10 (25.6) | 20 (55.6) | ||
| Age (years)ᵗ | — | 48.00±15.66 46.00 (18.00–75.00) |
49.38±17.48 46.00 (18.00–75.00) |
46.50±13.49 46.00 (24.00–72.00) |
0.365 |
| Disease duration (months)ᶻ | — | 68.04 ± 77.33 36.00 (1.00–360.00) |
72.56±88.64 36.00 (1.00–360.00) |
63.14±63.75 42.00 (1.00–240.00) |
0.698 |
| Follow-up duration (months)ᵗ | — | 35.21 ± 35.43 24.00 (1.00–144.00) |
34.10 ± 38.40 14.00 (1.00–144.00) |
36.42 ± 32.41 24.00 (1.00–120.00) |
0.780 |
|
Monthly coffee consumption among coffee consumers (g/month)ᶻ |
— | — | — | 119.17±132.95 55.00 (10.00–540.00) |
— |
|
Smoking exposure among smokers (pack-years)ᵗ |
— | 15.74 ± 13.72 15.00 (1.00–55.00) |
9.70 ± 8.68 7.50 (1.00–25.00) |
18.62 ± 14.88 20.00 (1.00–55.00) |
0.045* |
| Total daily fluid intake (L/day)ᵗ | — | 2.35 ± 0.65 2.00 (2.00–4.00) |
2.31 ± 0.66 2.00 (2.00–4.00) |
2.39 ± 0.64 2.00 (2.00–4.00) |
0.591 |
| Systolic blood pressure (mmHg)ᵗ | — | 127.40 ± 14.74 125.00 (90.00–160.00) |
129.10 ± 14.73 125.00 (100.00–160.00) |
125.56 ± 14.72 122.50 (90.00–150.00) |
0.301 |
| Diastolic blood pressure (mmHg)ᵗ | — | 76.91 ± 8.64 80.00 (60.00–100.00) |
77.18 ± 9.02 80.00 (60.00–100.00) |
76.61 ± 8.33 80.00 (60.00–100.00) |
0.778 |
| Body mass index (kg/m²)ᵗ | — | 28.44 ± 4.78 29.10 (17.90–44.40) |
28.17 ± 4.48 29.00 (17.90–35.40) |
28.71 ± 5.13 29.10 (20.00–44.40) |
0.641 |
| Height (cm)ᵗ | — | 163.91 ± 8.55 163.00 (147.00–187.00) |
162.20 ± 8.28 160.00 (147.00–177.00) |
165.68 ± 8.57 163.50 (150.00–187.00) |
0.091 |
| Body weight (kg)ᵗ | — | 76.47 ± 13.47 77.00 (50.00–109.00) |
74.09 ± 11.51 73.40 (52.40–99.90) |
78.93 ± 15.00 79.95 (50.00–109.00) |
0.137 |
| Total body water (kg)ᵗ | — | 39.94 ± 7.42 38.10 (27.70–58.20) |
38.45 ± 6.69 36.90 (27.70–53.10) |
41.48 ± 7.90 40.95 (29.40–58.20) |
0.090 |
| Total body water (%)ᵗ | — | 52.66 ± 7.68 53.08 (33.58–70.50) |
52.36 ± 8.18 52.23 (33.58–67.30) |
52.97 ± 7.24 53.83 (40.31–70.50) |
0.744 |
| Body surface area (m²)ᵗ | — | 1.86 ± 0.19 1.85 (1.47–2.32) |
1.82 ± 0.16 1.81 (1.53–2.16) |
1.90 ± 0.21 1.91 (1.47–2.32) |
0.094 |
Note: Data are presented as n (%) for categorical variables and as mean ± standard deviation; median (minimum–maximum) for continuous variables. Categorical variables were compared using Pearson’s chi-square test or Fisher’s exact test, as appropriate. Normally distributed continuous variables were compared using the independent-samples t-test, whereas non-normally distributed continuous variables were compared using the Mann–Whitney U test. Coffee consumption was quantified only among participants who reported coffee consumption and was expressed as grams of dry coffee per month. *p< 0.05 was considered statistically significant. ᵗ Independent-samples t-test; ᶻ Mann–Whitney U test.
Table 2.
Serum Copeptin Levels and Laboratory Parameters According to Coffee Consumption in Patients with Autosomal Dominant Polycystic Kidney Disease.
Table 2.
Serum Copeptin Levels and Laboratory Parameters According to Coffee Consumption in Patients with Autosomal Dominant Polycystic Kidney Disease.
| Variable | Nocoffee consumption(n=39) Mean ± SD; Median (Min–Max) |
Coffee consumption (n=36) Mean ± SD; Median (Min–Max) |
p-value | Effect size |
|---|---|---|---|---|
| Serum copeptin level (ng/L)ᶻ | 414.88 ± 274.28; 331.28 (180.85–1272.41) |
323.40 ± 207.75; 262.73 (131.19–1114.91) |
0.009* | r = 0.330 |
| Glucose (mg/dL)ᶻ | 117.19 ± 93.08; 95.50 (82.50–660.00) |
99.74 ± 16.42; 97.45 (78.60–162.00) |
0.958 | r = 0.006 |
| Urea (mg/dL)ᵗ | 41.07 ± 21.98; 33.10 (15.10–108.50) |
41.78 ± 20.17; 33.50 (18.50–107.00) |
0.885 | d=−0.034 |
| Creatinine (mg/dL)ᶻ | 1.07 ± 0.57; 0.90 (0.46–2.85) |
1.14 ± 0.54; 1.00 (0.60–3.00) |
0.324 | r = 0.114 |
| eGFR (mL/min/1.73 m²)ᵗ | 84.84 ± 32.17; 86.83 (19.29–128.70) |
80.79 ± 30.70; 78.93 (16.02–127.45) |
0.580 | d = 0.129 |
| Uric acid (mg/dL)ᵗ | 5.41 ± 1.93; 5.50 (1.90–10.20) |
5.40 ± 1.65; 5.45 (2.40–11.50) |
0.980 | d = 0.006 |
|
Calcium (mg/dL)ᵗ |
9.60 ± 0.47; 9.56 (8.40–10.90) |
9.50 ± 0.39; 9.47 (8.40–10.10) |
0.350 |
d = 0.217 |
| Sodium (mmol/L)ᵗ | 141.97 ± 2.99; 143.00 (131.00–149.00) |
141.14 ± 3.02; 142.00 (135.00–146.00) |
0.232 | d = 0.278 |
| Potassium (mmol/L)ᵗ | 4.52 ± 0.35; 4.50 (3.69–5.10) |
4.44 ± 0.30; 4.42 (3.93–5.00) |
0.310 | d = 0.236 |
| Phosphate (mg/dL)ᵗ | 3.31 ± 0.55; 3.30 (2.20–4.40) |
3.20 ± 0.55; 3.23 (2.00–4.79) |
0.376 | d = 0.206 |
| Parathyroid hormone (pg/mL)ᶻ | 80.54 ± 62.30; 56.00 (26.40–256.00) |
78.08 ± 51.11; 63.25 (21.00–208.00) |
0.832 | r = 0.024 |
| Leukocyte count (×10³/µL)ᵗ | 6.95 ± 1.77; 6.80 (3.53–11.40) |
7.15 ± 1.69; 7.12 (4.28–11.80) |
0.628 | d =−0.113 |
| Hemoglobin (g/dL)ᵗ | 13.40 ± 1.55; 13.05 (9.70–16.40) |
13.54 ± 1.62; 13.35 (10.20–17.30) |
0.697 | d =−0.091 |
| Hematocrit (%)ᵗ | 40.75 ± 4.71; 40.30 (28.90–49.40) |
41.94 ± 4.59; 40.95 (33.80–53.50) |
0.276 | d =−0.255 |
| Platelet count (×10³/µL)ᵗ | 258.32 ± 57.24; 248.00 (173.90–412.00) |
232.16 ± 56.97; 237.00 (111.40–372.00) |
0.053 | d = 0.458 |
|
Spot urine albumin-to- creatinine ratio (mg/g)ᶻ |
75.52 ± 129.43; 15.90 (1.30–634.30) |
61.05 ± 115.01; 21.05 (2.50–578.60) |
0.592 | r = 0.062 |
Note: Data are presented as mean ± standard deviation and median (minimum–maximum). Normally distributed continuous variables were compared using the independent-samples t-test, and non-normally distributed continuous variables were compared using the Mann–Whitney U test. Effect sizes were expressed as Cohen’s d for variables analyzed using the independent-samples t-test and as r = |Z|/√N for variables analyzed using the Mann–Whitney U test. For Cohen’s d, values of 0.20, 0.50, and 0.80 represent small, moderate, and large effects, respectively; for r, values of 0.10, 0.30, and 0.50 represent small, moderate, and large effects, respectively. *p< 0.05 was considered statistically significant. ᵗ Independent-samples t-test; ᶻ Mann–Whitney U test; eGFR, estimated glomerular filtration rate.
Table 3.
Comparison of Echocardiographic Parameters According to Coffee Consumption Status in Patients with Autosomal Dominant Polycystic Kidney Disease.
Table 3.
Comparison of Echocardiographic Parameters According to Coffee Consumption Status in Patients with Autosomal Dominant Polycystic Kidney Disease.
| Variable | No coffee consumption (n=39) Mean ± SD; Median (Min–Max) |
Coffee consumption (n=36) Mean ± SD; Median (Min–Max) |
p-value | Effect size |
|---|---|---|---|---|
| Mitral regurgitation, n (%) | — | |||
| No | 21 (53.8) | 18 (50.0) | 0.739 | |
| Yes | 18 (46.2) | 18 (50.0) | ||
| Aortic regurgitation, n (%) | — | |||
| No | 29 (74.4) | 27 (75.0) | 0.949 | |
| Yes | 10 (25.6) | 9 (25.0) | ||
| Tricuspid regurgitation, n (%) | — | |||
| No | 3 (7.7) | 2 (5.6) | 1.000 | |
| Yes | 36 (92.3) | 34 (94.4) | ||
|
Increased left ventricular mass index (LVMI), n (%) |
— | |||
| Normal/Not increased | 18 (46.2) | 22 (61.1) | 0.195 | |
| Increased | 21 (53.8) | 14 (38.9) | ||
|
Left ventricular end-diastolic diameter (LVDd), cmᶻ |
4.74 ± 0.47; 4.70 (3.60–5.50) | 4.87 ± 0.51; 4.80 (4.20–6.70) | 0.503 | r = 0.08 |
|
Left ventricular end-systolic diameter (LVSd), cmᶻ |
3.14 ± 0.50; 3.10 (2.10–4.40) | 3.21 ± 0.54; 3.10 (2.40–5.30) | 0.903 | r = 0.01 |
|
Interventricular septal thickness (IVST), cmᵗ |
1.19 ± 0.27; 1.10 (0.80–1.90) | 1.11 ± 0.19; 1.10 (0.70–1.55) | 0.171 | d = 0.32 |
|
Left ventricular posterior wall thickness (PWT), cmᵗ |
1.06 ± 0.21; 1.00 (0.70–1.70) | 1.06 ± 0.19; 1.05 (0.60–1.44) | 0.926 | d= −0.02 |
| **Left ventricular ejection fraction (LVEF), %**ᶻ |
62.05 ± 6.38; 61.00 (35.00–72.00) | 62.31 ± 6.66; 61.00 (40.00–75.00) | 0.970 | r< 0.01 |
| **Fractional shortening (FS), %**ᶻ | 34.41 ± 4.12; 34.00 (26.00–48.00) | 34.14 ± 4.99; 33.00 (20.00–45.00) | 0.741 | r = 0.04 |
|
Left ventricular end-diastolic volume (LVEDV), mLᶻ |
115.82 ± 21.75; 121.50 (55.00–152.00) | 119.23 ± 26.45; 118.00 (77.00–230.00) | 0.899 | r = 0.01 |
|
Left ventricular end-systolic volume (LVESV), mLᶻ |
45.97 ± 13.41; 45.50 (21.00–96.00) | 45.34 ± 19.82; 44.00 (25.00–140.00) | 0.479 | r = 0.08 |
| Aortic root diameter, cmᵗ | 2.72 ± 0.36; 2.70 (2.10–3.80) | 2.65 ± 0.30; 2.65 (2.00–3.50) | 0.364 | d = 0.21 |
|
Ascending aortic diameter (AscAo), cmᵗ |
3.23 ± 0.50; 3.30 (2.40–4.30) | 3.22 ± 0.45; 3.20 (2.40–4.50) | 0.934 | d = 0.02 |
| Left atrial diameter (LAD), cmᶻ | 3.34 ± 0.79; 3.30 (0.60–5.70) | 3.48 ± 0.67; 3.30 (2.60–6.20) | 0.706 | r = 0.04 |
|
Mitral early diastolic flow velocity (E), m/sᶻ |
0.68 ± 0.21; 0.70 (0.40–1.40) | 0.64 ± 0.16; 0.60 (0.40–1.10) | 0.516 | r = 0.08 |
|
Mitral late diastolic flow velocity (A), m/sᵗ |
0.69 ± 0.14; 0.70 (0.40–1.10) | 0.66 ± 0.13; 0.70 (0.40–0.90) | 0.406 | d = 0.20 |
|
Mitral annular early diastolic tissue velocity (e′), m/sᵗ |
0.69 ± 0.43; 0.60 (0.30–2.00) | 0.92 ± 0.41; 0.90 (0.30–1.70) | 0.029* | d =−0.53 |
| Mitral E/e′ ratioᵗ | 10.63 ± 4.23; 10.00 (4.00–20.00) | 8.52 ± 4.70; 7.21 (3.75–20.00) | 0.058 | d = 0.47 |
| Aortic flow velocity, m/sᵗ | 1.09 ± 0.42; 1.10 (0.40–1.80) | 1.25 ± 0.25; 1.20 (0.60–1.70) | 0.096 | d= −0.46 |
| Pulmonary flow velocity, m/sᵗ | 1.00 ± 0.19; 1.00 (0.63–1.40) | 0.92 ± 0.17; 0.90 (0.60–1.30) | 0.057 | d = 0.48 |
|
Tricuspid annular plane systolic excursion (TAPSE), mmᵗ |
19.95 ± 3.66; 20.00 (14.00–28.00) | 21.61 ± 4.05; 21.00 (14.00–29.00) | 0.072 | d= −0.43 |
| Systolic pulmonary artery pressure (sPAP), mmHgᶻ | 27.55 ± 8.22; 27.50 (14.00–50.00) | 24.88 ± 6.02; 25.00 (15.00–50.00) | 0.083 | r = 0.20 |
| Left ventricular mass, gᶻ | 201.86 ± 77.76; 188.02 (100.60–448.71) | 199.11 ± 58.68; 187.41 (77.38–337.90) | 0.861 | r = 0.02 |
| Left ventricular mass index (LVMI) | 111.10 ± 37.48; 105.96 (60.52–226.50) | 104.74 ± 27.91; 97.72 (46.84–167.79) | 0.548 | r = 0.07 |
Note: Data are presented as n (%) for categorical variables and as mean ± standard deviation and median (minimum–maximum) for continuous variables. Categorical variables were compared using Pearson’s chi-square test or Fisher’s exact test, as appropriate. Normally distributed continuous variables were compared using the independent-samples t-test, and non-normally distributed continuous variables were compared using the Mann–Whitney U test. ᵗ Independent-samples t-test; effect sizes were expressed as Cohen’s d. ᶻ Mann–Whitney U test; effect sizes were expressed as r = |Z|/√N. For Cohen’s d, values of 0.20, 0.50, and 0.80 were considered small, moderate, and large effects, respectively; for r, values of 0.10, 0.30, and 0.50 were considered small, moderate, and large effects, respectively. *p< 0.05 was considered statistically significant.
Table 4.
Correlation Analysis of Coffee Consumption Status and Monthly Coffee Consumption Amount with Selected Clinical, Biochemical, and Echocardiographic Variables.
Table 4.
Correlation Analysis of Coffee Consumption Status and Monthly Coffee Consumption Amount with Selected Clinical, Biochemical, and Echocardiographic Variables.
| Variable | Coffee consumption status¹ | Monthly coffee consumption amount (g/month)² | ||
|---|---|---|---|---|
| r | p | r | p | |
| Smoking status | 0.305* | 0.008 | 0.409* | 0.013 |
| Mitral regurgitation | 0.038 | 0.743 | 0.476* | 0.003 |
| Age (years) | −0.077 | 0.511 | 0.404* | 0.015 |
| Follow-up duration (months) | 0.126 | 0.283 | 0.446* | 0.006 |
| Serum copeptin level (ng/L) | −0.329* | 0.008 | 0.440* | 0.009 |
| Mitral annular early diastolic tissue velocity (e′) | 0.304* | 0.010 | 0.021 | 0.906 |
| Mitral E/e′ ratio | −0.283* | 0.020 | −0.031 | 0.866 |
Note: Data are presented as Spearman’s rank correlation coefficient (r) and corresponding p-values. Values in bold indicate statistically significant correlations (p< 0.05). Only variables showing a statistically significant correlation in at least one of the two analyses are presented. ¹ Coffee consumption status was coded as 0 = no consumption and 1 = consumption. ² Analysis of monthly coffee consumption amount was performed only among coffee consumers (n = 36).
Table 5.
Multivariable Linear Regression Analysis of the Association Between Coffee Consumption and Natural Log-Transformed Serum Copeptin Level.
Table 5.
Multivariable Linear Regression Analysis of the Association Between Coffee Consumption and Natural Log-Transformed Serum Copeptin Level.
| Independent variable | B | SE | β | t | p | 95% CI for B | Tolerance | VIF |
|---|---|---|---|---|---|---|---|---|
| Constant | 5.841 | 0.477 | — | 12.244 | <0.001 | 4.885–6.796 | — | — |
| Age (years) | 0.004 | 0.005 | 0.126 | 0.730 | 0.468 | −0.007–0.015 | 0.496 | 2.014 |
| Sex¹ | −0.087 | 0.131 | −0.093 | −0.668 | 0.507 | −0.349–0.174 | 0.763 | 1.311 |
| Coffee consumption² | −0.284 | 0.127 | −0.306 | −2.229 | 0.030* | −0.539–−0.029 | 0.783 | 1.276 |
| Smoking status³ | 0.090 | 0.136 | 0.095 | 0.662 | 0.510 | −0.182–0.361 | 0.715 | 1.398 |
| Total daily fluid intake (L/day) | 0.036 | 0.093 | 0.050 | 0.387 | 0.701 | −0.150–0.222 | 0.870 | 1.149 |
| eGFR (mL/min/1.73 m²) | −0.002 | 0.003 | −0.140 | −0.819 | 0.416 | −0.007–0.003 | 0.504 | 1.982 |
Table 6.
Multivariable Linear Regression Analyses of the Associations of Coffee Consumption with Mitral Annular Early Diastolic Tissue Velocity (e′) and Mitral E/e′ Ratio.
Table 6.
Multivariable Linear Regression Analyses of the Associations of Coffee Consumption with Mitral Annular Early Diastolic Tissue Velocity (e′) and Mitral E/e′ Ratio.
| Dependent variable | Independent variable | B | SE | β | t | p | 95% CI for B | Tolerance | VIF |
|---|---|---|---|---|---|---|---|---|---|
| Mitral annular e′ velocity | Constant | 0.967 | 0.343 | — | 2.823 | 0.006 | 0.283–1.651 | — | — |
| Age (years) | −0.008 | 0.004 | −0.294 | −2.020 | 0.048* | −0.016–0.000 | 0.591 | 1.692 | |
| Sex¹ | 0.176 | 0.106 | 0.203 | 1.660 | 0.102 | −0.036–0.388 | 0.840 | 1.190 | |
| Coffee consumption² | 0.226 | 0.104 | 0.263 | 2.182 | 0.033* | 0.019–0.434 | 0.867 | 1.154 | |
| Smoking status³ | −0.026 | 0.115 | −0.030 | −0.227 | 0.821 | −0.255–0.203 | 0.729 | 1.372 | |
| Hypertension⁴ | 0.029 | 0.104 | 0.033 | 0.278 | 0.782 | −0.178–0.236 | 0.865 | 1.156 | |
| eGFR (mL/min/1.73 m²) | 0.000 | 0.002 | 0.008 | 0.057 | 0.955 | −0.004–0.004 | 0.587 | 1.703 | |
| Mitral E/e′ ratio | Constant | 11.165 | 3.911 | — | 2.855 | 0.006 | 3.343–18.988 | — | — |
| Age (years) | 0.024 | 0.045 | 0.083 | 0.526 | 0.601 | −0.067–0.114 | 0.601 | 1.664 | |
| Sex¹ | −1.653 | 1.231 | −0.180 | −1.343 | 0.184 | −4.115–0.809 | 0.838 | 1.193 | |
| Coffee consumption² | −1.664 | 1.190 | −0.184 | −1.398 | 0.167 | −4.045–0.718 | 0.864 | 1.157 | |
| Smoking status³ | −1.484 | 1.314 | −0.161 | −1.129 | 0.263 | −4.112–1.145 | 0.735 | 1.360 | |
| Hypertension⁴ | 0.180 | 1.194 | 0.020 | 0.151 | 0.881 | −2.208–2.568 | 0.858 | 1.166 | |
| eGFR (mL/min/1.73 m²) | −0.005 | 0.022 | −0.035 | −0.223 | 0.824 | −0.050–0.040 | 0.601 | 1.663 |
Note: Data are presented as unstandardized regression coefficients (B), standard errors (SE), standardized regression coefficients (β), t values, p values, 95% confidence intervals (95% CI) for B, tolerance, and variance inflation factor (VIF). Two separate multivariable linear regression models were constructed, with mitral annular e′ velocity and mitral E/e′ ratio as dependent variables. All independent variables were entered simultaneously using the Enter method. Both models included age, sex, coffee consumption, smoking status, hypertension, and eGFR as covariates. ¹ Sex: 0 = male, 1 = female. ² Coffee consumption: 0 = no consumption, 1 = consumption. ³ Smoking status: 0 = no, 1 = yes. ⁴ Hypertension: 0 = no, 1 = yes. *p< 0.05 was considered statistically significant. Tolerance values >0.20 and VIF values <5 were considered indicative of no important multicollinearity.
Disclaimer/Publisher’s Note: The statements, opinions and data contained in all publications are solely those of the individual author(s) and contributor(s) and not of MDPI and/or the editor(s). MDPI and/or the editor(s) disclaim responsibility for any injury to people or property resulting from any ideas, methods, instructions or products referred to in the content. |
© 2026 by the authors. Licensee MDPI, Basel, Switzerland. This article is an open access article distributed under the terms and conditions of the Creative Commons Attribution (CC BY) license (http://creativecommons.org/licenses/by/4.0/).
Copyright: This open access article is published under a Creative Commons CC BY 4.0 license, which permit the free download, distribution, and reuse, provided that the author and preprint are cited in any reuse.