

Submitted:
23 September 2026
Posted:
23 September 2026
You are already at the latest version
Abstract
The EU farm structure is subject to significant changes, which is seen not only to reduction of their number but also in transformation of their characteristics from family-type farming unto agri-business type. There are different causes behind those trends and evolution and technological progress along with general economic growth, which provides better conditions for employment and remuneration of the working force are some of the reasons. Retaining the farm number is crucial for rural employment, maintaining biodiversity, and supporting farm sustainability as well. It is noted that between 1967 and 1997, the number of farms fell by 42% in the founding EU countries, which means for a period of 30 years, whereas for EU-27 only between the last two censuses 2010 – 2020 years, the farm number declines by 25% from 12 million to 9 million. Looking at the picture across the EU, it is ascertained that it is not an issue or perspective of some member states but rather an omnipresent process. The purpose of this study is to project the EU farm number to 2030 year applying a proportional extrapolation scenario model and to evaluate the influence from factors acting at three territorial levels – regional (NUTS 2), national (countrywide) and overarching (EU level). The assumptions are that on different territorial levels there are various factors affecting and impacting farm number and the goal is not to identify particularly which are those but to reveal at which territorial level those factors are designated. It is deemed that when member states’ trends in farm number resemble the EU average trend, it might be accepted that designation of factor influence is from the higher rather than national level and vice versa. Hence, the overarching level is considered to be EU level but the development in common direction mostly implies the influence of factors from general essence rather than specific national or regional origin. The results from the study demonstrate the farm number in EU-27 will decrease till 2030 by 16% in the status-quo scenario. The results from the pessimistic scenario testifies for a greater drop in EU-27 farm number by 33% compared to 2020, while the optimistic scenario indicates a likely slight enhancement by just 1%. Territorial analysis reveals the weight of overarching territorial factors, which are commonly admitted for EU level is evaluated to be 61%, the weight of national level and regional NUTS 2 factors can be allocated to 39%. Within the EU countries, there are divergences concerning the distribution of the territorial impact, which is explicated in the study.
Keywords:
meta-analysis
; EU countries
; farm number
; territorial factors
; proportional extrapolation
; territorial share shift analysis
1. Introduction
The development of farms and agricultural households is always an interesting and essential topic from research point of view. According to Janovska et al [1] “the size and the number of agricultural holdings in a region is a proxy for an indicator of the sustainability and economic health of the agricultural economy”. In 2020, there were almost 9.1 million farms across the European Union (EU). This is an estimated 3 million fewer farms compared to Census 2010 (the calculated decline of about 25%). The changes in farm number are also tied with transformations in farm specialization where the share of crop farming outmatches that number in livestock. The main reason for it is the higher labor intensity of livestock farming, as especially in pig and poultry sectors, there are huge consolidation and production scale to rationalize the immense investment costs.
The goal of the paper is to study the determination of territorial influence on the farm number changes throughout EU countries and based on the ascertained results from the Agricultural Censuses 2010 and 2020 to make projections for their evolvement in 2030 through 3 scenarios. The elaborated scenarios are Status-Quo (baseline), optimistic (the highest projections of farm number in the EU countries) and pessimistic (the lowest projected farm number) using the none stochastic rather best and worst experienced cases on NUTS 2 EU level observed between 2010 and 2020 Censuses. The none stochastic case scenarios are set taking into account the real farm number evolvement on NUTS 2 EU level, where the best and worst cases of farm changes between both Censuses are identified and their coefficients are adopted to project the optimistic and pessimistic scenarios. The assumption to apply this scenario approach is that farm number in the future may evolve within some frontiers, which might be generated from the historical cases experienced in the observed changes between 2010 and 2020 period.
The territorial determination of farm number is envisaged as an influence of various factors whose origin and roots are embedded in those territorial levels. The territorial levels in this study are defined as lowest – EU NUTS 3, intermediate – national and overarching – EU level. In a report prepared by Joint Research Centre of EU by Castillo et al [2] is also used the same territorial structure for analysis to “highlight selected key territorial facts and trends in EU rural areas at pan-European, national (NUTS 0) and regional (NUTS 3) level within 2015-2030”. The referred analysis is performed by applying the LUISA Territorial Modelling Platform of the EC to project baseline scenario on rural EU areas, which are perceived on NUTS 3 level in EU member states (MS).
It manifests that such territorial analysis, where the variables and indicators are set up on regional, national and pan-European level is corroborated. For the sake to apply territorial analysis, where to investigate the impact of factors acting on vertically laid territorial levels is important to keep in mind that those territorial levels are not starkly delimited. It means that NUTS 2 level is the lowest in this vertical layer structure whereas this level covers the determination and pressure coming from factors acting at NUTS 3 or underneath levels. The same should be considered in terms of overarching EU level, which represents the repercussions exerted interregional of international perspective. The analysis is not designated to study the factors determining the changes in the farm number across NUTS 2 EU level but assuming that farm number change between 2010 and 2020 Censuses at overarching EU level could be linear and national-wide change could be envisaged as relative dispersion change, the outcome for farm number at lowest NUTS 2 level could be expressed as resultative. This preposition is assumed and it is underlain for building up the estimation of farm number share changes between those 3 territorial levels and afterwards to project the farm number changes unto 2030.
Globally, there are more than 570 million farms, whereas about 84% of farms are smaller than 2 ha, and they operate about 12% of farmland [3]. The number of farms through the years is subject to a significant reduction, determined by various reasons, most of them related to economic performance of the countries’ economies. In countries at lower levels of income, the number of farms per capita is usually higher than countries where the labor remuneration and wealth of population is greater. It is also observed how smaller farms operate a far greater share of farmland than do smaller farms in the higher-income countries [3]. In a newer paper by Lowder et al [4], it is underlined farm sizes and the total number of farms change over time because of “population growth, agricultural development, land policies and other socio-economic and climatic factors”. Lowder et al [4] envisaged that worldwide farm number is over 608 million due to several reasons, where the most trivial is the wider country coverage cited within both papers.
In Bulgaria, there are a lot of agricultural economists (Koteva, Bachev, Ivanov, Nikolov, Chopeva, Doichinova, Krustev, Sarov, etc) who dedicate their studies to the issue of farm development and economic and other farm issues denoting the decrease in farm number and dualistic farm structure in Bulgarian agriculture. The situation does not change considerably after the Bulgarian membership in EU compared to previous pre-accession period despite at little improvement. As regards the last Agricultural Census (2020), it is turned out that 10% of farms in Bulgaria grow 83% of the Utilized Agricultural Land, which testifies the great contrast in the farm pattern. The structural transformations in Bulgarian agriculture during the EU membership are attributed to continuation of farm reduction, enhancement of their size, raise of their concentration and strengthening replacement of labor input by machinery and investments [5,6,7].
Regarding the EU farm trend, that is seen in most of the world, the number of farms is in downward dynamic, and “the remaining farming land is often acquired by larger farms” [8]. In 2020, there were almost 9.1 million farms across EU countries, estimated 3 million fewer farms compared to Census 2010 (a decline of about 25%). The changes in farm number are also bound to some transformations in farm structure with outmatching share of crop farming over livestock. In this relation, almost 58% of farms in 2020 are classified as specialist crop farms out of which 34% specialized in field crops, 22% in permanent crops and merely 2% in horticulture observed from Eurostat data [9]. It turns out that 22% of the EU’s farms are defined as livestock farms. The holding specialized in dairy are the most common type (5% of all farms), followed by meat units – cattle rearing, poultry, and sheep, goats and other grazing livestock, where each of them is with a presence of 4%.
The mixed specialized (crop and livestock) and various crops and livestock combined farms are reported to decline from a share of 13% in 2010 to about 12% in 2020, whereas one of the biggest drops between 2010 to 2020 is measured in farms specialized in poultry and ruminant livestock from about 5% each to less than 4%. It is found that between 1967 and 1997, the number of farms fell by 42% in the EU founding MS, whereas for EU-27 only in ten years span between 2010 – 2020 years, the farm number declines by 25%. It can be asserted farm restructuring and reduction in number often entail a join into EU and introduction of Common Agricultural Policy. For example, for the period 1975-1997, among the MS, which joined the EU in 1973 – “Ireland and Denmark lost relatively more farms than the founding members (35% and 52% respectively as against 29% for EU-6)” [10].
On the other hand, Bulgaria and Romania between 2007 and 2020 years lost roughly 73% and 28% of their farms, while Slovakia and Poland between 2005 and 2020 are subject to 71% and 47% decrease in farm number, threatening also the farm sustainability [11]. According to Schuh et al [12] the drivers of farm decline are primarily structural, economic and social, while the environmental factors have a smaller impact on farm number. Previous studies of drivers of farm structural change in the EU-27 suggest that the main determinant of farm structure is past farm structure [12]. The path dependency in economic development is a wide perceived theory, which can be prescribed in farm structural evolution as well.
Besides, Noack and Larsen [13] state that farmers earn higher and more stable incomes with increasing farm size while consumers suffer from lower and more variable food supply. More specifically, increasing farm size reduces the output per unit of land but larger farms have higher output per unit of labor. Larger farms may operate under different economic constraints and can hedge differently against risk compared to smaller farms [14]. It is asserted that relatively small farms may face lower economic risks due to less dependency from borrow capital but those farms are more vulnerable to price fluctuations and have less options to withstand revenue stagnation. It is also found out that output per unit of land declines with increasing farm size the reverse is true for farmers income and consumption [13], which means smaller farmers are more efficient per unit of land or any resource but they are not viable and efficient per farm due to high labor costs and low capital return.
Altogether, farming system is an important factor for a rural and territorial development. According to Mann [15], “a traditional agricultural system based on small family farms will not be an option for Eastern Europe, and it probably would not be desirable, either. But it should be considered to support farm structures in rural problem regions where added value per hectare is high and interdependencies with other local actors is strong”. The farming systems affect the territorial situation, as small farms and family farms are crucial for rural viability, where their number reduction across EU is seen as adverse effects for predominantly rural areas. For case of Romania, which has the highest number of farms in the Union, it is found out that “the individual rural household represents the basic element in the organization of the contemporary world, representing a way of existence that ensures the maintenance/preservation and functioning of the rural space” [16].
2. Materials and Methods
The main source of data to conduct this study is the Eurostat agricultural census database. The agricultural farm censuses are carried out in each 10 years and they are considered to make full, not extrapolated surveillance of farm structure and resource availability across EU member states. The censuses are envisaged to reveal the most accurate and overall picture of the farm development in the member states and contrarily to annual-base data are suitable to implement not time series factor and projection analysis.
The methodology for this analysis is set up on the Territorial Share-Shift Analysis (TSSA), which is found on the logical framework of the classical Share-shift analysis (SSA). The SSA is elaborated by Herzog and Olsen [17] and is designated to investigate the territorial share of impact rendered on certain industry driven by local, intermediate and national factors. The TTSA method is adopted and explored by Ivanov [18] and it is constructed to estimate the share of observed change in certain indicators allotted between three territorial levels: local, intermediate and overarching. In case of this study, the local level is set on NUTS 2 EU level, the intermediate level is based on national scale and overarching layer is set on EU level. The TSSA is run as a model where the change in the number of farms in EU level between both censuses 2010 and 2020 is linearly transposed down on local (NUTS 2 region) level. It predisposes that evolution in the farm number at NUTS 2 regional level should be linearly to dynamic on overarching EU level and the difference between real NUTS 2 farm number and estimated one is assumed to be prescribed to influence of acting local and intermediate (national) factors.
The concept of the methodology [18] is to ascertain and depict whereof those various factors play role on the changes of farm number at local (NUTS 2) EU level. The share of this influence is distributed between factors and drivers coming from EU and higher transnational level, national on each member states and local regional NUTS 2 and lower layer. The estimation algorithm is adopted and described by Ivanov [18] and includes following equations:
The variables comprised in the above-adopted formulas are Localt-1 – number of farms on local NUTS 2 EU level during the initial period 2010 (t-1), whereas Local t – the farm number at the same level in the next period 2020 (t). The other elements in the described equations are NS t – the figures out of farm number at the overarching EU level determined by Census 2020 (t), while IS t-1 – the number of farms at the intermediate territorial level for this study is defined national member state level in the initial time 2010. On the other side, IS t – the value of farm number at the same member state national level, which is identified in the second census 2020 period (t). In this case, , , are net changes in the farm number estimated between 2010 and 2020 at the three territorial levels: EU, national and local – NUTS 2 regions. The absolute changes in the farm number are calculated for each NUTS 2 EU region, where this change is distributed into shifts driven likely by factors from EU and upper level, national member states level or NUTS 2 and lower level. Afterwards the distributed shifts between impacts bound to those three territorial levels can be used to estimate the weights of each of those three territorial layers, which might be illustrated either in percents (up to 100%) or in ratio (up to 1).
In respect to estimating the changes’ share of farm number at NUTS 2 level noted between 2010 and 2020, a scenario projection is evolved to model the farm number at NUTS 2 level in 2030. The proportional extrapolation method is applied to project the farm number [19], which is based on the calculated value changes of the farm number ascertained between 2010 and 2020 distributed between EU territorial level, national member states and NUTS 2 local layer (, , The proportional extrapolation is very similar to the most popular linear extrapolation and is used when is assumed that there is reliable relationship between two or more variables. The proportional method is well-known in the statistical work with data and disaggregation adjustments. The proportional Denton method [20] and its modifications are accomplished as for filling up the missing data series and variables values but as well as for extrapolating the future forecasting values. The proportional extrapolation method for this study is consisted of following calculations:
After implementing above equations (4) or (5), the coefficients of proportional extrapolation are calculated. These coefficients are derived for each of the three territorial variables and represents the future proportional change of farm number taken into 2020 basis. It means the coefficients of proportional extrapolation (), which is expected to reveal the shift in the farm number between 2020 and 2030 at NUTS 2 EU level are derived conceiving the estimated changes of farm number distributed between the three territorial levels and the initial 2010 year . The projections for farm number in the future 10-year period, concurring with the next agricultural census () scheduled for 2030 is fulfilled through the following computation:
The formula (6) expresses the calculations of projections of farm number at NUTS 2 EU level to 2030, where are the three coefficients of proportional extrapolation, whose sum is multiplied to the historically reported farm number at last 2020 year (t). This formula is applied to project the NUTS 2 farm number for baseline (status-quo) scenario, whereas regarding the pessimistic and optimistic scenario is conceived a stochastic approach for deriving the coefficients for proportional extrapolation [21]. The equations for estimating the coefficients for proportional extrapolation under pessimistic and optimistic scenario are set up as:
The calculations of coefficients for proportional extrapolation assumed for optimistic and pessimistic scenarios () are characterized with little differences compared to status-quo scenario due to lack of stochastic variations. As regards the NUTS 2 and national levels are used equation (7), whereas the expressed formulas (8,9) are used to estimate the same scenarios on EU level because is sole value, which does not have stochastic options to project other scenarios. Primary, the overarching EU level is assumed to represent the absolute quantitative change of farm number caused by factors acting on EU and upper level, which alters in farm number on EU NUTS 2 regions by same and single proportion. The assumptions for optimistic and pessimistic scenarios are that for the optimistic scenario, it can be heighten up by the yield of maximal and the sum of same one and the average of PEC (), which is powered and afterward divided by same degree. Regarding the pessimistic scenario, the same estimation way is appropriated but the sum of minimal and is multiply by (-1) to reverse the correction, which is approached to derived on the status-quo scenario. This way for projecting predisposes that as higher is the within status-quo scenario so skewed will be the same coefficient for optimistic and pessimistic scenarios.
The implementation of stochastic analysis as well as fulfilling assessment of factor territorial share so as to measure the impact and changes driven by different territorial levels on EU farm evolution anticipates to be complemented by test for statistical significance. The most widespread test for checking the significance is z-test, which subserves for confidence level evaluation. The z statistics is expressed as:
The variables in the statistical significance test are farm number at EU NUTS 2 level in the both censuses conducted in 2010 and 2020 (), whereas is their standard deviation. The same formula for z-test is used in the scenario stage, where instead of farm number in the initial 2010 period is replaced by the projected farm number in 2030 for the status-quo scenario (). Regarding the significance check, an additional estimation shown in formula (11) is conducted [19]. The coefficient of confidence level (C) depends on the average of variation of farm number in each of the covered periods with their average divided to the same average () put under root square. This part of equation is divided by the root square of the count of NUTS 2 regions for each member state (N). Afterwards to get (C) the previous expression is lessened by 1 to range confidence coefficient within 0 to 1. The presumption behind formula 11 is that coefficient of confidence level is in dependence with the variation in the farm number through the observed period and because the confidence level of farm number is demonstrated at national level, it is in relationship with the NUTS 2 country count.
3. Results
3.1. Change in the Farm Number from 2010 to 2020
Although the applied methodology shows how the CAP influences reduce the agricultural holdings throughout the EU, there are also opposite phenomena, supported by national and, in some cases, specific regional policies.
3.1.1. Increased Number of Farms
The only member state with a positive confluence of circumstances regarding the number of farms is the Czech Republic, where an increase in the structures constituting the agricultural sector is observed in all the regions. Despite the possibility this to be referred only to juridical and just formal farm separation due to the subsidy threshold, that corresponds to a 4.6% raise in the farm sustainability [21]. The total increase in the national structure exceeds 6 thousand agricultural units, which represents 26.5% compared to the base year. The regional support outweighs the negative influence of national policy (Figure 1), leading to an increase in the composition of agricultural structures in the country from 14% (Northeastern region) to 50% (Southeastern). These processes are supported precisely by regional factors, which are in opposition to the implemented national policy, which has a negative impact.
Similar trends are visualized in individual regions in some member states (MS). In several regions of Germany (6 out of 38) and Spain (2 out of 17), as well as a single region of Portugal, Slovakia and the capital of Belgium, national policies are helping to ensure a positive outcome and an increase in the number of agricultural entrepreneurs.
Member states with a positive regional impact accompanied by a negative national one represent 33.3% of the EU-27. Some regional policies have an impact in the majority of EU members (44.4%), but the distribution of forces acting in the opposite direction, not in favor of farmer`s diversity and not leading to a positive development in the parameters studied. MS with extremely negative impact at regional, national and central level are 22.2%.
3.1.2. Decrease Between 50% and 75%
Considering the overall negative impact of the CAP on the farm number at the EU level from 2010 to 2020, the decrease is by about 3 million or a share up to 25%. This process is most noticeable in Bulgaria (64.2%) and Hungary (59.4%) as a share (Table 1), forming a group where the decrease is between 50% and 75%. The absolute value of entrepreneurs who left the business is 237 740 and 339 590, respectively, or about 20% on EU level altogether.
The individual Bulgarian planning regions where relative share of change varies between 61% and 70%. According to this research, the negative impact at the regional level is slightly weaker than the national one, and the EU impact is even more significant in the other four areas. In the case of Hungary, the influence is proportionally divided – the weakest is at regional level, while the national level is a bit weaker than the European central impact.
3.1.3. Decrease Between 25% and 50%
The next crucial category of decrease is the most noticeable in absolute values, between 25% and 50%. Even the percentage of Romanian (25.2%) and Italian (30.3%) left farms is not that impressive, behind these ratios lie significant scale of structural changes – the Balkan country lost about a million farmers, while this figures out almost half a million in Italy. The share of both countries represents the half of disappeared agricultural units on the EU`s map of producers. Five Italian regions could be characterized as receiving a positive influence by regional factors, but not enough to stop the declining tendency, so there is no Italian region that has a positive change in the number of farms. Local forces do not support Romanian regions that are positively affected by the national policy. The opposite forces are acting on three regional entities. The rest of Romanian territory has a total negative impact.
Between 60 and 90 thousand farmers abandoned their livelihoods in Croatia (38.3%) and Lithuania (33.9%), while in Malta and Estonia is about 40%. The influence of both the national and the regional frameworks on the Croatian Adriatic region is positive, while on the Continental part all forces act negatively. The decrease in Lithuanian is 34%, the negative influence of regional factors is more significant than the national one. Among the EU countries that have suffered the most from CAP is Estonia – after the ominous 42% decrease in the already small number of the country`s farms remain only 11 370 while in Malta the impact of regional factors is less significant than the national policy.
The losses suffered by the sector in Greece are also crucial. Those leaving the industry characterized by small family units are 26.6% or 192 thousand units. The most regions of the country face a negative relation to the studied components. Local policies support the expansion of farms in 4 out of 13 regions. In two cases, the national policy operates in optimistic directions, while another two are supported by unidirectional power.
The relative shares are similar in the cases of Finland, the Netherlands and Austria. The corresponding losses are up to 20 thousand in the northern countries, while the Alpine lost nearly 40 000. The Scandinavian country with the smallest farms has two regions positively influenced by the national policy, without particular significance of the negative influence on the reduction trend. There are two Netherland regions affected by a positive regional force appears but in both cases without positive national impact, which is applied on the main country part, without the support of regional factors. This leads to a decrease in agricultural organizations in all the Dutch regions. Some regional forces manage to mitigate the CAP impact on the Austrian farms` number in three areas, while in other four – national policy has a positive impact. In both cases is observed a moderate decrease in the farm number, compared to regions with a stronger negative impact.
3.1.4. Decrease Between 10% and 25%
Within the group between 10% and 25%, Poland stands out as the most severely affected. Behind 13.6% stand over 205 000 farms. The most affected is the Silesian region, where all the studied influences are negative and, accordingly, the reduction of economic units is the most significant (27%). In the rest areas, the decline is limited to about 20%.
France lost about 126 thousand units covering the share of 24.5%. The only regional exceptions are significantly distant from the European continent. Regional influence reflects positively on 10 (45.5%) of the country's regions and in three cases the national policy has a favorable impact. The latter also applies to another three areas, where the regional forces are negative. The only region without changes in the farm number is Corsica.
Germany has the highest number of planning regions in the EU and the negative impact of government measures affected slightly over 12% or 36 700 units. This is mitigated by actions at a regional level. There are some specific exceptions as Hamburg, but despite this collaboration, the rates of reduction in farm number are very serious. An exception is the Berlin region, where the influence of all administrative levers is negative and the decline is the most significant – 29%. Sweden – between 7% and 22%, farms are decreasing in different regions, with no exceptions in the direction of the forces acting on these processes.
The share of lost farms in Latvia is 17% where methodology determines two separate influence coefficients - the regional act positively, while the national – negatively.
In Slovakia and Cyprus, entrepreneurs who have oriented their interests in other sectors are just over 4 800 with respective shares of 19.8% and 12.4%. In Denmark this number is slightly less – 4 280 or 10.3%.
About 15% is the rate of farms remaining outside the business in Belgium and Luxembourg, and the corresponding values are 6 870 and 320. All the Belgium regions have a negative impact by the national regulatory framework. In contrast, regional forces act to relief the reduction of economic entities. An exception is the capital region, where the number of farms increases 3 times, from 20 to 60.
3.1.5. Up to 10% Decrease
Despite the small share of decrease, the group of up to 10% represents Spain where about 75 000 organizations and 15 000 in Portugal (5%) left the agricultural business. Spain has only three regions influenced negatively by all the powers, while in the rest regional policy acts positively. In Murcia, the government's positive action could not succeed to increase the farm number. However, this happened in two areas due to a regional influence. Portugal has a positive regional impact but the national is negative. However, there is a region that increases the number of farmers by 3%.
Slovenia and Ireland are the countries with the least long-term impact, the decline is around 3%, and the absolute values are respectively 2.16 and 4.82 thousand holdings.
3.2. Forecast Towards 2030
The forecasting results are presented in different groups based on the direction and significance of the coefficients obtained in the different scenarios – positive or negative. Two main groups and several exceptional cases were obtained. The exceptions are in 23% (6 out of 27) of the EU member states and represent the more interesting part of the results obtained.
An exceptionally positive trend in the projected number of farms in all three scenarios is found only in the Czech Republic, for all regions of the country. This is the only case in the EU where an increase in the number of farmers is predicted in all three scenarios, potentially reflecting an increase in farm sustainability. In the optimistic, to over 40 000 farms (+38%), considering by 2020 their number is close to 30 000. In the pessimistic scenario, to over 30 000 (+5%) and the baseline scenario assumes a 21% increase to nearly 35 000 farming structures (Figure 2).
Figure 2.
Forecasting European Union farm number– projection towards 2030 on NUTS 2 level, baseline scenario.
Figure 2.
Forecasting European Union farm number– projection towards 2030 on NUTS 2 level, baseline scenario.
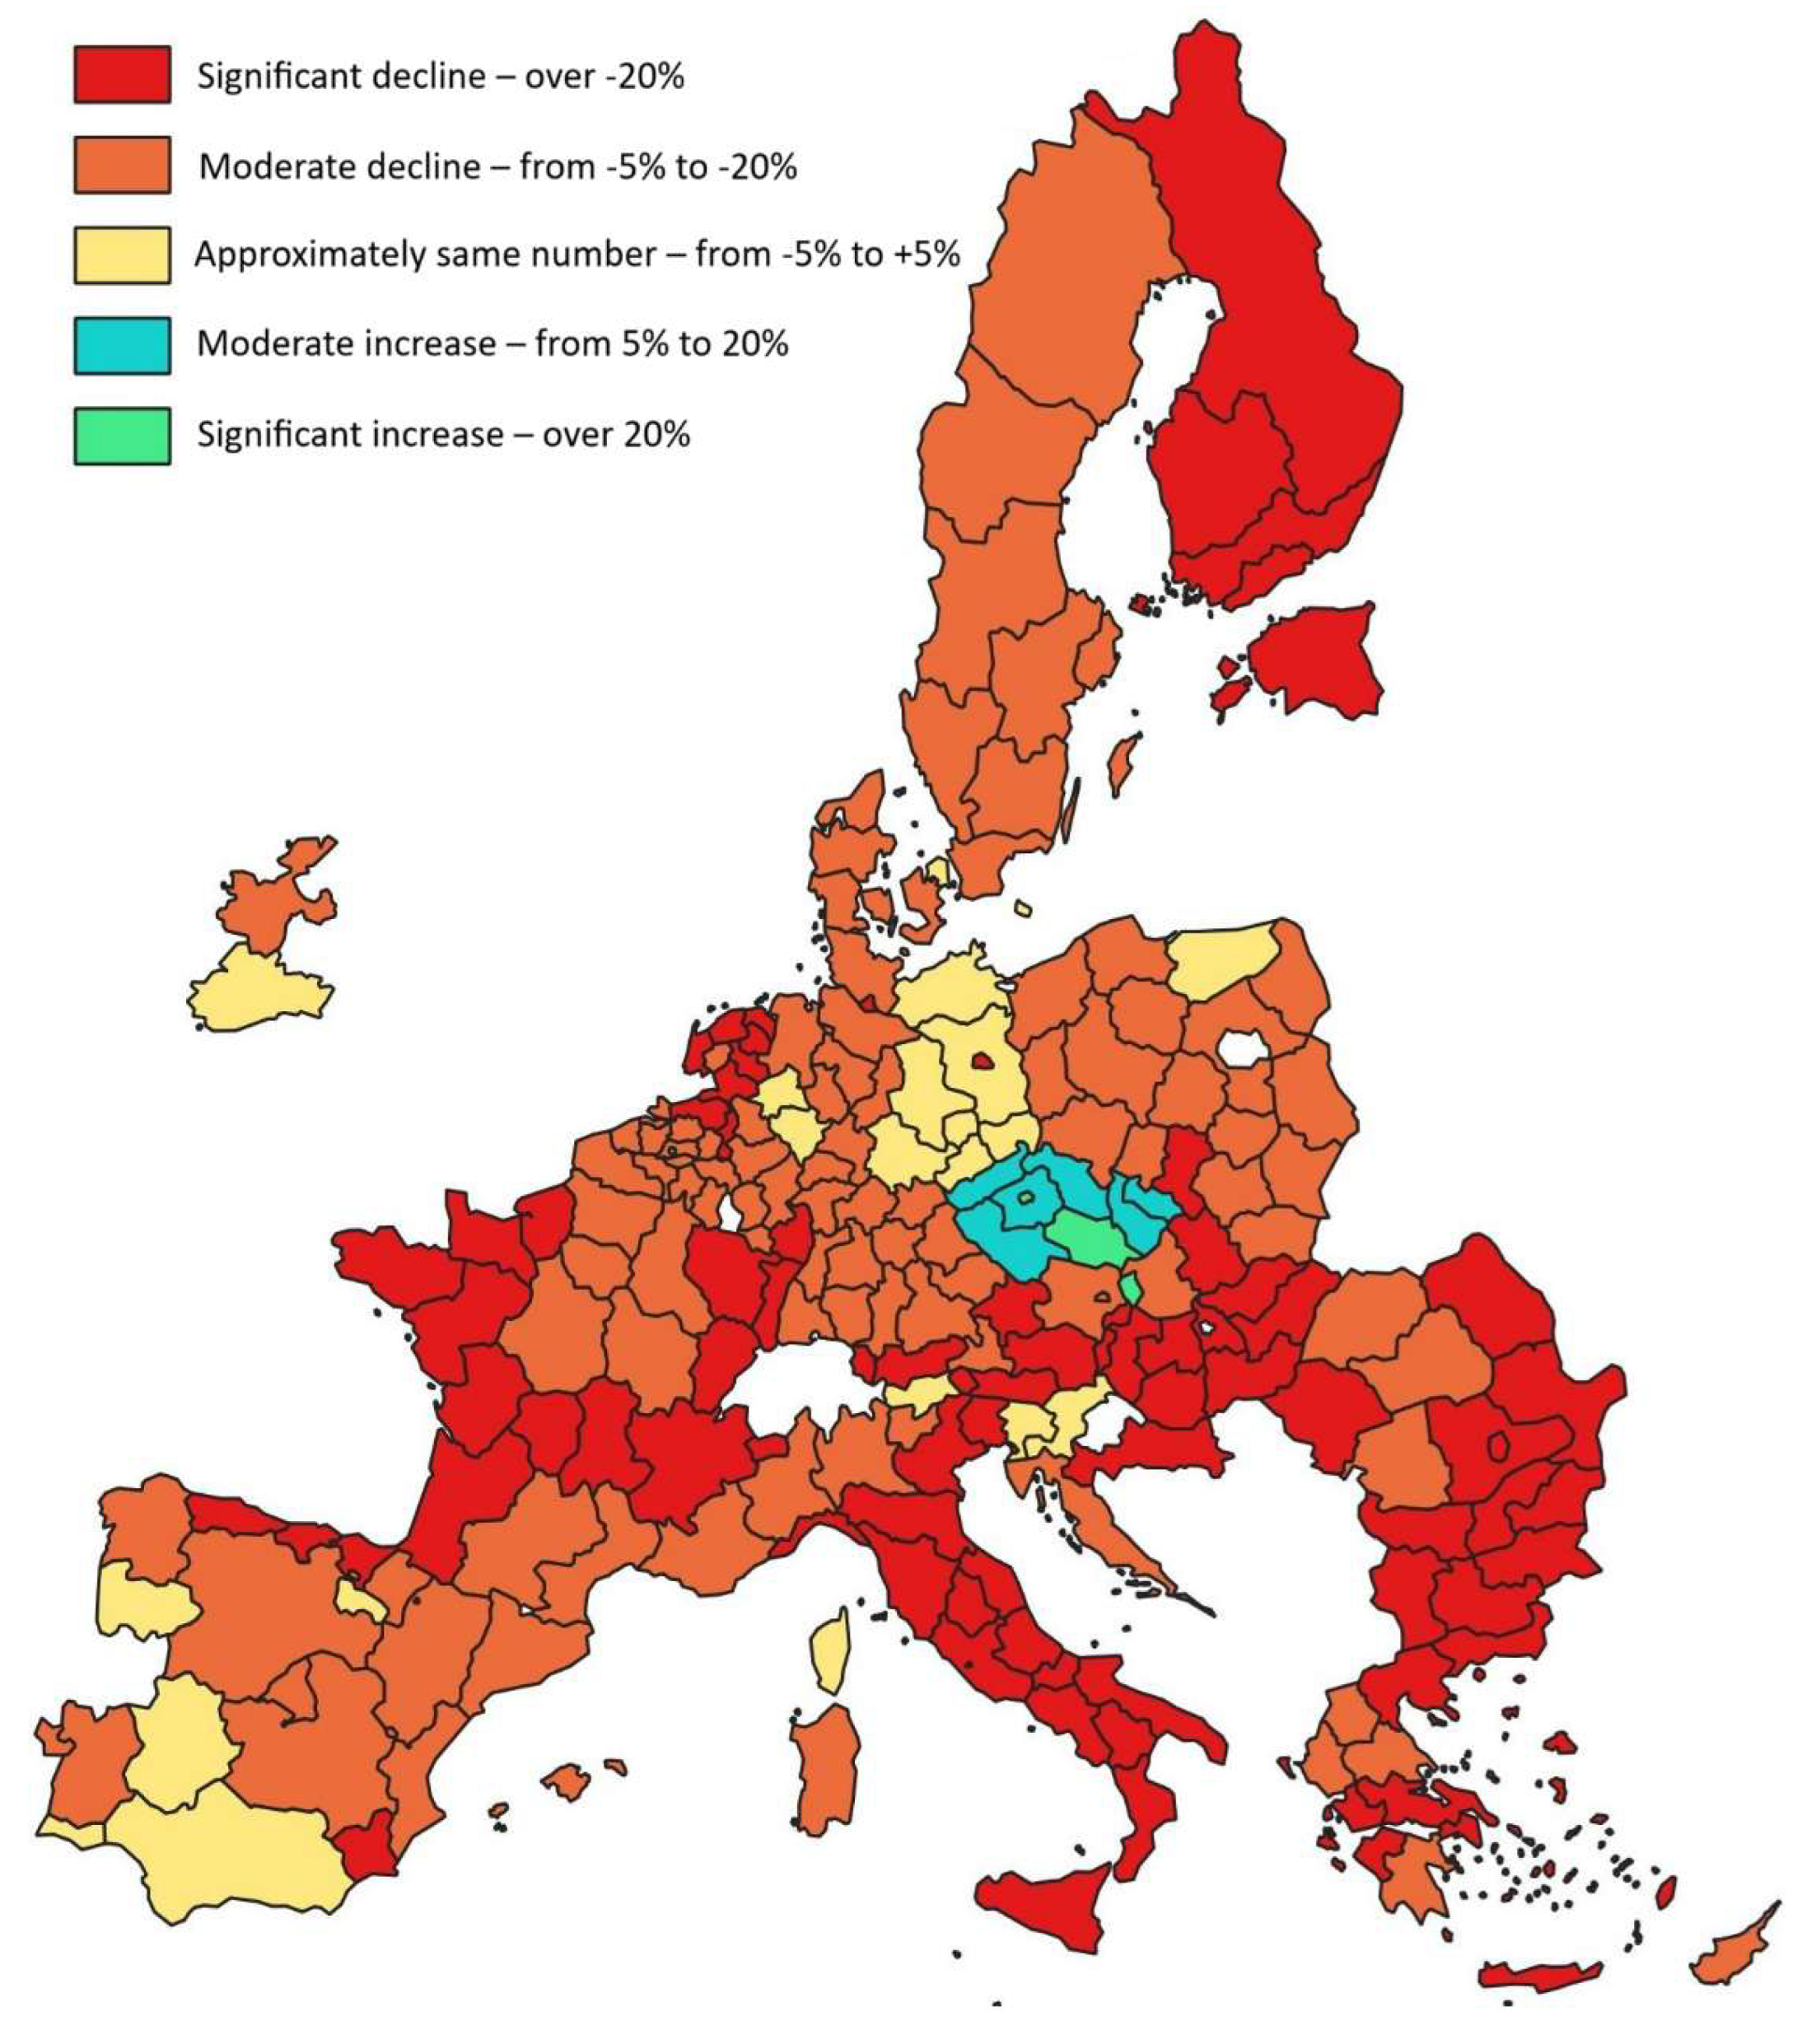
Source: Own calculations
The other distinct group is that of member states which have extremely negative development and prediction for all three scenarios to 2030. In terms of the relative value of the change, a decrease of up to 70% can be predicted. This applies most particularly to Bulgaria in the pessimistic scenario, while Croatia, Hungary, Estonia, and Malta could lose nearly half or even more of their agricultural structures under such circumstances.
The scenario of maintaining the status quo, the number of farmers is expected to decrease by 30% to 50%. In Hungary, this is equivalent to 100 000 farms, in Croatia more than 42 000, and in Bulgaria more than 70 000 farms. In the cases of the other two countries, the relative share is just over 30%, which corresponds to nearly 4 000 farming organizations in Estonia and over 2 000 in the small island MS. Under optimistic circumstances, a serious decline in agricultural entrepreneurship is again expected. In Hungary, this would lead to the loss of nearly 70 000 farms (-29%), Croatia – over 17 000 (-12%), Bulgaria – around 50 000 (-37%), while in the other two countries the projected decline is around 15% – 1 000 farmers in the case of the island MS and twice as many in the Baltic state. The remaining (majority) member states scenarios can be categorized into two groups.
The first group, the largest one, to which nearly half of the member states belong (13 out of 27, or 48%), is made up of countries that received a positive assessment for the development of the examined variable in the optimistic scenario – a projected increase of 15%–16%. The pessimistic scenario claims the decline in farm number is limited to a reasonable range of 15% to 30%. In the baseline scenario, a relatively low decrease in the number of active farmers – within the range of up to 15%.
If the negative trend intensifies and pressure on agricultural producers continues, this group would also be seriously affected. In smaller countries such as Belgium, Denmark, and Slovakia, estimates indicate a loss of 6 000 to 10 000 farms, which are among the largest production structures in the EU. Under such circumstances, Sweden and Latvia would lose a further 17% of their farmers – 16 000 and 19 000 producers respectively. With positive policy measures, these two countries could benefit 3 000 new entrepreneurs, while Belgium, Denmark, and Slovakia could gain 2 000, 4 000, and 1 000 new units, respectively.
The realization of the optimistic scenario would have the most significant impact in countries with numerous agricultural organizations (Table 2), such as Poland and Spain, where a potential increase in their number would lead to the emergence of over 100 000 farms, while in Germany, Portugal, and Ireland, this scenario could mean the emergence of 25 000, 43 000, and 21 000 new farms, respectively.
The second group is defined by relatively moderate negative structural changes and includes 30% of member states (8 out of 27). In a highly negative scenario, the number of decision-making units decreases mostly within the range of 30% to 50%; in a realistic scenario, the range of decrease is between 15% and 30%, and in the optimistic by up to 15%.
In the optimistic scenario, the algorithm predicts a minimal reduction of the economic structure of France, Austria, and Finland – between 2 000 and 3 000 units. On the other hand, the results for the other two scenarios differ significantly in terms of quantity, with differences in the pessimistic scenario of 134, 17, and 50 thousand farms, respectively. This category includes the highest farm diversity MS in the EU – Romania where all the scenarios predict decline in farm number. This country is characterized by the smallest farms, while the huge crop farms are becoming increasingly common, and in fact are the largest in the EU averaging 2 500 ha in the largest economic class – over 500 000 Standard Output [23]. This type of farms is typical only in the new MS. Low added value, intensive use of a wide range chemical fertilizers and plant protection products, requiring a depleting soil fertility are usual also in Bulgaria, Hungary, Slovakia, and the Baltic MS. The optimistic scenario predicts a change within 2.5%, which is equivalent to 72 177 farmers, while in a highly negative scenario, this figure would reach over 1 million production organizations.
4. Discussion
The evidence presented in this study calls into question the assumption that structural transformation in the European Union agricultural holdings follow a standardized process of farm consolidation. Although the dominant direction is clearly towards a reduction in the farm number, the intensity, spatial distribution and policy sensitivity of this process differ substantially across Member States and, even more importantly, across regions. The results therefore point towards a differentiated model of structural change, in which European, national and regional forces interact rather than functionate independently.
4.1. Farm Structural Change as a Differentiated European Process
The decline in the number of farms is a common European trend, but its intensity and scale vary significantly among the Member States. According to Neuenfeldt et al. [25] there is “a strong path dependency” and the structural evolution in EU farming is highly contingent on historical precedents, as past organizational frameworks account for most contemporary differences, reflecting a long-term rigidity in farm scale and specialization. Agricultural frameworks in new MS (EU-12) evolve more rapidly than those in old MS (EU-15), while historical continuity accounts for nearly half of the structural shifts in the EU-15, it influences only about 20% of the EU-12, a disparity driven by the transformative impacts of recent EU integration and ongoing economic transitions.
In a report from 2023 [26], Eurostat concludes the farm number decrease in 2020 compared to 2005. It summarizes the regional specifics and priorities for crop and livestock farming specializations heavily reflect regional climates and conditions where the weather allows Eastern and Mediterranean nations to focus primarily on crops like grains, fruits, and olives, with crop specialist farms making up the majority in Southern EU. Conversely, Northwestern Europe leans heavily toward animal agriculture, with livestock farms dominating the agricultural landscape in Luxembourg, Ireland, and the Netherland. In general, it is reported a decrease of 37% in the farm number on overall EU level to 9.1 million farms.
The future of European agriculture should not be assessed simply by whether the number of farms increases or decreases, but by what type of agricultural structure emerges after such a transformation. Data indicates that although enhanced agricultural performance as higher labor productivity, which drives the rural economic growth, its effect on reducing rural poverty remains minimal while achieving sustainable rural development demands comprehensive and integrated political frameworks [27]. These policies must look beyond modern productivity incentives and technical innovations to actively support underperforming regions through targeted funding, capacity building, and structural transformation. Transitioning from subsistence to commercial agriculture requires robust infrastructure, business education, secured legal frameworks, reliable capital, and political stability; while this shift drives economic growth and feeds urban populations, it removes the environmental and economic safety net that traditional subsistence farming provides to rural societies [28].
4.2. Regional Heterogeneity and the Role of National and Regional Policies
One-third of the Member States experience positive outcomes from regional agricultural policies despite facing negative impacts at the national level. While specific regional initiatives influence most EU countries, opposing dynamics often counteract these efforts, undermining farmer diversity and hindering progress across the evaluated metrics. Additionally, nearly a quarter of member states suffer highly detrimental effects across all three levels: regional, national, and central.
Czechia represents a significant exception to the common EU trend. Between 2010 and 2020, the number of agricultural holdings increased by approximately 26.5%, making it the only Member State in the dataset to record a positive change within the studied period. This development contrasts with the substantial reductions observed in most other Member States and suggests that national and regional conditions may play an important role in shaping farm structural dynamics under the Common Agricultural Policy framework.
Bulgaria and Hungary represent the most noticeable relative decrease in the EU farm structure where the change is around and above 60%. According to this study, that phenomenon is mostly driven by the influence of the EU policies and less by national and regional level.
In absolute numbers, Italy and Romania represent the highest number of farms that left the agricultural production structure. Both Member States experienced substantial declines in agricultural units, losing one million and a half farmers, which together account for half of all disappeared agricultural entrepreneurs in the European Union. While a few regions in both countries showed localized resilience or policy support, overall structural trends and opposing forces resulted in net declines across all Italian regions and the majority of Romanian territory.
4.3. Farm Consolidation, Family Farming and Generational Renewal
Farmland consolidation is accelerating across many European Union nations, as evidenced by the growing dominance of large-scale operations in both total farm count and their share of the utilised agricultural area. While this concentration is most pronounced in the Central and Eastern Member States, it is also highly advanced in major Western agricultural economies, including Germany, Denmark, and France [29]. However, this systemic decline in smaller holdings and their associated farm area poses severe challenges for the generation of public goods. Although large operations can effectively deliver certain environmental services, maintaining a diverse network of smaller farms remains essential for sustaining rural vitality, preserving cultural heritage, protecting biodiversity, and maintaining traditional landscapes. Consequently, the presence of smaller agricultural holdings functions as a vital defense mechanism against the economic stagnation and rapid depopulation of rural communities and “their presence is a fundamental element of the counteracting against depopulation of rural areas and their social and economic degradation” [29].
Kostov and Davidova [30] find out early-stage EU accession accelerates technological change, serving as the primary driver of productivity growth for family farms. However, this momentum eventually stagnates and reverses as farms encounter structural growth constraints. In later development phases, CAP support induces an endowment effect, shifting the growth engine toward resource accumulation. This capital deepening helps bridge the technological deficit, potentially capitalizing farms sufficiently to catalyze a subsequent wave of technological innovation and output growth.
European Commission reports that the young farmers in the European Union manage larger and economically superior holdings compared to older generations, driving modernization and farm consolidation [31]. Despite their vital role in technology adoption and higher educational attainment, young managers face severe demographic imbalances and high entry barriers such as capital restrictions and land competition caused less or more by the farm consolidation itself. Eurostat sets out that family farms account for the overwhelming majority of agricultural holdings in the EU, representing approximately 93% of all farms in 2020 and highlights a rapid shift toward specialization and consolidation within EU agriculture while mixed farming experiencing the sharpest decline [32]. This structural evolution is characterized by the several changes in farm types: mixed farms decreased by 2.6 million, marking the most drastic decline as agriculture moves away from diversified, small-scale subsistence farming; livestock specialist farms decreased by 1.6 million, reflecting intensification and scale concentration in animal production; crop specialist farms decreased by 0.9 million, showing the lowest relative reduction among the three, as specialized crop production remains highly viable [32]. This trend directly connects to the role of young farmers, who typically take over or establish larger, highly specialized, and commercially oriented holdings rather than traditional mixed farms [32], but they form only 11.9% of the EU agricultural managers in 2020, at age up to 40 years [33], who used to be 11% in 2016 [34].
After the transformation and land consolidation, CAP and farms continue not to distribute adequate income to the entrepreneurs and the involved working force. Furthermore, although direct payments account for 25% of factor income in the EU and nearly 50% of farmers' income in mountainous areas—while also supporting viability in the most remote regions and contributing to a 15% rise in productivity—agricultural incomes still lag significantly behind the average wage in the economy [35].
In the final report on the CAP impact, the European Commission summarizes Ireland`s proposal as key measures designed to improve generational renewal and management [36]. The proposal expects a long-term transition starting with a succession of the farm partnership that utilizes a dynamic, inverse-proportional profit and subsidy allocation matrix between an older farmer and a younger farmer featuring a dynamic, multi-year profit-sharing model. Young Farmer should start with a high share of EU installation aid and low farm profit; over time, installation aid declines while their share of farm profit increases, while older farmer starts with high farm profit; as their profit share decreases, it is systematically replaced by dedicated retirement support. The generational renewal agenda, mentioned in the report, continues with enhanced subsidiarity and member state empowerments, regulatory enforcement of national reserve entitlements, holistic structural support for the aging agrarian demographic and finishes with retention of rural development within the CAP architecture.
Fundamentally, this integrated framework demonstrates that successful generational renewal in European agriculture cannot be achieved by focusing on youth installation alone; rather, it requires an equitable, decentralized policy matrix that simultaneously secures the socioeconomic dignity of retiring farmers and safeguards the dedicated funding structures of the rural hinterland. To optimize generational renewal, the Common Agricultural Policy should leverage the comprehensive territorial reach and program synergies of Local Development Companies, formalizing their collaborative approach within frameworks like Project Ireland 2040 to ensure generational support is explicitly targeted across all rural communities [36].
4.4. Alternative Trajectories Towards 2030
CAP interacts with pre-existing structural, demographic and territorial conditions and may reinforce, mitigate or redirect structural change.
The three scenarios reveal varying degrees of structural vulnerability. The baseline suggests a 19% decline in the total number of EU farms, the optimistic tends a stabilization, while the pessimistic reveals the whole threat and the sectoral vulnerability (−37%). The Czech Republic is once again the exception, while Bulgaria, Hungary, Croatia, Estonia, and Malta represent the other end of the spectrum; and Romania is a unique case characterized by a massive structural base that is nonetheless continuing to shrink.
The exceptionally strong contraction observed in Bulgaria and Hungary suggests that farm exit is not merely a continuation of the EU-wide consolidation process, but reflects a particularly vulnerable structural configuration in which negative forces operate simultaneously at national and regional levels.
Future EU rural development policies should replace uniform frameworks with targeted interventions tailored to distinct agricultural clusters to meet 2030 climate and cohesion targets, while the CAP strategies should focus on structural reforms and green skills in lagging regions, capital reinforcement in transitioning economies, and agri-tech sustainability solutions in high-performing nations [37]. The Member States should focus on improving and strengthening administrative skills and policy alignment as institutional capacity, which allows the Common Agricultural Policy to match local needs and foster inclusive, sustainable and fair development [38].
Wimmer et al. [39] found that smaller production units might be more affected by the climate change extremums than larger units, both in a period of the severe event through consecutive subsequent years and proposed a production shift from cereals and oilseeds toward root crops as a measure to adapt to future climate risks.
Neuenfeldt et al. [40] reveal that initial agricultural conditions or path dependency account for approximately 39.2% of structural transformations in the EU agriculture. The remaining variance is primarily driven by environmental factors at 18.3%, alongside agricultural subsidies and farm income at 13.2%, and concluded that their data indicates that older EU Member States exhibit a significantly less adaptable farm structure than newer Member States.
4.5. Policy Implications and Limitations
4.5.1. Policy Implications
The results have several implications for agricultural policy. The substantial differences in farm number dynamics across Member States and regions suggest a uniform approach to structural change may have limited effectiveness. Although the overall tendency towards a reduction in the number of farms is evident, the magnitude of this process varies considerably, while some regions and Member States show a capacity to maintain or even increase the number of agricultural holdings. Policy interventions should therefore account for differences in initial farm structure and territorial conditions rather than focusing exclusively on aggregate EU trends.
Results indicate that farm-number decline should not be interpreted automatically as an undesirable policy outcome. Structural adjustment may reflect the movement of land and production resources towards economically more viable farms. Consequently, agricultural policy should not aim simply to preserve the maximum possible number of holdings. Instead, greater attention should be paid to the quality and sustainability of structural change, including the economic viability of remaining farms, opportunities for new entrants, generational renewal and the maintenance of an appropriate degree of farm diversity.
Strong regional differentiation identified in the analysis points to the importance of territorially targeted policy implementation. In several cases, regional influences appear to mitigate negative national or European tendencies. This suggests that rural development measures and other locally adapted interventions may play an important role in determining how farms respond to broader structural pressures.
Strengthening the territorial dimension of agricultural policy could therefore help address situations in which national level measures are insufficient to prevent excessive farm exit. The results also have implications for generational renewal. The continuing reduction in farm number, particularly in countries experiencing strong structural contraction, makes the entry and retention of younger farmers increasingly important. Policies supporting young farmers should therefore be considered together with measures addressing access to land, investment, farm income and the broader economic attractiveness of rural areas. Supporting entry alone may be insufficient if the structural and economic conditions do not allow new farms to remain viable.
The scenario analysis suggests that future farm structures may respond substantially differently under alternative policy and economic conditions. The large difference between the optimistic, baseline and pessimistic projections should not be interpreted as a precise forecast, but rather as an indication of the potential sensitivity of farm structural development to changing conditions. This supports the use of scenario-based approaches in agricultural policy planning and suggests that early intervention may be particularly important in Member States and regions where structural decline is already pronounced.
4.5.2. Study Limitations
Several limitations should be considered when interpreting the findings. The analysis focuses primarily on changes in the number of agricultural holdings. Farm number is an important indicator of structural change, but it does not capture all dimensions of agricultural restructuring. Changes in utilised agricultural area, average farm size, standard output, labour productivity, farm income or land concentration may occur simultaneously with changes in the number of holdings. A reduction in farm number therefore cannot be interpreted as an equivalent reduction in agricultural production capacity or economic performance.
The interpretation of the European, national and regional influences should not be understood as demonstrating direct causal effects of individual CAP measures. Farm structural changes is a result of multiple interacting factors, including economic conditions, demographic processes, land markets, technological development, natural conditions and agricultural policy. The results identify differences in the direction and amplitude of the influences represented in the analytical framework, but they do not isolate the causal contribution of each individual policy instrument.
The comparison of Member States should be interpreted with caution because the initial structure of agricultural sectors differs substantially across countries. A given percentage reduction may correspond to very different absolute numbers of farms and may have different economic and social implications. This is particularly relevant when comparing countries with very large numbers of small holdings, such as Romania, with Member States characterised by a smaller number of substantially larger farms.
The projected 2030 results represent conditional scenarios rather than deterministic forecasts. The optimistic, baseline and pessimistic projections illustrate possible trajectories under different assumptions about the factors incorporated into the model. They should therefore be interpreted as an assessment of the range and direction of potential structural change rather than as exact predictions of the number of farms that will exist in 2030.
This study would benefit from further research incorporating farm entry and exit, farm size, land concentration, age structure and generational succession at the regional level. Such an extension would make it possible to distinguish more clearly between different forms of structural change and to assess whether a reduction in farm numbers represents economically beneficial consolidation, demographic driven farm exit, or a combination of both.
The policy objective should not be the preservation of farm number, but the governance of structural change in a way that maintains economically viable farms, supports generational renewal and avoids excessive territorial concentration. The analysis identifies structural relationships and scenario outcomes, but does not establish the causal effect of individual CAP instruments on farm exit.
5. Conclusions
Given the methodology used and its characteristic of maintaining the trend in the development of the number of agricultural production units from the previous (already observed) period, the realistic scenario presents a less intense projection of the change in the number of farms from 2020 compared to 2010.
It can be assumed that the status quo trend may materialize (with a probability of 24%), followed by the realization of one of the other scenarios (potentially after 2028–2029). This could be assumed in the event of global changes, where there is some potential and which we may eventually observe and which may influence the internal policies implemented by the countries. Therefore, the forecasts are presented in such a way as to reflect this hypothesis for the development of agricultural production units, even if the period is not entirely accurate.
If the optimistic scenario is triggered, the number of farms should start to increase shortly before 2030, as a result of which, at a certain point, agricultural units will increase in specific sub-sectors producing small-scale, high-quality products (traditional production) and generating high added value.
On the other hand, the optimistic scenario assumes an increase in the total number at EU level, albeit minimal.
The pessimistic scenario represents a realistic projection and a reinforcement of the devastating policy pursued by the European Commission, clearly observed in Bulgaria and particularly affecting the new member states. This process is also evident in the way the EU implements the CAP, which in practice demonstrates a policy against the diversity and uniqueness of farmers and their production, traditions, and the heritage of rural soci-eties. One of the new instruments proving this assertion is the new European framework restricting the free exchange of genetic production material [24] in favor of the international trading corporations that provide propagation materials, seedlings and seeds pursuing a market dominance.
Author Contributions
H.B., B.I. and V.K. contributed equally to this work, but the supervision is dedicated to the first author, and individual contributions are 34:33:33. All authors have read and agreed to the published version of the manuscript.
Funding
This publication, elaborated under the project “Sustainability of Bulgarian Agricultural Holdings from Vulnerable Sectors and the Influence of the Institutional Environment”, is acknowledging the financing received by the Bulgarian National Science Fund under the project № КП-06 М96/3 from 9 December 2025.
Institutional Review Board Statement
Not applicable.
Informed Consent Statement
Not applicable.
Data Availability Statement
Available upon request.
Conflicts of Interest
The authors declare no conflicts of interest.
Abbreviations
The following abbreviations are used in this manuscript:
| (T)SSA | (Territorial) Share-Shift Analysis |
| NUTS 2 | Directory of open access journals |
| EU | European Union |
| EC | European Commission |
| LUISA | Land Use Integrated Sustainability Assessment |
| MS | Member State |
| CAP | Common Agricultural Policy |
References
- Janovska, V.; Simova, P.; Vlasak, J.; Sklenicka, P. Factors affecting farm size on the European level and the national level of the Czech Republic. Agric. Econ. – Czech. 2017, 63, 1–12. [Google Scholar] [CrossRef]
- Castillo, C.; Kavalov, B.; Ribeiro, R.; Diogo, V.; Jacobs-Crisioni, C.; Batista e Silva, F.; Baranzelli, C.; Lavalle, C. “Territorial facts and trends in the EU rural areas within 2015-2030”. JRC Technical Reports, , EUR 29482 EN, Publications Office of the European Union. Pp. 70. 2018. Available online: https://www.researchgate.net/publication/333508141_Territorial_Facts_and_Trends_in_the_EU_Rural_Areas_within_2015-2030.
- Lowder, S. K.; Skoet, J.; Raney, T. The number, size, and distribution of farms, smallholder farms, and family farms worldwide. World Dev. 2016, 87, 16–29. [Google Scholar] [CrossRef]
- Lowder, S.; Sanchez, M.; Bertini, R. Which farms feed the world and has farmland become more concentrated? World Development, 142, Pp. 15. 2021. Available online: https://www.sciencedirect.com/science/article/pii/S0305750X2100067X?via%3Dihub.
- Beluhova-Uzunova, R.; Shishkova, M.; Hristov, K. Bulgarian agricultural structure and prospects post-2023. Sci. Pap. Ser. Manag. Econ. Eng. Agric. Rural Dev. 2023, 23(2). [Google Scholar]
- Bachev, H.; Koteva, N.; Ivanov, B.; Mitova, D.; Terziev, D.; Sarov, A.; Boevsky, I.; Kostenarov, K.; Marinov, P.; Chopeva, M.; Dimova, N.; Stoyanova, N. Konkurentosposobnost na Bulgarian Fermi”. Institute of Agricultural Economics, pp. 170. 2023. Available online: https://www.iae-bg.com/.
- Institute of Agricultural Economics. Analiz na sastoyanieto na selskoto stopanstvo i hranitelno-vkusovata promishlenost – SWOT analiz, pp. 532. 2020. Available online: https://www.mzh.government.bg/media/filer_public/2020/01/21/analiz_na_sstoianieto_na_selskoto_stopanstvo_i_khranitelno-vkusovata_promishlenost_izgotven_ot_institut_po_agrarna_ikonomika.pdf.
- Kryszak, Ł.; Guth, M.; Czyżewski, B. Determinants of farm profitability in the EU regions. Does farm size matter? Agric. Econ. – Czech. 2021, 67, 90–100. [Google Scholar] [CrossRef]
- Eurostat. Database data on EU farm census 2010 and 2020. 2025. Available online: https://ec.europa.eu/eurostat/web/main/data/database (accessed on 24 September).
- Vidal, C. Thirty years of agriculture in Europe. Farm numbers declining as farms grow in size. Agriculture and Fisheries, Theme 5 – 1/2000. 2000. Available online: https://www.researchgate.net/publication/23510077_The_Depopulation_of_Rural_Areas_and_the_Farming_System.
- Krustev, V. Assessment of the ЕU market farms sustainability based on a composite sustainability index. Bulg. J. Agric. Sci. 2023, 29(4), 597–604. [Google Scholar]
- Schuh, B.; et al. Research for AGRI Committee – The Future of the European Farming Model: Socioeconomic and territorial implications of the decline in the number of farms and farmers in the EU; European Parliament, Policy Department for Structural and Cohesion Policies: Brussels, 2022. [Google Scholar]
- Noack, F.; Larsen, A. The contrasting effects of farm size on farm incomes and food production. Environmental Research Latter Volume 14. Pp. 15. 2019. Available online: https://www.researchgate.net/publication/334101975_The_contrasting_effects_of_farm_size_on_farm_incomes_and_food_production.
- Rosenzweig, M.; Binswanger, H. Wealth, weather risk and the composition and profitability of agricultural investments. Econ. J. 1993, 103, 56–78. [Google Scholar] [CrossRef]
- Mann, S. The depopulation of rural areas and the farming system. EAAE seminar “From households to firms with independent legal status: the spectrum of institutional units in the development of European agriculture”. Pp. 10. 2004.
- Chitea, L.; Dona, I. The Romanian rural household from sustainable rural development perspective. Scientific Papers Series Management, Economics Engineering in Agriculture and Rural Development. Volume 18, Issue 1. 2018; Issue 1.
- Herzog, H.; Olsen, R. Shift-share analysis revisited: The allocation effect and the stability of regional structure; Oak Ridge National Laboratory, 1977; Available online: https://onlinelibrary.wiley.com/doi/abs/10.1111/j.1467-9787.1977.tb00514.x.
- Ivanov, B.; et al. “Overview of European policy in agriculture. Approaches and research methods”. In B. Ivanov, R. Popov, D. Mitova, Ts. Harizanova, D. Toteva, et al. “Outlook to Bulgarian agriculture and rural areas in the context of CAP 2021-2027 and Recovery Plan of EU. Institute of Agricultural Economics. Pp. 5-25. (Bg). 2022. Available online: https://www.iae-bg.com/.
- Ivanov, B. Projections for territorial distribution of farms in Bulgaria till 2030 entailed by the Green Deal. Bulg. J. Agric. Econ. Manag. 2024a, 69(4), 3–13. [Google Scholar] [CrossRef]
- Denton, F. Adjustment of Monthly or Quarterly Series to Annual Totals: An approach based on quadratic minimization. J. Am. Stat. Assoc. 1971, 66, 99–102. Available online: https://www.researchgate.net/publication/254424075_On_the_Extrapolation_with_the_Denton_Proportional_Benchmarking_Method. [CrossRef]
- Ivanov, B. Stochastic modeling in production of oilseed crops in Bulgaria in the context of Green Deal. Bulg. J. Agric. Econ. Manag. 2024b, 69(3), 3–14. [Google Scholar] [CrossRef]
- Krustev, V. Economic Size and Sustainability of Agricultural Holdings. Doctoral dissertation, Institute of Agricultural Economics, Agricultural Academy, Sofia, Bulgaria, 2024. [Google Scholar]
- Farm Accountancy Data Network (2025). Public Database data on farm economic and business activity. Available online: https://agridata.ec.europa.eu/extensions/FADNPublicDatabase/FADNPublicDatabase.html (accessed on 07 August).
- Ministry of Agriculture. Ordinance 3 from 10 May 2023 on the conditions and procedure for implementing interventions in the form of direct payments included in the Strategic Plan, on checks, reductions in payments and the procedure for imposing administrative sanctions (BG). 2023. Available online: https://dv.parliament.bg/DVWeb/showMaterialDV.jsp?idMat=188420.
- Neuenfeldt, S.; Gocht, A.; Heckelei, T.; Ciaian, P. Explaining farm structural change in European agriculture: A novel analytical framework. Eur. Rev. Agric. Econ. 2019, 46(Issue 5), 713–768. [Google Scholar] [CrossRef]
- Eurostat. EU farms: 5.3 million fewer in 2020 than in 2005. 2023. Available online: https://ec.europa.eu/eurostat/web/products-eurostat-news/w/ddn-20230403-2 (accessed on 9 September 2026).
- Herman, E. Changes and Challenges in EU Agricultural Holdings and Their Impact on Rural Development. Land 2025, 14(5), 1080. [Google Scholar] [CrossRef]
- Hansen, H.O. Structure of Agriculture. In Megatrends in Agriculture, Food Industry and Food Markets. Palgrave Advances in Bioeconomy: Economics and Policies.; Palgrave Macmillan: Cham, 2024. [Google Scholar] [CrossRef]
- Daniłowska, A. Changes in European Union Farm Structure and Their Multidimensional Implications. Acta Sci. Pol. Oecon. 2018, 17(4), 31–40. [Google Scholar] [CrossRef]
- Kostov, P.; Davidova, S. Common policy but different outcomes: Structural change in family farms of central and east european countries after their accession to the EU. Agriculture 2021, 11(11), 1074. [Google Scholar] [CrossRef]
- European Commission. Young Farmers in the EU – Structural and Economic Characteristics. EU Agricultural and Farm Economics Briefs, Brief No. 15, October 2017. Directorate-General for Agriculture and Rural Development, Unit Farm Economics, 2017. Available online: https://agriculture.ec.europa.eu/system/files/2019-11/agri-farm-economics-brief-15_en_0.pdf (accessed on 9 September 2026).
- Eurostat. Most of the 9.1 million farms in the EU are family-run. European Commission. 2023. Available online: https://ec.europa.eu/eurostat/web/products-eurostat-news/w/ddn-20231024-2 (accessed on 9 September 2026).
- Eurostat. Regions in Europe – 2025 edition: Agriculture. European Commission, ISBN 978-92-68-29247-1, ISSN 2600-3368. 2025. Available online: https://ec.europa.eu/eurostat/web/interactive-publications/regions-2025#agriculture (accessed on 9 September 2026). [CrossRef]
- European Commission. CAP performance 2014–20: A summary of CAP performance and impact across the EU. Generational renewal. Directorate-General for Agriculture and Rural Development. 2021. Available online: https://agriculture.ec.europa.eu/common-agricultural-policy/cap-overview/pmef/cap-performance-2014-20_en (accessed on 9 September 2026).
- European Commission. Report to the European Parliament and the Council on the implementation of the common monitoring and evaluation framework including an assessment of the performance of the common agricultural policy 2014–2020. 2021. Available online: https://eur-lex.europa.eu/legal-content/EN/TXT/PDF/?uri=CELEX:52021DC0815 (accessed on 9 September 2026).
- European Commission. CAP Objective 7: Generational renewal in agriculture. Directorate-General for Agriculture and Rural Development. 2025. Available online: https://agriculture.ec.europa.eu/vision-overview/generational-renewal_en#a-new-generation-for-europes-farms (accessed on 9 September 2026).
- European Commission. Evaluation of the impact of the CAP on generational renewal, local development and jobs in rural areas – Final report. Directorate-General for Agriculture and Rural Development, OIR, ADE s.a, CCRI, Bunnen, P. v. Publications Office, 2019. Available online: https://op.europa.eu/en/publication-detail/-/publication/4bd0b0a2-0503-11ea-8c1f-01aa75ed71a1/language-en (accessed on 9 September 2026).
- Herman, E. Changes and Challenges in EU Agricultural Holdings and Their Impact on Rural Development. Land 2025, 14(5), 1080. [Google Scholar] [CrossRef]
- Wimmer, S.; Stetter, C.; Schmitt, J.; Finger, R. Farm-level responses to weather trends: A structural model. Am. J. Agric. Econ. 2023, 106(3), 1241–1273. [Google Scholar] [CrossRef]
- Neuenfeldt, S.; Gocht, A.; Ciaian, P.; Heckelei, T. Structural Change in European Agriculture. Contribution presented at the XV EAAE Congress, “Towards Sustainable Agri-food Systems: Balancing Between Markets and Society”. 2017. Available online: https://ageconsearch.umn.edu/record/261141/.
Figure 1.
Forecasting European Union farm number– projection towards 2030 on NUTS 2 level, baseline scenario. Source: Eurostat – Agricultural Census
Figure 1.
Forecasting European Union farm number– projection towards 2030 on NUTS 2 level, baseline scenario. Source: Eurostat – Agricultural Census
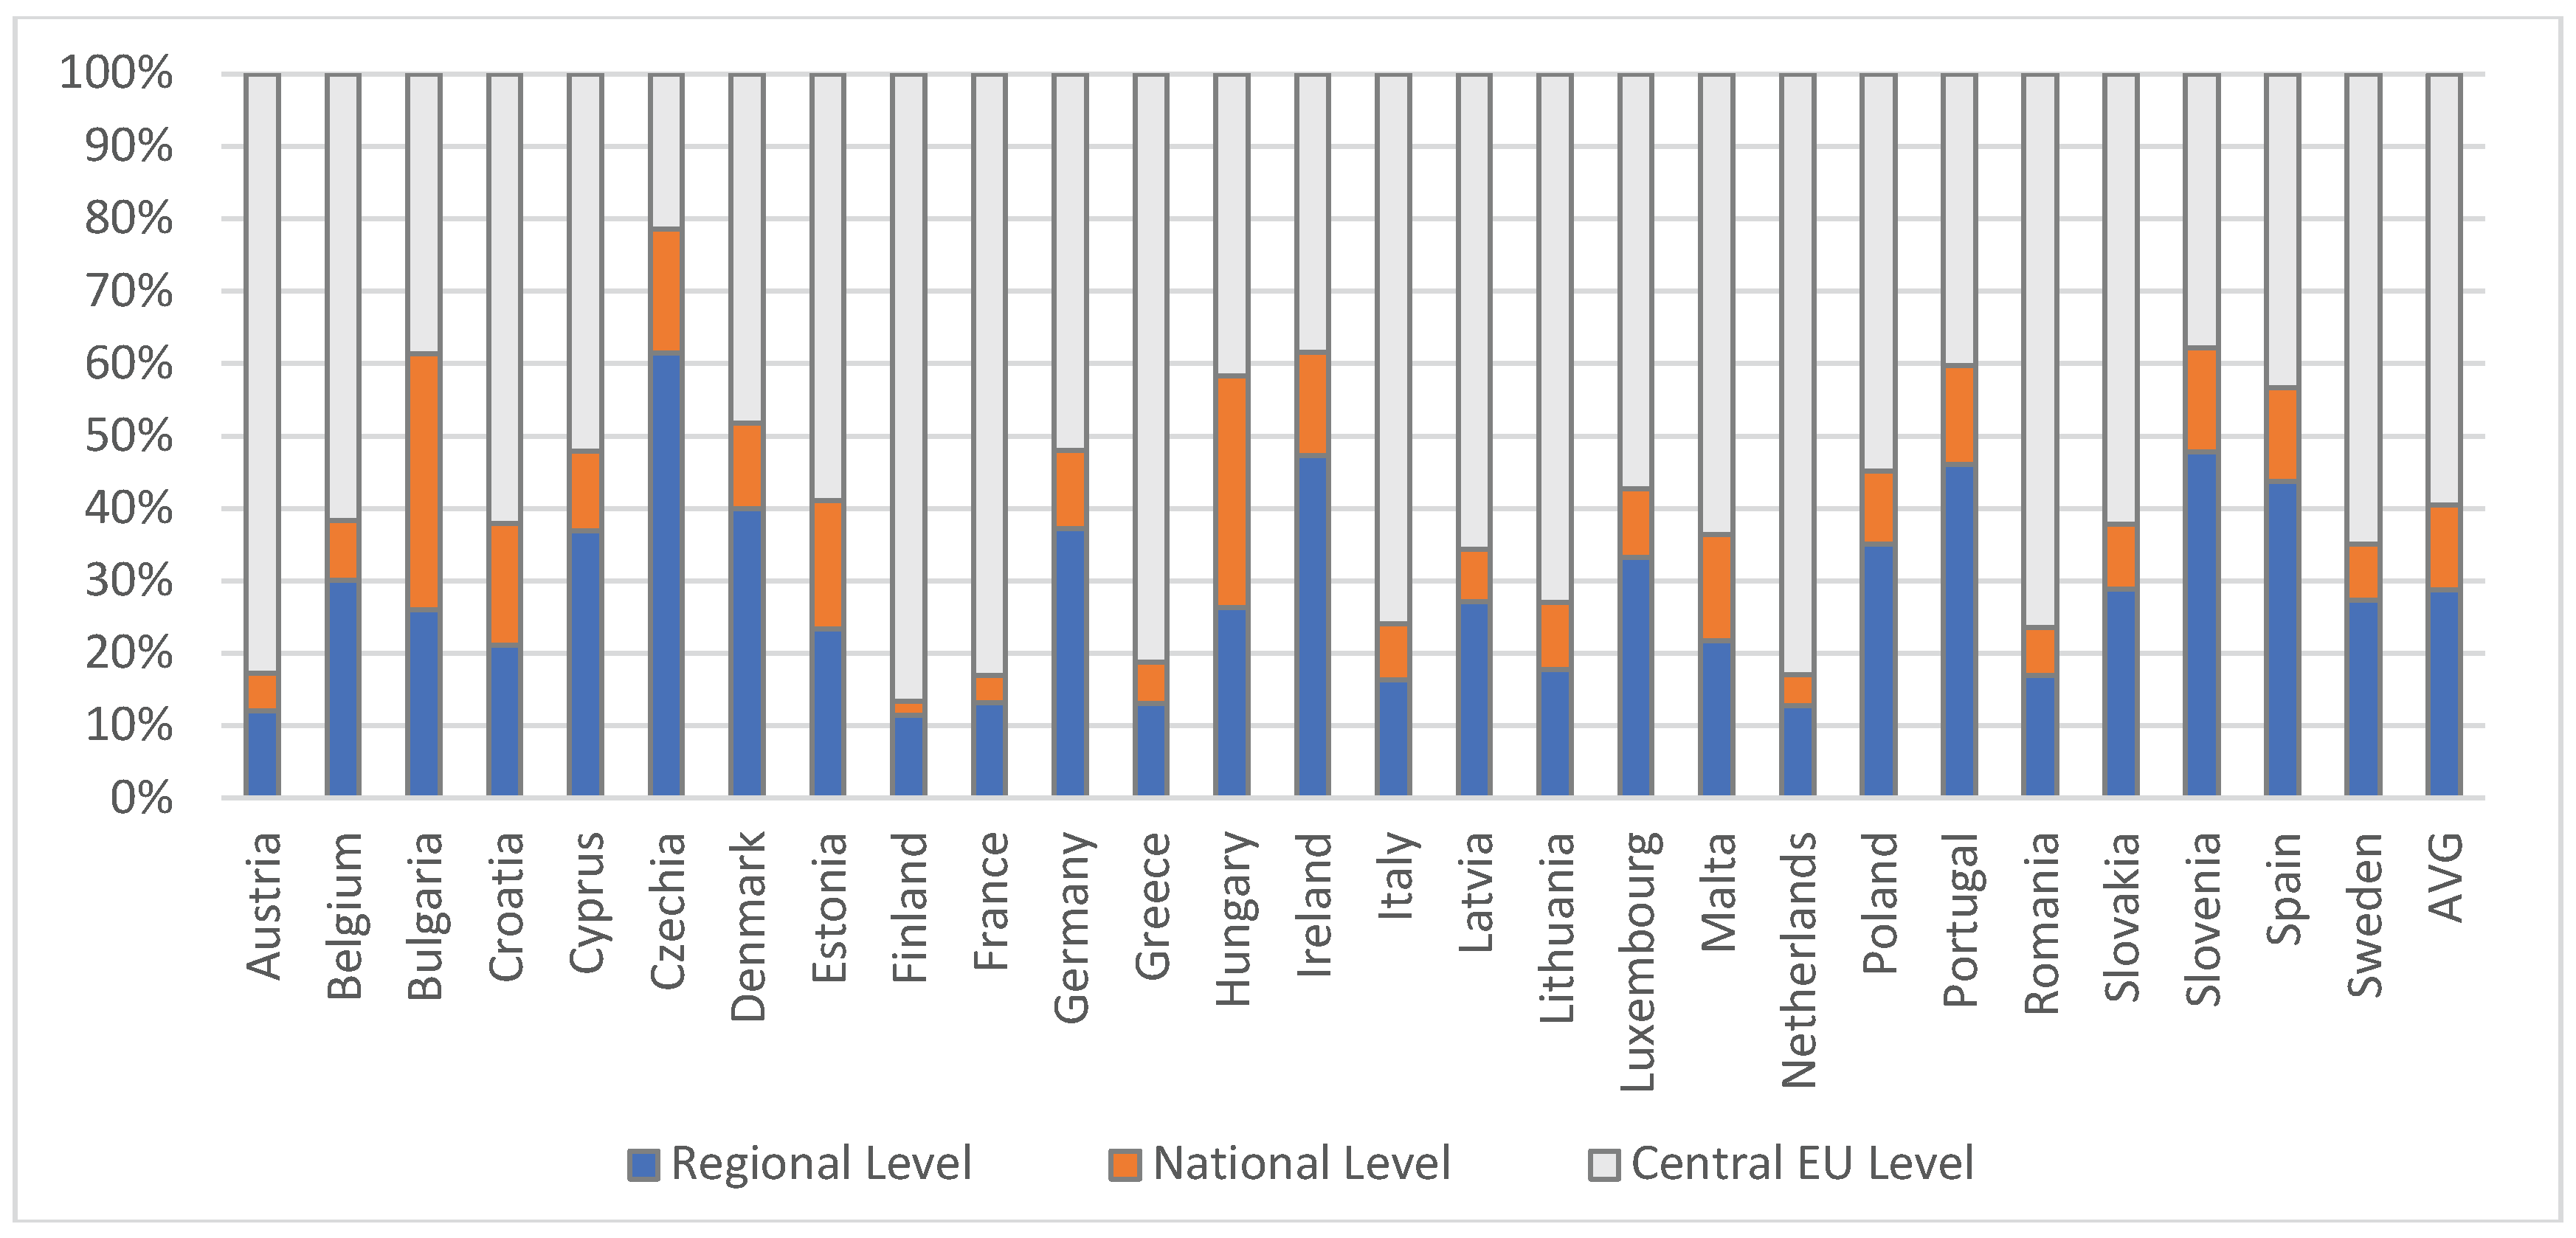

Table 1.
Change in farm number from 2010 to 2020.
| Member State | Farm Number 2010 (thousand farms) |
Standard Deviation 2010 (regional) | Farm Number 2020 (thousand farms) |
Standard Deviation 2020 (regional) | Change in Farm Number |
|---|---|---|---|---|---|
| Austria | 150.17 | 12617 | 110.79 | 9131 | -26% |
| Belgium | 42.86 | 2563 | 35.99 | 1936 | -16% |
| Bulgaria | 370.49 | 22691 | 132.74 | 9505 | -64% |
| Croatia | 233.28 | 62230 | 143.92 | 24303 | -38% |
| Cyprus | 38.86 | - | 34.05 | - | -12% |
| Czechia | 22.86 | 1650 | 28.91 | 2216 | +26% |
| Denmark | 41.37 | 3664 | 37.09 | 3058 | -10% |
| Estonia | 19.61 | - | 11.37 | - | -42% |
| Finland | 63.87 | 8978 | 45.63 | 5576 | -29% |
| France | 516.11 | 12449 | 389.21 | 9113 | -25% |
| Germany | 299.18 | 5498 | 262.54 | 4675 | -12% |
| Greece | 723.07 | 29285 | 530.64 | 23332 | -27% |
| Hungary | 571.66 | 34311 | 232.06 | 16564 | -59% |
| Ireland | 139.86 | 3950 | 135.037 | 14224 | -3% |
| Italy | 1620.9 | 66626 | 1130.54 | 44519 | -30% |
| Latvia | 83.39 | - | 68.98 | - | -17% |
| Lithuania | 199.91 | - | 132.08 | - | -34% |
| Luxembourg | 2.2 | - | 1.88 | - | -15% |
| Malta | 12.53 | - | 7.65 | - | -39% |
| Netherlands | 72.33 | 3488 | 52.65 | 2435 | -27% |
| Poland | 1506.64 | 59370 | 1301.49 | 43005 | -14% |
| Portugal | 305.26 | 42051 | 290.23 | 33698 | -5% |
| Romania | 3859.04 | 239969 | 2887.07 | 171872 | -25% |
| Slovakia | 24.47 | 3337 | 19.63 | 1976 | -20% |
| Slovenia | 74.64 | 16060 | 72.48 | 6153 | -3% |
| Spain | 989.77 | 60447 | 914.91 | 63433 | -8% |
| Sweden | 71.09 | 4948 | 58.8 | 3806 | -17% |
| Total | 12061.47 | - | 9062.32 | - | -25% |
Source: Eurostat – Agricultural Census.
Table 2.
Forecasting scenarios inf EU`s farm number to 2030. Source: Own calculations
| Member State | Baseline scenario (thousand farms) |
Change in Baseline scenario | Optimistic scenario (thousand farms) | Change in Optimistic scenario | Pessimistic scenario (thousand farms) | Change in Pessimistic scenario |
|---|---|---|---|---|---|---|
| Austria | 86.52 | -22% | 106.74 | -4% | 66.29 | -40% |
| Belgium | 31.34 | -13% | 37.91 | 5% | 24.77 | -31% |
| Bulgaria | 60.43 | -54% | 84.66 | -36% | 36.19 | -73% |
| Croatia | 98.25 | -32% | 124.52 | -13% | 71.97 | -50% |
| Cyprus | 30.51 | -10% | 36.73 | 8% | 24.29 | -29% |
| Czechia | 34.30 | 19% | 39.58 | 37% | 29.02 | 0.4% |
| Denmark | 33.80 | -9% | 40.57 | 9% | 27.03 | -27% |
| Estonia | 7.21 | -37% | 9.29 | -18% | 5.14 | -55% |
| Finland | 34.46 | -24% | 42.79 | -6% | 26.13 | -43% |
| France | 309.43 | -20% | 380.49 | -2% | 238.38 | -39% |
| Germany | 235.84 | -10% | 283.77 | 8% | 187.91 | -28% |
| Greece | 413.54 | -22% | 510.41 | -4% | 316.66 | -40% |
| Hungary | 118.70 | -49% | 161.06 | -31% | 76.33 | -67% |
| Ireland | 129.51 | -4% | 154.16 | 14% | 104.85 | -22% |
| Italy | 842.00 | -26% | 1048.39 | -7% | 635.61 | -44% |
| Latvia | 59.24 | -14% | 71.83 | 4% | 46.64 | -32% |
| Lithuania | 93.08 | -30% | 117.20 | -11% | 68.97 | -48% |
| Luxembourg | 1.65 | -12% | 2.00 | 6% | 1.31 | -30% |
| Malta | 5.05 | -34% | 6.45 | -16% | 3.66 | -52% |
| Netherlands | 40.56 | -23% | 50.17 | -5% | 30.95 | -41% |
| Poland | 1155.23 | -11% | 1392.83 | 7% | 917.63 | -29% |
| Portugal | 275.68 | -5% | 328.67 | 13% | 222.70 | -23% |
| Romania | 2287.95 | -21% | 2815.02 | -2.5% | 1760.89 | -39% |
| Slovakia | 16.69 | -15% | 20.28 | 3% | 13.11 | -33% |
| Slovenia | 69.78 | -4% | 83.01 | 15% | 56.55 | -22% |
| Spain | 857.53 | -6% | 1024.56 | 12% | 690.51 | -25% |
| Sweden | 50.49 | -14% | 61.23 | 4% | 39.76 | -32% |
| Total | 7378.77 | -19% | 9034.30 | 0% | 5723.24 | -37% |
Disclaimer/Publisher’s Note: The statements, opinions and data contained in all publications are solely those of the individual author(s) and contributor(s) and not of MDPI and/or the editor(s). MDPI and/or the editor(s) disclaim responsibility for any injury to people or property resulting from any ideas, methods, instructions or products referred to in the content. |
© 2026 by the authors. Licensee MDPI, Basel, Switzerland. This article is an open access article distributed under the terms and conditions of the Creative Commons Attribution (CC BY) license.
Copyright: This open access article is published under a Creative Commons CC BY 4.0 license, which permit the free download, distribution, and reuse, provided that the author and preprint are cited in any reuse.