

Submitted:
22 September 2026
Posted:
22 September 2026
You are already at the latest version
Abstract
Security authorization relies on a target security profile that is relatively stable, whereas threats, exposure, control health, and assessment evidence change continuously. We present a two-stage decision-support model that separates operational remediation from structural insufficiency of an already authorized profile. The first stage tests whether an assurance-adjusted authorization-risk index can be restored to tolerance using admissible actions while the profile remains fixed. Only when this problem is infeasible does the second stage generate a minimum-burden candidate profile for assessment and reauthorization. The model defines an authorization envelope, preserves mandatory requirements, distinguishes candidate from authorized states, and treats any structural profile revision as a reauthorization event. In a 365-day synthetic critical-infrastructure benchmark with 100 paired Monte Carlo replicates, the proposed strategy averaged 0.27 days above the benchmark risk tolerance and 1.43 risk-driven profile revisions, compared with 0 days and 9.06 revisions for direct event-driven reoptimization. Ablation and sensitivity analyses support the role of the remediation-first boundary while identifying assumed control effectiveness as the main source of model uncertainty. The results support frequent reassessment but selective, explainable profile revision. This study is a computational proof of concept and does not replace legal authorization or empirical cyber-range validation.
Keywords:
security authorization
; target security profile
; critical information infrastructure
; continuous monitoring
; cyber risk
; profile adaptation
; reauthorization
1. Introduction
Security authorization is performed with respect to a defined system state, a documented set of security requirements, and evidence that those requirements have been implemented and assessed. For the purposes of this study, a target security profile is the documented set of security requirements selected for a system, while security authorization is the formal governance decision, under the applicable regime, concerning operation on the basis of assessed risk and supporting evidence. For brevity, we use authorized profile to mean the target profile currently in force as part of the system’s authorization basis; this shorthand does not imply that the profile itself is the legal object of authorization. The system itself does not remain static after authorization. Software is updated, assets and external connections change, identities and privileges are modified, new vulnerabilities are disclosed, threat intelligence evolves, security controls degrade, and evidence may become incomplete or stale. This problem is particularly consequential for critical information infrastructure (CII), where a cybersecurity incident can disrupt not only confidentiality or data integrity but also the availability of an essential operational function, the continuity of a public or industrial service, and, in cyber-physical settings, safety-related processes.
Current standards and regulations increasingly emphasize lifecycle monitoring and risk-proportionate reassessment. The National Institute of Standards and Technology (NIST) Risk Management Framework (RMF) treats authorization as part of a system life cycle and supports ongoing authorization and event-driven reauthorization when changes are significant enough to affect risk [1]. NIST Special Publication (SP) 800-137, Information Security Continuous Monitoring for Federal Information Systems and Organizations, defines continuous monitoring as a process for maintaining visibility of assets, threats, vulnerabilities, and the effectiveness of implemented controls so that risk can be reassessed as conditions change [2]. The NIST Cybersecurity Framework (CSF) 2.0 likewise distinguishes current and target profiles and links the target state to context, priorities, and risk [3]. In the European context, the second Network and Information Systems Directive (NIS2) requires technical, operational, and organizational measures proportionate to risk and calls for evaluation of their effectiveness [4].
Ukraine has recently introduced a profile-oriented security-authorization model for state information resources and CII. Law No. 4336-IX and Cabinet of Ministers Resolution No. 712 establish a sequence in which risk assessment informs baseline, sectoral, and target security profiles and the applicable security-authorization process [5,6]. Resolution No. 1799 and related requirements further define cybersecurity-state assessment, including evaluation against applicable target-profile requirements [7,8]. The current catalog for selecting protection measures is defined by the Ukrainian Normative Document on Technical Information Protection (NDTZI) 3.6-006-24, whereas NDTZI 2.3-025-24 defines the methodology for assessing implementation of those measures; these two documents serve different functions and are treated separately in this paper [9,10]. Working English translations of Ukrainian regulatory terms are used where no official English text is available.
Continuous monitoring, ongoing authorization, event-driven reauthorization, and risk-adaptive security controls are not new concepts. Prior adaptive-security work adjusts controls or configurations according to current risk, context, or system state [11,12,13,14,15]. Optimization of security-control portfolios by risk and cost is also well established [16,17,18,19]. The unresolved question addressed here is narrower and governance-specific: when a currently authorized target profile is exposed to a new risk state, should the organization execute or restore controls that are already authorized, or is the profile itself structurally insufficient and therefore in need of revision and reauthorization?
This distinction matters because a high-priority vulnerability or a transient control failure does not automatically imply that the authorized profile is inadequate. If the profile already requires vulnerability monitoring, flaw remediation, boundary protection, appropriate authentication, logging, incident response, and change management, the correct response can be rapid operational execution of those requirements. By contrast, a new remote-access path, a new supplier relationship, a material architecture change, or a regulatory requirement may create a risk scenario that the current profile does not cover even when every existing control is fully implemented. We therefore use operational insufficiency for a state in which the required protective capabilities are already represented in the current profile but their operation or supporting evidence must be restored, and structural insufficiency for a state in which no admissible restoration of the current profile can return authorization risk to tolerance, or the profile omits a newly mandatory requirement. Treating both situations as the same structural event can create unnecessary profile churn, repeated assessment activity, and repeated reauthorization workload.
The central research question is therefore:
How can a dynamic authorization process formally distinguish risk that can be restored to tolerance within the current authorized target security profile from structural insufficiency of that profile, and, in the latter case, determine the minimum-burden candidate revision that should enter assessment and reauthorization?
We address this question through four research questions (RQs):
- RQ1.
- How can the structural sufficiency of an already authorized target profile be formally determined as threats, vulnerabilities, architecture, control health, evidence quality, and mandatory requirements change?
- RQ2.
- When the current profile is structurally insufficient, how can a minimum-burden candidate revision be generated while preserving mandatory requirements and limiting unnecessary governance burden?
- RQ3.
- Can operational remediation be separated formally from events that require profile revision and reauthorization?
- RQ4.
- Does a remediation-first event-driven strategy reduce time above risk tolerance relative to periodic strategies without causing the high profile-revision frequency of direct event-driven reoptimization?
The contributions are as follows. First, we formalize a two-stage decision boundary between operational insufficiency and structural insufficiency of an already authorized profile. Second, we define an authorization envelope, i.e., the set of system states from which acceptable assurance-adjusted authorization risk can be restored without changing the current profile. Third, we formulate a minimum-burden candidate-profile problem whose weighted objective combines profile distance, relative change cost, and continuing operational burden while preserving mandatory controls and restricting elevated-risk adaptation to additions. Fourth, we distinguish operational control health from the quality of evidence available for an authorization decision, thereby avoiding the interpretation that missing evidence physically changes the underlying cyber risk. Fifth, we evaluate the decision logic using reproducible Monte Carlo experiments, paired statistical comparisons, ablation tests, parameter and model-form sensitivity analyses, and a synthetic scalability stress test.
The scope is deliberately narrower than a complete theory of target-profile lifecycle governance. Initial profile tailoring, inheritance, formal role assignment, version registries, rollback, superseding, and retirement are important lifecycle concerns, but the present study focuses on the adaptive-maintenance loop between an authorized profile and a candidate revision.
2. Regulatory and Conceptual Basis
This section translates the governance problem into the state variables used by the decision model. The key distinction is between a governance specification and its current operational realization. The target security profile specifies which protective capabilities are required and can be credited in the authorization basis; it does not imply that every required capability is operating perfectly at every instant. Continuous monitoring therefore updates operational condition and evidentiary confidence without automatically changing the profile itself. Table 1 summarizes the main constructs before they are formalized.
2.1. Target Security Profiles and Mandatory Requirements
Control catalog. Let the security-control catalog contain m selectable entries:
Equation (1) defines the universe of control entries available to the profile-selection model.
Profile projection. A target security profile is represented by the binary selection vector
where means that control entry is included in the profile. Equation (2) is a mathematical projection, not a claim that a real security profile is merely a binary list. The full control text, parameters, implementation guidance, evidence requirements, and normative references remain metadata associated with each . For this benchmark, profile inclusion identifies the protective capabilities that the authorization model is permitted to credit; actual operational realization is represented separately by . A production implementation may additionally distinguish deployed-but-not-yet-profiled capabilities from formally required profile entries.
The currently authorized version is denoted , where k is a profile-version index. When the version number is not important, we write .
Time-varying mandatory set. The controls that are mandatory at time t are collected in
where denotes applicable baseline requirements, applicable sectoral requirements, and other legally or regulatorily mandatory requirements. Equation (3) separates normative obligations from the numerical risk threshold.
Mandatory-inclusion constraint. Every candidate profile must satisfy
Thus, Equation (4) prevents any candidate-selection procedure introduced later in Section 5 from omitting a mandatory control in order to reduce profile burden or cost.
A change in is treated as a governance trigger independently of the numerical risk threshold. If a newly mandatory control is absent from , the current profile requires revision and reauthorization even when the current risk index happens to remain below . This ordering prevents a risk-threshold test from masking a direct regulatory obligation.
2.2. Control Health, Evidence Quality, and Two Risk Views
A target profile records what the authorization basis requires; it is not a real-time statement that every included control is fully effective. For example, multi-factor authentication can remain a required profile entry while an identity-service fault temporarily reduces its operational effectiveness, and a logging control can continue to operate while telemetry needed to demonstrate that operation becomes unavailable. The model therefore separates profile membership from two time-varying state variables.
For each control, let
represent implementation or operational health, with 1 denoting full operation and 0 denoting no expected protective effect. Separately, let
represent the quality or confidence of the evidence available to support the authorization decision. A control may therefore remain operational while evidence quality decreases, for example when the control continues to enforce policy but assessment telemetry is temporarily unavailable.
For the base proof of concept, the trusted state used by the authorization decision is
This conservative rule does not mean that evidence loss physically increases attack probability. To keep that distinction explicit, we use two related quantities. The operational risk index is calculated from alone. The assurance-adjusted authorization-risk index uses and therefore represents the risk estimate that can be justified by the evidence currently available for authorization. Sensitivity experiments later compare alternative evidence-fusion functions.
2.3. Dynamic System State
The monitored state entering reassessment is summarized as
where denotes assets and criticality; known vulnerabilities; exposure and configuration; threat information; control health; evidence quality; and the applicable normative context. Equation (8) is a conceptual state decomposition. External vulnerability and exploitation signals inform and ; monitoring and assessment update , , and ; and governance changes update and, through it, the mandatory set . The synthetic benchmark does not instantiate complete asset or vulnerability inventories for each component; instead, it maps these constructs to generated scenario likelihood/exposure/event state, the control-health vector , the evidence-quality vector , and the time-varying mandatory set derived from . A change in any component can trigger reassessment, but does not by itself imply profile revision.
3. Related Work and Novelty Boundary
3.1. Continuous Authorization, Continuous Assurance, and Evidence
NIST RMF defines a lifecycle of categorization, control selection, implementation, assessment, authorization, and monitoring [1]; NIST SP 800-137 operationalizes continuous monitoring [2]. Continuous compliance research increasingly automates the collection and verification of evidence, and the Open Security Controls Assessment Language (OSCAL) provides machine-readable representations for catalogs, profiles, implementations, and assessment results [20,21]. Recent work in the Journal of Cybersecurity and Privacy has likewise emphasized integrated cyber-risk management for critical infrastructure and the trustworthiness of evidence used in certification processes [22,23]. These lines of work motivate continuous evidence and risk updates, but they do not by themselves specify when an already authorized profile has become structurally insufficient.
3.2. Risk-Adaptive Controls and Adaptive Profiles
Calvo and Beltrán developed a risk-based adaptive-security model in which deployment and configuration of controls can change as risk and risk tolerance change [11]. Grigoriadis et al. linked situation-based risk assessment to adaptive security enforcement [12], while Chehida et al. studied model-based self-adaptive security in cyber-physical systems [13]. Adaptive edge security and moving-target defense further illustrate dynamic policy generation under changing risk [14,15]. Skladannyi et al. model adaptive security profiles that evolve according to threats and context [24].
The present model instead treats the already authorized profile as fixed unless a defined structural condition is met. Before changing the profile, the method tests whether the current state can be recovered by executing or restoring controls that are already included. Structural modification is considered only when this fixed-profile remediation problem is infeasible or when a new mandatory requirement directly invalidates the current profile.
3.3. Security-Control Optimization and Critical-Infrastructure Adaptation
Optimization of security controls under risk, cost, and attack-graph constraints is an established research area [16,17,18,19]. Critical-infrastructure research has also addressed adaptive cyber-resilience mechanisms and lifecycle security [25,26]. In those formulations, the central object is generally the configuration, defense portfolio, resilience policy, or lifecycle of the infrastructure itself. Our optimization target is the minimum-burden candidate change to a profile that has already passed an authorization process, where changing that profile is itself a governance event requiring assessment and reauthorization.
3.4. Targeted Literature Screening
To reduce the risk of overstating novelty, a targeted Scopus search was performed on 23 August 2026 using combinations of terms related to ongoing or continuous authorization, security profiles and baselines, adaptive security controls, risk tolerance, continuous monitoring, and profile lifecycle. The export contained 141 records; the authors screened titles and abstracts, classifying 16 records as closest prior art and 27 as contextually relevant. The complete query and redistributable screening decisions are included in the reproducibility package, but the proprietary raw Scopus export is not redistributed. This was a targeted prior-art check rather than a systematic literature review; it narrows the claim but cannot establish absolute priority.
Within the screened literature and the standards reviewed above, we did not identify a single formal model combining all of the following: (i) an already authorized profile as a fixed governance basis; (ii) a remediation-feasibility test before structural change; (iii) infeasibility of that test as the definition of structural insufficiency; (iv) a minimum-burden candidate revision that explicitly penalizes profile distance and change burden; and (v) a mandatory external assessment/reauthorization step between the candidate profile and the next authorized version. The novelty claim is limited to this authorization-specific decision boundary and its integration into a reproducible decision model; it is not a claim that feasible sets, Hamming distance, adaptive controls, or continuous authorization are new mathematical or governance concepts.
4. Dynamic Assurance-Adjusted Authorization Risk
4.1. Threat Scenarios and Critical-Infrastructure Consequence
Let be a set of n threat scenarios. Each scenario has a normalized, time-dependent scenario-likelihood term and, in the general formulation, an impact term . In this proof of concept, is an internal benchmark quantity used for policy comparison rather than a calibrated probability of a real incident. A more detailed implementation can decompose impact into confidentiality, integrity, availability, critical operational function or service delivery, and physical/safety consequences:
where , , , , and denote scenario impacts on confidentiality, integrity, availability, critical operational function or service delivery, and physical/safety consequences, respectively. Their non-negative weights , , , , and sum to one. Equation (9) is a conceptual decomposition only: the benchmark assigns no numerical values to these component weights and instead uses the aggregate values in Table 2. In the present proof of concept, impact is time-invariant, , and the components are aggregated into a normalized because the objective is to compare decision policies rather than claim calibrated consequence values for a real facility.
Dynamic threat information can modify . Disclosed vulnerabilities may be identified through the Common Vulnerabilities and Exposures (CVE) system. For example, the Exploit Prediction Scoring System (EPSS) estimates near-term exploitation probability for disclosed vulnerabilities, whereas the Cybersecurity and Infrastructure Security Agency (CISA) Known Exploited Vulnerabilities (KEV) catalog records evidence of exploitation in the wild [27,28,29]. Neither signal is treated here as a complete organizational risk score: local exposure, asset consequence, control condition, and compensating measures remain separate variables. Historical vulnerability-intelligence ingestion is outside the present scope; threat-signal generation is kept synthetic so that the experiment isolates the authorization decision boundary rather than introducing a second exploit-prediction model.
4.2. Control Effectiveness and Residual Risk
For scenario s and control i, let and denote potential reductions in likelihood and impact, respectively. The assurance-adjusted effective contribution is scaled by the profile selection and trusted state . The proof-of-concept residual likelihood and impact are
The scenario risk index is
and the aggregate assurance-adjusted authorization-risk index is
In the benchmark, the raw relative-criticality values in Table 2 are normalized as . Equations (10) and () define residual likelihood and impact, Equation (12) forms scenario risk, and Equation (13) aggregates scenarios using explicitly normalized weights. The operational risk index is computed analogously using rather than . Because for every control and the benchmark uses non-negative effectiveness coefficients, this model satisfies ; equality holds when the trusted states equal operational health for all credited controls. The inequality represents reduced assurance, not a physical risk increase caused by documentation loss.
The implementation additionally clips each individual multiplicative factor to as a numerical guard. The lower guard is not active for the base 12-control coefficient matrices; it is retained only to prevent pathological factors in synthetic stress variants. The multiplicative form is intentionally transparent and reproducible and should be read as a separable-effect approximation, not as evidence that real security controls are statistically independent. If two controls protect the same attack path, simple multiplication can over-credit overlapping effects; if one control is a prerequisite for another, multiplying their nominal contributions can also misrepresent the dependency; and common-mode failures can reduce several controls simultaneously. Conversely, synergistic controls can make a purely separable representation conservative for some states. A production model can represent these relationships through conditional effectiveness coefficients, explicit prerequisite and exclusion constraints, interaction terms, attack-graph structure, or correlated health/failure states. The global effectiveness sensitivity in Section 7.7 tests uncertainty in effect magnitude, but it does not substitute for empirical identification of the dependency structure. This remains a priority for cyber-range or field validation.
4.3. Risk Tolerance
Let denote the benchmark threshold for acceptable assurance-adjusted authorization risk:
The base experiment uses . The threshold was selected during benchmark design as an interior operating point rather than as an empirical or regulatory quantity: under the fixed synthetic generator it leaves routine periods predominantly below tolerance while allowing designed stress episodes and degradation events to cross the threshold, so that both remediation and structural-revision branches are exercised. A threshold that was always above or always below the generated risk range would provide little information about the decision boundary. The value was not fitted to obtain a particular method ranking and was not derived from regulation, incident frequencies, or a calibrated facility risk model. To test whether the findings depend on this design choice, the analysis sweeps a symmetric local range of 0.032–0.040 (approximately to around the base value); the main exposure–governance pattern is retained across that range (Section 7.5). is therefore a benchmark operating threshold, not a regulatory limit or transferable safety criterion. A production model should normally add scenario-specific constraints
Thus, Equation (14) defines the aggregate benchmark tolerance, while Equation (15) illustrates scenario-specific limits that a production implementation may require so that an acceptable aggregate value cannot conceal a single unacceptable high-consequence scenario. No values are assigned or used in the present benchmark.
5. Remediation-First Authorization Model
Figure 1 presents the decision architecture and input-to-model mapping before the optimization details. Three input classes are kept distinct. External security signals update the vulnerability/threat components and of the monitored state; system monitoring updates exposure , control health , and evidence quality ; and the normative context determines mandatory requirements . These inputs feed the authorization-risk engine. Mandatory-set validity is checked before the numerical risk threshold. If no mandatory-profile gap exists and risk is acceptable, the current authorized profile is retained. If no mandatory-profile gap exists but risk is elevated, Stage 1 asks whether an admissible action can restore tolerance while remains fixed; these recoverable states form . Stage 2 is reached only when that test is infeasible; a mandatory-profile gap can instead trigger Stage 2 independently of the numerical risk threshold. Stage 2 produces a candidate , not an authorization decision; assessment and reauthorization remain external governance actions.
5.1. Stage 1: Bounded Operational Remediation
When no mandatory-profile gap exists and , the method does not immediately modify the target profile. It first searches over admissible operational actions that leave the profile itself unchanged; contains only actions associated with capabilities already credited by (including restoration of their supporting evidence), not additions of new profile entries. Examples include restoring logging, correcting a configuration, deploying a patch already required by the profile, restoring multi-factor authentication, isolating an unintended service, or repairing evidence collection. The admissible set also contains a null action that leaves the system state unchanged and has ; this convention ensures that a state already satisfying the risk condition belongs to the authorization envelope without requiring a fictitious remediation action.
The general remediation problem is
subject to
Here is a remediation resource/cost measure, is completion time, is the maximum admissible remediation time, is the available remediation resource budget, is temporary availability loss, and is its admissible upper bound. These constraints prevent a technically possible but operationally unacceptable remedy—for example, one requiring excessive delay, resources, or outage—from being treated as evidence that the current profile is structurally sufficient.
The proof-of-concept implementation uses a simplified action set: active controls and their assessment evidence can be restored within one daily decision step. In the base benchmark, for controls currently included in , the restoration operation raises the modeled control-health and evidence-quality states to at that decision step; subsequent stochastic degradation may reduce them again on later days. These modeled restoration actions are assumed to be admissible within the time, resource, and availability bounds in Equations (), (), and (); separate action-specific durations, budgets, and outage costs are therefore not simulated. Because full one-step restoration is a strong assumption for the mechanism that defines the authorization envelope, Section 7.6 adds a dedicated 30-replicate sensitivity in which remediation can raise degraded active-control health/evidence only to attainable levels of 0.70, 0.80, 0.90, or 1.00 (states already above the selected level are not reduced). The base abstraction therefore isolates the classification logic, while the additional experiment quantifies how the structural-churn result changes when remediation is less effective.
5.2. Authorization Envelope
The states from which acceptable authorization risk can be restored while the profile remains fixed define the authorization envelope
Equation (21) formalizes this feasible-state set. For compactness, is used when the operational bounds are understood. If , the profile is structurally sufficient and the response is operational. If , even the admissible restoration of existing controls cannot return the system to the benchmark tolerance; a structural candidate revision is then considered.
5.3. Stage 2: Minimum-Burden Candidate-Profile Revision
Let denote a candidate revision of the currently authorized profile . The weighted profile distance is
where expresses the relative significance of changing a profile entry. In the base experiment all , so is the Hamming distance between the two binary control-selection vectors. In plain terms, it counts how many individual control-inclusion decisions differ.
Let
be a dimensionless relative implementation/change-cost surrogate, where is the change-cost coefficient for control entry i (the “Relative change cost” value in Table 3), and
be the continuing operational burden of the profile, where is the corresponding relative burden coefficient in Table 3. Candidate evaluation also requires a distinction between the state of controls that are already active and the assumed state of controls that would be newly introduced. For an entry already present in , and retain their definitions as current operational health and current supporting-evidence quality. For an entry absent from , Stage 2 instead uses prospective post-implementation/post-assessment surrogates and . The state credited when testing a candidate P is therefore
The Stage-2 risk constraint uses these evaluation states together with the candidate selection vector. The barred quantities are not observations of deployed controls and do not contribute to the current risk of ; they are explicit assumptions about the state that would be available after implementation and assessment if the candidate were activated. The synthetic benchmark stores these prospective states separately from active-control health/evidence and transfers them into the active state only when a candidate becomes operative.
The candidate is selected by
subject to
During elevated-risk adaptation, removals are prohibited by the additional constraint
Equations (22), (23), and (24) define its component burdens; Equation (25) defines the candidate objective; Equations (26), (27), and (28) define its base feasibility constraints; and Equation (29) prohibits removals during elevated-risk adaptation. Removal of optional controls is considered only in a separate stable-state review.
The coefficients , , and are trade-off weights. They determine how strongly the optimizer values profile stability, one-time implementation/change cost, and continuing operational burden. Reauthorization burden is not included as a constant additive term in Equation (25), because such a constant would not change the ranking among non-identical Stage-2 candidates. Instead, every non-identical candidate is explicitly counted as a reauthorization-request event in the governance metrics. A future model could incorporate state-dependent assessment/reauthorization cost, for example by control family, assurance level, or expected assessment effort.
The base computational study uses , , and . All three objective components are dimensionless benchmark surrogates. The weights are designed so that changing an entry in the authorization basis dominates modest differences in the relative cost and continuing-burden terms; they are neither calibrated economic costs nor normative values. Parameter sensitivity is reported in Section 7.5.
5.4. Candidate Versus Authorized State
A candidate profile is not an authorized profile. Any structural revision identified by the algorithm must enter the applicable assessment and authorization process before it becomes operative as the next authorized version:
Equation (30) makes this governance boundary explicit. The algorithm can prepare evidence, identify the controls responsible for the gap, and propose a minimum-burden candidate; it cannot issue the legal or organizational authorization decision.
The primary computational benchmark idealizes candidate activation as immediate and assumes that generated candidates are accepted. For a newly selected entry, activation compactly represents implementation/deployment, acquisition of the assessment evidence needed to credit the control, and completion of the applicable external assessment/authorization step. This convention also applies to the synthetic mandatory-profile update at day 220. It isolates the decision boundary rather than the timing of downstream workflow. In practice, implementation, assessment, rejection/revision, and authorization can take days or weeks; Section 7.8 therefore examines non-zero combined candidate-activation latency for risk-driven candidates.
5.5. Normalized Required Profile Adaptation
For comparisons across catalog sizes, define normalized required profile adaptation (NRPA) as
Equation (31) normalizes the required profile delta by total profile-distance weight, where is the inclusion indicator of the Stage-2 candidate . For this indicator, is set equal to when Stage 2 is not invoked; if Stage 2 is invoked but no feasible candidate exists, NRPA is undefined and the state is instead classified as authorization degraded. Under that convention, NRPA equals zero when no structural change is required, while a positive value indicates that the minimum-burden feasible candidate differs from the current authorized profile. NRPA is a decision-support indicator, not a legal threshold; it is defined for cross-catalog comparability but is not used as a primary outcome in the present policy comparison.
5.6. Decision States and Event Logic
The model distinguishes four decision states:
- 1.
- Stable: and no mandatory profile gap exists.
- 2.
- Operational remediation required: , but bounded remediation is feasible while remains fixed.
- 3.
- Profile revision and reauthorization required: bounded remediation is infeasible, or a new mandatory requirement is absent from , and a feasible candidate profile exists.
- 4.
- Authorization degraded: no admissible candidate within the modeled catalog can satisfy the required risk condition; the decision must be escalated to compensating controls, functional restriction, explicit risk acceptance by an accountable authority, redesign, or other governance action.
The benchmark evaluates decisions at daily steps and responds to modeled events; it does not attempt packet-, process-, or machine-cycle control. Relevant events can include a newly relevant vulnerability, a material change in exploitation intelligence, a new external service, architecture or asset changes, control failure, evidence loss, an incident, a supplier change, or a new mandatory requirement. To reduce oscillation around the threshold, the base policy uses an activation threshold and a lower release threshold . After a risk-driven candidate revision, a 7-day cooldown suppresses repeated structural requests during closely spaced stress events; optional removals are considered only after a stable period.
6. Experimental Design
6.1. Purpose and Reference Architecture
The experiment is designed to test decision behavior, not to claim calibrated cyber risk for a real organization. All internal system states, threat trajectories, control-health degradations, evidence-quality degradations, and control-effectiveness coefficients are synthetic. No production CII network diagrams, logs, configurations, personal data, or confidential operational information are used.
The reference architecture is a logical energy-sector CII context rather than a packet-level network emulation. It contains enterprise IT, an Internet-facing/DMZ layer, a remote-access gateway, an OT supervisory zone, historian and human–machine-interface (HMI) functions, engineering workstations, and a simulated field level (Figure 2). These zones provide locations and consequences for the six designed threat scenarios: S1, credential compromise; S2, Internet-facing service exploitation; S3, IT-to-OT lateral movement; S4, ransomware and service disruption; S5, telemetry manipulation or loss; and S6, supply-chain compromise. Their numerical benchmark parameters are reported in Table 2. The benchmark does not emulate vendor products, industrial protocols, malware execution, or physical-process dynamics. Instead, Python code generates scenario likelihood/exposure states, control-health states, evidence-quality states, and governance events that are consumed by the decision model. Thus, the implementation is an algorithmic policy simulator built around a generic CII architecture, not a digital twin of a specific facility.
6.2. Designed Threat Scenarios
Six scenarios are used (Table 2). The numerical values are designed benchmark parameters, not random observations and not empirical estimates for a real infrastructure operator. They were selected to create heterogeneous test conditions rather than to reproduce a particular operator: credential compromise and external-service exploitation begin with larger likelihood terms, whereas IT-to-OT lateral movement, ransomware, telemetry manipulation, and supply-chain compromise receive larger impacts or portfolio weights. The “Impact column enters the within-scenario risk term ; the relative criticality serves only to construct the cross-scenario aggregation weight . Stochastic variation is introduced later in the time-series generator. Sensitivity analysis is used to test whether the conclusions depend on narrow parameter choices.
6.3. Aggregated Control Catalog
The main proof of concept uses 12 aggregated controls (Table 3). NIST SP 800-53 identifiers are used as analytical anchors, not as a legal crosswalk. In a Ukrainian deployment, control selection would have to be mapped and reviewed against the current NDTZI 3.6-006-24 selection catalog and applicable baseline/sectoral requirements [9,30]. NDTZI 2.3-025-24 is relevant to assessment of implemented measures, not to selection of the catalog itself [10].
The entries are deliberately aggregated by protective function so that their role in the benchmark can be understood without treating the NIST anchors as one-to-one implementations. C01–C03 represent identity, account, and remote-access protections most directly relevant to credential compromise and remote entry (S1–S2); C04–C05 represent vulnerability identification and flaw remediation, especially for Internet-facing exploitation (S2); C06 represents boundary protection and segmentation against IT-to-OT propagation (S3); C07–C08 represent audit and continuous-monitoring capabilities that support detection and authorization evidence across scenarios; C09–C10 represent incident handling and recovery, especially for ransomware/service disruption and telemetry loss (S4–S5); C11 represents controlled configuration change; and C12 represents supply-chain risk management (S6). The effectiveness matrices then encode the synthetic degree to which each aggregated function influences each scenario.
The and matrices are included in the reproducibility package. They are designed synthetic benchmark coefficients chosen to reflect the expected qualitative function of each aggregated control—for example, multi-factor authentication primarily reduces credential-compromise likelihood, segmentation primarily limits lateral movement, backup primarily reduces ransomware impact, and supply-chain risk management primarily affects the supply-chain scenario. They are not measured product effectiveness and were not obtained through a formal expert-elicitation study. Their uncertainty is therefore evaluated explicitly in Section 7.7. The change-cost coefficients and operational-burden coefficients in Table 3 are likewise dimensionless synthetic relative scores chosen to create heterogeneous optimization trade-offs, not monetary costs, labor hours, or measured organizational burdens.
6.4. 365-Day Synthetic Environment
The simulation horizon is 365 daily decision steps. Here denotes the continuous uniform distribution on . The generator applies a mean-reverting threat multiplier (0.92 persistence), a daily lognormal perturbation with , synthetic vulnerability shocks with daily probability 0.11 and multiplier , KEV-like exploitation shocks with probability 0.025 and multiplier , and exposure-change events with probability 0.018 and factors 0.78, 1.30, or 1.45 (clipped to 0.75–1.80). Four designed stress episodes occur on days 62, 153, 247, and 309 for scenarios S2, S3, S4, and S6 with multipliers 2.4, 2.7, 2.5, and 3.2, respectively. Daily scenario likelihood terms are clipped to . The complete generator settings are recorded in data/config.json; none is an empirical frequency estimate.
Control health and evidence quality are synthetic dynamic states. For controls currently included in the authorized profile, and denote active operational health and current evidence quality. For controls absent from the current profile, the simulator maintains separate prospective readiness/evidence vectors and for candidate evaluation; these are assumed post-implementation/post-assessment states, not observations of deployed controls. On each day, a control-state degradation occurs with probability 0.035 and sets the semantically applicable state for one catalog entry to a value drawn from if lower; an evidence-quality degradation occurs with probability 0.025 and analogously uses . Evidence ages by 0.0025 per day to a floor of 0.30 in the active or prospective state as applicable. When a candidate is activated, the prospective values for newly selected entries become their initial active-control states. On event days with no other action, active controls receive the same 0.08 evidence-refresh increment under every comparison policy. The main representative run uses seed 20260822. Synthetic identifiers such as SYN-CVE-* and SYN-KEV-* are artificial and must not be interpreted as real vulnerabilities.
At day 220, C12 becomes mandatory as a deliberately synthetic governance stress event, not as a reconstruction of a real regulatory date. Its purpose is branch coverage of the governance logic: a mandatory-set change should force a profile update even when the numerical risk threshold alone would not require one. The event is placed between the designed day-153 and day-247 threat-stress episodes so that the mandatory-gap pathway is observable as a conceptually distinct trigger rather than being introduced at the same instant as a designed threat spike. Because mandatory-set validity is checked before the risk threshold, this event can require profile revision and reauthorization even if . The primary benchmark idealizes implementation, assessment, and authorization of a selected candidate as occurring within the activation step; the combined activation-latency diagnostic in Section 7.8 relaxes this assumption for risk-driven candidates.
6.5. Comparison Strategies
The four strategies are intended to represent different governance policies, not four parameterizations of a single isolated factor. Their roles are as follows:
- 1.
- Static annual: a low-adaptation baseline in which no risk-driven structural change is made during the year; operational remediation remains possible and a structural reassessment is allowed at the end of the horizon. It tests the cost of relying primarily on the existing authorization basis. If the end-of-horizon reassessment produces a revision because residual risk remains above tolerance, that event is counted as a risk-driven revision.
- 2.
- Periodic 30-day: structural reoptimization is allowed every 30 days, with remediation between reviews. It represents calendar-driven reassessment that is more responsive than annual review but is not directly synchronized to security events.
- 3.
- Direct event-driven reoptimization (DER): every relevant event or threshold exceedance can trigger direct profile reoptimization using the same risk model but a low weight on profile stability. DER is an intentionally aggressive structural-adaptation comparator: it asks what happens when dynamic risk signals are treated as opportunities for immediate profile reoptimization rather than first testing the existing authorization basis. It is not proposed as a normative implementation model.
- 4.
- Proposed remediation-first strategy: Stage 1 first tests whether the current authorized profile can be restored to tolerance; Stage 2 is reached only when Stage 1 is infeasible or a mandatory requirement creates a direct profile gap. Elevated-risk revisions are additions-only and use hysteresis and a cooldown to reduce oscillatory structural requests.
Table 4 makes the policy parameterization explicit. Because the policies intentionally differ in trigger logic, objective weights, removal rules, and anti-oscillation mechanisms, the primary four-strategy experiment compares complete policy configurations; it should not be interpreted as attributing every difference between DER and the proposed strategy solely to Stage 1. To isolate the remediation-first decision boundary, Section 7.4 includes a matched-parameter No Stage 1 comparison in which all proposed-policy parameters, thresholds, cooldown, hysteresis, stable-state logic, objective weights, and paired synthetic environments are held fixed and only the ordering of structural optimization versus fixed-profile remediation is removed. This matched ablation is the one-factor test of the Stage-1 mechanism requested by the causal interpretation. The comparator weights and anti-oscillation settings remain synthetic policy-design choices rather than calibrated governance recommendations. The shared 0.08 evidence refresh on otherwise inactive event days is applied identically to all four strategies.
6.6. Evaluation Metrics
The primary exposure metrics are Time Above Risk Tolerance (TART)
and Cumulative Unacceptable Risk Exposure (CURE)
Here is the number of daily decision steps and is the indicator function. TART is therefore the number of days above the benchmark threshold. CURE sums the daily positive excess above and can be read as risk-index-days for this fixed daily discretization; it is not normalized by the horizon. Both are internal comparison metrics, not regulatory measures.
Governance burden is described using: (i) the number of risk-driven profile-revision events, which corresponds to candidate revisions that would require assessment and reauthorization; (ii) mandatory profile-revision events caused directly by ; and (iii) profile-entry changes, defined as the sum of Hamming distances between consecutive binary profile-selection vectors. A single revision event can change multiple profile entries, so revision count and profile-entry changes are different quantities. The profile-entry-change count therefore has a direct interpretation: it counts how many individual control-inclusion indicators switch between 0 and 1 over time. We also count a remediation event whenever the benchmark restoration operation is executed on a daily decision step.
6.7. Monte Carlo Protocol and Statistical Comparison
The primary Monte Carlo experiment uses 100 paired replicates. Replicate k, for , uses seed . All four strategies within a replicate receive the same threat/event environment and the same control/evidence degradation schedule, which supports paired comparison. We report mean ± standard deviation (SD). For key contrasts we use paired bootstrap 95% confidence intervals with 20,000 resamples and two-sided Wilcoxon signed-rank tests. Because the inferential comparisons are supportive rather than a large hypothesis-testing family, emphasis is placed on effect magnitude and confidence intervals rather than extremely small p-values.
6.8. Robustness and Sensitivity Program
Before describing the robustness experiments, four anti-oscillation/design mechanisms used by the proposed policy are made explicit in Table 5. Their purpose is operational rather than mathematical novelty: they prevent transient threshold crossings from producing unnecessary structural profile churn.
Seven groups of additional experiments are then performed. First, component ablation compares the full model with variants that: (i) remove Stage 1 while holding the remaining proposed-policy settings fixed; (ii) ignore evidence in the decision rule; (iii) remove hysteresis; (iv) remove cooldown; (v) remove the stable-dwell requirement; or (vi) substantially reduce the profile-stability weight. Second, one-factor sensitivity varies , , , the off-threshold factor in , cooldown in days, and the stable window in days; every setting is evaluated on the same 30 synthetic environments. Third, is swept over 0.032, 0.034, 0.036, 0.038, and 0.040 using 30 paired replicates. These values form a symmetric local stress range around the base value 0.036 (approximately to ) and are not alternative regulatory thresholds. Fourth, the attainable Stage-1 restoration level is varied over 0.70, 0.80, 0.90, and 1.00 in a separate 30-replicate diagnostic, with a matched No-Stage-1 comparator on the same environments. Fifth, the control-effectiveness matrices are multiplied globally by 0.70, 0.85, 1.00, 1.15, and 1.30; this is a deliberately broad model-uncertainty stress test, not a confidence interval. Alternative evidence-fusion functions are also compared. Sixth, an illustrative candidate-activation-latency sensitivity delays activation of risk-driven candidate profiles by 0, 1, 3, 7, 14, or 30 days; the delay compactly represents combined implementation/deployment, assessment, and authorization latency. Mandatory-set updates remain immediate in that diagnostic so that cyber-risk exposure from delayed risk-driven activation is not conflated with the duration of a modeled mandatory-profile gap. Seventh, computational scalability is tested with synthetic catalogs of 12, 25, 50, 100, 150, 200, and 299 control entries. For sizes above 12, base control-effect columns are resampled and perturbed (lognormal ), attenuated by , relative costs and burdens are perturbed by factors from , approximately 10% of entries are marked mandatory, and each instance is calibrated to a common initial stress level of approximately . These are computational stress instances, not reconstructed target profiles.
The largest stress-test size, 299, corresponds to the number of active base-control identifiers in the current Ukrainian NDTZI 3.6-006-24 catalog after withdrawn base identifiers are excluded; control enhancements are not counted as separate entries in that number [9]. The catalogs above 12 entries are synthetic computational stress instances, not reconstructed real target profiles. Their purpose is solely to test algorithmic scaling at a policy-relevant order of magnitude.
For catalogs larger than 12 entries, exhaustive enumeration is replaced with a simple ratio-based candidate heuristic. At each iteration, the heuristic evaluates every currently absent control and adds the control with the greatest immediate reduction in the risk index per unit increase in the candidate objective. After reaching feasibility, it performs a reverse-deletion pass to remove additions that are no longer needed. This is a transparent heuristic rather than an exact large-scale solver. It is compared with exhaustive optimization only at .
6.9. Computational Implementation and Use of Generative Artificial Intelligence
The implementation is modular and mirrors the mathematical flow in Figure 1. Table 6 identifies the main computational components and their role. The benchmark is implemented in Python with NumPy, pandas, SciPy, and Matplotlib; exact Python/package versions, deterministic seeds, and benchmark settings are included in the reproducibility package.
The daily execution sequence is: generate/update the synthetic state; apply mandatory-set changes; degrade or age control/evidence states; calculate the pre-decision authorization risk; execute the policy-specific Stage-1/Stage-2 logic; calculate post-decision metrics; and append an auditable trace row. The implementation therefore exposes the same decision boundary described mathematically rather than treating the optimizer as a separate black box. Synthetic states and events were generated by the supplied deterministic Python scripts, not by a generative artificial intelligence (AI) model.
OpenAI ChatGPT (GPT-5.6 Sol, accessed in August–September 2026) was used during study and manuscript preparation for manuscript structuring, English-language editing, literature-search assistance, Python code scaffolding/refactoring, and consistency checks. The authors reviewed the sources, assumptions, equations, executable code, numerical outputs, and interpretations and retain responsibility for the work.
7. Results
7.1. Representative 365-Day Run
Figure 3 shows the assurance-adjusted authorization-risk trajectories for the representative seed. Static annual and periodic strategies remain above for extended intervals after stress episodes. DER reduces exposure aggressively through frequent profile reoptimization. The proposed strategy likewise returns below tolerance in the representative run while changing the authorization basis less often.
Table 7 gives the numerical results. Both DER and the proposed method achieve zero TART in this particular run. DER produces nine risk-driven profile revisions and eleven individual profile-entry changes, whereas the proposed method produces two risk-driven revisions and three profile-entry changes. Each strategy also encounters the synthetic mandatory change at day 220 when needed by its current profile state; mandatory changes are reported separately from risk-driven revisions.
Figure 4 shows profile size over time, while Figure 5 displays the 12 control-selection entries for the proposed method. The proposed method does not redesign the profile after every transient risk increase; profile additions persist unless a later stable-state review removes them.
The exposure–governance trade-off for the representative run is summarized in Figure 6.
7.2. Monte Carlo Comparison
Across 100 paired replicates, static annual authorization produces days above the benchmark tolerance and periodic 30-day review produces days. DER produces no threshold-exceedance days in this constructed environment, but averages risk-driven profile revisions and profile-entry changes. The proposed method averages only days above tolerance, risk-driven profile revisions, and profile-entry changes (Table 8).
The mean numbers of mandatory-profile revision events are 1.00 for static annual, 0.95 for periodic 30-day review, 1.00 for DER, and 0.96 for the proposed method; values below one occur when C12 has already entered the profile before day 220. Combining risk-driven and mandatory events, with same-day overlaps counted once, gives 1.05, 1.45, 9.79, and 2.39 mean reauthorization-request events, respectively. These counts are governance diagnostics rather than additional optimization objectives. The fourth decision state, authorization degraded, does not occur in any of the 100 proposed-policy base replicates. All 27 threshold-exceedance days accumulated across those runs (0.27 day/run) are labeled remediation cooldown; thus the residual base-case TART is caused by the seven-day anti-oscillation rule rather than by absence of a feasible Stage-2 candidate in the 12-control catalog.
7.3. Paired Statistical Comparisons
Relative to periodic 30-day review, the proposed method has a paired mean TART difference of days per run (paired bootstrap 95% confidence interval (CI), to days) and a CURE difference of (95% CI, to ). Relative to DER, the paired TART difference is day (95% CI, 0.12–0.44; Wilcoxon ), whereas the proposed method has 7.63 fewer risk-driven profile revisions (proposed minus DER ; 95% CI, to ) and 8.18 fewer profile-entry changes (difference ; 95% CI, to ). Two-sided Wilcoxon signed-rank tests were calculated for all listed contrasts; exact p-values are included in the reproducibility output. The method therefore does not dominate DER on every metric; it deliberately trades a small amount of residual threshold exposure for a much larger reduction in structural governance activity.
7.4. Component Ablation
The ablation results in Table 9 and Figure 9 provide direct mechanism checks. Most importantly, the No Stage 1 variant is a matched-parameter comparison: it uses the same paired synthetic environments, risk threshold, objective weights, hysteresis, cooldown, stable-state settings, and removal rules as the full proposed policy; the only substantive change is that structural optimization is attempted before fixed-profile remediation. In the regenerated 80-replicate analysis, removing Stage 1 reduces mean TART from 0.29 to 0.03 day but increases mean risk-driven profile revisions from 1.41 to 2.90 and profile-entry changes from 2.51 to 4.08. On average, 2.44 structural revision opportunities per run occur in states for which restoring already authorized controls/evidence would have been sufficient. The result therefore isolates the intended remediation-first effect rather than conflating it with the different parameterization of DER in the primary four-policy comparison.
An evidence-blind decision rule, in contrast, produces few structural revisions but accumulates days above the evidence-aware authorization threshold. The decision-blind-days diagnostic shows that it hides 11.33 days per run on average in which the decision layer regards the state as acceptable while the evidence-aware criterion does not. This supports keeping operational health and authorization evidence conceptually distinct.
Two ablations are numerically identical to the full model in this constructed sample, and their inactivity is itself informative. The No stable dwell variant would differ only if the policy encountered an event after a sufficiently low-risk interval at which an optional control could be removed while meeting the stricter stable-review target; no such removal opportunity changed the selected profile in these 80 trajectories. The Weak change weight variant would differ only if two or more feasible candidate profiles created a trade-off in which the lower profile-distance penalty changed the optimizer’s ranking; in the sampled elevated-risk states, the same feasible candidate remained preferred despite the weaker . By contrast, removing hysteresis increases revision frequency and removing cooldown eliminates residual TART in this sample at the cost of slightly more structural activity, showing that those mechanisms were active under at least some trajectories.
7.5. Parameter and Threshold Sensitivity
Across most settings in the shared 30-environment one-factor sensitivity set, the qualitative exposure–governance trade-off is unchanged. The tested ranges are –4.0, –1.0, –0.16, off-threshold factors 0.70–1.00, cooldowns 0–30 days, and stable windows 7–120 days. Noticeable changes occur mainly at boundary settings: setting the off-threshold factor to 1.0 increases mean revision frequency, a 30-day cooldown raises mean TART to 0.63 day, and boundary objective weights produce modest changes in structural activity. The base parameters should therefore be interpreted as one stable configuration within the tested region, not as uniquely optimal values. The 30-replicate design is an exploratory one-factor robustness check rather than a calibration or global sensitivity analysis.
The sweep likewise preserves the main pattern. For thresholds from 0.032 to 0.040, DER produces approximately 5.13–14.73 risk-driven revisions, whereas the proposed method produces approximately 1.13–2.17 revisions and 0.13–0.50 TART days in the 30-replicate sensitivity runs. The threshold itself remains a benchmark design choice.
7.6. Stage-1 Restoration Sensitivity
Because the base proof of concept assumes full one-step restoration of already authorized controls/evidence, a separate 30-replicate diagnostic tests attainable restoration levels of 0.70, 0.80, 0.90, and 1.00. A level r raises any degraded active-control health/evidence state below r to r during Stage 1 while leaving states already above r unchanged. The same environments are also evaluated with a matched No-Stage-1 policy. Table 10 shows that the structural-churn benefit is conditional rather than automatic: with full restoration the policy averages 1.40 risk-driven revisions, but this rises to 1.77 at 0.90, 2.23 at 0.80, and 2.93 at 0.70. At 0.70, the revision count and profile-entry changes are approximately those of the structural-first comparator, and mean TART rises to 1.03 days. Thus, remediation-first behavior is most useful when execution/restoration of already authorized capabilities can recover a substantial portion of their intended state; as attainable remediation weakens, the authorization envelope contracts and the structural-churn advantage correspondingly attenuates.
7.7. Control-Effectiveness and Evidence-Model Uncertainty
Assumed control effectiveness is the most influential model uncertainty. When all potential effectiveness coefficients are scaled to 70% of their base values, the 12-entry catalog no longer keeps the proposed strategy below the benchmark threshold through every stress episode: TART rises to days and the mean final profile size reaches 11.97 of 12 entries. The fourth decision state becomes material in this severe stress: the 10.00 mean TART days decompose into 8.10 mean authorization-degraded days, for which no feasible candidate in the modeled catalog satisfies the risk threshold, and 1.90 mean cooldown days. At a factor of 0.85, TART is days; at 1.00 it is day in this 30-replicate sensitivity set; at factors 1.15 and 1.30 it is zero. Figure 10 visualizes this dependence. The contrast with the 100-replicate base case, where authorization degraded never occurs, shows that the fourth state is reachable when catalog effectiveness is sufficiently stressed rather than being only a formal branch of the model.
Alternative trusted-state functions , , , and health-only produce TART values between 0.13 and 0.33 day and mean revision counts between 1.43 and 1.47 in the corresponding 30-replicate tests. Thus the qualitative result is not sensitive to the exact simple evidence-fusion function within this constructed environment. This does not contradict the evidence-blind ablation: the fusion experiment evaluates internally consistent models, whereas the evidence-blind ablation intentionally creates a mismatch between decision information and the evidence-aware assurance criterion.
7.8. Candidate-Activation-Latency Sensitivity
The main benchmark activates an accepted candidate without delay in order to isolate the decision boundary. This immediate activation compactly assumes that a newly selected control can be implemented/deployed, brought to the prospective state used for candidate evaluation, assessed, and authorized within the same decision step. To assess the consequence of that idealization, an additional 30-replicate diagnostic delays activation of risk-driven candidate profiles while retaining the same remediation-first logic. The delay should therefore be interpreted as a combined implementation/deployment, assessment, and authorization latency rather than as purely administrative authorization time. This diagnostic uses a separate 30-replicate seed set; consequently, its zero-delay row is a within-diagnostic baseline and is not expected to reproduce the 100-replicate mean in Table 8. Mandatory-set updates remain immediate in this diagnostic; therefore, Table 11 isolates cyber-risk exposure from delayed risk-driven candidate activation rather than also modeling the duration of a mandatory-profile gap.
The result confirms that the zero-delay assumption is consequential for absolute exposure estimates: even a one-day activation latency raises mean TART to 1.43 days in this diagnostic, and longer delays increase exposure progressively. The number of candidate requests changes little, so the core remediation-first classification remains stable while the operational consequence of delayed implementation/assessment/authorization becomes more visible. These values are illustrative rather than calibrated estimates of real deployment or authorization duration. Accordingly, the near-zero TART values in the primary benchmark should be interpreted as decision-logic results under immediate candidate activation, not as expected exposure for a real implementation and authorization workflow. The latency diagnostic separates two claims: the remediation-first classification remains comparatively stable, whereas absolute risk exposure is sensitive to downstream activation latency.
7.9. Synthetic Scalability Stress Test
Table 12 and Figure 11 report the scalability experiment. The ratio-based candidate heuristic finds a feasible solution in all constructed synthetic stress instances up to 299 control entries. In the regenerated version-1.2.0 run, median runtime rises from approximately 0.69 ms at 12 entries to 75.6 ms at 299 entries on the execution environment used for this package; the 95th percentile at 299 entries is approximately 84.4 ms. Runtime is environment-dependent and should be interpreted only as an order-of-magnitude computational check.
At 12 entries, exhaustive search remains available as a reference. The heuristic objective is on average 3.69% above the exact optimum, with a 95th-percentile gap of 8.88%. For larger catalogs, only feasibility and runtime are evaluated; no optimality claim is made.
7.10. Answers to the Research Questions
RQ1. Structural sufficiency is not inferred solely from . It is defined by the existence of an admissible remediation action while the profile remains fixed. If such an action exists within the operational bounds, the current profile is structurally sufficient.
RQ2. If fixed-profile remediation is infeasible, the Stage-2 optimization produces a minimum-burden candidate profile by minimizing Equation (25) subject to the risk condition, mandatory requirements, profile-distance cost, implementation/change cost, operational burden, and additions-only constraint during elevated risk.
RQ3. Operational remediation and structural revision are separated by membership in the authorization envelope. Structural revision creates a candidate only; it does not create a new authorized state. Any such candidate must proceed through assessment and reauthorization before it can become .
RQ4. Under the base synthetic assumptions, the proposed strategy nearly eliminates time above the benchmark tolerance compared with periodic baselines while producing far fewer risk-driven profile revisions than direct event-driven reoptimization. The dedicated restoration sensitivity shows that this structural-churn advantage narrows as attainable Stage-1 remediation becomes weaker, so the result is conditional on operational recoverability rather than universal.
8. Discussion
8.1. Why a New Vulnerability Does Not Automatically Imply a New Profile
A central practical implication is that a dynamic threat signal should be separated from a structural profile signal. EPSS, KEV, vulnerability severity, or an incident may substantially increase urgency, but if the current profile already requires the relevant security capabilities, the appropriate response can remain operational. Conversely, a new architecture or supplier path can reveal a missing capability even when every existing control is healthy. The first case is inside ; the second is outside it.
This separation is also relevant when vulnerability intelligence is informed by statistical or machine-learning models. EPSS estimates one component of the problem—exploitation likelihood—but does not incorporate an organization’s local exposure, consequence, compensating controls, or current assessment evidence [27,28]. Accordingly, the present framework treats threat intelligence as input to reassessment rather than as an autonomous trigger that automatically changes the authorized profile.
8.2. Practical Governance Value
The model can serve as a decision-support layer beneath a formal profile-and-authorization process. Telemetry, vulnerability information, asset/configuration changes, control status, and assessment evidence are converted into a dynamic state; the current profile is tested for recoverability; and only structural insufficiency produces a traceable candidate revision. This provides three practical benefits. First, each candidate change can be linked to the risk constraint or mandatory requirement that made the current profile insufficient. Second, the method can explain why one event requires operational remediation while another requires profile revision. Third, the organizational burden of repeated assessment and reauthorization becomes an explicit outcome rather than an invisible side effect of continuous reoptimization.
A production architecture could connect the decision layer to asset and software-bill-of-materials inventories, vulnerability-management platforms, security information and event management, security orchestration/automation, evidence repositories, and machine-readable control representations such as OSCAL [21]. The model’s output should remain a decision-support record containing the triggering evidence, affected risk scenarios, failed remediation-feasibility condition, candidate profile delta, and required authorization workflow.
8.3. Position in the Target-Profile Lifecycle
Figure 12 positions the method in a broader lifecycle. The profile is initially created or tailored, assessed, and placed in force as part of the authorization basis . Monitoring updates . A newly mandatory requirement that is absent from the profile, or a state outside , creates a structural gap and leads to candidate generation. Otherwise the current profile is maintained: if risk is already acceptable, monitoring simply continues through the null action; if risk is elevated but the state remains inside the authorization envelope, operational remediation is performed and monitoring resumes without a version change. Assessment, review, and authorization are required before any structural candidate becomes the next in-force profile .
A complete profile-lifecycle governance model would additionally address initial tailoring, inheritance of baseline and sectoral requirements, role and approval matrices, version registries, provenance, rollback, superseding, and retirement. Those functions are deliberately outside the contribution of this article and provide a separate research direction.
8.4. International Applicability
Although the Ukrainian regulatory reform motivates an important use case, the mathematical core is not tied to Ukrainian terminology. Under NIST RMF, can represent the selected controls and associated implementation basis that have already been assessed for the current authorization decision, while continuous monitoring updates and significant changes can trigger reassessment or reauthorization [1,2]. For example, suppose continuous monitoring identifies a newly exploitable Internet-facing vulnerability. If the current assessed control set already requires vulnerability scanning, flaw remediation, boundary protection, and appropriate authentication, Stage 1 represents execution or restoration of those existing requirements. If that admissible remediation returns to tolerance, the model recommends maintaining the current authorization basis. If the new exposure creates a protective requirement not represented in the assessed control set, or if existing authorized capabilities cannot restore tolerance, Stage 2 generates a candidate control-set revision that would then enter the RMF assessment/authorization process rather than becoming operative automatically. NIST CSF current/target profiles provide an additional profile-gap interpretation [3]. The authorization envelope is therefore a governance-independent decision abstraction, provided that mandatory requirements, authority roles, assessment evidence, and reauthorization triggers are mapped to the applicable framework.
8.5. Threats to Validity and Limitations
The results should be interpreted within the following limitations.
Synthetic internal environment. The main trajectories, events, control health, evidence quality, and architecture are synthetic. The experiments exercise and compare the internal decision behavior of the model; they do not establish expected field performance for a real CII operator.
Control effectiveness is not empirically measured. The and coefficients are designed benchmark values. Sensitivity analysis shows that they are the most influential assumption. Cyber-range measurements, structured expert elicitation with uncertainty distributions, or historical incident evidence are needed before operational deployment.
No full historical threat-intelligence replay. EPSS and KEV are discussed as plausible external inputs, but the main 365-day experiment does not replay time-consistent historical threat feeds. Accordingly, conclusions about performance under real historical threat feeds are outside the present evidence base.
Simplified control interactions. The multiplicative model is a separable-effect approximation and does not establish independence of real controls. Dependencies, prerequisites, overlapping effects, common-mode failures, and partial implementations beyond the health scalar can make the combined effect larger or smaller than the product used here. A production optimizer should represent these relationships explicitly, for example through conditional effectiveness, interaction terms, dependency constraints, attack-graph structure, or correlated health states.
Simplified remediation timing and quality. Stage 1 is formulated with time, budget, and availability bounds, but the proof-of-concept implementation completes eligible remediation within one daily decision step and uses full restoration in the base benchmark. The dedicated sensitivity in Section 7.6 shows that this assumption is consequential: as attainable restoration declines from 1.00 toward 0.70, the structural-revision frequency rises and the advantage over the matched structural-first comparator largely disappears. Real remediation durations, partial recovery, action-specific cost, and outage constraints can therefore materially change the authorization envelope and should be calibrated empirically before operational use.
Prospective candidate state and idealized activation latency. Controls absent from the current profile are not treated as currently deployed: Stage 2 evaluates them using separate prospective post-implementation/post-assessment readiness/evidence surrogates. When a candidate is activated in the base benchmark, those prospective values become the initial active states immediately. This idealizes implementation/deployment together with assessment and authorization. The latency sensitivity in Section 7.8 confirms that non-zero combined activation latency can materially increase exposure, but it remains a simplified diagnostic: it does not model control-specific deployment schedules, detailed assessment workflow, rejection probability, compensating measures during review, or the duration of mandatory-profile gaps when required changes are delayed.
Heuristic scalability test. The ratio-based stress test up to 299 entries demonstrates feasibility and runtime only. It does not establish large-scale optimality. Mixed-integer linear/nonlinear programming, branch-and-bound, decomposition, or other exact/approximate formulations with real dependency constraints remain necessary for production-scale optimization.
Targeted rather than systematic prior-art screening. The Scopus screening reduces the risk of a broad novelty claim but is not a systematic literature review and cannot prove absence of related work outside the query and database.
No autonomous authorization. NRPA, the decision-state logic, and the candidate-profile optimizer are decision-support mechanisms. Legal, regulatory, organizational, and safety decisions remain with accountable authorities.
9. Conclusions
This paper developed a remediation-first decision-support model for risk-adaptive security authorization of critical information infrastructure. Its central premise is that a dynamic increase in risk should not be equated automatically with a structural change to the authorized target security profile. The model first tests whether admissible operational remediation can restore the assurance-adjusted authorization-risk index while the current profile remains fixed. The states for which this is possible form an authorization envelope. Only when bounded remediation is infeasible—or a new mandatory requirement directly invalidates the current profile—does the model generate a minimum-burden candidate revision.
The practical output is therefore a governance decision aid rather than an autonomous security-authority function: the monitored state and normative context are translated into one of four decision states, existing authorized controls are restored where sufficient, and only structural gaps produce a candidate profile. The candidate is not a new authorized profile. Every structural profile revision must pass the applicable assessment and reauthorization process before the next version can enter force.
In 100 paired synthetic Monte Carlo replicates, the proposed strategy averaged day above the benchmark tolerance and risk-driven profile revisions, compared with zero TART days but revisions for direct event-driven reoptimization in the same constructed benchmark. The primary comparison is between complete policy configurations; the matched-parameter No-Stage-1 ablation separately isolates the remediation-first ordering and shows that removing it increases mean risk-driven revisions from 1.41 to 2.90 and profile-entry changes from 2.51 to 4.08 in the 80-replicate ablation set. In the 100-replicate base case, authorization degraded never occurs; the residual 0.27 TART day/run is entirely associated with the anti-oscillation cooldown. Under the severe 0.70 control-effectiveness stress, by contrast, authorization-degraded states account for 8.10 of the 10.00 mean TART days, demonstrating that the fourth decision state becomes active when the modeled catalog is insufficient.
The mechanism-specific sensitivities also qualify the mechanism-specific attribution. In the separate 30-replicate restoration diagnostic, mean risk-driven revisions increase from 1.40 under full restoration to 1.77, 2.23, and 2.93 at attainable restoration levels of 0.90, 0.80, and 0.70, respectively; the matched No-Stage-1 comparator produces 2.83 revisions. Thus, the structural-churn benefit of remediation-first decision making is strongest when already authorized capabilities can be restored effectively and attenuates as recoverability weakens. The 30-environment one-factor sweep and the sweep preserve the main qualitative pattern over the tested region, but these synthetic sensitivity analyses should not be interpreted as parameter calibration.
The absolute exposure values require a further qualification. The primary benchmark activates accepted candidates immediately, which compactly idealizes implementation/deployment, assessment, and authorization. In the separate activation-latency diagnostic, a one-day delay raises mean TART from 0.03 to 1.43 days and a seven-day delay raises it to 5.07 days. The near-zero primary TART values should therefore be interpreted as properties of the decision logic under immediate activation, not as estimates of field exposure during real implementation and authorization workflows. Likewise, the control-effectiveness coefficients, remediation durations, risk threshold, prospective candidate-readiness states, and internal trajectories are synthetic rather than empirically calibrated.
Within those boundaries, the computational evidence supports the examined design principle: monitoring and risk reassessment can be frequent while structural profile revision and reauthorization remain selective, minimal, evidence-traceable, and explicitly justified. Further validation should combine cyber-range or comparable testbed measurements, structured expert elicitation for control effectiveness and dependencies, realistic remediation and authorization durations, time-consistent threat-intelligence replay, and scalable optimization with explicit control-interaction constraints.
Author Contributions
Conceptualization, O.P., S.H. and V.A.; methodology, O.P., S.H. and V.A.; software, O.P. and S.H.; validation, S.H., O.D. and V.A.; formal analysis, O.P., S.H. and V.A.; investigation, O.P. and O.D.; data curation, O.P. and O.D.; visualization, O.D. and O.P.; supervision, V.A. and S.H.; project administration, O.D. and V.A.; funding acquisition, V.A.; writing—original draft preparation, O.P., S.H., O.D. and V.A.; writing—review and editing, O.P., S.H., O.D. and V.A. All authors have read and agreed to the published version of the manuscript.
Funding
This research was partially supported by the U.S. National Academy of Sciences and the Office of Naval Research Global (ONRG), USA, through the Science and Technology Center in Ukraine (STCU), under STCU Contract No. 7126, within the framework of the International Multilateral Partnerships for Resilient Education and Science System in Ukraine (IMPRESS-U).
Institutional Review Board Statement
Not applicable. This computational study did not involve humans or animals.
Informed Consent Statement
Not applicable.
Data Availability Statement
The code, synthetic data, benchmark configuration, raw and summarized computational outputs, literature-screening metadata that can be redistributed, and source files required to reproduce the computational figures and LaTeX conceptual diagrams are available in the accompanying Zenodo reproducibility package, Version 1.2.1, DOI: 10.5281/zenodo.22836875. The package contains no production critical-infrastructure data, personal data, confidential operational information, or proprietary raw Scopus export.
Acknowledgments
During the preparation of this manuscript, the authors used OpenAI ChatGPT (GPT-5.6 Sol) for manuscript structuring, English-language editing, literature-search assistance, code scaffolding, and consistency checks of the computational workflow. The authors reviewed the sources, assumptions, equations, code, numerical outputs, interpretations, and final manuscript and take responsibility for the content of the publication. The computational figures were generated programmatically from the reported data, while the conceptual diagrams were typeset directly in LaTeX by the authors. No generative-image tool was used.
Conflicts of Interest
The authors declare no conflicts of interest.
Abbreviations
The following abbreviations are used in this manuscript:
| AI | Artificial intelligence |
| CI | Confidence interval |
| CII | Critical information infrastructure |
| CISA | Cybersecurity and Infrastructure Security Agency |
| CSF | Cybersecurity Framework |
| CURE | Cumulative Unacceptable Risk Exposure |
| CVE | Common Vulnerabilities and Exposures |
| DER | Direct event-driven reoptimization |
| DMZ | Demilitarized zone |
| EPSS | Exploit Prediction Scoring System |
| IMPRESS-U | International Multilateral Partnerships for Resilient Education and Science System in Ukraine |
| IT | Information technology |
| KEV | Known Exploited Vulnerabilities |
| NAS | National Academy of Sciences |
| NDTZI | Ukrainian normative document series for technical information protection |
| NIS2 | Directive (EU) 2022/2555 |
| NIST | National Institute of Standards and Technology |
| NRPA | Normalized required profile adaptation |
| ONRG | Office of Naval Research Global |
| OSCAL | Open Security Controls Assessment Language |
| OT | Operational technology |
| RMF | Risk Management Framework |
| RQ | Research question |
| SD | Standard deviation |
| SP | Special Publication |
| STCU | Science and Technology Center in Ukraine |
| TART | Time Above Risk Tolerance |
References
- Joint Task Force. Risk Management Framework for Information Systems and Organizations: A System Life Cycle Approach for Security and Privacy. Technical Report NIST SP 800-37 Rev. 2, National Institute of Standards and Technology, 2018. [CrossRef]
- Dempsey, K.; Chawla, N.; Johnson, L.; Johnston, R.; Jones, A.; Orebaugh, A.; Scholl, M.; Stine, K. Information Security Continuous Monitoring (ISCM) for Federal Information Systems and Organizations; Technical Report NIST SP 800-137; National Institute of Standards and Technology, 2011. [Google Scholar] [CrossRef]
- National Institute of Standards and Technology. The NIST Cybersecurity Framework (CSF) 2.0. Technical Report NIST CSWP 29. National Institute of Standards and Technology, 2024. [Google Scholar] [CrossRef]
- European Parliament and Council of the European Union. Directive (EU) 2022/2555 on Measures for a High Common Level of Cybersecurity across the Union (NIS 2 Directive), 2022. Official Journal of the European Union.
- Verkhovna Rada of Ukraine. Law of Ukraine No. 4336-IX of 27 March 2025 on Amendments Concerning Information Protection and Cybersecurity of State Information Resources and Critical Information Infrastructure. Official legislation database. 2025. (accessed on 29 August 2026). in Ukrainian.
- Cabinet of Ministers of Ukraine. Resolution No. 712 of 18 June 2025: Some Issues of Protection of Information, Electronic Communications, Information and Communication, and Technological Systems, 2025. Current consolidated text accessed 29 August 2026; in Ukrainian; title translated by the authors.
- Cabinet of Ministers of Ukraine. Resolution No. 1799 of 31 December 2025: On Approval of the Procedure for Assessing the Cybersecurity State of Information, Electronic Communications and Information-Communication Systems, Critical Infrastructure Facilities, and Critical Information Infrastructure Facilities, 2025. Current consolidated text accessed 29 August 2026; in Ukrainian; title translated by the authors.
- State Service of Special Communications and Information Protection of Ukraine. Order No. 438 of 11 July 2025 on Requirements for Entities Assessing Implementation of Target Security-Profile Requirements, 2025. Accessed 29 August 2026; in Ukrainian.
- State Service of Special Communications and Information Protection of Ukraine. NDTZI 3.6-006-24: Procedure for Selecting Information-Protection Measures for Information Systems Where Protection Is Required by Law and the Information Does Not Constitute a State Secret; Normative document; working English translation by the authors; in Ukrainian. 2024.
- State Service of Special Communications and Information Protection of Ukraine. NDTZI 2.3-025-24: Methodology for Assessing Information-Protection Measures for Information Systems Where Protection Is Required by Law and the Information Does Not Constitute a State Secret; Assessment methodology; working English translation by the authors; in Ukrainian. 2024.
- Calvo, M.; Beltrán, M. A Model for Risk-Based Adaptive Security Controls. Comput. Secur. 2022, 115, 102612. [Google Scholar] [CrossRef]
- Grigoriadis, C.; Laborde, R.; Verdier, A.; Kotzanikolaou, P. An Adaptive, Situation-Based Risk Assessment and Security Enforcement Framework for the Maritime Sector. Sensors 2022, 22, 238. [Google Scholar] [CrossRef] [PubMed]
- Chehida, S.; Rutten, E.; Giraud, G.; Mocanu, S. A Model-Based Approach for Self-Adaptive Security in CPS: Application to Smart Grids. J. Syst. Archit. 2024, 150, 103118. [Google Scholar] [CrossRef]
- Halgamuge, M.N.; Niyato, D. Adaptive Edge Security Framework for Dynamic IoT Security Policies in Diverse Environments. Comput. Secur. 2025, 148, 104128. [Google Scholar] [CrossRef]
- Kyriakopoulos, K.G.; Kiarie, L.; Aristodemou, M.; Babirye, S.; Patel, A.; Nassiuma, I.; Rezaei, M.; Phillips, I.; Le, A.T.; Maple, C.; et al. Intelligent Asset Parameterisation for Risk-Based Moving Target Defence. Comput. Secur. 2026, 170, 105058. [Google Scholar] [CrossRef]
- Poolsappasit, N.; Dewri, R.; Ray, I. Dynamic Security Risk Management Using Bayesian Attack Graphs. IEEE Trans. Dependable Secur. Comput. 2012, 9, 61–74. [Google Scholar] [CrossRef]
- Zhang, H.; Chari, K.; Agrawal, M. Decision Support for the Optimal Allocation of Security Controls. Decis. Support Syst. 2018, 115, 92–104. [Google Scholar] [CrossRef]
- Khouzani, M.H.R.; Liu, Z.; Malacaria, P. Scalable Min-Max Multi-Objective Cyber-Security Optimisation over Probabilistic Attack Graphs. Eur. J. Oper. Res. 2019, 278, 894–903. [Google Scholar] [CrossRef]
- Kavallieratos, G.; Spathoulas, G.; Katsikas, S. Cyber Risk Propagation and Optimal Selection of Cybersecurity Controls for Complex Cyberphysical Systems. Sensors 2021, 21, 1691. [Google Scholar] [CrossRef] [PubMed]
- Angermeir, F.; Fischbach, J.; Moyón, F.; Méndez, D. Towards Automated Continuous Security Compliance. In Proceedings of the 18th ACM/IEEE International Symposium on Empirical Software Engineering and Measurement (ESEM), 2024; pp. 440–446. [Google Scholar] [CrossRef]
- National Institute of Standards and Technology. Open Security Controls Assessment Language (OSCAL). Accessed. 2026. (accessed on 29 August 2026).
- El Amin, H.; Samhat, A.E.; Chamoun, M.; Oueidat, L.; Feghali, A. An Integrated Approach to Cyber Risk Management with Cyber Threat Intelligence Framework to Secure Critical Infrastructure. J. Cybersecur. Priv. 2024, 4, 357–381. [Google Scholar] [CrossRef]
- Regueiro, C.; Urquizu, B. Blockchain-Based Evidence Trustworthiness System in Certification. J. Cybersecur. Priv. 2025, 5, 1. [Google Scholar] [CrossRef]
- Skladannyi, P.; Kostiuk, Y.; Khorolska, K.; Bebeshko, B.; Sokolov, V. Model and Methodology for the Formation of Adaptive Security Profiles for the Protection of Wireless Networks in the Face of Dynamic Cyber Threats. Proc. CEUR Workshop Proc. 2025, Vol. 4042, 17–36. [Google Scholar]
- Ma, Y.W.; Tu, Y.H.; Shen, C.T. DSACR: A Defense-Based System with Adaptive Cyber Resilience for Industrial Control Systems. Int. J. Crit. Infrastruct. Prot. 2024, 45, 100662. [Google Scholar] [CrossRef]
- Itäpelto, T.; Elhajj, M.; van Sinderen, M. Digital Twin Application in Lifecycle Security of Critical Infrastructures: A Systematic Literature Review. Int. J. Crit. Infrastruct. Prot. 2025, 50, 100783. [Google Scholar] [CrossRef]
- Jacobs, J.; Romanosky, S.; Edwards, B.; Adjerid, I.; Roytman, M. Exploit Prediction Scoring System (EPSS). Digit. Threat. Res. Pract. 2021, 2, 20:1–20:17. [Google Scholar] [CrossRef]
- Forum of Incident Response and Security Teams (FIRST). Exploit Prediction Scoring System (EPSS), Accessed. 2026; (accessed on 29 August 2026).
- Cybersecurity and Infrastructure Security Agency. Known Exploited Vulnerabilities Catalog, 2026. Accessed. (accessed on 29 August 2026).
- Joint Task Force. 2020. Security and Privacy Controls for Information Systems and Organizations. Technical Report NIST SP 800-53 Rev. 5. National Institute of Standards and Technology. [Google Scholar] [CrossRef]
Figure 1.
Decision architecture and correspondence between practical inputs and model notation. Monitoring and external signals update , while normative context updates . Mandatory-set validity is checked before the numerical risk threshold. When no mandatory-profile gap exists, the current profile is retained if risk is acceptable; if risk is elevated, Stage 2 is reached only when Stage-1 remediation is infeasible. A mandatory-profile gap can trigger Stage 2 independently of the numerical risk threshold. Structural revision produces only a candidate profile; assessment and reauthorization remain external governance actions.
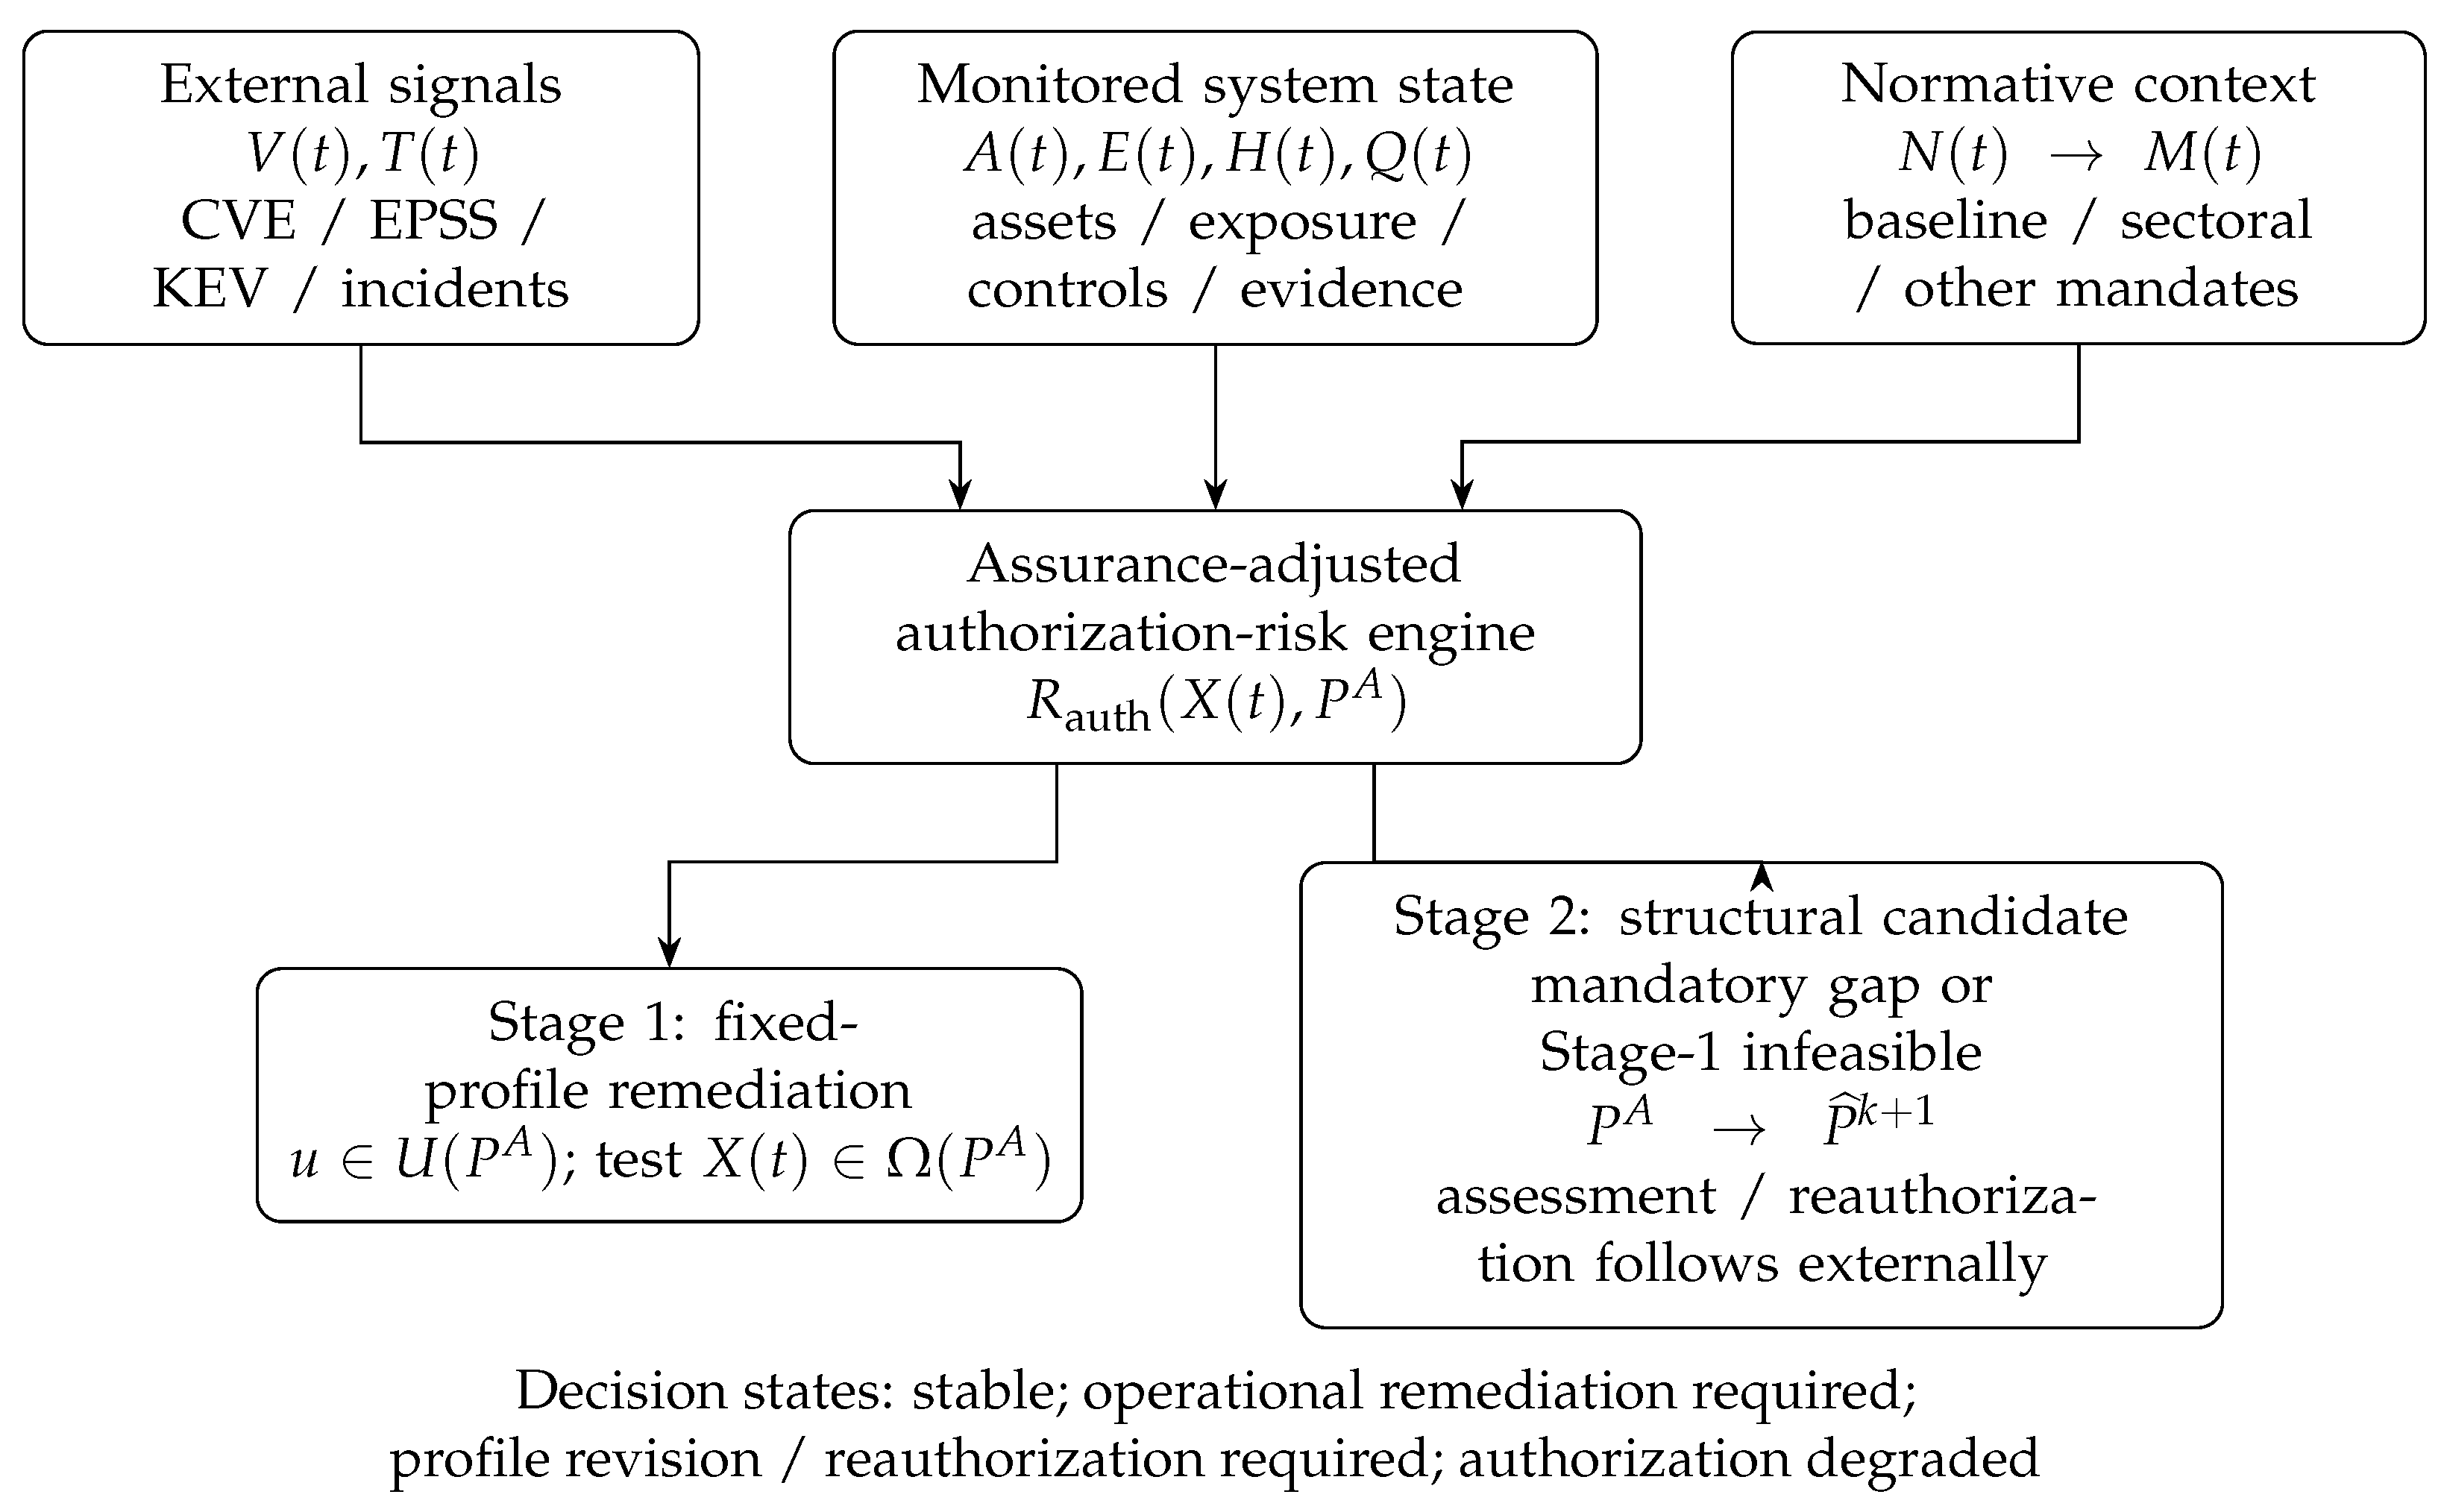
Figure 2.
Conceptual reference architecture used to give the synthetic scenarios operational context. The simulator represents logical zones and state variables; it does not emulate specific products, protocols, or physical-process dynamics.
Figure 2.
Conceptual reference architecture used to give the synthetic scenarios operational context. The simulator represents logical zones and state variables; it does not emulate specific products, protocols, or physical-process dynamics.
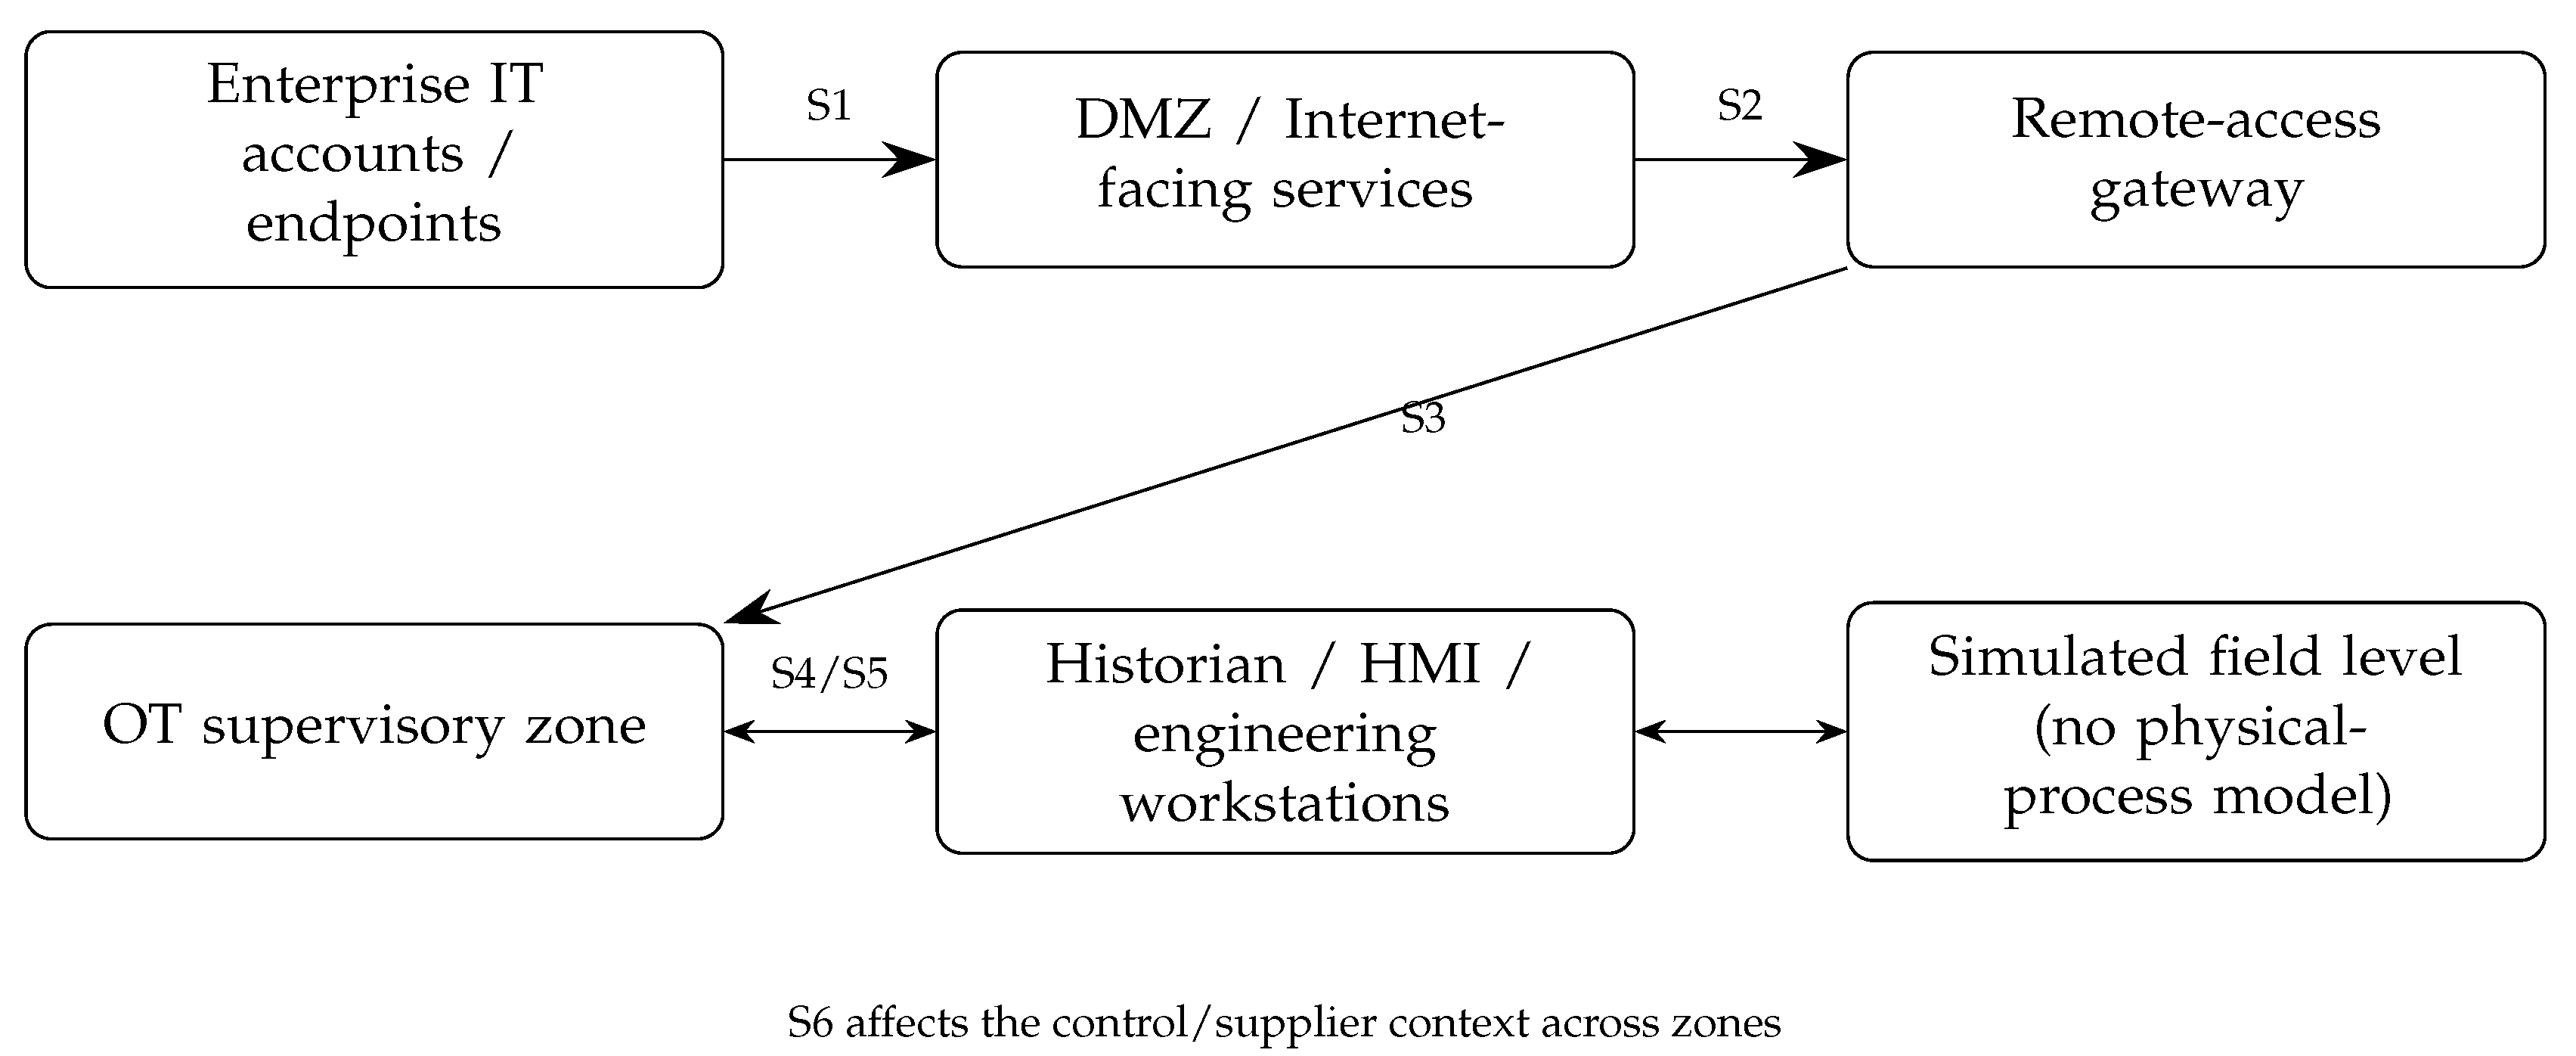
Figure 3.
Assurance-adjusted authorization-risk trajectories in the representative 365-day synthetic run. The dashed line denotes the benchmark threshold .
Figure 3.
Assurance-adjusted authorization-risk trajectories in the representative 365-day synthetic run. The dashed line denotes the benchmark threshold .
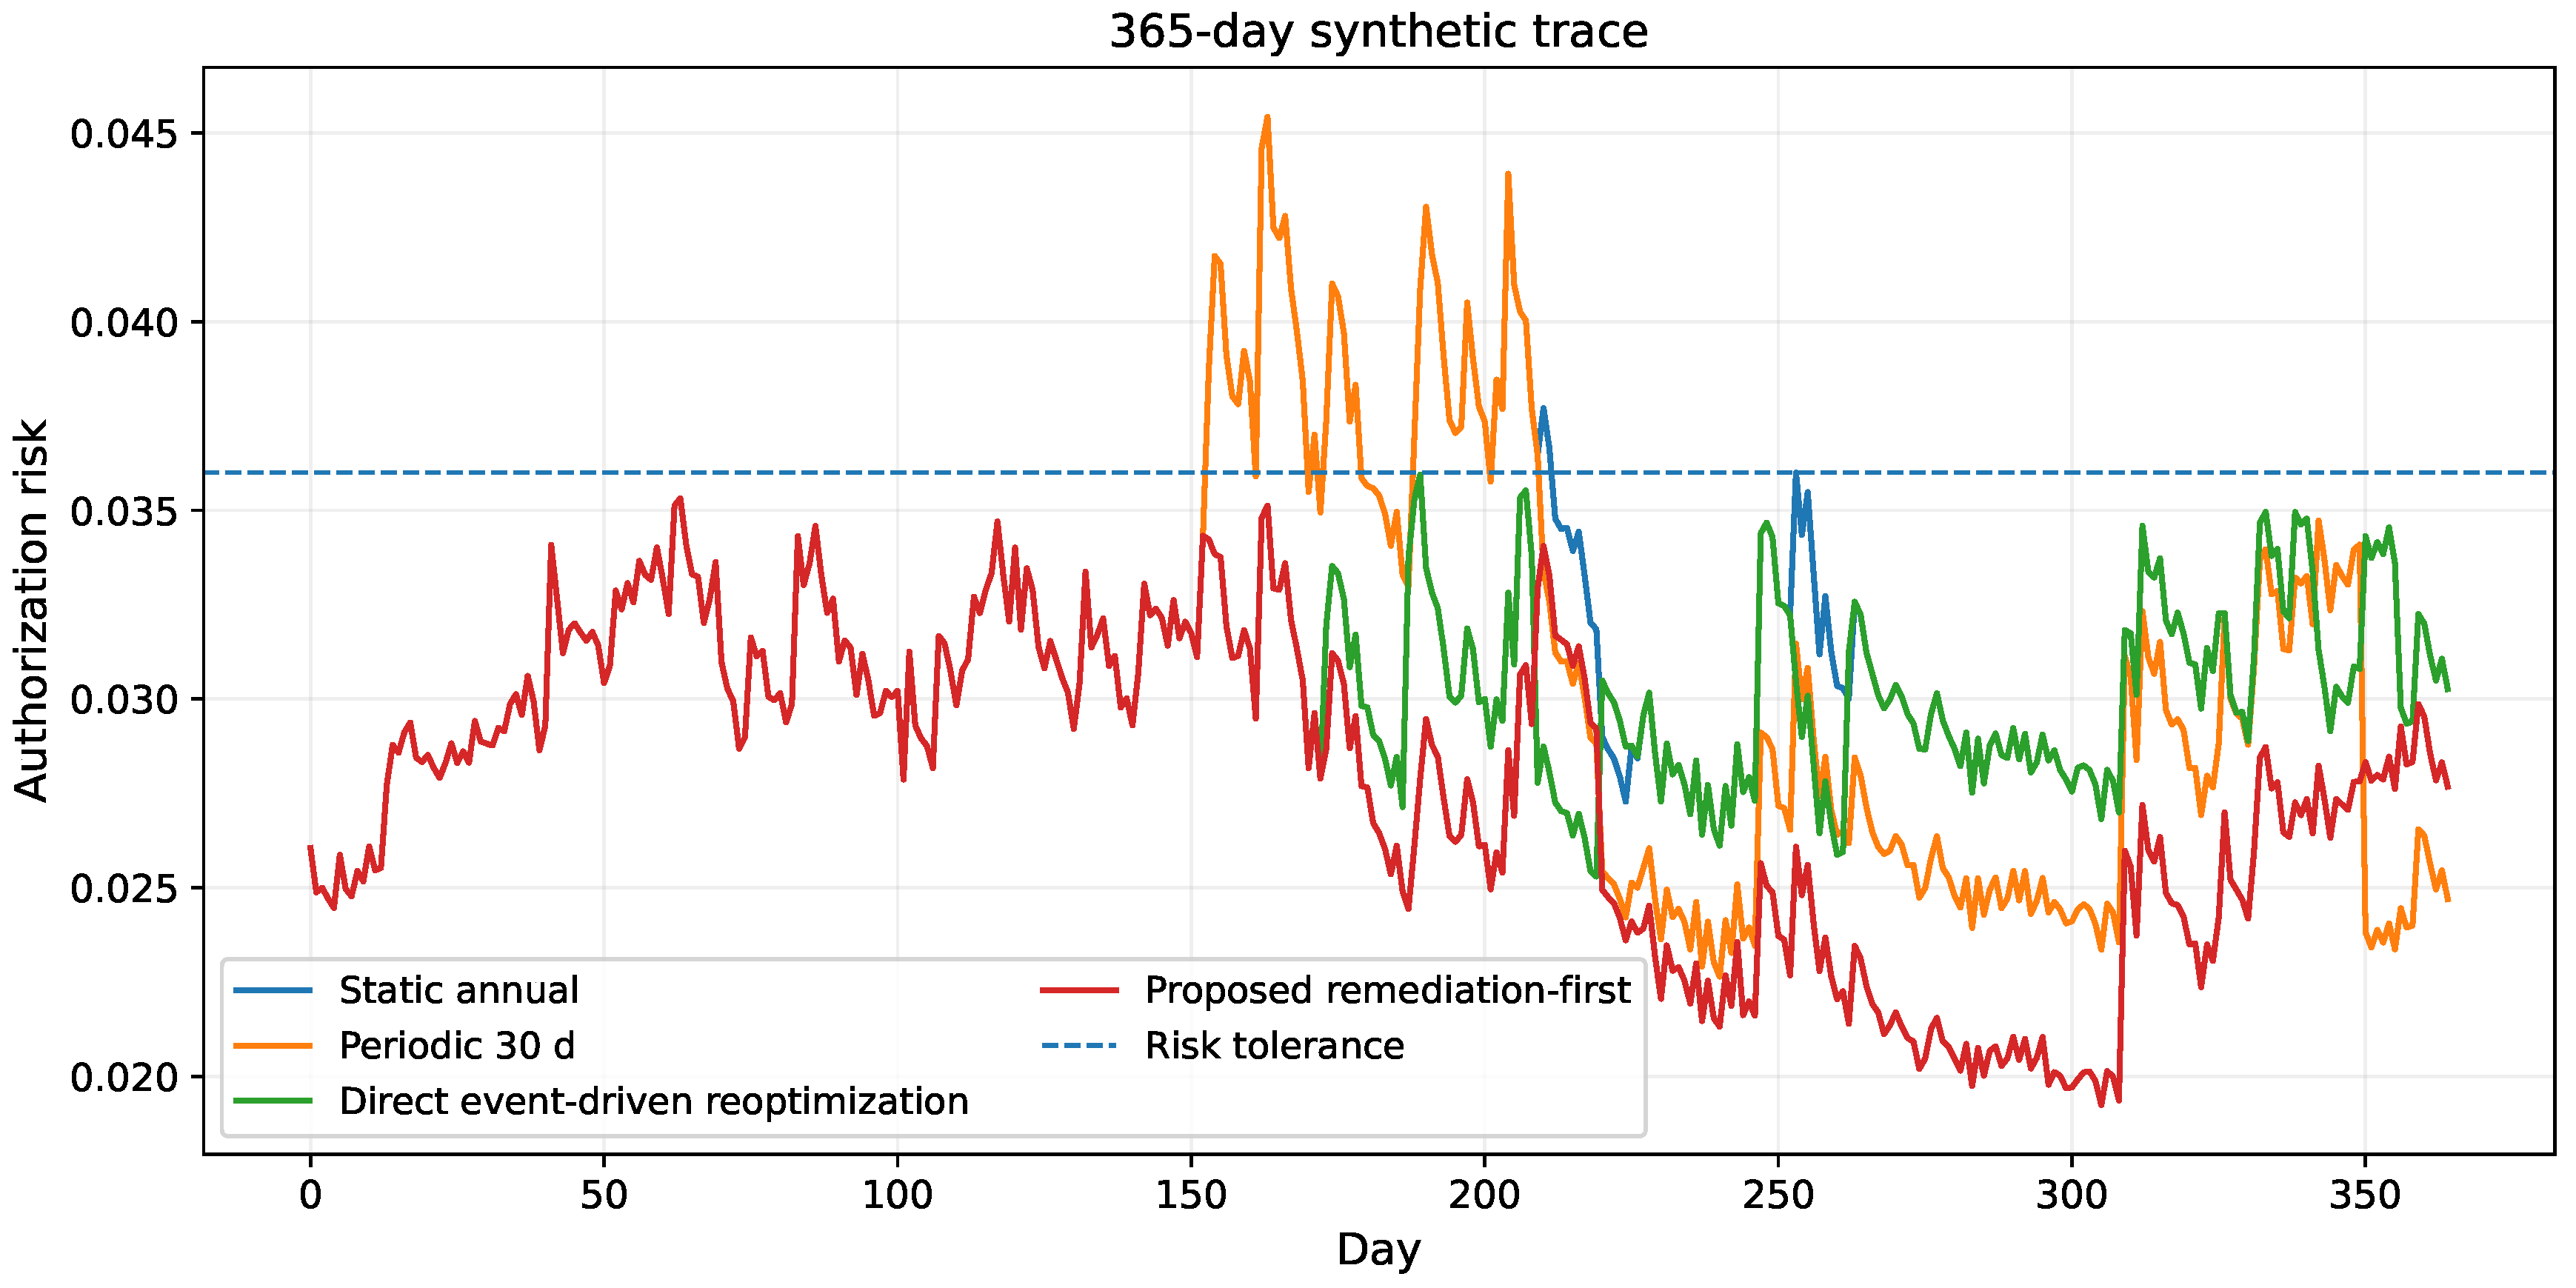
Figure 4.
Target-profile size over the representative run.
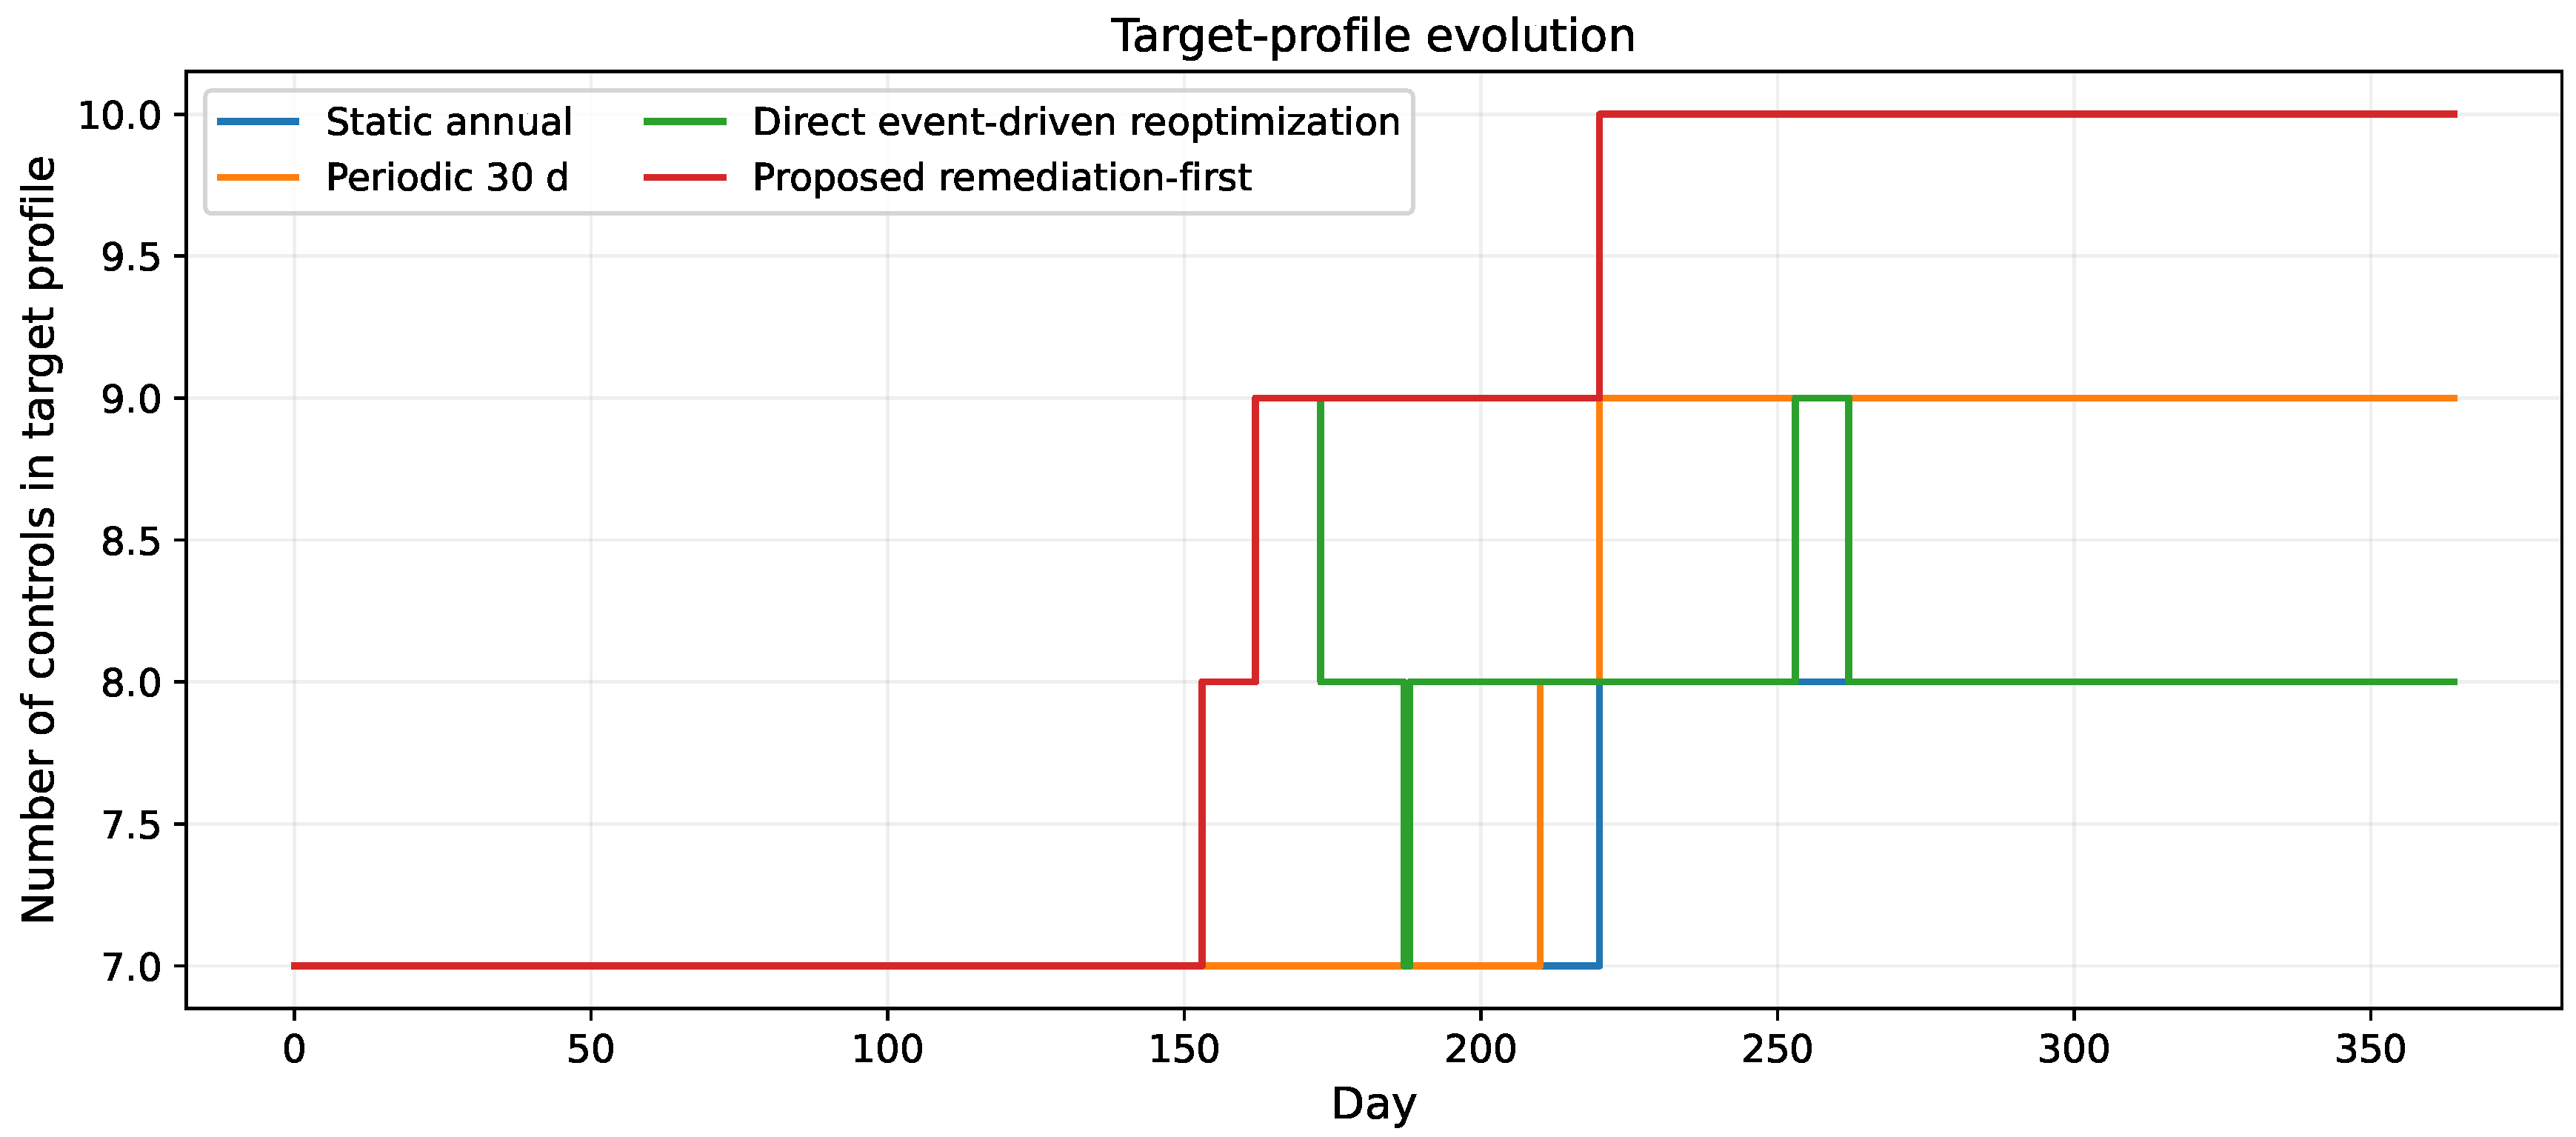
Figure 5.
Control entries included in the proposed target profile over time (1 indicates inclusion).
Figure 5.
Control entries included in the proposed target profile over time (1 indicates inclusion).
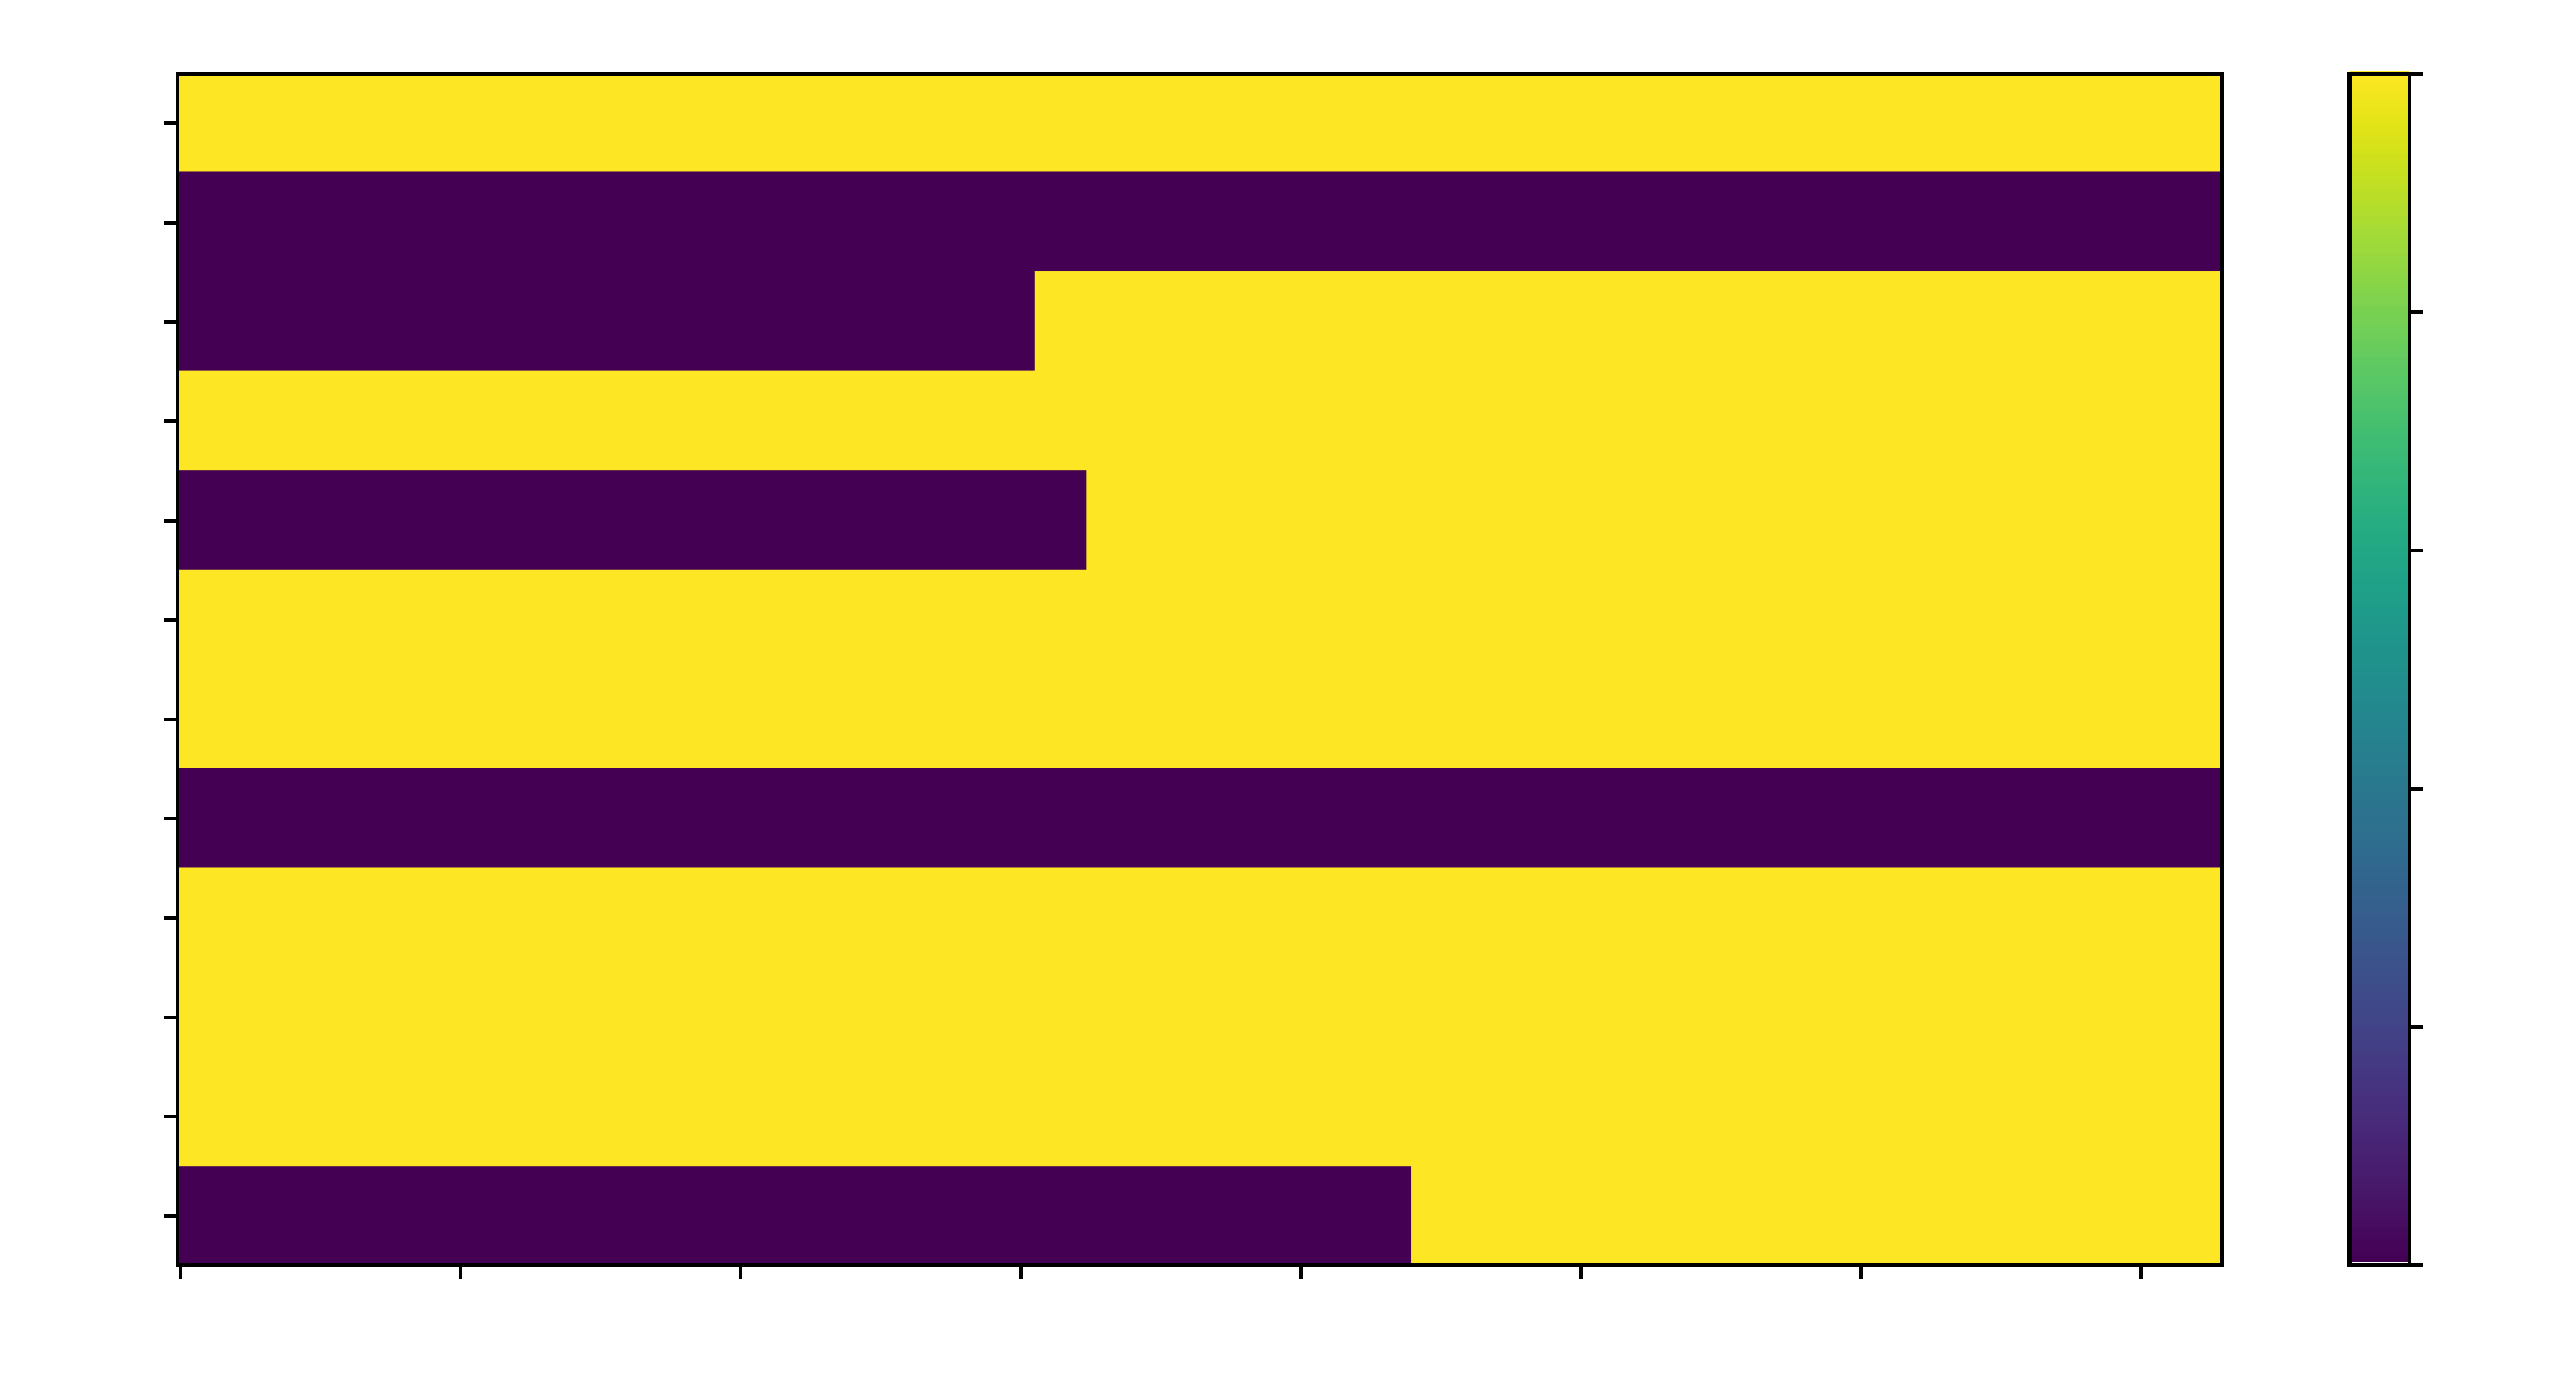
Figure 6.
Trade-off between days above the benchmark risk tolerance and risk-driven profile-revision events in the representative run.
Figure 6.
Trade-off between days above the benchmark risk tolerance and risk-driven profile-revision events in the representative run.
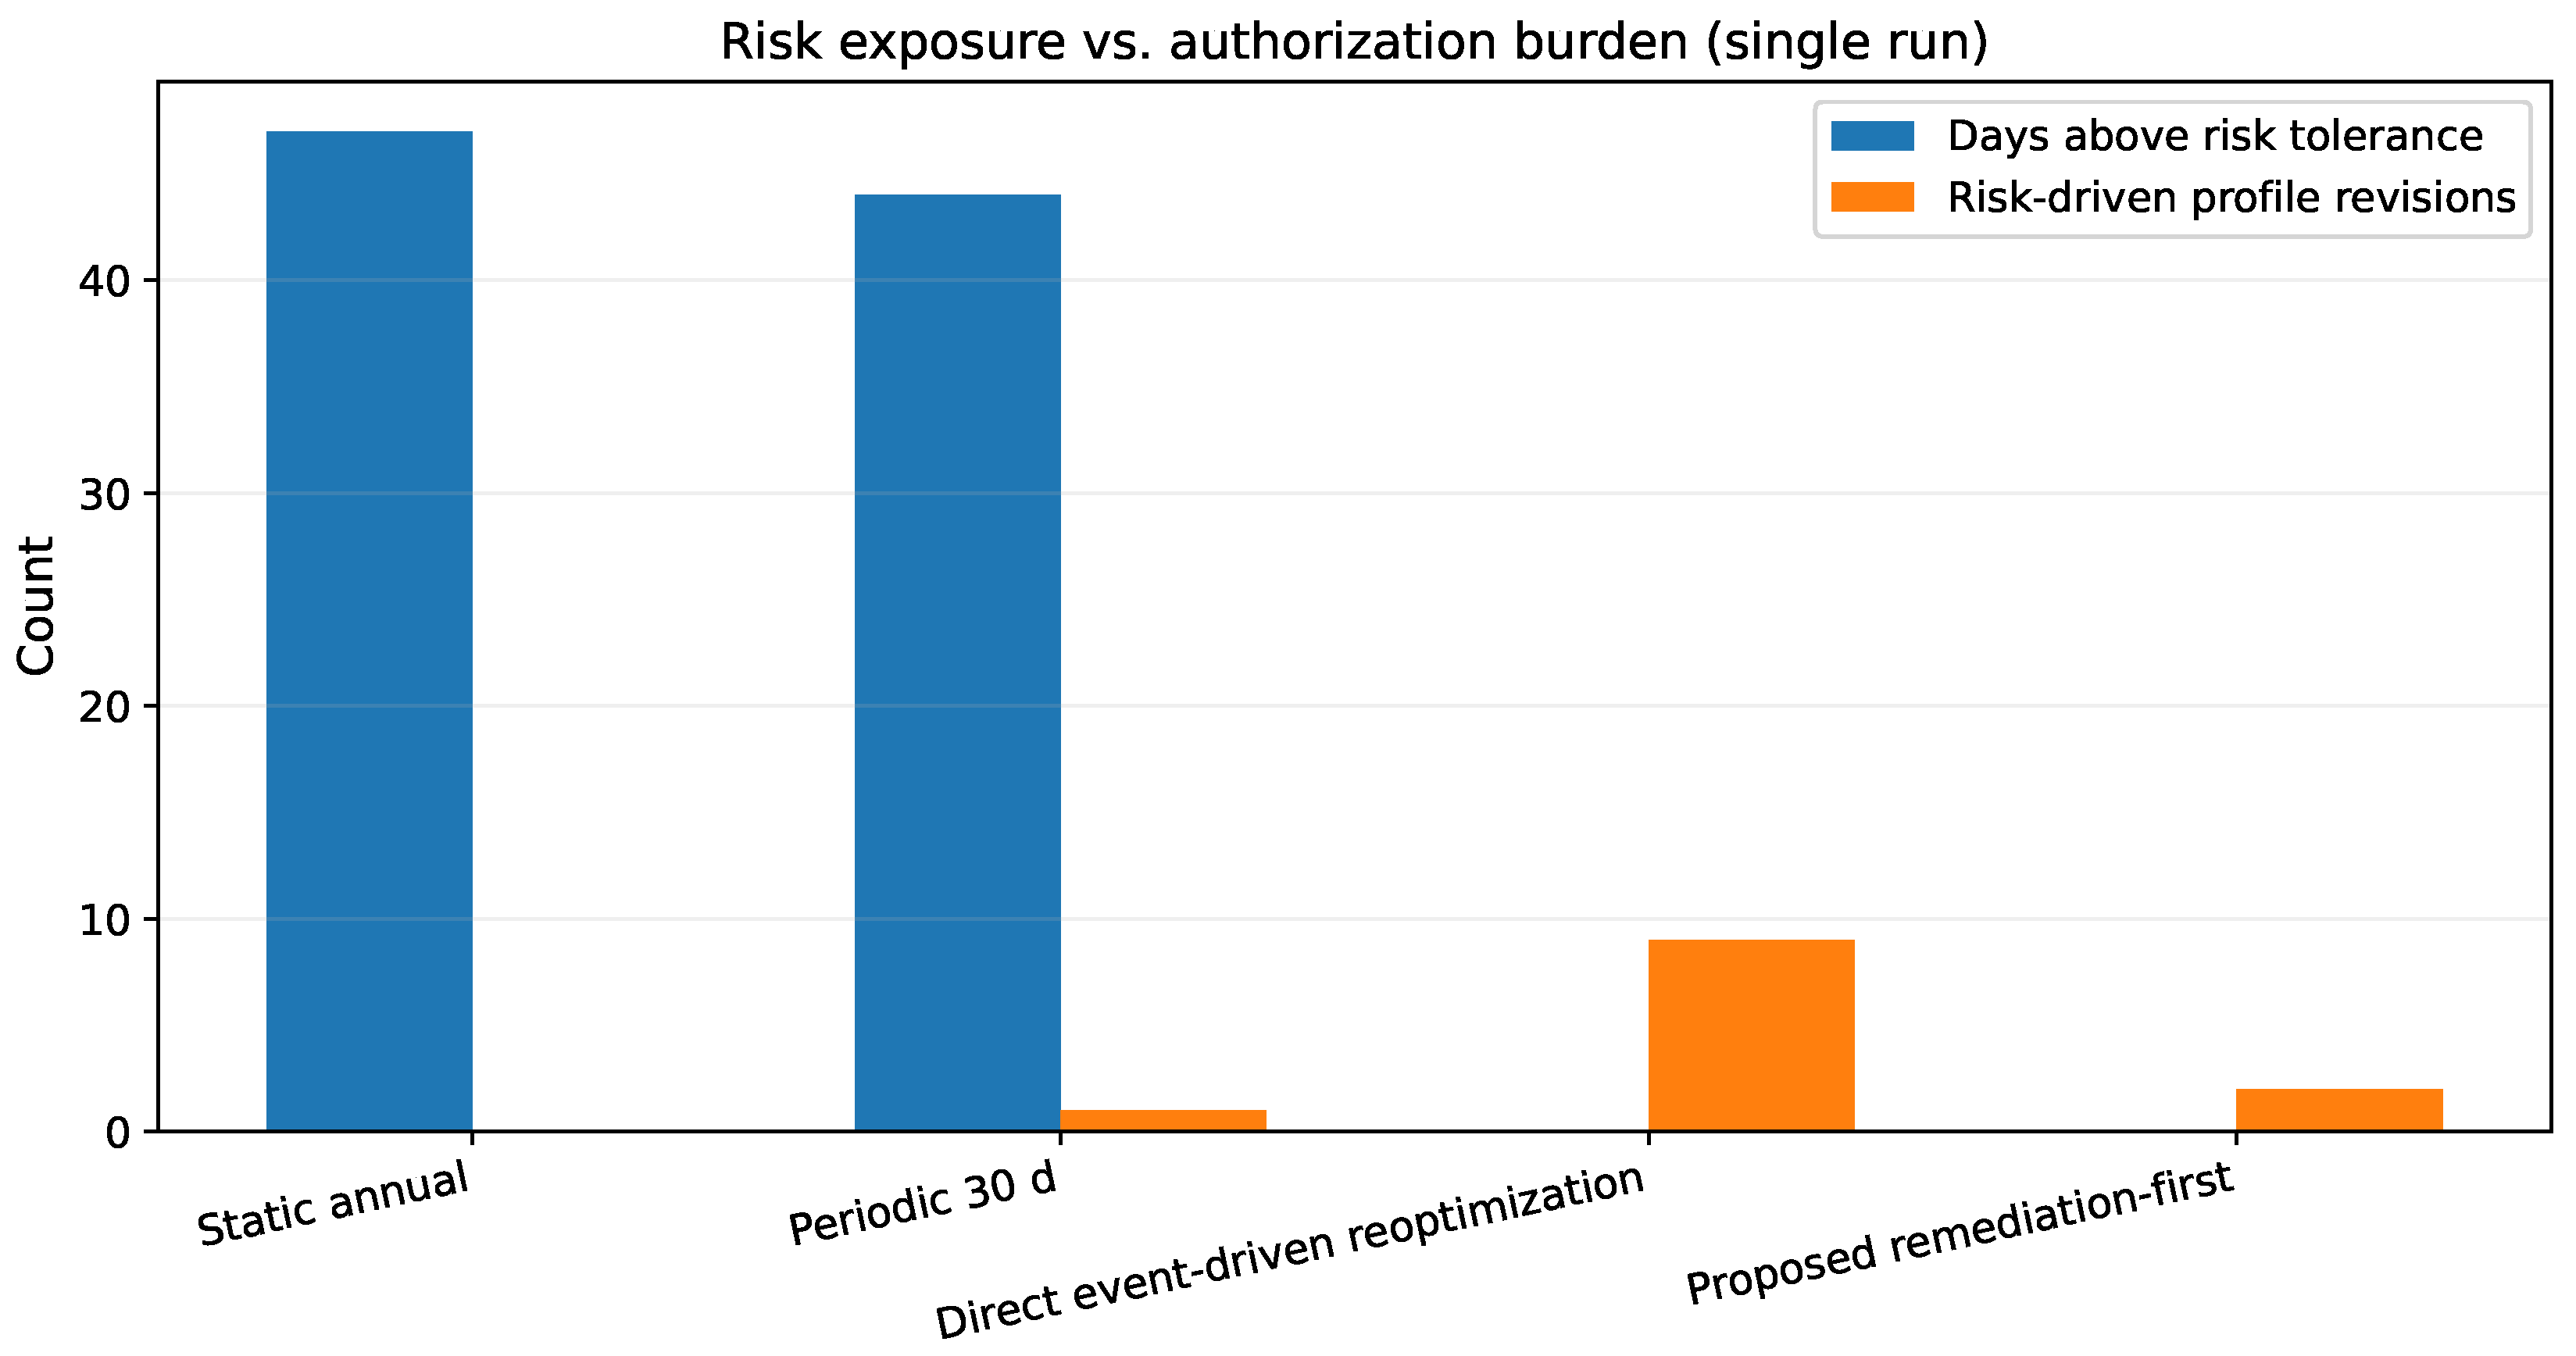
Figure 7.
Time above risk tolerance across 100 paired Monte Carlo replicates (mean ± SD).
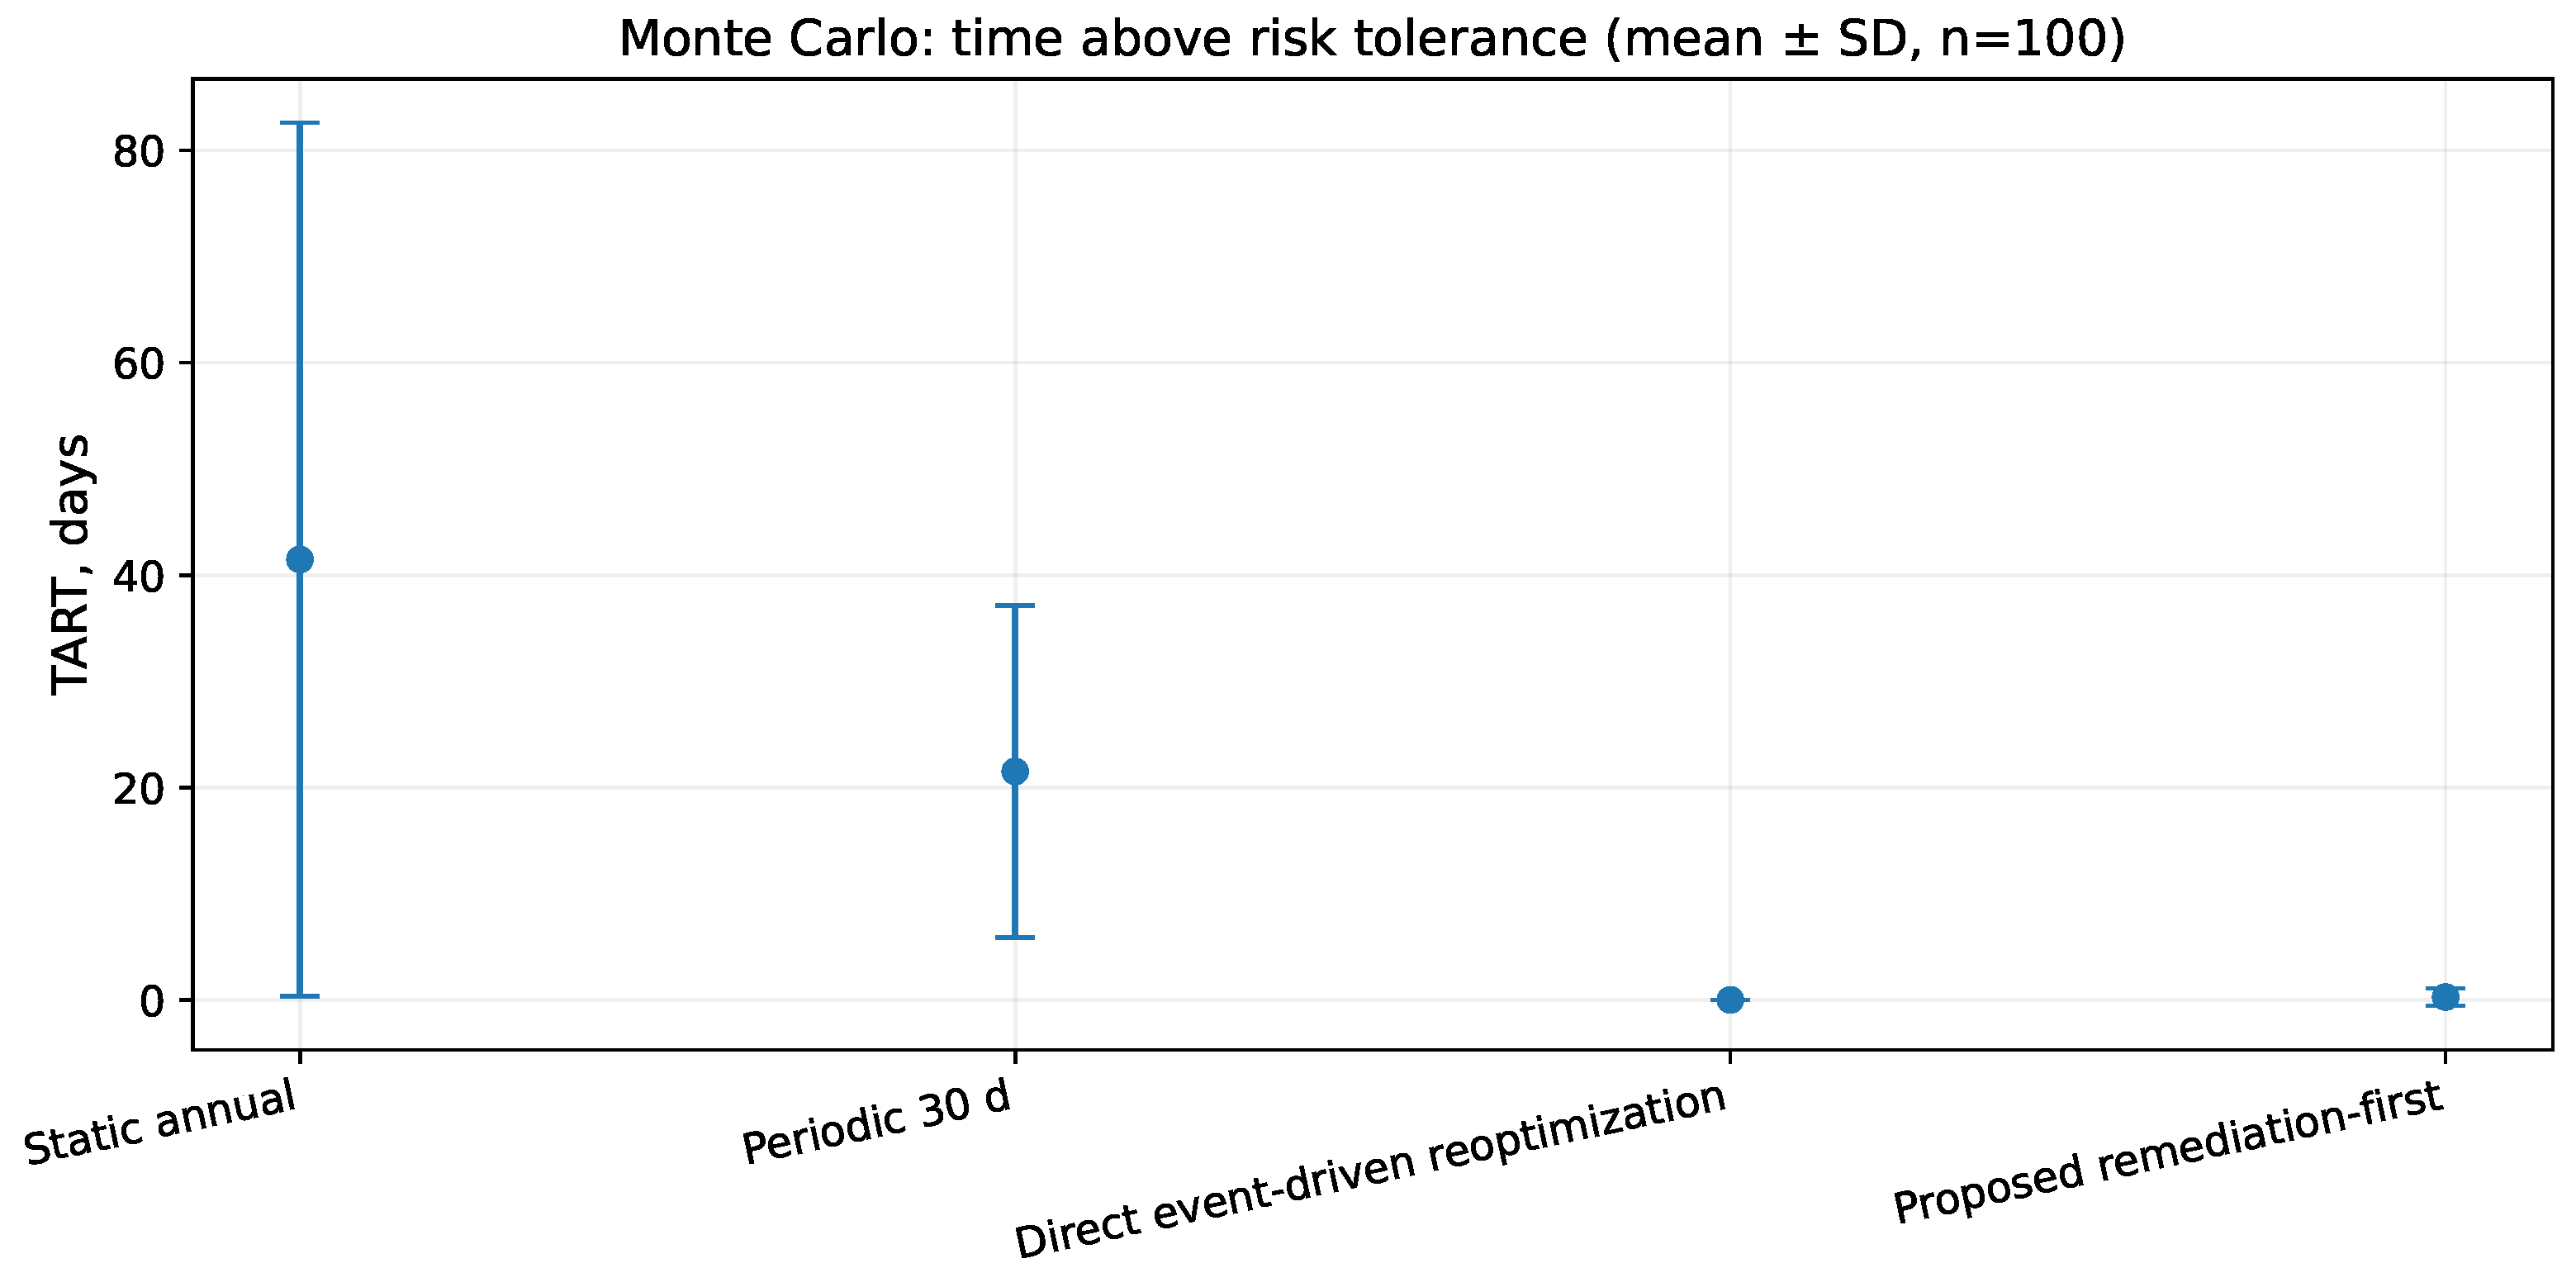
Figure 8.
Number of individual profile-entry changes across 100 paired Monte Carlo replicates (mean ± SD).
Figure 8.
Number of individual profile-entry changes across 100 paired Monte Carlo replicates (mean ± SD).
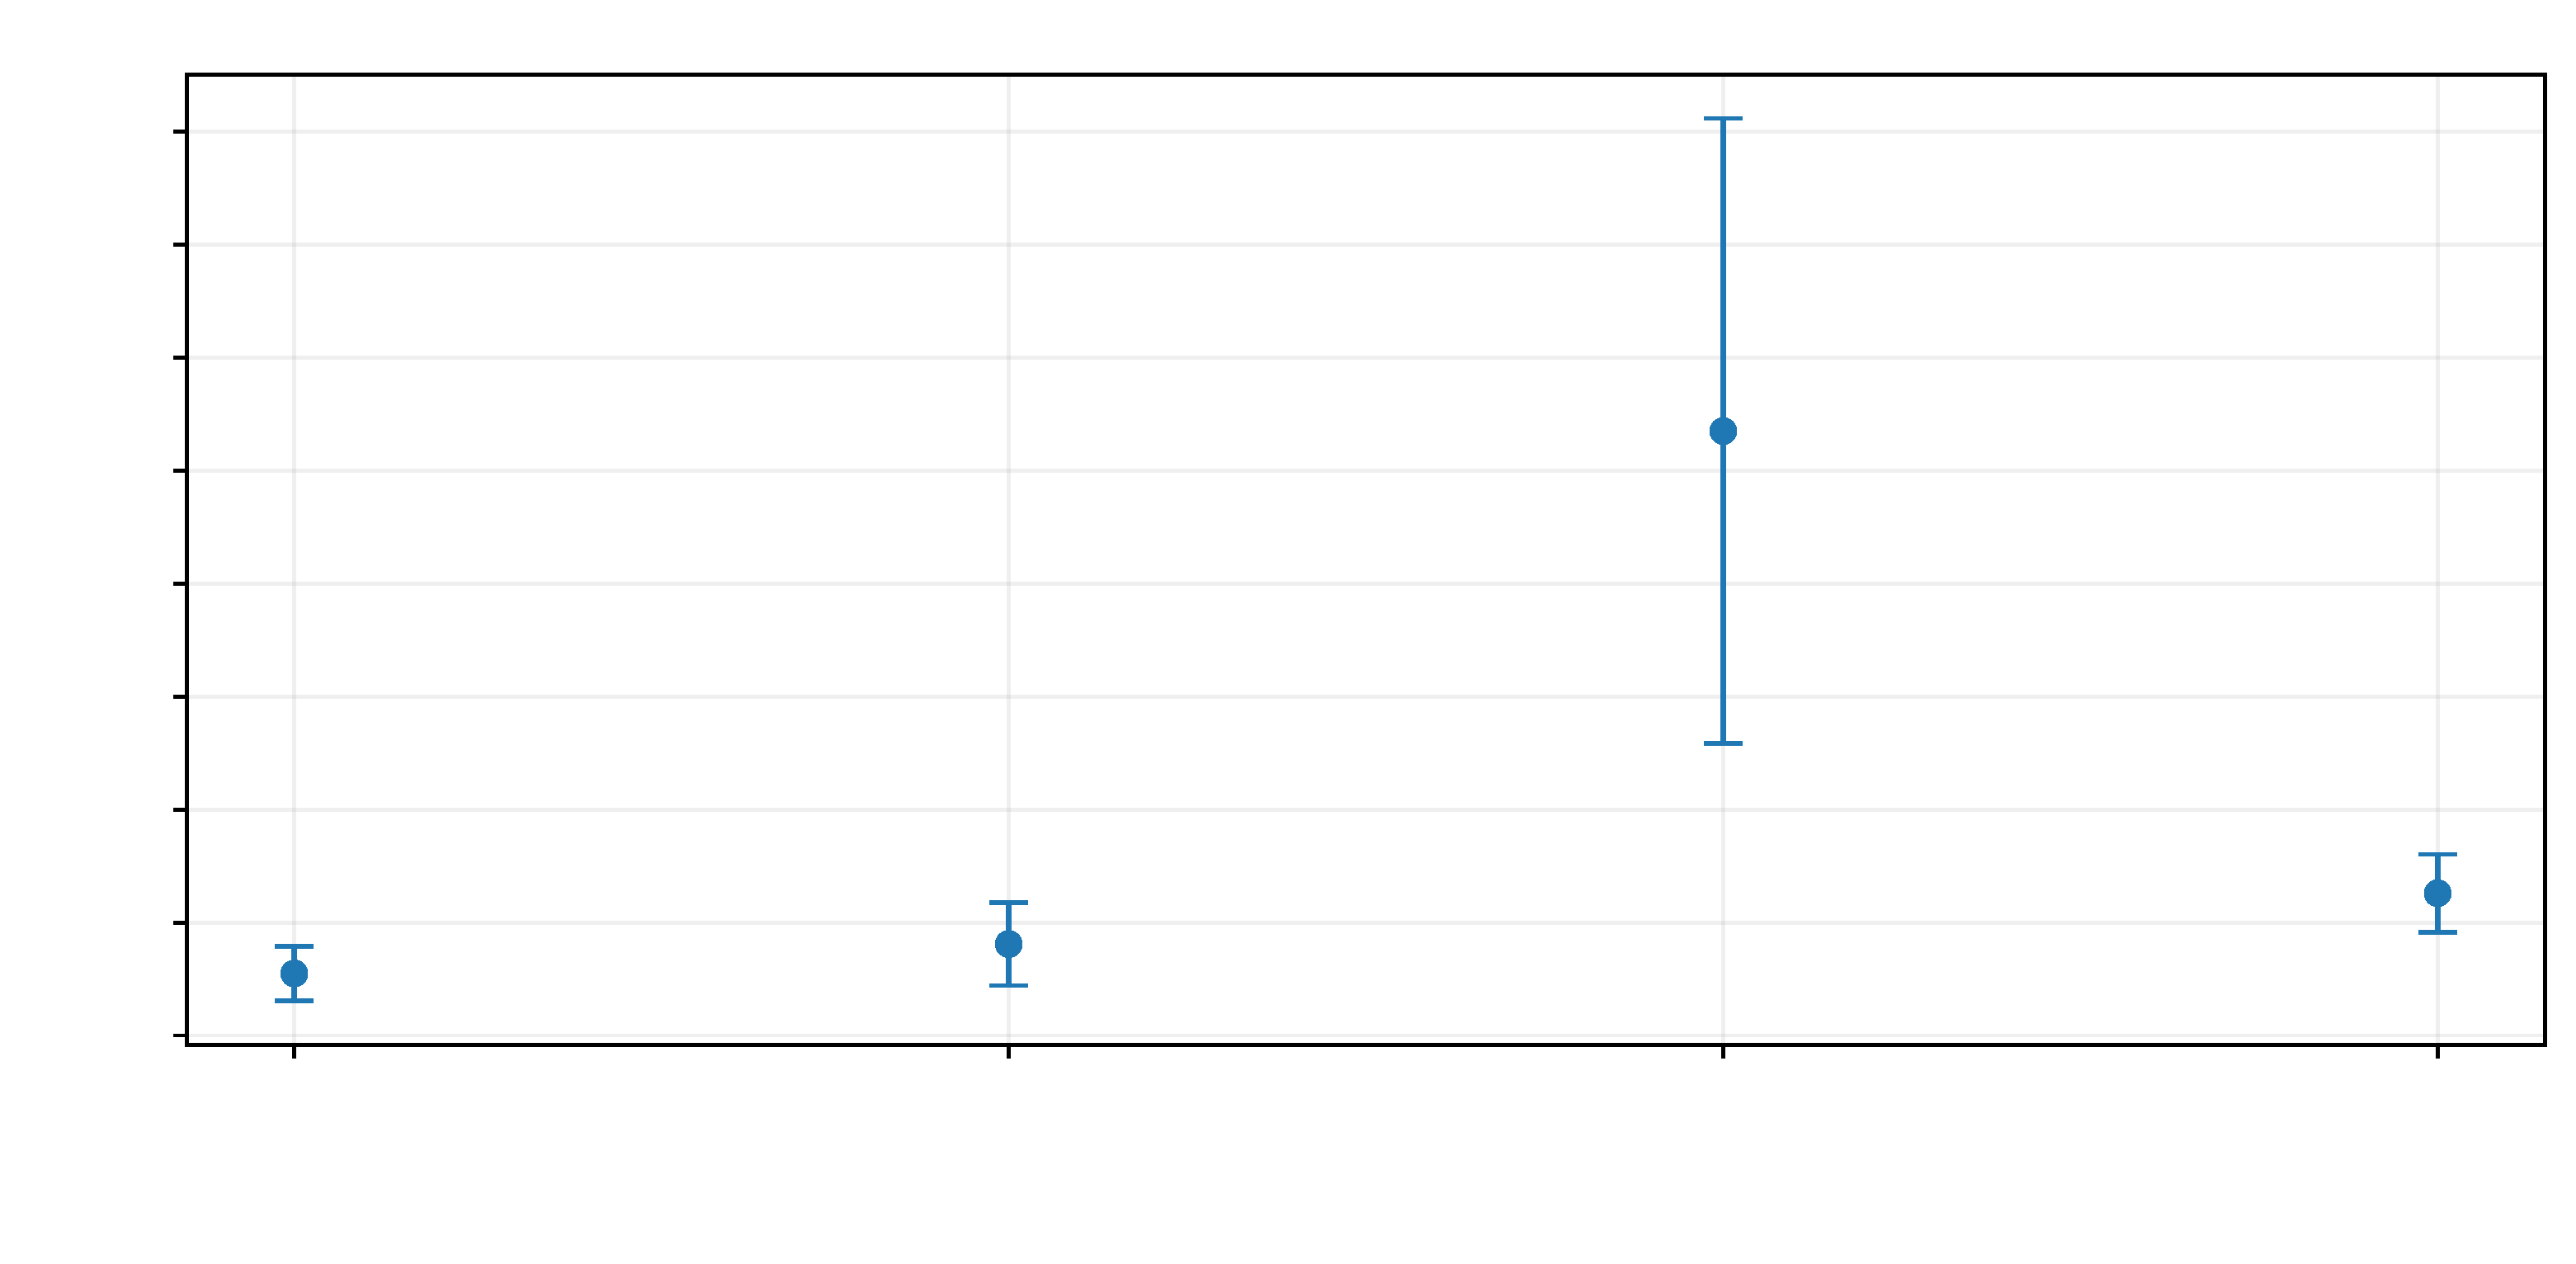
Figure 9.
Component-ablation trade-off between time above risk tolerance and risk-driven profile-revision frequency. The No Stage 1 point is the matched-parameter comparison that isolates the remediation-first ordering.
Figure 9.
Component-ablation trade-off between time above risk tolerance and risk-driven profile-revision frequency. The No Stage 1 point is the matched-parameter comparison that isolates the remediation-first ordering.
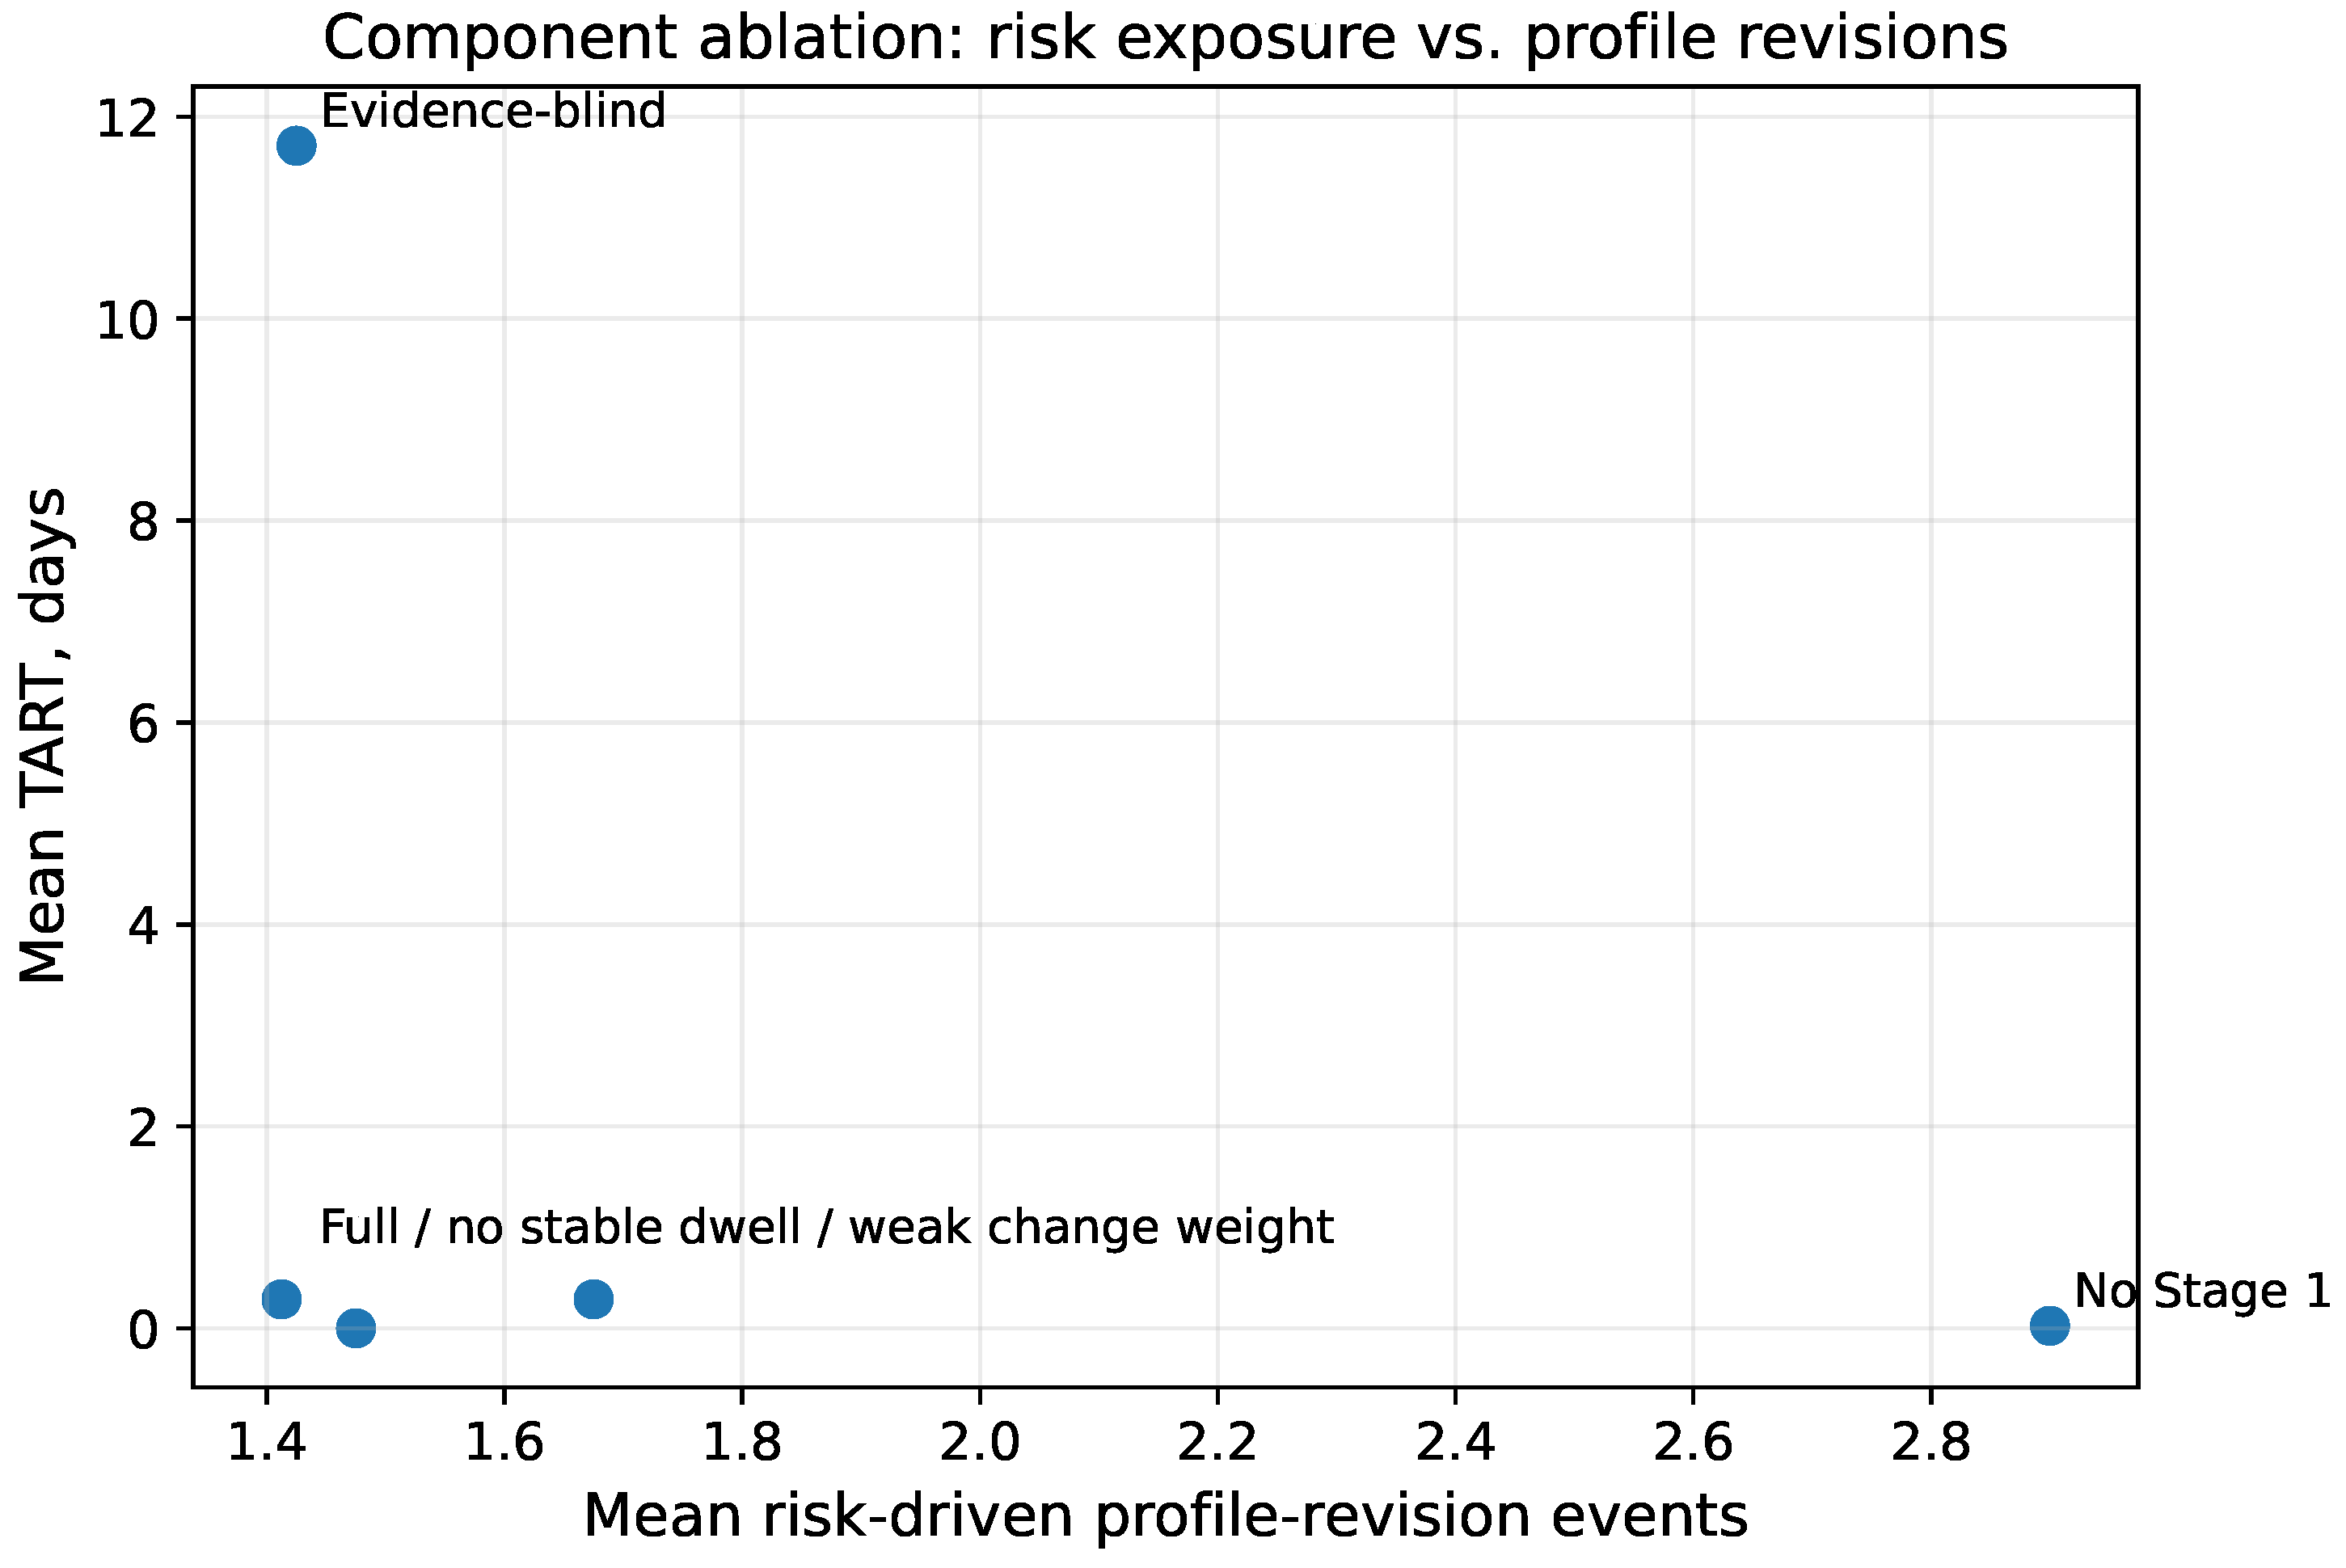
Figure 10.
Sensitivity of the proposed strategy to a global multiplier on assumed control effectiveness. The multiplier is a model-uncertainty stress factor, not an empirical confidence interval.
Figure 10.
Sensitivity of the proposed strategy to a global multiplier on assumed control effectiveness. The multiplier is a model-uncertainty stress factor, not an empirical confidence interval.
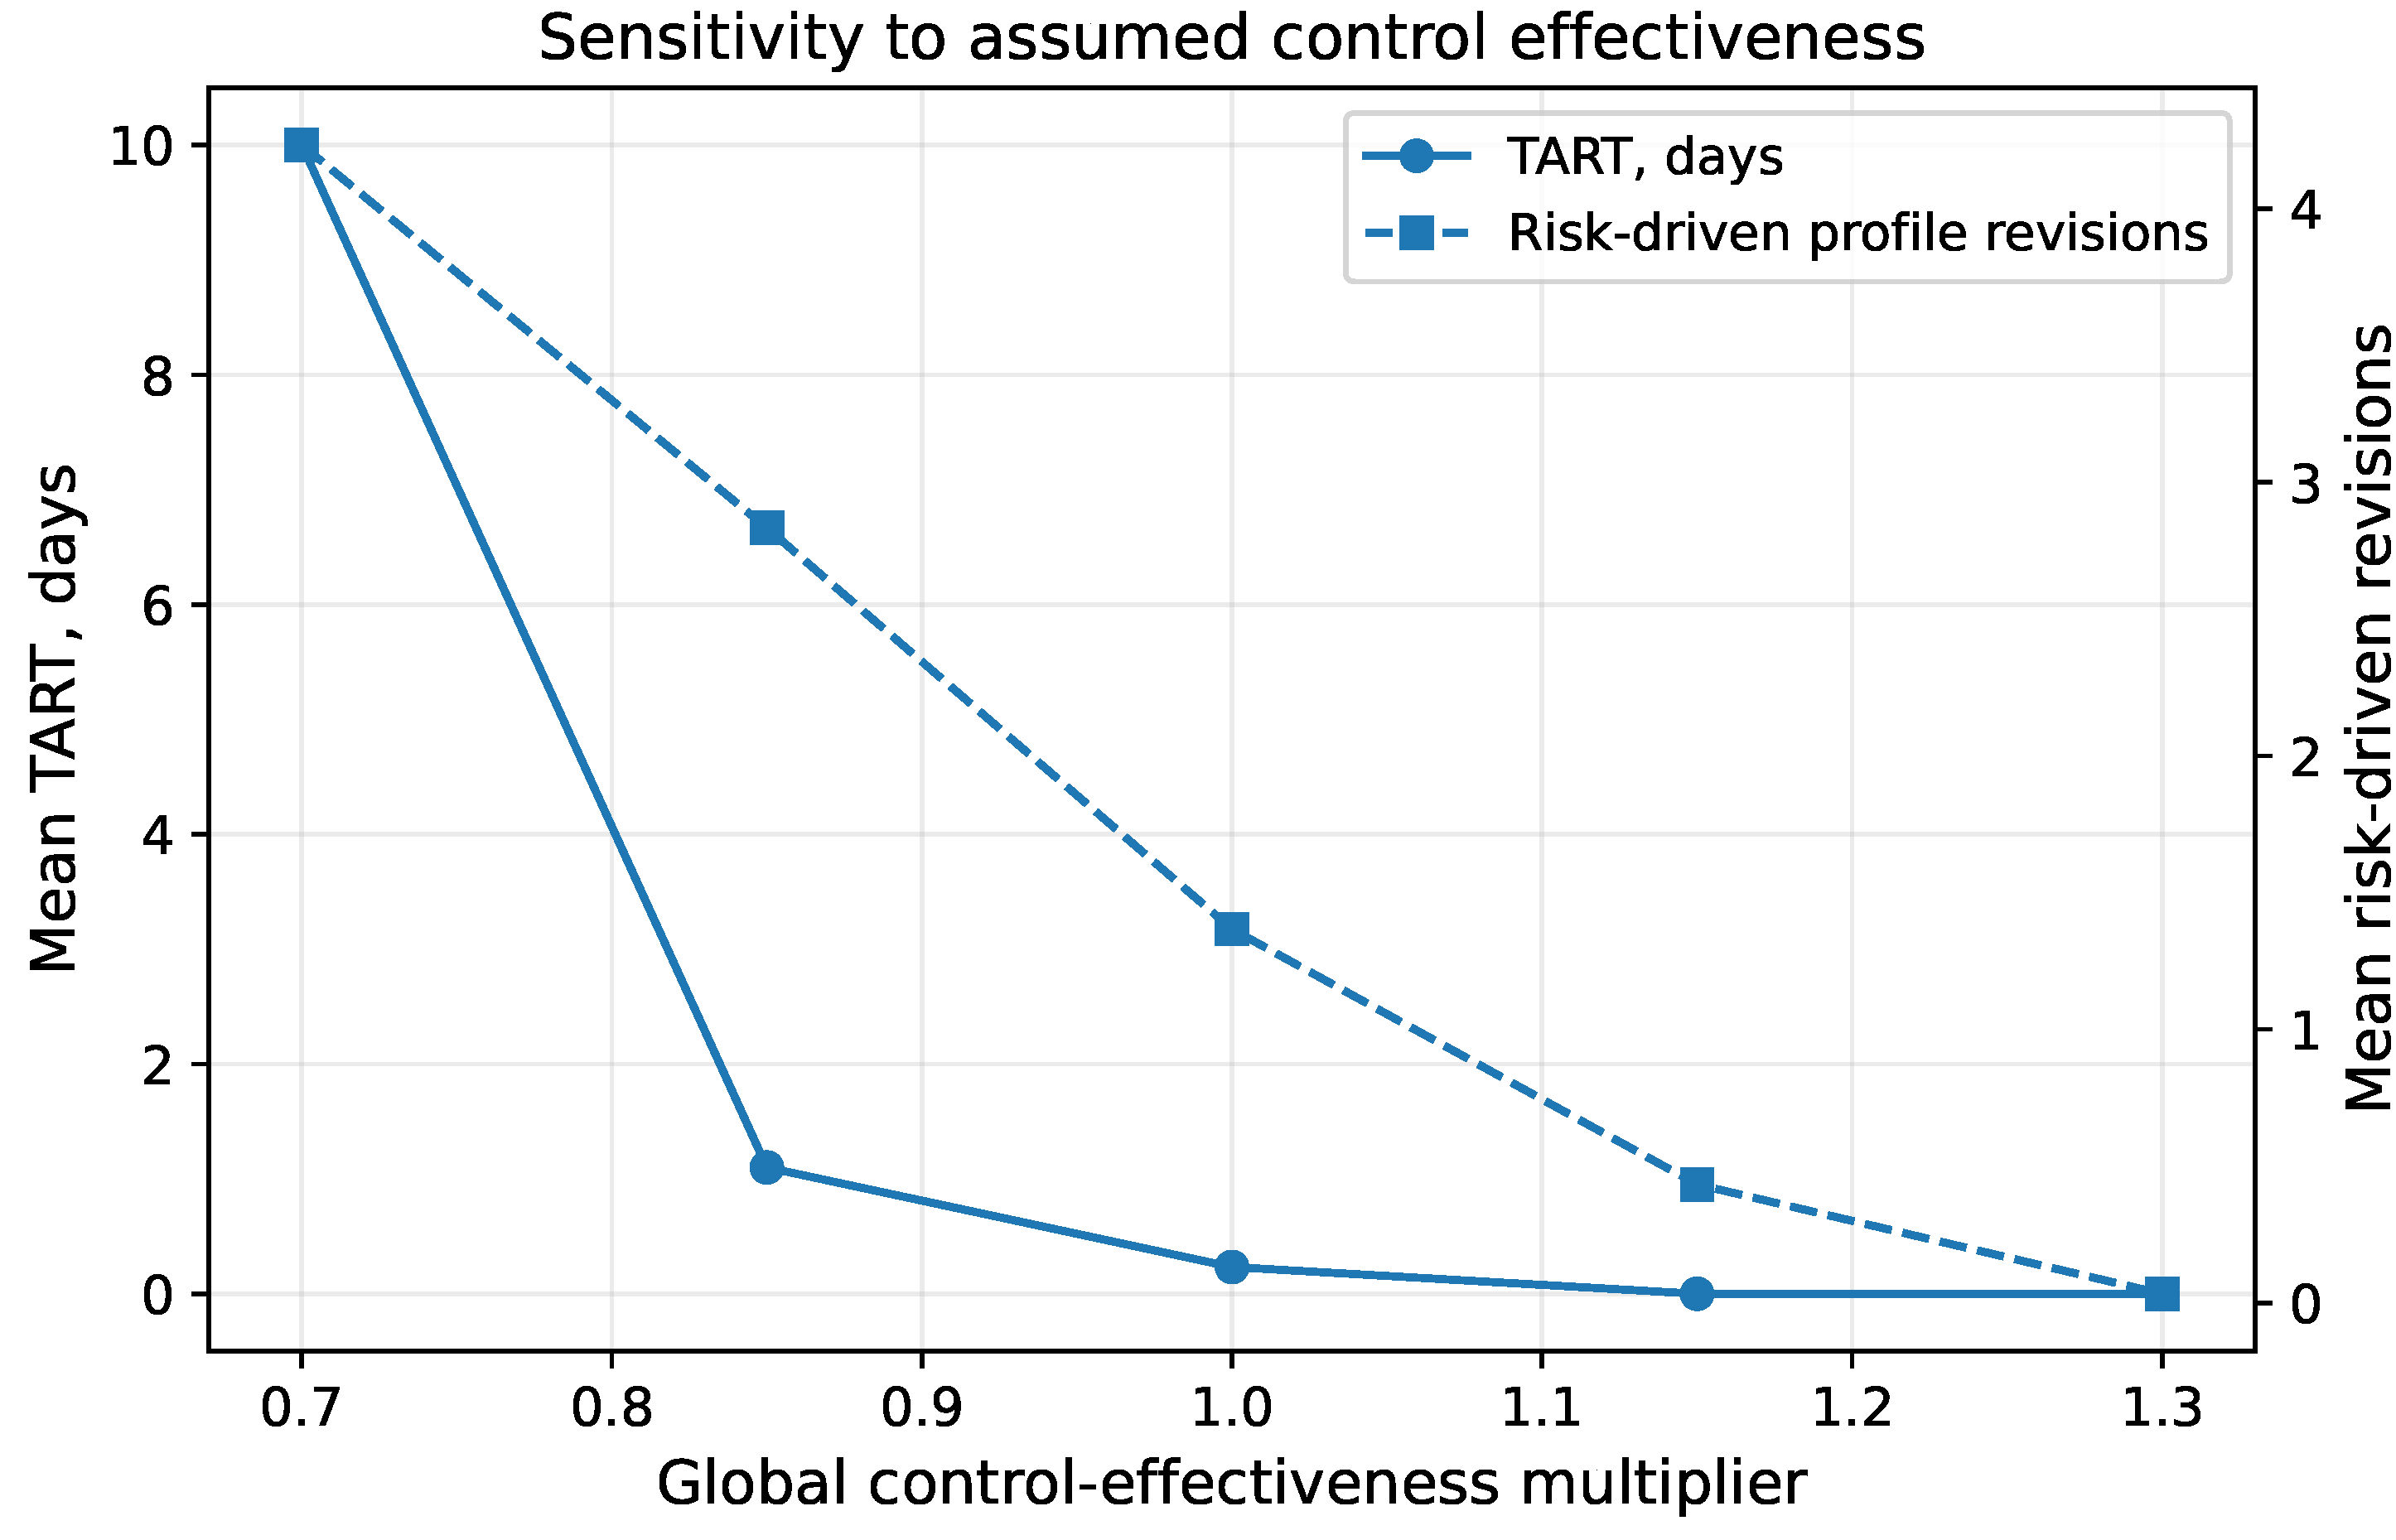
Figure 11.
Runtime of the ratio-based candidate-profile heuristic in the synthetic scalability stress test.
Figure 11.
Runtime of the ratio-based candidate-profile heuristic in the synthetic scalability stress test.
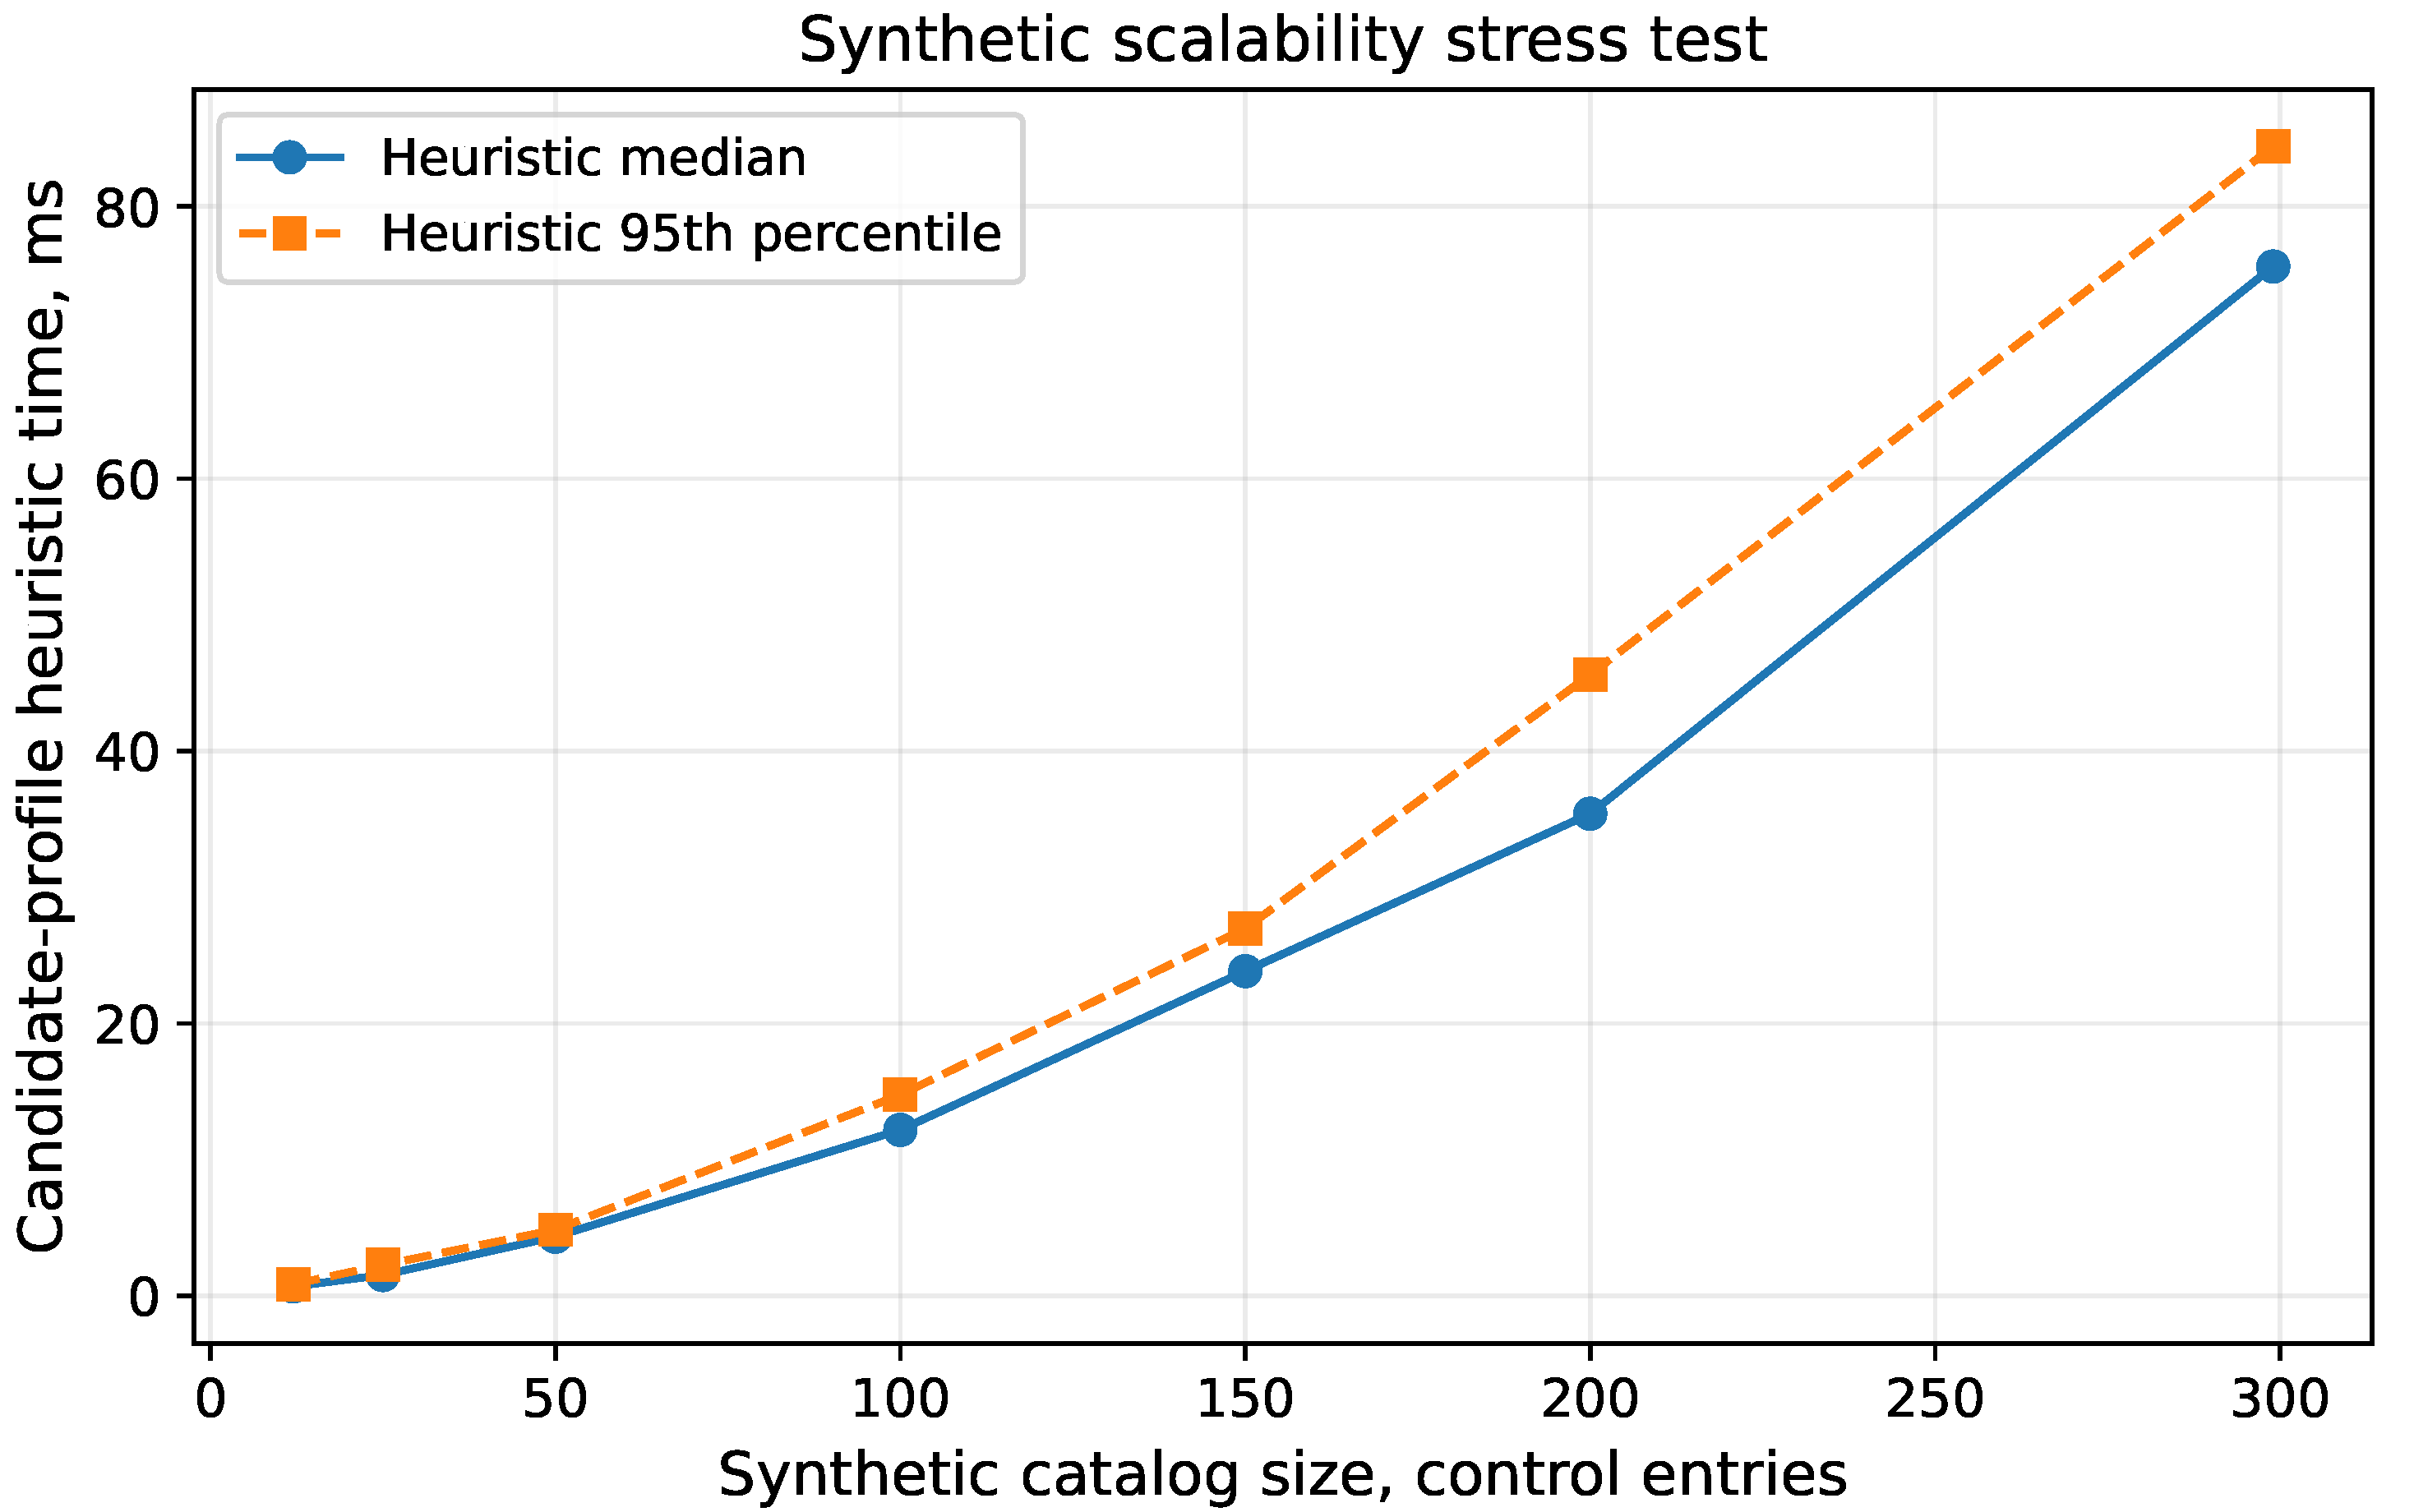
Figure 12.
Position of the remediation-first decision model in the adaptive-maintenance loop of the target-profile lifecycle. States without a structural gap retain the current profile and use operational remediation only when needed; structural gaps produce a candidate profile, while the authorization decision remains external.
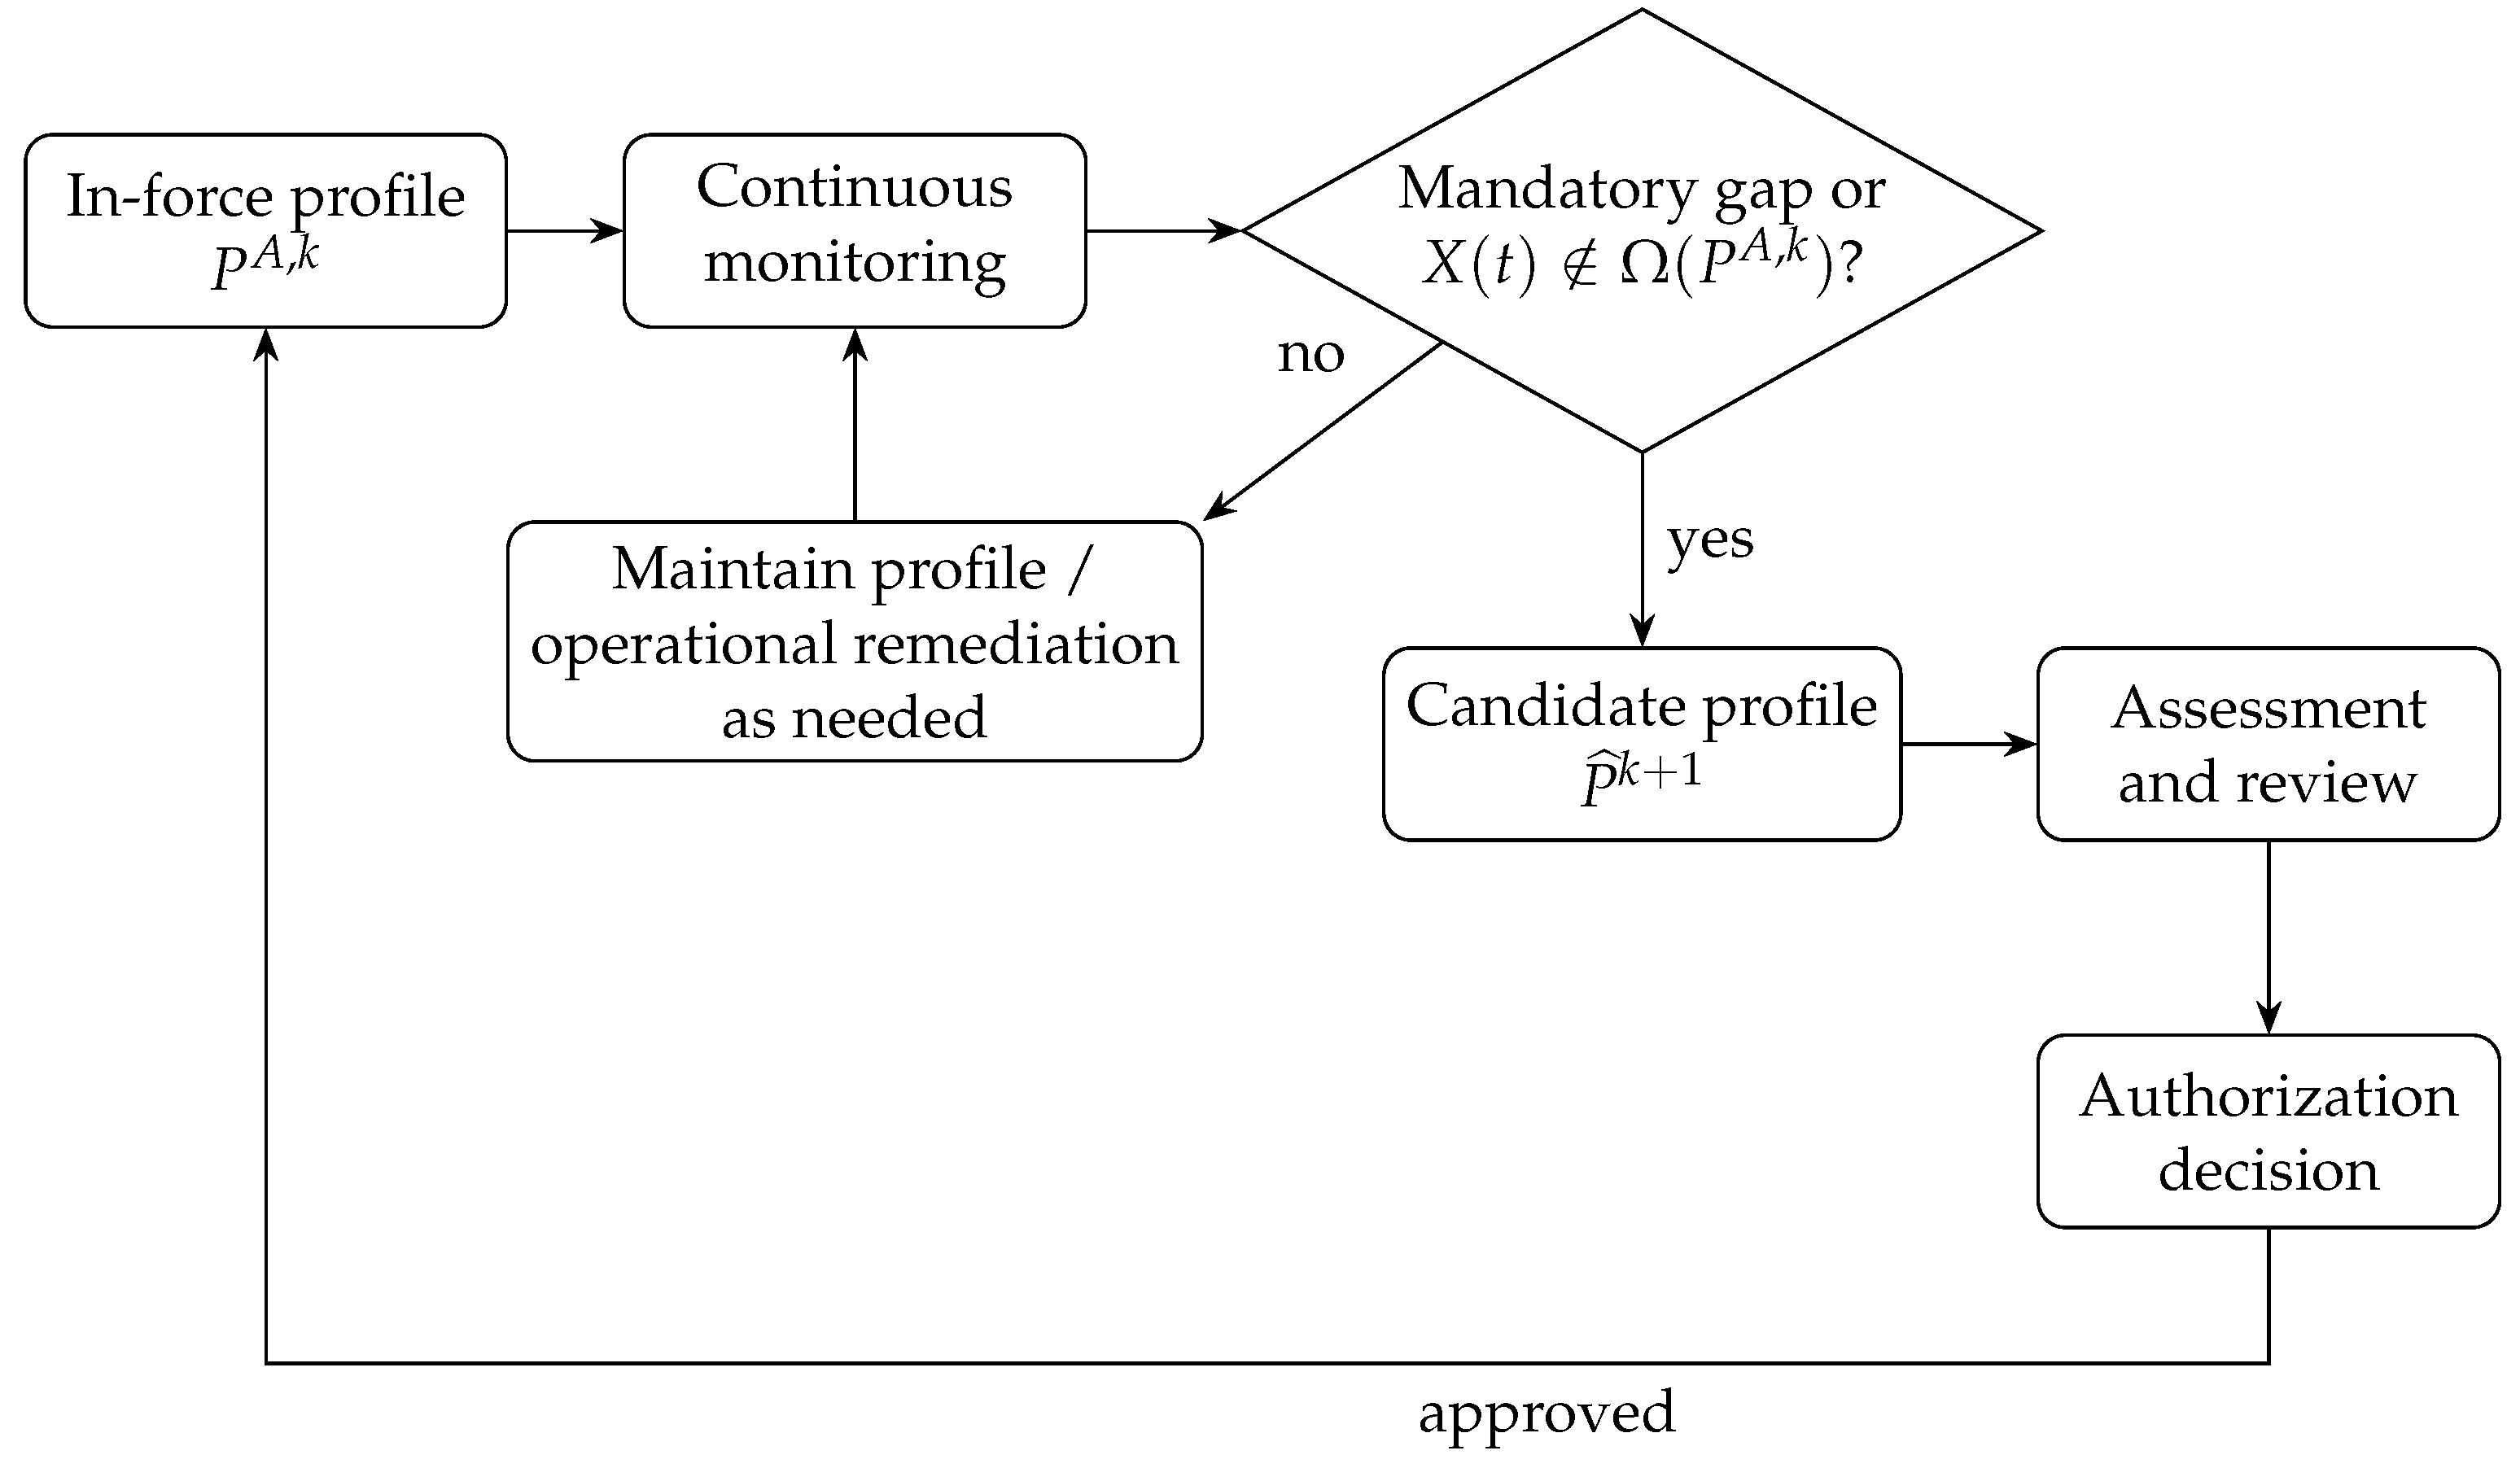

Table 1.
Core constructs and their operational interpretation.
| Construct | Symbol | Operational interpretation |
|---|---|---|
| Authorized target profile | The currently in-force target profile within the authorization basis; it remains fixed during Stage 1. | |
| Candidate profile | A proposed structural revision; it is not operative until the applicable assessment and authorization process is completed. | |
| Mandatory requirements | Requirements that every admissible candidate profile must contain at time t. | |
| Control health | Modeled implementation/operational condition of control i at time t. | |
| Evidence quality | Confidence in, or availability of, evidence supporting the authorization decision for control i. | |
| Dynamic system state | Compact state containing assets, vulnerabilities, exposure, threat information, control health, evidence quality, and normative context. | |
| Authorization-risk index | Evidence-aware benchmark risk index used for the authorization decision logic. | |
| Authorization envelope | States from which acceptable authorization risk can be restored without structurally changing the current profile. |
Table 2.
Synthetic threat scenarios and designed base parameters. Values are normalized benchmark parameters rather than field estimates.
Table 2.
Synthetic threat scenarios and designed base parameters. Values are normalized benchmark parameters rather than field estimates.
| ID | Scenario | Base likelihood term | Impact | Relative criticality |
|---|---|---|---|---|
| S1 | Credential compromise | 0.18 | 0.65 | 1.0 |
| S2 | Internet-facing service exploitation | 0.16 | 0.75 | 1.1 |
| S3 | IT-to-OT lateral movement | 0.10 | 0.92 | 1.4 |
| S4 | Ransomware and service disruption | 0.11 | 1.00 | 1.5 |
| S5 | Telemetry manipulation or loss | 0.08 | 0.95 | 1.5 |
| S6 | Supply-chain compromise | 0.07 | 0.88 | 1.3 |
Table 3.
Aggregated control entries used in the main proof of concept.
| ID | Anchor | Mandatory initially |
Control | Relative change cost |
Relative operational burden |
|---|---|---|---|---|---|
| C01 | AC-2 | Yes | Account management | 0.55 | 1.0 |
| C02 | AC-17 | No | Remote-access control | 0.80 | 1.4 |
| C03 | IA-2 | No | Multi-factor authentication | 0.70 | 1.2 |
| C04 | RA-5 | Yes | Vulnerability monitoring and scanning | 0.60 | 1.0 |
| C05 | SI-2 | No | Flaw remediation | 0.75 | 1.1 |
| C06 | SC-7 | Yes | Boundary protection and segmentation | 1.00 | 1.8 |
| C07 | AU-6 | Yes | Audit-record review | 0.45 | 0.8 |
| C08 | CA-7 | No | Continuous monitoring | 0.90 | 1.3 |
| C09 | IR-4 | Yes | Incident handling | 0.65 | 1.0 |
| C10 | CP-9 | Yes | System backup | 0.60 | 0.9 |
| C11 | CM-3 | Yes | Configuration change control | 0.55 | 0.9 |
| C12 | SR-3 | Noa | Supply-chain risk management | 0.85 | 1.3 |
aC12 becomes mandatory on day 220 only as a synthetic governance stress event; the date is not tied to a real regulatory change. The event is distinguished from risk-driven profile revision.
Table 4.
Decision-policy parameterization used in the main four-strategy comparison. The weights correspond to profile distance (), relative change cost (), and continuing operational burden ().
Table 4.
Decision-policy parameterization used in the main four-strategy comparison. The weights correspond to profile distance (), relative change cost (), and continuing operational burden ().
| Policy/state | Structural trigger | Removals | Additional logic | |||
|---|---|---|---|---|---|---|
| Static annual | End of horizon | 1.00 | 0.22 | 0.04 | Yes | Operational remediation during the year |
| Periodic 30-day | Every 30 days | 0.20 | 0.12 | 0.10 | Yes | Remediation between scheduled reviews |
| DER | Event or threshold exceedance | 0.05 | 0.08 | 0.12 | Yes | No hysteresis or cooldown |
| Proposed, elevated risk | Stage 1 infeasible | 1.00 | 0.25 | 0.04 | No | ; 7-day cooldown |
| Proposed, stable review | Event after stable dwell | 1.25 | 0.25 | 0.06 | Yes | ; 60-day stable dwell; target margin |
Table 5.
Policy mechanisms varied in ablation and sensitivity analyses.
| Mechanism | Base setting | Meaning in the benchmark |
|---|---|---|
| Hysteresis | ; | Structural response is activated at the upper threshold, while stable-state logic requires risk to fall below a lower threshold, reducing rapid switching near . |
| Cooldown | 7 days | After a risk-driven candidate revision, further structural requests are suppressed for seven days while monitoring and remediation continue. |
| Stable dwell | 60 days | Optional control removal is considered only after sustained low-risk operation rather than immediately after a stress episode. |
| Profile-stability weight | in elevated risk | Penalizes changes to the authorization basis relative to modest differences in change cost and continuing burden. |
Table 6.
Computational modules in the reproducibility package and their relation to the model.
| Component | Implementation role and principal source |
|---|---|
| Environment/state generator | Creates paired synthetic threat, exposure, mandatory-set, control-health, and evidence trajectories (run_experiment.py; data/config.json). |
| Risk engine | Computes operational and assurance-adjusted risk from scenario state, profile selection, health, evidence, and effectiveness matrices (run_experiment.py). |
| Stage-1 logic | Tests restoration of already authorized capabilities before structural change (run_experiment.py). |
| Stage-2 optimizer/policy controller | Selects feasible candidates and applies static, periodic, DER, or remediation-first trigger logic (run_experiment.py; extended_experiments.py). |
| Robustness/statistics | Produces ablations, paired comparisons, parameter, Stage-1-restoration and effectiveness sensitivity, candidate-activation-latency diagnostics, and scalability tests (robustness_analysis.py; extended_experiments.py; authorization_delay_sensitivity.py). |
| Output/figures | Writes auditable CSV traces and regenerates computational figures (generate_figures.py; generate_analysis_figures.py). |
Table 7.
Representative run, seed 20260822. “Revisions” means risk-driven profile-revision events; mandatory changes are shown separately.
Table 7.
Representative run, seed 20260822. “Revisions” means risk-driven profile-revision events; mandatory changes are shown separately.
| Strategy | CURE | TART | Revisions | Mandatory | Entry changes | Remediations |
|---|---|---|---|---|---|---|
| Static annual | 0.16545 | 47 | 0 | 1 | 1 | 53 |
| Periodic 30-day | 0.16308 | 44 | 1 | 1 | 2 | 50 |
| Direct event-driven reoptimization | 0.00000 | 0 | 9 | 1 | 11 | 13 |
| Proposed remediation-first | 0.00000 | 0 | 2 | 1 | 3 | 6 |
Table 8.
Monte Carlo summary over 100 paired replicates (mean ± SD). Revisions are risk-driven; the mandatory synthetic requirement is tracked separately.
Table 8.
Monte Carlo summary over 100 paired replicates (mean ± SD). Revisions are risk-driven; the mandatory synthetic requirement is tracked separately.
| Strategy | CURE | TART (days) | Risk-driven revisions |
Profile-entry changes |
|---|---|---|---|---|
| Static annual | ||||
| Periodic 30-day | ||||
| Direct event-driven reoptimization | 0 | 0 | ||
| Proposed remediation-first |
Table 9.
Component ablation, 80 paired replicates (mean ± SD). The No Stage 1 row is a matched-parameter comparison with the full proposed policy except for the remediation-first ordering.
Table 9.
Component ablation, 80 paired replicates (mean ± SD). The No Stage 1 row is a matched-parameter comparison with the full proposed policy except for the remediation-first ordering.
| Variant | TART (days) |
Risk-driven revisions |
Profile-entry changes |
Change-cost surrogate |
|---|---|---|---|---|
| Full model | ||||
| No Stage 1 | ||||
| Evidence-blind decision | ||||
| No hysteresis | ||||
| No cooldown | 0 | |||
| No stable dwell | ||||
| Weak change weight |
Table 10.
Sensitivity to attainable Stage-1 restoration quality in a separate 30-replicate synthetic diagnostic (mean ± SD). The No Stage 1 row uses the same environments and proposed-policy settings but performs structural optimization before remediation.
Table 10.
Sensitivity to attainable Stage-1 restoration quality in a separate 30-replicate synthetic diagnostic (mean ± SD). The No Stage 1 row uses the same environments and proposed-policy settings but performs structural optimization before remediation.
| Variant | TART (days) | Risk-driven revisions | Profile-entry changes |
|---|---|---|---|
| Restoration 0.70 | |||
| Restoration 0.80 | |||
| Restoration 0.90 | |||
| Restoration 1.00 | |||
| No Stage 1 (matched) | 0 |
Table 11.
Illustrative sensitivity to non-zero candidate-activation latency for risk-driven candidate profiles in a separate 30-replicate synthetic diagnostic (mean ± SD where shown). The latency is a compact surrogate for combined implementation/deployment, assessment, and authorization time.
Table 11.
Illustrative sensitivity to non-zero candidate-activation latency for risk-driven candidate profiles in a separate 30-replicate synthetic diagnostic (mean ± SD where shown). The latency is a compact surrogate for combined implementation/deployment, assessment, and authorization time.
| Delay (days) | TART (days) | Mean CURE | Mean candidate requests |
|---|---|---|---|
| 0 | 0.00007 | 1.40 | |
| 1 | 0.00330 | 1.40 | |
| 3 | 0.00746 | 1.40 | |
| 7 | 0.01313 | 1.40 | |
| 14 | 0.02133 | 1.33 | |
| 30 | 0.03511 | 1.30 |
Table 12.
Synthetic scalability stress test; 30 constructed instances per catalog size. Catalogs above 12 entries are synthetic computational instances.
Table 12.
Synthetic scalability stress test; 30 constructed instances per catalog size. Catalogs above 12 entries are synthetic computational instances.
| Entries | Mean initial risk |
Median time (ms) |
95th percentile (ms) |
Mean entry additions |
|---|---|---|---|---|
| 12 | 0.0522 | 0.69 | 0.85 | 1.83 |
| 25 | 0.0522 | 1.53 | 2.27 | 2.13 |
| 50 | 0.0522 | 4.34 | 4.86 | 3.00 |
| 100 | 0.0522 | 12.18 | 14.76 | 4.00 |
| 150 | 0.0522 | 23.84 | 26.98 | 4.67 |
| 200 | 0.0522 | 35.40 | 45.62 | 5.10 |
| 299 | 0.0522 | 75.59 | 84.40 | 6.37 |
Disclaimer/Publisher’s Note: The statements, opinions and data contained in all publications are solely those of the individual author(s) and contributor(s) and not of MDPI and/or the editor(s). MDPI and/or the editor(s) disclaim responsibility for any injury to people or property resulting from any ideas, methods, instructions or products referred to in the content. |
© 2026 by the authors. Licensee MDPI, Basel, Switzerland. This article is an open access article distributed under the terms and conditions of the Creative Commons Attribution (CC BY) license (http://creativecommons.org/licenses/by/4.0/).
Copyright: This open access article is published under a Creative Commons CC BY 4.0 license, which permit the free download, distribution, and reuse, provided that the author and preprint are cited in any reuse.