

Submitted:
11 October 2026
Posted:
12 October 2026
You are already at the latest version
Abstract
Automated coral image analysis remains challenging because methods must resolve individual colonies while preserving taxonomic information. We present a YOLO-based in-stance-segmentation framework trained on more than 9,500 hand-annotated images of Caribbean scleractinian corals representing 57 species and 24 genera. Four architectures, YOLOv8x, YOLOv9e, YOLOv11x, and YOLOv12x, were evaluated under consistent training conditions at both species and genus levels. On the held-out test set, species-level mask mAP₅₀ reached 0.789 and genus-level mask mAP₅₀ reached 0.870 (both YOLOv9e), with inference times of 4.1–5.5 ms per image. YOLOv8x, YOLOv9e, and YOLOv11x performed similarly (mask mAP₅₀ within 0.01 of one another), with YOLOv8x and YOLOv11x the fastest, while YOLOv12x showed no improve-ment despite added architectural complexity. Segmentation performance varied among taxa and growth forms, with compact or visually distinct colonies generally producing stronger masks than branching, encrusting, low-contrast, or substrate-integrated forms. External model transfer was evaluated on independent mesophotic coral ecosystem imagery using published results and expert review. Expert-confirmed precision was higher at genus level than species level and in-creased with confidence filtering, reaching 82.8% for genus-level and 71.1% for species-level pre-dictions at confidence >0.90. These results indicate that YOLO-based instance segmentation can produce rapid, taxonomically resolved coral observations, but external applications require con-fidence-based filtering and expert review, particularly for species-level inference in visually com-plex reef imagery.
Keywords:
coral reef monitoring
; instance segmentation
; YOLO
; deep learning
; underwater imagery
; coral taxonomy
; computer vision
1. Introduction
Coral reefs are among the world’s most biodiverse and valuable ecosystems, providing critical habitat, coastal protection, and livelihoods. Yet these reefs are rapidly degrading under numerous anthropogenic pressures (Hughes et al. 2017; Stoddart et al. 2019). Climate change, ocean acidification (Allemand and Osborn 2019), illegal overfishing activities (Petrossian 2015), pollution (Duckworth et al. 2017; Lamb et al. 2018), and disease outbreaks (Keesing et al. 2010) have all contributed to widespread coral decline (Hughes et al. 2017). Precise monitoring of coral communities integrating interdisciplinary science and modern technology methodologies is therefore essential to assess reef health, track biodiversity changes, and guide conservation measures (Obura et al. 2019; Apprill et al. 2023).
Traditional reef monitoring methods, such as diver surveys and manual annotation of underwater photos, are time-consuming, labor-intensive, and prone to variable observer bias (Harrison et al. 2025). For example, a review by Beijbom et al. (2015) of annotated coral images found that there was strong agreement (~80%) between human experts on coral genera, there was often disagreement on benthic image annotations, and observed that semi- and fully-automated annotation techniques can yield unbiased results with increased spatial resolution in significantly shorter timescales. To overcome these limitations, researchers are increasingly turning to artificial intelligence, deep learning, and computer vision methods for automated coral reef assessment (Beijbom et al. 2015; Gonzalez-Rivero et al. 2020; Hopkinson et al. 2020; Blondin et al. 2024). Early efforts trained classifiers on coral image datasets (e.g. the CoralNet platform; CoralNet n.d.) to estimate benthic cover from sparse point labels (Beijbom et al. 2015; Chen et al. 2021; Harrison et al. 2025). Recent developments in object detection and instance segmentation models have been applied to identify and delineate corals in images, promising faster and more standardized reef monitoring (Rubbens et al. 2023; Sauder et al. 2025). Coral-specific approaches include CoralSeg, which propagates sparse point labels into dense semantic segmentation (Alonso et al. 2019), CoralSCOP, a foundation model that segments coral masks at growth-form and genus granularity (Zheng et al. 2024), and Coral-CRCA, which automates bleaching-severity assessment from color-reference charts (Elmezain et al. 2026); none of these targets species-level instance segmentation. Many general large scale classification and segmentation models and datasets have been developed; however, fewer than 20 exist that are specific to coral reefs and there are even fewer at the coral species level (see Sauder et al. 2025 for a detailed list).
The You Only Look Once (YOLO) family of models has emerged as a leading approach for real-time object detection (Redmon et al. 2016). YOLO models perform detection in a single forward pass without a separate region proposal stage (Redmon et al. 2016), enabling high speed while maintaining accuracy. They have proven effective in marine contexts, with adaptations for tasks like fish detection and coral identification (Rubbens et al. 2023; Cordero et al. 2026). Notably, YOLO models excel in underwater settings due to their resilience against challenging conditions such as variable illumination, turbidity, and occlusion (Thakur et al. 2023; Zhang et al. 2024; Sapkota et al. 2025; Saragih et al. 2025). In prior work, we introduced Coral Intel, a deep learning framework demonstrating that YOLOv8 can detect Caribbean coral taxa from underwater imagery, illustrating the potential of modern object-detection approaches for coral monitoring (Figure 1; Cordero et al. 2026). However, that study output only coarse bounding boxes, which can omit important spatial details. Recent research emphasizes that pixel-level segmentation of coral imagery is crucial for capturing colony size, morphology, and partial mortality (e.g. bleaching) (Rubbens et al. 2023; Zhao et al. 2024; Raoult et al. 2025). Bounding boxes alone cannot delineate growth forms or tissue loss, whereas segmentation masks provide rich morphological information necessary for ecological assessments.
Unlike earlier YOLO versions (v1–v3) which lacked segmentation, the latest YOLO models (v5+) support instance mask prediction in addition to box detection (Wu et al. 2024; Sapkota et al. 2025). Recent work has demonstrated that YOLOv8-based segmentation architectures can achieve high detection accuracy in challenging underwater settings, maintaining robustness under turbidity, illumination variability, and occlusion (Zhang et al. 2024; Zhao et al. 2024; Li et al. 2024; Zhang and Gao 2025). This is achieved by augmenting YOLO’s single-stage architecture with a parallel mask branch that produces pixel-wise masks for each detected object (Li et al. 2024). Importantly, YOLO’s unified framework handles object recognition and mask generation in one network, simplifying deployment compared to two-stage approaches like Mask R-CNN (He et al. 2020; Wu et al. 2024). Alternative deep learning models have also been applied to underwater object recognition, each with distinct trade-offs (Ji et al. 2024). Mask R-CNN is a popular two-stage detector that generates region proposals and then predicts a mask for each region (He et al. 2020; Li et al. 2024). Mask R-CNN and similar R-CNN variants can achieve high segmentation accuracy, and they have been used for coral disease detection and habitat mapping (Li et al. 2024; Harrison et al. 2025). However, their two-stage pipeline makes them computationally heavy and relatively slow, limiting real-time use (Thakur et al. 2023; Ji et al. 2024; Zhang and Gao 2025). Developments in the wider detection and computing literature are also relevant to these trade-offs. SAFARI-Net applies scale-adaptive, frequency-aware refinement to the detection of small infrared targets (Zhang et al. 2026), a problem that, like reef imagery, involves small, low-contrast objects against cluttered backgrounds, and TianheGraph is a topology-aware system for large-scale graph processing (Gan 2025), an example of the computing infrastructure on which analyses of very large image-derived datasets increasingly depend.
Semantic segmentation networks such as U-Net (Ronneberger et al. 2015), DeepLabV3+ (Chen et al. 2018), and newer transformer-based architectures (Xie et al. 2021; Xu and Zheng 2021) have also been employed to classify reef images into benthic or substrate categories (Obura et al. 2019; Harrison et al. 2025). These models yield fine-grained maps of benthic habitat composition; examples include outputs such as the Allen Coral Atlas (2022) project which maps reefs globally from satellite imagery and Asner et al. (2020), which used high-resolution airborne high-fidelity imaging spectroscopy to map nearshore bathymetry and three-dimensional habitat complexity (i.e. rugosity). Yet pure semantic segmentation models do not inherently distinguish individual coral instances. In contrast, YOLO-based instance segmentation offers a compelling middle ground by integrating detection and segmentation. The YOLO approach simultaneously outputs bounding boxes, class labels, and per-object masks in a single pass (Redmon et al. 2016; Wu et al. 2024; Li et al. 2024). This one-stage design tends to be lighter and faster than Mask R-CNN, making it better suited for large-scale or real-time monitoring applications (Zhao et al. 2024; Wu et al. 2024; Saragih et al. 2025; Zhang and Gao 2025). For example, comparisons show that a lightweight YOLO model can match or exceed Mask R-CNN’s accuracy while running an order of magnitude faster in real-time detection (Thakur et al. 2023; Zhang et al. 2024; Li et al. 2024).
As of 2025, YOLOv12x (Figure 2) marks a major redesign in the YOLO series. Its backbone incorporates A2C2f modules, an evolution of Cross Stage Partial (CSP) networks that combine multi-scale features through parallel atrous convolutions and C2f residual flows for efficient gradient propagation (Tian et al. 2025; Sapkota et al. 2025). An e-scaling mechanism dynamically adjusts network depth and width to balance accuracy and computational cost, while the A2C2f neck fuses features across scales via high-dimensional upsampling. An area attention module, implemented with FlashAttention, prioritizes coral-rich regions and suppresses background noise (Tian et al. 2025). The head retains YOLO’s three-scale mask outputs but employs streamlined layers that may further reduce latency (Li et al. 2024).
To address the need for computer vision methods that meet the practical requirements of scientific coral monitoring, we leverage the segmentation capabilities of YOLO to expand coral image analysis in three key directions. First, we develop a Caribbean scleractinian coral dataset with mask annotations for 57 coral species. Second, we evaluate YOLO-based detection and segmentation models, from YOLOv8 through YOLOv12, for fine-grained coral recognition at both the species and genus levels. In particular, we compare the recently released YOLOv12, which introduces architectural enhancements intended to improve performance under difficult image conditions, against earlier YOLO versions. Third, we assess model transferability using independent mesophotic coral ecosystem (MCE) imagery and external human-in-the-loop validation, combining historical species-list comparison with expert visual review of model outputs. This external validation allows us to distinguish ecologically plausible predictions from visually confirmed detections and to evaluate how confidence thresholding affects model reliability outside the original training domain. To our knowledge, this is one of the first studies to benchmark next-generation YOLO models for fine-grained Caribbean coral segmentation while also testing their external performance in mesophotic reef imagery. The overarching goal is to evaluate whether one-stage segmentation models can support large-scale reef surveys by producing taxonomically detailed, pixel-level observations at high throughput, while identifying the confidence thresholds and validation steps needed for scientifically defensible monitoring.
2. Materials and Methods
Our overall workflow comprised seven stages: (1) dataset collection, (2) preprocessing and quality control, (3) data partitioning, (4) modeling, (5) network architecture specification, (6) evaluation metrics, and (7) validation. Each stage was designed to ensure robust model training and meaningful ecological insights.
2.1. Dataset Collection
We assembled a diverse image dataset of Caribbean reef corals primarily from publicly available Global Biodiversity Information Facility (GBIF) image repositories (GBIF.org 2025). The focus was on key reef-building scleractinian genera in the Caribbean, including Acropora, Orbicella, Porites, Agaricia, Madracis, Meandrina, Mycetophyllia, Oculina, and Siderastrea. In total, 9,530 images encompassing 57 coral species were utilized (Table 1), ranging from 5 (Meandrina danae) to 601 (Agaricia lamarcki) images per species. By morphological analysis group (Table 1), the dataset comprised 24 massive, submassive, encrusting, or nodular species (4,361 images), 14 plate-like, foliose, or laminar species (1,624 images), 12 branching, columnar, or upright species (1,726 images), three free-living or attached species (649 images), two phaceloid or flabello-meandroid species (583 images), and two meandroid species (587 images). For genus-level models, these species were grouped into 24 genera, with Pseudodiploria clivosa and P. strigosa labeled under their former genus, Diploria. This new Caribbean coral dataset provided a rich foundation for training and evaluating segmentation models across a wide range of coral forms.
2.2. Preprocessing and Quality Assessment
All images underwent thorough quality screening before annotation. We removed or flagged images that were duplicates or that had issues like extremely low resolution, high turbidity, motion blur, or poor lighting. This step ensured the training data was as clean as possible, given the inherent variability of underwater photography. We retained class imbalance in the dataset (i.e. some species had many more images than others) to reflect real-world frequency biases; however, this imbalance was noted and later addressed in model training through the data augmentation described in Section 2.4. No class-specific loss weighting or class-balanced resampling was applied.
For annotation, we used the AnyLabeling tool, an open-source AI-assisted image labeling platform, to create precise pixel-level masks for each coral instance (Nguyen 2023). AnyLabeling integrates models like SAM (Segment Anything Model; Kirillov et al. 2023) to assist human annotators in quickly delineating objects. Using its smart polygon and brush tools, we outlined each coral colony in an image and tagged it with the species label (Figure 3). SAM 2 supplied an initial mask for each colony, which the primary annotator manually corrected and completed; a second annotator then quality-checked the masks, and finally a third annotator performed the final review and approval. A numerical inter-annotator agreement statistic was not calculated. The result is a high-quality set of ground truth masks for all coral instances, providing the necessary training targets for segmentation.
2.3. Data Partitioning
After annotation and quality checks, the dataset was split into training, validation, and test sets in an approximate 80/10/10 ratio (Table S2). The training set (80% of images) was used to fit the models and learn coral features. The validation set (10%) was used during training for hyperparameter tuning and early stopping, ensuring the models generalized and preventing overfitting. Finally, the test set (10%) was held out from training and model selection and was used only for the final evaluation of the selected models (Section 2.6). Images were assigned to the training, validation, and test sets at random at the image level, after manual exclusion of obvious duplicate GBIF images from the same survey; the assignment was not grouped by reef site or colony. The species-level and genus-level datasets contain the same 9,530 images and 22,398 annotated colony instances and differ only in their class labels. Each dataset was partitioned by its own random draw, so the two taxonomic levels do not share the same training, validation, and test images (Tables S2 and S3). Because the number of annotated colonies per image varies widely (median of 1, maximum of 122), the two partitions also differ in the number of instances in each subset. The data was organized in a hierarchical folder structure by species and split, which is compatible with YOLO training requirements. This structure, with separate folders for train, validation, test, and subfolders for each species class containing images and labels, facilitated automated loading of images and masks during model training.
2.4. Modeling Approach
We trained four modern instance segmentation models derived from the YOLO family: YOLOv8x, YOLOv9e, YOLOv11x, and YOLOv12x (Table 2). These were chosen for their strong performance in prior object detection tasks and their scalability to high-resolution images. Each model outputs both a bounding box and a segmentation mask for each detected object, performing per-pixel classification within each box. We utilized transfer learning to initialize the models with weights pre-trained on the Microsoft COCO dataset (Lin et al. 2014) before fine-tuning on our coral data. This approach leverages general learned features (e.g. edges, textures) and speeds up convergence (Gómez-Ríos et al. 2019). YOLOv8x, YOLOv9e, and YOLOv11x were initialized from their corresponding pretrained segmentation weights; YOLOv12x was built from its segmentation configuration, with matching weights loaded from the YOLOv11x segmentation checkpoint.
Training was conducted for up to 300 epochs for each model, using identical hyperparameters for consistency; architecture-specific hyperparameter tuning was not performed. We employed an image size of 480×480 pixels with mosaic augmentation to handle different aspect ratios, a dropout rate of 0.15, a batch size of 16, and the NAdam optimizer with a learning rate of 0.0001. Early stopping was monitored on validation mAP, with a patience of 50 epochs. The checkpoint with the highest validation fitness (the sum of box and mask mAP₅₀–₉₅), saved as best.pt, was used for evaluation. All models were trained on a single NVIDIA RTX 5090 GPU and we utilized parallel data loading with 12 CPU workers to maximize throughput. Notably, data augmentation techniques including random flips, rotations, color jitter, and specific augmentations like random blur or hue shift were applied to improve robustness to varying conditions. Models were trained with Ultralytics (version 8.3.203 for YOLOv8x and YOLOv11x; version 8.3.227 for YOLOv9e and YOLOv12x) in Python 3.11.13 with PyTorch 2.10.0.dev20250923+cu128. The results reported here come from one saved training run per architecture and taxonomic level (eight runs in total), each with random seed 0.
2.5. Network Architecture
To enable reliable coral instance segmentation, we evaluated the architectural evolution of YOLO-based models from YOLOv8 through YOLOv12 (Table 2). All models follow the canonical YOLO paradigm composed of a backbone, neck, and head (Figure 2). The backbone extracts hierarchical image features through convolutional operations; the neck fuses multi-scale representations via upsampling and concatenation; and the head generates detection boxes, class scores, and segmentation masks at multiple spatial scales. Collectively, these components enable end-to-end, one-stage detection and segmentation, distinguishing YOLO models from slower two-stage frameworks such as Mask R-CNN. Our network design choices were motivated by achieving the best accuracy while preserving the real-time inference potential.
2.6. Evaluation Metrics
We evaluated model performance using standard object detection and segmentation metrics. To better understand how coral morphology influences segmentation accuracy, we additionally analyzed species-level performance by coral growth form using the following classifications: branching, columnar, upright, plate-like, foliose, laminar, massive, submassive, encrusting/nodular, free-living/attached, phaceloid, flabello-meandroid, and meandroid (Table 1, Kramer et al. 2020; Veron 1993; Veron et al. 2016).
For detection, we computed mean Average Precision (mAP) at Intersection-over-Union (IoU) 0.5 (mAP₅₀) as well as the more stringent mAP at IoU 0.5:0.95 (mAP₅₀–₉₅, averaged over IoU thresholds from 0.5 to 0.95). Average precision (AP) summarizes the precision-recall curve for each class; mAP is the mean of AP across all classes (in our case, either across all coral species or genera). A detection (bounding box) was considered correct if it had IoU ≥ 0.5 with a ground-truth box of the same class. For segmentation, we similarly calculated mAP of the predicted masks, where a mask is considered correct if its overlap with the ground-truth mask (IoU of the mask areas) exceeds the threshold. We report mask mAP₅₀ and mAP₅₀–₉₅ to evaluate instance segmentation quality. We also report precision, recall, and F1-score for both tasks using the following set of equations:
Precision is the fraction of model detections that were true positives (TP), which reflects how well the model avoids false positives (FP). Recall represents the fraction of ground-truth corals correctly detected by the model, reflecting its ability to find all true instances. Lower recall values correspond to higher false negative (FN) rates, where existing corals are missed by the detector. The F1-score is the harmonic mean of precision and recall, providing a balanced single measure of accuracy. We computed these metrics separately for the species-level and genus-level models, to see if models perform differently at finer or coarser taxonomic resolutions. The internal metrics reported in the Results were computed on the held-out test set (1,004 images and 2,222 annotated instances at the species level; 974 images and 2,490 instances at the genus level). The validation set (930 images and 2,321 instances at the species level; 942 images and 1,935 instances at the genus level) was used for early stopping and checkpoint selection; validation metrics for the selected checkpoints are given in Table S1. The split was not grouped by site or colony (Section 2.3). Metrics were obtained by running the Ultralytics validation routine (version 8.3.227) on the selected checkpoint with the test split, using the default minimum confidence of 0.001 and class-aware non-maximum suppression with an IoU threshold of 0.7; the summary precision and recall values are those at the confidence threshold that maximized the F1-score. In addition, we measured the inference speed (frames per second [FPS]) of each model on a standard GPU to compare runtime efficiency, given the importance of real-time analysis in practical deployments.
2.7. Validation Using Mesophotic Transects
MCEs are light-dependent reef communities that occur below conventional recreational diving depths, typically between 30 and 150 m depending on local water clarity and oceanographic conditions (Locker et al. 2010; Turner et al. 2017). Their greater depth and reduced accessibility make them more difficult to observe and document than shallow reefs, while also producing imagery under conditions that may differ substantially from those represented in predominantly shallow-water training datasets. These characteristics make MCE imagery a useful test of model transferability beyond the original training domain. We therefore conducted a human-in-the-loop validation using independent MCE photo-quadrats from Hole-in-the-Wall, a steep south–southwest-facing site along the shelf edge off southwestern Puerto Rico (Sherman et al. 2016; Appeldoorn et al. 2021). Details on sampling design, spatial coverage, and survey data are described in Sherman et al. (2016) and Appeldoorn et al. (2021). This external dataset differed greatly from the training data in illumination, imaging geometry, substrate composition, sediment cover, and colony morphology.
The external dataset included 41 high-resolution photo-quadrats collected on 28 August 2018 along a 50 m depth transect. Each transect consisted of two, east and west, ~10-m long continuous series of high-resolution 40×60 cm photo-quadrats. Prior to inference, images were standardized by upscaling by a factor of four in each dimension using Lanczos-4 interpolation, converting to RGB, and exporting at high resolution to preserve fine morphological detail. All four YOLO models were applied to the external images at both genus and species levels. Model outputs were exported as annotated image products with predicted labels, confidence scores, and instance masks. For expert review, image-level panels were generated showing the original photo alongside outputs from each model, enabling direct visual comparison of detections among model versions.
External validation proceeded in two stages. Firstly, model-predicted taxa were compared with MCE species recorded at Hole-in-the-Wall and El Hoyo, at depths of approximately 50 and 70 m, in southwestern Puerto Rico shelf margin, published by Sherman et al. (2016) and Appeldoorn et al. (2021). This step evaluated whether predicted taxa were consistent with documented MCE assemblages, recognizing that differences in survey year, transect location, and sampling methods precluded strict one-to-one ground-truth comparison.
Secondly, we conducted an expert review of model detections by a single marine biologist experienced in coral biology and identification. Inter-observer agreement therefore could not be assessed. For each image, model version, taxonomic level, and predicted taxon, we recorded the number of detections judged correct, incorrect, or uncertain. Each such record is referred to as a review entry, and each individual detection within it as an observation. Images in which no model produced a detection yielded no review entries. Because the review panels displayed model labels and confidence scores, the review was not blinded to model identity or confidence. Review entries flagged in the reviewer’s notes as duplicates (e.g. a repeated photograph of a quadrat or a duplicate detection) were excluded from precision calculations. A detection was considered correct when the visible organism, mask placement, and assigned genus or species were supported by the original imagery; it was considered incorrect when non-coral substrate was labeled as coral or an incorrect taxon was assigned. Ambiguous cases were retained as uncertain rather than forced into binary categories and were counted in the precision denominator. Expert-confirmed precision for the external validation was defined as
3. Results
3.1. Object Detection Performance
We evaluated model performance at two taxonomic levels: species and genus, to assess the effect of label granularity on detection and segmentation. Box detection mAP on the test set was similar for YOLOv8x, YOLOv9e, and YOLOv11x and lower for YOLOv12x, and recall, mAP, and F1-scores were higher at the genus level than at the species level for every architecture. Species-level box detection metrics showed differences among architectures, with mAP₅₀ values ranging from 0.755 to 0.793 (Figure 4). YOLOv9e achieved the highest species-level mAP₅₀ (0.793), followed by YOLOv11x (0.789) and YOLOv8x (0.781). YOLOv8x had the highest species-level recall (0.719), and YOLOv11x the highest precision (0.825). YOLOv12x demonstrated the lowest species-level mAP₅₀ (0.755). F1-scores across species-level box detection ranged from 0.738 (YOLOv9e) to 0.755 (YOLOv11x). Genus-level F1-scores were higher, peaking at 0.826 (YOLOv8x) and 0.809 (YOLOv11x).
Genus-level detection accuracy improved across all architectures. YOLOv9e, YOLOv8x, and YOLOv11x achieved similar genus-level performance (mAP₅₀ = 0.870, 0.866, and 0.857, respectively). YOLOv12x again ranked lowest (mAP₅₀ = 0.840).
3.2. Segmentation Performance
Mask segmentation results followed trends consistent with box detection. At the species level, YOLOv9e had the highest mask mAP₅₀ (0.789) and recall (0.743) but the lowest precision (0.716), YOLOv11x had the highest precision (0.819) with a similar mAP₅₀ (0.787), and YOLOv8x followed (mAP₅₀ = 0.779). At the genus level, YOLOv9e again had the highest mask mAP₅₀ (0.870), followed by YOLOv8x (0.864) and YOLOv11x (0.860). YOLOv12x again produced the weakest segmentation results, with the lowest mask mAP₅₀ at both levels (0.752 and 0.842). Across all architectures, genus-level mask recall, mAP, and F1-scores exceeded species-level values. Segmentation F1-scores mirrored detection trends: at the species level, YOLOv11x achieved the highest value (0.751) and YOLOv9e the lowest (0.729), and genus-level F1-scores were uniformly higher, reaching 0.828 for YOLOv8x. For the same checkpoints, validation-set mAP₅₀ values were 0.05–0.07 higher at the species level and up to 0.02 higher at the genus level, for both boxes and masks (Table S1). Inference time per image was 4.1 ms for YOLOv11x, 4.2 ms for YOLOv8x, 4.9 ms for YOLOv9e, and 5.5 ms for YOLOv12x.
3.3. Segmentation Accuracy by Coral Taxon and Morphology
Segmentation accuracy differed notably across coral species, genera, and growth forms. Values in this paragraph are class-wise mask mAP₅₀ on the test set, averaged across the four architectures, with the number of test images for each taxon (n) in parentheses. At the species level, 34 of the 57 species had fewer than 20 test images, and their means ranged from 0.268 (Mycetophyllia danaana; n = 5) to 0.995 (Meandrina danae, n = 1; Solenastrea hyades, n = 7), so these scores should be interpreted cautiously. Among the 23 species with at least 20 test images, the highest means were obtained for Meandrina meandrites (0.978; n = 42), Scolymia cubensis (0.967; n = 30), Agaricia lamarcki (0.962; n = 61), and Siderastrea radians (0.944; n = 34). In contrast, Madracis decactis (0.303; n = 22), Agaricia agaricites (0.604; n = 26), Acropora cervicornis (0.621; n = 26), and Agaricia tenuifolia (0.667; n = 28) had the lowest means among species with at least 20 test images. At the genus level, among the 19 genera with at least 20 test images, Mycetophyllia (0.991; n = 23), Scolymia (0.988; n = 30), and Favia (0.950; n = 22) ranked highest, while Orbicella (0.625; n = 86), Madracis (0.653; n = 46), Cladocora (0.779; n = 22), and Eusmilia (0.780; n = 39) ranked lowest. By morphological analysis group (Table 1), no architecture was consistently best: YOLOv9e had the highest mean mask mAP₅₀ in the branching/columnar/upright and meandroid groups, YOLOv11x in the free-living/attached, massive/submassive/encrusting/nodular, and phaceloid/flabello-meandroid groups, and YOLOv8x in the plate-like/foliose/laminar group, whereas YOLOv12x had the lowest mean in five of the six groups.
Figure 5 summarizes species-level model performance by coral growth form. Because many coral taxa exhibit more than one growth form, morphology assignments were collapsed into primary growth-form categories for analysis. Performance varied among forms, with meandroid, laminar–meandroid, and laminar/foliaceous forms generally showing the highest mean mask mAP₅₀–₉₅ values across YOLO models among forms represented by more than one species. Columnar, laminar, and massive forms showed intermediate performance, while encrusting/nodular and branching forms produced the lowest mean scores. Categories represented by a single species ranged from the highest mean values (submassive and free-living/basally attached forms) to the lowest (plate-like/foliaceous/laminar forms); these categories should be interpreted cautiously.
3.4. External Validation: Species Detections Relative to Historical Transect Data
In the external MCE validation, expert-confirmed precision was higher at the genus level than at the species level and increased with confidence threshold. Of the 23 species-level taxa predicted in the MCE imagery, 13 were present in the historical reference datasets. External review directly confirmed three species-level identifications: Agaricia lamarcki, Montastraea cavernosa, and Siderastrea siderea (Table 3, Figure 6 and Figure 7). Seven additional predicted species were not confirmed to species level but belonged to genera that were externally supported (Table 3). The remaining 13 species were not externally confirmed at either the species or genus level. At the observation level, 62 of 160 species-level predictions were confirmed and 98 were rejected, yielding an expert-confirmed species-level precision of 38.8% and an unsupported prediction rate of 61.3%.
At the genus level, the external expert validation included 171 model observations across 92 review entries and 37 images, after exclusion of three duplicate-flagged review entries (eight observations). Of these observations, 88 were classified as correct, 82 as incorrect, and 1 as uncertain, yielding an expert-confirmed precision of 51.5%. Genus-level precision varied among architectures, with YOLOv8x and YOLOv11x producing the highest confirmation rates, 69.0% and 64.3%, respectively, followed by YOLOv9e at 46.5% and YOLOv12x at 36.8%.
Species-level validation used the same review framework but evaluated the finer taxonomic label assigned to each model observation. Species-level performance was lower than genus-level performance; the review included 160 model observations across 90 review entries and 36 images, after exclusion of three duplicate-flagged review entries (eight observations). Of these observations, 62 were classified as correct and 98 as incorrect, yielding an expert-confirmed species-level precision of 38.8%. Species-level precision was highest for YOLOv8x (45.2%), followed by YOLOv9e (41.0%), YOLOv12x (37.5%), and YOLOv11x (34.0%).
Confidence thresholding increased expert-confirmed precision at both taxonomic levels while reducing the number of retained observations (Figure 8). Thresholds were applied to the confidence value recorded for each review entry, and the precision values below are pooled across the four architectures (correct/total observations in parentheses). At the genus level, precision increased from 51.5% (88/171) with no threshold to 60.4% (84/139) at confidence >0.50, 75.0% (72/96) at >0.70, and 82.8% (53/64) at >0.90. The corresponding mean number of genus-level observations retained per model (± SD across the four architectures) declined from 42.8 ± 11.4 with no threshold to 34.8 ± 7.4, 24.0 ± 1.6, and 16.0 ± 1.2 at the same thresholds. Species-level outputs showed the same threshold-dependent pattern but retained lower confirmation rates overall, increasing from 38.8% (62/160) with no threshold to 44.2% (57/129) at confidence >0.50, 54.7% (52/95) at >0.70, and 71.1% (32/45) at >0.90. Mean species-level observations retained per model declined from 40.0 ± 7.8 with no threshold to 32.3 ± 5.6, 23.8 ± 2.2, and 11.3 ± 4.3 across the same thresholds. The 95% Wilson score intervals for these pooled values, which treat observations as independent, were 44.0–58.8%, 52.1–68.2%, 65.5–82.6%, and 71.8–90.1% at the genus level and 31.5–46.5%, 35.9–52.8%, 44.7–64.4%, and 56.6–82.3% at the species level (no threshold, >0.50, >0.70, and >0.90, respectively); the intervals widen at higher thresholds as fewer observations are retained.
Error modes differed between taxonomic levels. At the genus level, incorrect observations were primarily associated with wrong-taxon assignments and false positives on non-coral benthic features, including sponges, hard substrate, shadowed areas, and Halimeda. Additional errors involved imperfect mask placement and confusion among morphologically similar massive corals, particularly Orbicella and Montastraea. At the species level, errors were more strongly associated with fine-scale taxonomic attribution, including cases where the broader genus assignment appeared plausible but the species-level label was rejected.
4. Discussion
We implemented a range of YOLO architectures and analyzed how incremental changes from YOLOv8 through YOLOv12 affected performance on coral data. Notably, all YOLO models here perform joint detection and segmentation in one stage. This contrasts with two-stage pipelines (Faster/Mask R-CNN) which first generate proposals then classify and segment, incurring more latency (Sapkota et al. 2025). The unified YOLO approach simplifies the process and tends to be more computationally efficient for our use case. In comparison to sole object detection, joint detection and segmentation performed essentially the same, except for mAP₅₀–₉₅, where the joint model saw improvements of up to 1-2% likely due to segmentation being able to isolate objects and edges (Afreen Awalludin et al. 2024). Across all architectures, species-level models showed lower recall compared to genus-level models. This likely reflects species models benefiting from more distinct morphological boundaries, while genus-level predictions had broader intra-class variability that improved sensitivity but at the cost of precision.
Coral growth form influenced segmentation performance, with more planar, laminar, meandroid, and compact morphologies generally producing stronger mask scores than more irregular, encrusting, nodular, or phaceloid forms. This pattern likely reflects differences in boundary definition, colony contrast, and the degree to which colonies visually separate from the surrounding substrate. Branching and encrusting morphologies remain challenging because thin branches, shadows, partial occlusion, and substrate blending can reduce mask consistency and lower model confidence (Afreen Awalludin et al. 2024). The difficulty of segmenting these morphologies was most evident in lower recall and mAP₅₀–₉₅ values among branching taxa across all models. Incorporating more diverse examples of branching and encrusting species during model training, or using targeted augmentation strategies, may help address persistent segmentation challenges among morphologically complex taxa.
Comparison of YOLOv8x, YOLOv9e, YOLOv11x, and YOLOv12x showed that architectural changes produced only modest gains for coral segmentation. On the test set, YOLOv9e had the highest mAP₅₀ at both taxonomic levels, YOLOv11x the highest species-level F1-scores, and YOLOv8x the highest genus-level F1-scores, but these three models differed by only about 0.01 in mAP₅₀, and their order was not the same on the validation set (Table S1). YOLOv12x did not improve performance despite added architectural complexity. The lower mAP of YOLOv12x may indicate difficulty in detecting smaller or lower-contrast colonies under the uniform training hyperparameters, although its different weight initialization (Section 2.4) may also have contributed. These results suggest that the earlier YOLOv8 design already captures most of the relevant coral features for this task.
It is important to note that standard mAP-based metrics evaluate performance strictly against annotated ground-truth masks, penalizing any additional detections that extend beyond those annotations, even when the model correctly segments unannotated coral. Consequently, model predictions that capture biologically valid but unlabeled regions are treated as false positives, leading to an underestimation of true ecological segmentation accuracy (Jena et al. 2023). However, this can be useful in the development of a two-step annotation system: first use YOLO to detect coral instances, then apply a specialized segmentation refinement (or a super-resolution mask upscaling) on each instance for the best of both worlds. Indeed, hybrid strategies in deep learning workflows are emerging (e.g., using a segmentation for initial detection and a second stage for mask refinement), and future work could explore such combinations for dataset enrichment. This can generate ecological metrics like colony size-frequency distribution, inter-colony spacing, or tracking the fate of specific colonies over time (e.g. which colony died, which bleached, etc.).
Notable differences in inference speed were identified, which could be decisive in field deployment scenarios. For instance, if an autonomous drone needed to process video in real-time, YOLOv8x or YOLOv11x would be the most viable options. YOLOv11x had the fastest inference time, followed closely by YOLOv8x, YOLOv9e, and YOLOv12x (Section 3.2). All models exceeded real-time performance thresholds (>15 FPS), which is impressive given the complexity of per-instance segmentation. By comparison, a typical Mask R-CNN model (using a ResNet-50 backbone) typically experiences lower speeds (Hassan et al. 2022; Li et al. 2024). Thus, depending on the application, there is a range of model choices trading off accuracy versus speed.
The transition from YOLOv8 to YOLOv11 and YOLOv12 showed that adding attention and other complex modules produced mixed, architecture-specific effects on coral imagery. YOLOv11x, which incorporates channel and spatial attention, effectively suppressed background clutter (e.g., sand, rocks, and macroalgae) and produced noticeably cleaner masks in complex scenes (Figure 9d). In comparison, YOLOv8x occasionally merged macroalgae into coral regions (Figure 9b), while YOLOv9e detected more faint or small colonies that YOLOv11x sometimes missed (Figure 9c–d). YOLOv12x, featuring A2C2f and area-attention modules, offered the most refined boundary delineation—particularly for branching species such as Acropora cervicornis— but its mAP values were the lowest of the four models (Figure 4). The differences in mask quality noted above are qualitative observations (Figure 9). We hypothesize that the attention-based modules of YOLOv11x improved boundary refinement; however, because component-level ablations were not performed, the contribution of specific modules remains untested. The added complexity also increased computational cost, suggesting that for many reef-mapping applications, YOLOv8x or YOLOv11x may offer the best trade-off between performance and efficiency. The YOLO family’s evolution yielded only incremental improvements for this task, reinforcing that the lightweight YOLOv8 design already captures most of the relevant coral features. Beyond a certain point, architectural complexity produced diminishing returns, likely due to limited training data and the inherent noise of underwater imagery.
4.1. Expert-Led Validation
The external MCE validation showed that model performance depended strongly on confidence threshold and taxonomic resolution. Genus-level outputs were more reliable than species-level outputs, and confidence filtering substantially improved expert-confirmed precision at both levels. This indicates that unfiltered external predictions should not be interpreted as validated ecological observations, especially in imagery that differs from the training domain. Confidence-filtered genus-level predictions therefore provide the most defensible basis for ecological interpretation. Because missed colonies were not systematically counted during the expert review, these results characterize precision but not recall.
The lower species-level confirmation rate reflects the difficulty of fine-scale coral identification from still imagery. Many Caribbean coral species share overlapping colony forms, textures, and skeletal or tissue features, and these can be obscured by sediment, shadows, viewing angle, partial colony exposure, or mask placement. As a result, some detections may be visually plausible at the genus level but unsupported at the species level. The seven predicted species that were supported only at the genus level (Table 3) are thus more likely cases of over-specific taxonomic attribution than false detections. Species-level outputs should therefore be treated as candidate identifications unless supported by high confidence and expert confirmation, especially for visually similar congeners, partially visible colonies, low-contrast masks, and morphologies that cannot be confidently resolved from the available image evidence.
The segmentation-based framework also compared favorably with the earlier object-detection-only framework evaluated by Cordero et al. (2026), although the two studies differed in validation dataset and evaluation design, so this comparison is indicative rather than direct. In the present study, unfiltered external precision was 51.5% at the genus level and 38.8% at the species level, with both increasing substantially after confidence thresholding. By contrast, the earlier object-detection-only framework reported lower precision and a higher proportion of unsupported detections. The strongest improvement relative to object detection alone was observed for genus-level interpretation and confidence-filtered outputs, while species-level performance remained constrained by the difficulty of fine-scale taxonomic attribution in reef imagery.
Model architecture also influenced external reliability. YOLOv8x and YOLOv11x produced the strongest externally confirmed genus-level outputs, whereas YOLOv12x generated more observations but lower unfiltered precision. This pattern suggests a tradeoff between detection volume and reliability when models are transferred beyond their training domain. The most common rejected predictions involved incorrect taxonomic attribution, false positives on non-coral benthic features, poor mask placement, or confusion among morphologically similar coral taxa. Together, these findings support a conservative validation workflow in which historical records establish ecological plausibility, while expert review and confidence filtering determine which model outputs are suitable for interpretation.
4.2. Role of Coral-Specific Data and Transfer Learning
A significant aspect of this study was compiling a coral-specific dataset and fine-tuning models on it. The performance we report (e.g., species-level mask mAP₅₀ of ~0.79) is achieved by models that have learned coral-specific features, as opposed to generic pre-trained models. We found that starting from COCO-pretrained weights was beneficial for faster convergence, but the final accuracy only came from training the models with thousands of coral images. This stresses the importance of coral-focused datasets. Fortunately, coral reef imagery is becoming more abundant. Platforms like CoralNet (n.d.) host tens of thousands of annotated reef photos, albeit annotated by point labels rather than masks (Chen et al. 2021). Likewise, global mapping initiatives like the Allen Coral Atlas (2022) provide high-level maps and could be a source of weak labels or synthetic training data for broad habitat classes. There is potential to integrate such data to improve model robustness. For instance, one could use CoralNet’s (Chen et al. 2021) point labels or the recently produced Sauder et al. (2025) to pre-train a segmentation model on classification of patches. In our case, we chose to manually annotate a new dataset with full instance masks to ensure high-quality ground truth for evaluation. This dataset can complement existing resources and serve as a benchmark for coral instance segmentation. We believe that community-driven dataset development will be key to advancing deep learning in coral reef science.
4.3. Implications for Reef Monitoring
The ability to automatically detect and segment coral species in images has several impactful applications. First, it enables scalable reef surveys, quickly processing thousands of images from diver trips, remotely operated vehicle (ROV) or autonomous underwater vehicle (AUV) expeditions, or even snorkeler photos to produce quantitative metrics. This can dramatically reduce the manual workload and subjectivity during analysis, where common postprocessing workflows of underwater reef imagery are typically time consuming and subject to a higher degree of errors (Hsu et al. 2025). Secondly, the fine-grained species-specific masks allow precise ecological analyses of spatially calibrated imagery. For example, we can compute the percent cover of each coral species, size distribution of colonies, coral neighborhood interactions, and even detect phenomena like partial mortality or overgrowth by algae if we include those classes (Hill and Wilkinson 2004; Turner et al. 2015). Over time, such data can feed into spatiotemporal trend analyses. For example, we can relatively quickly answer if there are fast-growing branching corals increasing at a site or are massive corals dominating? Thirdly, models like YOLO can be deployed in real-time systems. One can envision an underwater ROV that uses on-board YOLO detection to navigate (e.g., focus on areas with high coral density) or to flag potential concerns (e.g. pollution or bleaching) as it records video. Real-time alerts or guidance could revolutionize how we conduct reef management, making it more proactive. It is worth mentioning that one-stage models like lightweight YOLO versions are generally more deployment-friendly on low-power or resource constrained devices (e.g. on drones or ROVs) due to their lower inference time (Li et al. 2024; Zhang and Gao 2025). Lightweight vision–language models developed for resource-constrained IoT devices (Weng et al. 2025) point to a further possibility, in which on-board detections are combined with natural-language interaction; this lies outside the present study and is noted only as a future direction.
4.4. Limitations and Future Work
Despite the promising results, challenges remain. Underwater images are notorious for varying lighting and visibility (Armstrong et al. 2006). Issues like color distortion at depth, backscatter, and motion blur can still fool models (Bryson et al. 2016; Peng and Cosman 2017; Akkaynak and Treibitz 2019). Our training data included some variety of conditions, but models might struggle in extreme conditions (i.e. very low visibility or very deep, blue-shifted imagery). Techniques like color correction, specialized augmentation (e.g., simulating haze or using generative methods to enrich data) could further strengthen model robustness (Islam et al. 2020). Another challenge is taxonomic confusion: some coral species are hard to differentiate even for experts (e.g., within the genus Porites or Orbicella complexes) (Weil and Knowlton 1994; Forsman et al. 2009, 2015; Boulay et al. 2014). Incorporating local contextual features or temporal information might help disambiguate these cases. Methods for recognizing categories that are absent from the labeled training set, such as generalized category discovery with cross-domain knowledge transfer (Xia et al. 2026), may also help models handle taxa and imaging conditions that are not represented in the training data. In addition, our evaluation was limited to still images; detection consistency across consecutive video frames and real-time video performance remain to be assessed.
Several limitations of the present evaluation should also be noted. Each architecture was trained once at each taxonomic level, with a single random seed and a common set of hyperparameters that was not tuned for individual architectures, so run-to-run variability was not estimated, no significance tests were applied, and the small differences in mAP among YOLOv8x, YOLOv9e, and YOLOv11x should not be interpreted as meaningful; the order of these three models also differed between the validation and test sets (Table S1). The comparison was restricted to the YOLO family and did not include a non-YOLO baseline such as Mask R-CNN (He et al. 2020). Although the test set was held out from training and checkpoint selection, the random image-level split does not exclude the possibility that images of the same site or colony occur in more than one subset. In addition, because the species-level and genus-level datasets were partitioned separately (Section 2.3), the two levels were evaluated on different test images, so differences between species-level and genus-level metrics reflect test-set composition as well as label granularity. Mask quality was assessed with mask mAP only; boundary-sensitive metrics such as Dice, Boundary IoU, or boundary F-score were not computed, so statements about boundary quality are qualitative. For the external validation, the imagery came from a single site, depth, and survey date and was reviewed by one expert; the effect of image upscaling was not compared with native-resolution inputs; and, because missed colonies were not counted and no manually annotated external test set was available, recall could not be estimated. The external results therefore describe precision under these specific conditions and should not be read as a general measure of cross-domain transferability.
From a modeling perspective, one future direction is exploring transformer-based architectures or other attention-heavy models (e.g., the recent SAM and vision transformers) for this task (Xie et al. 2021; Xu and Zheng 2021; Kirillov et al. 2023). While YOLO is highly optimized, transformer models like UKANFormer have been proposed for coral segmentation in remote sensing images, leveraging global context to handle noise (Dou et al. 2025; Sauder et al. 2025). Perhaps a tailored transformer could capture coral patterns over an entire image better than the localized CNN approach. However, these would need to be balanced against computational cost for practical deployment. By modifying segmentation model architecture, approaches by Li et al. (2024) and Sauder et al. (2025) have led to significant improvements in model accuracy. Advances from other domains may also be transferable: adaptive cross-channel dependency learning developed for weakly supervised object detection (Chen et al. 2025) could inform feature modeling for colonies set against complex backgrounds, training-free instance segmentation that fuses large pretrained models (Song et al. 2025) could reduce the annotation effort needed for new taxa, and fusion of complementary imaging modalities, as shown for infrared–visible segmentation of surface and subsurface defects (Zhuo et al. 2026), may be useful where reef surveys collect more than one type of imagery.
The YOLO family has continued to develop beyond the architectures compared here, and several of the changes are directed at limitations observed in this study. YOLOv13 (Lei et al. 2025) introduces hypergraph-based adaptive correlation enhancement, which models high-order relationships among features across locations and scales, together with a full-pipeline aggregation-and-distribution scheme and lighter depthwise-separable blocks; such global, multi-scale feature association may benefit thin branching and substrate-integrated encrusting colonies, the morphologies that were hardest to segment here. Ultralytics YOLO26 (Jocher et al. 2026) adopts end-to-end, NMS-free inference, removes the distribution focal loss, and adds progressive loss balancing and small-target-aware label assignment, changes aimed at small objects and at simpler deployment on edge devices, and it supports instance segmentation. Ultralytics has also announced YOLO27, which was still under development at the time of writing; its documentation describes a widened early feature stage intended to improve small-object detection and NMS-free, query-based model variants (Ultralytics 2026). None of these architectures was evaluated here, so whether they improve performance on small or low-contrast colonies, complex morphologies, or species-level discrimination remains to be tested. A practical roadmap is therefore to benchmark them on the present dataset and compare their performance with the models evaluated in this study.
Another avenue is to integrate 3D spatial information. Coral surveys often use photogrammetry to create 3D reconstructions of the reef (Burns et al. 2015; Ferrari et al. 2016). Instance segmentation on 2D images could be combined with depth maps to get volumetric estimates of coral cover or to distinguish overlapping corals in 3D space (Li et al. 2024). Multi-view consistency, ensuring the same coral is identified across different images of the reef structure, is an open problem that could benefit from our 2D detection as a starting point. Probabilistic approaches that attach uncertainty estimates to underwater 3-D reconstruction (Dai et al. 2026) would complement the confidence filtering used here.
Finally, we emphasize that human expertise remains vital (Beijbom et al. 2015). While our AI models can accelerate data processing, they should be used as tools to augment, not replace, the judgment of marine scientists. In practice, a pipeline might involve automated detection/segmentation followed by expert validation on a subset of results or difficult cases (Williamson et al. 2025). This synergy can lead to both more efficient monitoring and new biological insights as experts can focus on interpreting results rather than drawing polygons around corals, which will inherently reduce operating cost with the increased autonomy, better sensing, longer endurance of computer assisted technology (Armstrong et al. 2019).
5. Conclusions
We present a comparative evaluation of YOLO-based instance segmentation for coral reef image analysis. Across four architectures, the models demonstrated that one-stage segmentation can produce detailed coral observations at high throughput, but performance depends strongly on taxonomic level, growth form, and confidence threshold. The strongest overall balance of internal accuracy and speed was achieved by YOLOv8x and YOLOv11x, while external validation showed that genus-level predictions were more reliable than species-level predictions in mesophotic imagery. These findings suggest that YOLO-based segmentation is a promising tool for reef monitoring, especially when used conservatively with confidence filtering and expert review. In practice, the most defensible workflow is genus-level interpretation for external imagery, with species-level predictions reserved for high-confidence cases that are visually confirmed by experts.
Moving forward, the integration of such models into regular reef monitoring programs could greatly enhance our ability to detect changes in reef communities in a timely manner. For instance, sudden declines in a particular species or early signs of bleaching could be quantified quickly across thousands of images, triggering management action. The combination of detection and segmentation in one framework, typified by YOLOv8+, offers an efficient solution for practitioners who require both the where (i.e. object location) and what (i.e. object identity and shape) of reef components. Ultimately, the fusion of coral ecology expertise and machine learning holds great promise for improving how we observe and protect these precious ecosystems in a changing world. With YOLOv11x achieving the fastest inference and YOLOv8x balancing accuracy and speed, practitioners have flexible options based on deployment needs.
Supplementary Materials
The following supporting information can be found in the supplementary materials: Table S1: Box-detection and mask-segmentation metrics of the eight final models on the validation and test sets; Table S2: Numbers of images and annotated instances in the training, validation, and test subsets of the species-level and genus-level datasets; Table S3: Class-wise numbers of images and annotated instances in each subset.
Author Contributions
E.C. conceptualized the study, performed data preprocessing and model training, morphological grouping, conducted analysis, and wrote the manuscript. C.S. conceptualized the study, reviewed the manuscript, participated in the diving surveys, and provided guidance. A.B.T. performed the expert-led external validation and morphological grouping. P.Y. performed data preprocessing. V.K.R. performed data processing and model training.
Funding
This work was conducted without external financial support; in-kind resources and technical assistance were provided by SeaMount Geospatial Labs.
Data Availability Statement
The coral imagery used in this study was obtained primarily from publicly available records through the Global Biodiversity Information Facility (GBIF; https://doi.org/10.15468/dd.4hpa4h). Additional data supporting the findings of this study are available from the corresponding author upon reasonable request.
Acknowledgments
We thank SeaMount Geospatial Labs for providing access to resources and infrastructure support throughout this project. E.C. also acknowledges the Department of Marine Sciences at the University of Puerto Rico–Mayagüez for logistical and academic support during graduate research and dissertation-related activities.
Conflicts of Interest
The authors declare that the research was conducted in the absence of any commercial or financial relationships that could be construed as a potential conflict of interest.
References
- Afreen Awalludin E, Wan Yussof WNJH, Bachok Z, et al (2024) Monitoring climate change effects on coral reefs using edge-based image segmentation. Int J Electr Comput Eng IJECE 14:398. [CrossRef]
- Akkaynak D, Treibitz T (2019) Sea-thru: a method for removing water from underwater images. In: 2019 IEEE/CVF conference on computer vision and pattern recognition (CVPR). pp 1682–1691 . [CrossRef]
- Allemand D, Osborn D (2019) Ocean acidification impacts on coral reefs: from sciences to solutions. Reg Stud Mar Sci 28:100558. [CrossRef]
- Allen Coral Atlas (2022) Imagery, maps and monitoring of the world's tropical coral reefs. [CrossRef]
- Alonso I, Yuval M, Eyal G, et al (2019) CoralSeg: Learning coral segmentation from sparse annotations. J Field Robot 36:1456–1477. [CrossRef]
- Appeldoorn, R.S., Ballantine, D.L., Carlo, M., Cruz Motta, J.J., Nemeth, M., Ruiz, H.J., Schizas, N.V., Sherman, C.E., Weil, E., Yoshioka, P.M., 2021. Intra-Annual Variation in Mesophotic Benthic Assemblages on the Insular Slope of Southwest Puerto Rico as a Function of Depth and Geomorphology. Front. Mar. Sci. 8, 732926. [CrossRef]
- Apprill A, Girdhar Y, Mooney TA, et al (2023) Toward a New Era of Coral Reef Monitoring. Environ Sci Technol 57:5117–5124. [CrossRef]
- Armstrong RA, Pizarro O, Roman C (2019) Underwater Robotic Technology for Imaging Mesophotic Coral Ecosystems. In: Loya Y, Puglise KA, Bridge TCL (eds) Mesophotic Coral Ecosystems. Springer International Publishing, Cham, pp 973–988 . [CrossRef]
- Armstrong RA, Singh H, Torres J, et al (2006) Characterizing the deep insular shelf coral reef habitat of the Hind Bank marine conservation district (US Virgin Islands) using the Seabed autonomous underwater vehicle. Cont Shelf Res 26:194–205. [CrossRef]
- Asner GP, Vaughn NR, Balzotti C, et al (2020) High-Resolution Reef Bathymetry and Coral Habitat Complexity from Airborne Imaging Spectroscopy. Remote Sens 12:310. [CrossRef]
- Beijbom O, Edmunds PJ, Roelfsema C, et al (2015) Towards automated annotation of benthic survey images: variability of human experts and operational modes of automation. PLOS ONE 10:e0130312. [CrossRef]
- Blondin C, Guérin J, Inagaki K, et al (2024) Hierarchical Classification for Automated Image Annotation of Coral Reef Benthic Structures. arXiv:2412.08228. [CrossRef]
- Boulay JN, Hellberg ME, Cortés J, Baums IB (2014) Unrecognized coral species diversity masks differences in functional ecology. Proc R Soc B Biol Sci 281:20131580. [CrossRef]
- Bryson M, Johnson-Roberson M, Pizarro O, Williams SB (2016) True Color Correction of Autonomous Underwater Vehicle Imagery. J Field Robot 33:853–874. [CrossRef]
- Burns J, Delparte D, Gates R, Takabayashi M (2015) Integrating structure-from-motion photogrammetry with geospatial software as a novel technique for quantifying 3D ecological characteristics of coral reefs. PeerJ 3:e1077. [CrossRef]
- Chen L-C, Zhu Y, Papandreou G, et al (2018) Encoder-Decoder with Atrous Separable Convolution for Semantic Image Segmentation. In: Ferrari V, Hebert M, Sminchisescu C, Weiss Y (eds) Computer Vision – ECCV 2018. Springer International Publishing, Cham, pp 833–851 . [CrossRef]
- Chen P, Nie X, Ning Y, Zhang Y (2025) Learning Efficient and Adaptive Cross-Channel Dependencies for Weakly-Supervised Object Detection. IEEE Trans Multimed 27:8954–8966. [CrossRef]
- Chen Q, Beijbom O, Chan S, et al (2021) A new deep learning engine for CoralNet. In: Proceedings of the IEEE/CVF International Conference on Computer Vision (ICCV) Workshops. pp 3693–3702 . [CrossRef]
- CoralNet (n.d.) CoralNet platform. https://coralnet.ucsd.edu/. Accessed 6 Jan 2025.
- Cordero E, Sherman CE, Yadav P, et al (2026) Coral Intel: A YOLOv8 Deep Learning Framework for Monitoring Caribbean Corals. Intelligent Marine Technology and Systems 4:18. [CrossRef]
- Dai D, Wang H, Li X, et al (2026) Probabilistic Prediction and Uncertainty for Underwater 3-D Reconstruction. IEEE Trans Instrum Meas 75:1–17. [CrossRef]
- Dou T, Li M, Qin J, et al (2025) UKANFormer: Noise-Robust Semantic Segmentation for Coral Reef Mapping via a Kolmogorov-Arnold Network-Transformer Hybrid. arXiv:2510.16730. [CrossRef]
- Duckworth A, Giofre N, Jones R (2017) Coral morphology and sedimentation. Mar Pollut Bull 125:289–300. [CrossRef]
- Elmezain M, Sultan A, Rehman MU, et al (2026) Coral-CRCA: A Color-Reference Chart Automation algorithm for coral bleaching visualization and severity assessment. Mar Pollut Bull 226:119384. [CrossRef]
- Ferrari R, Bryson M, Bridge T, et al (2016) Quantifying the response of structural complexity and community composition to environmental change in marine communities. Glob Change Biol 22:1965–1975. [CrossRef]
- Forsman Z, Wellington GM, Fox GE, Toonen RJ (2015) Clues to unraveling the coral species problem: distinguishing species from geographic variation in Porites across the Pacific with molecular markers and microskeletal traits. PeerJ 3:e751. [CrossRef]
- Forsman ZH, Barshis DJ, Hunter CL, et al (2009) Shape-shifting corals: molecular markers show morphology is evolutionarily plastic in Porites. BMC Evol Biol 9:45. [CrossRef]
- Gan X (2025) TianheGraph: Topology-aware Graph Processing. ACM Trans Archit Code Optim 22:1–24. [CrossRef]
- GBIF.org (2025) Derived dataset: Filtered export of GBIF occurrence data: . [CrossRef]
- Gómez-Ríos A, Tabik S, Luengo J, et al (2019) Towards highly accurate coral texture images classification using deep convolutional neural networks and data augmentation. Expert Syst Appl 118:315–328. [CrossRef]
- Gonzalez-Rivero M, Beijbom O, Rodriguez-Ramirez A, et al (2020) Monitoring of Coral Reefs Using Artificial Intelligence: A Feasible and Cost-Effective Approach. Remote Sens 12:489. [CrossRef]
- Harrison DE, Asner GP, Vaughn NR, et al (2025) Semantic Segmentation of Coral Reefs Using Convolutional Neural Networks: A Case Study in Kiritimati, Kiribati. Remote Sens 17:3529. [CrossRef]
- Hassan E, El-Rashidy N, M. Talaa F (2022) Review: Mask R-CNN Models. Nile J Commun Comput Sci 3:17–27. [CrossRef]
- He K, Gkioxari G, Dollar P, Girshick R (2020) Mask R-CNN. IEEE Trans Pattern Anal Mach Intell 42:386–397. [CrossRef]
- Hill J, Wilkinson C (2004) Methods for Ecological Monitoring of Coral Reefs: A Resource for Managers, Version 1. Australian Institute of Marine Science, Townsville https://portals.iucn.org/library/node/8465.
- Hopkinson BM, King AC, Owen DP, et al (2020) Automated classification of three-dimensional reconstructions of coral reefs using convolutional neural networks. PLOS ONE 15:e0230671. [CrossRef]
- Hsu T-HT, Gordon S, Ferrari R, et al (2025) Optimizing remote underwater video sampling to quantify relative abundance, richness, and corallivory rates of reef fish. Coral Reefs 44:435–449. [CrossRef]
- Hughes TP, Barnes ML, Bellwood DR, et al (2017) Coral reefs in the Anthropocene. Nature 546:82–90. [CrossRef]
- Islam MJ, Luo P, Sattar J (2020) Simultaneous Enhancement and Super-Resolution of Underwater Imagery for Improved Visual Perception. In: Robotics: Science and Systems XVI. Corvallis, Oregon, USA. [CrossRef]
- Jena R, Zhornyak L, Doiphode N, et al (2023) Beyond mAP: Towards Better Evaluation of Instance Segmentation. In: 2023 IEEE/CVF Conference on Computer Vision and Pattern Recognition (CVPR). IEEE, Vancouver, BC, Canada, pp 11309–11318 . [CrossRef]
- Ji X, Chen S, Hao L-Y, et al (2024) FBDPN: CNN-Transformer hybrid feature boosting and differential pyramid network for underwater object detection. Expert Syst Appl 256:124978. [CrossRef]
- Jocher G, Qiu J, Liu M, et al (2026) Ultralytics YOLO26: Unified Real-Time End-to-End Vision Models. arXiv:2606.03748. [CrossRef]
- Keesing F, Belden LK, Daszak P, et al (2010) Impacts of biodiversity on the emergence and transmission of infectious diseases. Nature 468:647–652. [CrossRef]
- Kirillov A, Mintun E, Ravi N, et al (2023) Segment Anything. In: Proceedings of the IEEE/CVF International Conference on Computer Vision (ICCV). pp 4015–4026 . [CrossRef]
- Kramer N, Tamir R, Eyal G, Loya Y (2020) Coral Morphology Portrays the Spatial Distribution and Population Size-Structure Along a 5–100 m Depth Gradient. Front Mar Sci 7:615. [CrossRef]
- Lamb JB, Willis BL, Fiorenza EA, et al (2018) Plastic waste associated with disease on coral reefs. Science 359:460–462. [CrossRef]
- Lei M, Li S, Wu Y, et al (2025) YOLOv13: Real-Time Object Detection with Hypergraph-Enhanced Adaptive Visual Perception. arXiv:2506.17733. [CrossRef]
- Li T, Liang Z, Zhao S (2024) CIS: A Coral Instance Segmentation Network Model with Novel Upsampling, Downsampling, and Fusion Attention Mechanism. J Mar Sci Eng 12:1490. [CrossRef]
- Lin T-Y, Maire M, Belongie S, et al (2014) Microsoft COCO: Common Objects in Context. In: Fleet D, Pajdla T, Schiele B, Tuytelaars T (eds) Computer Vision – ECCV 2014. Springer International Publishing, Cham, pp 740–755 . [CrossRef]
- Locker SD, Armstrong RA, Battista TA, et al (2010) Geomorphology of mesophotic coral ecosystems: current perspectives on morphology, distribution, and mapping strategies. Coral Reefs 29:329–345. [CrossRef]
- Nguyen V-A (2023) AnyLabeling: Effortless AI-assisted data labeling tool. Zenodo. [CrossRef]
- Obura DO, Aeby G, Amornthammarong N, et al (2019) Coral Reef Monitoring, Reef Assessment Technologies, and Ecosystem-Based Management. Front Mar Sci 6:580. [CrossRef]
- Peng Y-T, Cosman PC (2017) Underwater image restoration based on image blurriness and light absorption. IEEE Trans Image Process 26:1579–1594. [CrossRef]
- Petrossian GA (2015) Preventing illegal, unreported and unregulated (IUU) fishing: A situational approach. Biol Conserv 189:39–48. [CrossRef]
- Raoult V, Joyce K, Li JYQ, et al (2025) Coral bleaching and mass mortality at Lizard Island revealed by drone imagery. Coral Reefs. [CrossRef]
- Redmon J, Divvala S, Girshick R, Farhadi A (2016) You only look once: Unified, real-time object detection. In: Proceedings of the IEEE Conference on Computer Vision and Pattern Recognition (CVPR). pp 779–788 . [CrossRef]
- Ronneberger O, Fischer P, Brox T (2015) U-Net: Convolutional Networks for Biomedical Image Segmentation. In: Navab N, Hornegger J, Wells WM, Frangi AF (eds) Medical Image Computing and Computer-Assisted Intervention – MICCAI 2015. Springer International Publishing, Cham, pp 234–241 . [CrossRef]
- Rubbens P, Brodie S, Cordier T, et al (2023) Machine learning in marine ecology: an overview of techniques and applications. ICES J Mar Sci 80:1829–1853. [CrossRef]
- Sapkota R, Flores-Calero M, Qureshi R, et al (2025) YOLO advances to its genesis: a decadal and comprehensive review of the You Only Look Once (YOLO) series. Artif Intell Rev 58:274. [CrossRef]
- Saragih RE, Husin HS, Mursalim MKN, Yodi (2025) Coral Detection based on Optimised Lightweight YOLO Model. Indones J Inf Syst 8:10–20. [CrossRef]
- Sauder J, Domazetoski V, Banc-Prandi G, et al (2025) The coralscapes dataset: Semantic scene understanding in coral reefs. In: Proceedings of the IEEE/CVF International Conference on Computer Vision Workshops (ICCVW). pp 2136–2143.
- Sherman, C., Schmidt, W., Appeldoorn, R., Hutchinson, Y., Ruiz, H., Nemeth, M., Bejarano, I., Motta, J.J.C., Xu, H., 2016. Sediment dynamics and their potential influence on insular-slope mesophotic coral ecosystems. Continental Shelf Research 129, 1–9. [CrossRef]
- Song J, Zhou X, Xu C, et al (2025) Training-free automatic instance segmentation of girder bridge point cloud via large model fusion with reverse entity modelling verification. Autom Constr 179:106484. [CrossRef]
- Stoddart J, Jones R, Page C, et al (2019) No effect of dredging on the prevalence of coral disease detected during a large dredging program. Mar Pollut Bull 140:353–363. [CrossRef]
- Thakur A, Dubey A, Vashisth R, et al (2023) An improved underwater object detection based on yolov8 segmentation. Preprint. [CrossRef]
- Tian Y, Ye Q, Doermann D (2025) YOLOv12: Attention-Centric Real-Time Object Detectors. In: Advances in Neural Information Processing Systems 38 (NeurIPS 2025). https://openreview.net/forum?id=gCvByDI4FN . [CrossRef]
- Turner JA, Polunin NVC, Field SN, Wilson SK (2015) Measuring coral size-frequency distribution using stereo video technology, a comparison with in situ measurements. Environ Monit Assess 187:234. [CrossRef]
- Turner JA, Babcock RC, Hovey R, Kendrick GA (2017) Deep thinking: a systematic review of mesophotic coral ecosystems. ICES J Mar Sci 74:2309–2320. [CrossRef]
- Ultralytics (2026) YOLO27. https://docs.ultralytics.com/models/yolo27. Accessed 2 Oct 2026.
- Veron JEN (1993) Corals of Australia and the Indo-Pacific. University of Hawaii Press, Honolulu.
- Veron JEN, Stafford-Smith MG, Turak E, others (2016) Corals of the World. https://www.coralsoftheworld.org/page/home/. Accessed 6 Aug 2025.
- Weil E, Knowlton N (1994) A multi-character analysis of the caribbean coral montastraea annularis (ellis and solander, 1786) and its two sibling species, M. Faveolata (ellis and solander, 1786) and M. Franksi (gregory, 1895). Bull Mar Sci 55:151–175.
- Weng Y, Yang K, Liu Z, et al (2025) LGVLM-mIoT: A Lightweight Generative Visual-Language Model for Multilingual IoT Applications. IEEE Internet Things J 12:13311–13326. [CrossRef]
- Williamson JE, Joyce KE, Duce S, et al (2025) Modernising sea cucumber surveys using remotely operated vehicles and aerial drones. Coral Reefs 44:1961–1976. [CrossRef]
- Wu Y, Li Z, Jiang H, et al (2024) YOLOv8-segANDcal: segmentation, extraction, and calculation of soybean radicle features. Front Plant Sci 15:1425100. [CrossRef]
- Xia J, Hu R, Li Y, et al (2026) Unlocking Optical Prior: Spectrum-Guided Knowledge Transfer for SAR Generalized Category Discovery. IEEE Trans Circuits Syst Video Technol. [CrossRef]
- Xie E, Wang W, Yu Z, et al (2021) SegFormer: Simple and Efficient Design for Semantic Segmentation with Transformers. In: Advances in Neural Information Processing Systems 34 (NeurIPS 2021). pp 12077–12090.
- Xu J, Zheng C (2021) Linear Semantics in Generative Adversarial Networks. In: Proceedings of the IEEE/CVF Conference on Computer Vision and Pattern Recognition (CVPR). pp 9351–9360 . [CrossRef]
- Zhang H, Zhong Q, Liu J, et al (2026) SAFARI-net: Scale-adaptive frequency-aware refinement infrastructure for infrared small target detection. Opt Laser Technol 199:115049. [CrossRef]
- Zhang J, Gao B (2025) RCDI-YOLO: a target-detection method for complex environment side-scan sonar images based on improved YOLOv8. Front Mar Sci 12:1679077. [CrossRef]
- Zhang F, Cao W, Gao J, et al (2024) Underwater Object Detection Algorithm Based on an Improved YOLOv8. J Mar Sci Eng 12(11):1991. [CrossRef]
- Zhao Y, Sun F, Wu X (2024) FEB-YOLOv8: a multi-scale lightweight detection model for underwater object detection. PLOS ONE 19:e0311173. [CrossRef]
- Zheng Z, Liang H, Hua B-S, et al (2024) CoralSCOP: Segment any COral Image on this Planet. In: Proceedings of the IEEE/CVF Conference on Computer Vision and Pattern Recognition (CVPR). pp 28170–28180.
- Zhuo X, Wang Z, Shu J, et al (2026) Unified segmentation of surface and subsurface façade defects via infrared–visible fusion and temperature perturbation cloning. Comput-Aided Civ Infrastruct Eng 47:100226. [CrossRef]
Figure 1.
Underwater imagery showing the application of the YOLOv8-based Coral Intel (Cordero et al. 2026) object detection model for coral species identification. Panels (a)–(l) show example images in which detected colonies are enclosed by bounding boxes labeled with the predicted species and confidence score. Image source: Global Biodiversity Information Facility (GBIF) (GBIF.org 2025).
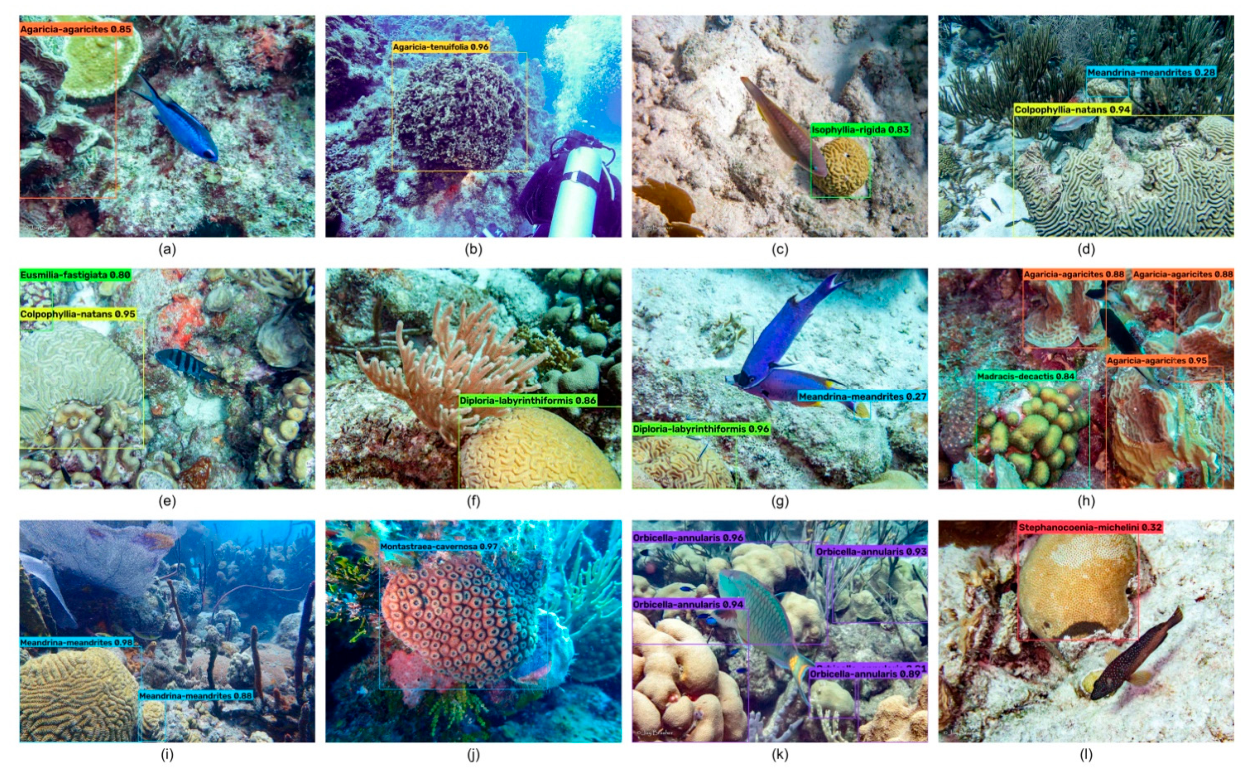
Figure 2.
Architecture of the YOLOv12 model, showing the backbone, neck, and head, with feature-map dimensions at each stage and detection outputs at three spatial scales (Tian et al. 2025).
Figure 2.
Architecture of the YOLOv12 model, showing the backbone, neck, and head, with feature-map dimensions at each stage and detection outputs at three spatial scales (Tian et al. 2025).
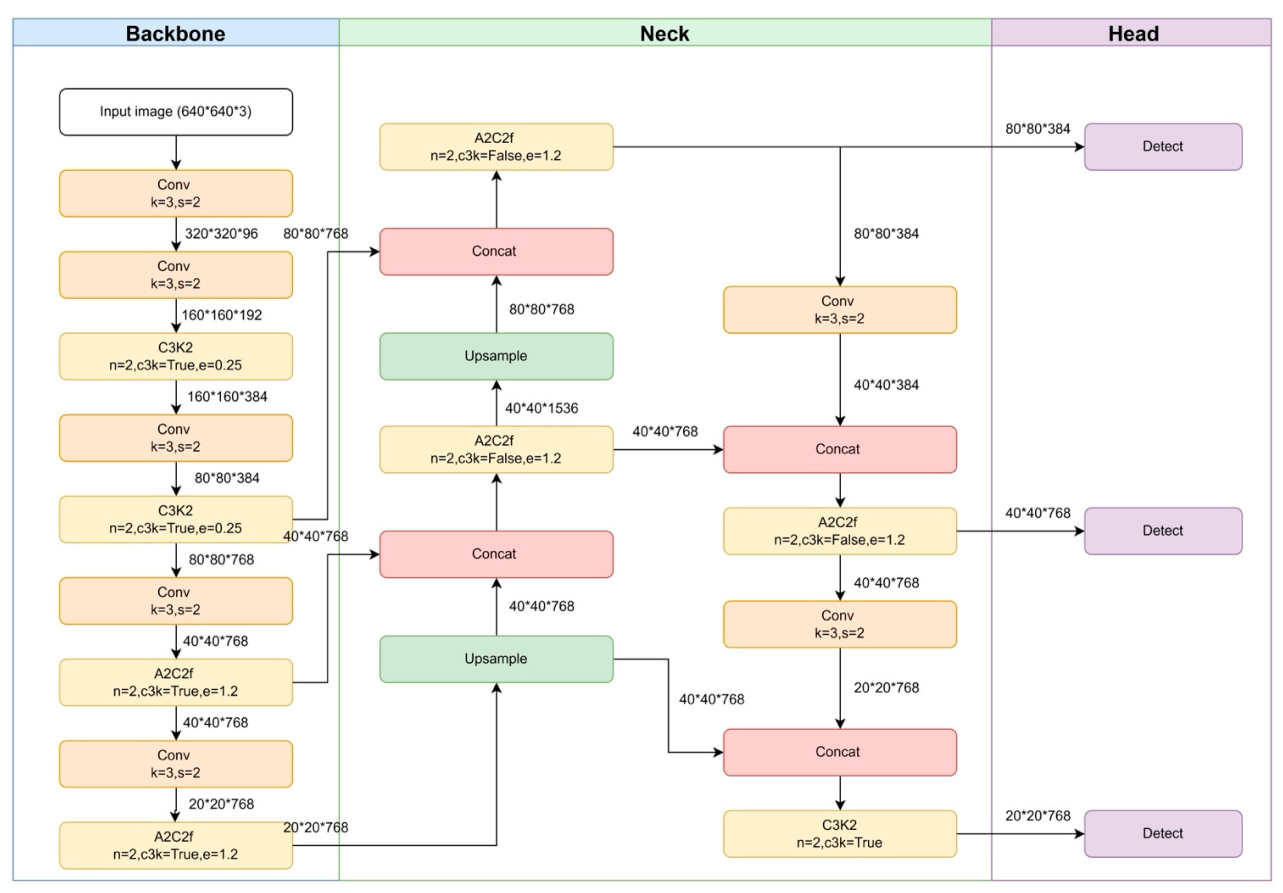
Figure 3.
Example of mask annotation for a Dendrogyra cylindrus colony in an image obtained from GBIF.org (2025). (a) Original image; (b) the same image with the colony mask outlined (cyan), generated by polygon-based annotation using the SAM 2 (Hiera-Large) model within the AnyLabeling tool (Nguyen 2023).
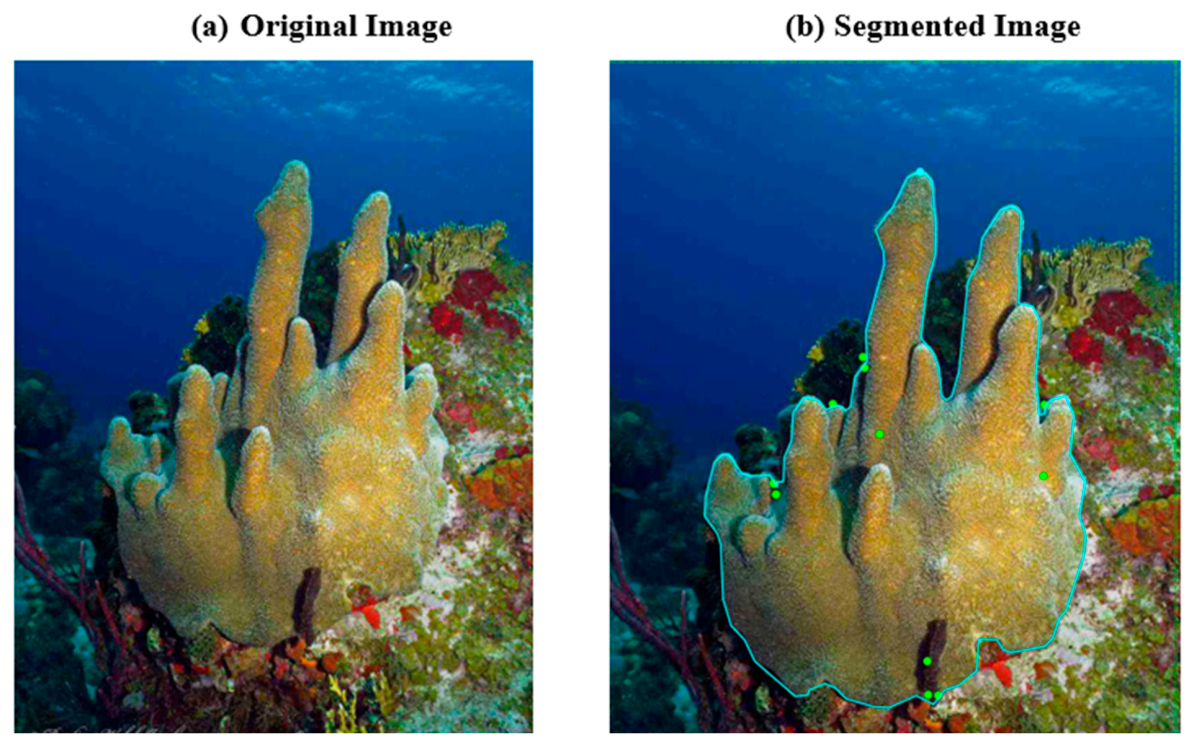
Figure 4.
Model performance comparison across YOLO architectures. Test-set box detection (dashed lines, “Object Detection”) and mask segmentation (solid lines, “Segmentation”) performance of genus- (dark lines) and species-level (light lines) coral models across YOLOv8x, YOLOv9e, YOLOv11x, and YOLOv12x frameworks. (a) Precision, (b) Recall, (c) mAP₅₀, (d) mAP₅₀–₉₅, (e) F1-score. Values are percentages, and each point is from a single training run.
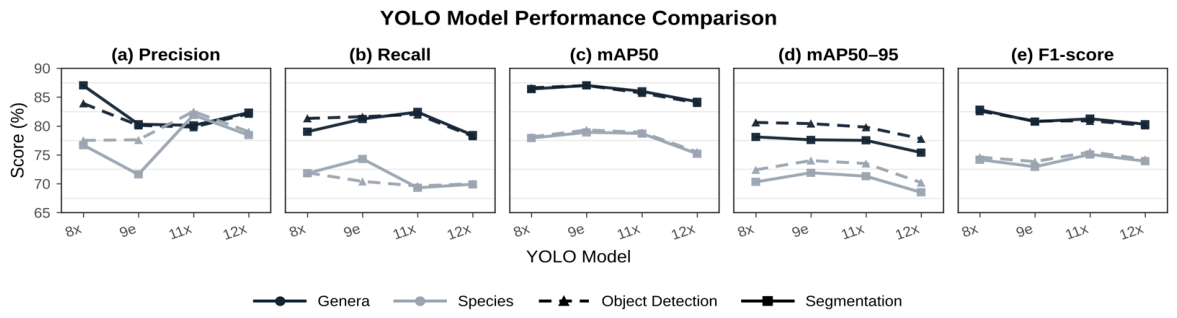
Figure 5.
Species-level test-set mask segmentation performance by primary coral growth form (Table 1) across YOLO models. Each row is a growth-form category; points show the mean mask mAP₅₀–₉₅ across the species in that category for each model (colors), and horizontal bars indicate ±1 standard error where a growth-form grouping contained more than one species.
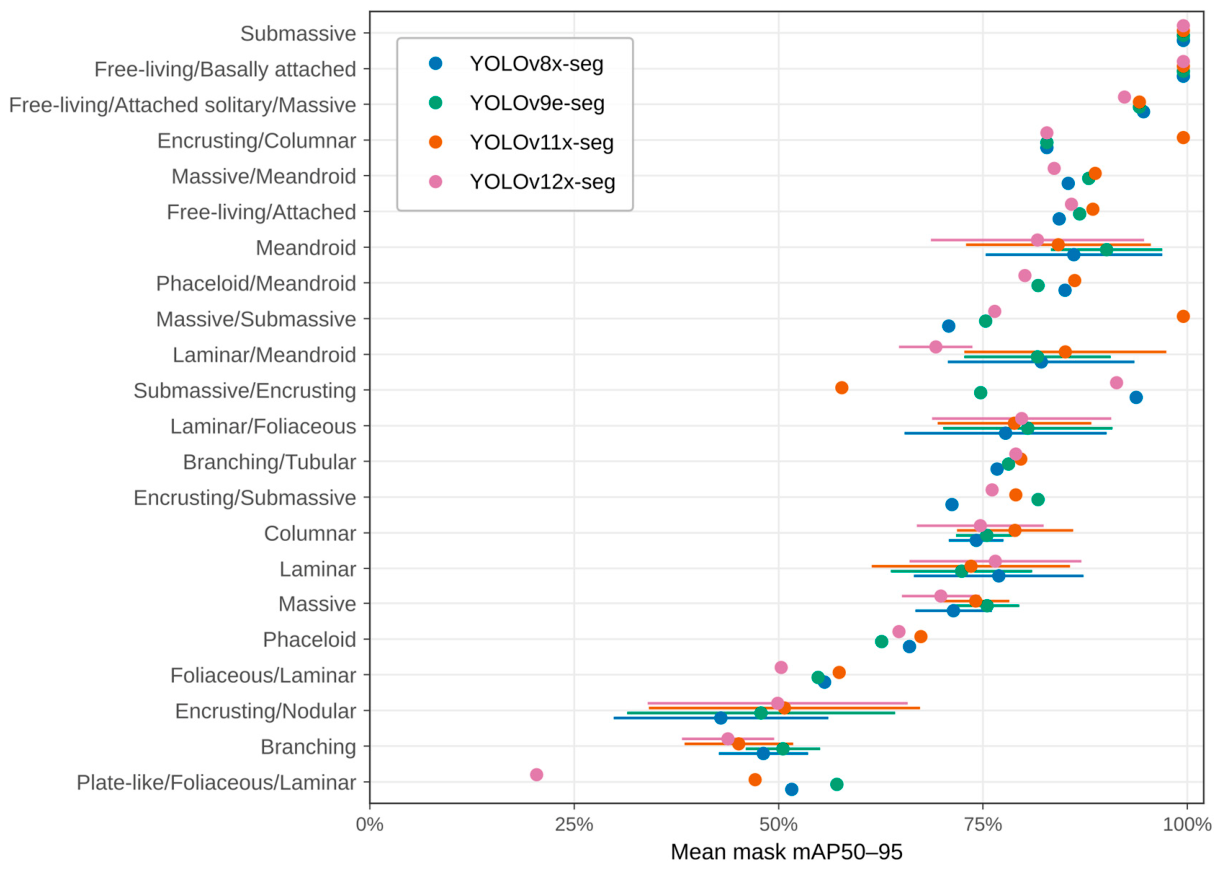
Figure 6.
Genus-level model outputs for one MCE photo-quadrat from Hole-in-the-Wall (50 m depth). The original upscaled quadrat image is shown on the left, and the four panels on the right show predictions from YOLOv8x, YOLOv9e, YOLOv11x, and YOLOv12x. Each model output displays genus-level box detections and instance segmentation masks, labeled with the predicted genus and confidence score. In this example, every model labeled its detections as Agaricia, but the number of detections and their confidence scores differed among models.
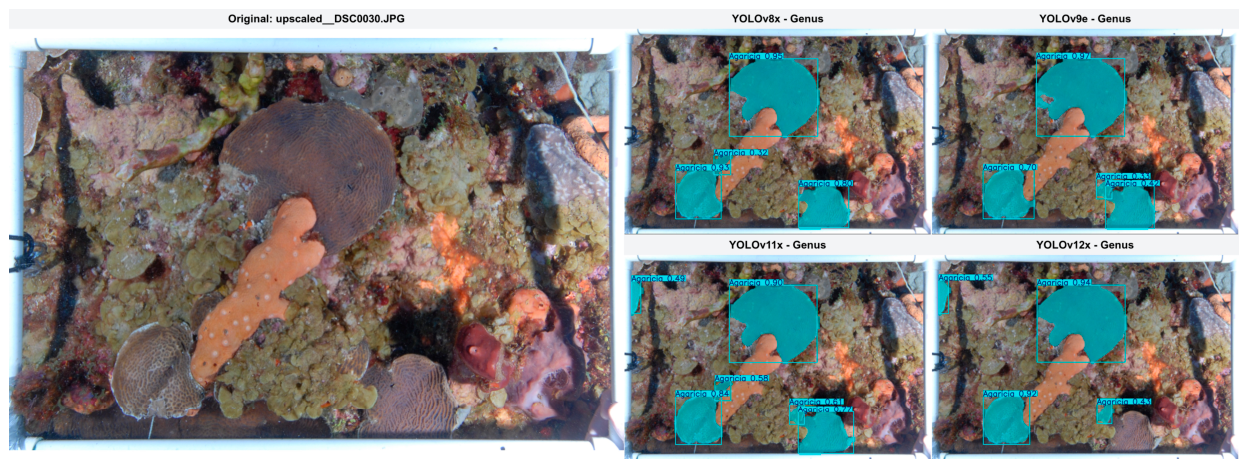
Figure 7.
Species-level model outputs for one MCE photo-quadrat from Hole-in-the-Wall (50 m depth), arranged as in Figure 6. Each model output displays species-level box detections and instance segmentation masks, labeled with the predicted species and confidence score. In this example, YOLOv8x, YOLOv9e, and YOLOv11x labeled their detections as Agaricia lamarcki, whereas YOLOv12x labeled both colonies as Montastraea cavernosa.
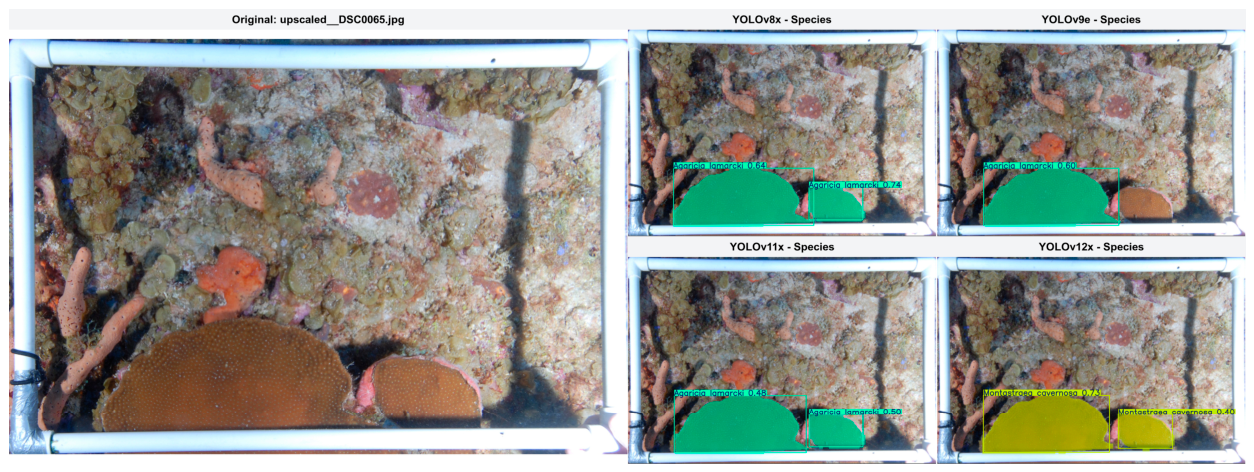
Figure 8.
Genus- and species-level expert-confirmed precision across confidence thresholds. Precision is shown for (a) YOLOv8x, (b) YOLOv9e, (c) YOLOv11x, and (d) YOLOv12x after removal of reviewer-flagged duplicate review entries. Dashed vertical lines mark confidence thresholds of 0.50, 0.70, and 0.90 (50%, 70%, and 90% on the x-axis). The inset reports, for each model, the number of expert-confirmed observations over the number of observations retained (confirmed/retained) with no threshold and at confidence thresholds of >0.50, >0.70, and >0.90.
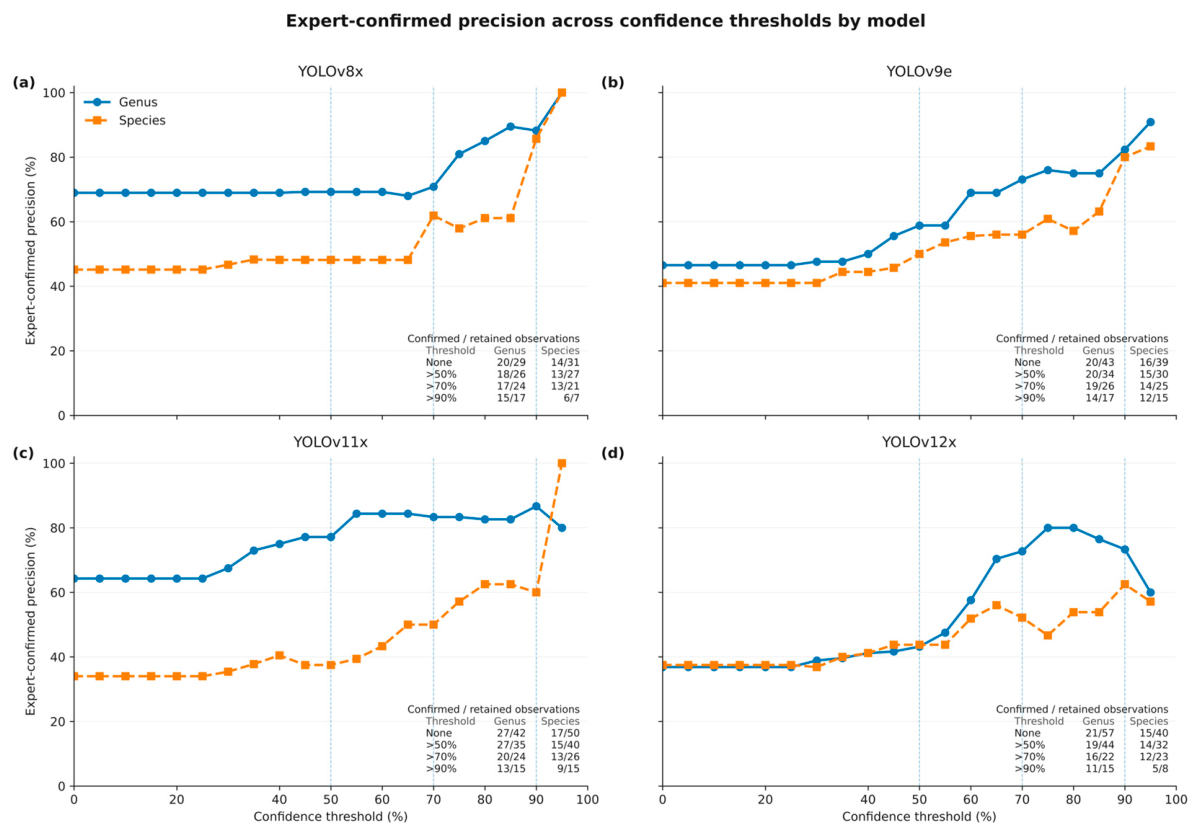
Figure 9.
Qualitative comparison of (i) genus- and (ii) species-based YOLO segmentation models. (a) Original images versus representative examples of coral instance segmentation across four YOLO architectures: (b) YOLOv8x, (c) YOLOv9e, (d) YOLOv11x, and (e) YOLOv12x. The rows in (i) show model predictions for the genera Orbicella, Siderastrea, and Porites, and the rows in (ii) show model predictions for three coral species, Orbicella faveolata, Siderastrea siderea, and Porites divaricata. Colored masks and bounding boxes show the colony outlines and labels, with confidence scores, predicted by each model.
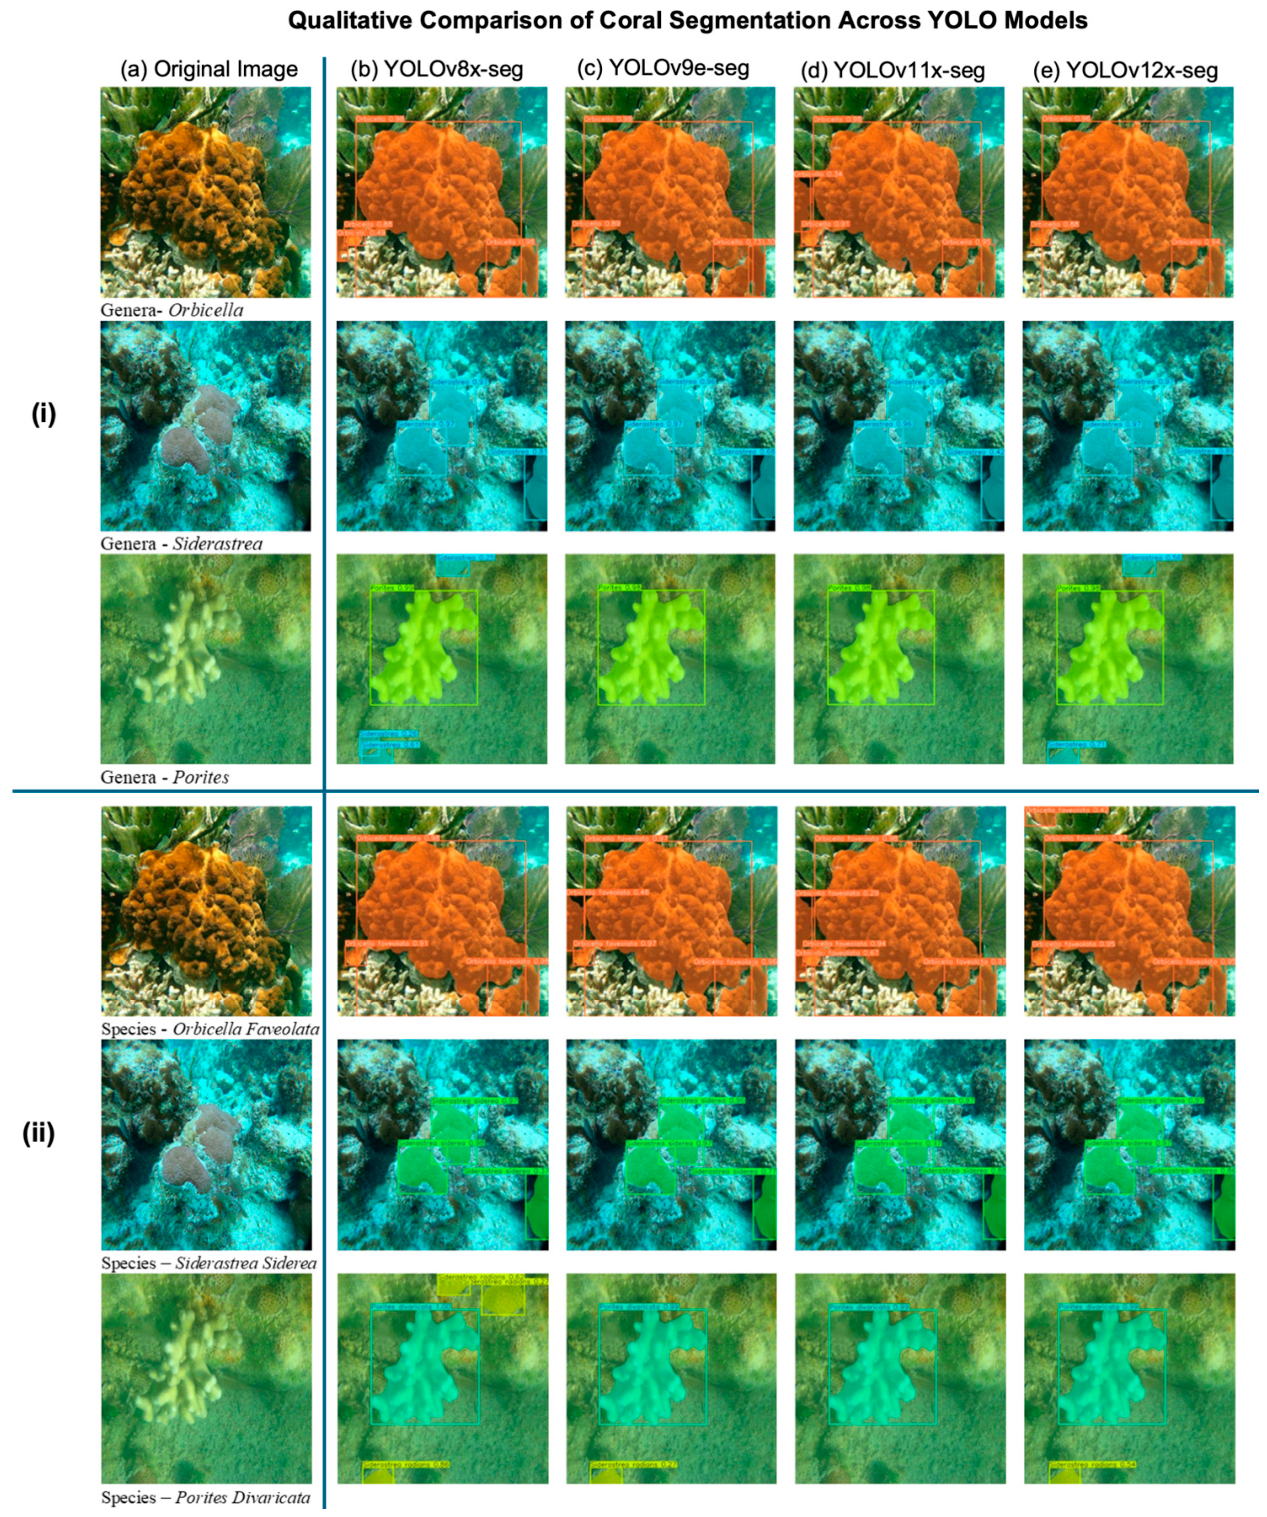

Table 1.
Coral species, primary morphological categories, broad analysis groups, and image counts in the instance-segmentation dataset. Species are grouped by the morphological categories and primary descriptors. For more details on growth form see Kramer et al. (2020), Veron (1993), and Veron et al. (2016).
| Morphological analysis group | Primary morphology | Species | Images |
|---|---|---|---|
| Branching / columnar / upright | Branching | Acropora cervicornis | 247 |
| Branching | Acropora palmata | 457 | |
| Branching | Acropora prolifera | 146 | |
| Branching/Tubular | Cladocora arbuscula | 214 | |
| Columnar | Dendrogyra cylindrus | 308 | |
| Branching | Madracis carmabi | 22 | |
| Columnar | Madracis formosa | 62 | |
| Branching | Madracis mirabilis | 19 | |
| Branching | Oculina diffusa | 54 | |
| Branching | Oculina varicosa | 115 | |
| Branching | Porites divaricata | 40 | |
| Branching | Porites furcata | 42 | |
| Plate-like / foliose / laminar | Laminar/Foliaceous | Agaricia agaricites | 260 |
| Laminar | Agaricia fragilis | 99 | |
| Laminar/Foliaceous | Agaricia grahamae | 45 | |
| Laminar/Foliaceous | Agaricia lamarcki | 601 | |
| Foliaceous/Laminar | Agaricia tenuifolia | 267 | |
| Laminar/Foliaceous | Agaricia undata | 31 | |
| Laminar | Leptoseris cailleti | 22 | |
| Laminar | Leptoseris cucullata | 56 | |
| Laminar | Mycetophyllia aliciae | 69 | |
| Laminar | Mycetophyllia danaana | 39 | |
| Laminar | Mycetophyllia ferox | 33 | |
| Laminar/Meandroid | Mycetophyllia lamarckiana | 72 | |
| Laminar/Meandroid | Mycetophyllia reesi | 17 | |
| Plate-like/Foliaceous/Laminar | Porites colonensis | 13 | |
| Massive / submassive / encrusting / nodular | Encrusting/Submassive | Agaricia humilis | 269 |
| Massive | Colpophyllia natans | 347 | |
| Massive/Submassive | Dichocoenia stokesi | 30 | |
| Massive/Meandroid | Diploria labyrinthiformis | 423 | |
| Massive | Favia fragum | 214 | |
| Massive | Isophyllia rigida | 96 | |
| Encrusting/Nodular | Madracis decactis | 209 | |
| Encrusting/Nodular | Madracis pharensis | 123 | |
| Encrusting/Columnar | Madracis senaria | 12 | |
| Submassive/Encrusting | Meandrina jacksoni | 6 | |
| Massive | Montastraea cavernosa | 471 | |
| Massive | Orbicella annularis | 323 | |
| Massive | Orbicella faveolata | 442 | |
| Massive | Orbicella franksi | 88 | |
| Massive | Porites astreoides | 325 | |
| Encrusting/Nodular | Porites branneri | 37 | |
| Massive | Pseudodiploria clivosa | 20 | |
| Massive | Pseudodiploria strigosa | 27 | |
| Massive | Siderastrea radians | 334 | |
| Massive | Siderastrea siderea | 387 | |
| Massive | Siderastrea stellata | 28 | |
| Massive | Solenastrea bournoni | 75 | |
| Submassive | Solenastrea hyades | 62 | |
| Massive | Stephanocoenia michelini | 13 | |
| Free-living / attached | Free-living/Attached | Manicina areolata | 356 |
| Free-living/Basally attached | Meandrina danae | 5 | |
| Free-living/Attached solitary/Massive | Scolymia cubensis | 288 | |
| Phaceloid / flabello-meandroid | Phaceloid | Eusmilia fastigiata | 381 |
| Phaceloid/Meandroid | Mussa angulosa | 202 | |
| Meandroid | Meandroid | Isophyllia sinuosa | 181 |
| Meandroid | Meandrina meandrites | 406 | |
| Total | 57 species | 9,530 |
Table 2.
Progression in YOLO-based segmentation model architecture. Based on Sapkota et al. (2025). No segmentation model is available for YOLOv10x.
Table 2.
Progression in YOLO-based segmentation model architecture. Based on Sapkota et al. (2025). No segmentation model is available for YOLOv10x.
| Model | Key Backbone Modules | Neck Architecture | Attention/Feature Fusion | Segmentation Head | Notable Advances |
|---|---|---|---|---|---|
| YOLOv8x (2023) | CSP + C2f blocks, SPPF layer | PANet-like upsampling and concatenation | - | Prototype mask branch using stride-8 feature map | Efficient baseline; real-time mask generation inspired by YOLACT |
| YOLOv9e (2024) |
CBLinear + RepNC-SPP-ELAN | Enhanced upsample–concat with RepNCS blocks | - | Multi-scale heads (80×80, 40×40, 20×20) | Deeper feature extraction; improved scale generalization |
| YOLOv11x (2024) | C3K, C3K2, and C2PSA (Channel & Spatial Attention) | PANet-like fusion | Channel–spatial attention modules | Standard three-scale head | Contextually aware segmentation under occlusion and noise |
| YOLOv12x (2025) |
A2C2f modules (parallel atrous + residual fusion) + e-scaling | A2C2f-based neck with high-dimension upsampling | Area Attention (FlashAttention) | Streamlined multi-head segmentation | Balances speed and accuracy; dynamic focus |
Table 3.
Species-level predictions from the independent MCE image set compared with historical survey records and external expert validation. Historical record indicates whether each predicted species was reported from Hole-in-the-Wall or El Hoyo MCE surveys (approximately 50 and 70 m depth) by Sherman et al. (2016) or Appeldoorn et al. (2021). Direct species support indicates whether the species-level label was visually confirmed during external review, whereas genus-level support indicates whether the corresponding genus was supported even when the exact species label was not confirmed. External validation status distinguishes confirmed species-level predictions, genus-supported but species-unconfirmed predictions, and predictions not externally confirmed.
| Species | Avg. confidence | Historical record | Direct species support | Genus-level support | External validation status |
|---|---|---|---|---|---|
| Acropora cervicornis | 0.445 | No | No | No | Not externally confirmed |
| Acropora palmata | 0.327 | No | No | No | Not externally confirmed |
| Agaricia agaricites | 0.601 | Yes | No | Yes | Genus supported only |
| Agaricia fragilis | 0.863 | Yes | No | Yes | Genus supported only |
| Agaricia lamarcki | 0.746 | Yes | Yes | Yes | Confirmed species |
| Agaricia tenuifolia | 0.469 | No | No | Yes | Genus supported only |
| Cladocora arbuscula | 0.285 | No | No | No | Not externally confirmed |
| Eusmilia fastigiata | 0.391 | Yes | No | No | Not externally confirmed |
| Isophyllia sinuosa | 0.727 | No | No | No | Not externally confirmed |
| Madracis decactis | 0.343 | No | No | No | Not externally confirmed |
| Madracis pharensis | 0.466 | Yes | No | No | Not externally confirmed |
| Meandrina meandrites | 0.363 | Yes | No | No | Not externally confirmed |
| Montastraea cavernosa | 0.663 | Yes | Yes | Yes | Confirmed species |
| Mussa angulosa | 0.718 | No | No | No | Not externally confirmed |
| Mycetophyllia aliciae | 0.446 | Yes | No | No | Not externally confirmed |
| Orbicella annularis | 0.301 | No | No | Yes | Genus supported only |
| Orbicella faveolata | 0.653 | Yes | No | Yes | Genus supported only |
| Orbicella franksi | 0.471 | Yes | No | Yes | Genus supported only |
| Porites branneri | 0.558 | No | No | No | Not externally confirmed |
| Scolymia cubensis | 0.484 | Yes | No | No | Not externally confirmed |
| Siderastrea radians | 0.621 | No | No | Yes | Genus supported only |
| Siderastrea siderea | 0.511 | Yes | Yes | Yes | Confirmed species |
| Solenastrea bournoni | 0.252 | Yes | No | No | Not externally confirmed |
Disclaimer/Publisher’s Note: The statements, opinions and data contained in all publications are solely those of the individual author(s) and contributor(s) and not of MDPI and/or the editor(s). MDPI and/or the editor(s) disclaim responsibility for any injury to people or property resulting from any ideas, methods, instructions or products referred to in the content. |
© 2026 by the authors. Licensee MDPI, Basel, Switzerland. This article is an open access article distributed under the terms and conditions of the Creative Commons Attribution (CC BY) license (http://creativecommons.org/licenses/by/4.0/).
Copyright: This open access article is published under a Creative Commons CC BY 4.0 license, which permit the free download, distribution, and reuse, provided that the author and preprint are cited in any reuse.