

Submitted:
16 September 2026
Posted:
17 September 2026
You are already at the latest version
Abstract
The 26 May 2026, Mw 4.5 Jalalpur earthquake, Pakistan, caused considerable damages around its epicentre. Investigations indicated a VII maximum intensity of the Modified Mercalli Intensity (MMI) scale, diminishing rapidly away from the source. Several earthquake-induced ground effects occurred, including liquefaction, temporary groundwater turbidity, differential settlement, tilting of utility poles and numerous landslides within the Quaternary deposits of the Tilla-Jogian Mountains. Observed pronounced North–South (N–S) ground motion was consistent with coseismic deformation within damaged infrastructure. Moment tensor inversion revealed that the earthquake originated at approximately 3 km depth, was characterized by predominant thrust faulting with a minor left-lateral strike-slip component, indicative of a transpressional tectonic regime. This mechanism is associated with a blind thrust beneath the Pabbi-Anticline and is supported by gravity modeling. Coulomb-stress analysis suggested that the Pabbi-Anticline was brought closer to failure after the 2019 Mw 5.8 Mirpur earthquake. However, seismic activation was delayed due to sustained increase in seismicity beginning in 2022. Both 2024 Mw 5.0 Kharian and 2026 Jalalpur earthquakes, occurred within this prolonged period of seismic activity. These observations suggest that stress transfer from the 2019 Mirpur earthquake, combined with progressive strain accumulation and localization along active structures, contributed to increased seismic hazard.
Keywords:
seismic source characterization
; tectonic deformation analysis
; fold-and-thrust structures
; Samwal and Pabbi Anticline
1. Introduction
The northwestern Himalayan foreland of Pakistan represents one of the most actively deforming tectonic regions, driven by the ongoing convergence between the Indian and Eurasian plates [1,2,3,4,5]. This convergence is accommodated through a complex system of fold-and-thrust belts, blind thrusts, strike-slip faults, and associated neotectonic structures that collectively contribute to the regional seismic hazard [6,7]. The Mirpur–Jalalpur Sharif region, located within the southeastern Potwar Plateau and bounded by left lateral Jhelum fault in East, Sarghodha high and Jhelum plain in south and Salt Range in the north.
Recent seismological investigations reported an increase in earthquake rate within the Mirpur and surroundings regions, particularly following the Mw 5.8 Mirpur earthquake of 24 September 2019 [7,8]. This earthquake was among the largest instrumentally recorded events in northeastern Pakistan in recent decades and occurred in close proximity to the Mangla Dam reservoir (Figure 1). The earthquake generated extensive socio-economic losses, causing widespread structural damage, casualties, and significant disruption to critical infrastructure [8,9,10,11,12,13,14,15,16,17]. Due to its shallow focal depth and occurrence within unconsolidated alluvial and fluvial deposits, the event triggered severe secondary geohazards, including liquefaction, lateral spreading, ground fissuring, and differential settlement [11]. These coseismic ground failures extensively affected the Upper Jhelum Canal and adjacent transportation networks, highlighting the pronounced vulnerability of engineered structures within the region [16].
The 2019 Mirpur earthquake also renewed interest in the active tectonics and stress evolution of the northeastern Potwar Plateau. Coulomb stress transfer modelling demonstrated that the earthquake significantly modified the regional stress field. [8] reported peak static Coulomb stress increases of approximately 1.3 bar in areas surrounding the rupture zone, suggesting an enhanced likelihood of future fault reactivation. Stress accumulation was particularly concentrated in the southern and up-dip portions of the source fault. Similarly, [12] identified positive coseismic stress perturbations at depths of approximately 10 km beneath the southern part of the rupture area, indicating that portions of adjacent fault systems may have been advanced toward failure. Such stress redistributions are considered important mechanisms controlling the spatial migration of seismicity and the occurrence of subsequent moderate earthquakes.
Following the Mirpur sequence, the Mw 5.0 Kharian 2024 earthquake represents the second-largest instrumentally recorded event in the area after the 2019 Mirpur earthquake. Despite its large magnitude and shallow depth (3 km), the Kharian earthquake caused no reportable damages.
On 26 May 2026, the Mw 4.5 Jalalpur Sharif earthquake occurred approximately 60 km southwest of the Mirpur epicentral area and about 40 km from the Kharian earthquake source region. Although moderate in magnitude, the earthquake caused unexpectedly severe damage to residential structures, resulting in one fatality and fourteen injuries. Field observations revealed widespread cracking of masonry buildings and infrastructure damage within the epicentral zone. Residents reported strong north–south ground motion during the event, while several damaged structures exhibited deformation patterns consistent with a dominant N–S component of shaking. The occurrence of significant damage from a relatively moderate earthquake raises important questions regarding its source characteristics, focal depth, rupture geometry, local site conditions, and tectonic setting.
Despite the significant damage caused by Jalalpur Sharif earthquake, its causative fault, rupture geometry, focal depth, and tectonic significance remained poorly constrained. The epicentral region is located on the footwall of the Salt Range Thrust (SRT), where no surface-mapped active fault has previously been identified, raising important questions regarding the existence of concealed or blind seismogenic structures beneath the northwestern Himalayan foreland. Determining whether the earthquake originated on a buried thrust associated with the Pabbi Anticline system, a subsidiary structure linked to the SRT, or another previously unrecognized fault is essential for understanding the distribution of active deformation and assessing future seismic hazard in the region. Moreover, the occurrence of this event within an area affected by stress perturbations following the 2019 Mw 5.8 Mirpur earthquake provides an opportunity to evaluate the role of stress transfer and fault interaction in controlling contemporary seismicity in northeastern Pakistan.
In this study, we integrate detailed field observations, gravity data modelling, and local waveform moment tensor inversion of broadband seismic recordings to determine the source characteristics, focal depth, faulting mechanism, and tectonic setting of the 2026 Jalalpur Sharif earthquake. The combined geophysical and geological analyses are used to identify the most likely causative structure, evaluate its relationship with regional tectonic elements, and investigate the factors responsible for the unexpectedly severe damage produced by a moderate-magnitude event. The results provide new constraints on active faulting beneath the Himalayan foreland fold-and-thrust belt and contribute to a more robust assessment of seismic hazard in the Jalalpur Sharif region and adjacent parts of northeastern Pakistan.
2. Geology and Tectonics
The Jalalpur Sharif region is located along the eastern Salt Range at the northwestern Himalayan deformation front, where active shortening associated with the ongoing India–Eurasia collision is transferred into the foreland [10,18]. This is a part of the Himalayan tectonic bend, which links the predominantly compressive deformation central Himalaya and transpressional deformation of western Himalaya. Oblique convergence, at an average rate of ~5 mm yr⁻¹, is accommodated through a combination of southward-directed thrusting and strike-slip faulting, producing a complex partitioned deformation field [3,4,19,20,21,22,23].
Within this tectonic framework, the Salt Range and Potwar Plateau constitute the frontal part of the Himalayan fold-and-thrust belt. They form a large allochthonous thrust sheet translated above a regional evaporite-rich décollement developed near the Precambrian basement, giving rise to a classic thin-skinned fold-and-thrust system characterized by fault-propagation folds, duplexes, and imbricate thrusts [24,25,26]. Eastward, the Salt Range frontal thrust gradually loses surface expression, becomes blind, and continues into the Chambal Ridge, Rohtas Anticline, and Pabbi Hills across the Jhelum River [27,28].
The earthquake epicentral area lies immediately south of the eastern Salt Range, where deformation is expressed by the Diljabba Ridge and the Chambal–Tilla Jogian Ridge. These NE–SW-trending structures define the dominant structures of the eastern Salt Range and contrast with the E–W-oriented folds farther west. The Chambal–Tilla Jogian Ridge consists of steep monoclines disrupted by thrust and tear faults, whereas the Diljabba Ridge forms a steep anticline dissected by the Diljabba–Domeli Thrust. Except for the Domeli Thrust, most mapped faults exhibit only limited surface displacement, suggesting that a significant component of shortening is accommodated by blind structures at depth [29].
South of the Salt Range, the Pabbi Anticline forms the principal active structure in the Jalalpur Sharif area. It is taken as a fault-propagation fold developed above a blind thrust that merges downward into the regional décollement [30]. Geological and geophysical evidence indicates that this structure has remained active throughout the late Quaternary, controlling regional drainage development, including the course of the Jhelum River [29,31]. Recent seismicity, including the December 2024 Mw 5.0 event, and the 2026 Mw 4.5 Jalalpur Sharif earthquake, depict the active deformation within this blind thrust system. The concentration of these moderate earthquakes highlights the role of the Pabbi Anticline and adjacent blind thrusts in accommodating active shortening and emphasizes their significance for seismic hazard assessment in the northwestern Himalayan foreland.
3. Data and Method
3.1. Seismic Data Compilation
Waveform data from local seismic from the Centre for Earthquake Studies (CES) and the Pakistan Meteorological Department (PMD) were utilized to carry out moment tensor inversion of the 2026 Jalalpur Sharif earthquake and to assess its seismotectonic significance. A total of 49 seismic stations form the joint network, including 33 stations operated by CES and 16 by PMD, providing coverage across different areas of Pakistan (Figure 2). The seismic stations have been operational since 1976, continuously transmitting recorded data to the central processing center in Islamabad through radio and satellite communication systems. These stations are broadband instrument and providing continuous recording, enabling reliable and high-quality acquisition of seismic waveform data [see 8,32,33 for details].
Earthquake locations and source parameters (origin time, depth, and epicenter) were calculated using the HYPOCENTER algorithm available in the SEISAN processing environment [34,35,36,37]. Earthquake solutions with RMS residuals <0.3 s were taken as reliable located events [36]. The CES catalog provides earthquake solutions with average location uncertainties of ~8 km and local magnitude (ML) uncertainties of ~0.2 units [38,39,40].
3.2. Waveform Inversion
Waveform Waveform inversion was carried out for the Jalalpur Sharif earthquake (Mw 4.5) to estimate the focal mechanism solution. To obtain reliable fault plane solutions and focal depth estimates, stations having high noise level, timing inaccuracies, or amplitude calibration problems were excluded from the analysis. Waveform data were processed using Seismic Analysis Code (SAC). A band-pass filter with a frequency range of 0.07–0.1 Hz was applied to reduce the influence of shallow subsurface effects on the source signals [41,42,43,44]. Instrument response correction was applied to the waveform data, with mean and trend removal performed before further analysis. The generation of synthetic seismograms requires the computation of Green’s functions at various source depths and station locations, which are controlled by the crustal velocity model and wave propagation behavior. A Green’s function was computed by using the discrete wave number technique of [45]. The accuracy of fault-plane solutions depends strongly on the assumed subsurface velocity structure and the presence of near-surface anisotropic effects [46,47,48] For Green’s function computation, we employed the local crustal velocity model developed by [49]. Their velocity model was developed using observations from the same seismic network utilized in this study. This model has subsequently been adopted in several recent investigations for estimating earthquake source parameters [32], while other studies have highlighted its limitations [47,48].
To estimate the source parameters of the recent earthquake, the moment tensor inversion approach of [50] was applied. The earthquake source mechanism was represented by six independent components of the seismic moment tensor. The optimal source parameters, including strike, dip, rake, and focal depth, were selected on the basis of lowest variance reduction value. It evaluate observed and synthetic waveforms fitting, where the variance reduction strongly effected by both amplitude and time. Time corrections were applied to the waveforms to improve cross-correlation and achieve better variance reduction () value. All seismograms were treated with equal weighting during the inversion. The best-fit source solution, characterized by the lowest Vr value, and the comparison between observed and synthetic waveforms for the Jalalpur Sharif event are illustrated in Figure 2 and Figure 3.
The stability of the inversion results was evaluated using the condition number (CN), which is determined from the ratio of the maximum to minimum eigenvalues of the Green’s function matrix [51]:
3.3. Seismicity Data Analysis
Seismicity recorded between 2010 and 2025 was investigated to evaluate the temporal evolution of earthquake activity in the study area. The analysis was based on a unified earthquake catalog developed by integrating datasets from CES and PMD, which provides a lower magnitude detection threshold than most regional and global catalogs. Data processing and catalog preparation followed procedures similar to those described by [53] and [8]. The spatial pattern of earthquake occurrence within the study region is shown in Figure 2.
The magnitude of completeness (Mc) was determined using the maximum curvature method of [54], which is commonly employed to evaluate the completeness level of earthquake catalogs. The Mc represents the lowest magnitude above which the recorded seismicity is considered reliably and consistently detected. The frequency–magnitude distribution (FMD) for the study area, together with the estimated Mc value, is presented in Figure 4(a).
The Gutenberg–Richter (G–R) relationship was used to examine the statistical distribution of earthquake magnitudes within the study area over a specified period. This well-established seismicity model demonstrates that the frequency of earthquake occurrence. Because of its broad applicability in seismic hazard and seismotectonic studies, the G–R relationship remains a fundamental tool for quantifying earthquake activity. The frequency–magnitude distribution (FMD) is given by:
The b-value often exhibits substantial fluctuations over short observation periods, typically ranging from 0.5 to 2.5, whereas it commonly approaches 1.0 when calculated over longer time intervals [56]. Variations in the frequency–magnitude distribution have been linked to differences in rock properties, deformation rates, tectonic setting, focal depth, and stress conditions, although the exact controlling mechanisms remain uncertain [54,57,58,59].
The temporal evolution of seismicity in the study area is shown through the daily earthquake rate and cumulative number of events in Figure 4(b) and Figure 4(c), respectively. These analyses provide valuable information on changes in seismic activity through time and help identify possible earthquake-triggering processes. They also assist in evaluating whether seismic activity in one area may influence neighboring regions through stress transfer and fault interactions, thereby contributing to clustered or sequential earthquake occurrence.
3.4. Seismogenic Depth
The seismogenic zone is identified by a noticeable decrease in earthquake occurrence with increasing depth, typically between 10 and 20 km [60,61,62]. The thickness of this active seismic layer is a critical factor that influences fault rupture dimensions and constrains the maximum magnitude of earthquakes that a fault can generate [63,64]. In addition, the depth to the basement is an important geological parameter, as it affects the accumulation and release of tectonic stress and therefore plays a significant role in the generation of large earthquakes [65,66].
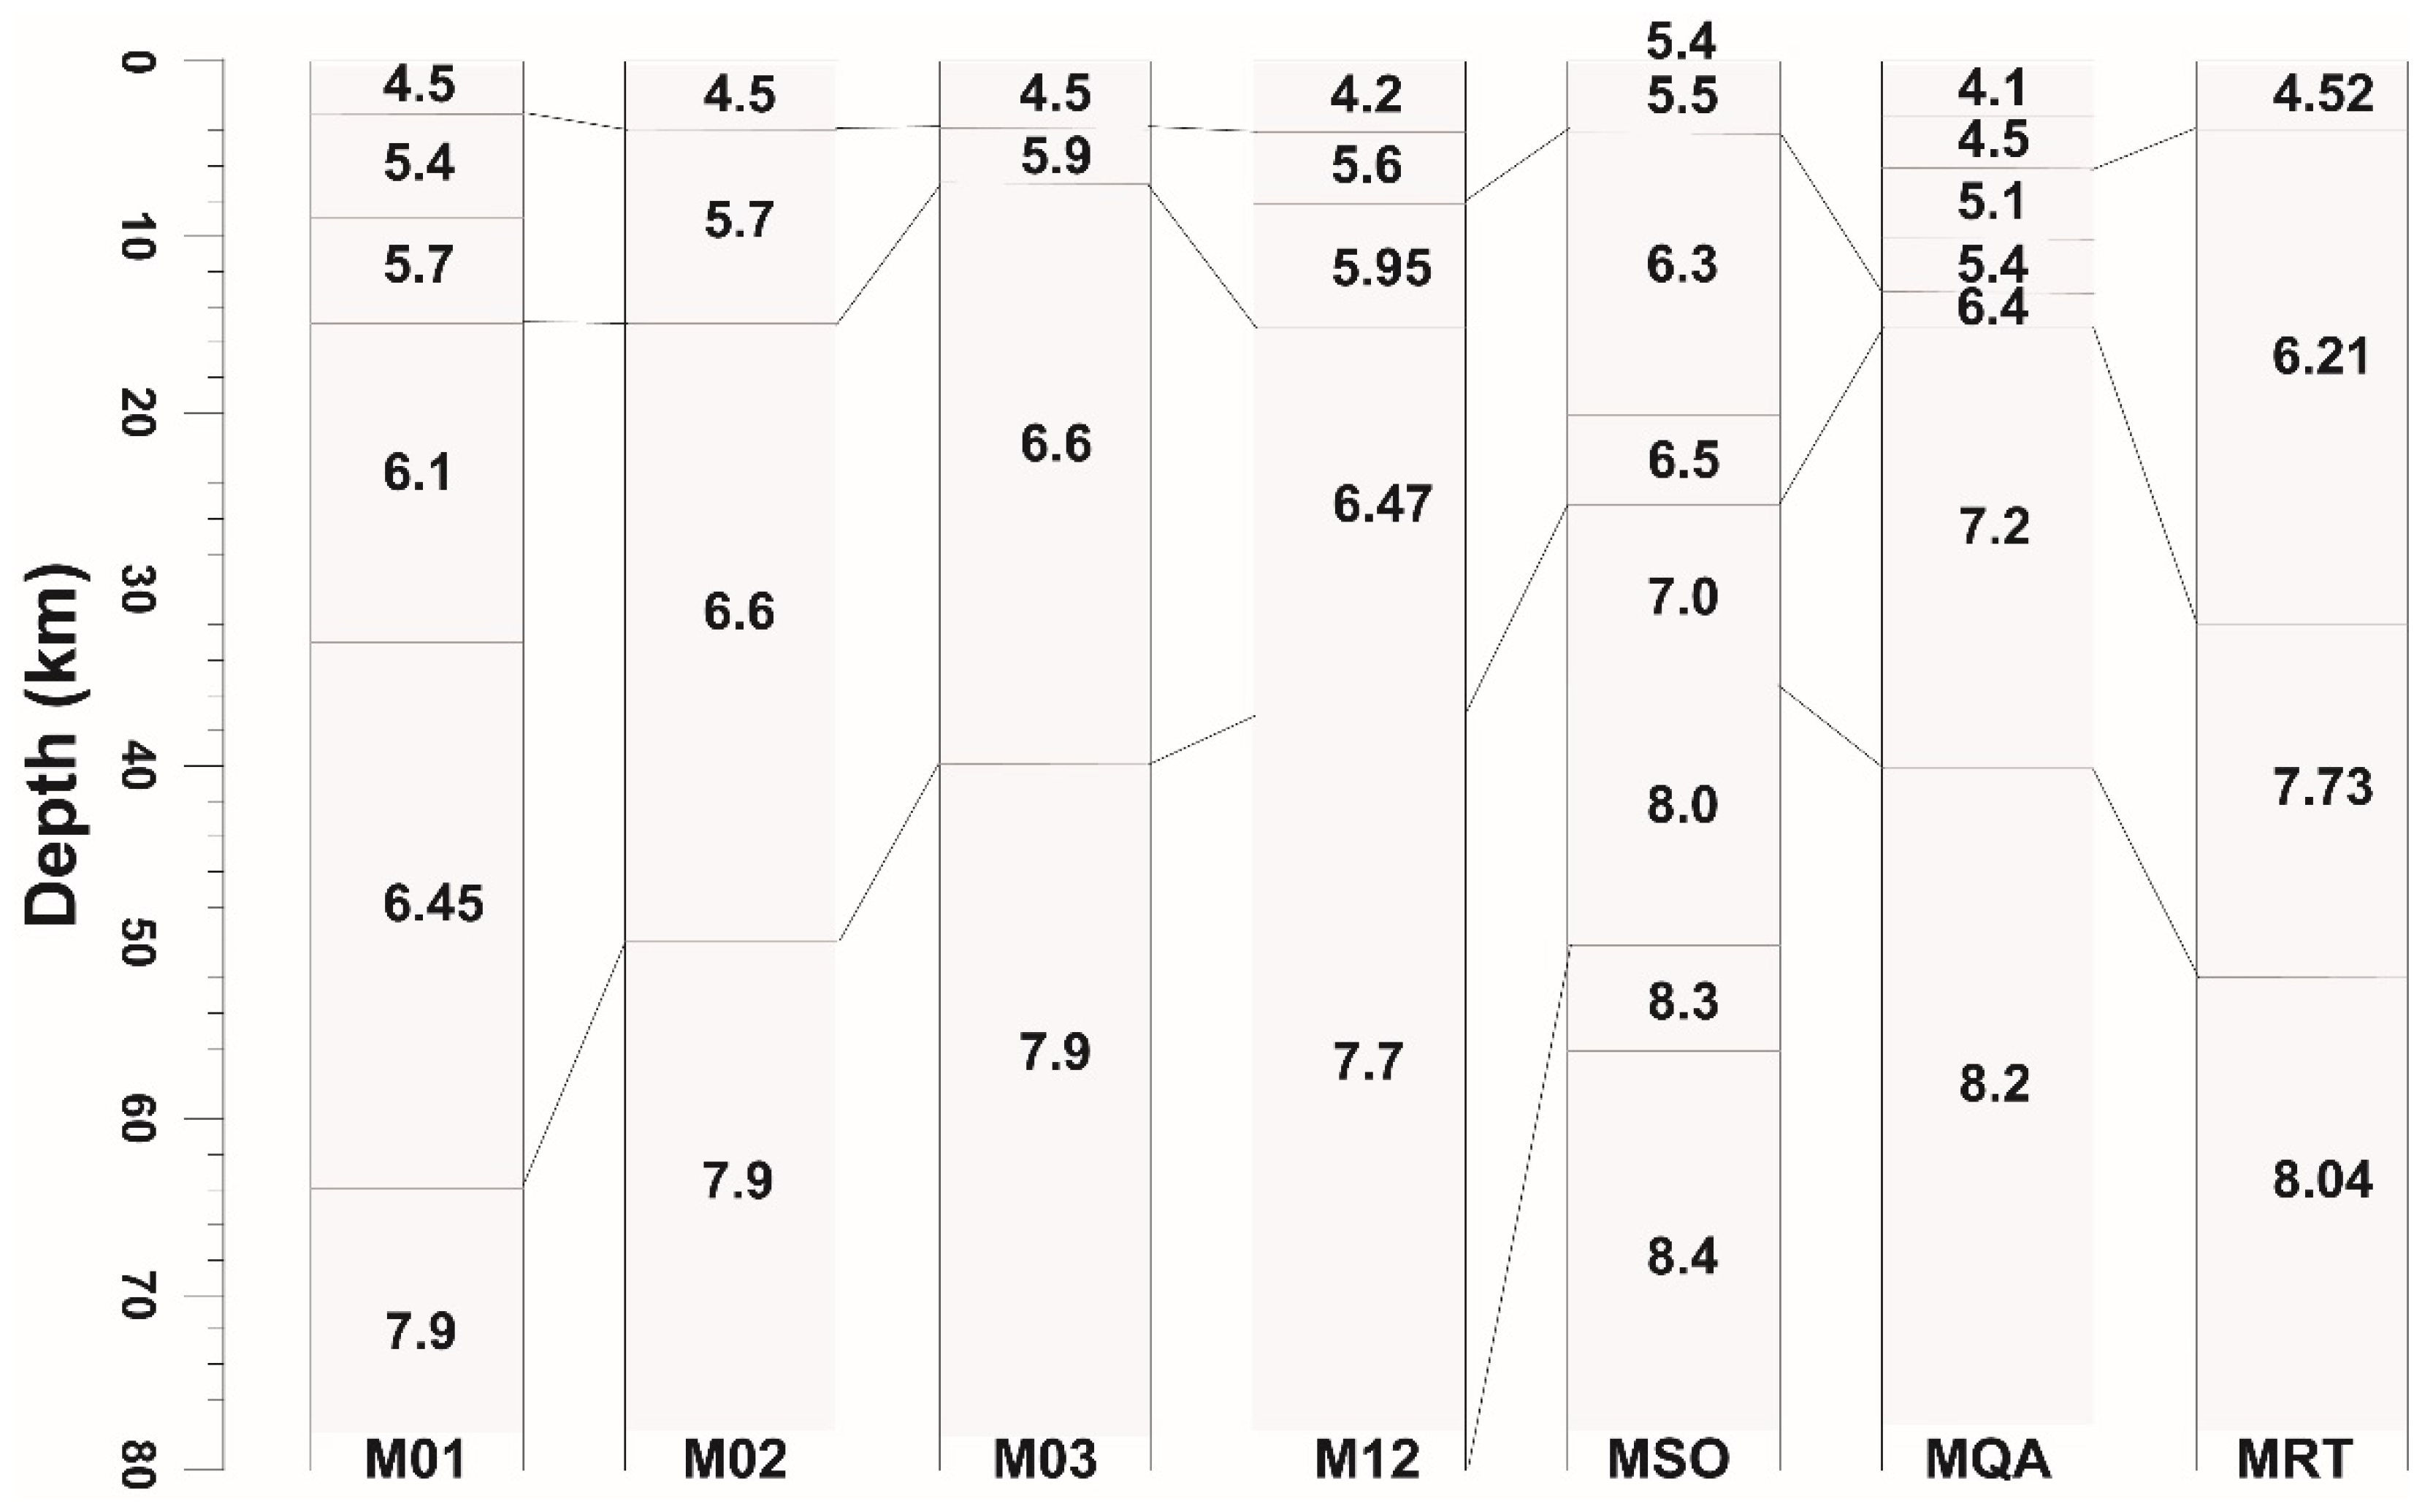
Seismicity in the Mirpur–Jalalpur Sharif region was examined to estimate the thickness of the seismogenic layer. A total of 152 earthquakes that occurred between 2010 and 2025 within a 70 km radius of the mainshock were selected for relocation. Only events recorded by at least six seismic stations were included to ensure reliable hypocentral solutions. Precise determination of earthquake focal depths depends on the selection of seismic velocity model, as the adopted model directly affects event locations and helps minimize uncertainties in depth estimates [67]. Seven velocity models were considered in this study (Appendix A, Figure A1), including models developed for Pakistan and neighboring regions of India. Among these, three models were specifically established for Pakistan and are referred to as Soomro [49], Qaisar [68], and WinPak [69]. Four velocity models from India were also incorporated, including those labeled M01, M02, and M12 [70]. Notably, the velocity model of Soomro et al. was the only local-scale model constrained using the same seismic network employed in this study. In contrast, the other velocity models were developed for broader regional applications and therefore may not adequately capture local crustal heterogeneities within the Mirpur–Jalalpur Sharif region [49,68,69]. In addition, a one-dimensional seismic velocity model for the upper and central Indus Basin was developed using data from 486 local earthquakes. To identify the most appropriate velocity structure for the study area, seven candidate models were evaluated, and the model yielding the lowest RMS travel-time residuals was chosen (Appendix Figure A1). Earthquake depths were then determined using a grid-search procedure in which the epicentral coordinates of each event were held constant while the source depth was systematically varied. The depth associated with the minimum RMS residual was taken as the preferred focal depth for that event (Figure 5).
3.5. Gravity Data
Gravity analysis was done from the TOPEX (https://topex.ucsd.edu/cgibin/-get_data.cgi). Bouguer and Terrain corrections, were applied to achieve the complete Bouguer anomaly [33,71]. The complete Bouguer anomaly (CBA) provides is the combination of near surface, intermediate and deep responses. As the Jhelum event (May 26, 2026) was occurred at shallow depth i.e. 3km, so we studied the structural variation in shallow depth in locality of said event and its surrounding as well as along the Kharian Earthquake that was occurred in near past December 5, 2024. For this, the shallow, intermediate and regional gravity responses (less the 2km, 2 to 3km and more the 3km, respectively) were separated from CBA using the technique of radial average power spectrum (RAPS). This technique is commonly used for assessing gravity responses at various depths [72,73,74,75]. To improve the resolution of features, the data was also subjected to upward continuation [76].
4. Results and Discussion
The Mw 4.5 Jalalpur Sharif earthquake of 26 May 2026 offers valuable insight into the active deformation processes and seismogenic structures of the Jhelum region in northeastern Pakistan. The earthquake occurred at 19:05:50 PST (14:05:50 UTC) near Jalalpur Sharif and caused considerable damage to residential buildings in the epicentral area. The event resulted in one fatality and several injuries. Despite its moderate magnitude, the earthquake produced unexpectedly strong local impacts, underscoring the vulnerability of existing infrastructure and emphasizing the seismic risk associated with active, yet insufficiently understood, tectonic structures in the region.
The earthquake epicenter is located within the footwall of the Salt Range Thrust (SRT), where no surface fault has been mapped in the available geological literature (Figure 1). This observation raises important questions regarding the subsurface structures responsible for the earthquake and their relationship to the regional tectonic framework.
To constrain the faulting mechanism and identify the causative structure, a moment tensor inversion was conducted using local seismic waveform data. Seismograms recorded by the Centre for Earthquake Studies (CES) and the Pakistan Meteorological Department (PMD) seismic networks were employed in the analysis (Figure 2). To further validate the inferred source mechanism and investigate the underlying subsurface structure, gravity data modeling was also performed. The combined interpretation of seismic and gravity datasets provides valuable insights into the active tectonics and seismogenic architecture of the Jalalpur Sharif region.
4.1. Faulting Style and Tectonic Association
The local seismic stations used for the moment tensor inversion of the 26 May 2026 Jalalpur Sharif earthquake are shown in Figure 2. Source parameters were determined through waveform inversion, and the preferred solution was selected based on the highest fitting between observed and synthetic waveforms, corresponding to a variance reduction (Vr) of approximately 35% (Figure 3). A grid-search procedure was applied to identify the optimum focal depth, yielding a preferred depth of about 3 km. The robustness of the inversion was assessed using the condition number (CN), which is commonly employed to evaluate the stability and reliability of moment tensor solutions. The obtained CN value of ~3.7 (Table 1) lies within the acceptable range suggested by [51], indicating that the derived source parameters are well constrained and reliable.
Figure 3.
Comparison of observed (solid lines) and synthetic (dotted lines) waveforms for the 2026 Jalalpur Sharif mainshock. The seismic station codes, maximum amplitudes, and waveform components used in the inversion are indicated above each trace. The derived focal mechanism solution is displayed as a beach ball. A grid-search approach was employed to estimate the focal depth, and the corresponding variance reduction values for different trial depths are shown in the upper-right panel. The preferred depth, corresponding to the minimum variance reduction value, is marked by a vertical dotted line.
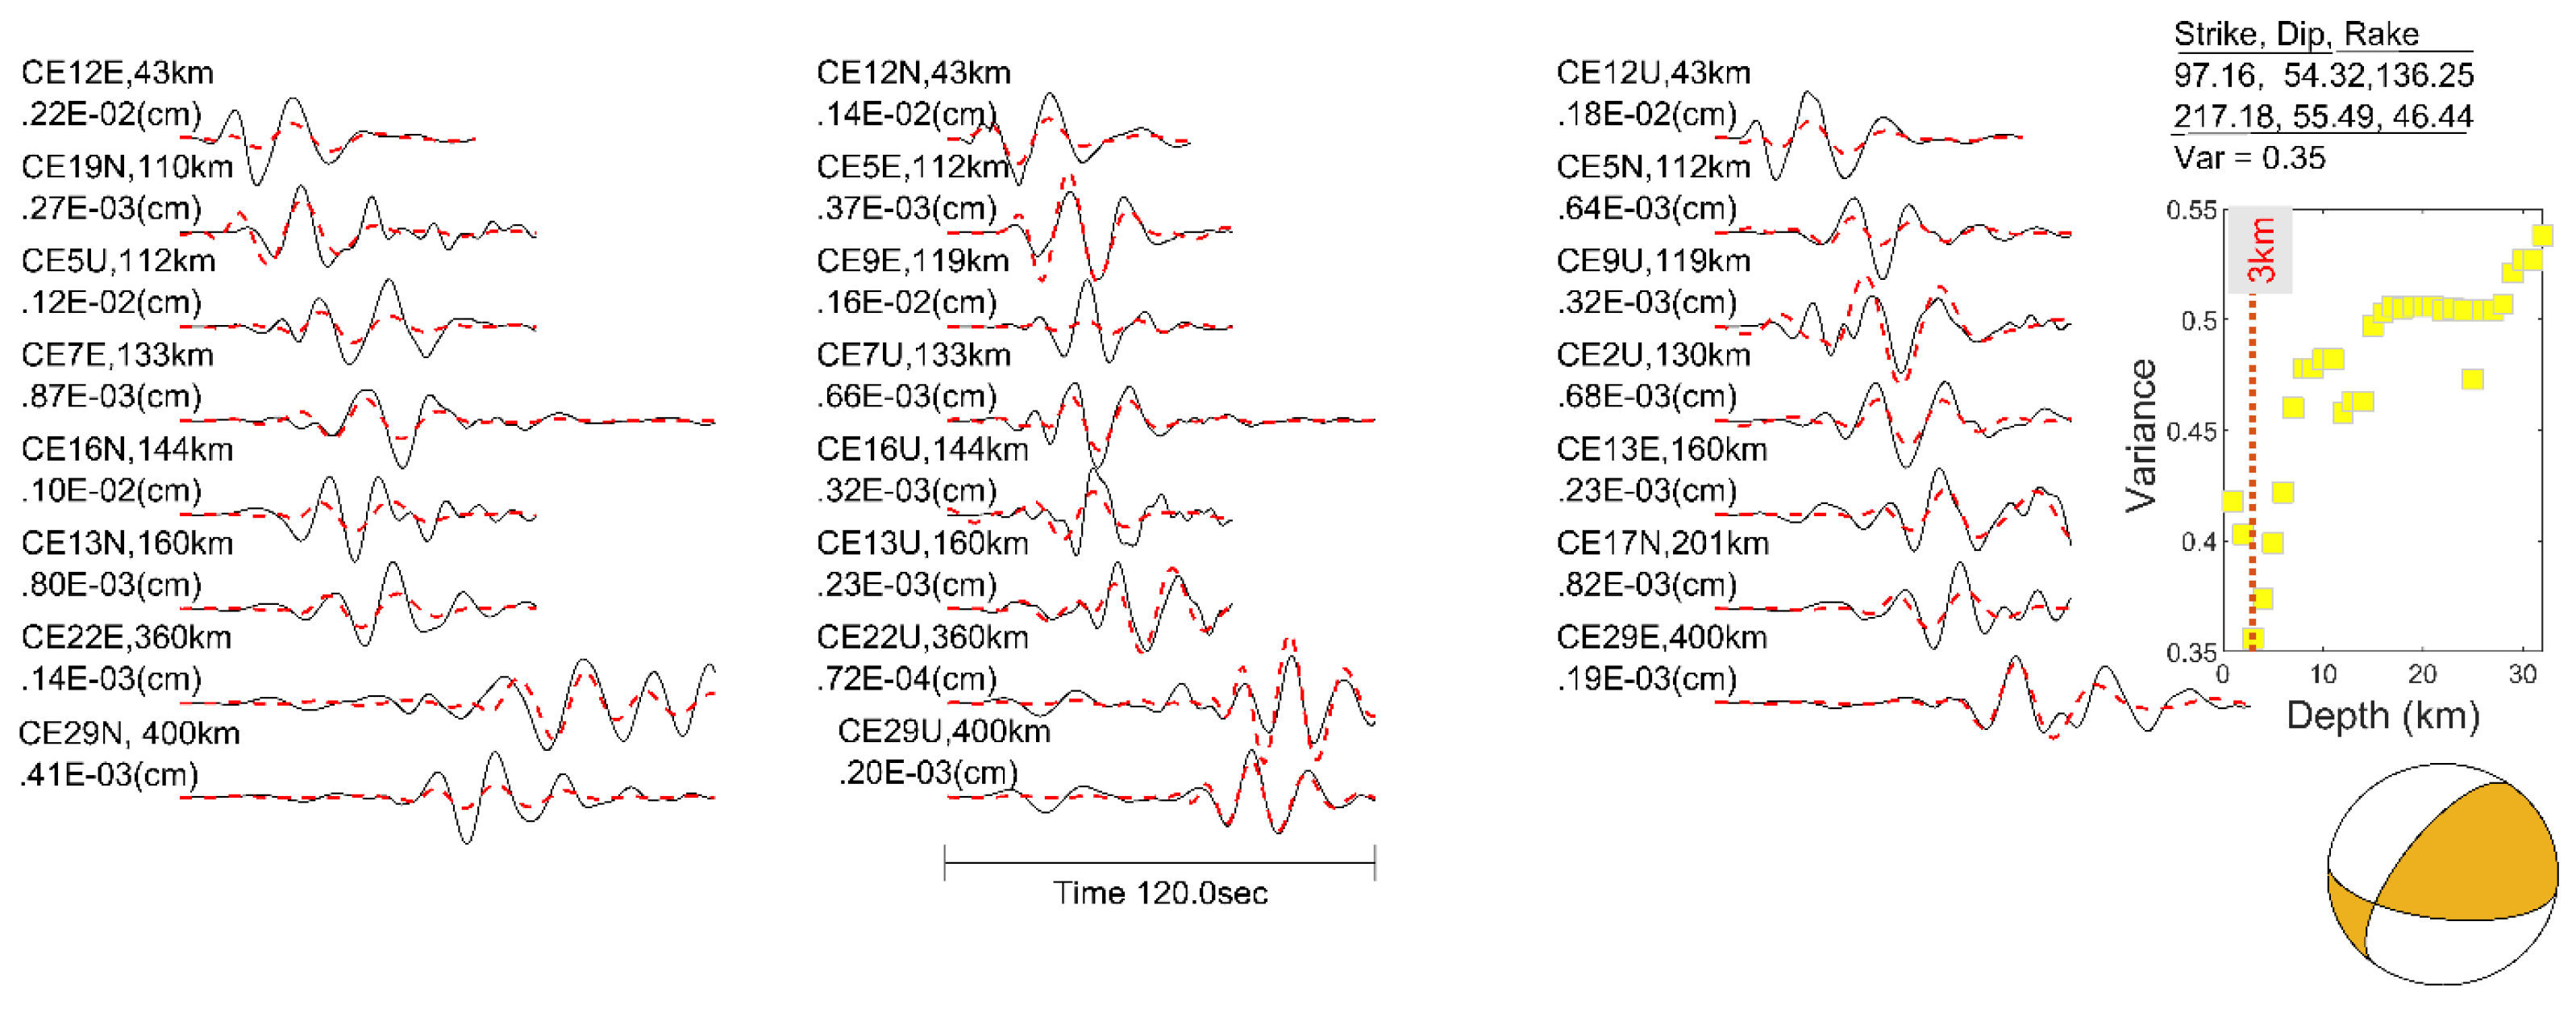
The preferred focal mechanism indicates predominantly thrust faulting with a minor left-lateral strike-slip component on a northeast–southwest (NE–SW) striking fault plane. This oblique-slip mechanism is consistent with the regional compressional tectonic regime of the northwestern Himalayan foreland and the Potwar Plateau, where ongoing convergence between the Indian and Eurasian plates is accommodated through a combination of thrusting and strike-slip deformation. Similar fault kinematics were recently documented by [7,28], who identified active thrust-related deformation within the Pabbi Anticline and reported subsidiary left-lateral strike-slip faults exhibiting orientations similar to that of the Jhelum Fault.
From a geological perspective, this depth corresponds closely to the estimated thickness of the sedimentary succession underlying the Pabbi Anticline. Geological and geophysical studies indicate that the folded sedimentary sequence in this area reaches nearly 3 km in thickness before encountering the basement [30]. The correspondence between the earthquake depth and the sedimentary cover thickness suggests that rupture likely occurred near the basal detachment or within thrust structures associated with the fault-propagation fold system responsible for the growth of the Pabbi Anticline.
Additional support for this interpretation is provided by the 2024 Kharian earthquake (having depth of 3 km, [7]), located approximately 40 km east of the Jalalpur Sharif epicenter. That event was also interpreted as being related to active deformation within the Pabbi Anticline fault-propagation fold system. These observations indicate that the Pabbi Anticline and its associated blind thrust faults remain tectonically active and continue to accommodate crustal shortening within the eastern Potwar Plateau–Salt Range fold-and-thrust belt. The occurrence of two shallow thrust-dominated earthquakes within a short time span further highlights the seismogenic potential of these concealed structures and their role in ongoing deformation of the region.
4.2. Seismogenic Depth
To select an appropriate velocity structure for earthquake relocation in the Jhelum region, seven one-dimensional velocity models were tested, including three models developed for Pakistan and four from neighboring regions of northern India. Among the evaluated models, the local velocity model of [49], which was derived using recordings from the same seismic network, yielded the smallest travel-time residuals (~ 0.3 s) between observed and synthetic data (Figure 4b).
The relocated seismicity exhibits concentration of earthquakes at depths of approximately 10–15 km, with a peak near 12 km (Figure 4). This depth interval represents the principal seismogenic layer beneath the Jhelum region and corresponds closely to the inferred position of the Main Himalayan Thrust (MHT), the regional basal décollement. It may suggests that a significant portion of crustal shortening and strain accumulation is accommodated along the MHT or within associated thrust structures rooted in this detachment. The concentration of earthquakes at these depths further indicates that the MHT and its associated structures play a fundamental role in controlling the distribution of seismic deformation within the region.
In contrast, the 2026 Jalalpur Sharif earthquake occurred at a much shallower depth of about 3 km. This depth corresponds closely to the estimated thickness of the sedimentary succession forming the Pabbi Anticline and indicates that the earthquake was not generated directly on the deeper MHT. Instead, the event likely originated on a shallow blind thrust or fault-propagation structure within the folded sedimentary cover. The thrust-dominated focal mechanism, together with the shallow hypocentral depth, supports the interpretation that the earthquake was associated with active deformation of the Pabbi Anticline, where shortening is transferred from the regional décollement to shallower thrust splays and fold-related faults.
The relationship between the shallow Jalalpur Sharif earthquake and the deeper concentration of regional seismicity suggests a mechanically linked fault system. While the MHT accommodates regional-scale convergence at depths of around 10-15 km, deformation is locally partitioned upward through subsidiary thrust faults that propagate into the sedimentary sequence. These shallow structures are capable of generating damaging earthquakes despite their relatively small magnitudes, as demonstrated by the Jalalpur Sharif event, which caused significant damage in the epicentral area.
A similar pattern has been observed in the 2019 Mirpur earthquake (Mw 5.8) nucleated at a depth of approximately 5 km and was associated with deformation above the Main Frontal Thrust (MFT). Subsequent studies showed that many aftershocks occurred on a steeper splay fault reaching depths of nearly 15 km, linking shallow faulting to deeper seismogenic structures. Likewise, the 2024 Kharian earthquake, located east of the study area, occurred at a shallow depth.
Small number of earthquakes occur below 17 km depth. This observation is consistent with previous studies of the northwestern Himalayan foreland, which indicate that active deformation is largely confined to the shallow and intermediate crust [27,77,78]. The decrease in seismicity with depth likely reflects increasing confining pressure and progressively stronger crustal conditions, which reduce the occurrence of brittle failure. Consequently, the 10–15 km depth interval represents the most favorable zone for earthquake nucleation and stress release, while shallow earthquakes such as the 2026 Jalalpur Sharif event likely occur where deformation is transferred upward from the regional décollement onto active thrust splays and fault-propagation folds within the sedimentary cover.
4.3. Regional Seismicity Characteristics
For completeness and reliability of the seismic catalog, the magnitude of completeness (Mc) was estimated as 1.3 (Figure 5a). Only events with magnitudes equal to or greater than Mc were subsequently used for seismicity analysis. The resulting Gutenberg–Richter relationship yields a b-value of 0.68 ± 0.03, indicating a relatively lower b-value for typical crustal regions. The observed low b-value may partly reflect the influence of the 2019 Mirpur earthquake aftershock sequence, which contributes a higher proportion of moderate-magnitude events to the catalog. It may also indicate heterogeneous stress conditions and localized stress accumulation within the Jhelum–Mirpur region [8].
A substantial change in the transient seismicity rate was observed following the 2019 Mirpur earthquake. The mean daily seismicity rate increased from approximately 0.03 events/day prior to the mainshock to 0.11 events/day afterward (Figure 5b), consistent with observations reported by [8] for the Mirpur region. Comparison of cumulative earthquake occurrence north and south of 33°N latitude reveals contrasting temporal behavior (Figure 5c). While the northern zone was dominated by the Mirpur aftershock sequence, the southern Kharian–Jalalpur Sharif region remained relatively quiescent during the aftershock triggering period. [8] reported an aftershock duration of approximately 600 days for the Mirpur sequence, after which a noticeable increase in seismic activity emerged in the southern part of the study area beginning in 2022. The occurrence of both the 2024 Kharian earthquake and the 2026 Jalalpur Sharif earthquake during this period of accelerating seismicity suggests progressive stress accumulation and renewed activation of fault structures within the southern Jhelum region.
4.4. Coulomb Stress Changes
The potential contribution of stress transfer to the 2026 Jalalpur Sharif earthquake was investigated using Coulomb stress modeling. The model of [8] was revised by including the 2019 Mirpur and 2024 Kharian earthquakes as source events. The Jalalpur Sharif fault plane was taken as the receiver fault. The resulting stress field was analyzed to evaluate whether stress changes from earlier earthquakes increased the likelihood of fault rupture in the epicentral area. The modeling results indicate that the epicentral area is located within a region of positive Coulomb stress change, implying that the preceding earthquakes increased the likelihood of fault reactivation in the area. Although the calculated stress increase is modest, with a maximum value of approximately 0.001 bar, it suggests that static stress perturbations may have contributed to advancing the fault toward failure. The resulting stress distribution is presented in Figure 6.
Positive Coulomb stress changes are concentrated over the Pabbi Anticline, supporting the interpretation that this fold-thrust structure remains tectonically active. Both the 2024 Kharian and 2026 Jalalpur Sharif earthquakes occurred within this stress-enhanced zone and are spatially associated with the Pabbi Anticline. The positive stress anomalies suggest that these faults are favorably oriented for failure under the current stress regime. Furthermore, stress transfer from the 2019 Mirpur earthquake sequence may have advanced the failure clock of nearby faults, thereby increasing the likelihood of subsequent earthquakes in the region. The occurrence of multiple earthquakes within the same stress corridor indicates ongoing deformation and stress redistribution among interconnected thrust faults. These observations suggest that the Pabbi Anticline and its associated blind thrusts constitute active seismogenic structures and represent an important source of seismic hazard in the Jhelum region.
4.5. Gravity Modeling
Gravity data investigation directed to discriminate variations in gravity in the region, discern structural variations/ faulting pattern and the impact of tectonic features. Figure 1 pageants the CBA map of study region, which represents the collective gravity response of shallow, intermediate and deep structures. The map highlights the higher gravity values on the south-western side, compared to rest of region. Salt Range Thrust (SRT), the regional tectonic feature is clearly identifiable CBA response, as shown in Figure 7. Moreover, minor indications of NE-SW trending fold (Pabbi anticline) just south of the Kharian earthquake event are also observable (sandwiched between the northern and southern side high density parallel regions). Figure 8 represents the shallow gravity response (less the 2km) separated from CBA for our area of interest. The recent Jhelum event (May 26, 2026) can be seen as the continuation of same structure, with many localized left lateral movements. In left side adjacent to recent event, the left lateral movements are also observable, clearly. In Figure 9, the continuity of structure becomes clear, as we move to toward the intermediate response. The same continuity becomes vanish in regional response below 3km, separating south western high density region from other areas.
4.6. Field Observations and Macroseismic Intensity Assessment
The recent moderate-magnitude earthquake caused anomalous damage within a localized area, where a teenager was killed and at least a dozen people were injured due to the collapse of houses. A field survey was conducted using questionnaires designed to collect the information required for intensity assessment according to the Modified Mercalli Intensity (MMI) scale. Earthquake-induced environmental effects, including rockfalls, landslides, and liquefaction, were also identified during the field investigation. Details of these observations are provided in the following subsections.
4.6.1. Field Survey of the Epicenteral Area
According to the designed questionnaire, more than eighty individuals were interviewed at fifteen localities covering the epicentral area of Jalalpur Sharif and surrounding villages, including Nathwala, Mariala, Dhariala Jalip, Pir Chack, Jhandran, Chandh, and Wagh. Detailed field observations, together with photographic documentation of structural damage and earthquake-induced environmental effects, were conducted during the survey (Appendix B).
Based on these observations, the highest intensity was recorded at Jalalpur Sharif, where the greatest loss of life and property occurred. The epicenter determined from the local CES seismic network closely corresponds to the area of maximum observed intensity, providing confidence in the earthquake location. Residents in the epicentral area also reported hearing a roaring sound during the earthquake, suggesting rupture of a very shallow asperity capable of generating audible seismic waves (>20 Hz). The zone of maximum damage covered approximately 4.5 km², and representative photographs of the damage are presented in Photos 1–6 (Appendix B).
The most severe damage occurred in poorly constructed buildings. Typical damage patterns included wall cracking, splitting of masonry units, partial wall collapse, and roof failure. Several reinforced concrete (RC) structures also exhibited cracks in roof slabs and beam–column joints, indicating inadequate seismic detailing and poor construction practices (Photo 6). In addition, utility poles were observed to have tilted northward (Photos 4 and 7), while in several buildings the walls had separated from the roof and were displaced toward the north. Similar observations were reported by local residents during interviews. These features collectively indicate a dominant north–south component of ground motion during the earthquake. Macroseismic evaluation indicates a maximum intensity of VII on the MMI/EMS-98 scale within the epicentral area (Figure 10).
The spatial distribution of intensity reveals a preferential elongation in the NE–SW and E–W directions, broadly corresponding to the strike of the causative structure and the trend of the Pabbi Anticline. This pattern suggests that the propagation of seismic energy and the distribution of damage were influenced by the underlying tectonic framework. Away from the epicentral region, shaking intensity decreased progressively in all directions, except at a few locations where structural damage resulted primarily from secondary effects rather than direct ground shaking (Photos 10–15).
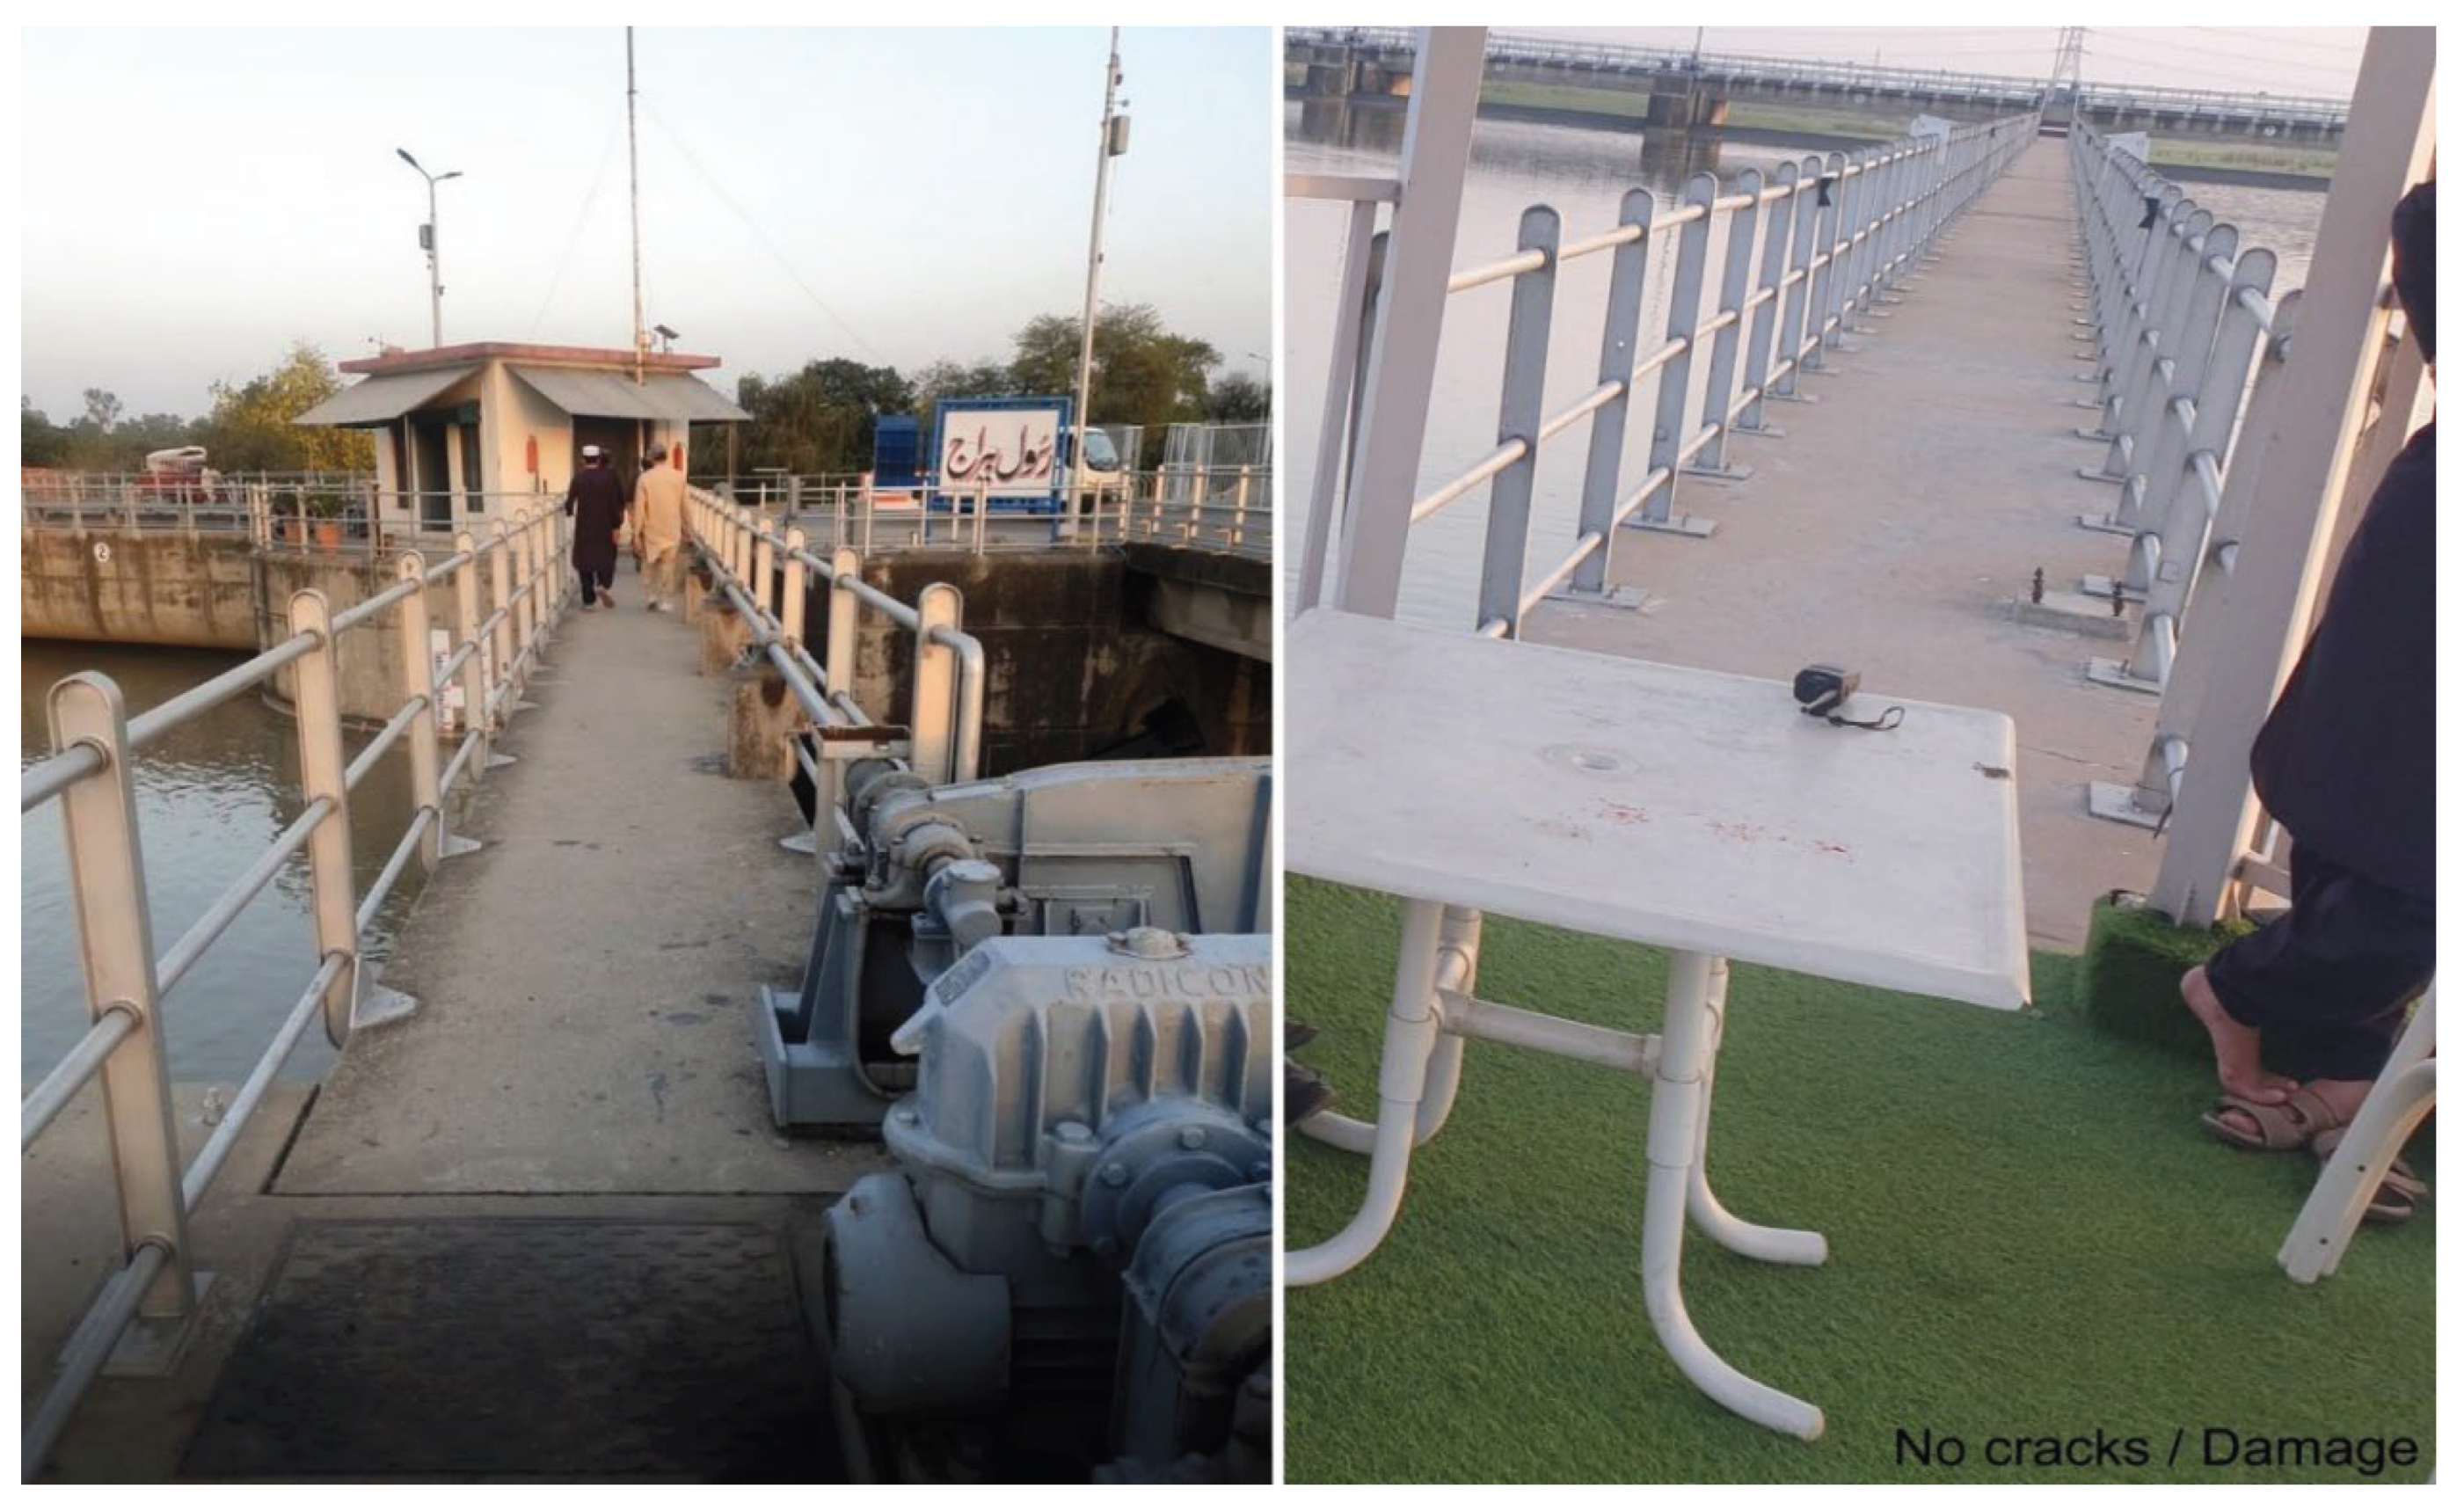
No damage was observed in the well-engineered structures at Head Rasul (Photo 16), although the earthquake was felt by most residents. Based on field observations and questionnaire responses, an intensity of II on the MMI scale was assigned to the area. A post-earthquake photograph of Head Rasul is shwon in Photo 16.
4.6.2. Earthquake Environmental Effects (EEEs)
During field survey, Earthquake Environmental Effects including Liquefaction, Turbidity of groundwater and Rock-fall / Land-sliding were investigated in detail. Shaking related liquefaction could be observed in the form of floor settlement, tilting of electric poles and turbidity of groundwater.
4.6.2.1. Turbidity of Groundwater
Shaking related turbidity of groundwater was only reported from a limited area (i.e. Jalapur Sharif) lasting for a few hours after occurrence of earthquake.
4.6.2.2. Liquefaction Effects on Civil Structures
The area dominantly consists of fluvial sand and silt deposits susceptible to liquefaction when subjected to shaking especially in horizontal direction. Tilting of civil structures and poles (particularly with shallow foundations) was observed not only in the epicentral area but also at considerable distances. For example, appearance of wide cracks in the piers / abutments of road bridge and a mosque more than twelve kilometers away signifies the extent of such damage due to differential settlement caused by sand liquefaction and site amplification factors. Pictorial evidences of these damages can be viewed in Appendix-B (Photo 8 -11).
4.6.2.3. Dust Caused by Rock-Fall and Landslides
The most striking feature of this seismic event was dust caused by rock-fall / landslides along both limbs of the ridge north of epicenter. This was observed by residents of epicenter as well as Chamkon Valley (Chamkon: acronym of the names of villages situated within the valley). The dust rose to such a height that the residents of the farthest villages in the said valley could observe it clearly. This is another fact indicating shallow occurrence of earthquake that caused severe shaking of the ridge resulting in rock-fall / landslides. Photography of the area is restricted due to presence of strategic formation in the area; however, limited pictures beyond the restricted area have been taken to show the nature and magnitude of mass movement causing the dust. Pictorial evidences of Landslide / Rock-fall can be viewed in Appendix-B (Photo 8 and Photo 9).
5. Conclusion
The Mw 4.5 Jalalpur Sharif earthquake of 26 May 2026 caused significant localized damage, resulting in one fatality, fourteen injuries, and a maximum intensity of VII on the Modified Mercalli Intensity (MMI) scale in the epicentral area. Field investigations documented several earthquake-induced environmental effects, including liquefaction, temporary groundwater turbidity, differential settlement, tilting of utility poles, and landslides within the Quaternary deposits of the Tilla Jogian Range. Moment tensor inversion, supported by gravity modelling, indicates that the earthquake originated at a shallow depth of approximately 3 km and was associated with a blind thrust beneath the Pabbi Anticline. The source mechanism is characterized by predominantly thrust faulting with a minor left-lateral strike-slip component. The spatial distribution of macroseismic intensity was elongated along the strike of the inferred causative structure, while observed north–south ground displacement, evidenced by tilted utility poles and structural deformation, is consistent with the minor strike-slip component of the focal mechanism. Seismicity patterns and Coulomb stress modelling suggest that the Jalalpur Sharif source region lies within a stress-enhanced zone influenced by the 2019 Mw 5.8 Mirpur earthquake. The occurrence of both the 2024 Mw 5.0 Kharian and 2026 Jalalpur Sharif earthquakes during a period of elevated seismicity indicates ongoing stress redistribution and progressive strain accumulation within the region. These findings suggest an increasing seismic hazard in the Jhelum–Kharian–Jalalpur Sharif corridor and highlight the important role of concealed thrust structures in accommodating active deformation within the northwestern Himalayan foreland.
Author Contributions
Conceptualization, M.T., M.Z.I. and R.A.H..; methodology, M.T., M.Z.I.,R.A.H., M.T.I., M.N.M., F.J.,T,I.,A.A.,M.A.S.,K.K.,N.G.,A.C.,C.D.,G.P.,I.V, Gi.P and D.N.; software, M.T., M.Z.I. and R.A.H.; validation, M.T., M.Z.I.,R.A.H., M.T.I., M.N.M.,,A.C.,C.D.,G.P.,,I.V, Gi.P and D.N..; formal analysis, M.T., M.Z.I.,R.A.H., M.T.I., M.N.M., F.J.,T,I.,A.A.,M.A.S.,K.K.,N.G.,A.C.,C.D.,G.P. I.V, Gi.P and D.N,; investigation, M.T., M.Z.I.,R.A.H., M.T.I., M.N.M., F.J.,T,I.,A.A.,M.A.S.,K.K.,N.G.,A.C.,C.D.,G.P., and D.N. resources, D.N. and S.D.; data curation, M.T., M.Z.I.,R.A.H., M.T.I., M.N.M., F.J.,T,I.,A.A.,M.A.S.,K.K.,N.G.,A.C.,C.D.,G.P., and D.N; writing—original draft preparation, M.T. ,and M.Z.I. writing—review and editing, M.T. and D.N.; visualization, M.T., M.Z.I., R.A.H.. and A.A. ; supervision, T.I. and D.N..; project administration, T.I., G.P. D.N.;. All authors have read and agreed to the published version of the manuscript.”.
Funding
This work received no specific grant from any funding agency in the public, commercial, or not-for-profit sectors.
Data Availability Statement
The data supporting the findings of this study are available from the corresponding author upon reasonable request.
Acknowledgments
The authors gratefully acknowledge the officials of CES and PMD for providing the data utilized in this study. We sincerely appreciate the support and assistance of our CES colleagues, Bilal Saif, Yousaf Khan, and Azmat Azad. Their valuable suggestions significantly enhanced the quality of the figures and improved the technical presentation of the manuscript.
Conflicts of Interest
The authors declare that they have no conflicts of interest related to this work. All authors confirm that they have no affiliations with, or involvement in, any organization or entity with a financial interest in the subject matter or materials discussed in this manuscript, including honoraria, grants, participation in speakers’ bureaus, memberships, employment, consultancies, stock ownership, other equity interests, expert testimony, or patent-licensing arrangements. The authors further confirm that they have no relevant non-financial interests, including personal or professional relationships, affiliations, knowledge, or beliefs that could have influenced the work.
Appendix A
Figure A.
Poorly constructed structures were more severely damaged in the epicenteral area: Snap of the house where casualty occurred. Cracks can be observed in brick masonry walls while mud-mortar / brick masonry walls were shattered causing collapse of roof.
Figure A.
Poorly constructed structures were more severely damaged in the epicenteral area: Snap of the house where casualty occurred. Cracks can be observed in brick masonry walls while mud-mortar / brick masonry walls were shattered causing collapse of roof.
Appendix B. (Field Evidence)
Photo 2.
Snaps of the house next to the house where casualty occurred. Cracks can be observed in brick masonry walls while mud-mortar / brick masonry walls were shattered causing collapse of roof.
Photo 2.
Snaps of the house next to the house where casualty occurred. Cracks can be observed in brick masonry walls while mud-mortar / brick masonry walls were shattered causing collapse of roof.
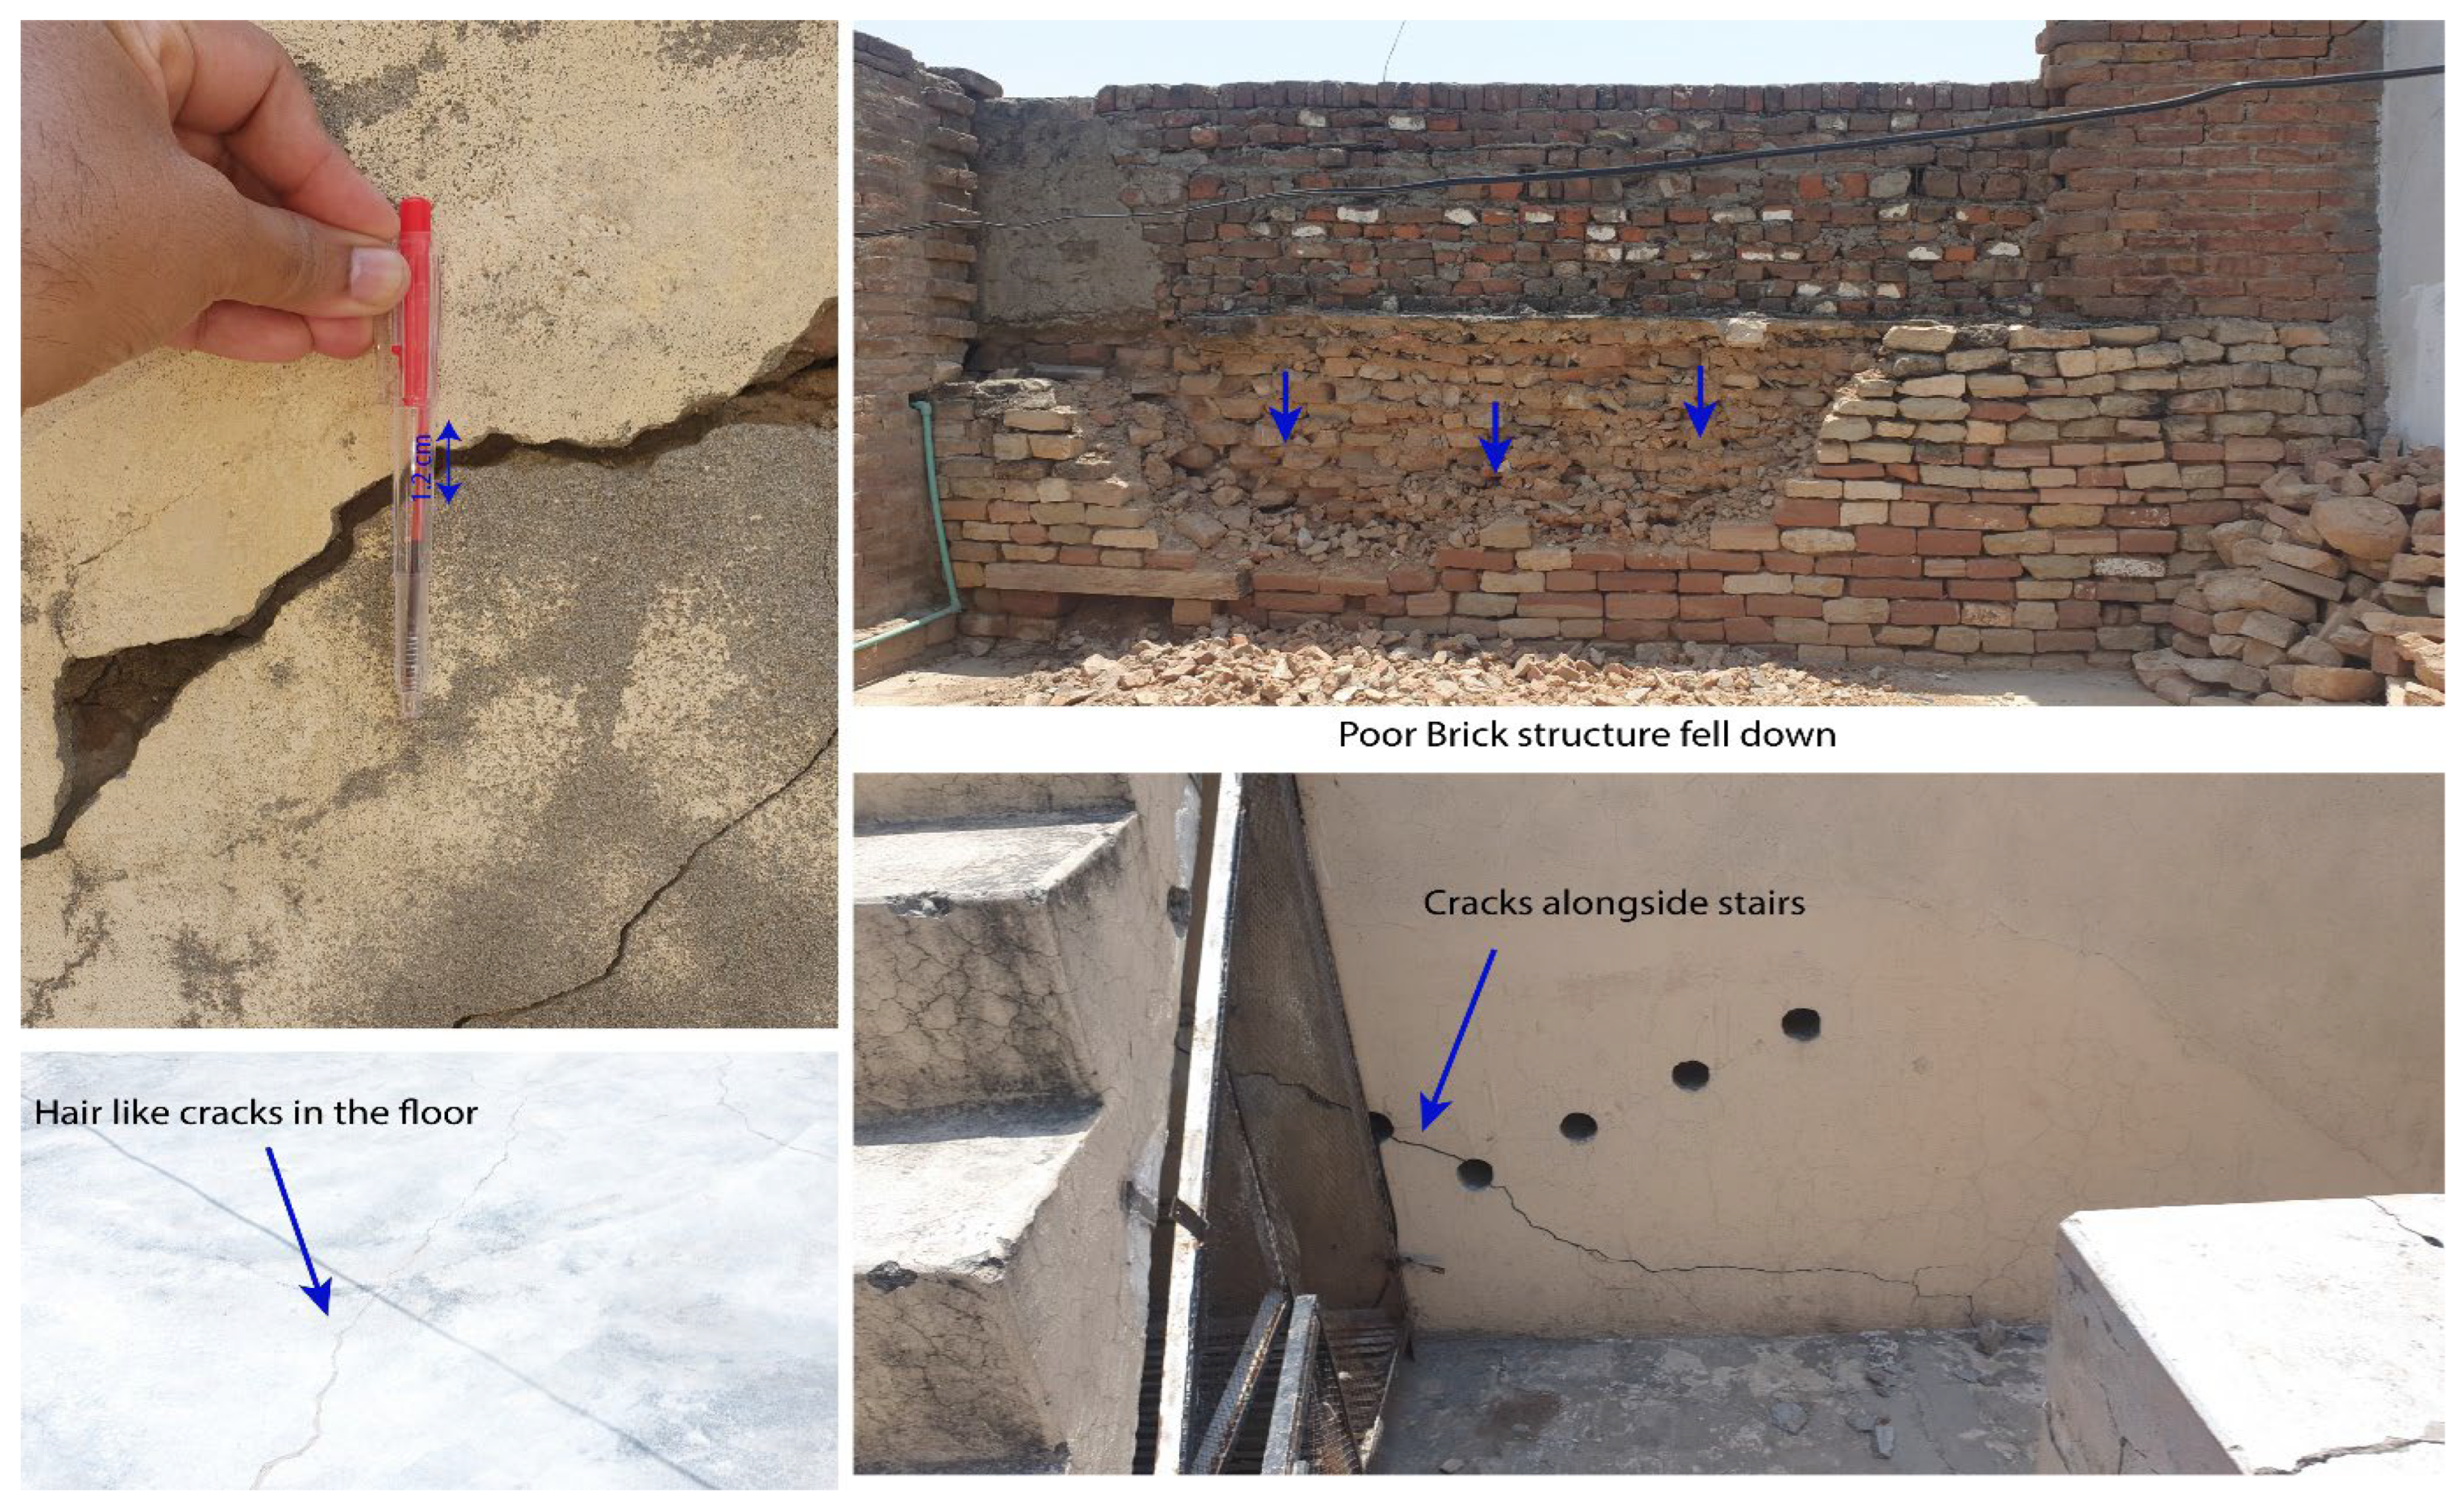
Photo 3.
Snaps of the house next to the house where casualty occurred. Cracks can be observed in brick masonry walls while mud-mortar / brick masonry walls were shattered causing collapse of roof.
Photo 3.
Snaps of the house next to the house where casualty occurred. Cracks can be observed in brick masonry walls while mud-mortar / brick masonry walls were shattered causing collapse of roof.
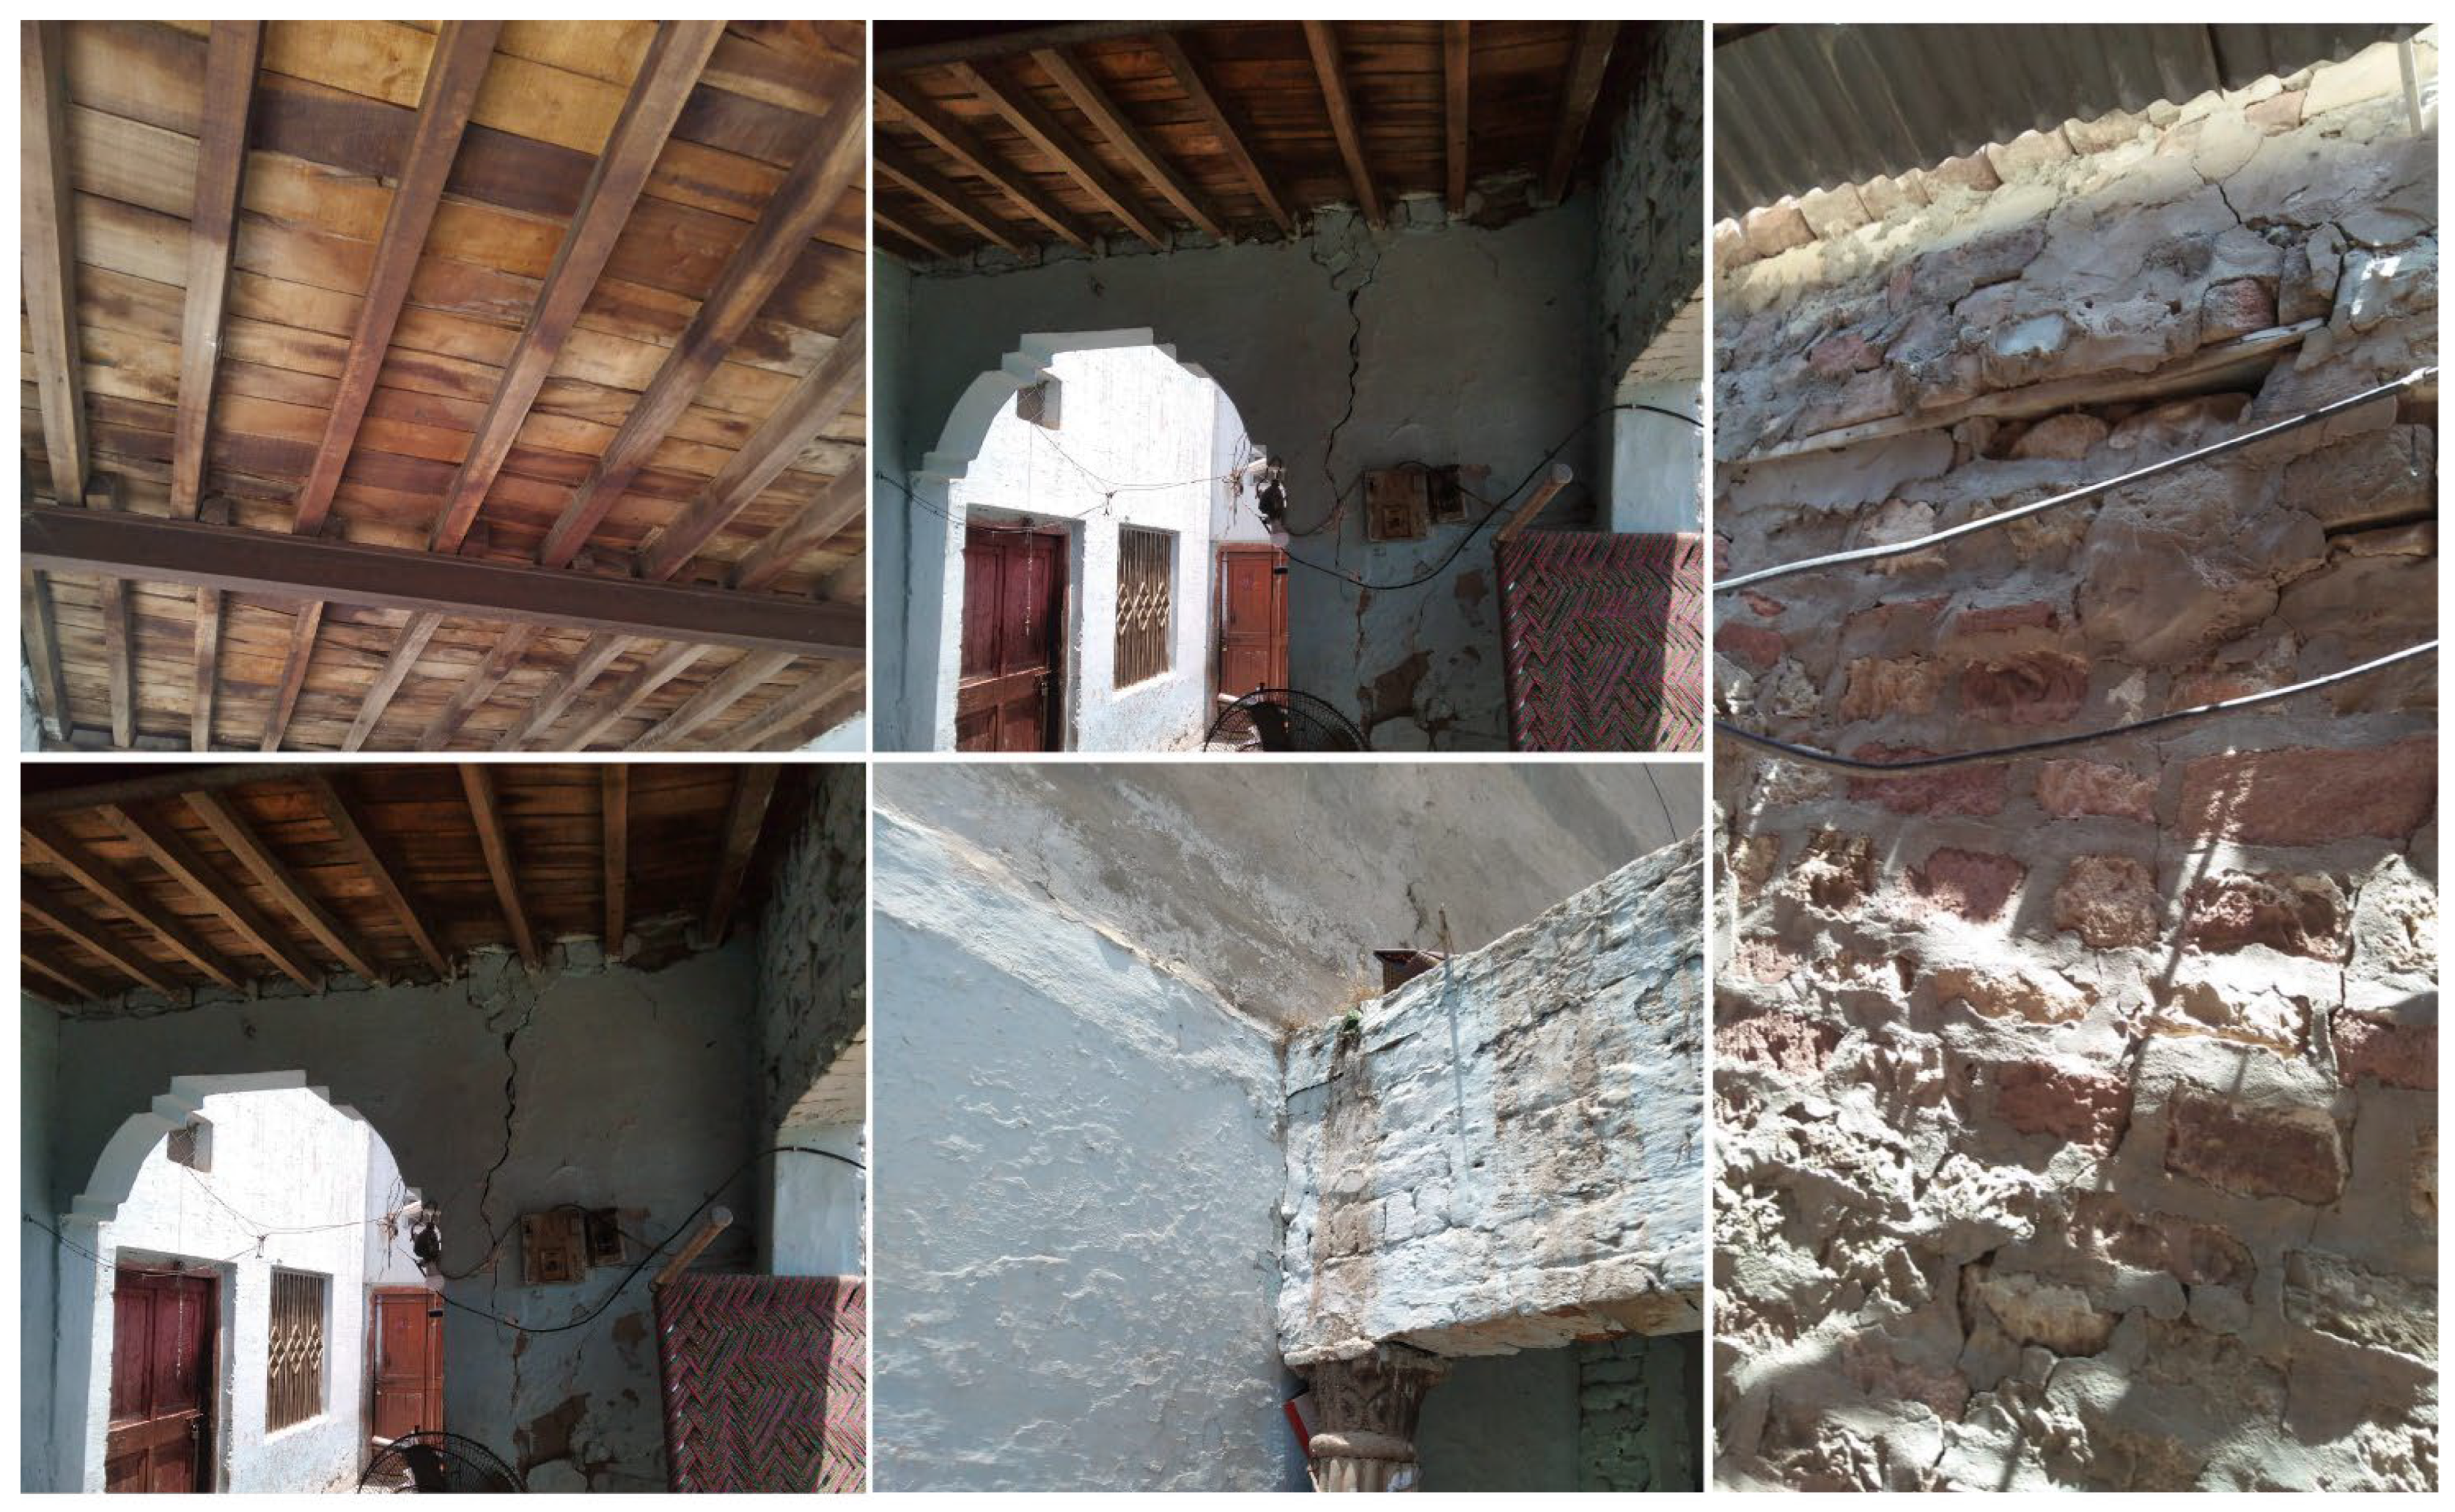
Photo 4.
Snaps of the houses in the area of maximum intensity. One can observe narrower cracks in Column-Beam / Arch structures vis-à-vis wider cracks in brick masonry walls and shattering mud-mortar / brick masonry walls causing collapse of roof.
Photo 4.
Snaps of the houses in the area of maximum intensity. One can observe narrower cracks in Column-Beam / Arch structures vis-à-vis wider cracks in brick masonry walls and shattering mud-mortar / brick masonry walls causing collapse of roof.
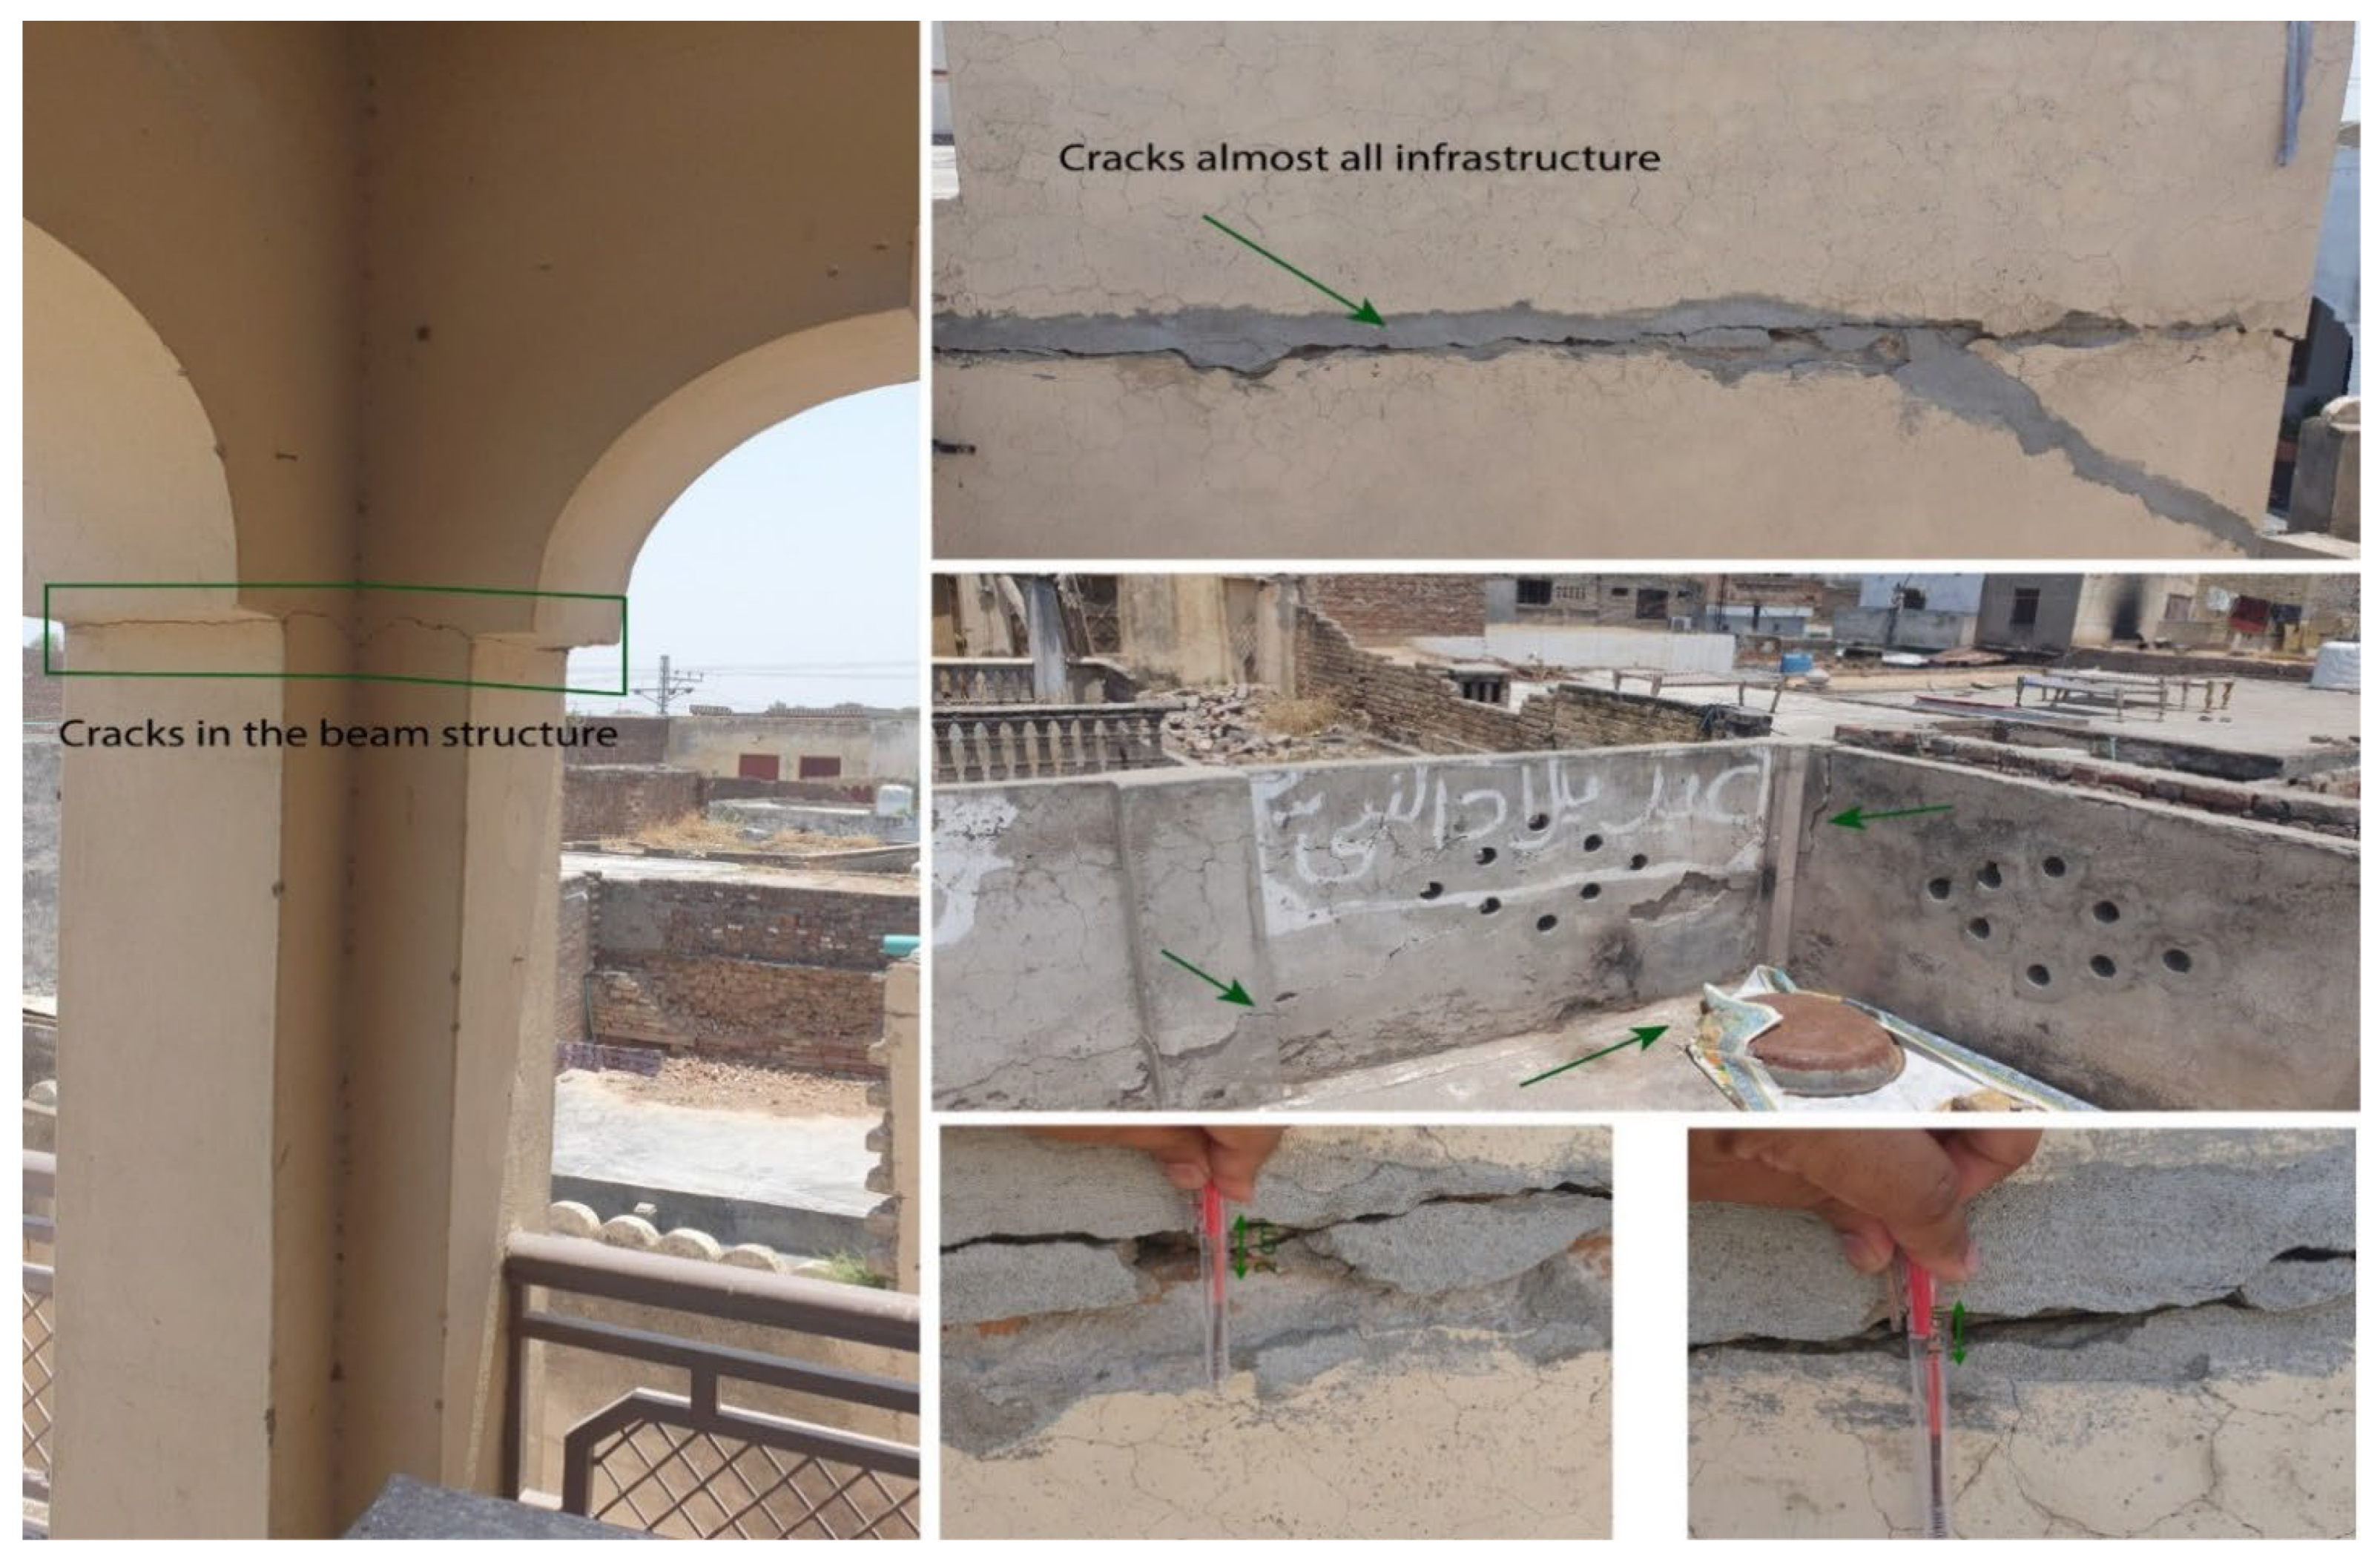
Photo 5.
Snaps of a school building in the maximum intensity area; cracks can be observed in properly designed/constructed structure of public-sector building.
Photo 5.
Snaps of a school building in the maximum intensity area; cracks can be observed in properly designed/constructed structure of public-sector building.
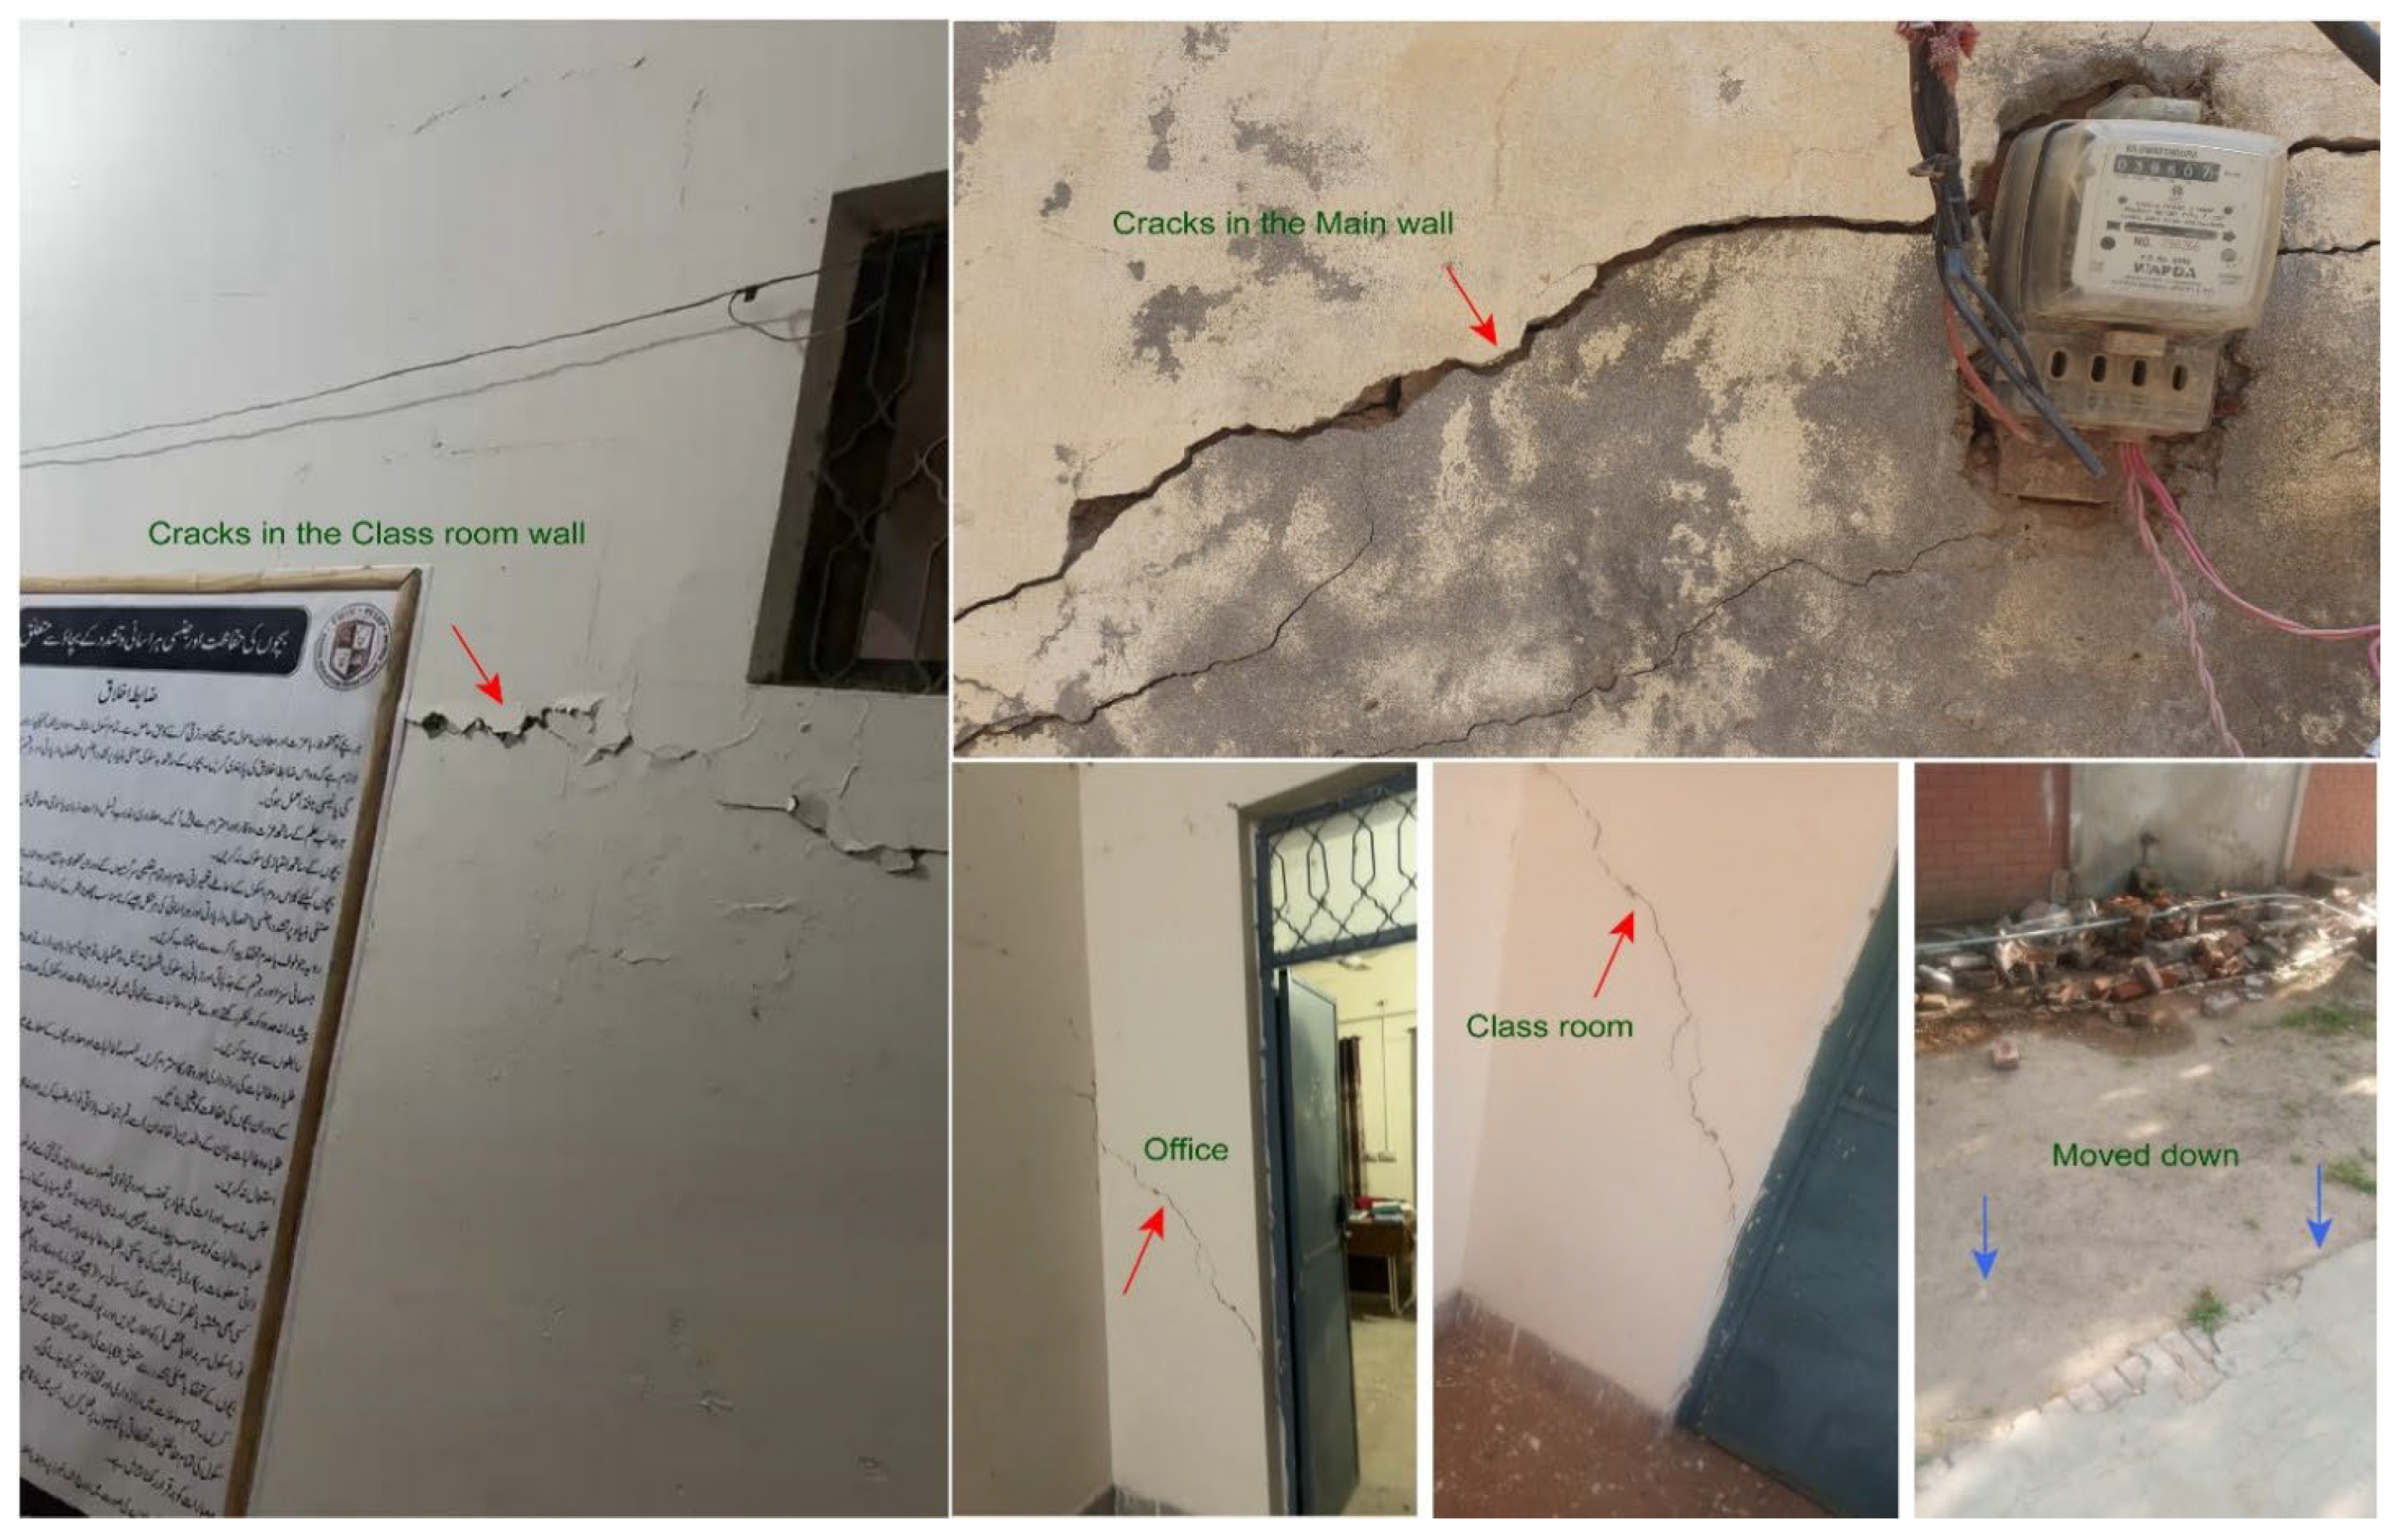
Photo 6.
Snaps of houses and mosque in the maximum intensity area; cracks can be observed in properly designed/constructed structures.
Photo 6.
Snaps of houses and mosque in the maximum intensity area; cracks can be observed in properly designed/constructed structures.
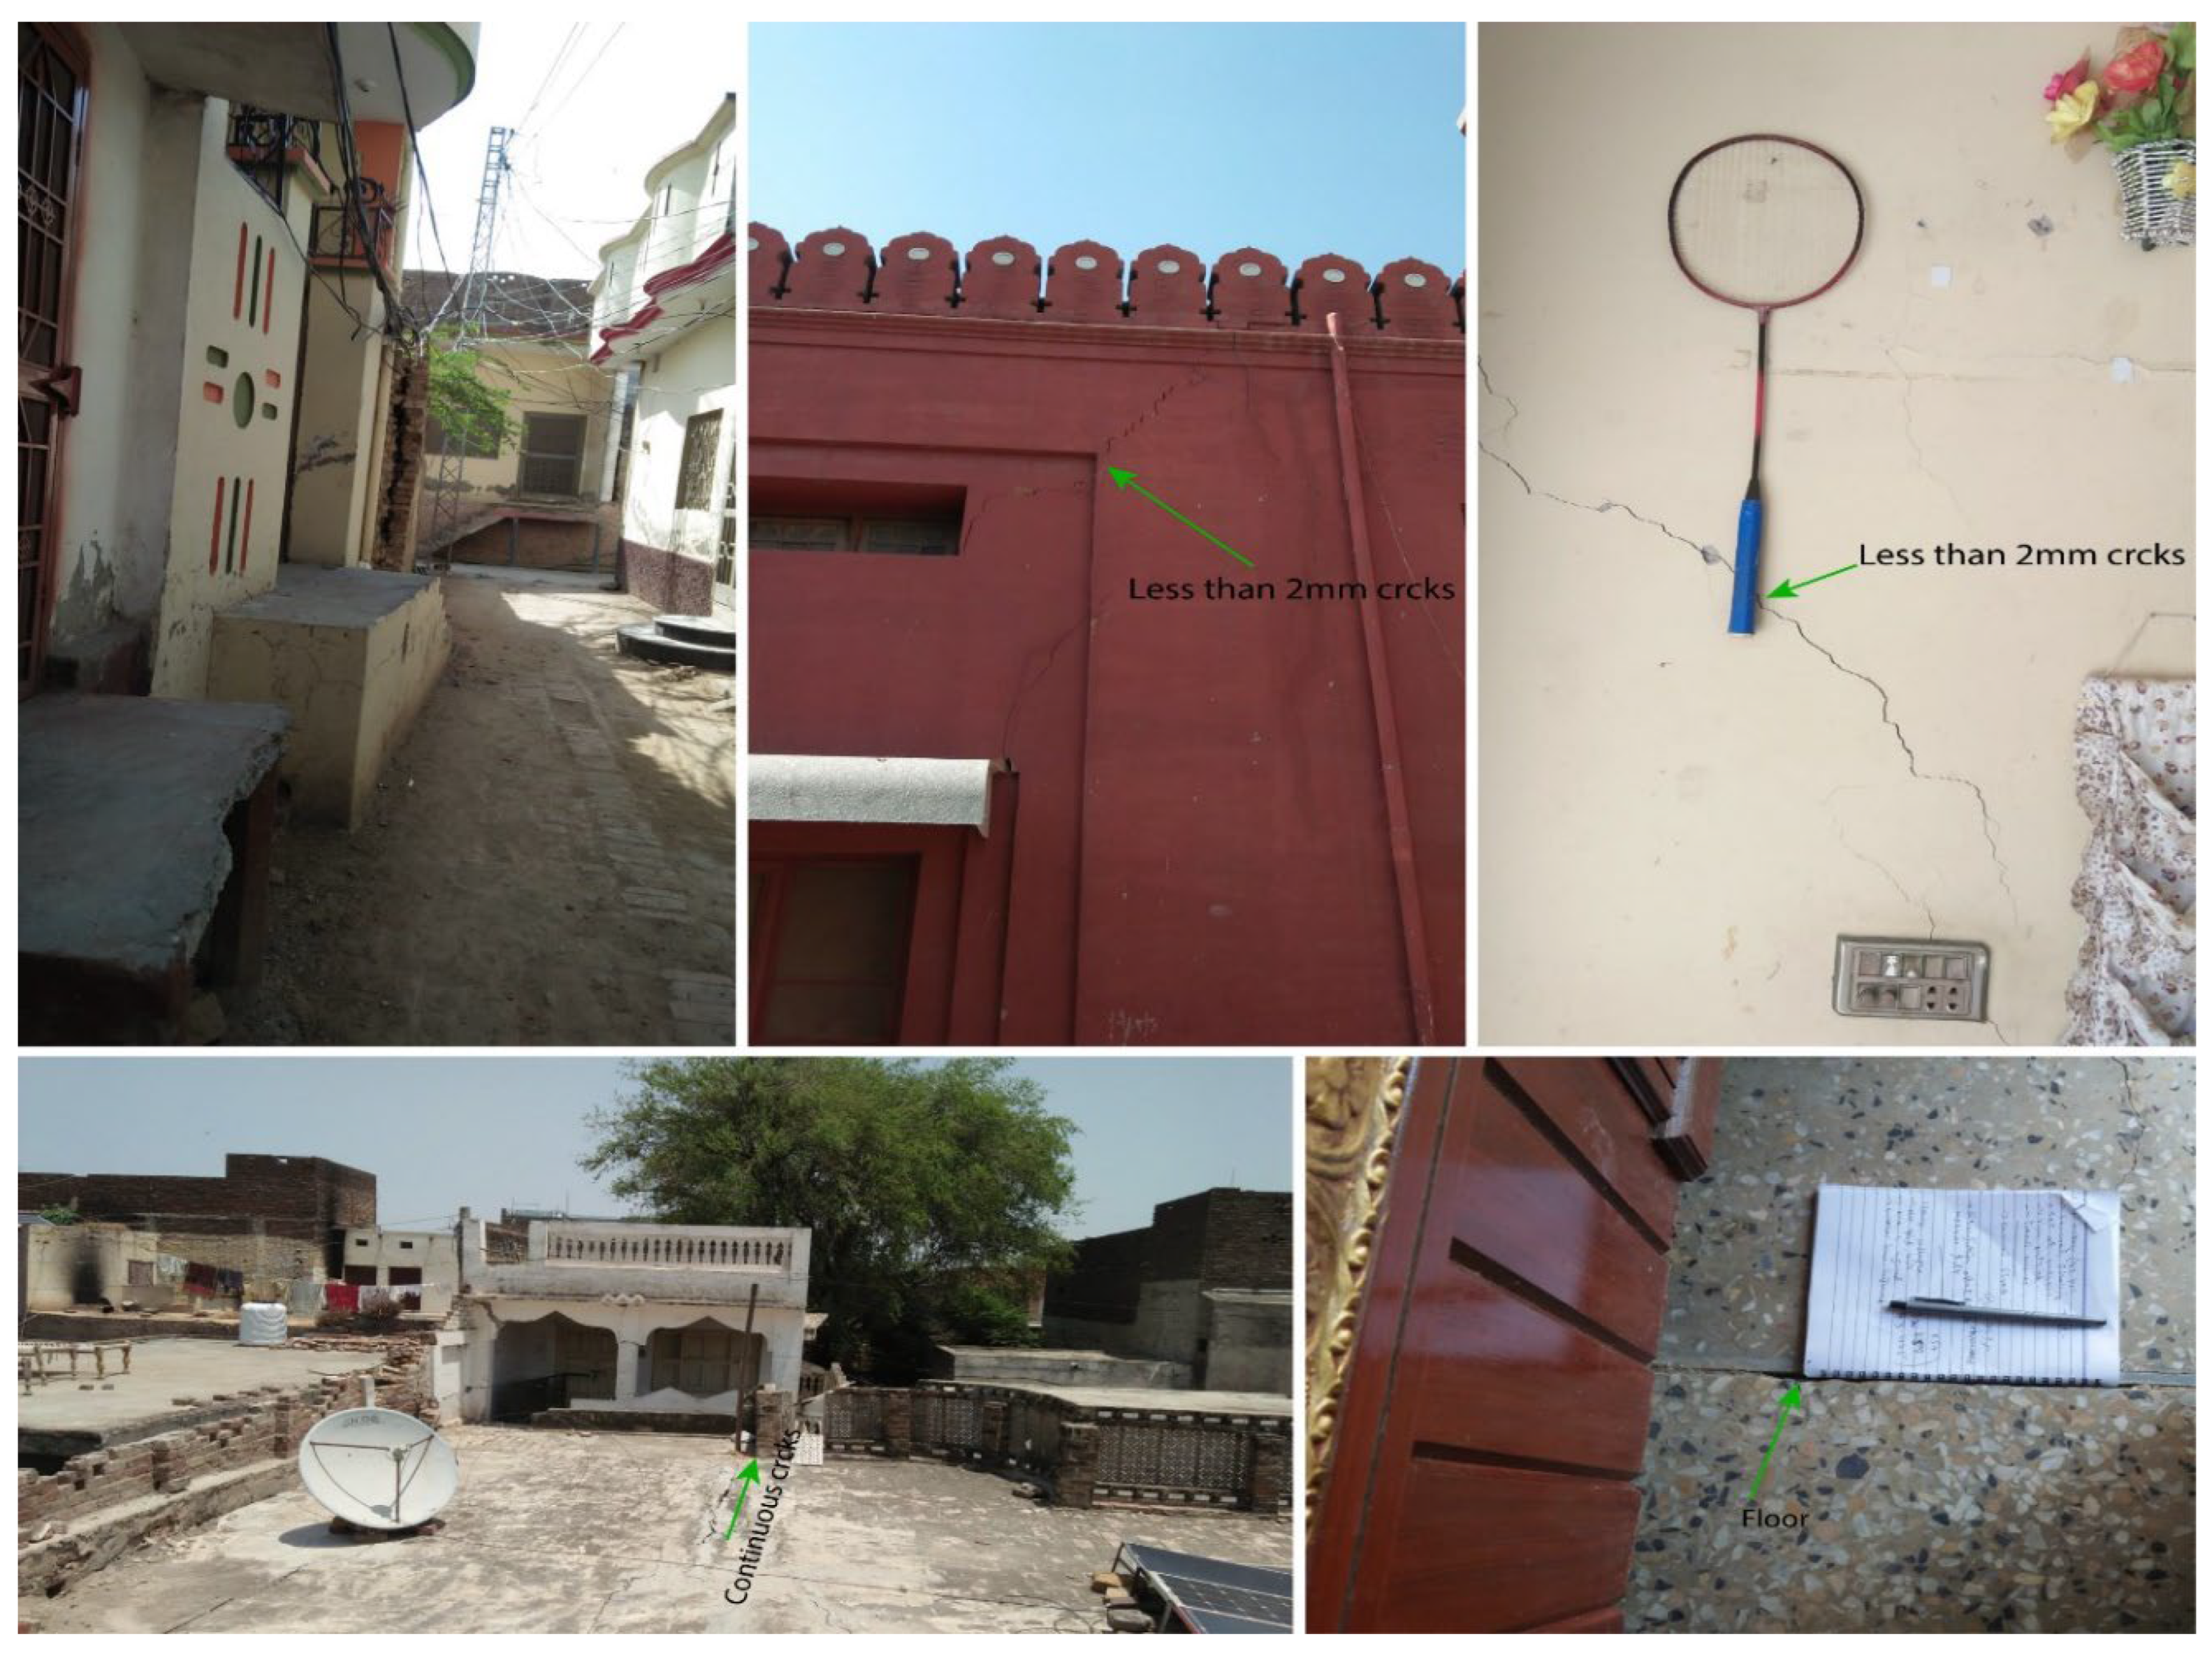
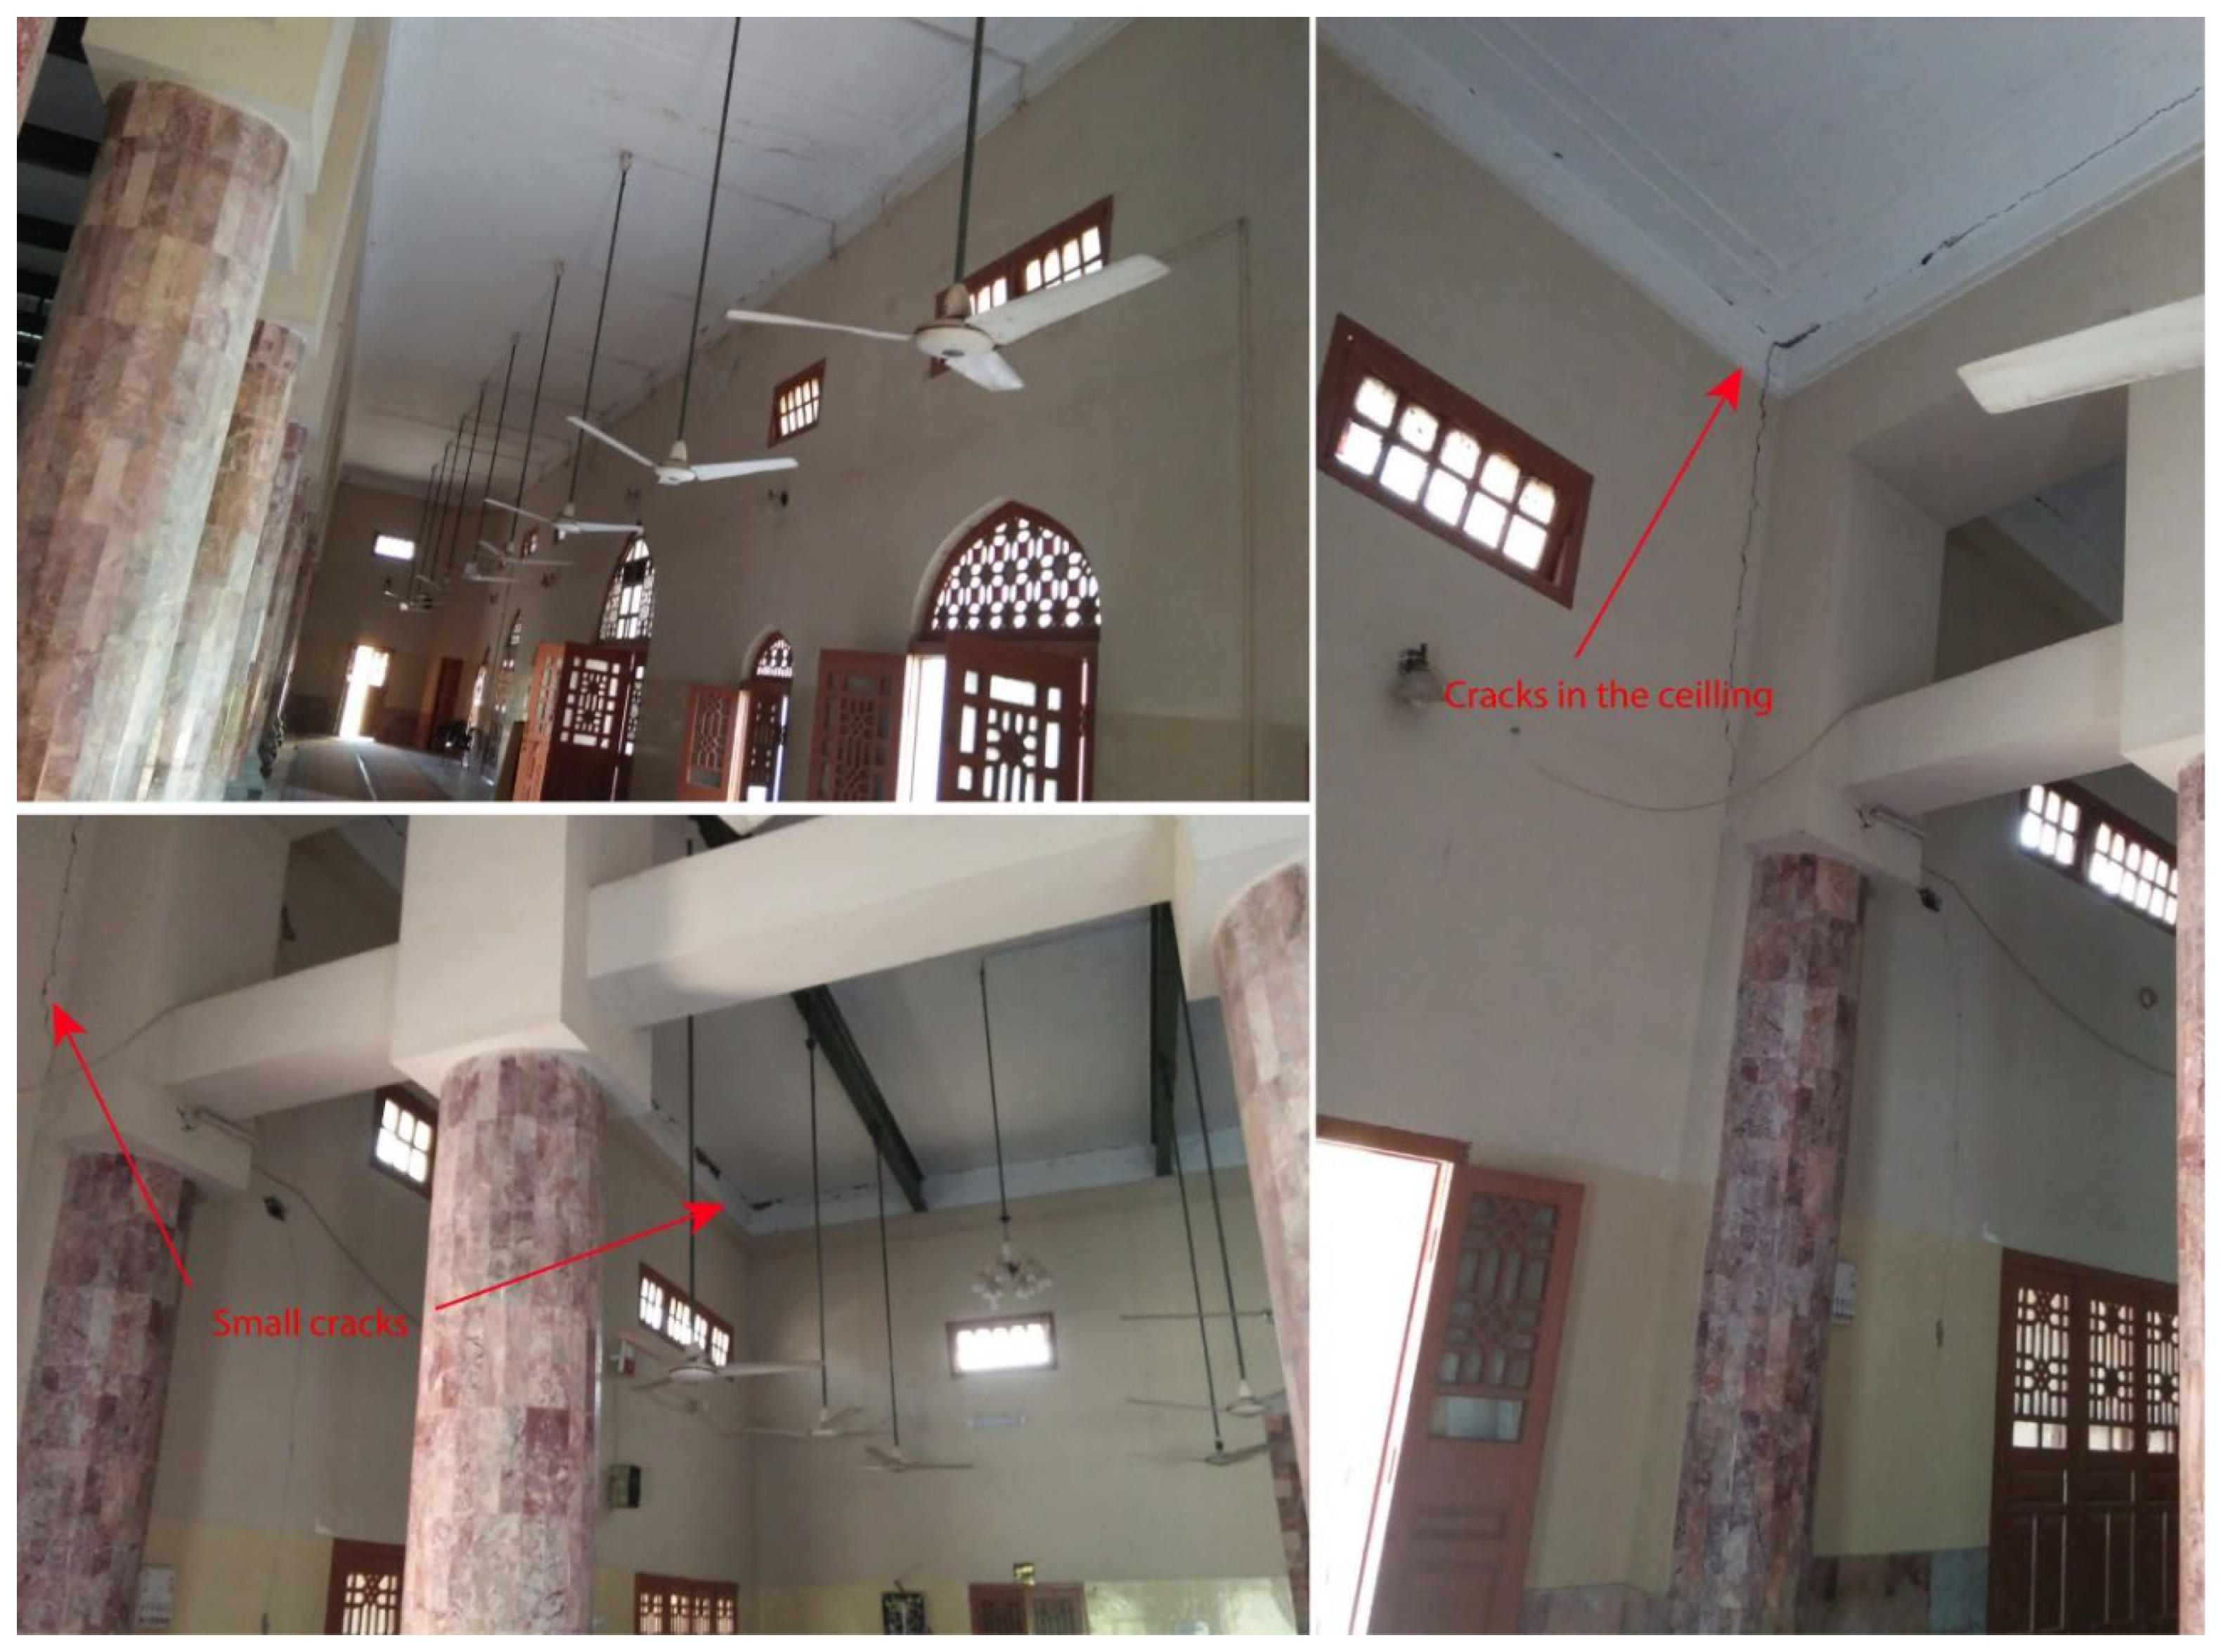
Photo 7.
Snaps of the houses in the area of maximum intensity near the road to Chamkon Valley. Tilting of electric pole can be observed; direction is northward.
Photo 7.
Snaps of the houses in the area of maximum intensity near the road to Chamkon Valley. Tilting of electric pole can be observed; direction is northward.
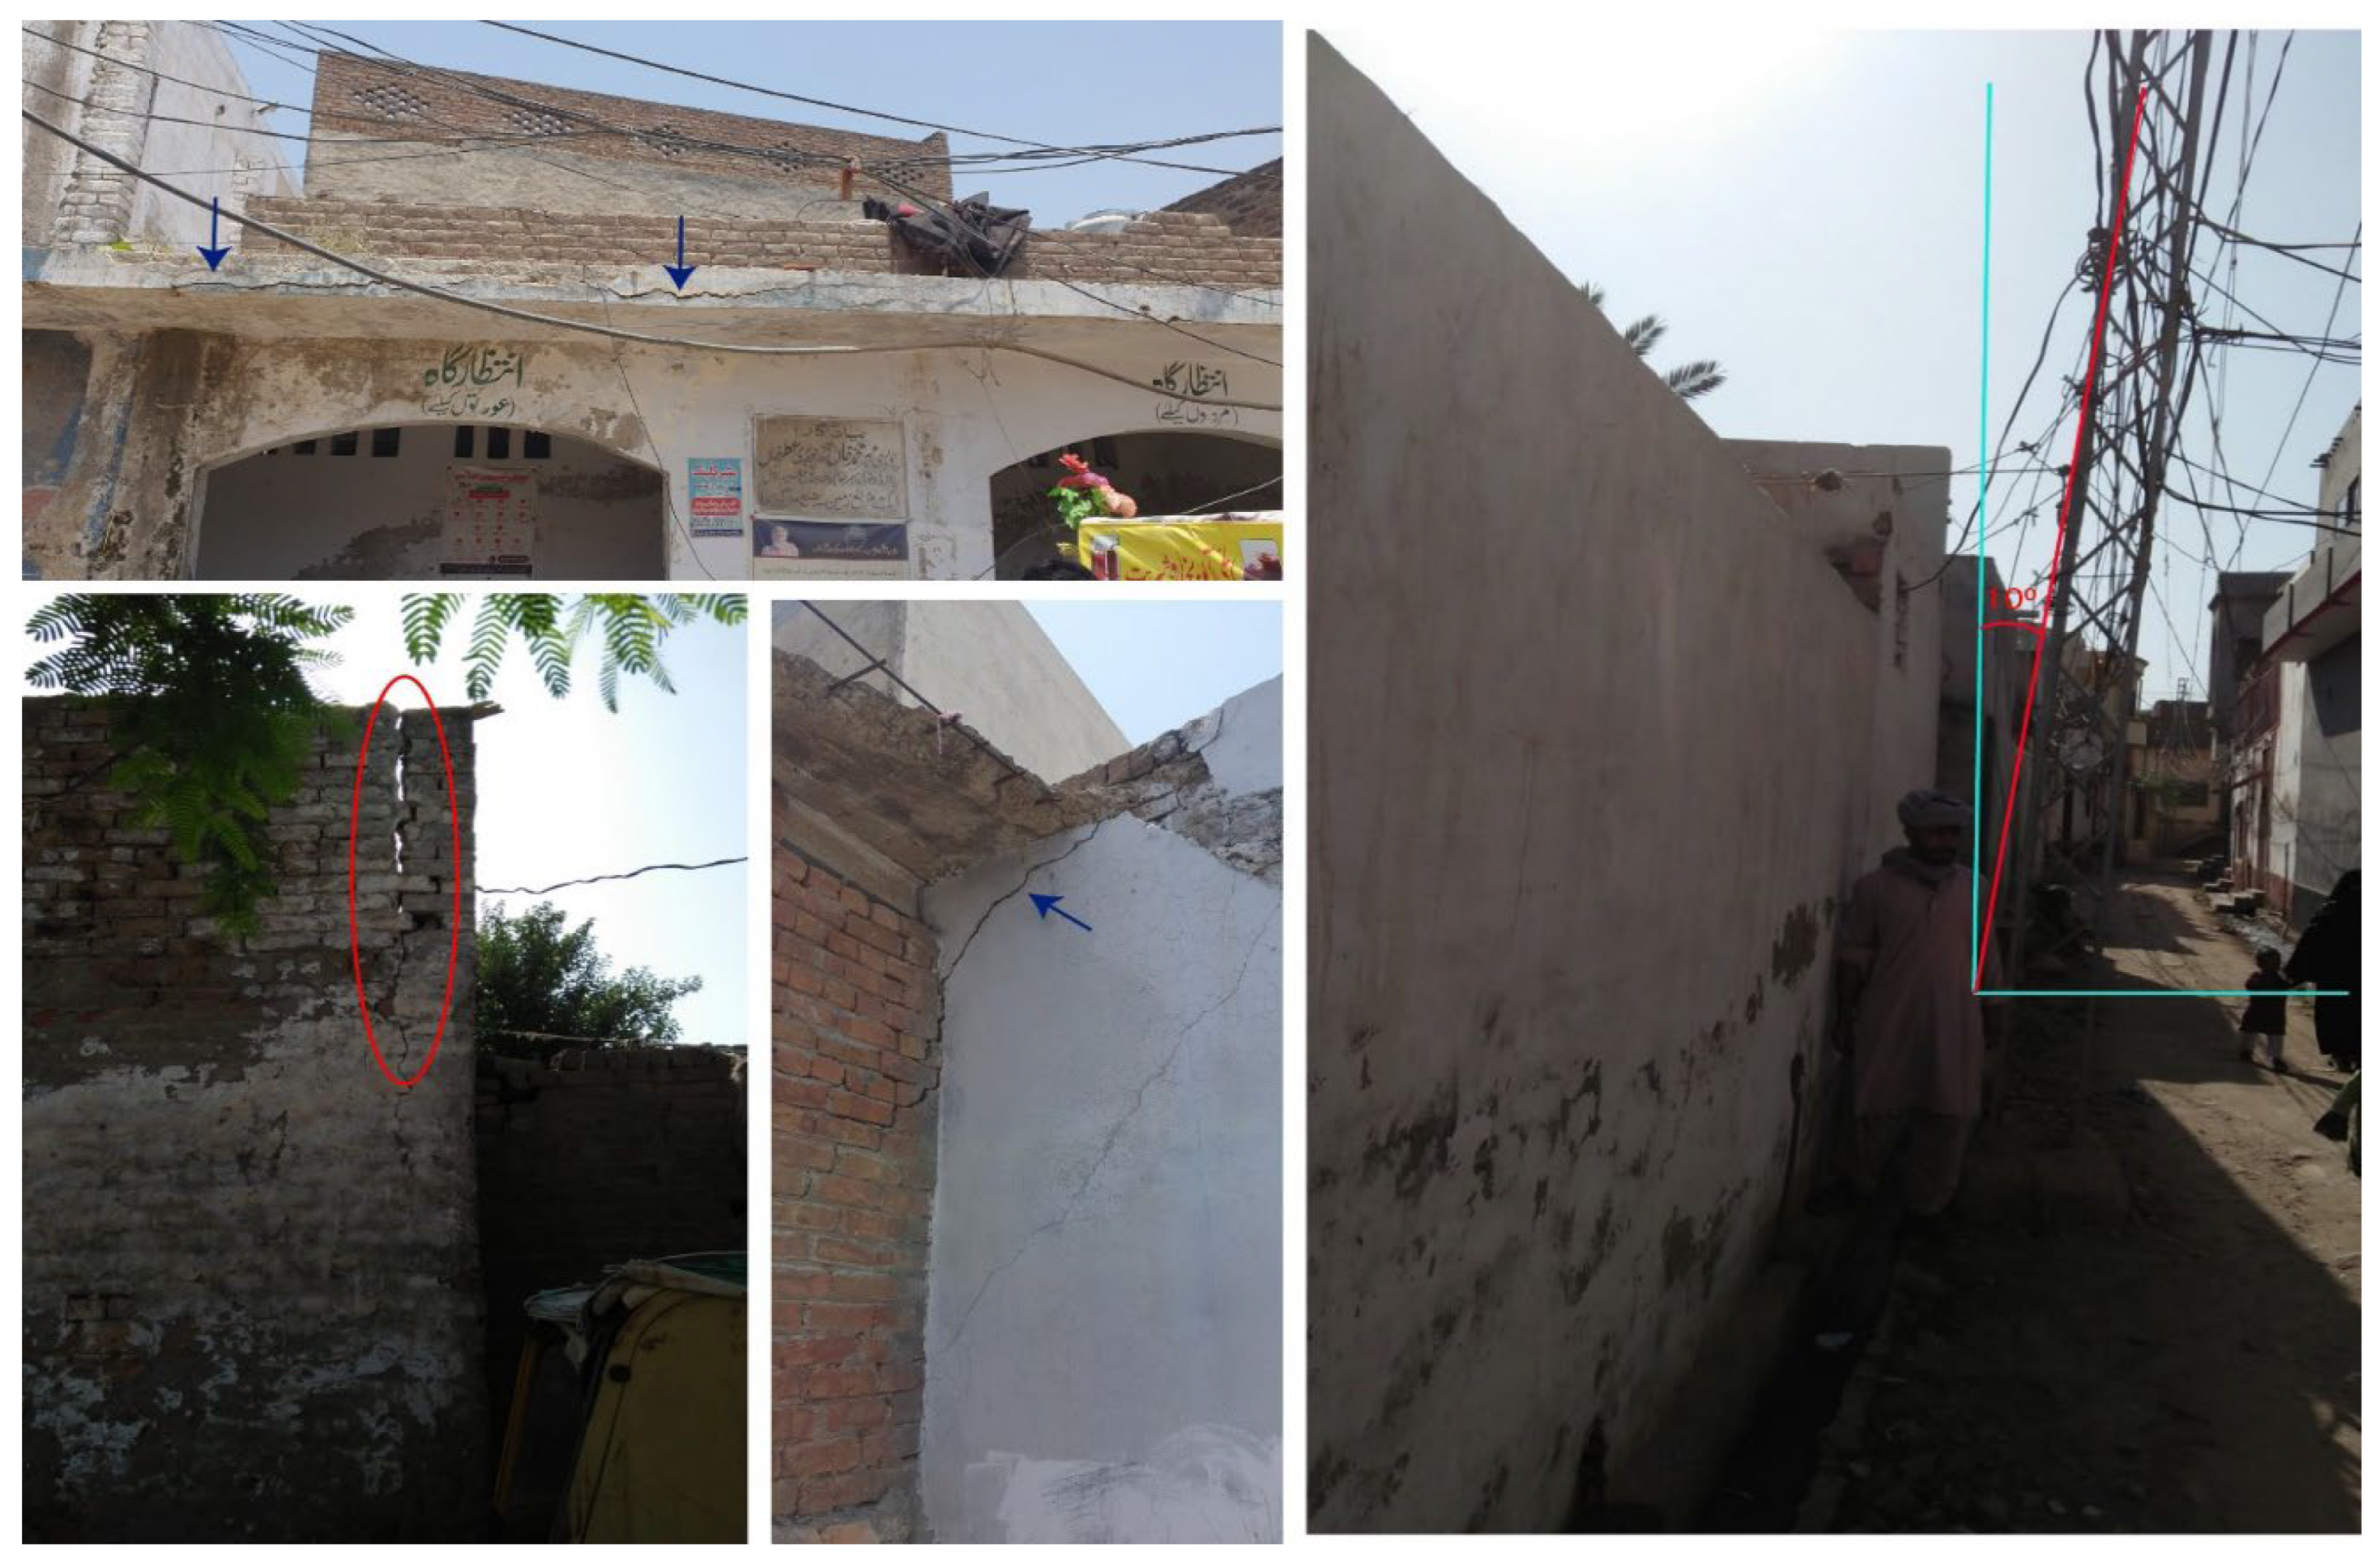
Photo 8.
Earthquake Environmental Effects: Snap of large Rock-fall site near the fence of strategic site code named Climax Mining Company (CMC) about two kilometers away from Jalalpur Sharif on the road in Chamkon Valley.
Photo 8.
Earthquake Environmental Effects: Snap of large Rock-fall site near the fence of strategic site code named Climax Mining Company (CMC) about two kilometers away from Jalalpur Sharif on the road in Chamkon Valley.
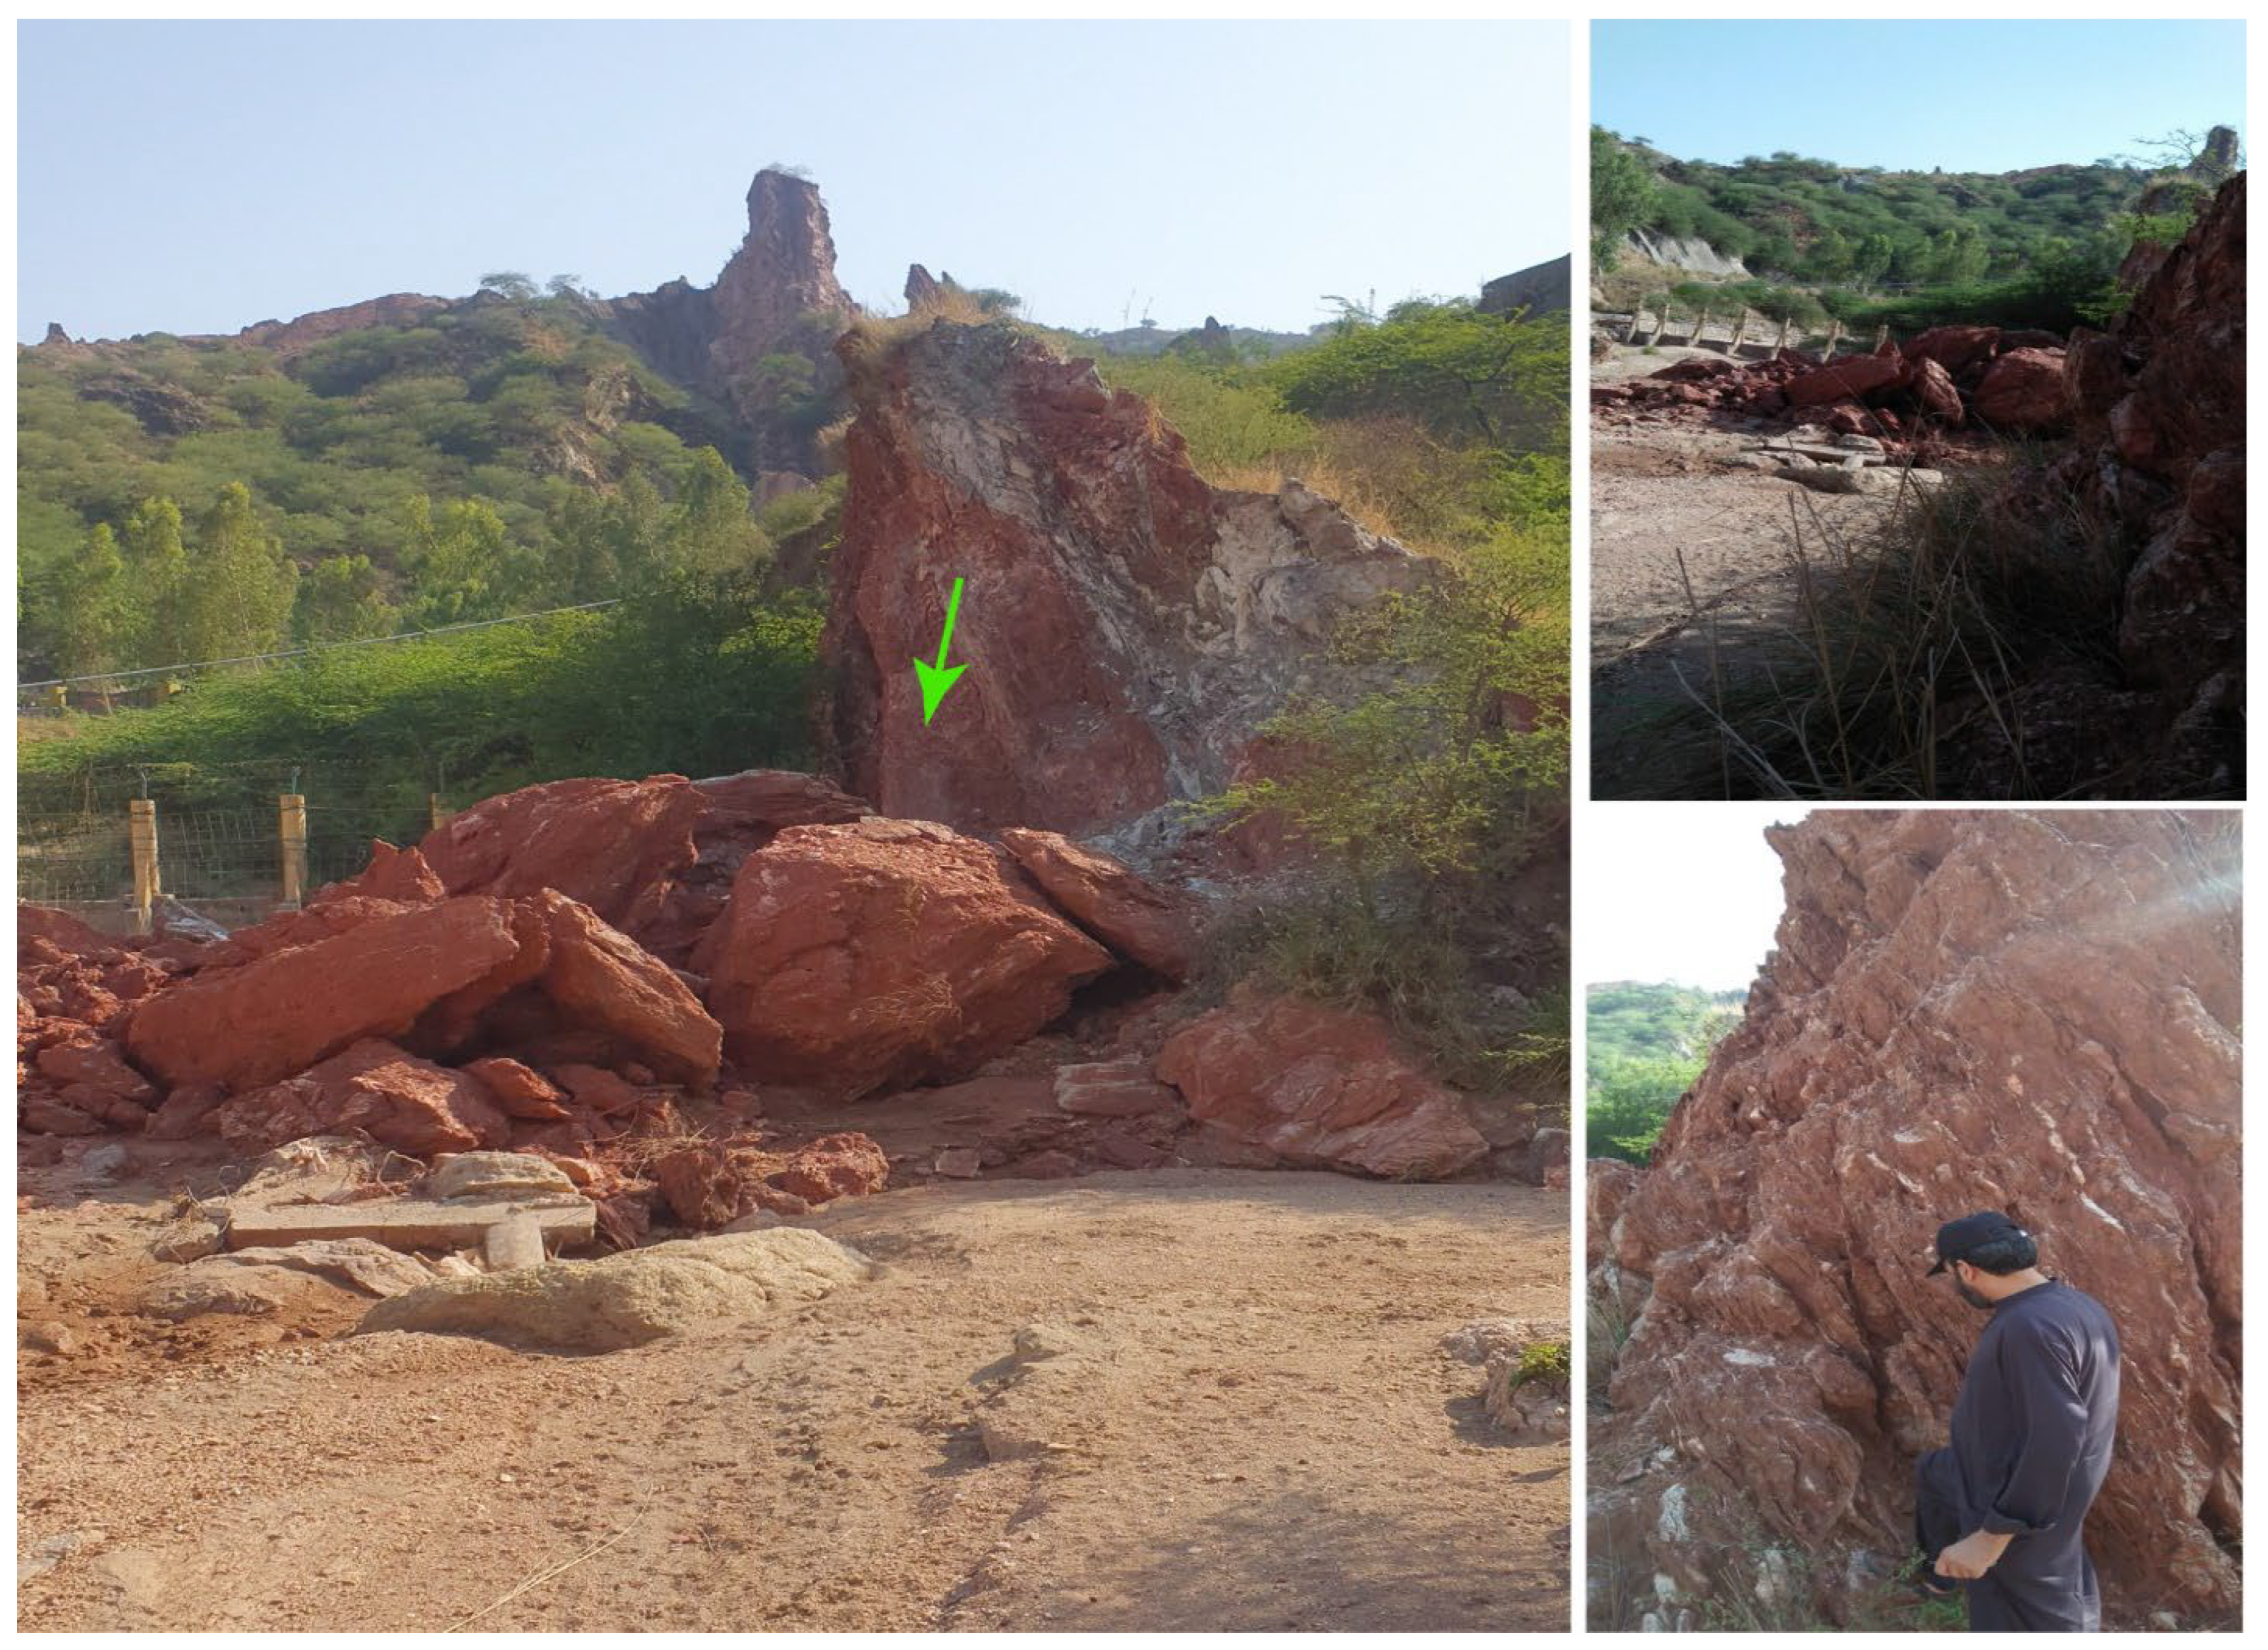
Photo 9.
Snaps of Rock-fall / Landslide sites along the road in Chamkon Valley about two to three kilometers north of Jalalpur Sharif.
Photo 9.
Snaps of Rock-fall / Landslide sites along the road in Chamkon Valley about two to three kilometers north of Jalalpur Sharif.
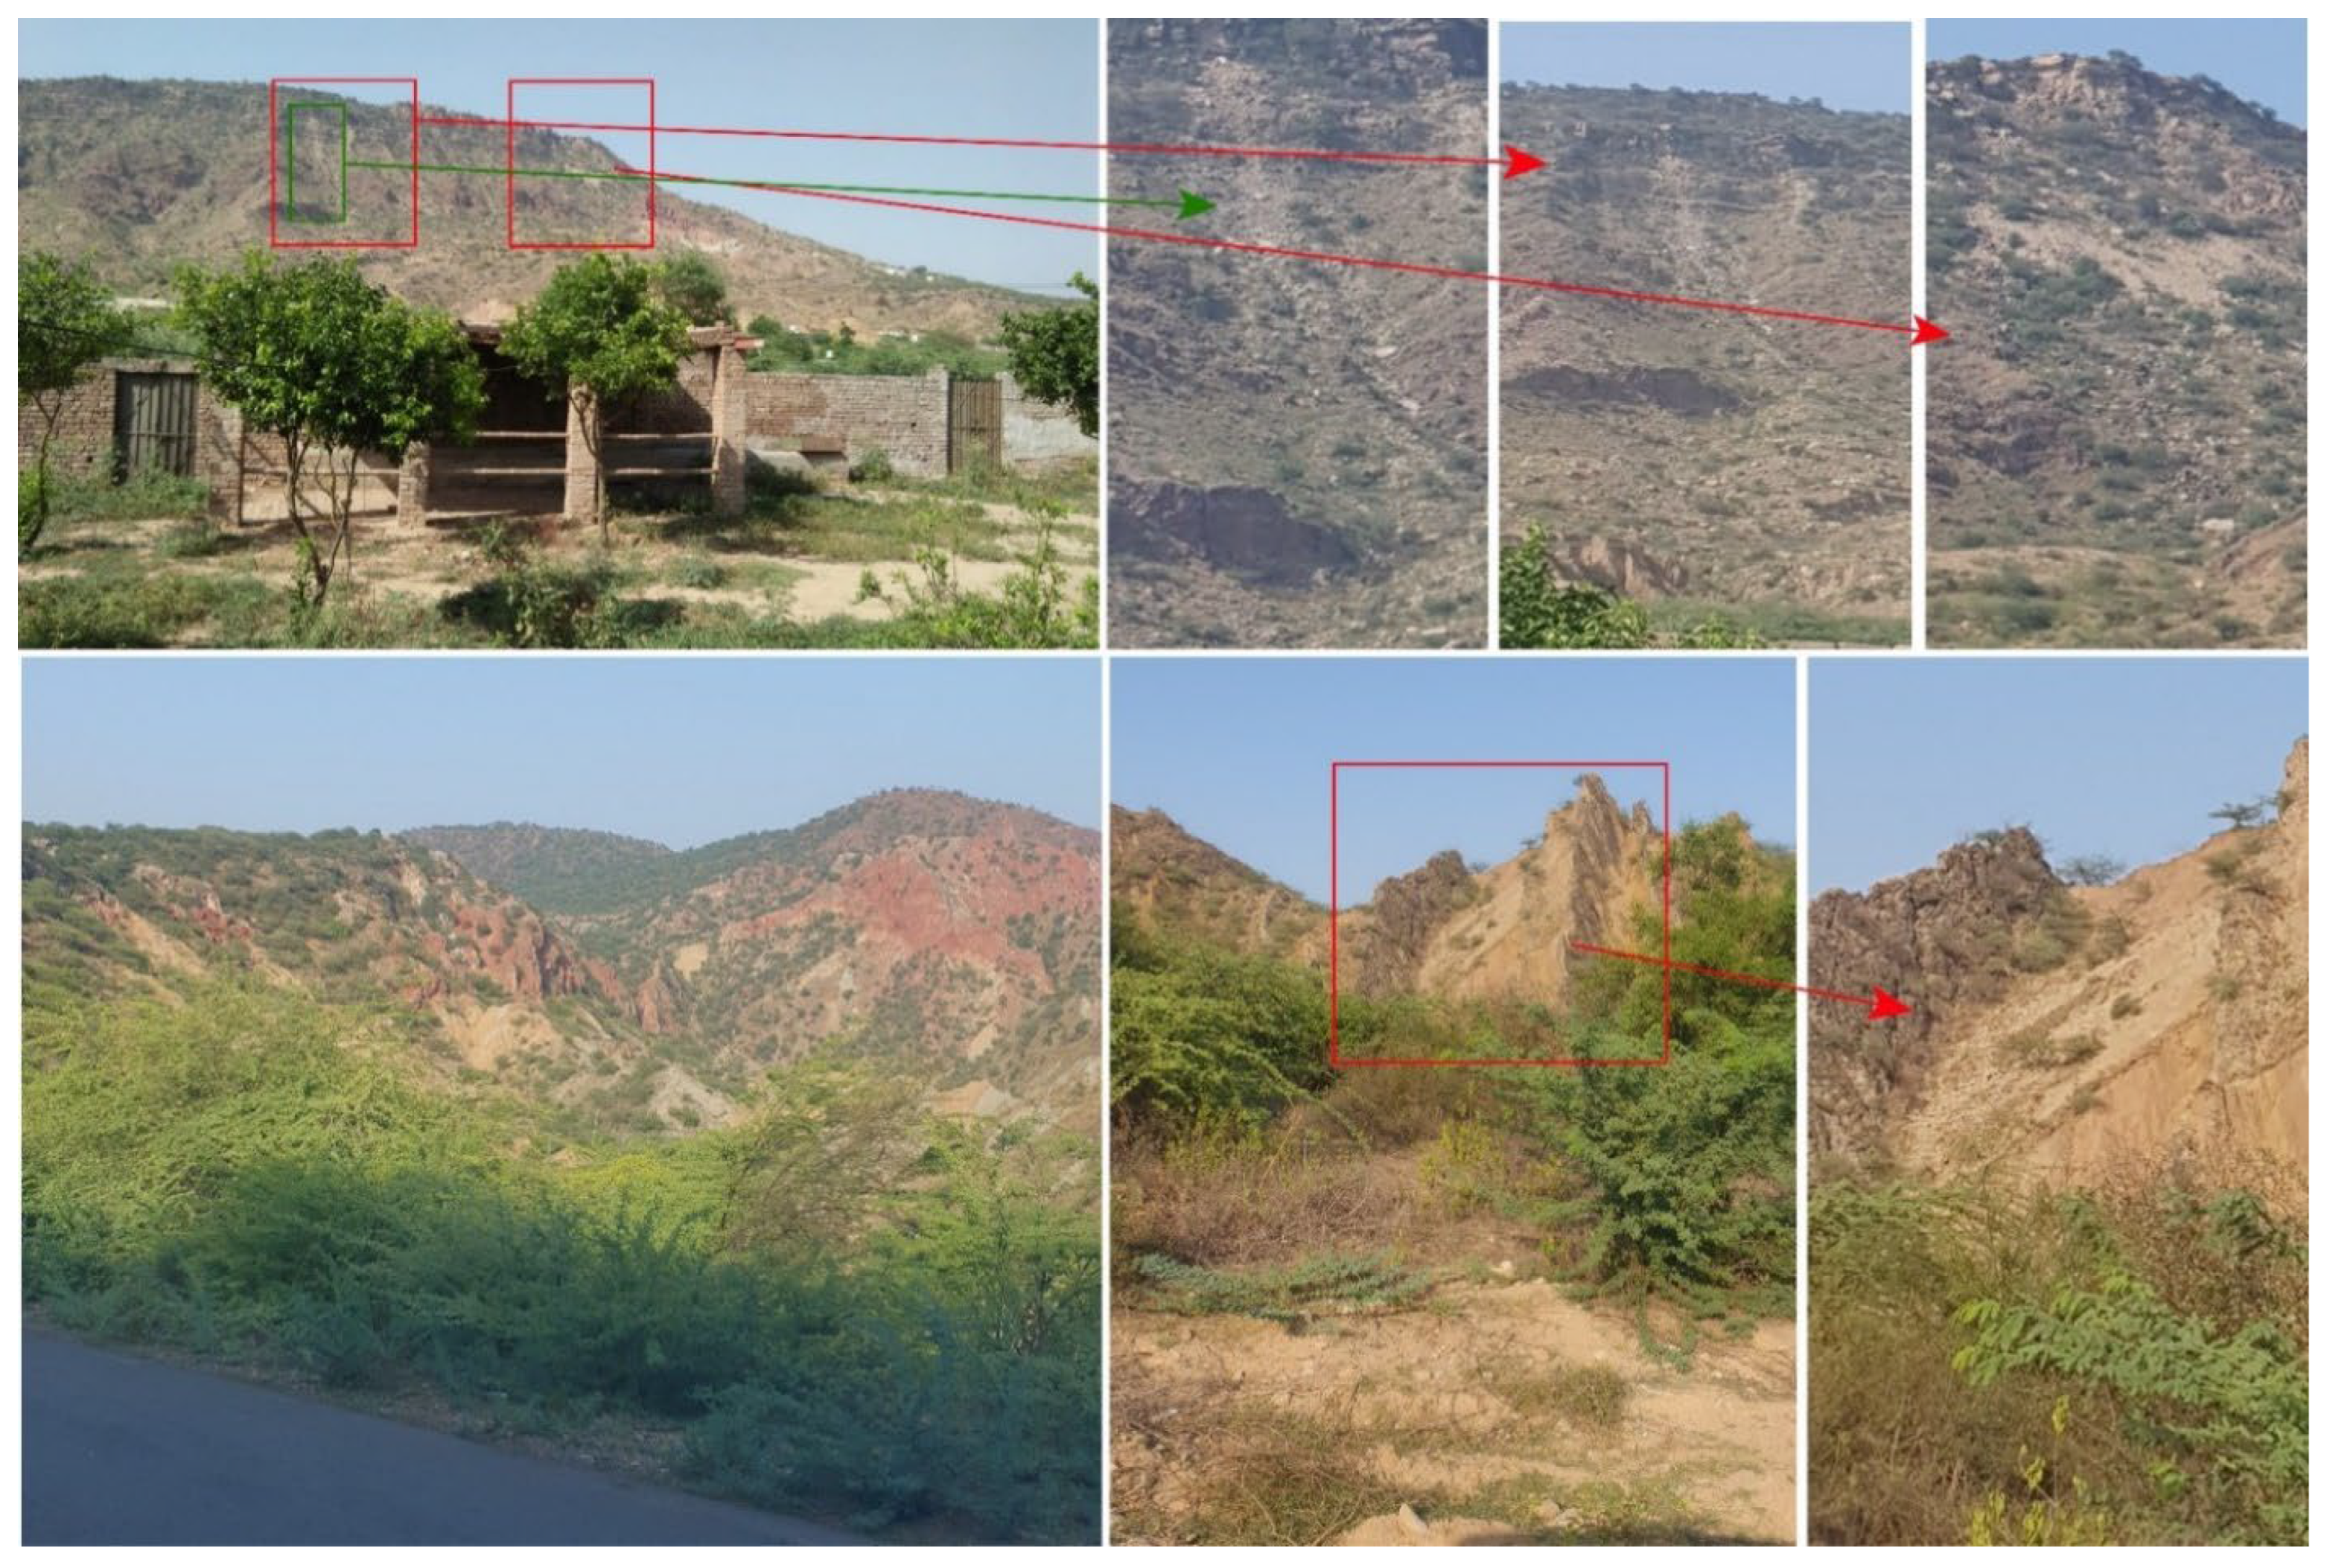
Photo 10.
Liquefaction / Site Amplification: Open cracks in the stone masonry pier / abutment wall of road bridge 12 km away from epicenter. The bridge is on a rainwater nala with sandy floodplain bed. Fall of stone masonry wall seemingly owes to poor / old construction and tilting of individual footing foundation. In the background, newly constructed RCC bridge on raft foundation bears no damage.
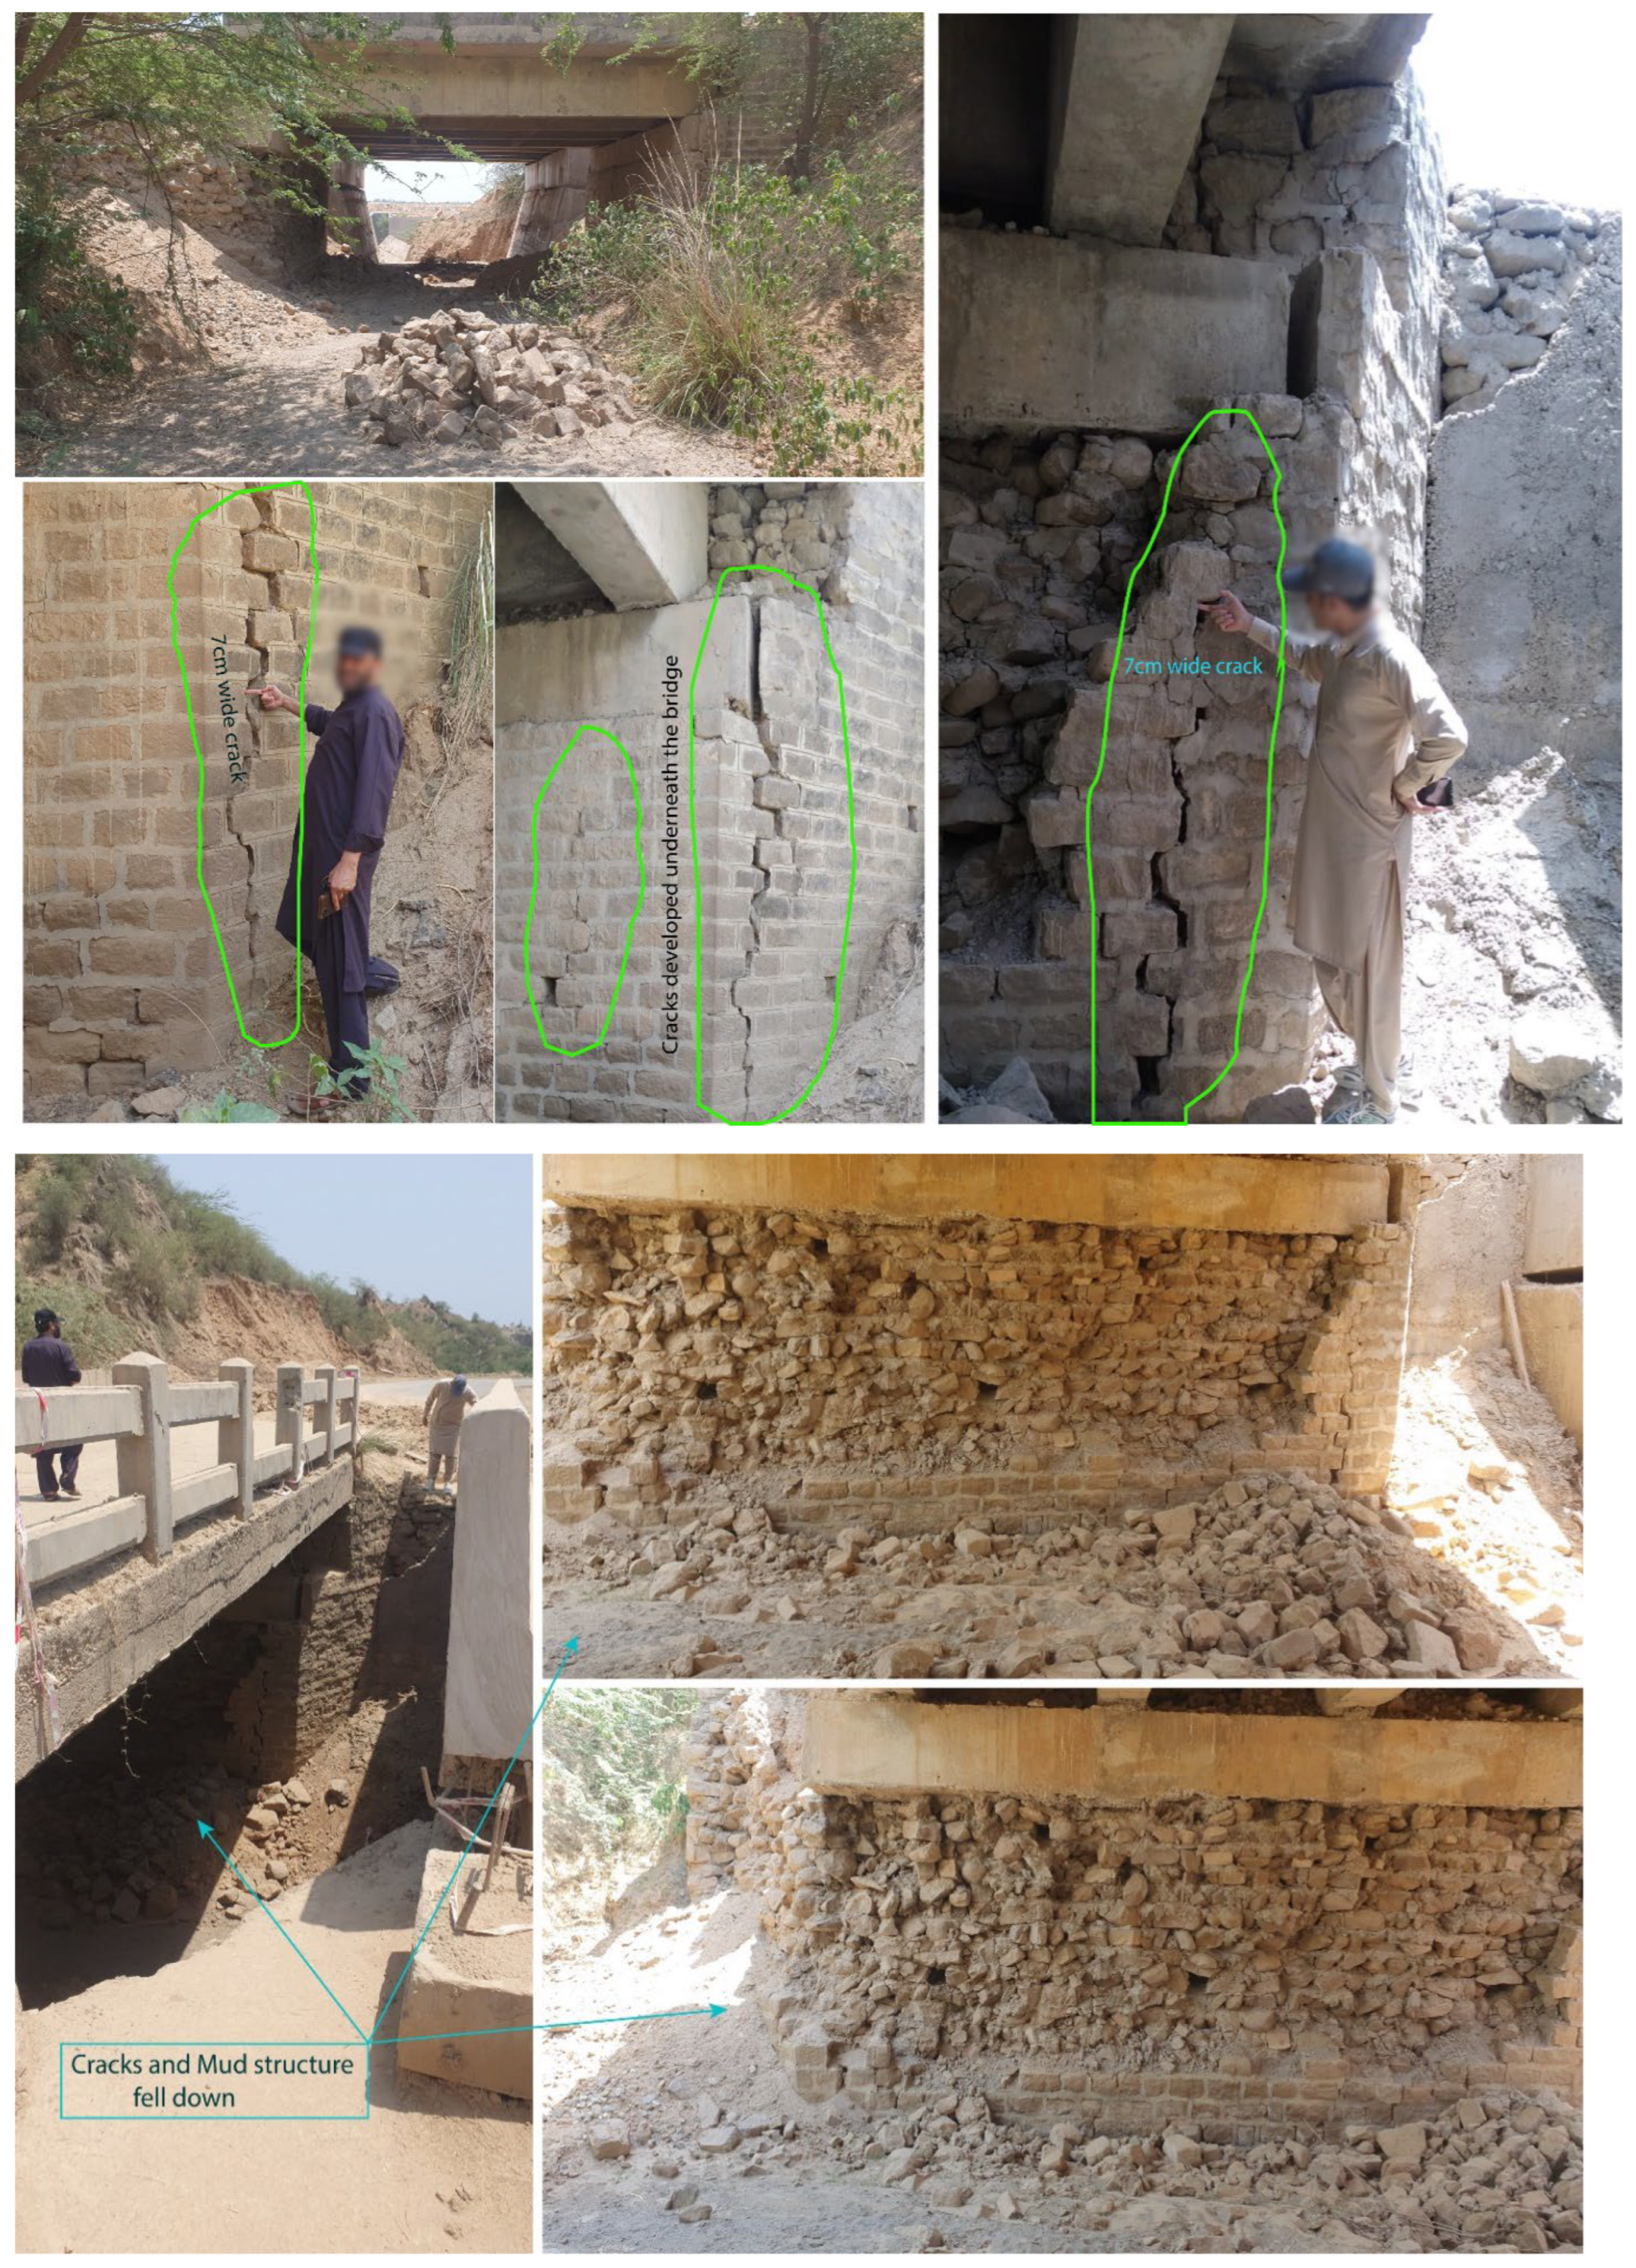
Photo 11.
Cracks with aperture of 14 cm (about six inches) in the wall of a mosque 12 km away from epicenter. The mosque is situated at the bank of a rainwater nala with sandy floodplain bed. Western block tilted represented by widening of crack from bottom to top.
Photo 11.
Cracks with aperture of 14 cm (about six inches) in the wall of a mosque 12 km away from epicenter. The mosque is situated at the bank of a rainwater nala with sandy floodplain bed. Western block tilted represented by widening of crack from bottom to top.
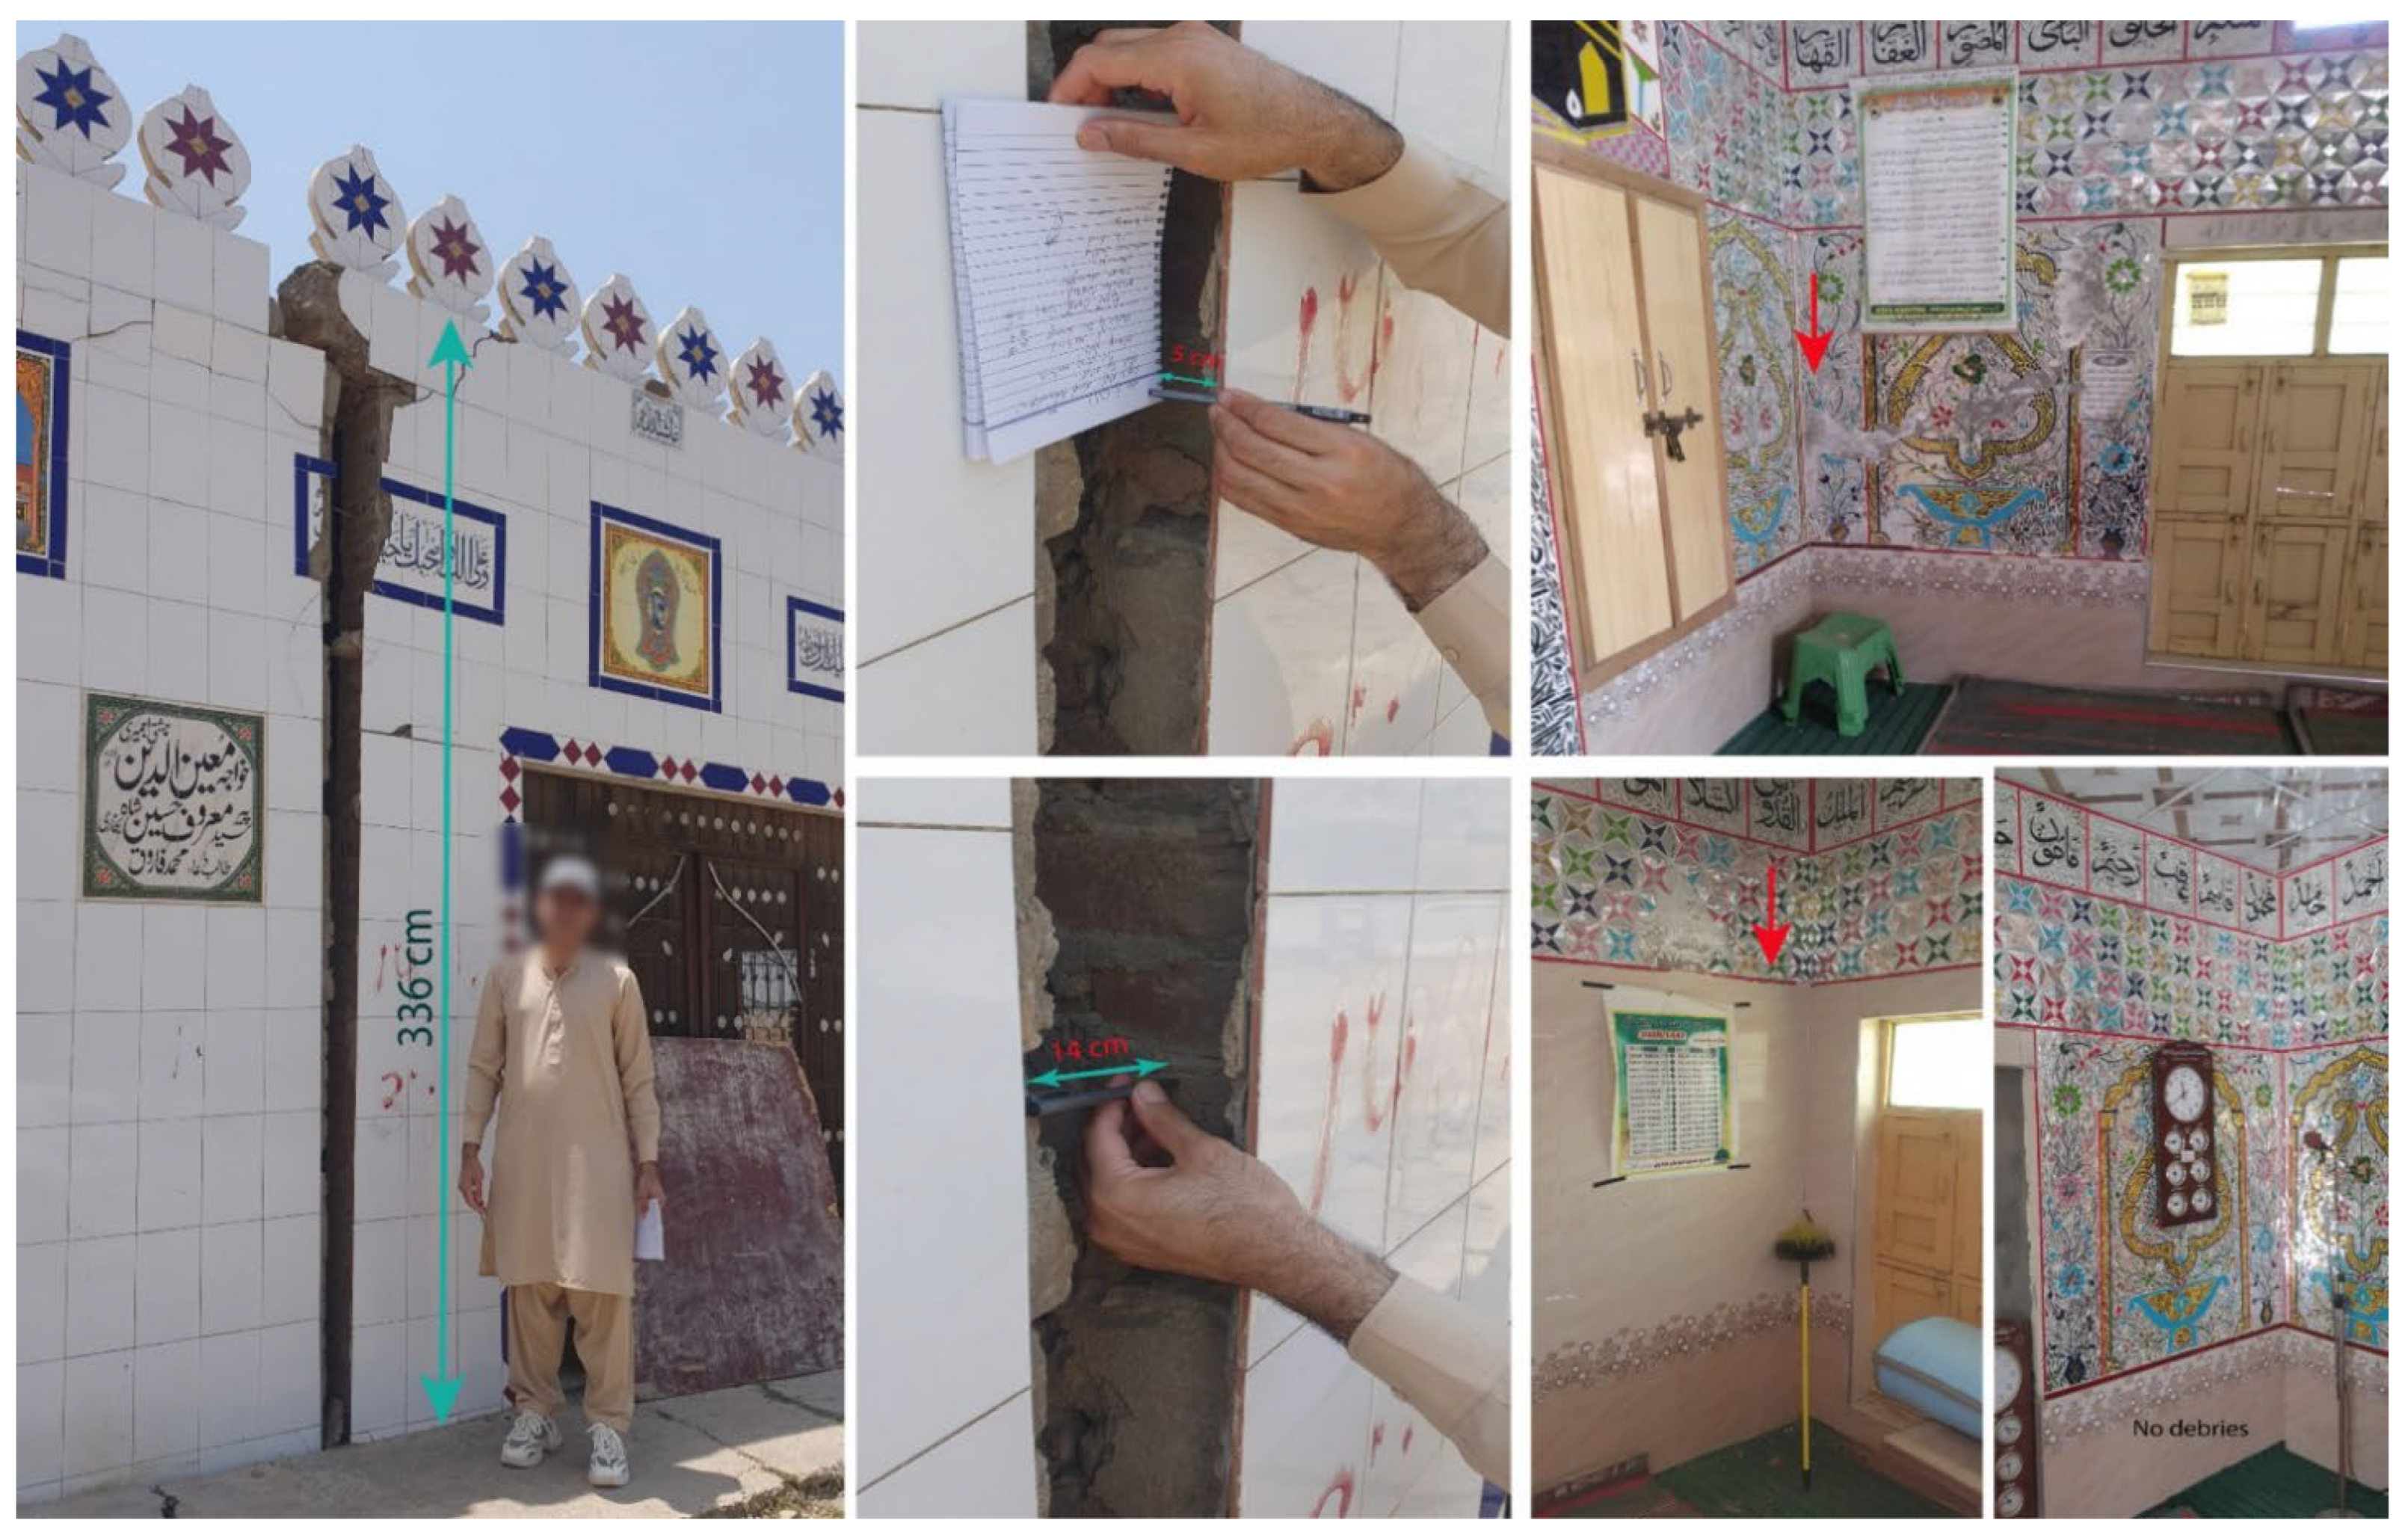
Photo 12.
Proper structures with poorly designed foundations were also damaged considerably away from the epicenter: Cracks in the roof slab and side walls at the first floor of Canal View Hotel, Jhelum-Pind Dadan Khan Road, about 13 km away from the epicenter.
Photo 12.
Proper structures with poorly designed foundations were also damaged considerably away from the epicenter: Cracks in the roof slab and side walls at the first floor of Canal View Hotel, Jhelum-Pind Dadan Khan Road, about 13 km away from the epicenter.
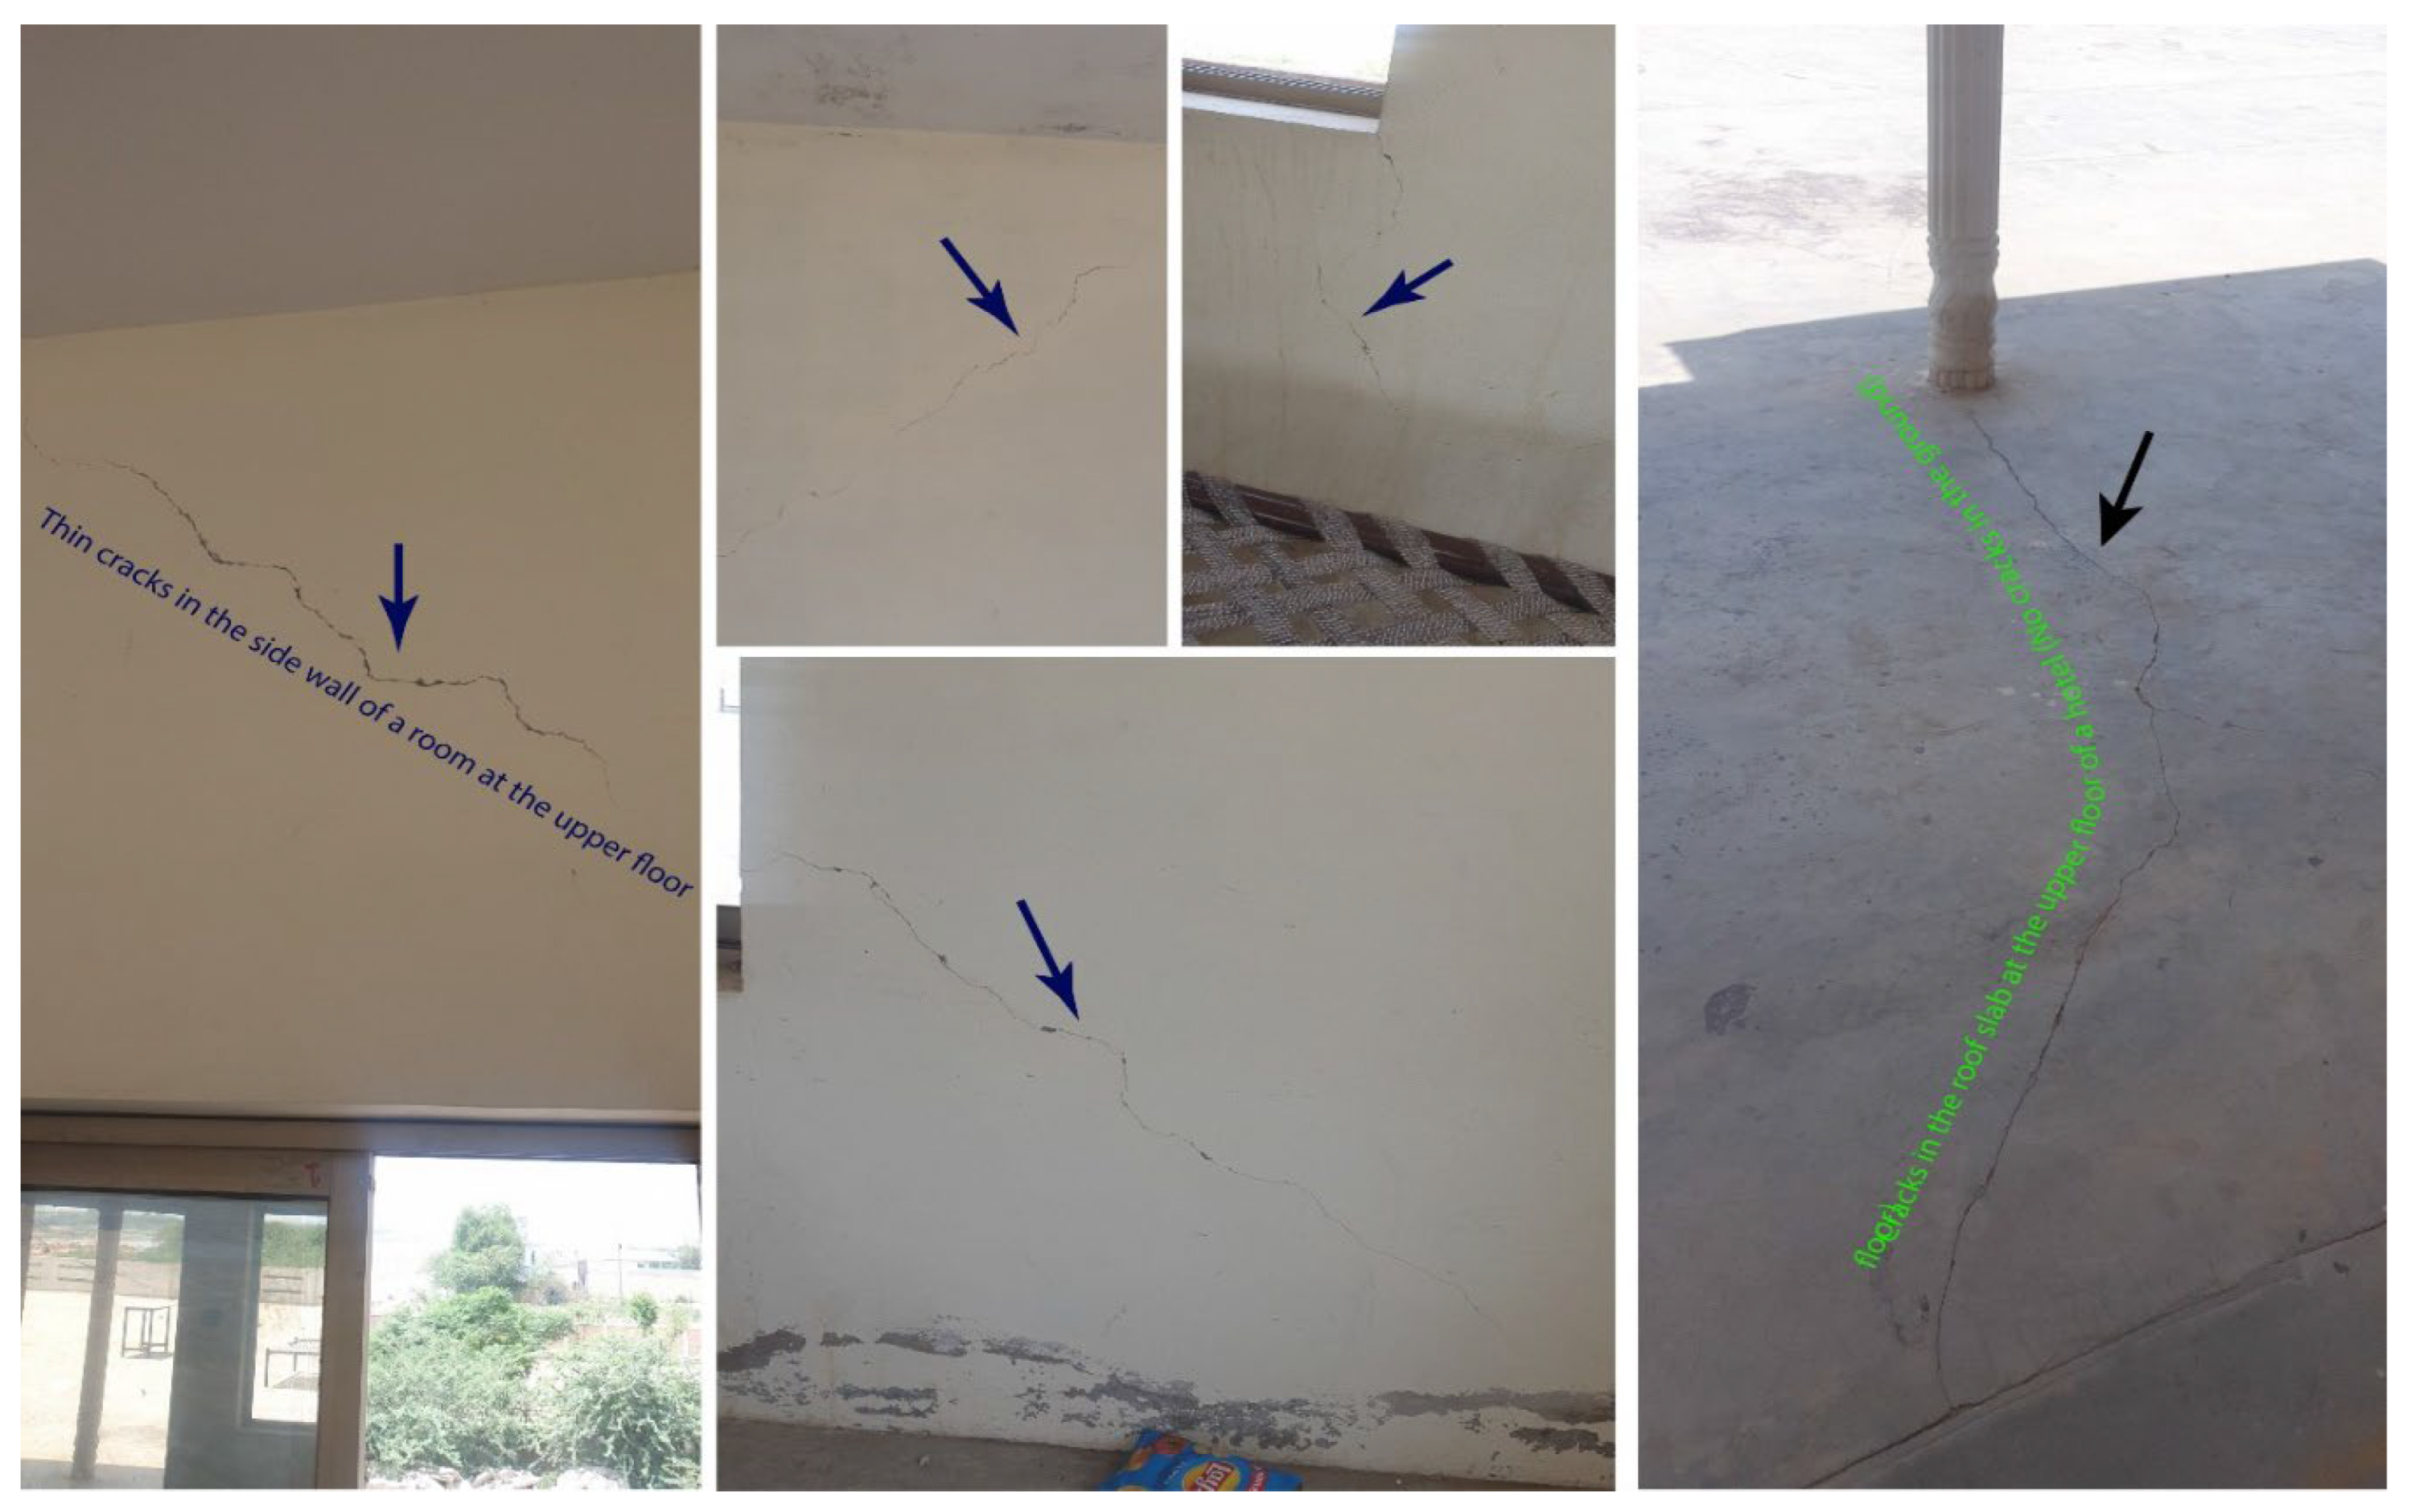
Photo 13.
Cracks in block masonry boundary wall and mud-mortar / brick masonry room wall about 15 km away from the epicenter.
Photo 13.
Cracks in block masonry boundary wall and mud-mortar / brick masonry room wall about 15 km away from the epicenter.
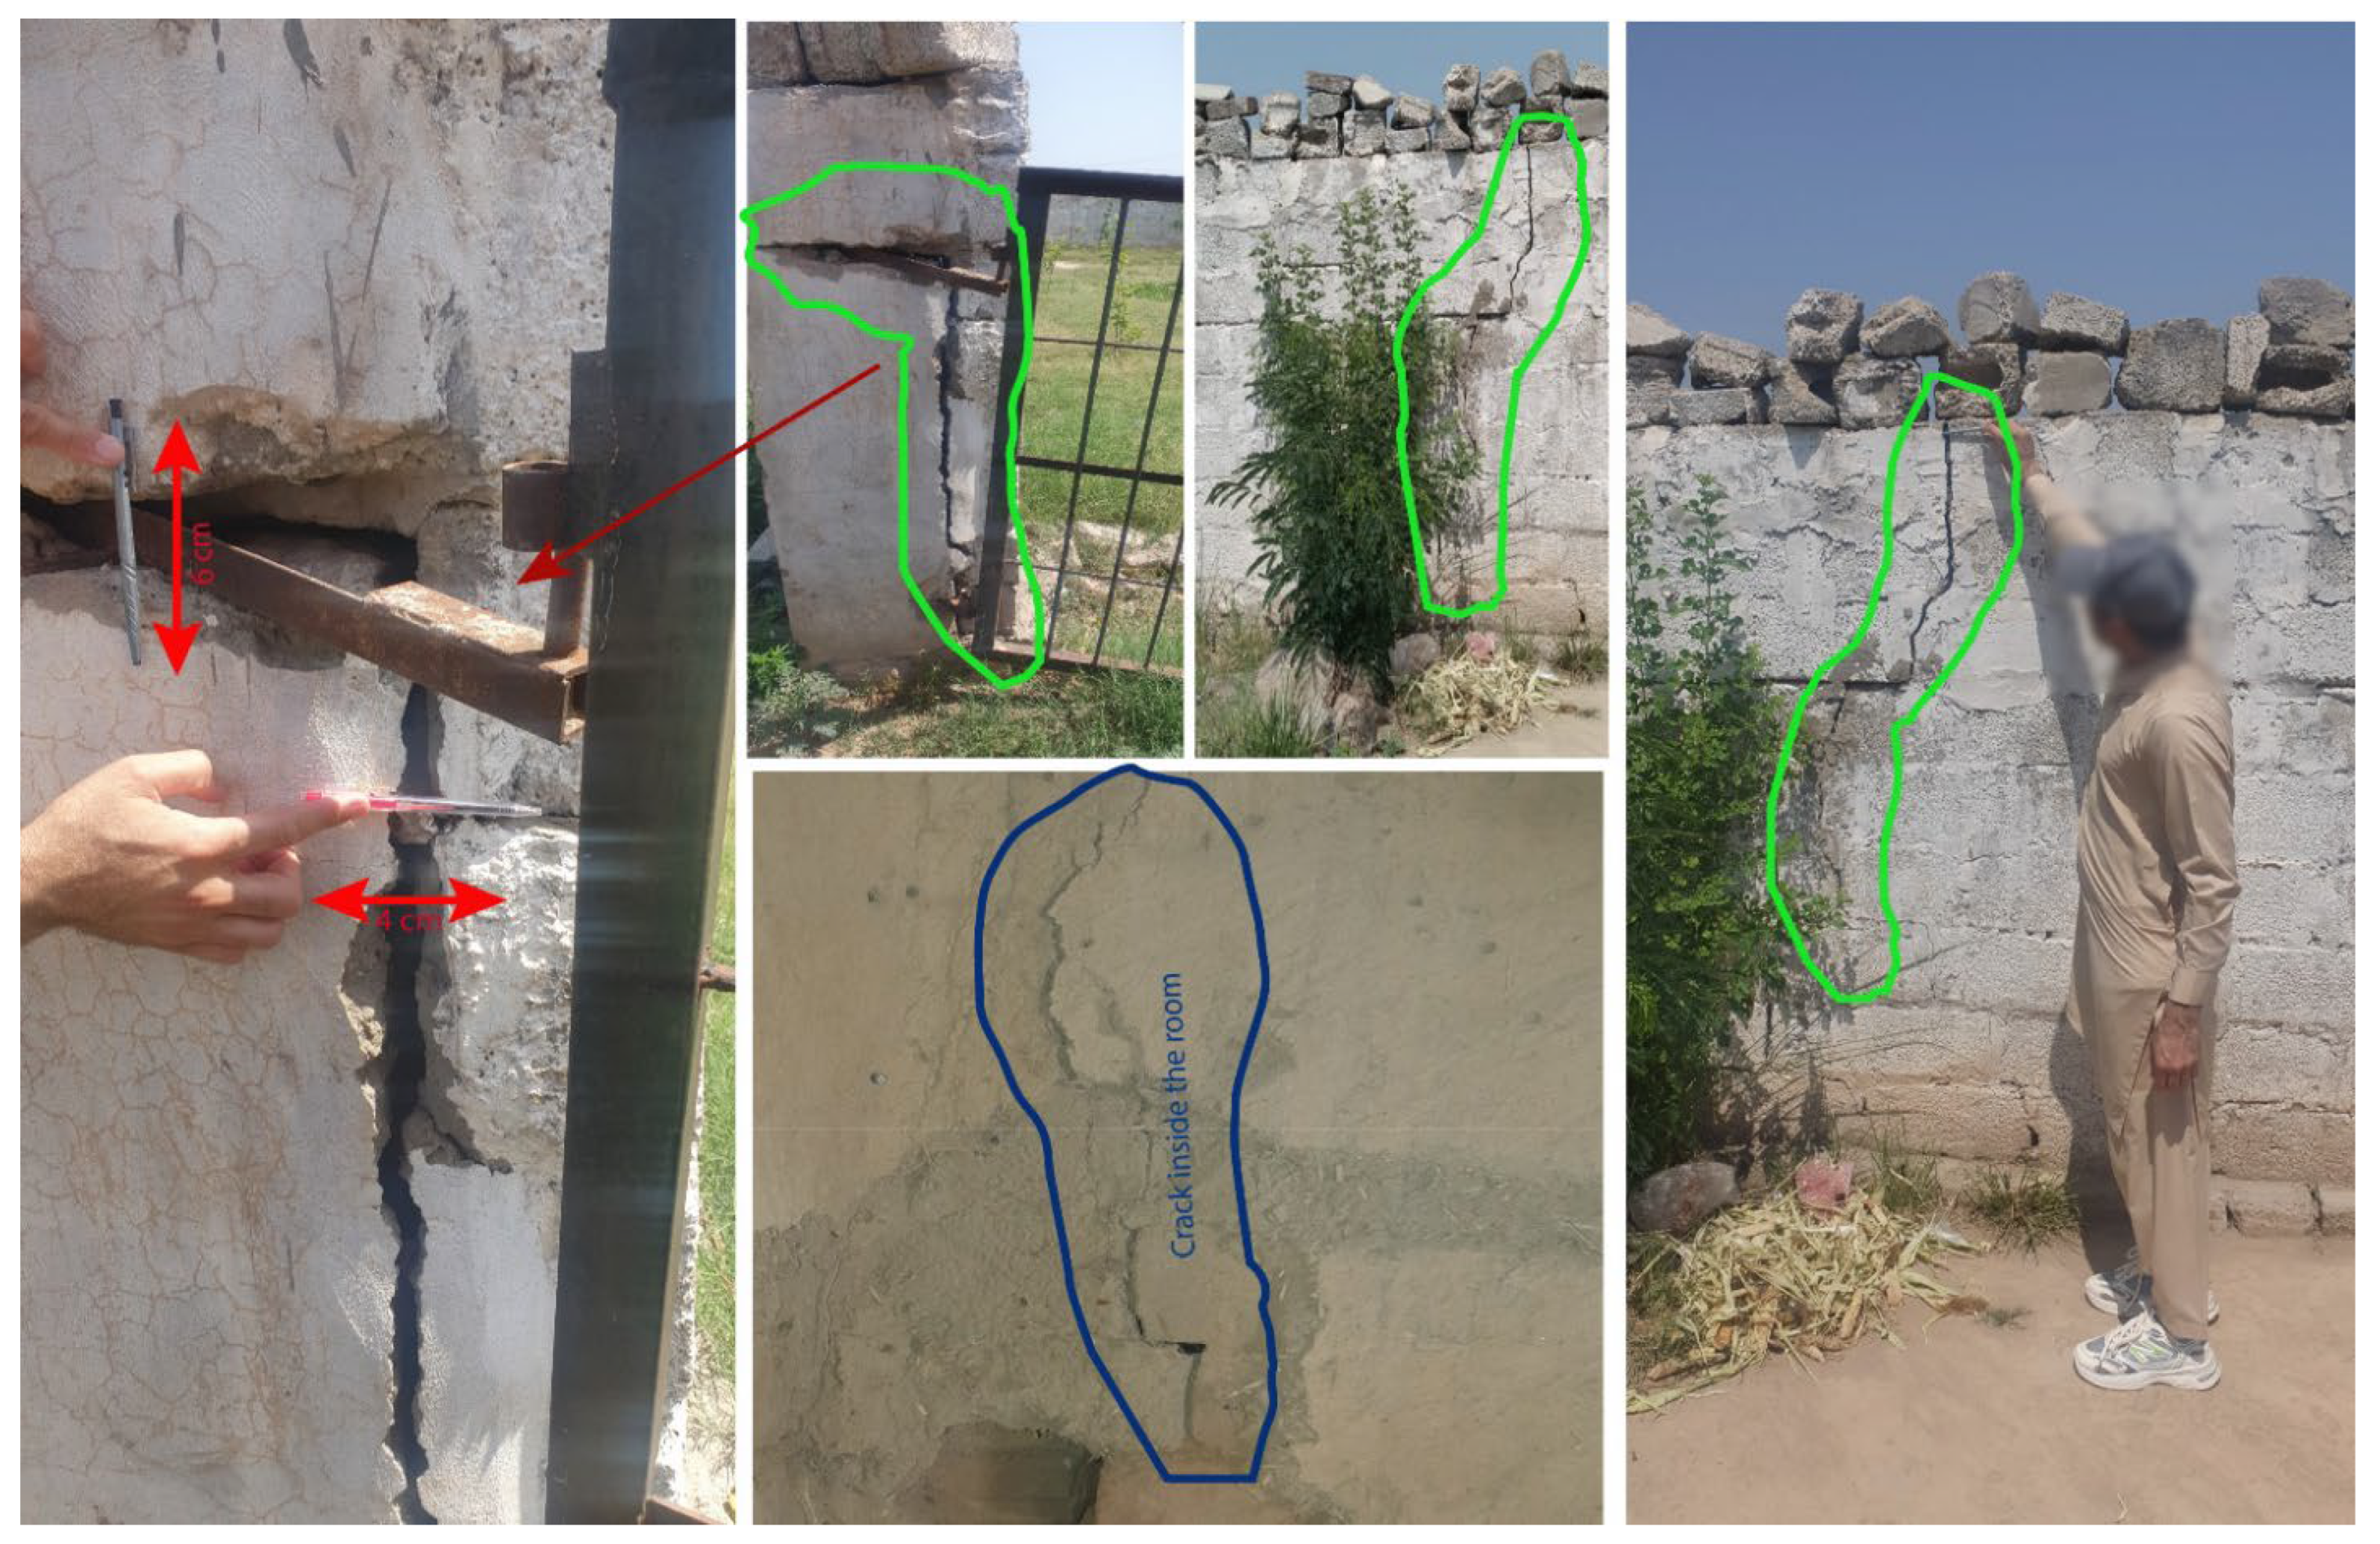
Photo 14.
No damaged in rocky / thin-sediment cover even poorly constructed structures: Snaps of block masonry boundary wall near Wagh Village, about six kilometers north of Jalalpur Sharif along the road in Chamkon Valley.
Photo 14.
No damaged in rocky / thin-sediment cover even poorly constructed structures: Snaps of block masonry boundary wall near Wagh Village, about six kilometers north of Jalalpur Sharif along the road in Chamkon Valley.
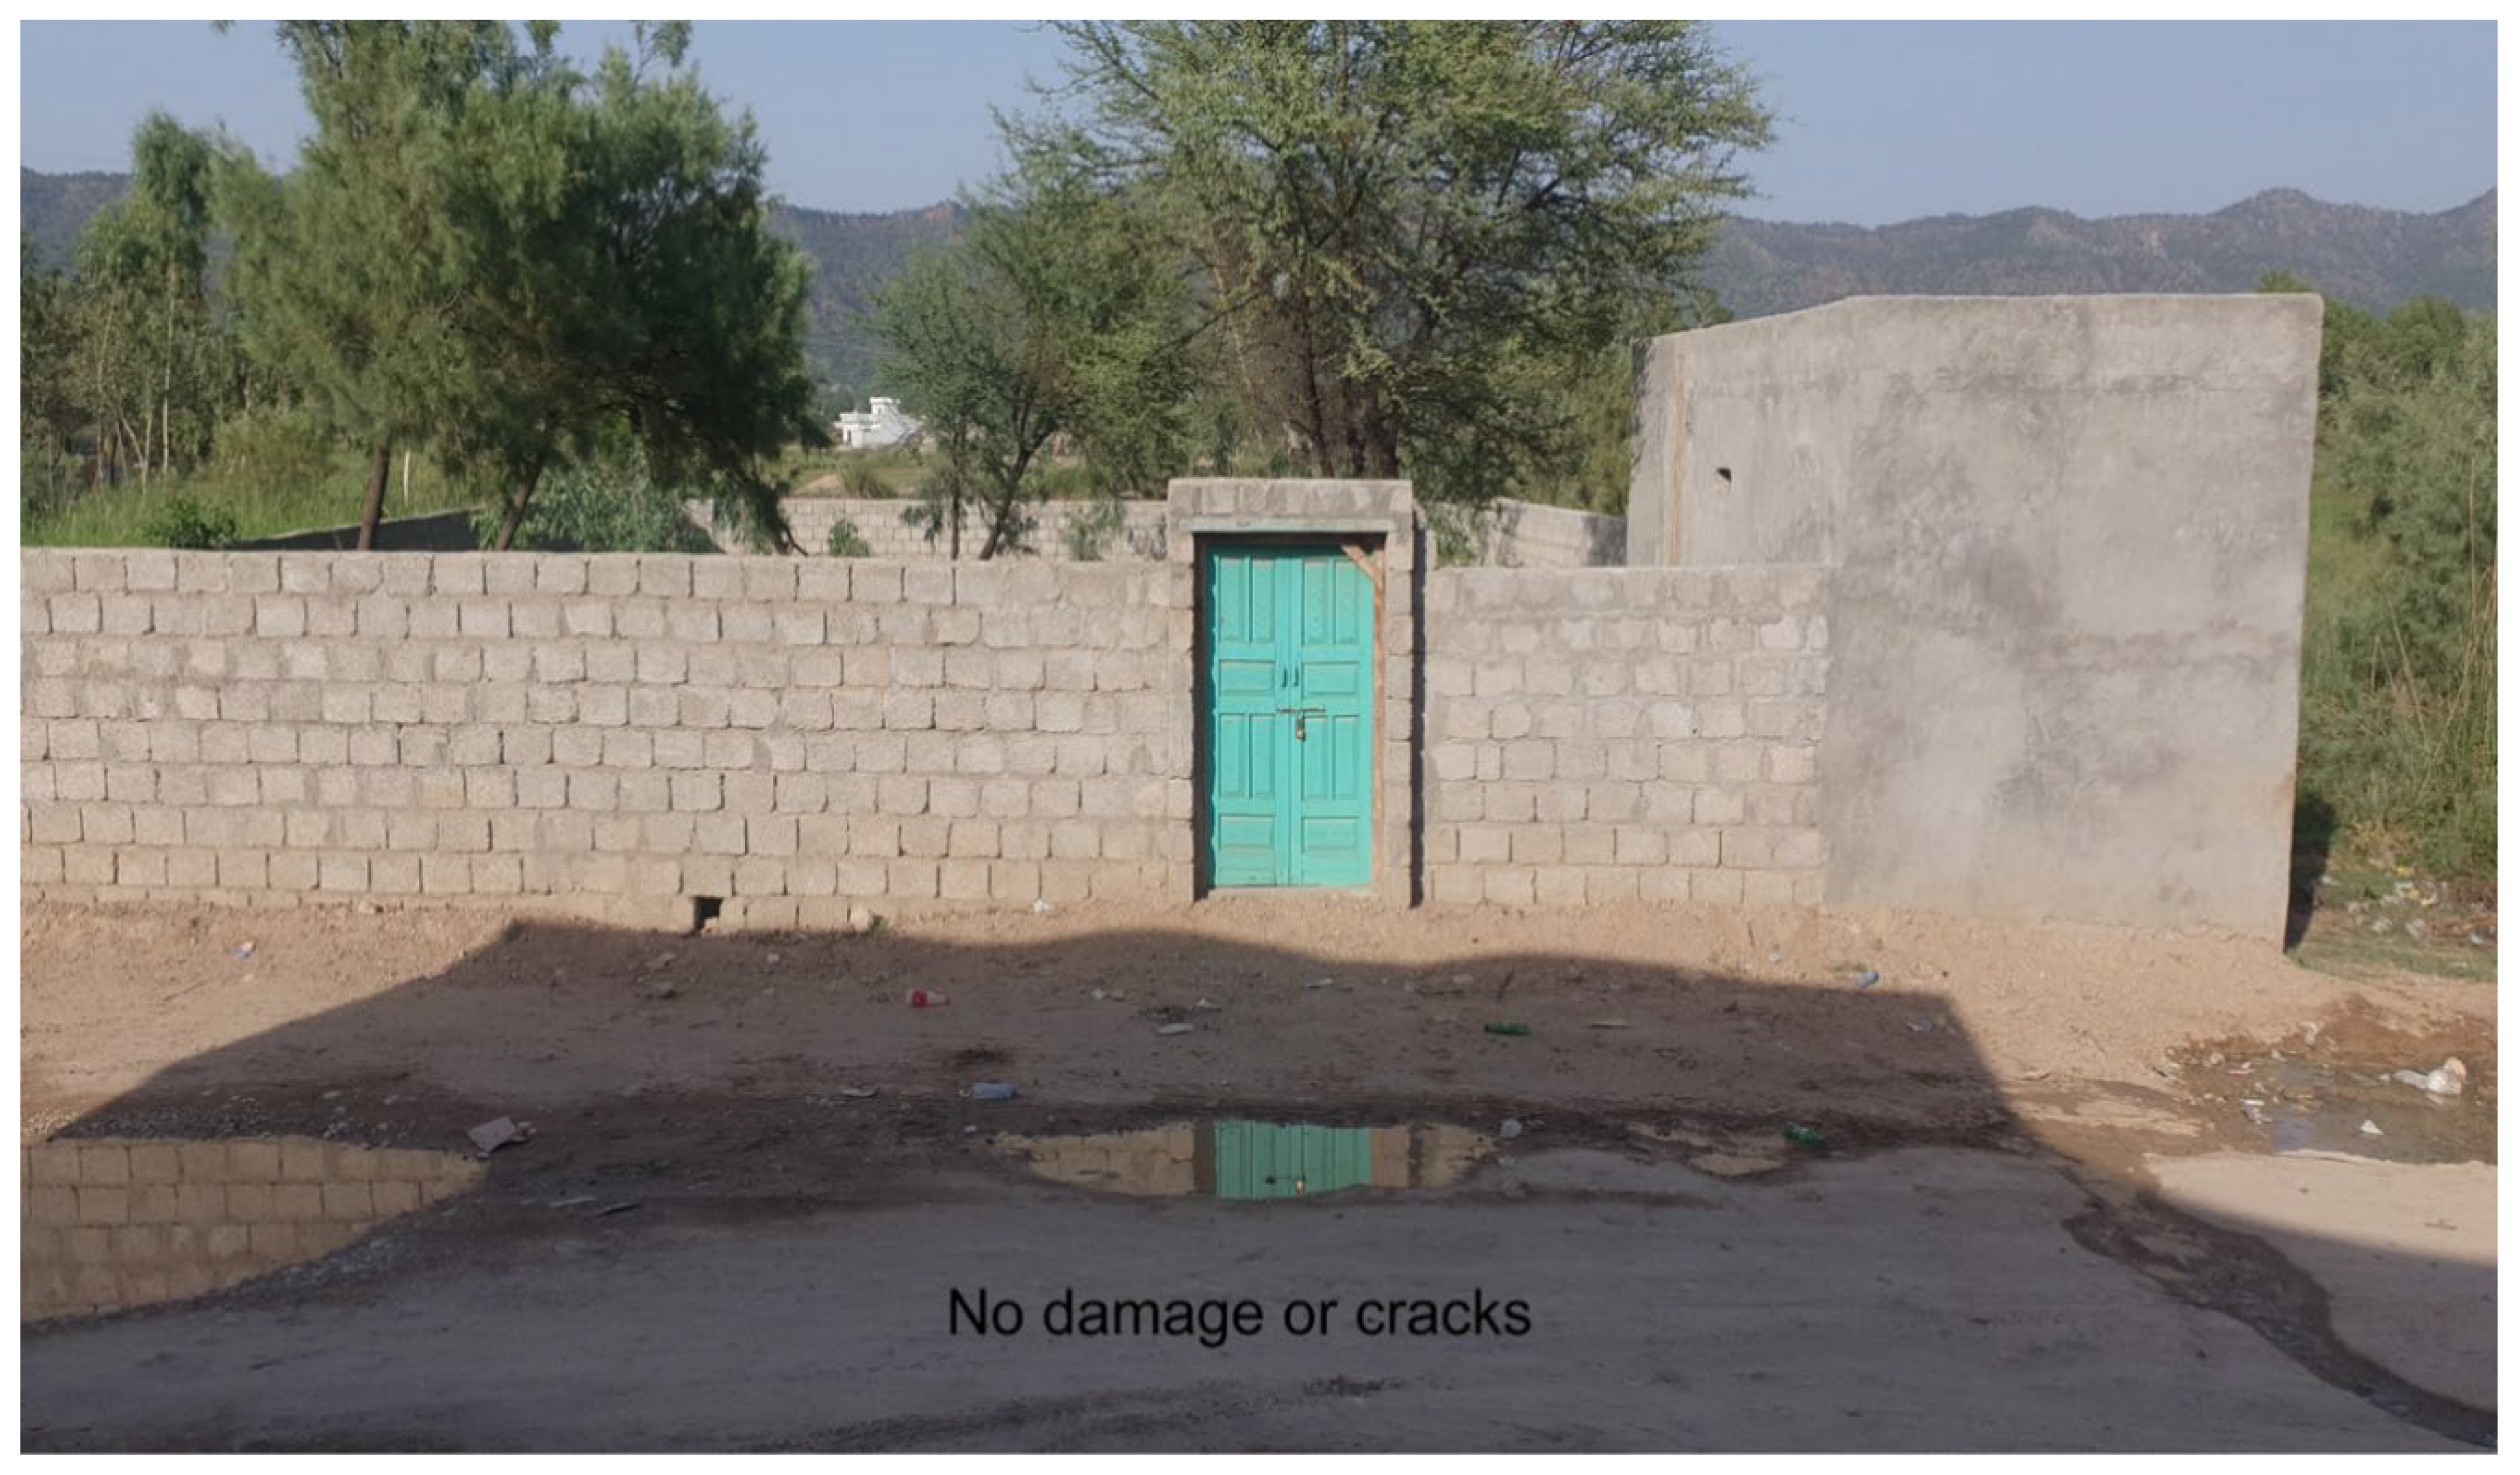
Photo 15.
Site Amplification / De-amplification Factors: Brick-kiln chimney having a height of about 35 ft survived about five kilometers away from the epicenter; though the structure was cracked badly. The site contains thin silt / clay cover on hard bedrock. Exposed rocky formations can be seen in the background. The factor explains less intensity west and north of the epicenter as compared to eastward areas containing wet/saturated sandy bed for foundations.
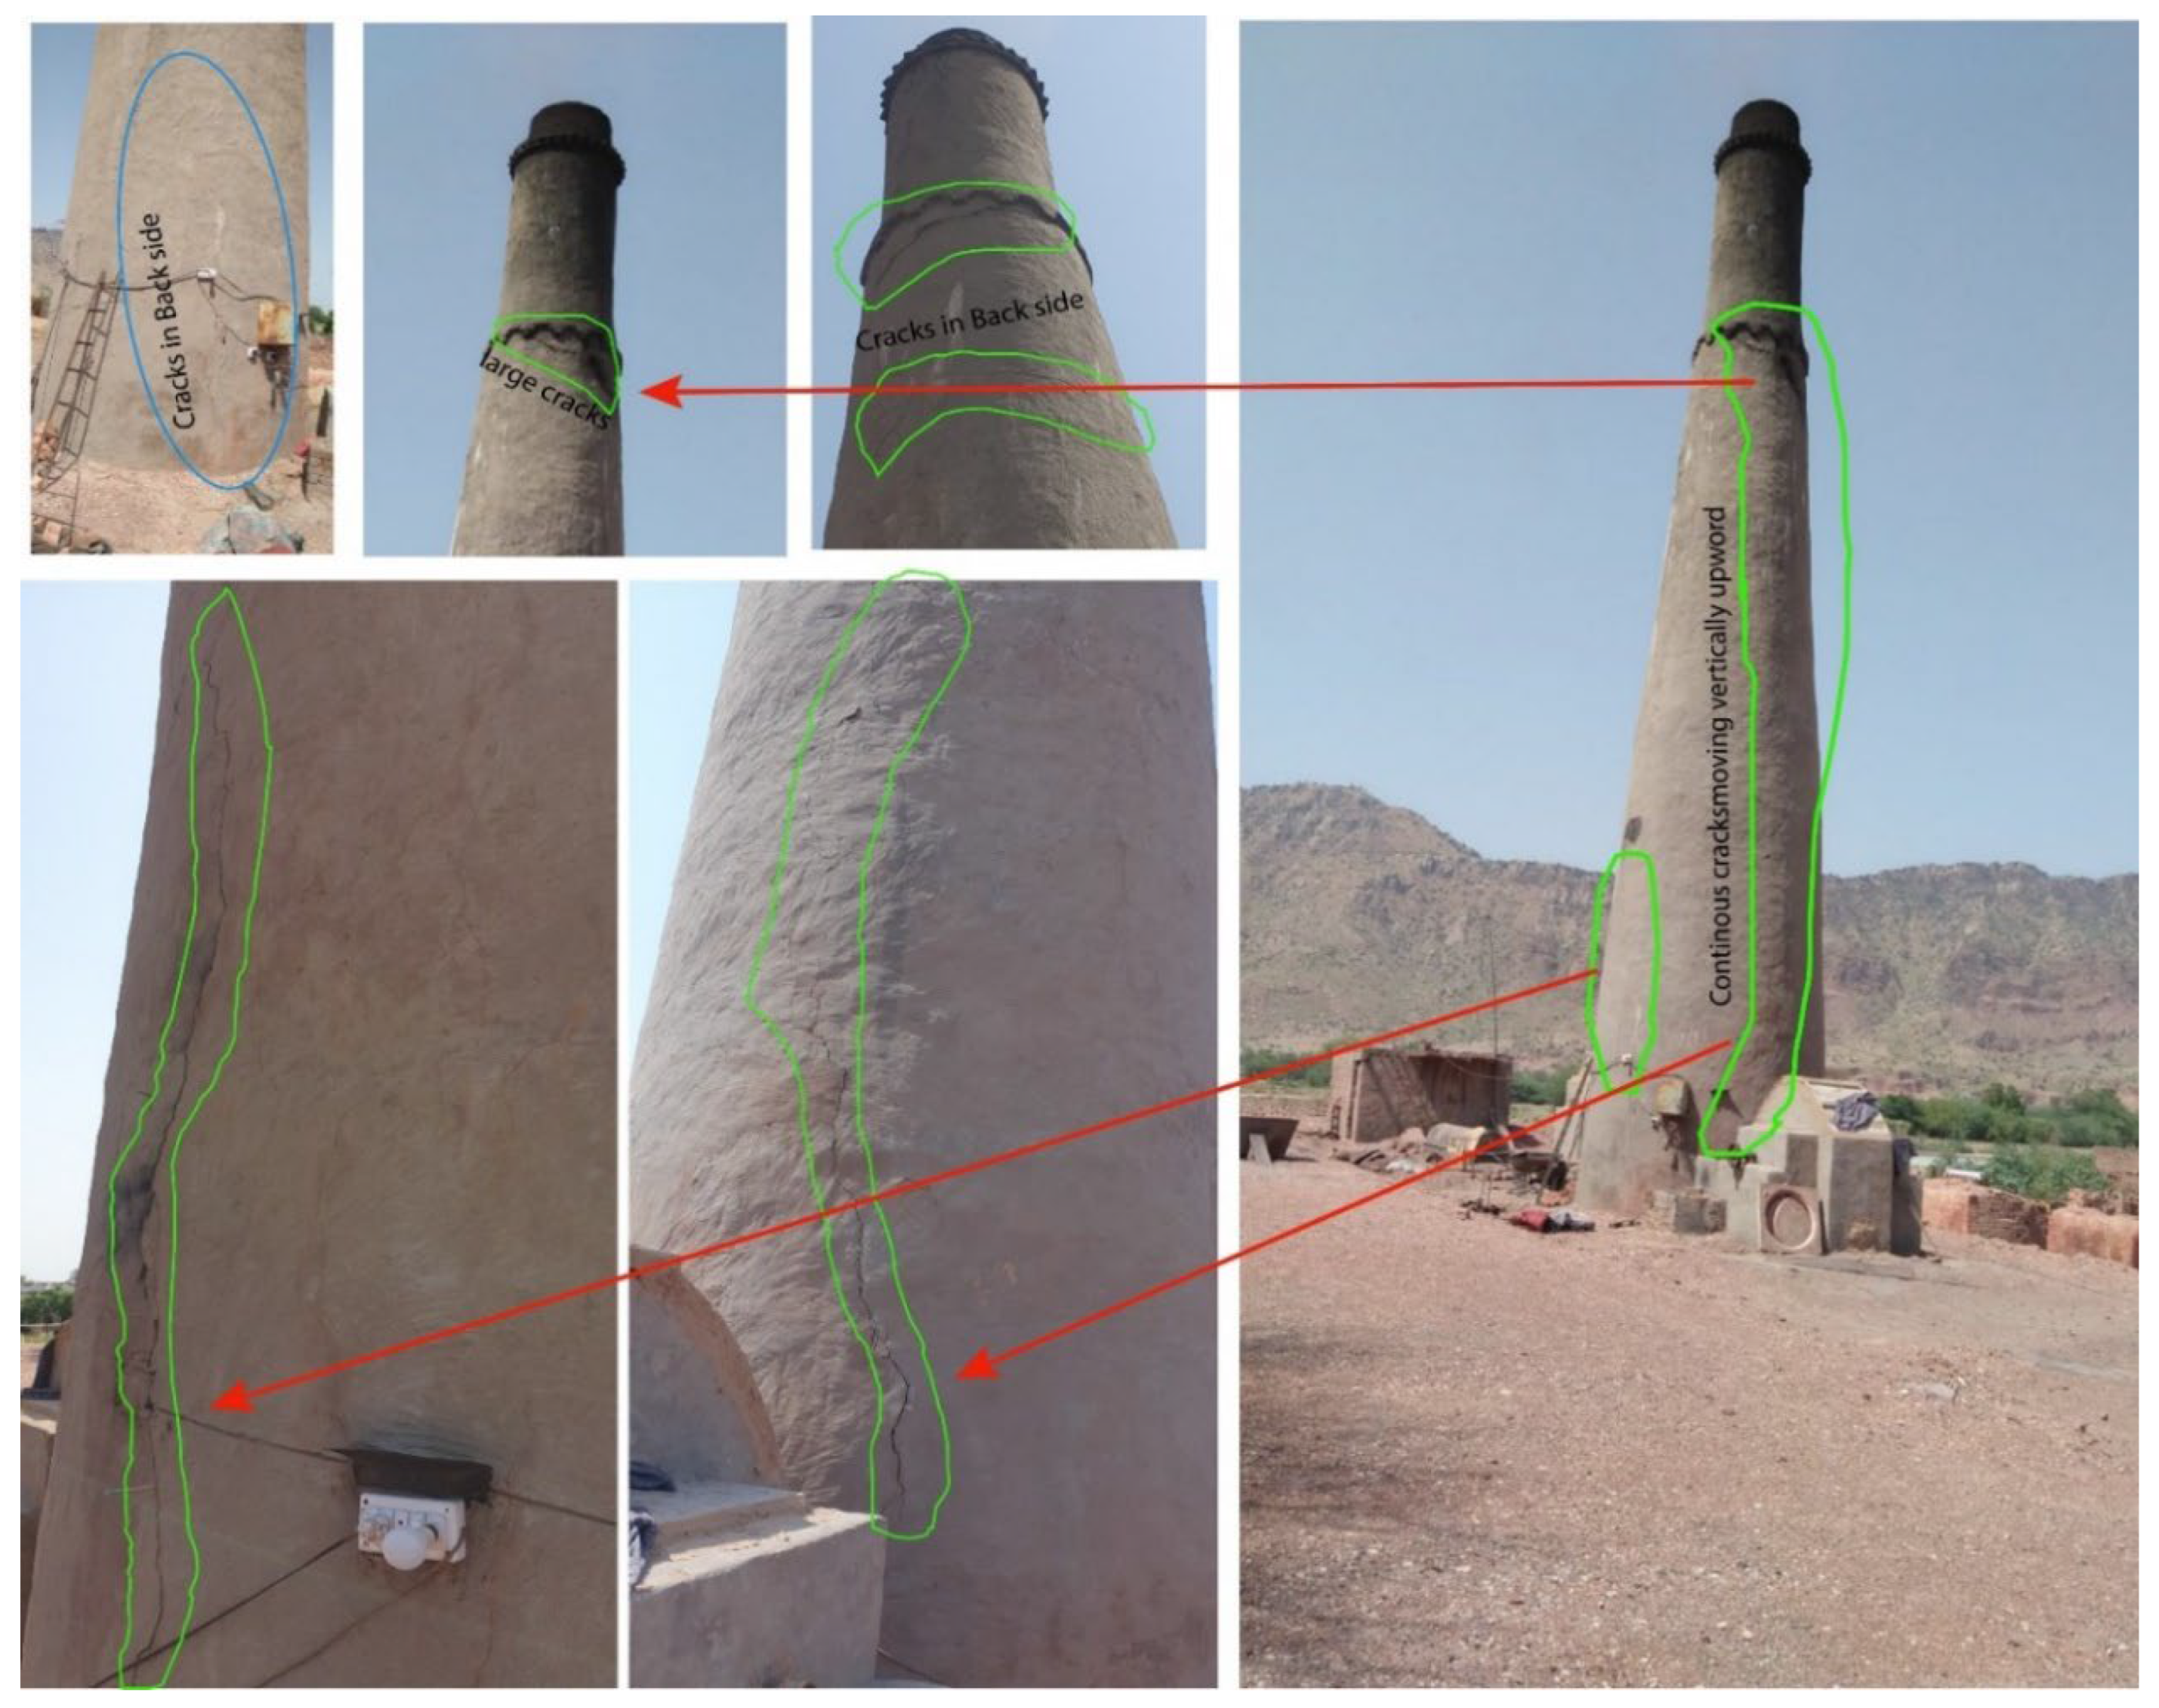
Photo 16.
Engineered structures away from epicenter: No damage to structures or sophisticated machinery / equipment at Head Rasul 17 km from the epicenter.
Photo 16.
Engineered structures away from epicenter: No damage to structures or sophisticated machinery / equipment at Head Rasul 17 km from the epicenter.
References
- Qasim, M.; Rehman, Z.U.; Ding, L.; Tanoli, J.I.; Abbas, W.; Jamil, M.; Bhatti, Z.I.; Umar, M. Foreland Basin Unconformity, Western Himalaya, Pakistan: Timing Gap, Regional Correlation and Tectonic Implications. Prog. Earth Planet. Sci. 2023, 10, 51. [Google Scholar] [CrossRef]
- Vassallo, R.; Mugnier, J.-L.; Vignon, V.; Malik, M.A.; Jayangondaperumal, R.; Srivastava, P.; Jouanne, F.; Carcaillet, J. Distribution of the Late-Quaternary Deformation in Northwestern Himalaya. Earth Planet. Sci. Lett. 2015, 411, 241–252. [Google Scholar] [CrossRef]
- Jouanne, F.; Gajurel, A.; Mugnier, J.-L.; Bollinger, L.; Adhikari, L.B.; Koirala, B.; Cotte, N.; Bhattarai, R.; Pecher, A.; Bascou, P. Postseismic Deformation Following the April 25, 2015 Gorkha Earthquake (Nepal): Afterslip versus Viscous Relaxation. J. Asian Earth Sci. 2019, 176, 105–119. [Google Scholar] [CrossRef]
- Jadoon, I.A.; Ding, L.; Saif-ur-Rehman, K.J.; Bhatti, Z.I.; Shah, S.T.; Qasim, M.; Ao, S. Lithospheric Deformation and Active Tectonics of the NW Himalayas, Hindukush, and Tibet. Lithosphere 2021, 2021. [Google Scholar] [CrossRef]
- Tahir, M.; Saif, B.; Iqbal, T.M.; Habib, R.A.; Iqbal, T.; Awais, M.; Shah, M.A. Probing the Active Kinematics in Northwestern Himalayan Foreland, Pakistan: Insights from Seismicity and Gravity Data. J. Geodyn. 2025, 164, 102100. [Google Scholar] [CrossRef]
- Khan, M.; Nawaz, S.; Radwan, A.E. New Insights into Tectonic Evolution and Deformation Mechanism of Continental Foreland Fold-Thrust Belt. J. Asian Earth Sci. 2023, 245, 105556. [Google Scholar] [CrossRef]
- Tahir, M.; Saif, B.; Habib, R.A.; Javed, F.; Iqbal, M.Z.; Iqbal, T.; Mahmood, N.; Ahmed, N. Seismotectonic Analysis of Pabbi Blind-Thrust in the NW Himalayan Foreland: Evidence from the 2024 Kharian Earthquake. Pure Appl. Geophys. 2026, 1–16. [Google Scholar] [CrossRef]
- Tahir, M.; Khan, M.Y.; Tahir, S.; Iqbal, T. Crustal Stress Redistribution and Aftershock Patterns in the Northwestern Himalaya Following the 2019 Mirpur Earthquake. J. Seismol. 2025. [Google Scholar] [CrossRef]
- Vaka, D.S.; Rao, Y.; Singh, T. Surface Deformation of the 2019 Mirpur Earthquake Estimated from Sentinel-1 InSAR Data; IEEE, 2020; pp. 130–133. [Google Scholar]
- Gardezi, S.A.H.; Hussain, G.; Neupane, B.; Imran, M.; Hamid, Q.Y.; Ikram, N.; Usmani, N.A.; Asghar, H. Geological Investigation of 5.6 MW Mirpur Earthquake, Northwestern Himalayas, Pakistan. Int. Res. J. Earth Sci. 2021, 9, 20–31. [Google Scholar]
- Khan, M.Y.; Turab, S.A.; Riaz, M.S.; Atekwana, E.A.; Muhammad, S.; Butt, N.A.; Abbas, S.M.; Zafar, W.A.; Ohenhen, L.O. Investigation of Coseismic Liquefaction-induced Ground Deformation Associated with the 2019 Mw 5.8 Mirpur, Pakistan, Earthquake Using Near-surface Electrical Resistivity Tomography and Geological Data. Surf. Geophys. 2021, 19, 169–182. [Google Scholar] [CrossRef]
- Sreejith, K.M.; Jasir, M.C.M.; Agrawal, R.; Rajawat, A.S. The 2019 September 24, Mw= 6, Mirpur Earthquake, NW Himalaya: Geodetic Evidence for Shallow, near-Horizontal Décollement Rupture of the Main Himalayan Thrust. Tectonophysics 2021, 816, 229013. [Google Scholar] [CrossRef]
- Barkat, A.; Javed, F.; Joe Tan, Y.; Ali, A.; Tahir Javed, M.; Ahmad, N.; Awais, M.; Ali Shah, M.; Iqbal, T. 2019 M w 5.9 Mirpur, Pakistan Earthquake: Insights from Integrating Geodetic, Seismic, and Field Observations. Seismol. Soc. Am. 2022, 93, 2015–2026. [Google Scholar] [CrossRef]
- Rafi, M.M.; Ahmed, M.; Lodi, S.H.; Varum, H.; Arshad, M.T. Investigation of Damage to Reinforced Concrete Buildings Due to the 2019 Mirpur Earthquake, Azad Kashmir. J. Perform. Constr. Facil. 2022, 36, 04022037. [Google Scholar] [CrossRef]
- Tan, Y.; Dai, Z.; Liu, B.; Zha, X. Source Parameters and Slip Distribution of the 2019 M w 5.8 Mirpur (Pakistan) Earthquake Inferred from the Corrected InSAR Observations. Seismol. Soc. Am. 2022, 93, 1464–1478. [Google Scholar] [CrossRef]
- Alam, Z.; Ahmed, S.; Fiaz, M.; Noroozinejad Farsangi, E. An Insight into the Characteristics of the September 24, 2019, MW 5.8 Mirpur, Pakistan, Earthquake and Reconnaissance of the Induced-Failure Modes in Buildings and Civil Infrastructure Facilities. Pract. Period. Struct. Des. Constr. 2023, 28, 05023005. [Google Scholar] [CrossRef]
- Habib, W.; Mahmood, S.; Noor, S.; Saleem, A.; Siraj, M.; Ahmad, H. A Post Earthquake Damage Assessment Using GIS in District Mirpur, Pakistan. Adv. GIS 2023, 3, 53–58. [Google Scholar]
- Goswami, T.K.; Bezbaruah, D.; Mahanta, B.N.; Sarmah, R.K. Structural Framework, Crustal Shortening and Cenozoic Exhumation in the Eastern Himalaya: A Review. Phys. Chem. Earth Parts ABC 2021, 124, 103048. [Google Scholar] [CrossRef]
- Zhang, Y.-P.; Wang, Y.; Wang, W.-T.; Shao, Z.-G.; Xu, B.-B.; He, X.-H.; Feng, W.-P.; Yao, Q.; Yang, Y.-Q.; Ma, H.-S. Active Block Tectonics and Intracontinental Deformation within the India-Eurasia Oblique Convergence Zone. Tectonics 2025, 44, e2025TC009029. [Google Scholar] [CrossRef]
- Qureshi, P.K.A.; Khan, P.S.D.; Tirmizi, P.O.; Khan, Z. Surface Deformation and Geometry of the Himalayan Frontal Thrust System in Pakistan: An Insight from InSAR and Seismic Interpretation. Tectonophysics 2025, 897, 230612. [Google Scholar] [CrossRef]
- Szeliga, W.; Bilham, R.; Kakar, D.M.; Lodi, S.H. Interseismic Strain Accumulation along the Western Boundary of the Indian Subcontinent. J. Geophys. Res. 2012, 117. [Google Scholar] [CrossRef]
- Kundu, B.; Yadav, R.K.; Bali, B.S.; Chowdhury, S.; Gahalaut, V.K. Oblique Convergence and Slip Partitioning in the NW Himalaya: Implications from GPS Measurements. Tectonics 2014, 33, 2013–2024. [Google Scholar] [CrossRef]
- Dal Zilio, L.; Hetényi, G.; Hubbard, J.; Bollinger, L. Building the Himalaya from Tectonic to Earthquake Scales. Nat. Rev. Earth Environ. 2021, 2, 251–268. [Google Scholar] [CrossRef]
- Mehmood, H.; Miraj, M.A.F.; Ahsan, N. Paleostress and outcrop fracture analysis along Himalayan Foothills (Eastern Salt Range), Potwar plateu NW Himalaya, Pakistan. Acta Geodyn. Geomater. 2021, 18, 185. [Google Scholar] [CrossRef]
- Ghani, H.; Sobel, E.R.; Zeilinger, G.; Glodny, J.; Zapata, S.; Irum, I. Palaeozoic and Pliocene Tectonic Evolution of the Salt Range Constrained by Low-temperature. Thermochronology Terra Nova 2021, 33, 293–305. [Google Scholar] [CrossRef]
- DeCelles, P.G.; Carrapa, B. Coupled Rapid Erosion and Foreland Sedimentation Control Orogenic Wedge Kinematics in the Himalayan Thrust Belt of Central Nepal. J. Geophys. Res. Solid Earth 2021, 126, e2020JB021256. [Google Scholar] [CrossRef]
- Yeats, R.S.; Khan, S.H.; Akhtar, M. Late Quaternary Deformation of the Salt Range of Pakistan. Geol. Soc. Am. Bull. 1984, 95, 958–966. [Google Scholar] [CrossRef]
- Krishnan, M.S. Salt Tectonics in the Punjab Salt Range, Pakistan. Geol. Soc. Am. Bull. 1966, 77, 115–122. [Google Scholar] [CrossRef]
- Ghazi, S.; Ali, S.H.; Sahraeyan, M.; Hanif, T. An Overview of Tectonosedimentary Framework of the Salt Range, Northwestern Himalayan Fold and Thrust Belt, Pakistan. Arab. J. Geosci. 2015, 8, 1635–1651. [Google Scholar] [CrossRef]
- Yeats, R.S.; Lillie, R.J. Contemporary Tectonics of the Himalayan Frontal Fault System: Folds, Blind Thrusts and the 1905 Kangra Earthquake. J. Struct. Geol. 1991, 13, 215–225. [Google Scholar] [CrossRef]
- Divyadarshini, A.; Rajendran, C.P.; John, B.; Singh, V.; Yadava, M.G.; Sarkar, A.; Parida, S. Evidence of Blind Thrusting in the Frontal Part of the Central Himalaya and Its Significance for Rupture Evolution and Size of a Medieval Earthquake. Tectonophysics 2023, 854, 229798. [Google Scholar] [CrossRef]
- Shaukat, A.Z.; Tahir, M.; Iqbal, T.; Iqbal, T.; Shah, M.A. Seismotectonic Analysis of the 7 October 2021 M w 5.9 Harnai Earthquake, Pakistan. Bull. Seism. Soc. Am. 2023, 113, 636–647. [Google Scholar] [CrossRef]
- Tahir, M.; Saif, B.; Iqbal, T.; Habib, R.A.; Iqbal, T.; Shah, M.A. Basement Neo-Tectonics of Western Himalayas from Seismic and Gravity Data Perspective. Ann. Geophys. 2024, 67, S551–S551. [Google Scholar] [CrossRef]
- Lienert, B.R.; Berg, E.; Frazer, L.N. HYPOCENTER: An Earthquake Location Method Using Centered, Scaled, and Adaptively Damped Least Squares. Bull. Seism. Soc. Am. 1986, 76, 771–783. [Google Scholar] [CrossRef]
- Lienert, B.R.; Havskov, J. A Computer Program for Locating Earthquakes Both Locally and Globally. Seism. Res. Lett. 1995, 66, 26–36. [Google Scholar] [CrossRef]
- Ottemöller, L.; Voss, P.; Havskov, J. Seisan Earthquake Analysis Software for Windows, Solaris, Linux and MacOsX. Dept. Earth Sci. Univ. Bergen Nor. 2011, 335. [Google Scholar]
- Havskov, J.; Voss, P.H.; Ottemöller, L. Seismological Observatory Software: 30 Yr of SEISAN. Seism. Res. Lett. 2020, 91, 1846–1852. [Google Scholar] [CrossRef]
- Mushtaq, M.N.; Tahir, M.; Shah, M.A.; Khanam, F. Development of Local Magnitude Scale for the Northern Punjab, Pakistan. J. Seism. 2019, 23, 403–416. [Google Scholar] [CrossRef]
- Mushtaq, M.; Tahir, M.; Iqbal, M.; Shah, M.; Iqbal, S. Calibration of Local Magnitude Scale for Hindukush Continental Subduction Zone. Earthq. Sci. 2021, 34, 114–122. [Google Scholar] [CrossRef]
- Tahir, M.; Khan, A.; Mushtaq, M.N.; Iqbal, M.T.; Iqbal, T.; Shah, M.A.; Khan, K.; Soomro, R.A. Distance Attenuation and Local Magnitude Scale Based on Constant Geometrical Spreading in Northern Punjab, Pakistan. Acta Geophys. 2021, 69, 1567–1584. [Google Scholar] [CrossRef]
- Dziewonski, A.M.; Chou, T. -A.; Woodhouse, J.H. Determination of Earthquake Source Parameters from Waveform Data for Studies of Global and Regional Seismicity. J. Geophys. Res. Solid Earth 1981, 86, 2825–2852. [Google Scholar] [CrossRef]
- Fukuyama, E.; Dreger, D.S. Performance Test of an Automated Moment Tensor Determination System for the Future “Tokai” Earthquake. Earth Planets Space 2000, 52, 383–392. [Google Scholar] [CrossRef]
- Zahradnik, J.; Jansky, J.; Plicka, V. Detailed Waveform Inversion for Moment Tensors of M∼ 4 Events: Examples from the Corinth Gulf, Greece. Bull. Seismol. Soc. Am. 2008, 98, 2756–2771. [Google Scholar] [CrossRef]
- Ekström, G.; Nettles, M.; Dziewoński, A.M. The Global CMT Project 2004–2010: Centroid-Moment Tensors for 13,017 Earthquakes. Phys. Earth Planet. Inter. 2012, 200, 1–9. [Google Scholar] [CrossRef]
- Kohketsu, K. The Extended Reflectivity Method for Synthetic Near-Field Seismogram. J. Phys. Earth 1985, 33, 121–131. [Google Scholar] [CrossRef]
- Vavryčuk, V. Iterative Joint Inversion for Stress and Fault Orientations from Focal Mechanisms. Geophys. J. Int. 2014, 199, 69–77. [Google Scholar] [CrossRef]
- Sabahat, S.; Tahir, M.; Munir, F.; Saif, B.; Iqbal, M.T.; Iqbal, J.; Iqbal, T. Inversion Techniques for Focal Mechanism Determination of Small-Magnitude Earthquakes: A Comparative Study Using the Burewala Earthquake (M W∼ 4) in Pakistan. J. Seismol. 2024, 28, 119–131. [Google Scholar] [CrossRef]
- Sabahat, S.; Tahir, M.; Iqbal, M.T.; Iqbal, J.; Iqbal, T. Source Parameters of the Fatehjang, Pakistan Earthquake $$({M} _ {w} 4.1) $$ of 28 August 2020. Arab J. Geosci. 2022, 15, 1–17. [Google Scholar] [CrossRef]
- Soomro, R.A.; Iqbal, S.; Shah, M.A.; Iqbal, T. P-Wave Minimum 1D Velocity Model for Central and Northern Pakistan. J. Seism. 2022, 26, 1039–1049. [Google Scholar] [CrossRef]
- Yagi, Y.; Nishimura, N. Moment Tensor Inversion of near Source Seismograms. Bull. IISEE 2011, 45, 133–138. [Google Scholar]
- Sokos, E.; Zahradník, J. Evaluating Centroid-moment-tensor Uncertainty in the New Version of ISOLA Software. Seismol. Res. Lett. 2013, 84, 656–665. [Google Scholar] [CrossRef]
- Zahradník, J.; Sokos, E. ISOLA Code for Multiple-Point Source Modeling. In Moment Tensor Solutions; Springer, 2018; pp. 1–28. [Google Scholar]
- Saif, B.; Tahir, M.; Shah, M.A.; Mushtaq, M.N.; Khan, M.Y.; Azad, A.; Iqbal, T. An Updated and Gridded Probabilistic Seismic Hazard Assessment of Quetta City, Pakistan Using Multiple Source Models. J. Asian Earth Sci. 2024, 272, 106245. [Google Scholar] [CrossRef]
- Wiemer, S.; Wyss, M. Mapping the Frequency-magnitude Distribution in Asperities: An Improved Technique to Calculate Recurrence Times? J. Geophys. Res. 1997, 102, 15115–15128. [Google Scholar] [CrossRef]
- Gutenberg, B.; Richter, C.F. Earthquake Magnitude, Intensity, Energy, and Acceleration. Bull. Seism. Soc. Am. 1942, 32, 163–191. [Google Scholar] [CrossRef]
- El-Isa, Z.H.; Eaton, D.W. Spatiotemporal Variations in the B-Value of Earthquake Magnitude–Frequency Distributions: Classification and Causes. Tectonophysics 2014, 615, 1–11. [Google Scholar] [CrossRef]
- Viti, M. Active Tectonics in Tuscany (Central Italy): Ten Years of Seismicity (2009-2019). Int. J. Geosci. 2020, 11, 613–650. [Google Scholar]
- Wyss, M.; Sobolev, G.; Clippard, J.D. Seismic Quiescence Precursors to Two M7 Earthquakes on Sakhalin Island, Measured by Two Methods. Earth Planets Space 2004, 56, 725–740. [Google Scholar] [CrossRef]
- Schorlemmer, D.; Wiemer, S.; Wyss, M. Variations in Earthquake-Size Distribution across Different Stress Regimes. Nature 2005, 437, 539–542. [Google Scholar] [CrossRef] [PubMed]
- Chiarabba, C.; Jovane, L.; DiStefano, R. A New View of Italian Seismicity Using 20 Years of Instrumental Recordings. Tectonophysics 2005, 395, 251–268. [Google Scholar] [CrossRef]
- Chung, T.W.; Iqbal, M.Z.; Lee, Y.; Yoshimoto, K.; Jeong, J. Depth-Dependent Seismicity and Crustal Heterogeneity in South Korea. Tectonophysics 2018, 749, 12–20. [Google Scholar] [CrossRef]
- Iqbal, M.Z.; Chung, T.W.; Zhou, H.; Cho, S.O.; Nam, M.J. Seismicity Boundary Depth of Mainland China. Ann. Geophys. 2018, 61. [Google Scholar] [CrossRef]
- Hameed, F.; Khan, M.R.; Dentith, M. Crustal Study Based on Integrated Geophysical Techniques in the Northwestern Himalayas, Pakistan. Geol. J. 2023, 58, 1523–1549. [Google Scholar] [CrossRef]
- Williams, J.N.; Werner, M.J.; Goda, K.; Wedmore, L.N.; De Risi, R.; Biggs, J.; Mdala, H.; Dulanya, Z.; Fagereng, Å.; Mphepo, F. Fault-Based Probabilistic Seismic Hazard Analysis in Regions with Low Strain Rates and a Thick Seismogenic Layer: A Case Study from Malawi. Geophys. J. Int. 2023, 233, 2172–2207. [Google Scholar]
- Gomar, F.; Ruh, J.B.; Najafi, M.; Sobouti, F. Importance of Basement Faulting and Salt Decoupling for the Structural Evolution of the Fars Arc (Zagros Fold-and-Thrust Belt): A Numerical Modeling Approach. Solid Earth 2024, 15, 1479–1507. [Google Scholar] [CrossRef]
- Avouac, J.-P.; Schubert, G. Mountain Building: From Earthquakes to Geological Deformation. Dyn. Process. Extensional Compressional Settings Treatise Geophys. 2007, 6, 377–439. [Google Scholar] [CrossRef]
- Laporte, M.; Letort, J.; Bertin, M.; Bollinger, L. Understanding Earthquake Location Uncertainties Using Global Sensitivity Analysis Framework. Geophys. J. Int. 2024, 237, 1048–1060. [Google Scholar] [CrossRef]
- Qaisar, M.; Shahid, M.B.; Mahmood, T.; Khan, K.; Ahmad, S. Velocity Structure and Hypocentral Location of Earthquakes by Simultaneous Inversion Method: Application to the Area of Kalabagh, Pakistan. J. Himal. Earth Sci. 2014, 47, 141–149. [Google Scholar]
- Reiter, D.; Rodi, W.; Johnson, M. Development of a Tomographic Upper-Mantle Velocity Model beneath Pakistan and Northern India for Improved Regional Seismic-Event Location. Bull. Seismol. Soc. Am. 2005, 95, 926–940. [Google Scholar] [CrossRef]
- Parvez, I.A.; Vaccari, F.; Panza, G.F. A Deterministic Seismic Hazard Map of India and Adjacent Areas. Geophys. J. Int. 2003, 155, 489–508. [Google Scholar] [CrossRef]
- Wiyono; Siombone, S.H.; Maryanto, S. Gravity and Remote Sensing Methods as a Solution in Identifying Geothermal Reservoirs on Volcanoes. Int. J. Geophys. 2022, 2022, 9737979. [Google Scholar] [CrossRef]
- Layade, G.O.; Edunjobi, H.O.; Makinde, V.; Bada, B.S. Application of Forward and Inverse Modelling to High-Resolution Gravity Data for Mineral Exploration. J. Earth Space Phys. 2021, 46, 117–129. [Google Scholar] [CrossRef]
- Layade, G.O.; Edunjobi, H.O.; Ajayi, K.D. Lineament, Qualitative Interpretation and Depth Evaluation of Potential Field Signatures in the Abeokuta Region, Southwestern Nigeria. J. Earth Space Phys. 2024, 49, 37–55. [Google Scholar]
- Basantaray, A.K.; Mandal, A. Interpretation of Gravity–Magnetic Anomalies to Delineate Subsurface Configuration beneath East Geothermal Province along the Mahanadi Rift Basin: A Case Study of Non-Volcanic Hot Springs. Geotherm. Energy 2022, 10, 6. [Google Scholar] [CrossRef]
- Ganguli, S.S.; Pal, S.K. Gravity-Magnetic Appraisal of the Southern Part of the Cauvery Basin, Eastern Continental Margin of India (ECMI): Evidence of a Volcanic Rifted Margin. Front. Earth Sci. 2023, 11, 1190106. [Google Scholar] [CrossRef]
- Kamto, P.G.; Lemotio, W.; Tokam, A.-P.K.; Yap, L. Combination of Terrestrial and Satellite Gravity Data for the Characterization of the Southwestern Coastal Region of Cameroon: Appraisal for Hydrocarbon Exploration. Int. J. Geophys. 2021, 2021, 5554528. [Google Scholar] [CrossRef]
- Quittmeyer, R.C.; Jacob, K.H. The Seismicity of Pakistan and Its Relation to Surface Faults; Geodynamicsof Paki- Stan,Editedby A. Farah and K. A. DeJong; Quittmeyer Richard Charles, 1979; pp. 271–284. [Google Scholar]
- Magsi, H.Z. Seismic Zoning of Pakistan. New Concept Glob. Tecton. J. 2014, 2, 47–53. [Google Scholar]
- Blisniuk, P.M.; Sonder, L.J.; Lillie, R.J. Foreland Normal Fault Control on Northwest Himalayan Thrust Front Development. Tectonics 1998, 17, 766–779. [Google Scholar] [CrossRef]
- DiPietro, J.A.; Pogue, K.R. Tectonostratigraphic Subdivisions of the Himalaya: A View from the West. Tectonics 2004, 23. [Google Scholar] [CrossRef]
Figure 1.
Regional geological and tectonic map of the NW Himalayan foreland fold-and-thrust belt, modified and updated from [7,8,29,79,80]. (a) Major earthquakes (Mw ≥ 7.0) and tectonic boundary passing through this region, along with their average slip rates. (b) Local tectonic with rectangular box marks the location of the study area. The inferred blind thrust-related Samwal and Pabbi anticline structures are depicted by dashed lines.
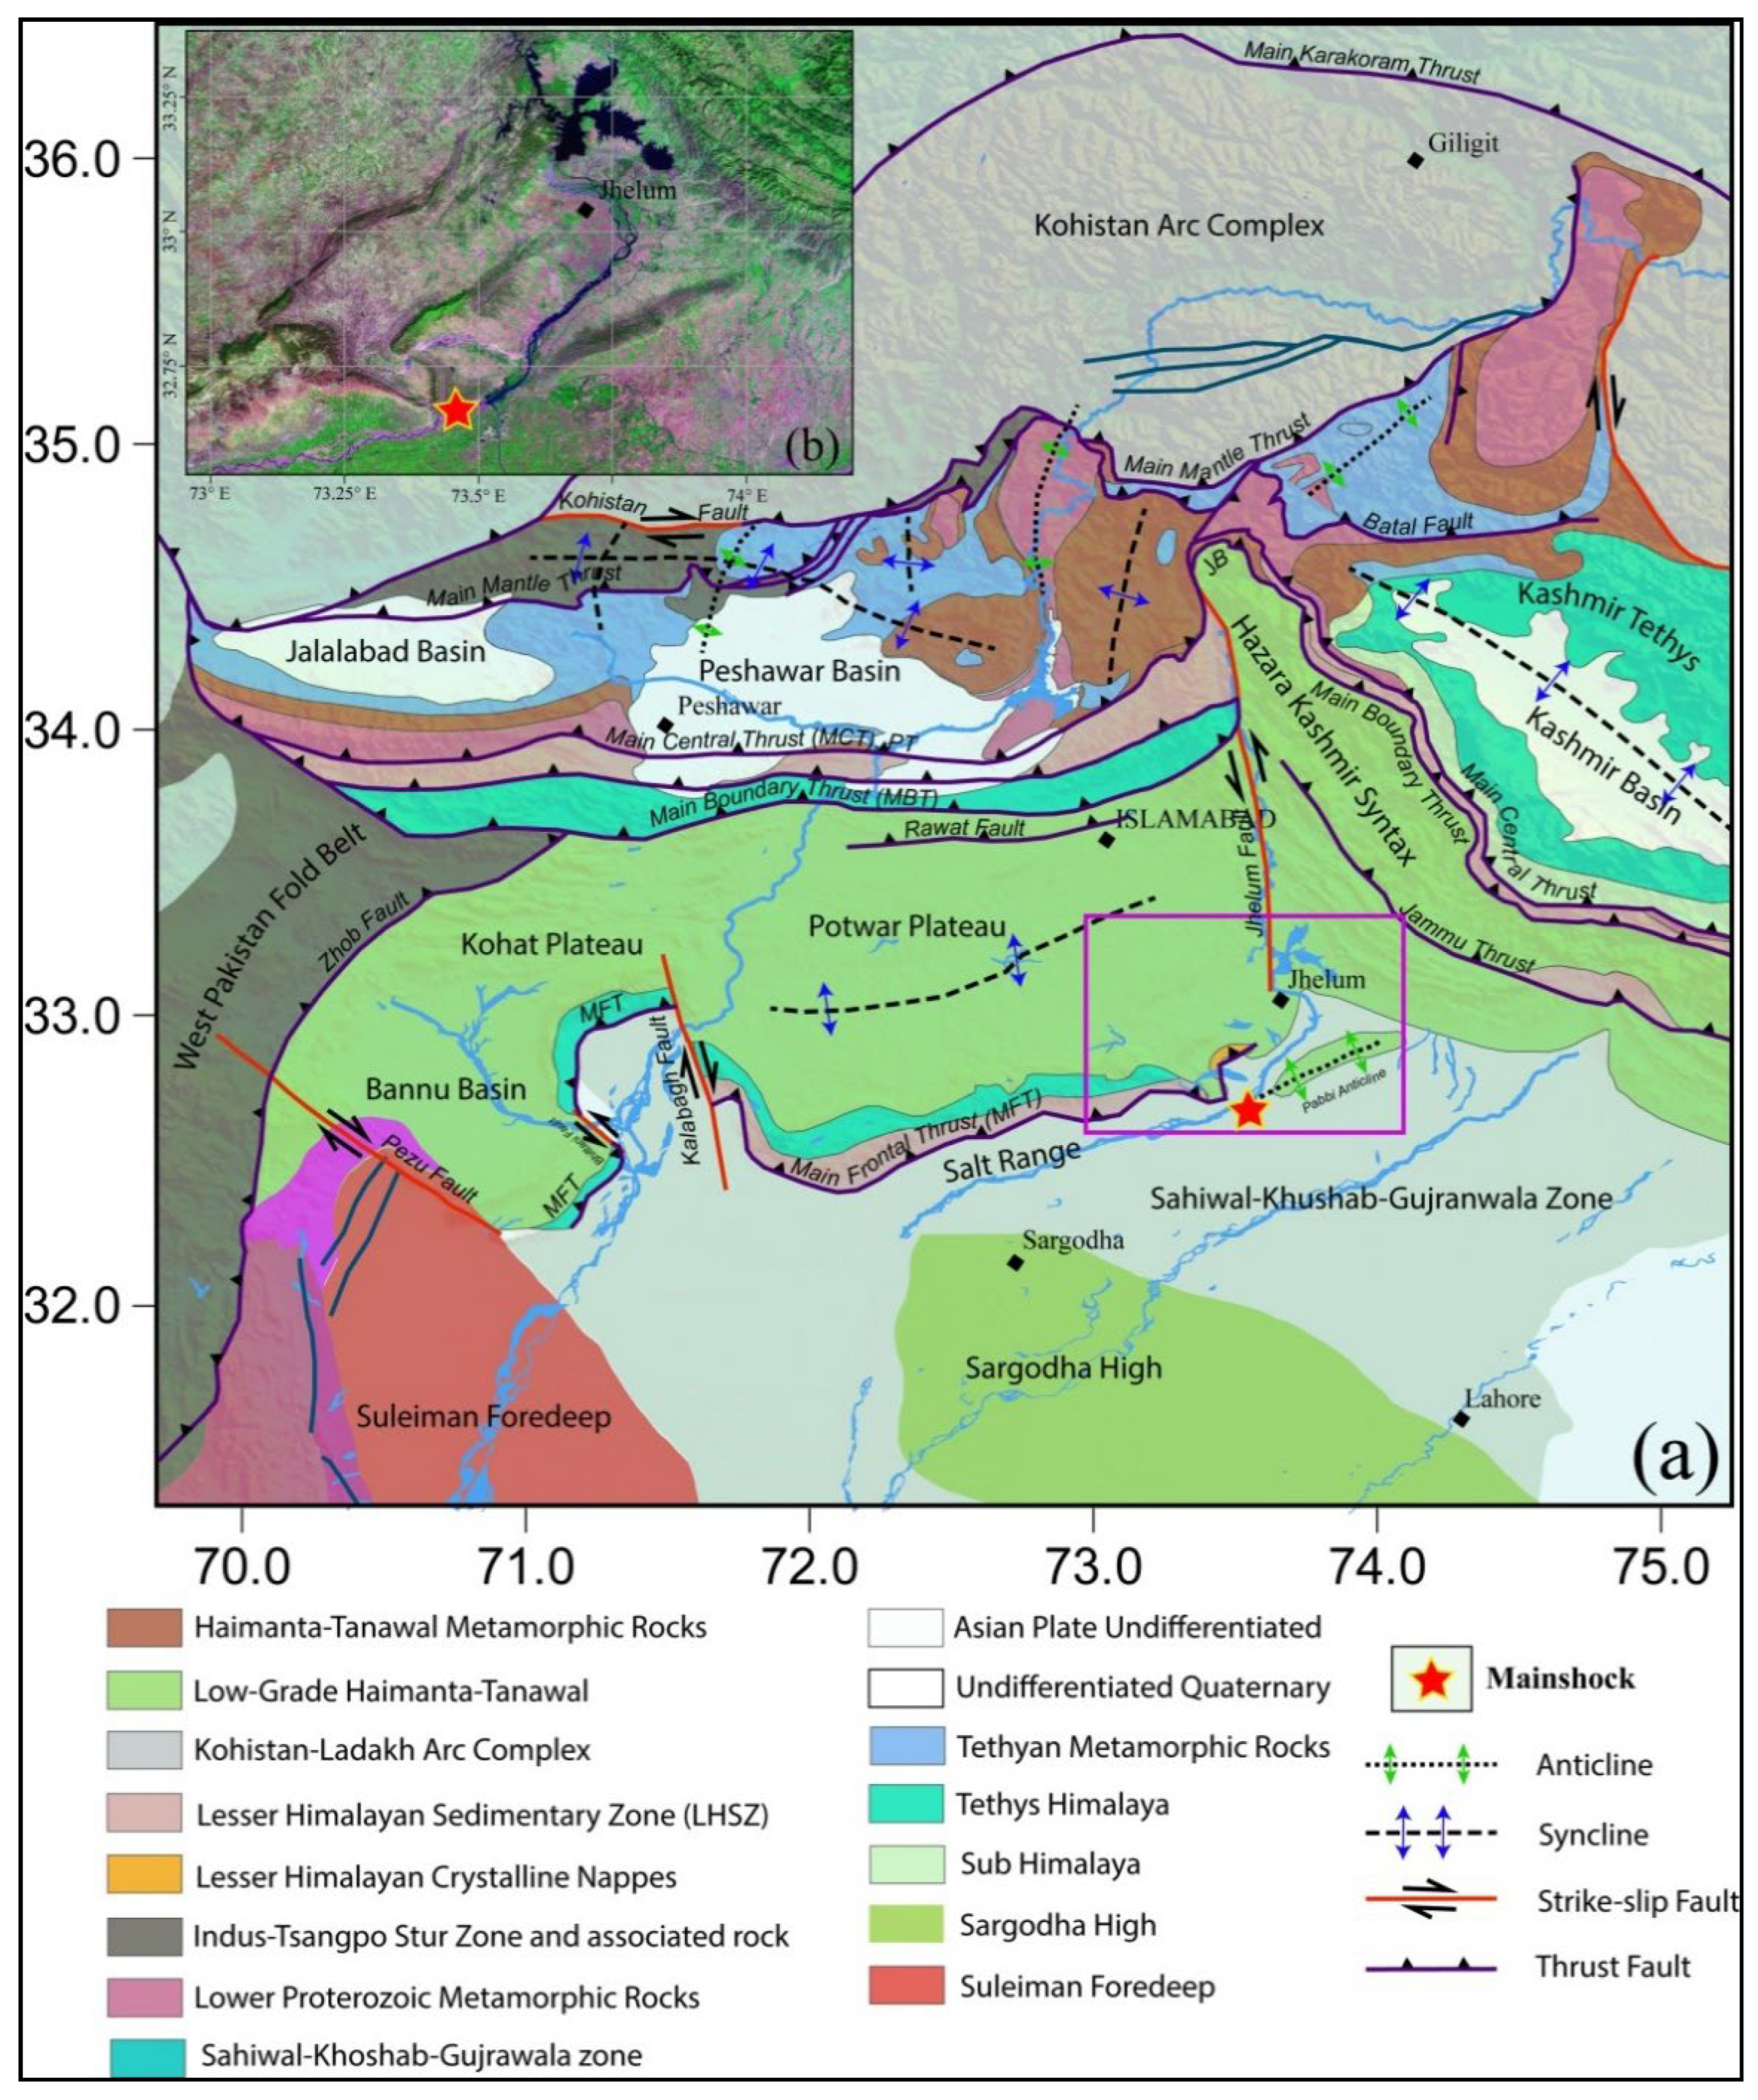
Figure 2.
Seismicity distribution and seismic network configuration used in this study. (a) Map showing earthquake distribution, available focal mechanism solutions, and major tectonic features in the study area. The star denotes the Jalalpur Sharif earthquake, while the blue beach ball represents the moment tensor inversion solution obtained in this study. Other focal mechanism solutions (orange beach balls) were compiled from the Global CMT catalog and published literature. (b) Distribution of local seismic stations across Pakistan. (c) Seismic stations selected for moment tensor inversion of the Jalalpur Sharif earthquake.
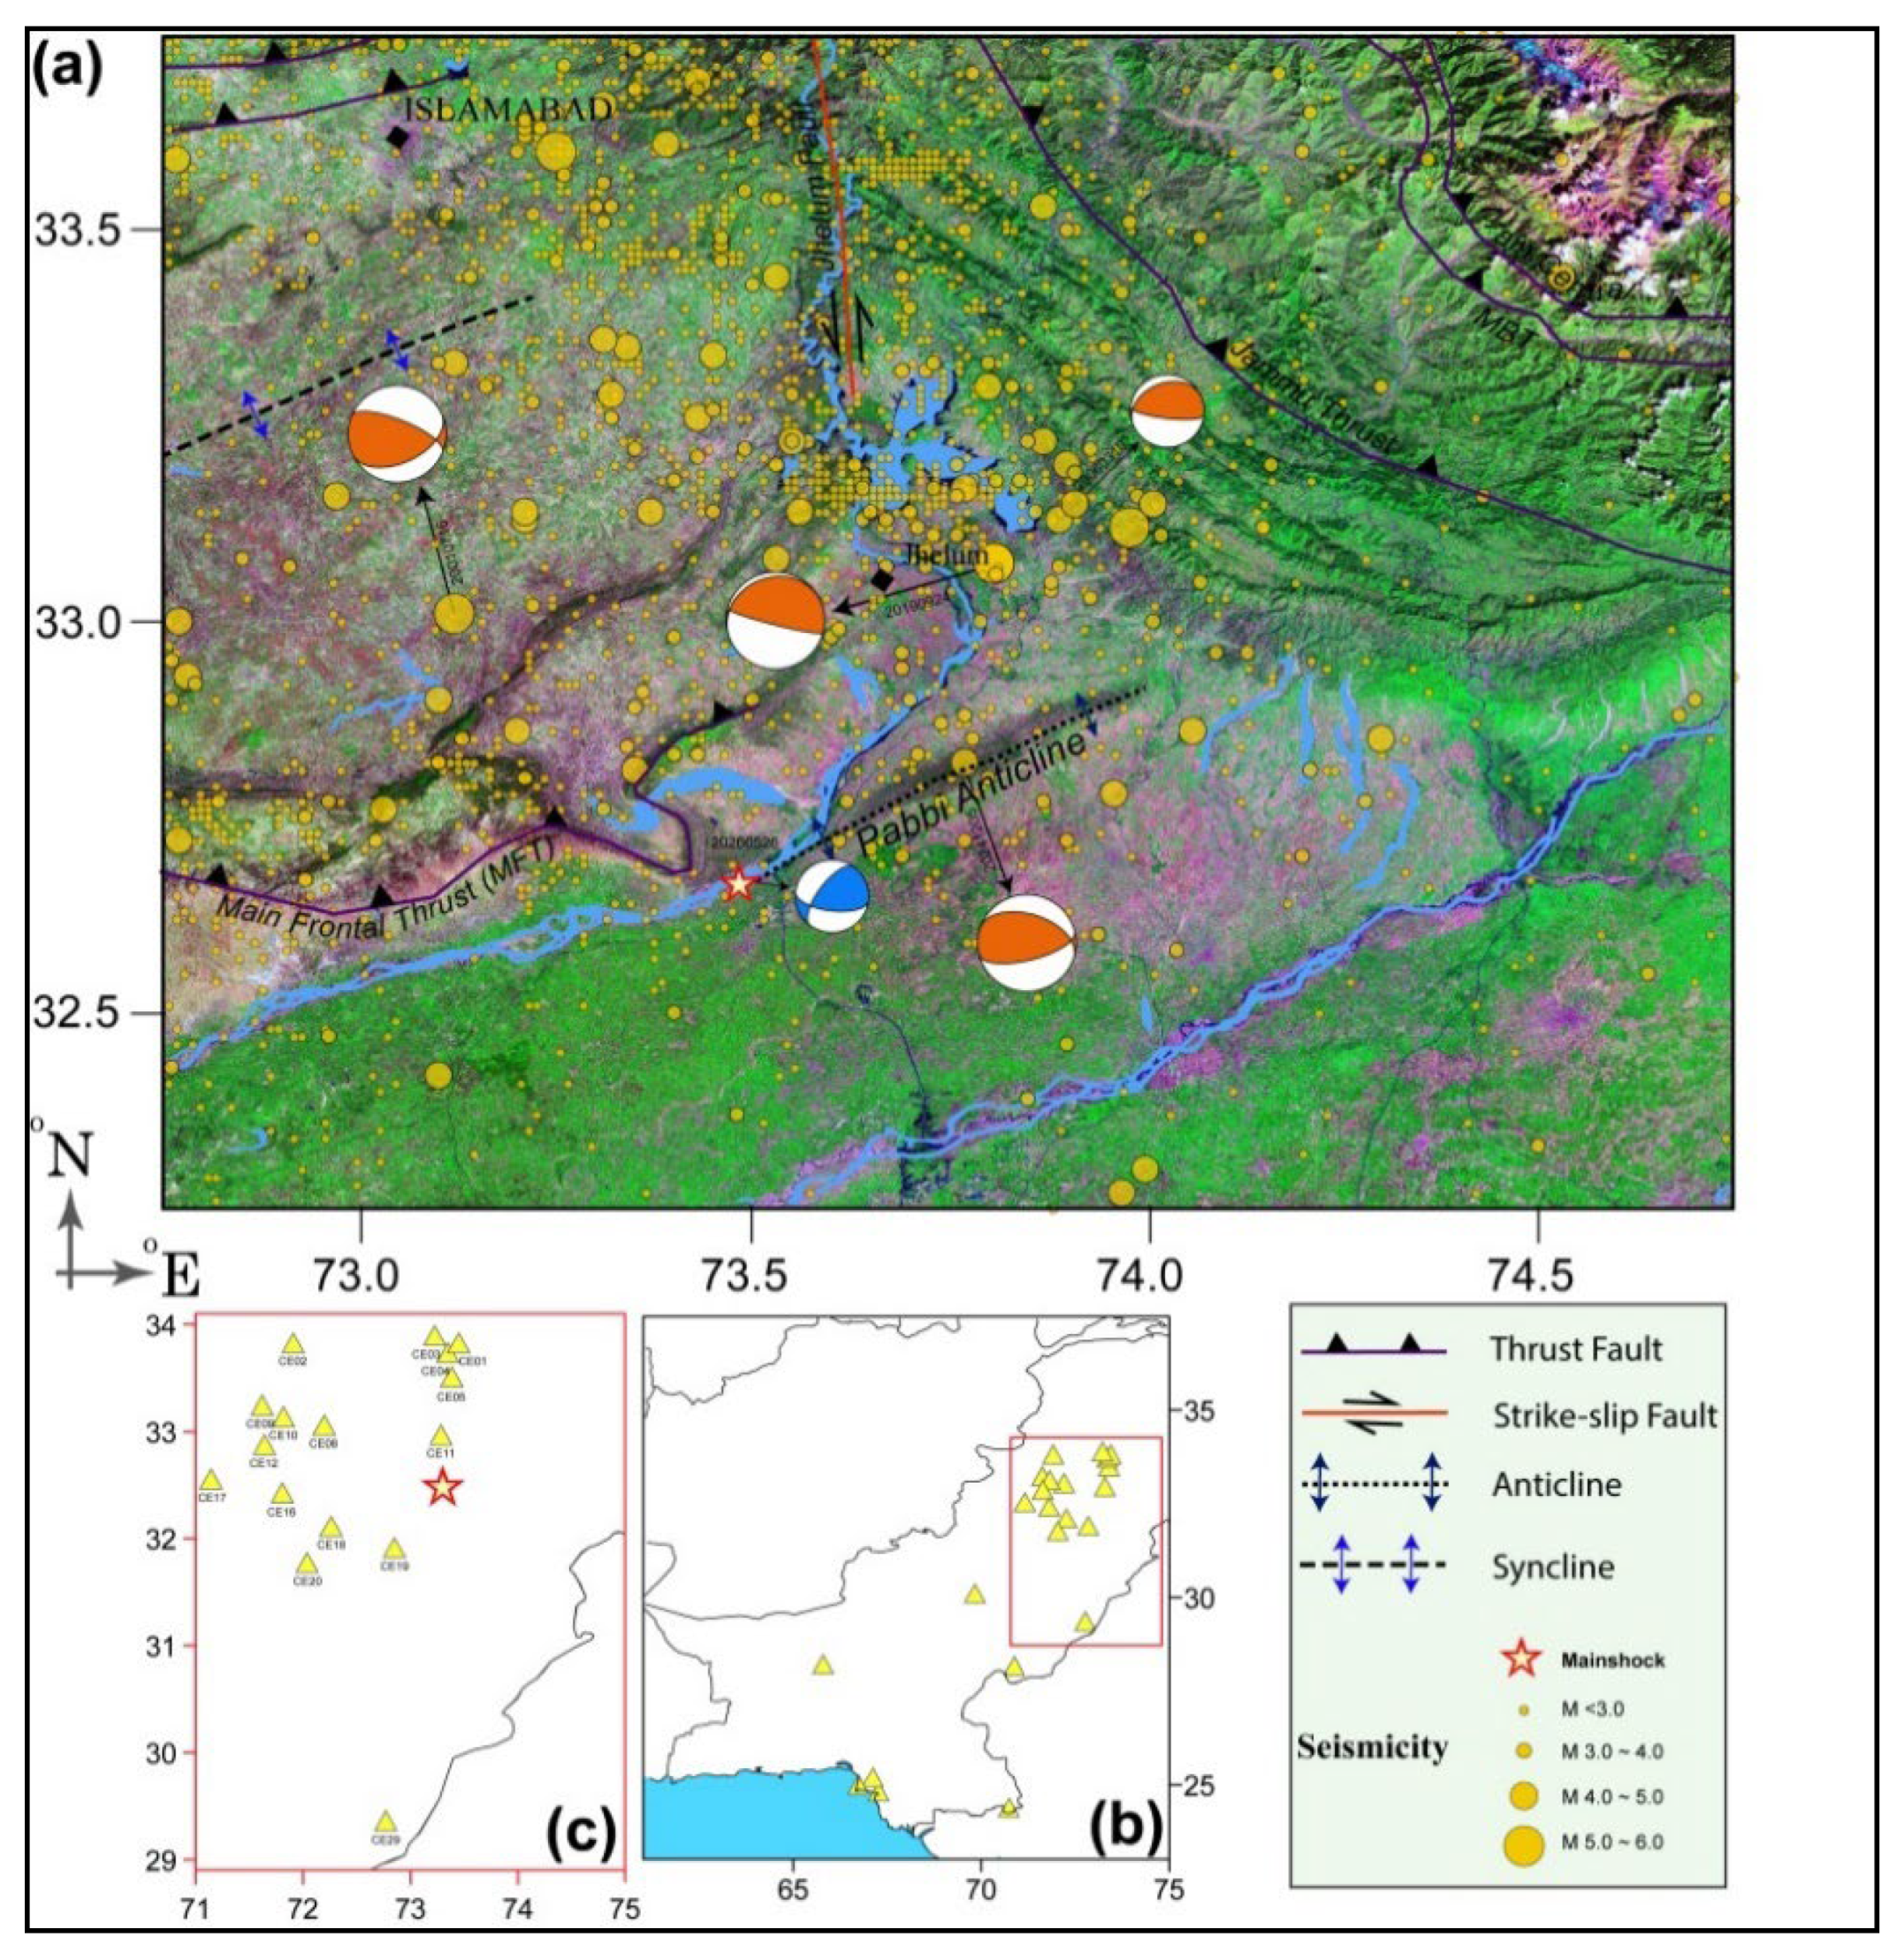
Figure 4.
Earthquake relocation and seismogenic depth characteristics of the Mirpur–Jalalpur Sharif region. (a) Frequency–depth distribution of relocated earthquakes obtained using a grid-search approach, in which the focal depth corresponding to the minimum RMS misfit was selected as the preferred solution for each event. The seismogenic layer is subdivided into upper (<15 km) and lower (>15 km) zones. Blue bars represent earthquakes occurring at depths shallower than 15 km, whereas red bars denote events deeper than 15 km. (b) Distribution of RMS residuals for the relocated earthquake catalog, illustrating the quality and stability of the relocation results. The majority of events exhibit low RMS values, indicating reliable hypocentral locations and depth estimates.
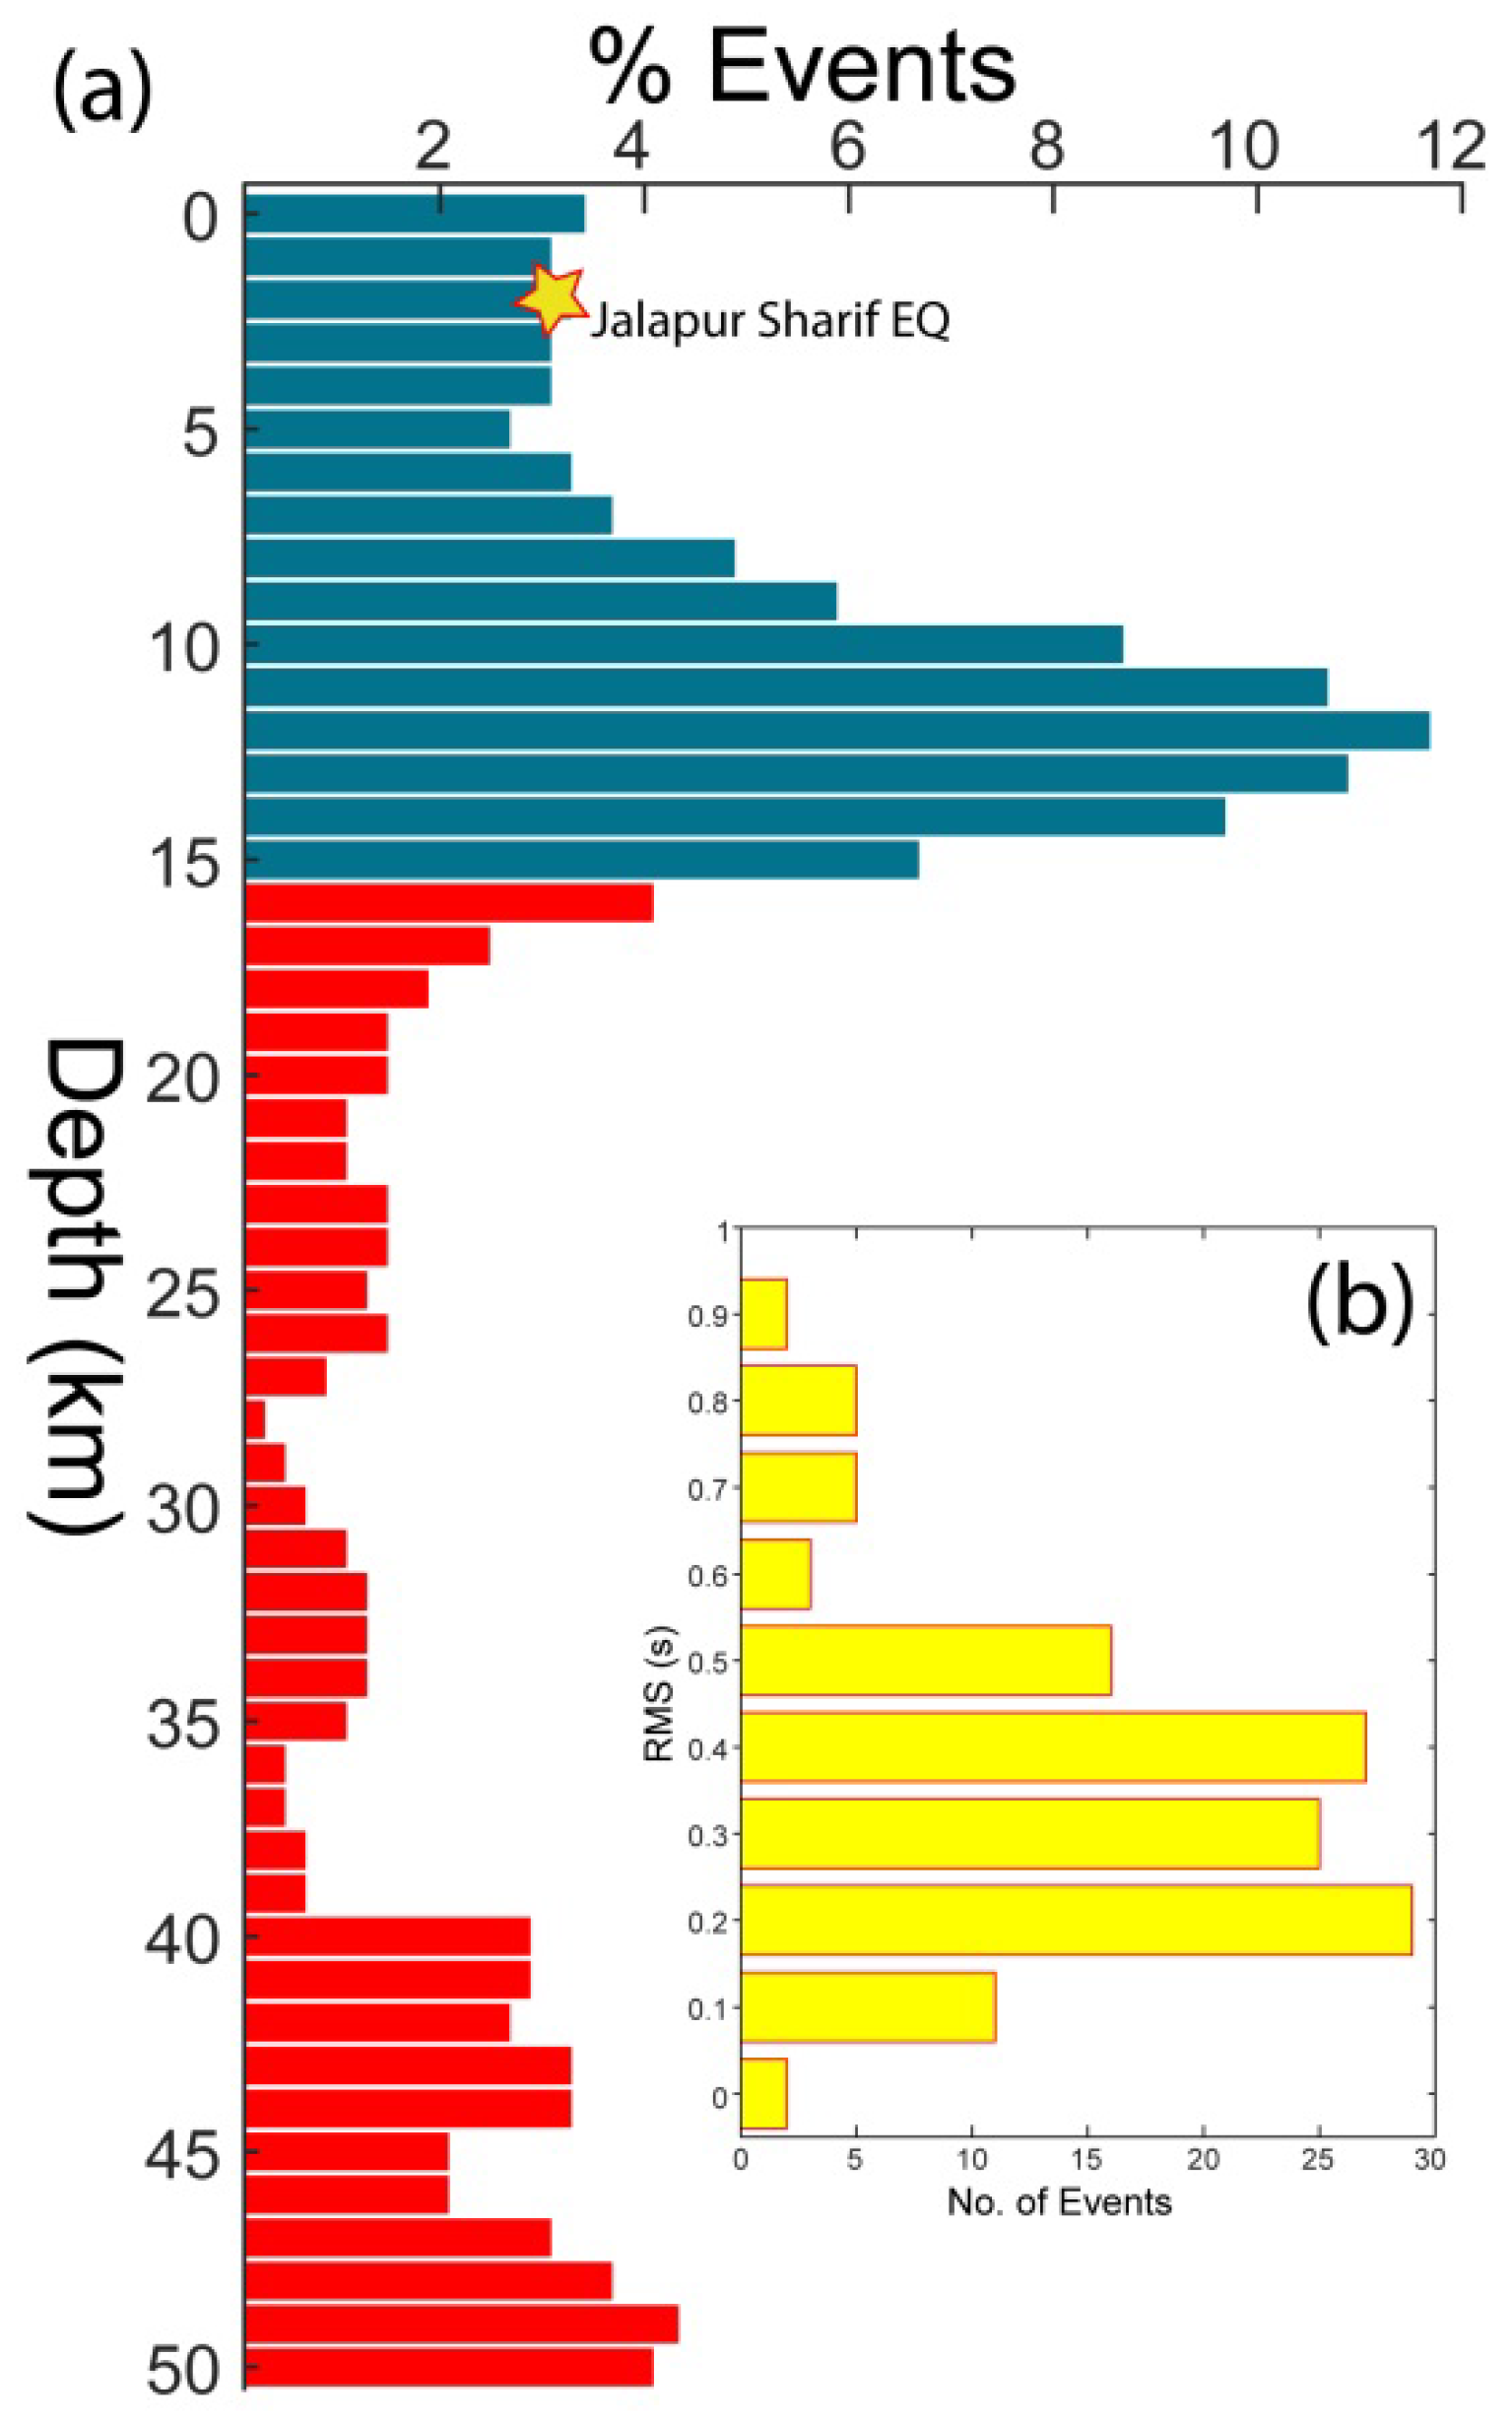
Figure 5.
Frequency–magnitude distribution and temporal seismicity characteristics of the Mirpur–Jalalpur Sharif region. (a) Gutenberg–Richter frequency–magnitude distribution of the seismic data. The vertical dashed line marks the magnitude of completeness (Mc), above which the catalog is considered complete and follows a linear Gutenberg–Richter relationship. (b) Daily seismicity rate before and after the 2019 Mirpur earthquake. The transient seismicity rate prior to the mainshock was approximately 0.03 events per day and increased to about 0.10 events per day. (c) Comparison of cumulative earthquake occurrence for regions north and south of 33°N latitude. Seismicity north of 33°N is dominated by the Mirpur aftershock sequence, whereas the southern zone is characterized by the occurrence of the 2024 Kharian and 2026 Jalalpur Sharif earthquakes. The Kharian–Jalalpur Sharif region remained relatively quiescent during the period of aftershock triggering following the Mirpur earthquake; however, a sustained increase in seismic activity has been observed since 2022, indicating progressive reactivation of faults within the area.
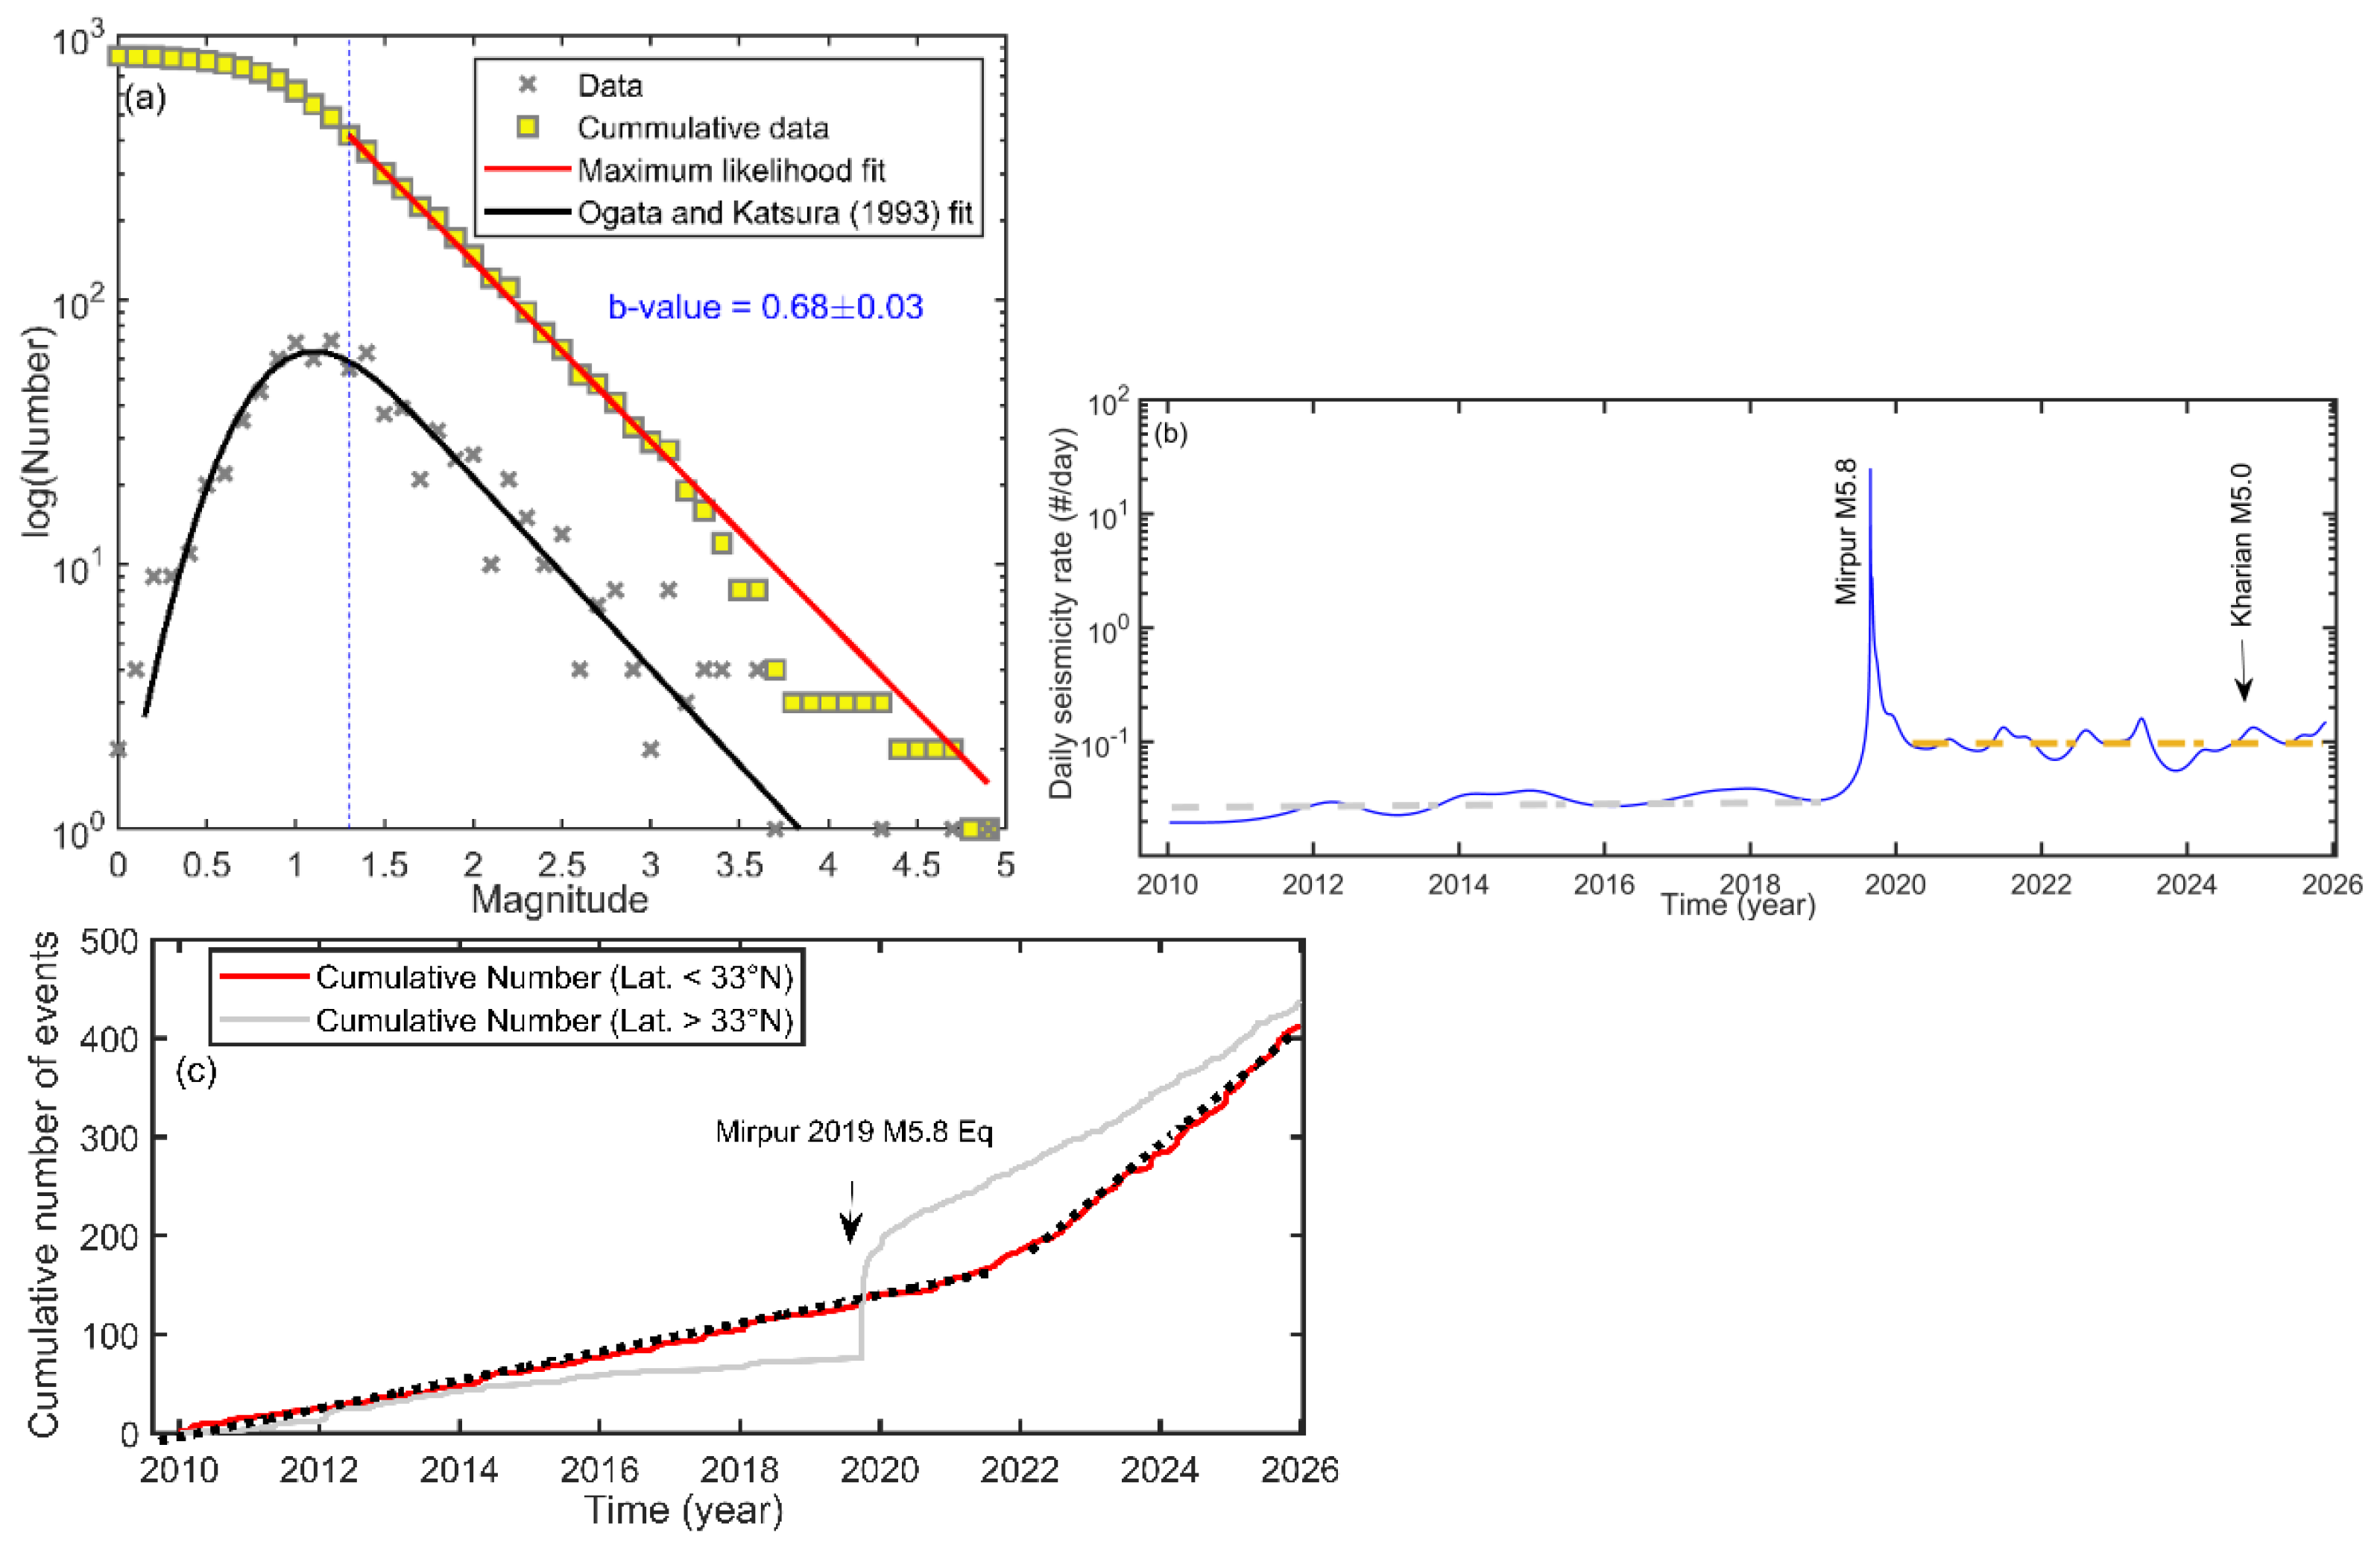
Figure 6.
Distribution of static Coulomb stress changes in the Jhelum–Mirpur region, together with focal mechanism solutions of recent earthquakes. Warm colors represent positive Coulomb stress changes, indicating stress loading and increased fault failure potential, whereas cool colors denote stress reduction. The 26 May 2026 Jalalpur Sharif earthquake (Mw 4.5), shown by the red star, is located within a zone of positive Coulomb stress change, suggesting that stress transfer from preceding earthquakes may have promoted fault instability in the epicentral area.
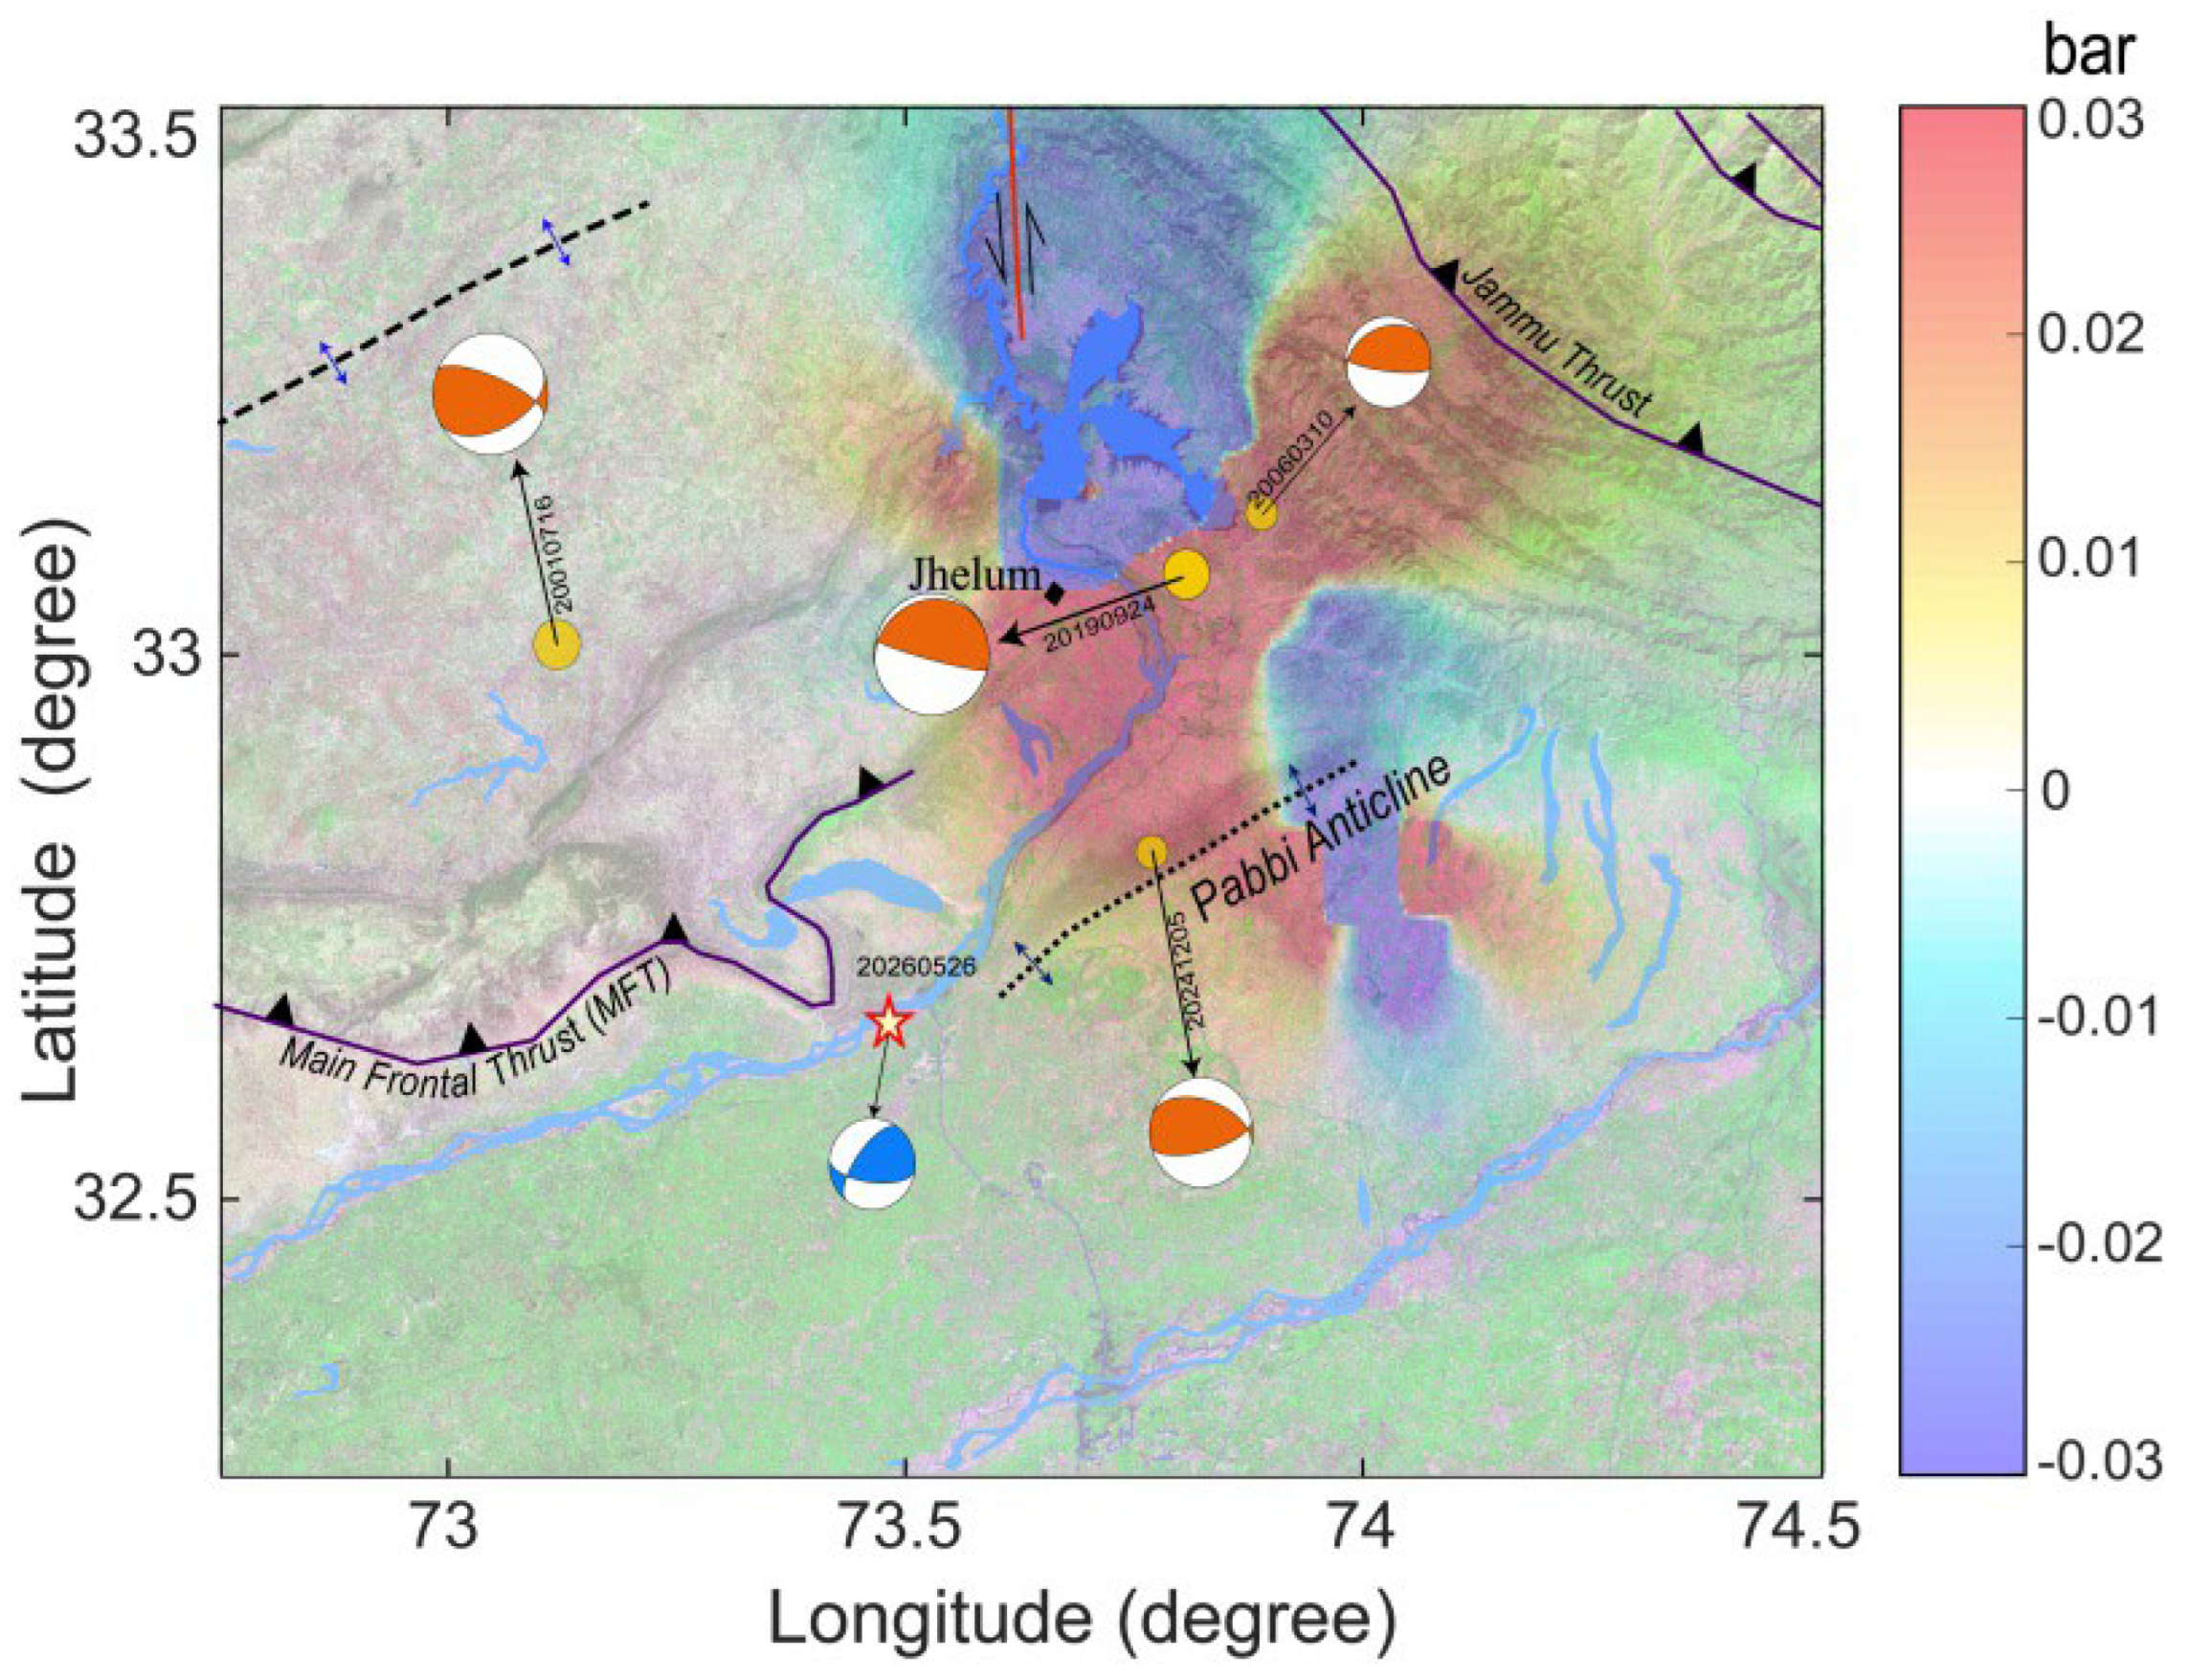
Figure 7.
Complete Bouguer Anomaly (CBA) map of the study area showing regional and residual gravity variations, along with focal mechanism solutions of the Jalalpur Sharif and Kharian earthquakes.
Figure 7.
Complete Bouguer Anomaly (CBA) map of the study area showing regional and residual gravity variations, along with focal mechanism solutions of the Jalalpur Sharif and Kharian earthquakes.
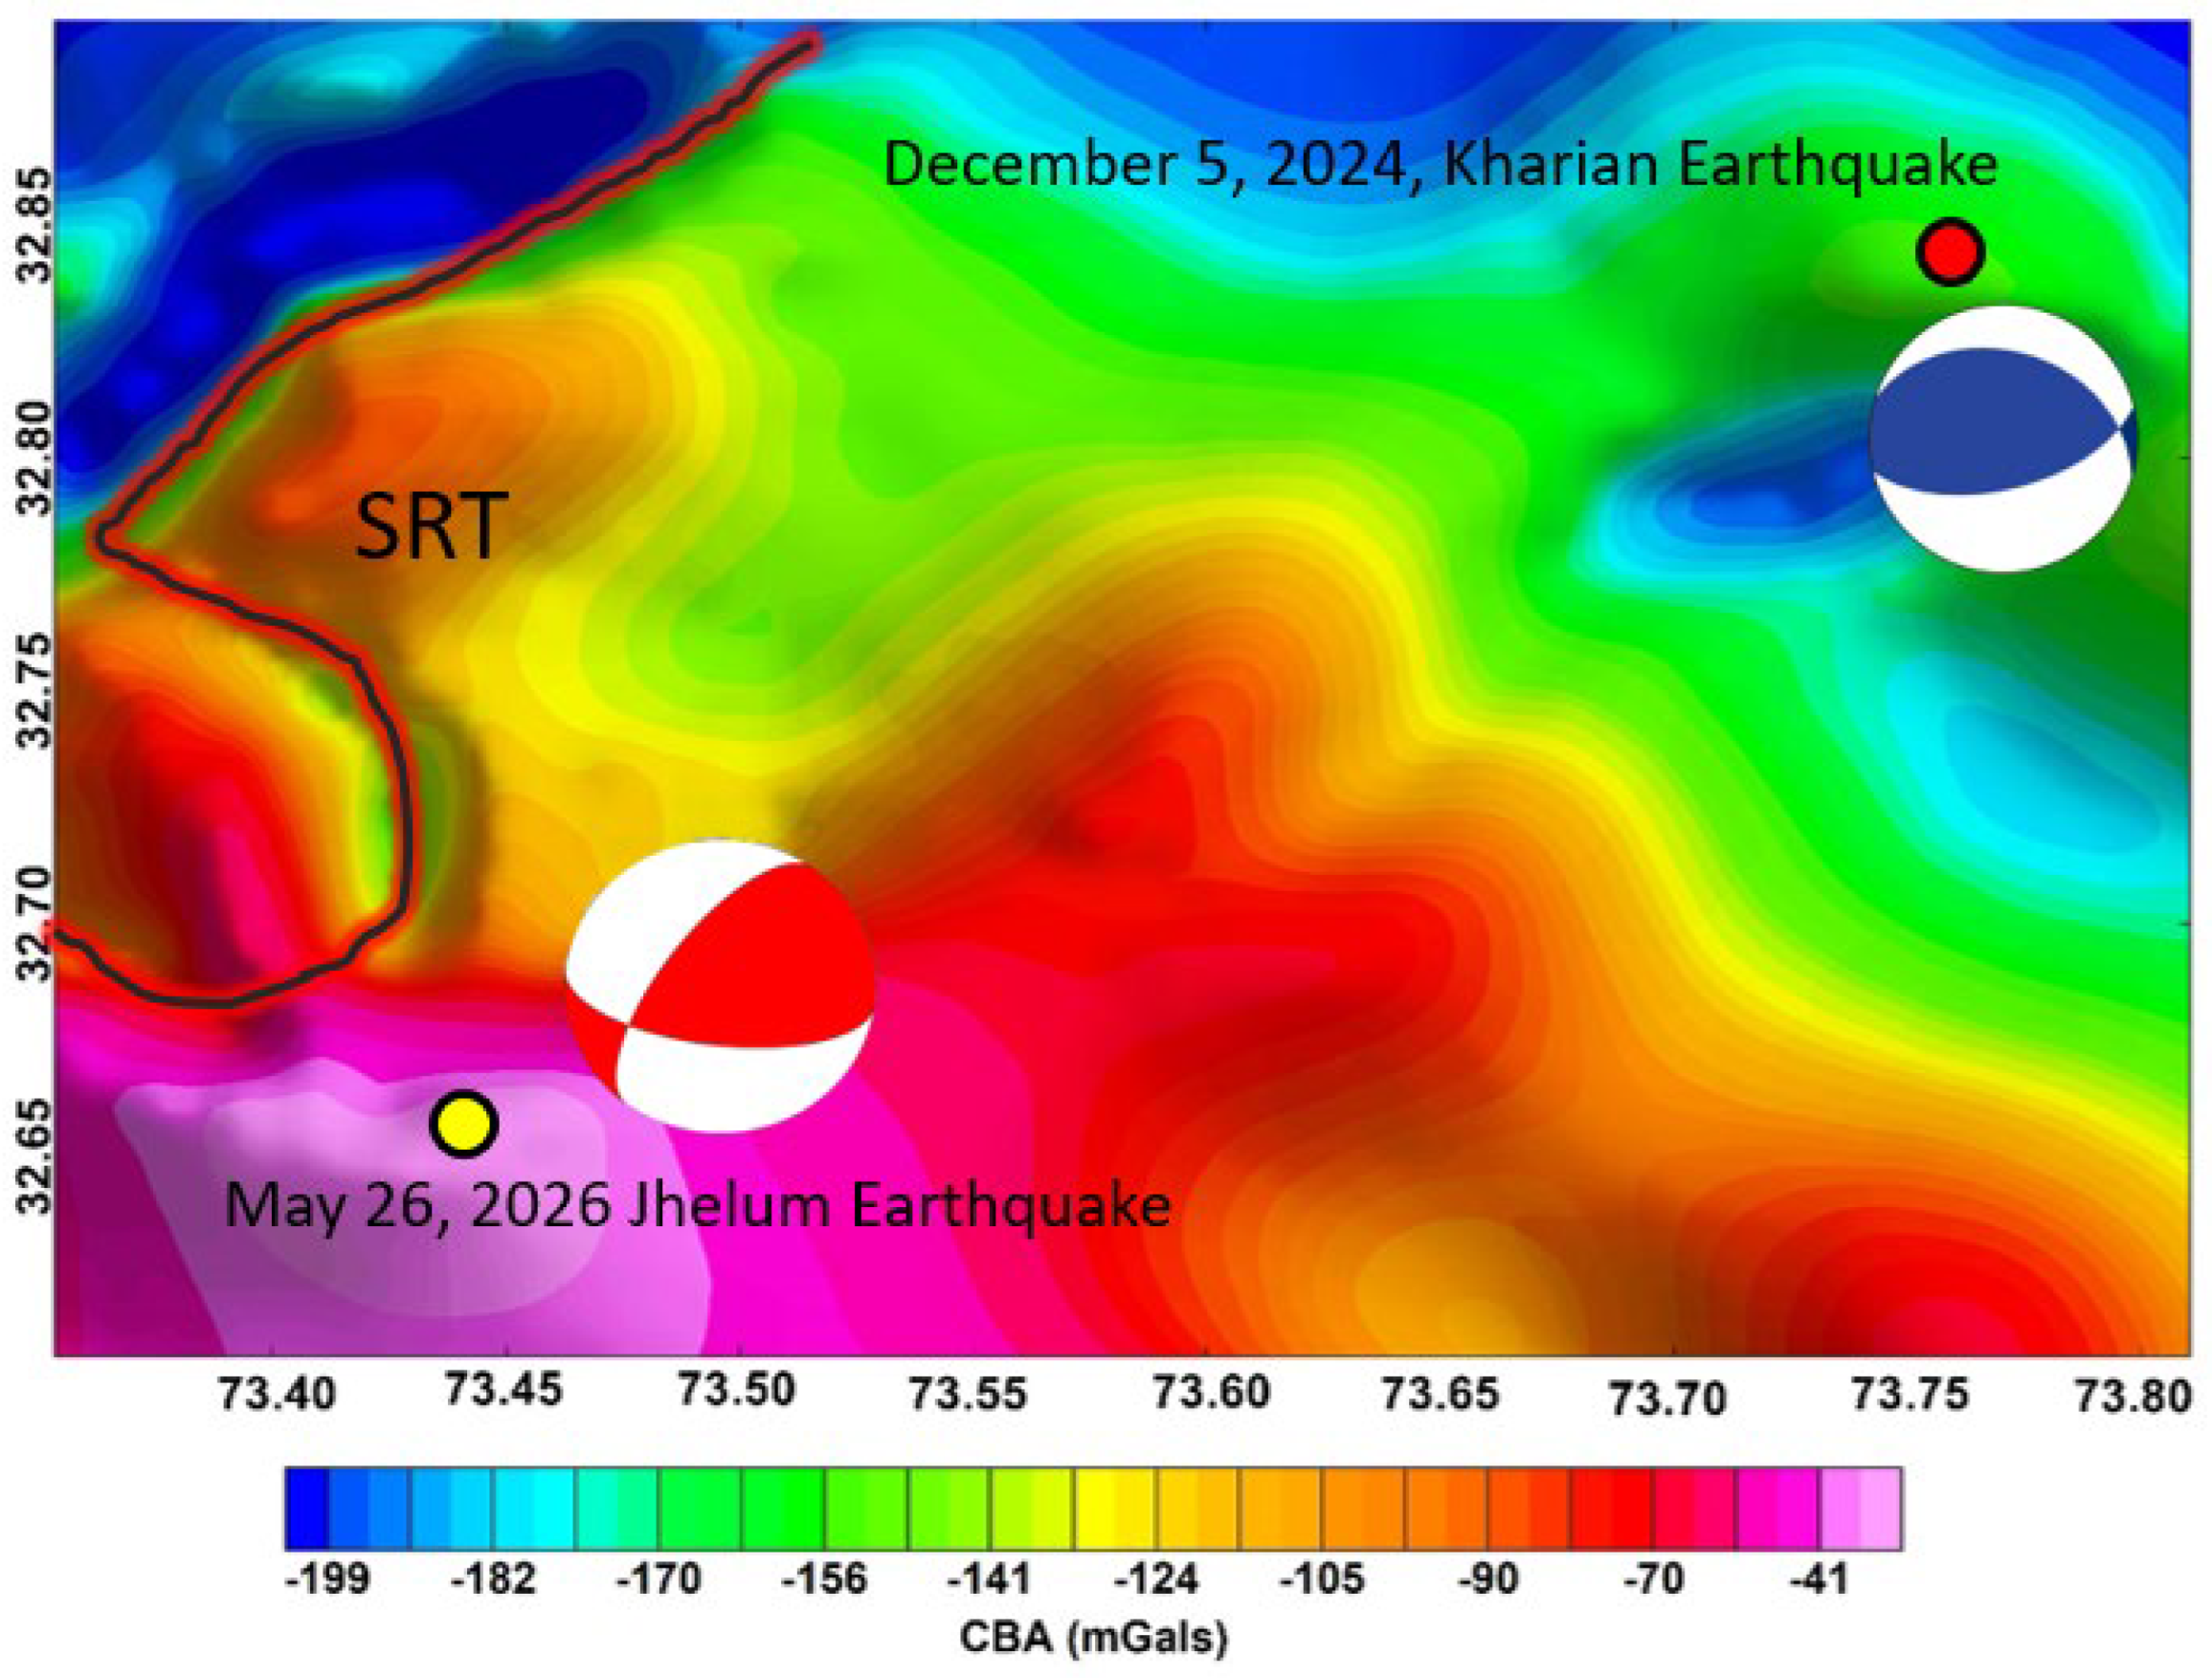
Figure 8.
Residual gravity anomalies (Response up to 2km) of the study area, with nearby Pabbi anticline (rectangle) can be marked by density contrast.
Figure 8.
Residual gravity anomalies (Response up to 2km) of the study area, with nearby Pabbi anticline (rectangle) can be marked by density contrast.
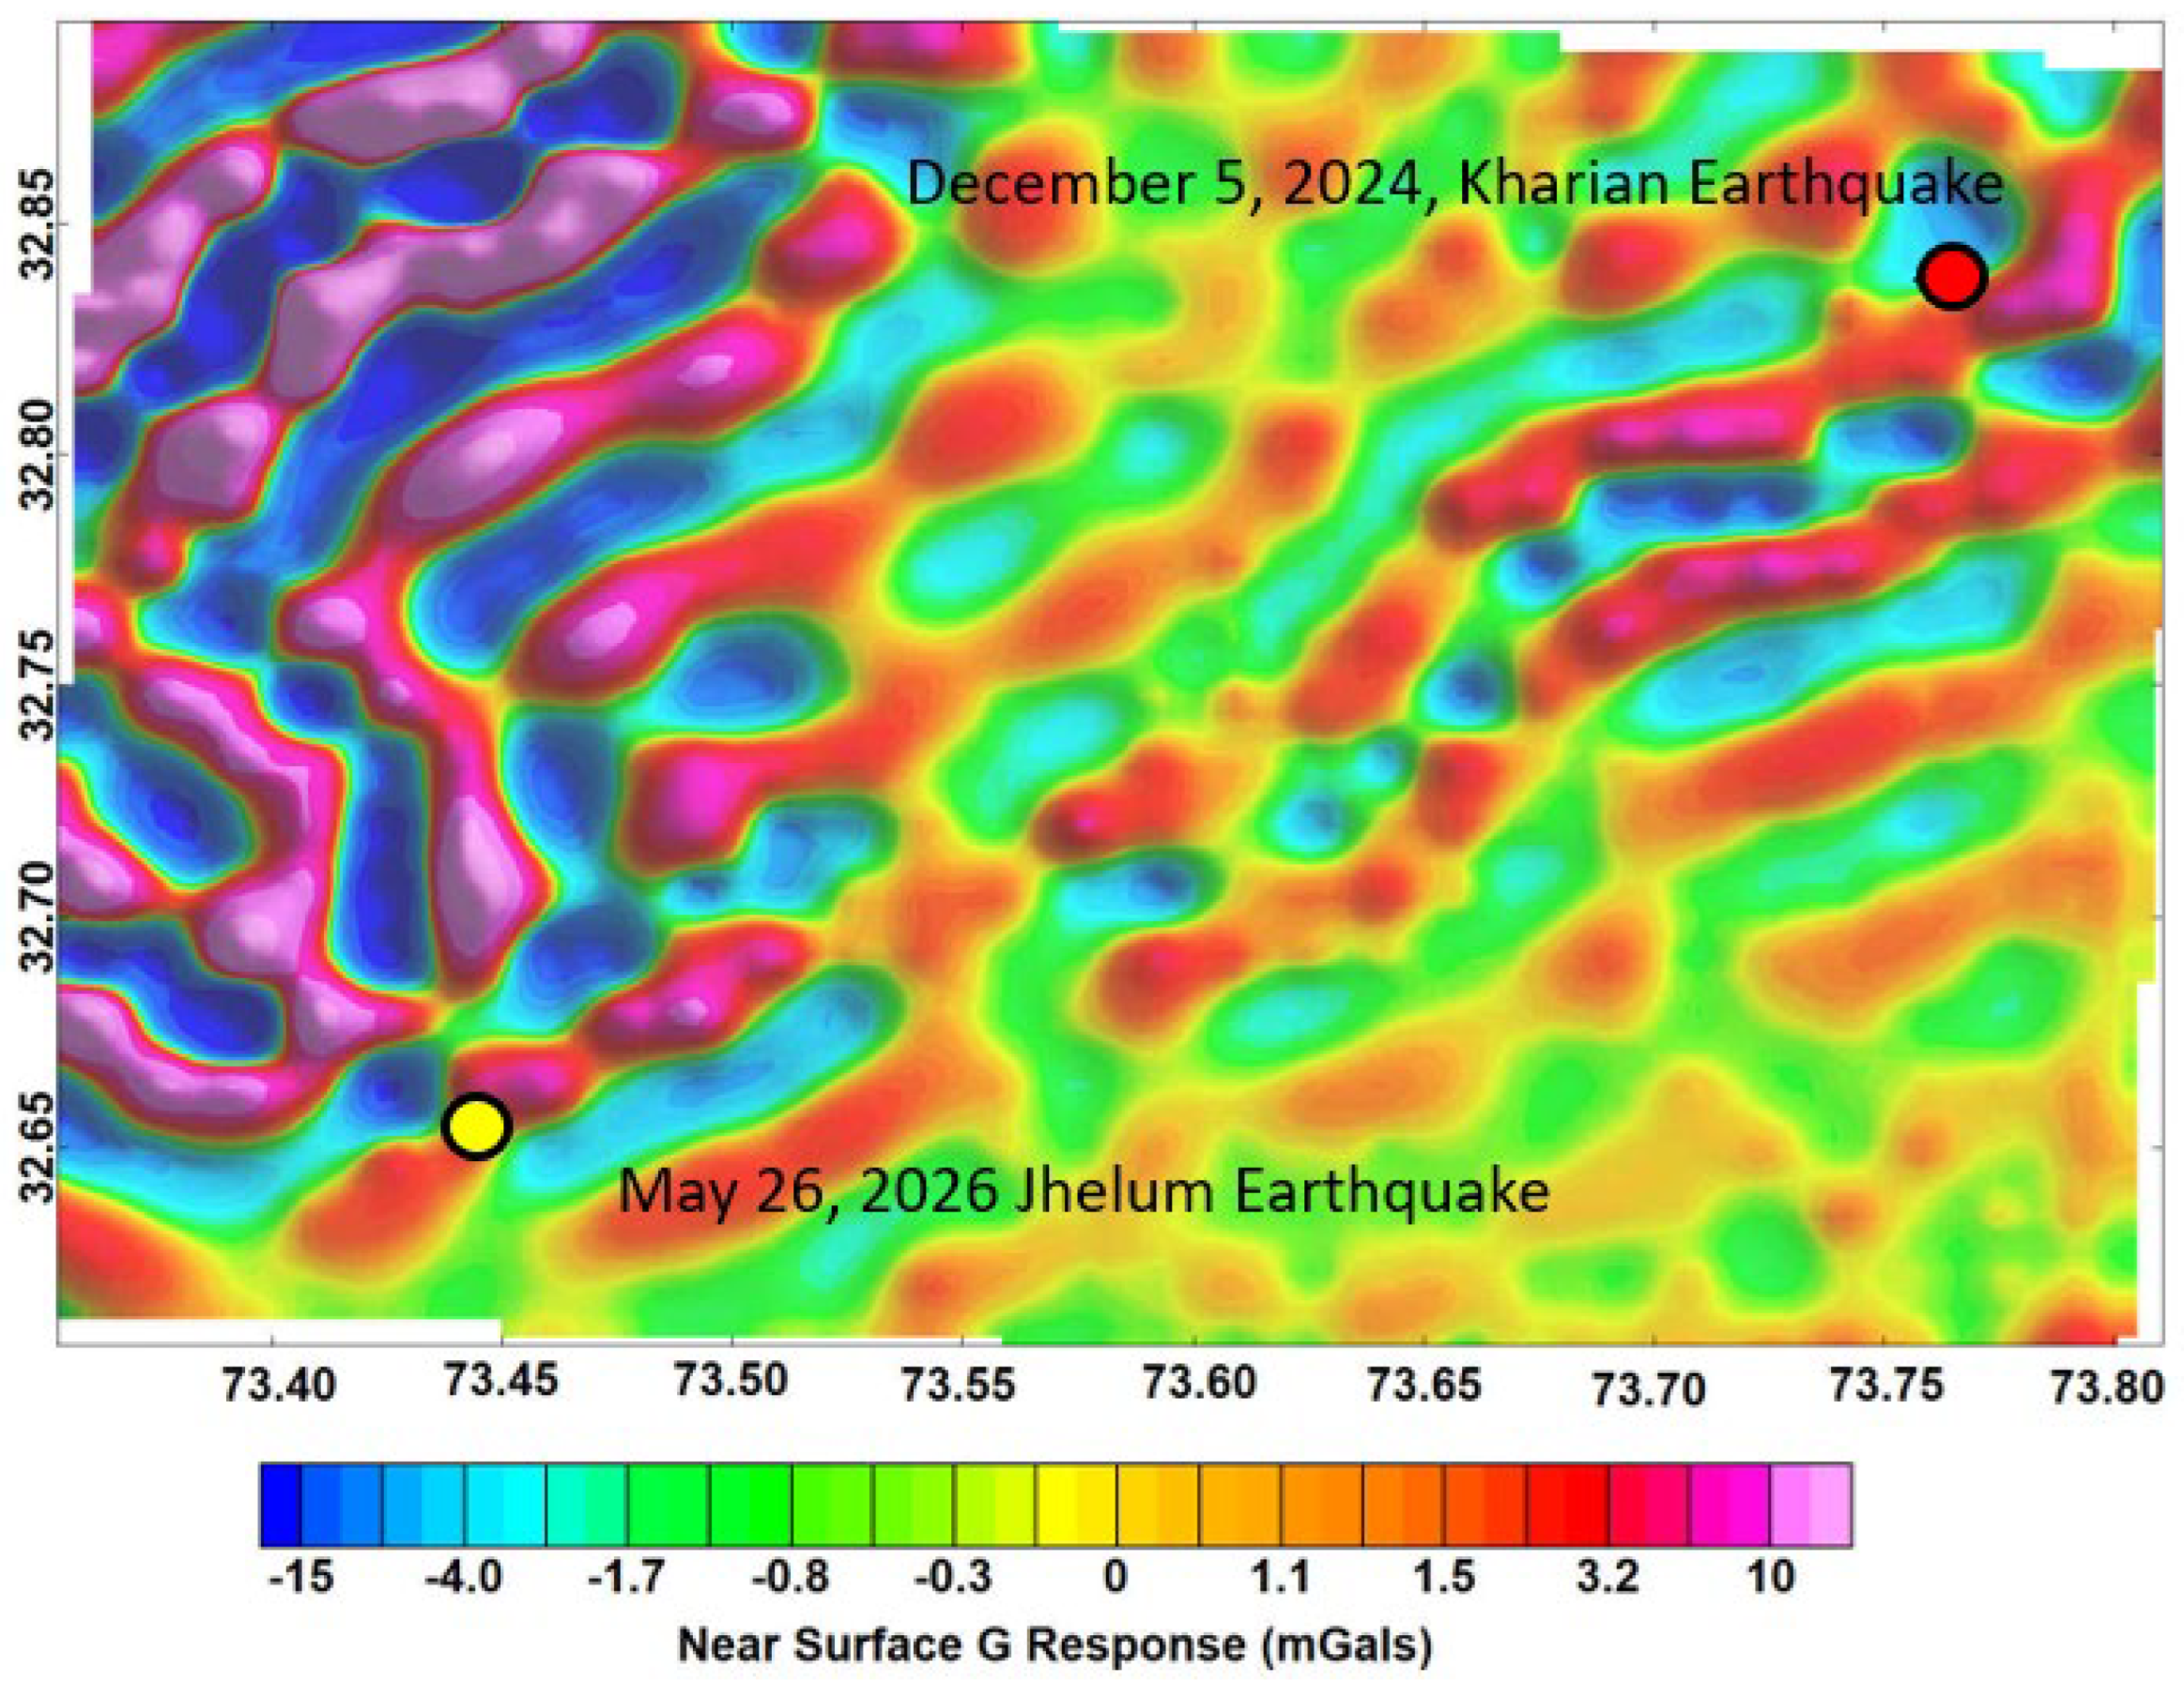
Figure 9.
Residual gravity anomalies (Response up to 2 to 3km) of the study area, depicting highly dense continued structure in region of two earthquakes.
Figure 9.
Residual gravity anomalies (Response up to 2 to 3km) of the study area, depicting highly dense continued structure in region of two earthquakes.
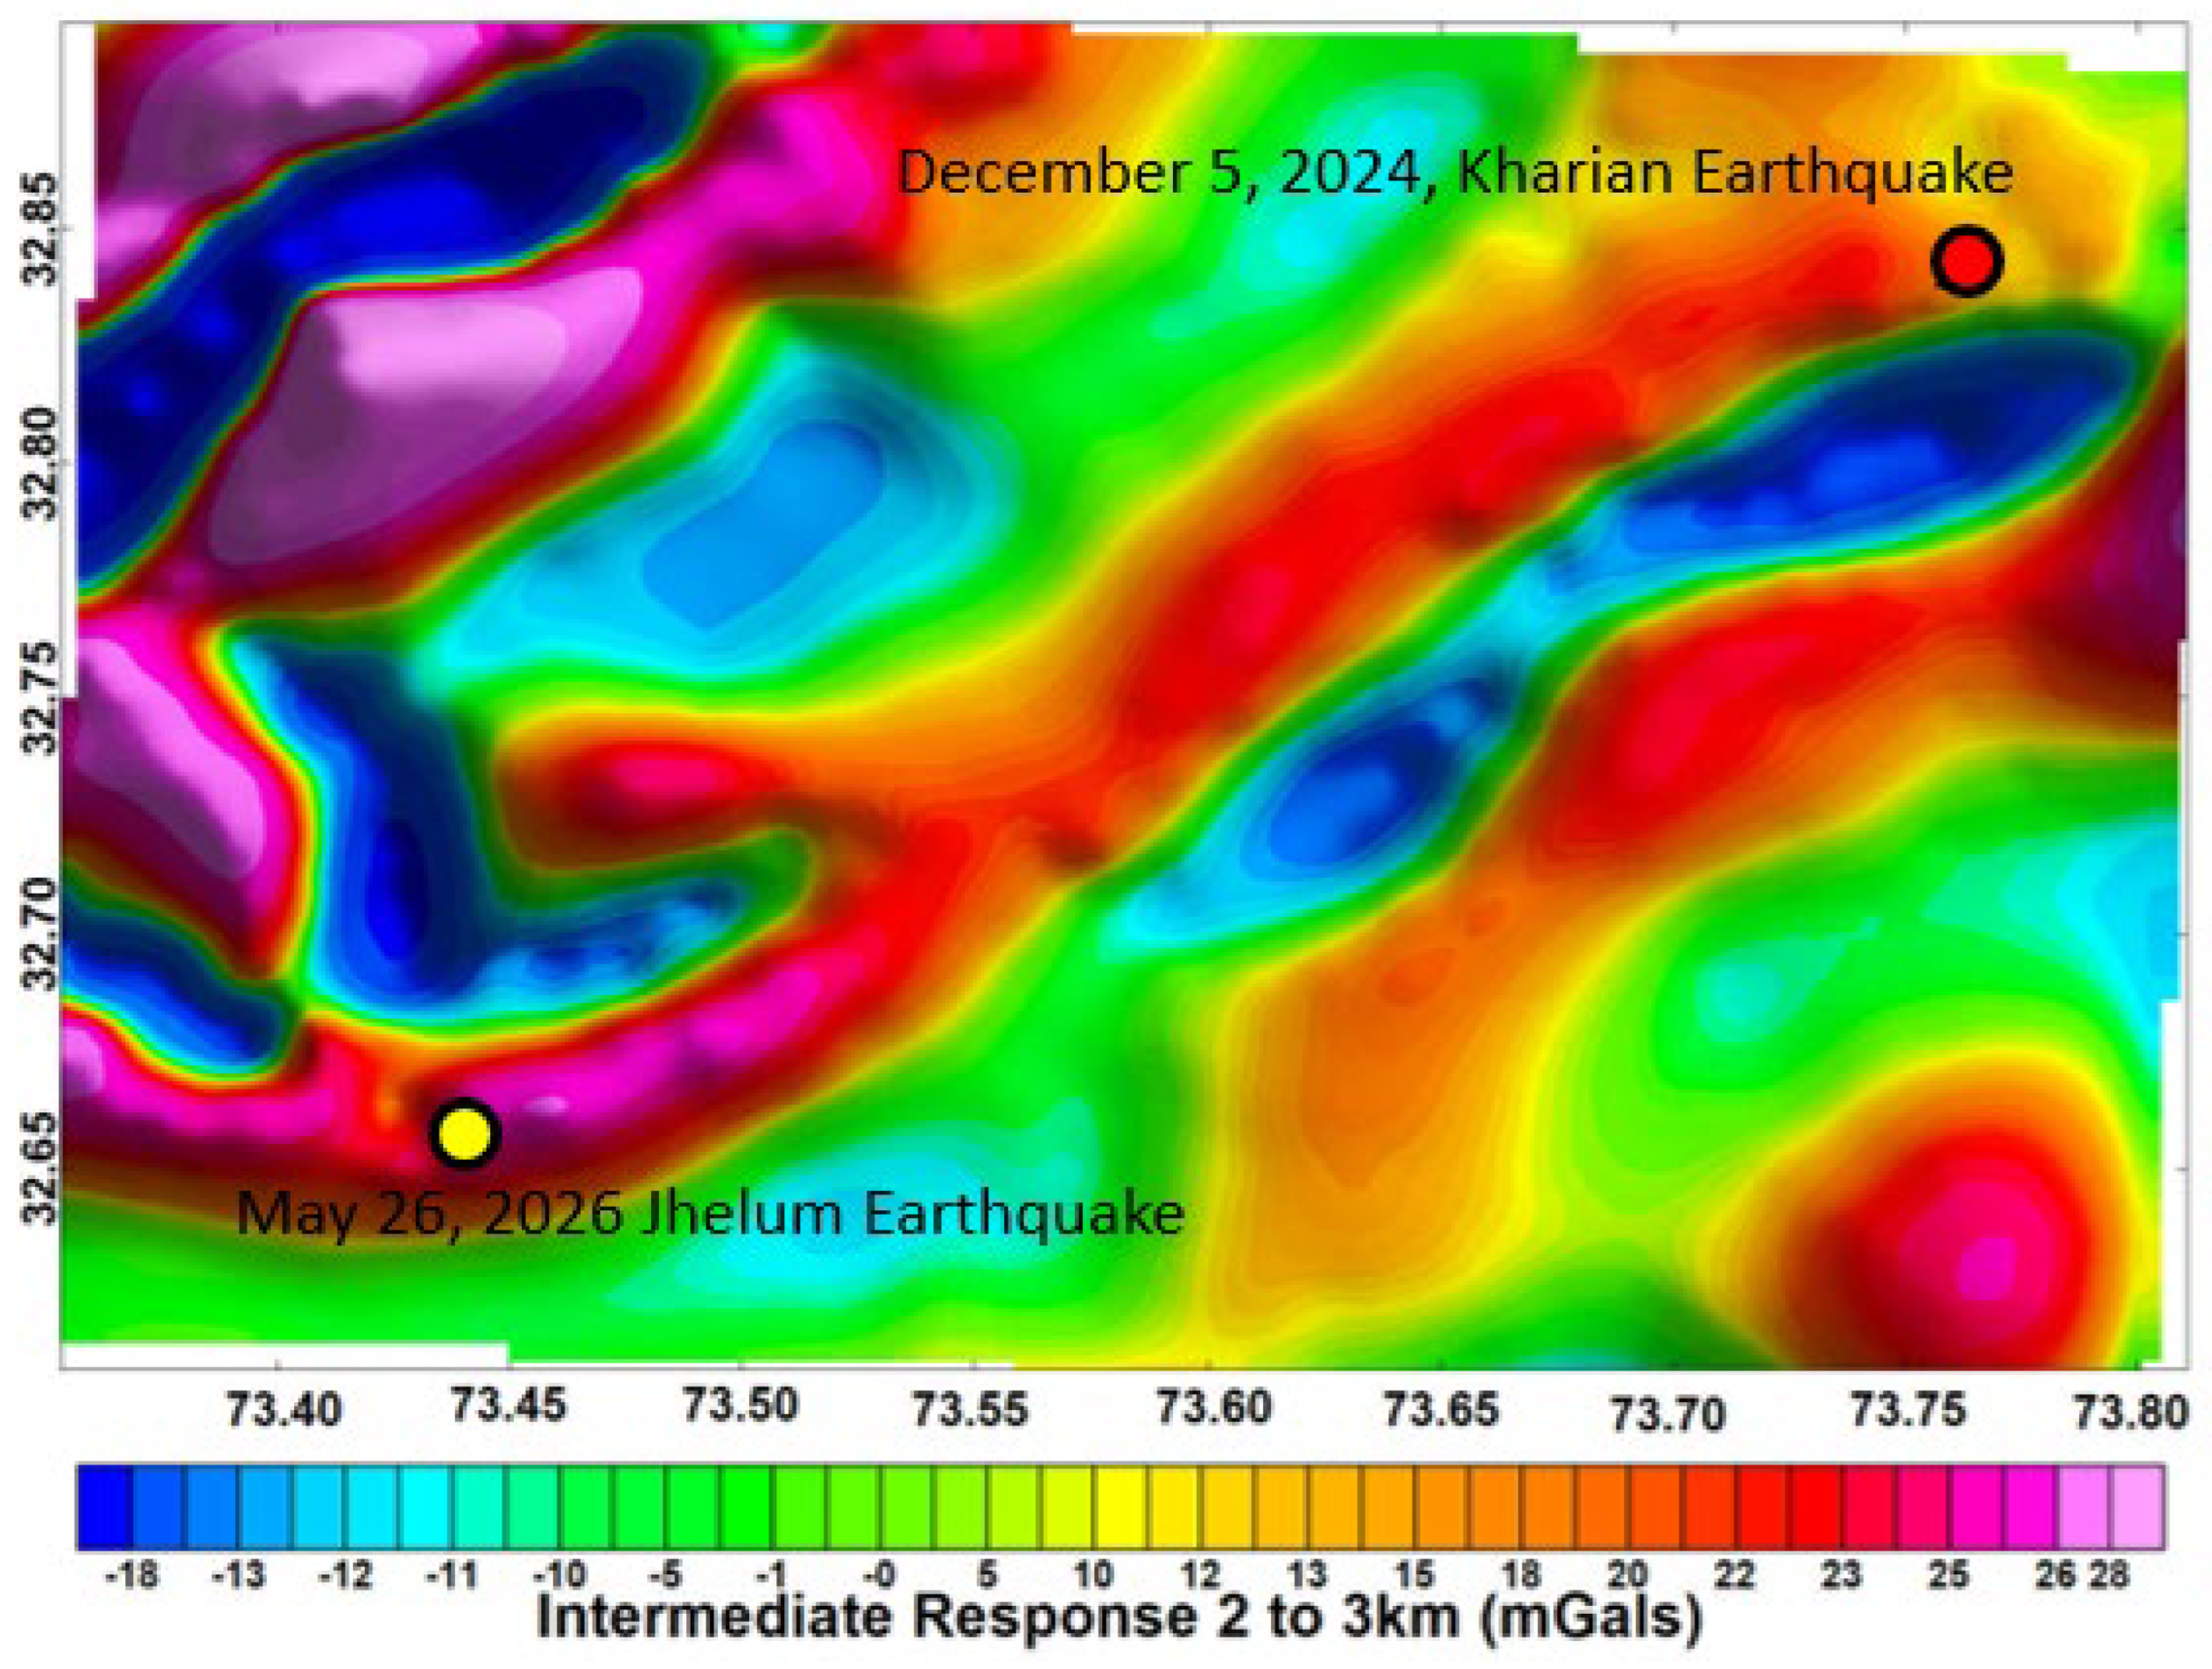
Figure 10.
Macroseismic intensity map of the Jalalpur Sharif earthquake derived from field surveys and damage observations. Intensity values were assigned based on observed structural damage and questionnaire responses following the Modified Mercalli Intensity (MMI) scale. The highest intensity was recorded in the Jalalpur Sharif area, where the zone of maximum damage covered approximately 4.5 km². Warmer colors indicate higher intensity levels, whereas lighter colors represent lower intensity levels.
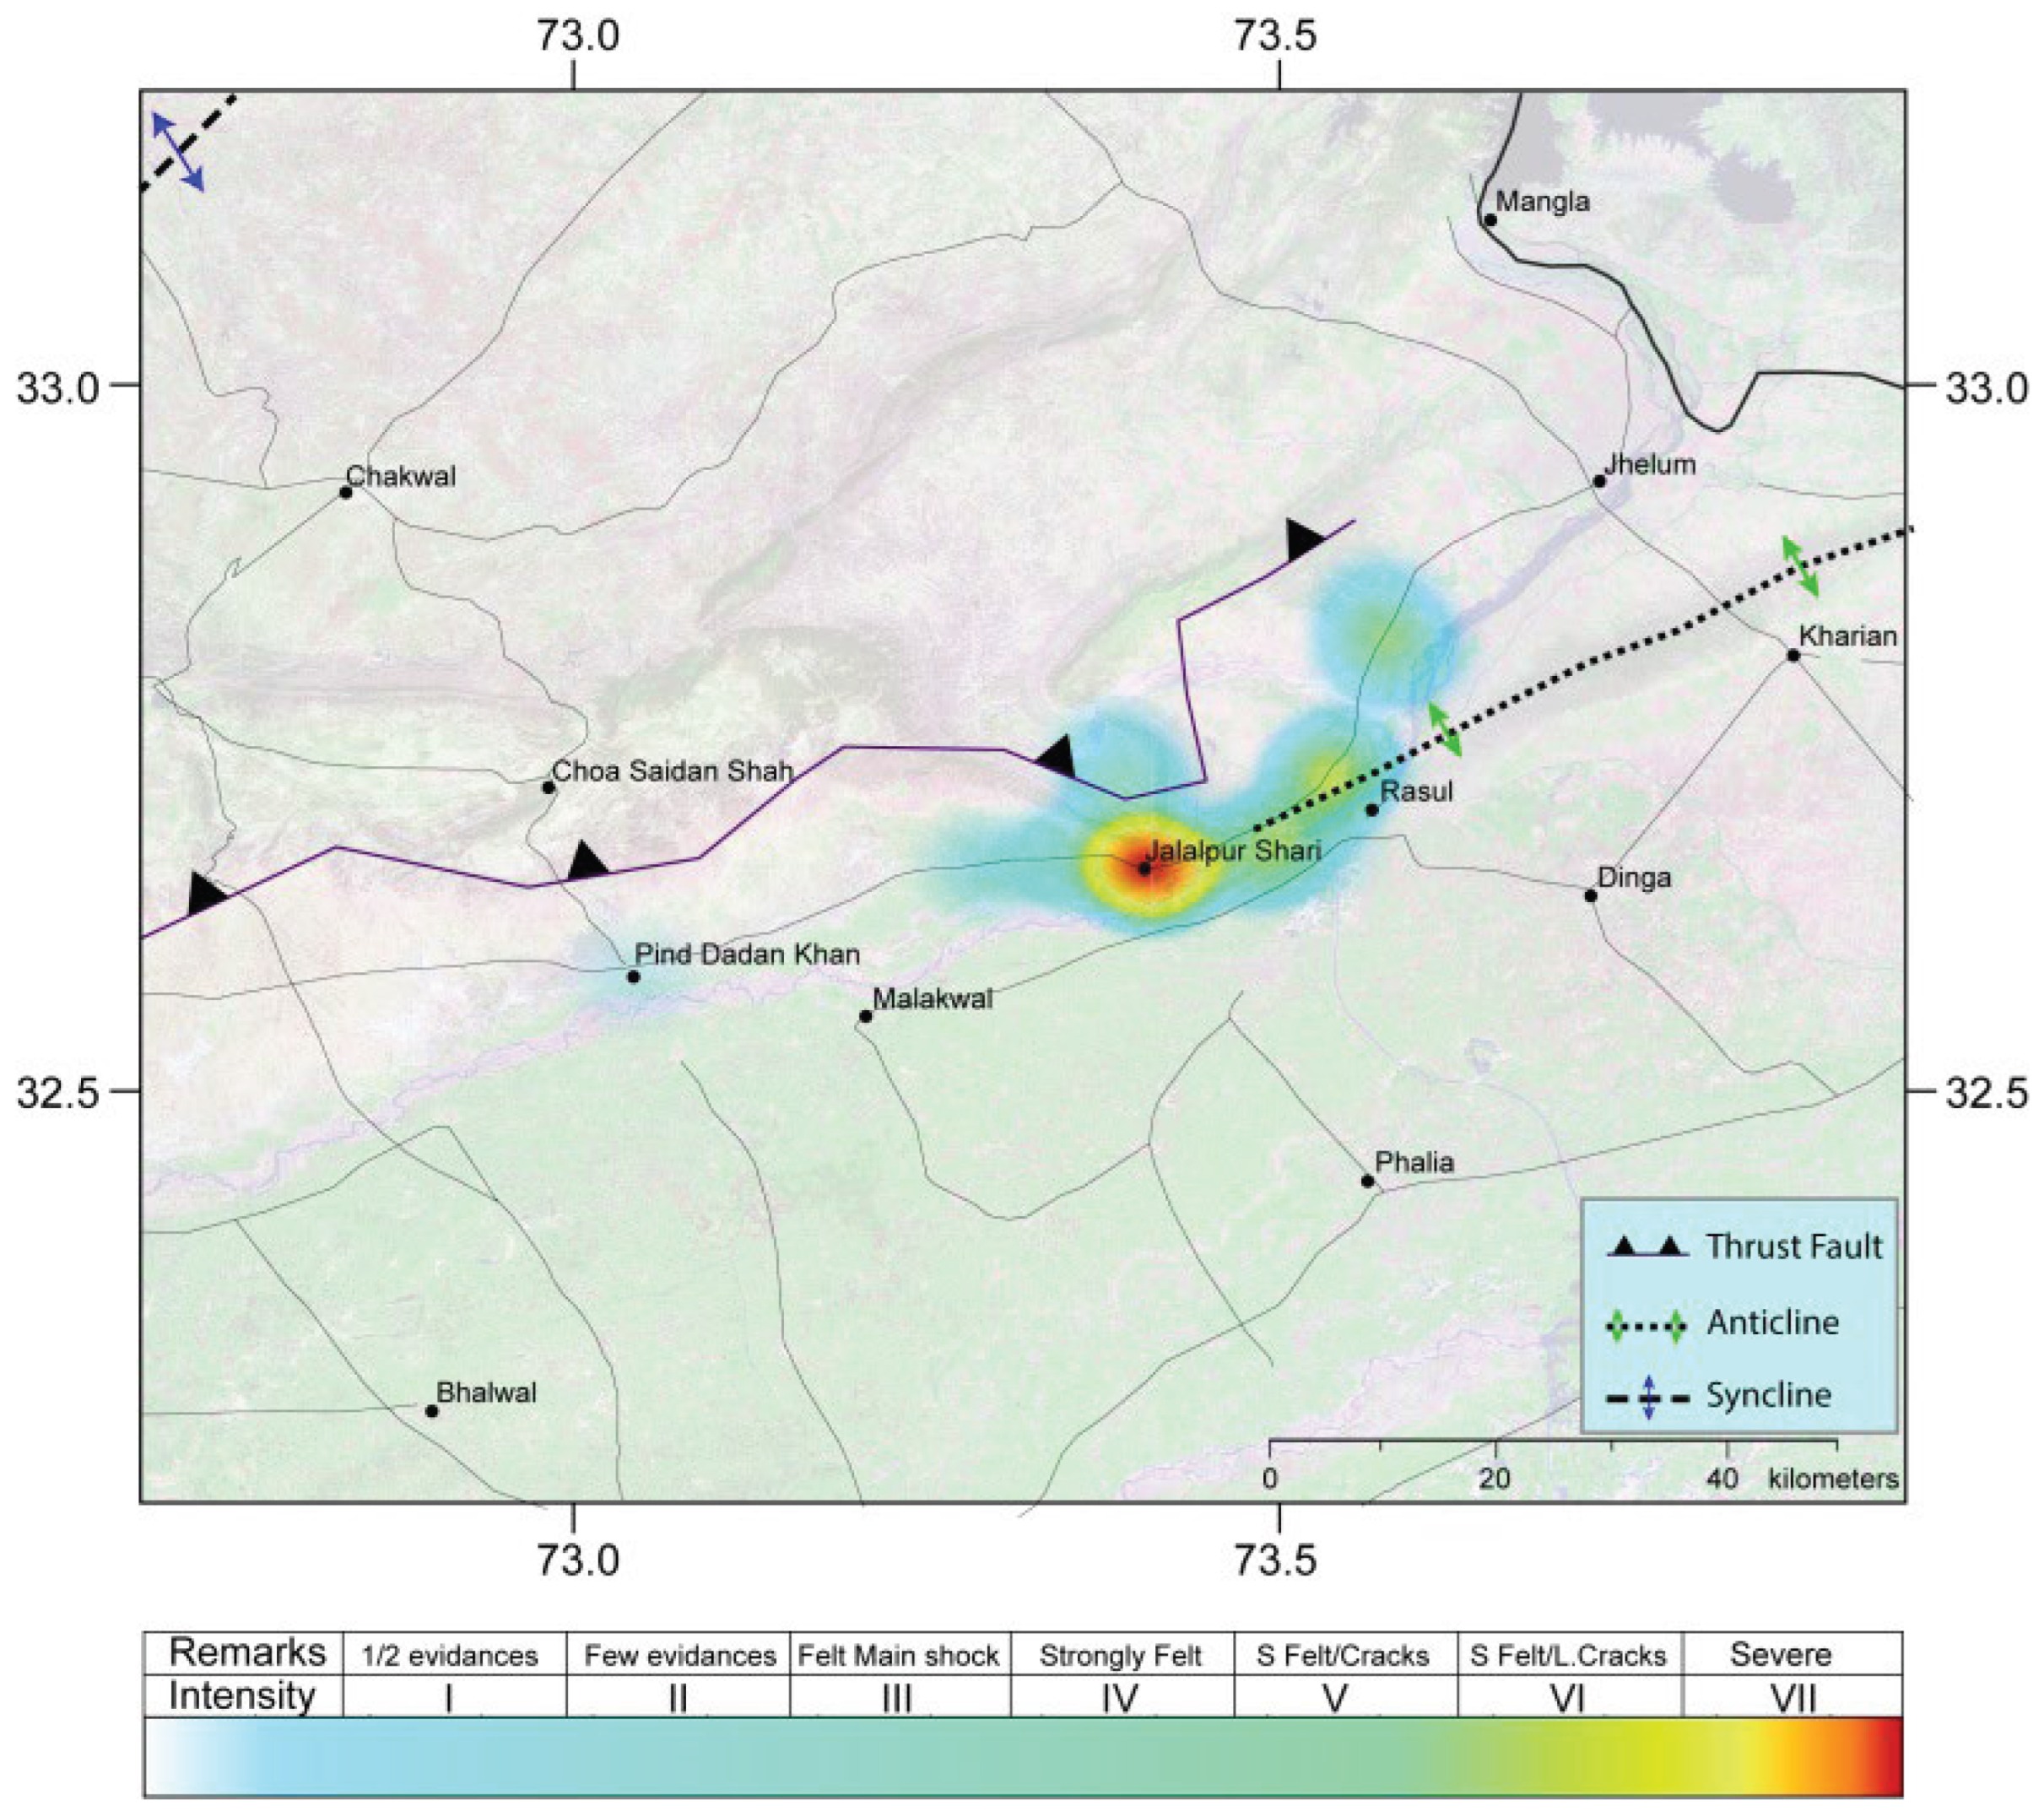

Table 1.
Source parameters and faulting styles of earthquakes with magnitudes greater than 4.5 that occurred in the Mirpur–Jalalpur Sharif region. Events 1–3 are obtained from the Global CMT catalog, whereas Event 4 is taken from [7]. Event 5 represents the 26 May 2026 Jalalpur Sharif earthquake, for which source parameters were determined through moment tensor inversion of local seismic waveform data. Abbreviations: yyyy=year, mn=month, dy=day, hr=hour, and min=minute; Lat.=latitude; Long.=longitude; Dept.=focal depth; Str.=strike; Vr=variance reduction; CN=condition number; DC=double-couple component; CLVD=compensated linear vector dipole.
| No | Time (yyyymndy hr:min) |
Location | Dep. (km) |
Mw | Plane 1 (Degree) | Plane 2 (Degree) | Vr | CN | DC (%) |
CLVD (%) |
|||||
|---|---|---|---|---|---|---|---|---|---|---|---|---|---|---|---|
| Lat. | Long. | Str | Dip | Rake | Str | Dip | Rake | ||||||||
| 1 | 20010716 07:18 |
33.01º | 73.12º | 50.5 | 5.1 | 65 | 36 | 49 | 292 | 64 | 116 | - | - | - | - |
| 2 | 20060310 07:50 |
33.13º | 73.89º | 10 | 4.9 | 246 | 21 | 61 | 96 | 71 | 101 | - | - | - | - |
| 3 | 20190924 11:01 |
33.08º | 73.80º | 10 | 5.8 | 246 | 10 | 52 | 105 | 82 | 96 | - | - | - | - |
| 4 | 20241205 06:21 |
32.80º | 73.94º | 03 | 5.0 | 76 | 58 | 72 | 286 | 36 | 116 | - | - | - | |
| 5 | 20260526 14:05 |
32.66º | 73.45 | 03 | 4.5 | 97 | 54 | 136 | 217 | 55 | 46 | 0.35 | 3.7 | 98.4 | 1.6 |
Disclaimer/Publisher’s Note: The statements, opinions and data contained in all publications are solely those of the individual author(s) and contributor(s) and not of MDPI and/or the editor(s). MDPI and/or the editor(s) disclaim responsibility for any injury to people or property resulting from any ideas, methods, instructions or products referred to in the content. |
© 2026 by the authors. Licensee MDPI, Basel, Switzerland. This article is an open access article distributed under the terms and conditions of the Creative Commons Attribution (CC BY) license (http://creativecommons.org/licenses/by/4.0/).
Copyright: This open access article is published under a Creative Commons CC BY 4.0 license, which permit the free download, distribution, and reuse, provided that the author and preprint are cited in any reuse.