

Submitted:
12 September 2026
Posted:
16 September 2026
You are already at the latest version
Abstract
Italy grants registered innovative start-ups fee exemptions, investor tax relief and guaranteed credit, and removes that status sixty months after incorporation. This paper asks whether certification changes firms’ markups. Markups are estimated from a translog production function on 76,466 firm-years of certified start-ups, certified innovative SMEs and ordinary SMEs over 2015–2024. Certified firms price about 12 per cent below ordinary SMEs, but within firms the gap shrinks to 2 per cent and vanishes once persistence is modelled: registration selects firms rather than changing their pricing. Exploiting the statutory expiry, and a 2020 extension that shifted it by one year for adjacent cohorts, the loss of status leaves markups unchanged on average (2SLS −0.005, first-stage F = 750). An unsupervised partition shows this null combines falls of five to six per cent in capital- and materials-intensive firms with none elsewhere; regression learners and double machine learning confirm the central estimates.
Keywords:
markups
; innovative start-ups
; start-up act
; production function
; machine learning
1. Introduction
Governments increasingly single out young innovative firms for special treatment. Italy’s Decree-law 179/2012 grants registered innovative start-ups fee exemptions, tax relief for investors, guaranteed credit and derogations from labour and insolvency rules, and removes that status sixty months after incorporation. A decade of evaluation has shown that the regime changes how these firms are financed and staffed (Giraudo et al., 2019; Manaresi et al., 2021; Biancalani et al., 2022; Ferrucci et al., 2021). What the regime does to the prices firms charge has not been asked.
The question matters for two reasons. Cost relief can be passed on to customers, invested, or retained as margin, and only the last would justify the concern that targeted support creates rents. And the markup is the quantity that separates the two sources of high profitability that accounting ratios confound: pricing above marginal cost and operating at lower cost. The production approach of De Loecker and Warzynski (2012) makes firm-level markups measurable from the accounts every firm files, and has been used to relate market power to trade, acquisitions and innovation (De Loecker et al., 2016; Díez et al., 2021; Ciapanna et al., 2024), but never to a regulatory status.
The paper therefore asks: does certification as an innovative start-up or SME change the markups of Italian small firms, and does the statutory end of start-up status change them when it arrives? The expiry date is set by law rather than chosen by the firm, and a twelve-month extension granted by Decree-law 34/2020 to firms on the register in May 2020 moved it by one year for adjacent cohorts, separating the loss of status from the evolution of markups with age that customer-accumulation models predict (Gourio & Rudanko, 2014; Roldan-Blanco & Gilbukh, 2021).
The answer rests on 76,466 firm-years of statutory accounts for certified start-ups, certified innovative SMEs and ordinary SMEs between 2015 and 2024. Markups are estimated with a translog production function (Ackerberg et al., 2015), and inference is drawn from within-firm changes, which remain measurable from financial statements even though the level of the markup does not (Bond et al., 2021; De Ridder et al., 2026). Certified firms price below ordinary SMEs, but the discount reflects which firms register rather than what registration does; the expiry leaves markups unchanged on average, both in an event study robust to heterogeneous cohorts (Sun & Abraham, 2021) and when instrumented by the statutory date; and that average combines falls of five to six per cent in capital- and materials-intensive firms with no fall elsewhere.
The paper is original in four respects. It is the first to measure the price margins of certified innovative firms, adding an outcome that the evaluations of the Start-up Act have not examined. It uses the statutory expiry of a firm-level certification as a source of identification, whereas the literature on certification has studied labels attached to products (Houde, 2022) or the value of public awards for raising capital (Galope, 2016; Howell, 2017). It is innovative in method: the same observations are analysed by panel estimators, by an unsupervised partition selected from 41 solutions on eleven validity indices, and by regression learners fitted to data transformed as the fixed-effects estimator transforms them. Machine learning is thus used to test the specification rather than to predict, following Mullainathan and Spiess (2017) and Chernozhukov et al. (2018). Finally, it shows that an average null can conceal responses of opposite sign across operating configurations, which a single coefficient cannot reveal.
The article continues as follows. Section 2 reviews the literature on markup estimation, on the life cycle of markups and on the evaluation of start-up policy, and identifies the gap the paper fills. Section 3 sets out the data and the three empirical strategies. Section 4 estimates markups and reports the panel, event-study and instrumental-variable evidence on certification and on the sixty-month expiry. Section 5 partitions the same firm-years into operating configurations and asks whether one coefficient vector fits them all. Section 6 uses regression learners to test the functional form of the markup equation and re-estimates the status effects by double machine learning. Section 7 sets the results against the literature. Section 8, Section 9 and Section 10 discuss the policy implications, the limitations and the conclusions. Five appendices support the main text: Appendix A documents the production function and the construction of the markup; Appendix B the sample and the coding of regulatory status; Appendix C the dynamic specification; Appendix D the instrumental-variable estimates and the partial withdrawal of treatment at the expiry; and Appendix E the robustness of the within-firm estimates. Further results are reported in the Supplementary Materials.
2. Literature Review
Whether a public regime for young innovative firms changes what those firms charge relative to what they pay for their inputs sits at the intersection of literatures that have developed almost without contact. Industrial organisation has built a toolkit for recovering firm-level markups from production data, and has used it to document trends and to relate market power to trade, acquisitions and innovation, but almost never to a regulatory status. The evaluation of start-up policy, rich on the Italian case, measures financing, employment, entry and survival, and never prices. A third strand, on firm dynamics and customer accumulation, predicts that markups move with age, which is exactly the dimension along which the Italian regime assigns and removes its benefits. This review takes the strands in turn, identifies what each leaves open, and closes with Table 1, which places the present study in relation to them.
Markups from production data. The production approach recovers the markup as the ratio between the output elasticity of a flexible input and that input’s share of revenue, and its modern form rests on De Loecker and Warzynski (2012), who showed that no assumption on demand or on the mode of competition is needed once the elasticity is estimated with a control-function production function. De Loecker et al. (2016) extended the method to multi-product firms with observed prices, separating markups from marginal costs in the Indian trade reform, and Dobbelaere and Mairesse (2013) had already shown in a panel of French manufacturing firms that product and labour market imperfections jointly drive a wedge between factor elasticities and revenue shares. The approach has since become the default for firm-level work on market power.
Its identification has come under sustained scrutiny, and the criticism bears directly on data of the kind used here. Bond et al. (2021) show that when output is measured by revenue rather than quantity, the revenue elasticity replaces the output elasticity and the ratio estimator is identically one under profit maximisation, so that the level of the markup is not identified without prices. Hashemi et al. (2022) reinterpret estimates obtained with revenue data as measures of input distortions rather than output market power. Raval (2023b) finds, across manufacturing data from several countries, that markups computed from labour and from materials are negatively correlated and trend in opposite directions, which a correctly specified production approach would not allow. Koppenberg and Hirsch (2022a) find that the production approach yields markups substantially larger than a stochastic-frontier alternative on the same European retailers. The constructive response has been to ask what can still be learned. De Ridder et al. (2026) show analytically that trends and dispersion of markups are well measured from financial statements even when the average level is not, and Kirov et al. (2026) and Huang and Yang (2025) propose estimators that model markups or unobserved prices directly inside the production function.
Two gaps follow. The validation work is conducted on manufacturing samples, often with price information, and rarely on small unlisted firms whose capital stock must be reconstructed from the balance sheet. And although the literature now agrees that within-firm changes are more reliable than levels, empirical applications still report and interpret levels. The present study estimates a translog elasticity on 76,466 firm-years, shows that the level is fragile — a Cobb–Douglas median below one, sector-specific elasticities above one — and rests every conclusion on within-firm changes, which survive all the variants tried.
Market power: trends and firm-level determinants. A second body of work uses the production approach to describe market power across economies and to relate it to firm choices. Díez et al. (2021) document a modest global rise in average markups between 2000 and 2015, concentrated in the top decile and in services, with a U-shaped relation between size and markups; Weche and Wambach (2021) find a sharp fall in European markups during the financial crisis followed by a partial recovery; Gradzewicz and Mućk (2024) document a fall in Polish markups linked to global value chains. For Italy, Ciapanna et al. (2024) find aggregate markups close to 1.1 and flat or slightly declining over two decades, with substantial dispersion across and within firms. Burstein et al. (2025) show in French administrative data that firm-level markups rise with market share and that their cyclical behaviour differs by firm size, while Peters (2020) makes the distribution of markups an equilibrium outcome of innovation and creative destruction.
At the firm level, markups have been related to trade policy (Asprilla et al., 2019), acquisitions (Stiebale & Vencappa, 2018), product innovation (Dai & Cheng, 2018), exporting among service firms (Kato & Kodama, 2014) and export and R&D strategies of Spanish SMEs in the recession, whose markups fell more than those of larger firms (Máñez et al., 2022). Regulatory status does not appear among these determinants. The firms that public policy singles out as young and innovative are absent from the samples, and the question whether a policy that lowers some costs of young firms is passed through to prices or retained as margin has not been posed. The present study measures markups for certified start-ups, certified innovative SMEs and ordinary SMEs on identical accounting items, finding medians of 1.047, 1.058 and 1.102 respectively.
Age, customers and the life cycle of markups. A theoretical literature predicts that markups change systematically as firms age. In Gourio and Rudanko (2014), search frictions in product markets make the customer base a slow-moving state variable, so that young firms price to acquire customers and older firms to exploit them. Roldan-Blanco and Gilbukh (2021) calibrate such a model to U.S. retail and find that customer accumulation shapes both the life cycle of establishments and the cyclicality of markups, with a larger contribution by small sellers. Morlacco and Zeke (2021) and Chiavari (2026) link customer capital to rising concentration and to the declining contestability of markets for entrants, and Eslava et al. (2024) show with price and quantity data that demand and product appeal, not only technical efficiency, drive the life-cycle growth of plants. In credit markets the same logic yields a life-cycle pattern in the interest-rate mark-ups that banks charge small firms (Kim et al., 2012).
The implication for policy evaluation has not been drawn. A regime whose benefits end at a fixed age from incorporation — sixty months under Decree-law 179/2012 — removes them precisely when these models predict that pricing is changing for reasons unrelated to policy. Any comparison of markups before and after the expiry confounds the loss of status with the life cycle. The present study separates the two by exploiting the twelve-month extension granted by Decree-law 34/2020 to firms on the register in May 2020, which moved the statutory expiry from sixty to seventy-two months for adjacent cohorts, and documents a life-cycle profile in which markups fall over the first four years and recover from the seventh.
Evaluations of the Italian regime. The Italian Start-up Act is among the most evaluated entrepreneurship policies in Europe, and the evidence is consistent on its financial effects. Manaresi et al. (2021) find, with conditional difference-in-differences and instrumental variables, that the policy raised several firm outcomes and eased financial frictions through tax credits for equity and the public guarantee, with no effect on patenting or survival. Biancalani et al. (2022) find that registered start-ups obtain more equity and debt and hire more. Giraudo et al. (2019) show that the guaranteed loans and the fiscal incentives for venture capital serve different types of young innovative companies, and Ferrucci et al. (2021) that access to the Central Guarantee Fund benefits the growth and survival of innovative start-ups more than that of comparable firms. Anderloni and Harasheh (2025) find stronger financial structures and higher survival but slower profitability among registered manufacturers, and Matricano (2024a) and De Angelis (2018) assess the Act a decade on.
A second group examines take-up and regional schemes. Cantarella et al. (2024) show that registration was persistently lower in German-speaking areas of Trentino-Alto Adige, so that take-up itself is selective. Regional grants raised firm creation in Trento and Bolzano (Accetturo, 2022) and in Latium (Albanese & Bronzini, 2026), but with no gain in innovation potential and, in Latium, slower growth among subsidised firms; Santoleri and Russo (2025) find null effects of regional programmes across a wide range of outcomes.
Three features of this literature frame the contribution. The outcomes are financing, employment, entry, survival and patents; prices and margins do not appear. Identification comes from registration, matching or programme discontinuities, never from the statutory end of status, although the expiry is the one date in the regime that the firm does not choose. And the selection documented by Cantarella et al. (2024) and Anderloni and Harasheh (2025) implies that cross-sectional differences between registered and unregistered firms mix treatment with selection. The present study finds exactly that mix: a between-firm markup gap of 12.6 per cent for start-up status against a within-firm change of 2.4 per cent, which disappears once markups are allowed to adjust dynamically, and an instrumented effect of the expiry of −0.005 with a standard error of 0.013.
Start-up support and certification elsewhere. Outside Italy, quasi-experimental evaluations of start-up support concentrate on grants and subsidised finance. Howell (2017) finds that early-stage SBIR awards roughly double the probability of subsequent venture capital and raise patenting and revenue, and attributes the effect to the funding of prototypes rather than to certification. Hottenrott and Richstein (2020) find that both grants and subsidised loans raise investment, employment and revenue growth among German knowledge-intensive start-ups, and Czarnitzki and Delanote (2015) reject full crowding-out of R&D subsidies for young high-tech firms. Firm age conditions both access and effect: younger firms are more likely to obtain R&D subsidies (Segarra-Blasco & Teruel, 2016), and the Korean venture certification programme benefits young and small firms more (Pyo & Park, 2020). Evidence on start-up subsidies for the unemployed (Caliendo & Künn, 2011) adds that effects are heterogeneous across recipients.
Whether a public label carries value in itself has been asked mainly about capital. Galope (2016) finds no certification effect of SBIR awards on follow-on investment, and Bracht et al. (2024) show that the legal form chosen at incorporation works as a signal to lenders whose value declines with firm age. On products, certification is known to shape prices and market power: Houde (2022, 2026) shows that firms bunch at the ENERGY STAR threshold and use a coarse certification to price discriminate. The expiry of a public benefit is almost unstudied; Cumming and Johan (2010) examine the phase-out of a venture capital tax credit and find that the concern it raised was concentrated among firms already funded by it. No study asks whether losing a firm-level certification changes the prices a firm can charge, which is the test the sixty-month expiry makes possible.
Heterogeneity and the validation of linear specifications. Two methodological strands bear on how the evidence is read. Taxonomies of small and young firms have a long history, from Rizzoni (1991) to Biga Diambeidou and Gailly (2011) on the early growth of Belgian start-ups and Libaers et al. (2016) on technology-commercialising firms; latent-class and cluster methods have been applied to SMEs’ circular practices (Bassi & Dias, 2020) and to the digital strategies of Italian innovative start-ups (Centobelli et al., 2022), and Cavicchioli and Kocollari (2021) group Italian start-ups to detect patterns of failure. These partitions describe populations; they are rarely used to test whether one coefficient vector fits the groups they identify. Machine learning, in turn, enters firm-level economics mainly as a predictive tool or as a device for estimating a single causal effect by double machine learning (Song et al., 2025; Guo et al., 2026), and comparisons of learners with panel estimators are usually framed as contests of predictive accuracy (Drago et al., 2025; Sultana et al., 2026). The present study uses both tools as tests of its own equation: a partition selected from 41 solutions shows that the average null at the expiry combines falls of five to six per cent in fixed-asset-heavy and materials-intensive configurations with small rises elsewhere, and boosted learners and double machine learning, run on the same firm- and year-demeaned data, reproduce the start-up coefficient at −0.024 to −0.025.
Synthesis
Read together, the literatures supply the pieces of the question without assembling them. The production approach can measure within-firm changes in markups from financial statements, although not their level. Theories of customer accumulation predict that those changes depend on age. The Italian regime assigns and removes a bundle of cost-reducing benefits at a statutory age, and its evaluations have established its financial effects without looking at prices. The present study joins these pieces on one population and one set of accounts. Table 1 summarises where it sits.
3. Methodology
The data are the statutory accounts of all registered innovative start-ups, all registered innovative SMEs and a comparison population of ordinary SMEs from AIDA, matched to the Business Register for registration and incorporation dates. The estimation sample contains 76,466 firm-years on 11,845 firms between 2015 and 2024, and every method below is applied to exactly these observations, so that disagreements between methods cannot be attributed to differences in sample.
Markups are estimated with the production approach of De Loecker and Warzynski (2012): the markup is the output elasticity of a flexible input — here materials and services — divided by its share of revenue. The elasticity comes from a translog production function estimated by the two-step procedure of Ackerberg et al. (2015), and revenue is purged of the first-stage error as in De Loecker et al. (2020). The approach suits the question because it requires no assumption on demand or on the form of competition. Its known weakness, that revenue data do not identify the level of the markup (Bond et al., 2021), is addressed by drawing inference only from within-firm changes, which remain measurable from financial statements (De Ridder et al., 2026).
The log markup is regressed on start-up and innovative-SME status under pooled OLS, between, random-effects, one- and two-way fixed-effects and weighted estimators. Reporting all of them is deliberate: when the between and within coefficients diverge, the cross-sectional gap reflects which firms register rather than what registration does. The F, Breusch–Pagan and Hausman tests select the reference estimator (Breusch & Pagan, 1980; Hausman, 1978), and a dynamic specification estimated in first differences (Anderson & Hsiao, 1981) checks whether status effects survive persistence, its coefficient bracketed by the pooled and fixed-effects bounds (Bond, 2002; Nickell, 1981).
The focal shock is the statutory expiry of start-up status sixty months after incorporation, extended to seventy-two by Decree-law 34/2020 for firms registered in May 2020. Because the date is set by law, it is used both in an interaction-weighted event study robust to heterogeneous cohort effects (Sun & Abraham, 2021), and as an instrument for the actual loss of status. The extension moves the expiry by one year between adjacent cohorts, which separates the policy from the life cycle of markups predicted by customer-accumulation models (Gourio & Rudanko, 2014).
Two further exercises test the restrictions the panel imposes. An unsupervised partition of the same firm-years, built from eight accounting ratios that exclude the markup and the register, compares six algorithms on eleven validity indices and bootstrap stability, and re-estimates the equation within the selected configurations; it asks whether one coefficient vector fits all firms. Six regression learners — linear regression, linear support-vector machine, regression tree, k-nearest neighbours, random forest (Breiman, 2001) and gradient boosting (Friedman, 2001) — are then fitted to data demeaned exactly as the fixed-effects estimator demeans them, with folds grouped by firm, and the best is used to test linearity and additivity and to re-estimate the status effects by double machine learning (Chernozhukov et al., 2018). Learners thus validate the specification rather than predict, as Mullainathan and Spiess (2017) and Athey and Imbens (2019) recommend.
4. Markups, Certification and the Sixty-Month Expiry
Return on assets cannot tell a firm that prices above marginal cost from one that buys its inputs cheaply, and the distinction matters for a policy whose stated purpose is to relieve young firms of constraints rather than to confer rents. This section estimates firm-level markups and asks two questions of them: whether firms on the start-up and innovative-SME registers price differently from ordinary SMEs, and whether anything happens to their markups when start-up status ends, which the law fixes at sixty months from incorporation. The second question is the sharper of the two, because the date is set by statute rather than chosen by the firm.
The two questions have different predictions. If certification lowers marginal cost — through fee exemptions, cheaper guaranteed credit and tax relief for investors — and prices are set in the market, markups should be higher while the status lasts and fall when it ends. If the label works as a quality signal, the same pattern appears through price rather than cost. Only if the relief is passed on in full, or is too small to register in the cost of purchased inputs, should the expiry leave markups unchanged.
Markups follow De Loecker and Warzynski (2012): the markup is the output elasticity of a flexible input divided by that input’s share of revenue, μ = θᵛ/αᵛ. Materials and services form the flexible input, revenue is purged of the transitory error estimated in the first stage (De Loecker et al., 2020), and θᵛ comes from a translog production function in materials and services, personnel cost and fixed assets, estimated by the two-step procedure of Ackerberg et al. (2015) on all firms jointly, so that no regime is given a technology of its own. Fixed assets are recovered as net worth less the structural margin. Years without personnel cost are excluded because the translog is undefined at zero, and this is the binding restriction: it removes 46 per cent of start-up years with positive revenue against one per cent of ordinary ones. The estimation sample contains 76,466 firm-years on 11,845 firms between 2015 and 2024. Table 2 states the constructions.
The elasticity has a median of 0.683, with an interquartile range from 0.560 to 0.792, and the implied markup a median of 1.091, placing the typical firm about nine per cent above marginal cost. Levels of this kind are sensitive to the production function (Bond et al., 2021): under Cobb–Douglas the median falls below one, and Appendix A reports both. Everything that follows therefore rests on differences, which survive a bias common to the level. Figure 1 shows the three distributions.
The certified populations sit to the left, with median markups of 1.047 for start-ups and 1.058 for innovative SMEs against 1.102 for ordinary SMEs. The gap does not come from the elasticity, which is higher among start-ups (0.801 against 0.671), but from the expenditure share, 0.807 of corrected revenue against 0.621: start-ups spend more of each euro of sales on purchased inputs. Whether the register produces that position or admits firms already in it is what the panel estimators separate. Table 3 regresses the log markup on the two status indicators under seven estimators.
The cross-section and the within dimension disagree by a factor of five. Between firms, start-up status is associated with a markup 12.6 per cent lower and innovative-SME status with one 15.3 per cent lower. Within firms, entry into the start-up section lowers the markup by 2.4 per cent and entry into the innovative-SME section by nothing distinguishable from zero. Pooled least squares, which mixes the two dimensions, lands in between at −0.106 and −0.081. The F, Breusch–Pagan and Hausman tests all reject, so two-way fixed effects is the reference. The between standard deviation of the log markup is 0.168 against a within one of 0.074, and most of what the between column describes is which firms register rather than what registration does. Figure 2 places the eight estimates side by side.
Two features of the figure qualify the within estimate. Weighting by revenue removes it, so the 2.4 per cent is carried by small firms. And the dynamic specification, which adds the lagged markup and is estimated in first differences with the markup at t−2 as instrument (Anderson & Hsiao, 1981), returns a persistence of 0.366, inside the bounds of 0.313 under fixed effects and 0.838 under pooled OLS (Bond, 2002), and a start-up coefficient of 0.0005. Once markups adjust gradually, entry leaves no trace. The expiry is where the design is cleanest. Among innovative SMEs incorporated after October 2012, entry into the SME section piles up between 54 and 84 months after incorporation, at the sixty months set by Decree-law 179/2012 and the seventy-two to which Decree-law 34/2020 extended the term for firms on the register in May 2020 (Appendix B). These 1,097 graduates lose start-up status on a date the law fixes, and Figure 3 traces their markups around it with the interaction-weighted estimator of Sun and Abraham (2021).
Nothing happens at the expiry. The coefficient in the year status is lost is 0.0004 (0.0055), the average over the post-event years 0.010 (0.009), and the profile against the statutory date is flatter still. A mild dip two and three years before the event takes the joint pre-trend test to p = 0.045 in panel A, but not in panel B. The remaining concern is that exit is partly chosen: some firms entitled to seventy-two months leave at sixty, and some stay beyond the term. The statutory date is the natural instrument for the actual loss of status, and Table 4 reports the result.
The instrument is strong: passing the statutory date raises the probability of having left the start-up section by 49 points, with a first-stage F of 750. The two-stage estimate is −0.005 with a standard error of 0.013, the reduced form −0.003, and the Durbin–Wu–Hausman test does not reject exogeneity of the actual exit (p = 0.234), so least squares and instrumental variables agree on a zero. With age entered as dummies, identification rests only on the one-year difference the 2020 extension created between adjacent cohorts; the first stage falls to F = 18 and the estimate loses precision, which is reported rather than hidden. Across the robustness variants of Appendix E the instrumented effect never exceeds 3.3 per cent in absolute value and is never significant. The instrument is kept in the body because the statutory term is the only source of variation here that the firm does not choose.
One objection concerns what the expiry removes. The graduates do not leave the regime: they move from the start-up section to the innovative-SME section, and innovative SMEs retain the benefits that bear most directly on the cost of external finance, notably the tax relief for equity investors and simplified access to the Central Guarantee Fund, while provisions specific to the start-up phase, among them the exemption from ordinary insolvency procedures, lapse. The expiry is therefore a partial withdrawal of treatment, and a null could reflect a small change in treatment rather than the absence of a price response. Three pieces of evidence, reported in Appendix Table D2, bear on this reading.
First, entering the SME section is not itself associated with higher markups. Among the 1,143 firms that join it without having been start-ups, the within-firm coefficient is 0.006 with a standard error of 0.003, so the switch does not conceal a gain from SME status offsetting a loss from start-up status. Second, 268 graduates re-register as SMEs at least one year after their statutory term expired, and in the interval they hold no certification at all. In those 219 firm-years the markup is 0.004 (0.010) relative to the start-up years, indistinguishable from zero; the full withdrawal of status, where it is observed, leaves no mark either. Third, the instrumented estimate bounds the effect of a complete withdrawal. Its 95 per cent interval runs from −0.030 to 0.020; if half of the relief were retained after the switch and the effect scaled with the relief withdrawn, a complete withdrawal would lower markups by at most about six per cent. The null is therefore not an artefact of a partial treatment, although the design cannot exclude a moderate effect of complete withdrawal, and the uncertified interval is short and observed only for firms that later re-registered. The three strands agree. Certified firms price below ordinary SMEs, but their markups barely move when they enter the start-up register and do not move when the law removes the status. The gap belongs to the firms the regime admits — young, small and input-intensive — rather than to the regime. For policy, the start-up regime neither creates market power that its expiry dissipates nor props up margins that would otherwise fall: whatever it relieves, it does not operate through price. Where the relief bites — on financing, on survival, on the tax charge — has to be read from other margins of the accounts.
5. Operating Configurations and the Markup: An Unsupervised Partition
The panel estimates impose one coefficient vector on every firm. A start-up that buys materials and one that capitalises its own development are assumed to respond to certification in the same way, and the zero found at the expiry could be an average of opposite responses. This section tests that restriction. It partitions the same 76,466 firm-years used in the econometric section, so that every cluster is a set of observations on which the markup equation can be re-estimated, into operating configurations using accounting ratios alone — the register, the markup and its components are withheld — and then asks two questions: whether the configurations explain the markup gap between certified and ordinary firms, and whether the status coefficients differ across them.
Eight ratios describe how a firm produces and finances itself: its cost structure, its asset base and its balance sheet. None is the dependent variable or a status indicator, and none enters the expenditure share on which the markup is built. Two ratios describe the cost structure, three the asset base and its use, two the balance sheet, and the last the weight of capitalised development. Each is winsorised at the first and ninety-ninth percentiles and standardised, and the unit is the firm-year rather than the firm, so a firm that changes configuration changes cluster. Table 5 lists them.
Six algorithms are compared: K-means, hierarchical clustering with Ward linkage, a Gaussian mixture as the model-based method, fuzzy C-means, a random-forest proximity partition in which trees separate observed from permuted data, and DBSCAN as the density-based method. The first five are run for two to eight clusters and DBSCAN at six radii, giving 41 solutions. Each is scored on eleven indices computed on a common random subsample of 6,000 firm-years: R², AIC, BIC, silhouette, maximum diameter, minimum separation, Pearson γ, Dunn, entropy, Calinski–Harabasz and the Herfindahl–Hirschman index of cluster sizes. A solution is admissible if every cluster holds at least one per cent of observations, noise stays below twenty per cent and the fuzzy algorithm returns the number of clusters requested; 26 pass. Figure 4 reports each admissible solution’s rank score, one minus its normalised mean rank across the eleven indices.
Two methods fail outright. DBSCAN finds no structure: at five of the six radii it returns a single cluster, and at the sixth it discards 32 per cent of observations as noise and places 99 per cent of the rest in one group, so small-firm accounts form a continuum rather than islands of density. Fuzzy C-means collapses beyond three clusters, with mean maximum membership falling to 0.30. The Gaussian mixture is admissible throughout but its silhouettes are near zero, because the full covariance matrices let clusters overlap, and the random-forest proximity partition loses admissibility beyond five clusters as it splits off groups of a few dozen observations. Table 6 reports the best admissible solution of each method.
K-means with seven clusters ranks first, with a mean rank of 5.14, and leads on the indices that reward compact, well-separated groups of useful size: it explains 52 per cent of the variance with a Calinski–Harabasz statistic of 1,088. Ward linkage with two clusters has the highest silhouette, 0.555, but only because it isolates 2.8 per cent of observations from the rest. The choice is confirmed by stability: across twenty bootstrap refits the seven-cluster K-means solution reproduces itself with an adjusted Rand index of 0.985, against 0.481 for the Ward solution ranked third. The eight-cluster solution, second in rank, is almost as stable (0.976) and differs only by adding an intermediate group carved from the materials-intensive and equity-rich clusters, leaving the other five intact. The partition is then estimated on all 76,466 firm-years. Figure 5 shows its centroids.
The configurations are economically legible. Materials-intensive producers (C1) and asset-light service firms (C7) are the two large groups, at 28.6 and 25.8 per cent, and they bracket the markup distribution at medians of 1.060 and 1.159. Between them sit equity-rich, liquid firms (C4), fixed-asset-heavy and illiquid ones (C6), and three small groups: firms capitalising their own development (C2), firms renting their assets (C3), and a pre-scale group whose personnel cost is 2.8 times revenue (C5). The ordering is itself informative. The highest markups occur where the elasticity of purchased inputs is lowest, in asset-light services at 0.539, and the lowest where materials dominate the cost base; a firm that sells mainly the work of its own staff earns a large margin over the inputs it buys, which is what the markup measures. Table 7 reports the profiles.
The partition recovers part of the register without being given it. Innovative SMEs make up two thirds of C2 and C5, ordinary SMEs 87 per cent of C1, and Cramér’s V between cluster and population is 0.29. But the configurations are states rather than types: a firm stays in its cluster from one year to the next with probability 0.81, and 62 per cent of firms observed for five years or more pass through at least two. Conditioning on them barely touches the register gap. Adding cluster effects to the pooled regression doubles its R², from 0.078 to 0.145, yet moves the start-up coefficient only from −0.106 to −0.090 and the SME coefficient from −0.081 to −0.078. Certified populations have lower median markups than ordinary SMEs in all seven configurations. The size of the gap does vary: pooled within each cluster, with year effects, size and age, the start-up coefficient ranges from −0.020 among materials-intensive producers to −0.152 among asset-light services (Supplementary Material S8). The gap therefore lies mainly in the firm effect, not in how the firm produces, and the configuration only changes how much of it shows. Table 8 asks whether the status coefficients themselves differ across configurations.
The single coefficient hides dispersion on both margins. Entry into the start-up section lowers the markup by 5.0 per cent among fixed-asset-heavy firms and 4.0 per cent among those capitalising development, and not at all among materials-intensive producers or the pre-scale group; equality is rejected at χ²(6) = 27.2. At the expiry the instrumented effects run from −6.4 per cent in C6 and −5.4 per cent in C1 to +2.8 per cent in C2 and +2.1 per cent in C4, and both the joint test and the equality test reject. Figure 6 draws the two sets.
The zero at the expiry is therefore an average, not an absence. Where the firm turns purchased materials or fixed capital into output, losing start-up status lowers its markup by five to six per cent; where it capitalises development or holds ample equity and liquidity, the markup does not fall and may rise. Neither cluster-level coefficient survives a Bonferroni correction for seven comparisons on its own, so the evidence is the joint rejection rather than any single estimate. It points to the relief operating on the cost side in capital- and materials-intensive production, where lower fees, cheaper guaranteed credit and tax relief can lower marginal cost, and not in configurations whose costs are mostly development and personnel. The register gap, by contrast, is left almost intact by the partition and remains a property of the firms rather than of how they produce.
6. Machine-Learning Validation of the Markup Equation
The econometric section rests on a linear, additive equation in two status indicators, size and age, estimated on within-firm variation. Its conclusions could fail in two ways: the equation might miss structure that a flexible function of the same variables would find, or the status coefficient might owe its value to the linear form in which the controls enter. This section uses regression learners to test both, not to predict markups. Every learner sees the same 76,466 firm-years, and every variable is first demeaned by firm and by year exactly as the two-way fixed-effects estimator demeans it, so the learners work on the variation that identifies the coefficients of Table 3 and on nothing else.
Two feature sets are used. The equation set contains the four regressors of Table 3. The augmented set adds the eight configuration ratios of the clustering section, to ask how much within-firm variation a richer description of the firm could explain and whether the status coefficient survives it. Six learners are compared: linear regression, a linear support-vector machine with absolute loss, a regression tree, k-nearest neighbours, a random forest and gradient boosting. Out-of-sample performance comes from five-fold cross-validation with folds grouped by firm, so that no firm contributes to both the training and the evaluation data. Ten indicators summarise the comparison: R², mean squared error and its root, mean and median absolute error, explained variance, maximum error, the correlation between prediction and outcome, and the dispersion and minimum of R² across folds. Table 9 states the specifications.
Figure 7 reports the out-of-sample R² of each learner on the two feature sets, with the linear model as the dashed reference.
With the equation variables alone, no learner explains more than 1.2 per cent of the within-firm variance of the markup. The linear model reaches 0.0017, boosting 0.0117 and the random forest 0.0112. The ratio is large, about seven, but the level is the finding: status, size and age account for almost none of the year-to-year movement in a firm’s markup in any functional form, which is consistent with the within R² of 0.006 in Table 3. The augmented set changes the scale. Linear regression rises to 0.051 and the two ensembles to 0.146 and 0.144, so the operating configuration carries real within-firm information that the markup equation leaves in the error. The linear SVM, fitted with absolute loss, has the lowest R² but competitive absolute errors, as a median-type fit should. The ensembles are also the most stable across folds: boosting never falls below an R² of 0.0077 on the equation set, whereas in one fold the linear model explains almost nothing. Table 10 reports all ten indicators.
Boosting ranks first overall, with a mean rank of 2.05 across both sets against 2.20 for the random forest. The two ensembles are close on every indicator: boosting leads on the equation set and the forest on the augmented set by 0.002 of R². Boosting is retained because it leads overall and fits 150 times faster, which matters for the repeated refits the validation requires. Neither choice is fragile: across nine combinations of tree size and minimum leaf size the boosted R² on the augmented set stays between 0.136 and 0.148 (Supplementary Material S9). The first validation question is where its advantage over the linear model comes from. Figure 8 decomposes the gain by constraining boosting to be additive, and reports which variables carry it.
On the equation set, additive nonlinearity adds little: splines take the R² from 0.0017 to 0.0049, and additive boosting reaches 0.0046. Interactions account for 70 per cent of the gain, but the whole gain is one point of within variance. The linear, additive form therefore loses almost nothing that these four variables could offer. Status is the most important of them, with a permutation importance of 0.0144 against 0.0118 for size, 0.0058 for the SME indicator and 0.0025 for age, so the learner leans on the variable the equation is about. On the augmented set the gain is larger and splits roughly evenly between nonlinearity and interaction, and one variable dominates: the personnel-cost share, at 0.31. That dominance is partly mechanical, because personnel cost enters the translog elasticity from which the markup is built, so it is a statement about the markup’s construction rather than its determinants. The second question is whether the status coefficient survives a flexible treatment of everything else. Table 11 compares four estimates.
The start-up coefficient is the same under every method. Two-way fixed effects give −0.0240, the boosting average marginal effect −0.0248, and double machine learning with boosted nuisance functions −0.0243 with a standard error of 0.0057. The SME coefficient stays at zero, and the instrumented expiry effect moves from −0.005 to 0.004, both with standard errors of 0.013–0.014. Size and age are where the functional forms disagree, with boosted marginal effects of 0.0027 and −0.0029 against −0.0017 and −0.0068, but all four values are economically negligible. Adding the configuration controls makes the start-up coefficient slightly more negative, −0.029, and the SME coefficient −0.007, significant at five per cent, but those controls are themselves shaped by status, so this column is a bound rather than a preferred estimate. The double-machine-learning estimator works in two steps: boosting predicts the markup and each status indicator from the controls on four folds, the prediction errors are formed on the fifth, and the status coefficient is the regression of one error on the other. Nothing about the controls is assumed linear, and cross-fitting prevents overfitting from leaking into the coefficient. Figure 9 draws the comparison.
The learners confirm the equation on the dimension that matters and qualify it on one that does not. Status effects are not artefacts of the linear form: a learner free to bend and interact every variable returns the same start-up discount of about 2.4 per cent and the same zero at the expiry. What the equation misses is the configuration of the firm, which explains up to fourteen per cent of within-firm variation that status, size and age cannot, but that variation is orthogonal enough to status that controlling for it flexibly moves the start-up coefficient by half a point. One result pulls against the clustering section: the boosted start-up effect varies little across the seven configurations, from -0.034 to -0.019, against −0.050 to 0.001 in the interacted regression. The ordering is similar — fixed-asset-heavy firms most negative, the pre-scale group least — but the learner compresses the dispersion, and the cluster-level coefficients should be read as indicating direction rather than size.
Two limits apply. Because the learners see only demeaned data, they test the specification conditional on the firm effect and cannot say whether the between-firm gap of Table 3 is itself correctly specified; that gap is described, not validated. And performance is measured on the markup as constructed in the econometric section, so any bias in the production-function elasticity that varies within firms is inherited rather than detected. Within those limits, the equation is adequate for the question it was built to answer.
7. Results
This section brings together what the three strategies of the paper — panel econometrics, unsupervised partitioning and regression learners — established on the same 76,466 firm-years, and sets each result against the literature reviewed earlier. Three findings organise it. Certified firms have lower markups than ordinary SMEs, but the gap is a property of the firms rather than of the regime. The statutory end of start-up status leaves the average markup unchanged. And that average conceals responses of opposite sign across operating configurations, which the linear equation does not see but which do not overturn its central coefficients.
The translog elasticity of purchased inputs has a median of 0.683 and the implied markup a median of 1.091, close to the aggregate level of about 1.1 that Ciapanna et al. (2024) report for Italy and below the averages of 1.22 to 1.29 that Díez et al. (2021) find across economies, consistent with their evidence that private firms carry lower markups than listed ones. The level, however, is not robust. Under Cobb–Douglas the median falls to 0.890, sector-specific translogs return elasticities above one in two sectors, and dropping personnel cost doubles the markup. This is the fragility that Bond et al. (2021) derive analytically for revenue-based estimates and that Raval (2023b) and Hashemi et al. (2022) document empirically, and it is why the paper follows De Ridder et al. (2026) in treating differences, not levels, as the object of inference.
On differences the evidence is sharp. The median markup is 1.047 among innovative start-ups, 1.058 among innovative SMEs and 1.102 among ordinary SMEs, and the gap comes from the expenditure share on purchased inputs rather than from the elasticity, which is higher among start-ups. Between firms, start-up status is associated with a log markup 0.126 lower and innovative-SME status with one 0.153 lower. Within firms the same coefficients are −0.024 and −0.001 under two-way fixed effects, which the F, Breusch–Pagan and Hausman tests all select, and the between standard deviation of the log markup is more than twice the within one. Most of the cross-sectional discount therefore reflects which firms register. That reading agrees with the selective take-up documented by Cantarella et al. (2024) and with the different financial profiles of registered firms in Anderloni and Harasheh (2025). It is new in the dimension it measures: none of the evaluations of the Start-up Act (Manaresi et al., 2021; Biancalani et al., 2022; Giraudo et al., 2019) examines prices or margins.
The within-firm effect of entering the start-up section is small and fragile. It is negative in every robustness variant, from −0.010 to −0.075, but disappears when observations are weighted by revenue and when the equation allows markups to adjust gradually. The Anderson–Hsiao persistence of 0.366 lies between the fixed-effects and pooled bounds, as Bond (2002) requires, and the start-up coefficient in that specification is 0.0005. The static −0.024 is therefore best read as an upper bound, concentrated among small firms. This contrasts with the positive financial effects of registration — more equity, more debt, more employment (Biancalani et al., 2022; Manaresi et al., 2021) — without contradicting them: the regime changes how start-ups are financed and staffed, not the margin they earn on what they sell.
The expiry is the part of the design the firm does not choose, and it gives the cleanest answer. Among 1,097 innovative SMEs identified as former start-ups from the bunching of their transfer at sixty and seventy-two months, the interaction-weighted event study of Sun and Abraham (2021) is flat: the coefficient in the year status is lost is 0.0004 and the post-event average 0.010 with a standard error of 0.009. Instrumenting the actual loss of status with the statutory date, whose first-stage F is 750, gives −0.005 with a standard error of 0.013, and the Durbin–Wu–Hausman test does not reject exogeneity of the actual exit. The null survives every variant, including an expenditure share that uses no production-function estimate at all.
It also survives the objection that graduates do not leave the regime but move to the innovative-SME section, which retains the finance-related benefits: entry into that section alone does not raise markups, and the years some graduates spend with no certification between their statutory term and re-registration show no fall either
Two predictions derived from the literature are thereby rejected on average. If certification lowered marginal cost through cheaper guaranteed credit and tax relief and prices were set by the market, markups should fall at the expiry; if the label signalled quality, they should fall through price. Neither happens. The second rejection is consistent with the absence of a certification effect of SBIR awards on follow-on finance (Galope, 2016) and with Howell’s (2017) conclusion that grants work by funding prototypes rather than by certifying firms. It stands in contrast with the strategic pricing that product certification enables (Houde, 2022, 2026), which suggests that a label attached to the firm, rather than to what it sells, carries little pricing power. The life-cycle profile uncovered along the way — markups falling over the first four years and recovering from the seventh — matches the customer-accumulation mechanism of Gourio and Rudanko (2014) and Roldan-Blanco and Gilbukh (2021), and shows why the expiry could not be read without controlling for age.
The unsupervised partition was selected, not assumed. Of 41 solutions from six algorithms, 26 were admissible, and K-means with seven clusters ranked first across eleven validity indices and reproduced itself with an adjusted Rand index of 0.985 under bootstrap refitting. DBSCAN found no admissible partition at any radius and fuzzy C-means degenerated beyond three clusters, so small-firm accounts form a continuum rather than separate groups. The seven configurations are nonetheless economically legible, from materials-intensive producers with a median markup of 1.060 to asset-light service firms at 1.159, the latter consistent with the higher markups in services documented by Díez et al. (2021). They recover part of the register without being given it (Cramér’s V = 0.29), yet 62 per cent of firms observed for five years or more pass through at least two of them: configurations are states, not types, unlike the taxonomies of Biga Diambeidou and Gailly (2011) or Centobelli et al. (2022), which classify firms once.
Two results follow from using the partition as a test. Conditioning on configuration doubles the explained variance of the pooled regression but moves the start-up coefficient only from −0.106 to −0.090, so the certified discount is not a matter of how firms produce. And the status coefficients are heterogeneous. Entry lowers markups by 5.0 per cent in fixed-asset-heavy firms and not at all in materials-intensive ones (equality rejected at p < 0.001). At the expiry, instrumented effects run from −6.4 per cent in fixed-asset-heavy and −5.4 per cent in materials-intensive firms to +2.8 per cent among those capitalising development, with the joint and equality tests both rejecting at p ≤ 0.001. The average null is therefore an average of opposite responses. The pattern fits the heterogeneity by firm type found for the Korean venture certification (Pyo & Park, 2020) and by strategy among Spanish SMEs (Máñez et al., 2022), and points to the relief acting on costs where production uses materials and fixed capital. No cluster-level coefficient survives a Bonferroni correction on its own, so it is the joint rejection that carries the result.
Six learners were compared on ten indicators with folds grouped by firm, on data demeaned exactly as the fixed-effects estimator demeans them. Gradient boosting (Friedman, 2001) ranked first overall, narrowly ahead of the random forest (Breiman, 2001). The learners were used to test the equation, as Mullainathan and Spiess (2017) and Athey and Imbens (2019) recommend, not to predict. On the equation’s own variables no learner explains more than 1.2 per cent of within-firm variation and interactions supply most of the small gain, so the linear additive form loses little. The start-up effect is the same under every method: −0.024 under fixed effects, −0.025 as the boosting average marginal effect, and −0.024 with a standard error of 0.006 by double machine learning (Chernozhukov et al., 2018). The instrumented expiry effect moves from −0.005 to +0.004, both with standard errors of about 0.014.
The learners also expose what the equation omits. With the eight configuration ratios added, out-of-sample R² rises from 0.051 to 0.146, so operating configuration carries real within-firm information about markups. The most important variable, the personnel-cost share, is partly mechanical, because personnel cost enters the translog elasticity — a reminder, in the spirit of Bond et al. (2021), that what a production-based markup measures depends on how it is built. One result pulls against the partition: the boosted start-up effect varies only between −0.019 and −0.034 across configurations, against five points in the interacted regression. The ordering is the same, but the size of the cluster-level differences should be read with caution.
Table 12 summarises the results and classifies each against the reference literature as consistent, in opposition, or original, where the question has not been asked before.
Taken together, the results are consistent with the literature where it is well established — the level and life cycle of markups, the fragility of revenue-based estimates, the selectivity of registration — and original where it is silent: the price margin of certified firms, the statutory expiry as a source of variation, and the use of partitions and learners as tests of the equation rather than as descriptions or forecasts. The single point of opposition concerns what a public label can do. Attached to a product it shapes prices; attached to a firm, and then removed, it does not.
8. Policy Implications
The first implication concerns what the register does. The discount in markups of certified firms — about 12 per cent between firms, 2 per cent within them and nothing once persistence is allowed for — shows that registration selects firms with a particular cost structure rather than changing how they price. Registration therefore works as a screen, identifying young, small and input-intensive firms, which is consistent with the selective take-up documented by Cantarella et al. (2024) and with the distinct financial profile of registered firms in Anderloni and Harasheh (2025). A regime that screens well can be judged on whether the screened firms receive what they need, not on whether registration transforms them.
The second implication concerns rents. A recurring concern about targeted support is that public relief is captured as margin rather than passed on in lower prices or higher investment. The evidence does not support that concern here: markups do not rise on entry and do not fall when the benefits end. The effects documented by the evaluations of the Start-up Act — more equity and debt, more employment, easier access to guaranteed credit (Manaresi et al., 2021; Biancalani et al., 2022; Giraudo et al., 2019; Ferrucci et al., 2021) — are therefore not accompanied by a transfer to the firm’s price margin. This contrasts with product certification, which firms use strategically to price discriminate (Houde, 2022, 2026). A label attached to the firm, rather than to its products, appears to carry little pricing power.
The third implication concerns the duration of status. The fixed sixty-month limit is often discussed as a cliff that could harm firms at the moment they lose support. On average the cliff leaves markups untouched, so extending the duration of status cannot be justified by the need to protect margins. The average, however, conceals configurations in which margins fall by five to six per cent when status ends — fixed-asset-heavy and materials-intensive firms — and others in which they do not. Where support operates on the cost of capital and inputs, a gradual phase-out, or a duration tied to the firm’s balance-sheet configuration rather than its age alone, would reduce that loss at little cost. The heterogeneity by firm type found for the Korean venture certification (Pyo & Park, 2020) and the experience with phasing out a venture-capital tax credit (Cumming & Johan, 2010) point in the same direction.
The fourth implication concerns evaluation. Markups can be monitored from the statutory accounts every firm files, provided that changes rather than levels are used (De Ridder et al., 2026), and this outcome should enter the evaluation of any regime that reduces the costs of a class of firms. The Italian design also offers identification that remains underused: statutory dates, and amendments that move them, such as the 2020 extension, generate variation that the firm does not choose. Regional schemes, whose effects are often null (Santoleri & Russo, 2025), could be evaluated with the same tools.
9. Limitations
The first limitation is the measurement of output. Statutory accounts report revenue, not quantities, so the elasticity is a revenue elasticity and the level of the markup is not identified (Klette & Griliches, 1996; Bond et al., 2021). The paper responds by drawing inference only from within-firm changes, which are robust to a bias that is constant within firms or common across them (De Ridder et al., 2026). A bias that varies within firms over time — for instance, if certification changed output prices and input quantities in ways the production function cannot separate — would not be removed. Estimates obtained with revenue data may also partly capture input distortions rather than output market power (Hashemi et al., 2022), and markups computed from different flexible inputs can diverge (Raval, 2023b).
The second limitation concerns the production function itself. Fixed assets are reconstructed from net worth and the structural margin and include financial holdings and capitalised intangibles, which helps explain a small negative capital elasticity. Sector codes exist only for certified firms, so the baseline technology is common to all firms; the sector-specific estimates on certified firms return implausible elasticities in two sectors. The control-function procedure of Ackerberg et al. (2015) was applied as intended, but its identifying timing assumptions cannot be tested with annual accounts.
The third limitation is selection. A markup is defined only for firm-years with positive revenue and personnel cost, which excludes almost a third of start-up years without sales and nearly half of those with sales but no employees. The results describe start-ups that sell and employ, not the earliest stage the regime was designed for, and correcting for this selection would require a model of the decision to hire that the accounts cannot support. The dynamic estimates, in turn, rest on lagged markups as instruments, and the overidentified version fails the Sargan test.
The comparison population raises a further issue. Ordinary SMEs were extracted among active firms, whereas the certified populations include failed and ceased firms, so survivorship differs across groups; and their incorporation dates are imputed from the chamber-of-commerce registration number, reliably for young firms but with compressed ages for older ones. Both issues affect the between-firm comparison more than the within-firm estimates, which condition on the firm.
The fourth concerns identification of the expiry. Past start-up spells are not recorded, so graduates are inferred from the timing of their transfer to the SME section.
Graduates are, moreover, observed only if they re-registered as innovative SMEs and remained active: start-ups that lost their status without re-registering cannot be identified in the current registers, so the expiry estimates refer to firms that continued to qualify as innovative, and they measure a partial withdrawal of benefits, since innovative SMEs keep the tax relief for investors and simplified access to guaranteed credit.
The statutory date is a function of age, and although age is controlled, the specification using only the 2020 extension has a first-stage F of 18 and is imprecise. The event study relies on the parallel-trends assumption, tested but not guaranteed (Sun & Abraham, 2021).
Finally, configuration is itself an outcome, so cluster-specific coefficients describe where status matters rather than proving why; no single cluster coefficient survives a Bonferroni correction, and gradient boosting compresses the dispersion the partition finds. The learners validate the specification on the variables supplied to them (Chernozhukov et al., 2018; Mullainathan & Spiess, 2017) and cannot detect what the accounts do not record. The evidence covers one country and 2015–2024.
10. Conclusions
This paper asked whether a public regime for young innovative firms changes the margin those firms earn over their marginal cost. The Italian regime offers an unusually clean setting for the question: it grants a bundle of fee exemptions, tax relief for investors and privileged access to guaranteed credit to firms that register, and it removes start-up status on a date fixed by law. Markups were estimated from the statutory accounts of certified start-ups, certified innovative SMEs and ordinary SMEs, and the same observations were analysed with panel estimators, an unsupervised partition and regression learners.
Three conclusions emerge. The first is that certified firms price below ordinary SMEs, but the discount is a property of the firms rather than a consequence of registration. The gap is large between firms and small within them, and it disappears once markups are allowed to adjust gradually. Certified firms spend a larger share of each euro of sales on purchased inputs, and that cost structure, not the register, accounts for most of the difference.
The second conclusion is that the end of start-up status does not change markups on average. The date on which status is lost is set by law, not chosen by the firm, and a one-year extension granted to some cohorts separates the policy from the natural evolution of markups with age. Around that date the markup profile is flat, and the instrumented effect is close to zero with a strong first stage. Neither the prediction that the relief lowers marginal cost nor the prediction that the label raises prices finds support.
The third conclusion is that the average hides responses of opposite sign. When firms are grouped by how they produce and finance themselves, the loss of status lowers margins by five to six per cent where production relies on materials and fixed capital, and not where it relies on development and personnel. The joint evidence for this heterogeneity is strong, although no single group’s estimate is decisive on its own. Regression learners, run on the same transformed data, confirm that the linear equation captures the status effects correctly, while showing that operating configuration explains a part of markup variation the equation leaves aside.
Methodologically, the three strategies were run against one another on the same rows. The partition could have shown the pooled coefficient to be meaningless and the learners could have reversed its sign; that the central estimate survives both, in a qualified form, is stronger than any one strategy could establish.
For policy, the start-up regime neither creates market power that its expiry dissipates nor props up margins that would otherwise collapse. Whatever it relieves, it does not operate through price. The heterogeneity at the expiry suggests that a smoother exit, tied to the firm’s configuration rather than its age alone, would protect the firms most exposed. Future work should combine the accounts with price and quantity data, to identify the level of markups as well as their changes, and follow the firms that never sell or employ, which the present design cannot observe.
Supplementary Materials
The following supporting information can be downloaded at the website of this paper posted on Preprints.org.
Acknowledgments
This research was supported by the project “LUtech Campus Ecosystem—LUCE” (Project Code: 22ROJB5), funded under a subsidized financing scheme of the Puglia Region within the framework of a Program Agreement (Contratto di Programma). The authors gratefully acknowledge this financial support, which made this study possible.
Appendix A. Production Function and Markup Estimation
The production function is estimated on every firm-year with positive revenue, purchased inputs, personnel cost and reconstructed fixed assets, pooled across the three populations. Output is revenue from sales; no firm-level price deflator exists in statutory accounts, so year effects absorb common movements in output and input prices, and the elasticity is a revenue elasticity in the sense of Klette and Griliches (1996). In the first stage log revenue is regressed on a third-order polynomial in the three log inputs and on year effects; the fit has an R² of 0.962, and the residual ε̂ is the measurement error by which revenue is corrected in the expenditure share. In the second stage productivity is recovered as φ̂ minus the input terms, follows a cubic Markov process, and the innovation is made orthogonal to current fixed assets, lagged personnel cost and lagged purchased inputs, and to their squares and cross-products in the translog case. Personnel cost is treated as chosen a period ahead, purchased inputs as flexible. Table A1 reports the estimates.

Table A1.
Production function estimates.
| Cobb–Douglas, OLS | Cobb–Douglas, ACF | Translog, OLS | Translog, ACF | |
| Purchased inputs, v | 0.7594 | 0.5712 (0.0150) | 0.6970 | 0.7098 (0.1020) |
| Personnel cost, l | 0.3632 | 0.5095 (0.0193) | 0.5373 | 0.6024 (0.0458) |
| Fixed assets, k | −0.0232 | −0.0293 (0.0047) | −0.0531 | −0.1415 (0.0678) |
| v² | 0.0524 | 0.0690 (0.0456) | ||
| l² | 0.0653 | 0.0844 (0.0410) | ||
| k² | −0.0002 | −0.0037 (0.0026) | ||
| v·l | −0.1322 | −0.1792 (0.0643) | ||
| v·k | 0.0126 | 0.0225 (0.0069) | ||
| l·k | −0.0077 | −0.0005 (0.0060) | ||
| Median θᵛ | 0.571 (0.015) | 0.683 (0.031) | ||
| θᵛ, 10th–90th percentile | constant | 0.412 – 0.915 | ||
| Median θˡ; median θᵏ | 0.509; −0.029 | 0.377; −0.015 | ||
| Returns to scale, median | 1.051 | 1.043 | ||
| Observations, second stage | 68,155 | 68,155 |
Note. Dependent variable: log revenue. OLS columns are the naive least-squares estimates on the same sample. ACF columns: two-step GMM of Ackerberg et al. (2015); bootstrap standard errors in parentheses, from 40 firm-level resamples of both stages and computed as the interquartile range divided by 1.349, because two Cobb–Douglas replications failed to converge and would otherwise dominate the dispersion. First stage on 81,784 firm-years; the second stage loses each firm’s first year. Elasticities in the translog vary by firm-year and are evaluated at observed inputs.
Purchased inputs carry the largest elasticity under both functional forms, and the correction moves it in the direction the simultaneity argument predicts for Cobb–Douglas, from 0.759 under least squares to 0.571, because the flexible input responds to productivity the econometrician does not see. The capital elasticity is small and negative. That is a known outcome when fixed assets include financial holdings and capitalised intangibles, as the structural-margin reconstruction does, and when output is revenue; it does not bear on the markup, which uses only the elasticity of the flexible input, and returns to scale at the median are close to constant. The translog allows the elasticity to vary with input mix, and Figure A1 shows why that matters here.
Figure A1.
Output elasticity by population, and the log markup over the life cycle. Note. Left: kernel densities of the translog elasticity θᵛ. Right: mean ln μ by completed years of age, with 95 per cent confidence bands; cells with fewer than one hundred observations omitted. Age is imputed for ordinary SMEs (Appendix B). The shaded band marks the ages at which the statutory term expires.
Figure A1.
Output elasticity by population, and the log markup over the life cycle. Note. Left: kernel densities of the translog elasticity θᵛ. Right: mean ln μ by completed years of age, with 95 per cent confidence bands; cells with fewer than one hundred observations omitted. Age is imputed for ordinary SMEs (Appendix B). The shaded band marks the ages at which the statutory term expires.
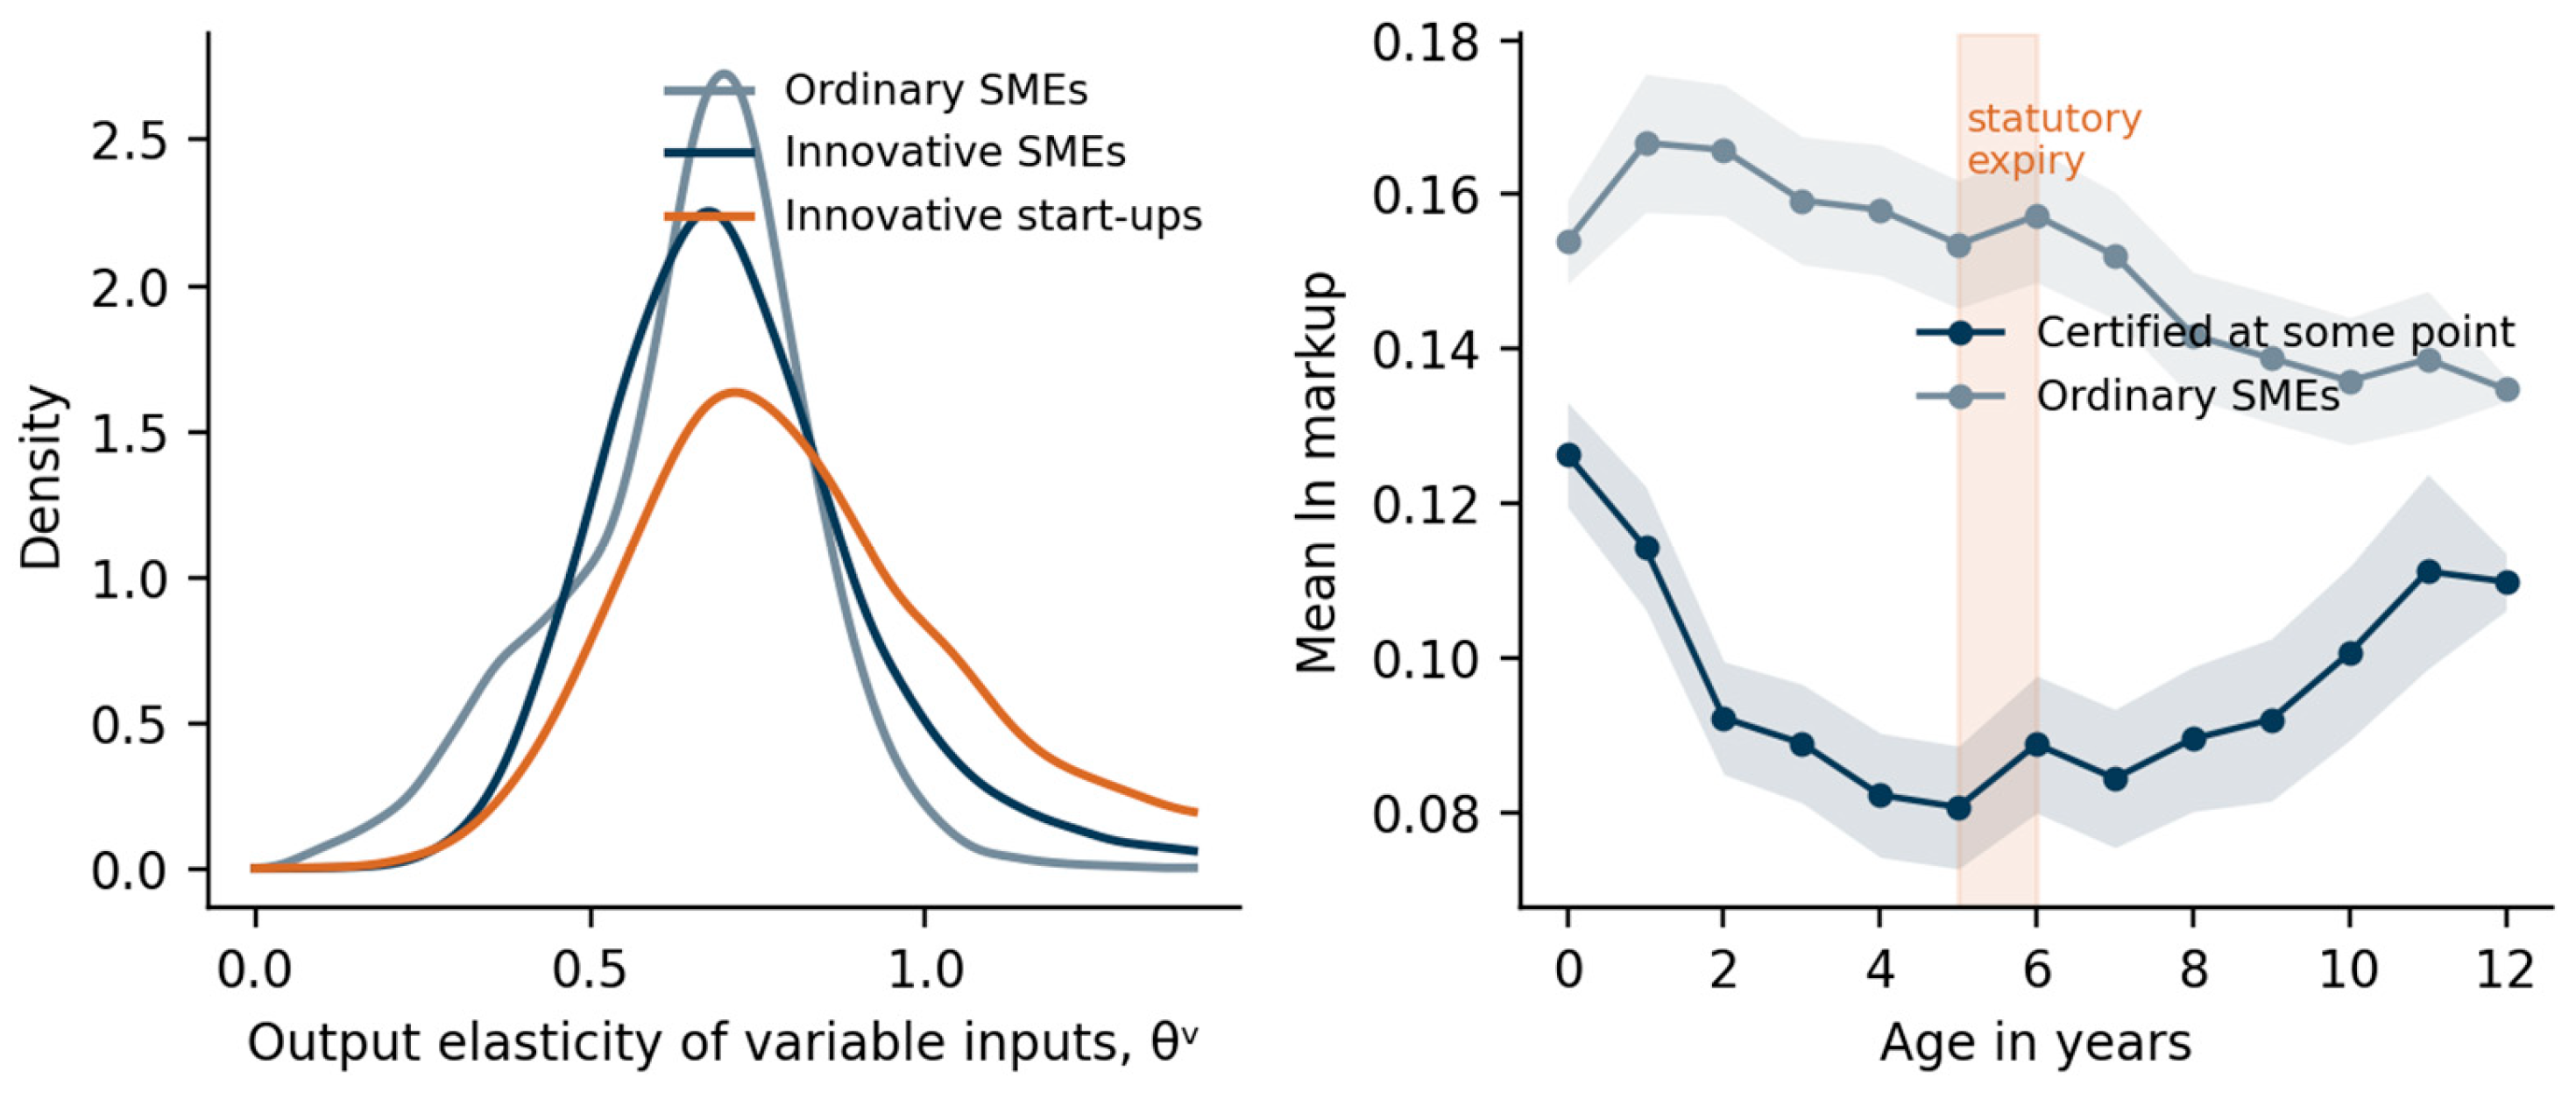
Start-ups have the highest and most dispersed elasticities, because their input mix is tilted towards purchased services, and a Cobb–Douglas form would impose on them the technology of an ordinary SME. The right panel shows the life cycle the panel estimators must absorb: among firms that were certified at some point the log markup falls over the first four years and recovers from the seventh, while ordinary SMEs, observed mostly at older ages, decline slowly. The statutory expiry falls at the trough, which is why age enters every within specification and why the instrument is also estimated with age dummies. Table A2 reports what happens to the level of the markup under alternative technologies.
Table A2.
The markup level under alternative technologies.
| Technology | Sample | Obs. | Median θᵛ | Median μ |
| Translog, pooled (baseline) | All firms | 81,784 | 0.683 | 1.092 |
| Cobb–Douglas, pooled | All firms | 81,784 | 0.571 | 0.890 |
| Translog, Manufacturing | Certified firms | 4,613 | 0.851 | 1.030 |
| Translog, ICT | Certified firms | 12,011 | 0.641 | 0.957 |
| Translog, Professional & R&D | Certified firms | 5,827 | 1.169 | 1.578 |
| Translog, Other | Certified firms | 3,376 | 1.301 | 1.611 |
| Translog in v and k only | Including years without personnel | 90,313 | 1.224 | 2.387 |
Note. Sector-specific estimates use ATECO 2007 divisions from the registers, which exist only for certified firms: manufacturing 10–33, ICT 58–63, professional and R&D services 69–75, all other divisions pooled. The two-input specification omits personnel cost and therefore retains firms with no employees.
The level is not robust and the paper does not rely on it. Cobb–Douglas places the median below one; sector-specific translogs return elasticities above one in professional services and in the residual group, which no flexible input can have; and dropping personnel cost loads the labour contribution onto purchased inputs and doubles the markup. These are the problems Bond et al. (2021) and Raval (2023b) document for revenue-based production functions. What survives every variant is the within-firm response to status, reported in Appendix E, because a bias in the elasticity that is constant within a firm, or common across firms, is absorbed by the fixed effects.
The same logic explains why the event study of Section 4 uses the translog. Under a Cobb–Douglas elasticity markups appear to rise at the expiry, but only because they were already rising in the preceding years, and the pre-trend test fails decisively (p = 0.001); under the translog the profile is flat on both sides of the event (Supplementary Material S3).
Appendix B. Sample Construction and Regulatory Status
The accounts come from thirty AIDA exports built on an identical template of 136 items: the full population of registered innovative start-ups and innovative SMEs, the failed and ceased firms of both registers, and eleven regional extractions of active ordinary SMEs with total assets below 43 million euro and at most 250 employees. Records are deduplicated on tax code and year, and a firm appearing in several exports is assigned to one population with priority to the start-up register, then to the SME register. Table B1 reports the attrition.
Table B1.
From filed accounts to the estimation sample.
| Step | Firm-years | Firms |
| Filed accounts, 2015–2024 | 105,451 | 17,480 |
| Positive revenue | 96,582 | 15,668 |
| Positive materials and services | 96,223 | 15,623 |
| Positive reconstructed fixed assets | 91,227 | 15,035 |
| Positive personnel cost | 82,612 | 12,730 |
| After trimming expenditure share (0.5/99.5) | 81,784 | 12,623 |
| Markup defined and inside 1st–99th percentile | 80,138 | 12,438 |
| Regulatory status known (estimation sample) | 76,466 | 11,845 |
Note. The step on regulatory status removes failed firms for which neither register reports dates, so that their status in each year cannot be established; they are retained in the production-function sample.
Two steps bind. Positive revenue removes almost a third of start-up years, those of firms not yet selling, and positive personnel cost removes a further 46 per cent of start-up years with revenue, against one per cent among ordinary SMEs. The markup is therefore estimated on start-ups that sell and employ, which is the population for which a price over marginal cost is meaningful, but it is a selected one and the selection is stated rather than corrected. Supplementary Table S1.1 describes the estimation sample by population.
Incorporation dates are taken from the registers for certified firms. For ordinary SMEs, whose accounts carry no incorporation date, the year is imputed by isotonic regression of the incorporation date on the chamber-of-commerce registration number within each province, trained on certified firms; five-fold cross-validation gives a mean absolute error of 0.27 years. The training set contains few firms incorporated before 2012, so imputed ages are reliable in the range where the expiry falls and compressed above it, which is one reason age enters the within specifications as a smooth function.
Status is coded year by year from the register dates. For start-ups still on the register the start-up indicator switches on in the year of entry into the section, so the 559 start-ups that filed accounts before registering supply within-firm variation on entry. For innovative SMEs the SME indicator switches on in the year of entry into that section. The registers do not record past start-up status, so graduates are identified from the distribution in Figure B1.
Figure B1.
Months from incorporation to entry in the innovative-SME section. Note. Innovative SMEs incorporated after 20 October 2012, when Decree-law 179/2012 introduced the start-up section; n = 1,983. The shaded band is the window used to define graduates; entries after 120 months are pooled in the last bin.
Figure B1.
Months from incorporation to entry in the innovative-SME section. Note. Innovative SMEs incorporated after 20 October 2012, when Decree-law 179/2012 introduced the start-up section; n = 1,983. The shaded band is the window used to define graduates; entries after 120 months are pooled in the last bin.
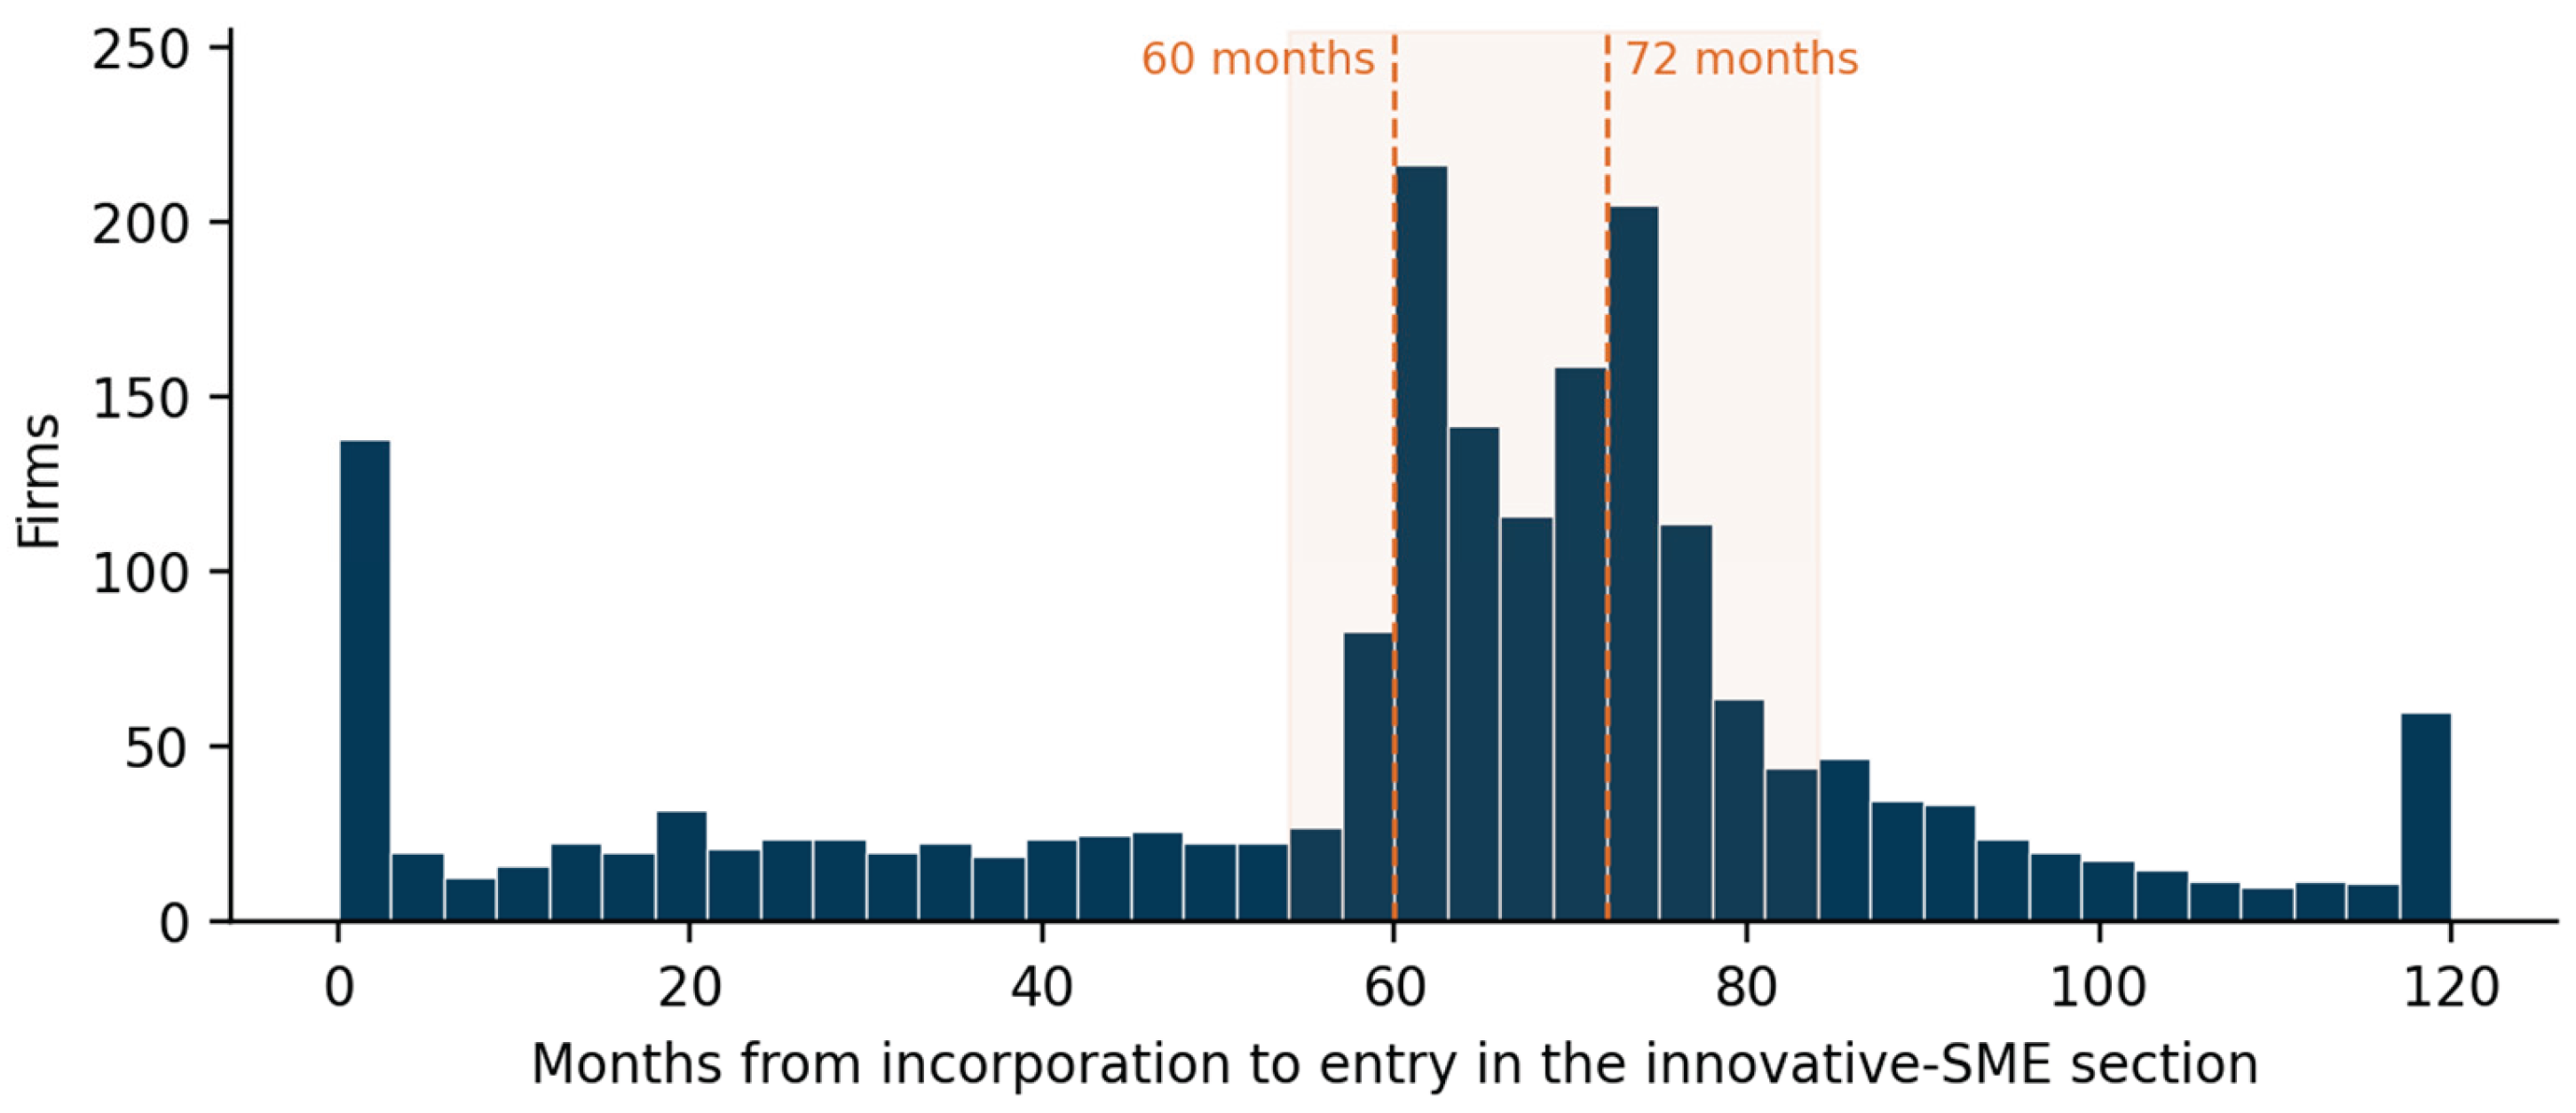
The mass between 54 and 84 months is the transfer of former start-ups at the end of their term: 1,171 of the 1,983 innovative SMEs incorporated after the start-up regime began enter the SME section inside that window, against a roughly flat density elsewhere, apart from the firms that enter the SME section at incorporation. The two modes at sixty and seventy-two months correspond to the original term and to the twelve-month extension that Decree-law 34/2020, art. 38, granted to firms on the register on 19 May 2020. Graduates are coded as start-ups from incorporation to transfer and as SMEs afterwards. The statutory term is computed for every firm ever on the start-up register as incorporation plus sixty months, or seventy-two for firms whose sixty months had not elapsed by 19 May 2020, and Z switches on in the year it is reached. Seventy per cent of graduates were entitled to the extension, and 128 start-ups still on the register had passed the statutory term by 2024, which is why Z and EXIT differ and why the first stage is not one.
Appendix C. Dynamic Specification
Markups are persistent, and a static equation with firm effects can attribute to status a slow adjustment that belongs to the lagged markup. Table C1 reports four dynamic estimators; the least-squares pair brackets the true persistence from below and above (Nickell, 1981; Bond, 2002).
Table C1.
Dynamic estimates of the log markup.
| Pooled OLS with lag | FE with lag | Anderson–Hsiao | Arellano–Bond, 2SLS | |
| ln μ(t−1) | 0.8375*** | 0.3131*** | 0.3664*** | 0.4491*** |
| (0.0047) | (0.0110) | (0.0216) | (0.0525) | |
| SU | −0.0286*** | −0.0005 | 0.0005 | −0.0041 |
| (0.0022) | (0.0048) | (0.0063) | (0.0065) | |
| PMI | −0.0094*** | 0.0051** | 0.0013 | 0.0001 |
| (0.0012) | (0.0026) | (0.0033) | (0.0033) | |
| SIZE | −0.0036*** | 0.0081*** | −0.0034 | 0.0023 |
| (0.0003) | (0.0017) | (0.0023) | (0.0026) | |
| AGE | 0.0024*** | 0.0101*** | 0.0213*** | 0.0108** |
| (0.0005) | (0.0027) | (0.0042) | (0.0044) | |
| Long-run SU effect | −0.1763 | −0.0007 | 0.0009 | −0.0074 |
| First-stage F | 867 | 625 | ||
| Sargan (p) | — | 21.7 (0.0000) | ||
| Observations | 63,490 | 63,490 | 52,719 | 43,412 |
Note. Firm-clustered standard errors in parentheses. Pooled OLS includes year effects; FE includes firm and year effects. Anderson–Hsiao (1981) and Arellano–Bond (1991) are estimated in first differences with year effects, instrumenting the lagged difference with ln μ(t−2), and with ln μ(t−2) and ln μ(t−3), respectively. Coefficients on differenced regressors are reported under the level names. Long-run effect = β/(1 − ρ).
The Anderson–Hsiao persistence of 0.366 lies inside the least-squares bounds and is the reference. The Arellano–Bond estimate of 0.449 also lies inside them, but the Sargan test rejects the second instrument, which is what serially correlated measurement error in an estimated markup would produce, and the overidentified estimate is reported without being used. In every dynamic column the start-up coefficient is small and insignificant, so the static within effect of Table 3 is best read as an upper bound on what registration does to price.
Appendix D. Instrumental Variables and the Partial Withdrawal of Treatment
The instrument is the year in which the statutory term is reached, and the endogenous regressor is the actual loss of start-up status. Relevance is not in question. The exclusion restriction requires that reaching the statutory date affects the markup only through the loss of status, conditional on firm and year effects, size and age. The threat is that the date is a deterministic function of age, so any discontinuity in the life cycle at five years would be attributed to the expiry. Two features limit it: the 2020 extension moves the date by one year for adjacent cohorts, and the age-dummy specification uses only that variation. Table D1 reports five specifications.
Table D1.
Instrumental-variable estimates of the loss of start-up status.
| Specification | First stage | F | OLS | Reduced form | 2SLS | DWH p | Obs. |
| A. Smooth age | 0.4903*** (0.018) | 750.2 | 0.0078 (0.0065) | −0.0025 (0.0062) | −0.0052 (0.0127) | 0.234 | 12,224 |
| B. Age dummies | 0.1527*** (0.036) | 18.1 | 0.0178** (0.0078) | −0.0097 (0.0095) | −0.0638 (0.0631) | 0.188 | 12,224 |
| C. Cohorts expiring by 2024 | 0.4622*** (0.019) | 586.9 | 0.0108 (0.0066) | 0.0001 (0.0061) | 0.0003 (0.0133) | 0.393 | 5,378 |
| D. Cobb–Douglas markup | 0.4903*** (0.018) | 750.2 | 0.0085 (0.0124) | −0.0105 (0.0116) | −0.0214 (0.0237) | 0.154 | 12,224 |
| E. Cost share only (−ln α) | 0.4903*** (0.018) | 750.2 | −0.0323 (0.0240) | −0.0167 (0.0228) | −0.0340 (0.0465) | 0.967 | 12,224 |
Note. Firm and year effects partialled out by alternating projections; SIZE and, except in the second row, ln(1 + age) as controls. Firm-clustered standard errors in parentheses. Rows: A, baseline; B, eleven age dummies; C, only cohorts whose statutory term falls by 2024; D, Cobb–Douglas markup; E, the log of the inverse uncorrected expenditure share, which carries no production-function estimate at all.
Every specification returns an instrumented effect indistinguishable from zero, and in none does the Durbin–Wu–Hausman test reject, so the actual exit is not detectably endogenous and the least-squares and event-study estimates stand. The last row matters most for credibility: with no production-function input at all, the expenditure share does not move at the expiry either, so the null is not produced by the elasticity.
Table D2 reports the evidence on the partial nature of the treatment discussed in Section 4.
Table D2.
The expiry as a partial withdrawal of treatment.
| Specification | Coefficient | Std. error | Firm-years | Firms |
| Entry into the SME section, firms never on the start-up register | 0.006* | 0.0034 | — | 1,143 switchers |
| Uncertified interval between statutory expiry and SME entry, graduates | 0.004 | 0.0104 | 219 | 193 |
| Years after entry into the SME section, graduates | 0.006 | 0.0064 | — | 1,097 graduates |
| 2SLS, loss of start-up status (Table 4) | −0.005 | 0.0127 | 12,224 | 3,787 |
| Implied bound on a complete withdrawal, 50% of relief retained | ≥ −0.060 | — | — | — |
Note. Dependent variable ln μ. Rows 1–3: two-way fixed-effects regressions with SIZE and AGE and firm-clustered standard errors. Row 1 is estimated on all firms except graduates, with SU and PMI as regressors. Rows 2–3 are estimated jointly on graduates and on the control groups of Figure 3, with the start-up years of graduates as the reference; the uncertified interval is the set of years from the statutory expiry to the year before entry into the SME section. Row 5 divides the lower end of the 95 per cent interval of row 4 by the share of relief withdrawn (0.5), assuming the effect is proportional to it. * p < 0.10.
The uncertified interval is the closest the data come to a complete withdrawal of status, and it shows no fall in markups. Its evidence is limited in two ways: most intervals last one or two years, and the firms that experience them are those that later re-registered, which selects firms that continued to qualify as innovative. It is therefore reported as supporting evidence rather than as a separate estimate of the effect of full withdrawal.
Appendix E. Robustness
Table E1 reports the two-way fixed-effects status coefficients and the baseline instrumental-variable estimate under seven constructions of the dependent variable and of the sample.
Table E1.
Robustness of the within estimates.
| Variant | SU, FE firm + year | PMI, FE firm + year | Obs. | EXIT, 2SLS | First-stage F | Obs. (IV) |
| Baseline: translog, pooled technology | −0.0240*** (0.0062) | −0.0007 (0.0034) | 76,466 | −0.0052 (0.0127) | 750 | 12,224 |
| Cobb–Douglas elasticity | −0.0428*** (0.0127) | 0.0111 (0.0074) | 76,502 | −0.0326 (0.0246) | 724 | 12,181 |
| Expenditure share only, no correction | −0.0751*** (0.0188) | 0.0144 (0.0112) | 76,466 | 0.0029 (0.0401) | 738 | 12,162 |
| Sector-specific translog, certified firms | −0.0224** (0.0088) | −0.0016 (0.0055) | 25,074 | −0.0005 (0.0157) | 752 | 12,372 |
| Trimmed at 5th/95th percentiles | −0.0160*** (0.0049) | 0.0031 (0.0028) | 70,218 | 0.0034 (0.0103) | 630 | 9,994 |
| Excluding 2020 and 2021 | −0.0162** (0.0069) | −0.0005 (0.0038) | 60,514 | −0.0103 (0.0158) | 419 | 9,801 |
| Firms observed five years or more | −0.0099 (0.0069) | 0.0018 (0.0034) | 67,036 | −0.0088 (0.0132) | 582 | 6,023 |
Note. Each row re-estimates the markup or the sample as described and re-trims at the first and ninety-ninth percentiles unless stated. Firm-clustered standard errors in parentheses. The sector-specific row is restricted to certified firms, for which the ATECO division is available.
The start-up coefficient is negative in every row and ranges from −0.010 to −0.075; it is largest when the dependent variable carries no elasticity and smallest on firms observed for five years or more, whose entry into the register is least likely to coincide with the beginning of sales. The SME coefficient is never economically meaningful, and the instrumented expiry effect is insignificant in every row. The design has three limits. Output is revenue, so a price increase and a productivity gain are not separated inside the elasticity. The registers do not record past start-up spells, so graduates are inferred from timing. And the start-up population with a defined markup is the part that sells and employs, which is not the population the regime was designed for at its earliest stage.
References
- Accetturo, A. Subsidies for innovative start-ups and firm entry. Industrial and Corporate Change 2022, 31(5), 1202–1222. [Google Scholar] [CrossRef]
- Ackerberg, D. A.; Caves, K.; Frazer, G. Identification properties of recent production function estimators. Econometrica 2015, 83(6), 2411–2451. [Google Scholar] [CrossRef]
- Albanese, G.; Bronzini, R. The impact of public incentives on the birth of innovative start-ups. Small Business Economics 2026, 66(3), 1309–1332. [Google Scholar] [CrossRef]
- Anderloni, L.; Harasheh, M. Innovative startups and their traditional peers: Further evidence using performance and survival analysis. Review of Financial Economics 2025, 43(3), 317–335. [Google Scholar] [CrossRef]
- Anderson, T. W.; Hsiao, C. Estimation of dynamic models with error components. Journal of the American Statistical Association 1981, 76(375), 598–606. [Google Scholar] [CrossRef]
- Arellano, M.; Bond, S. Some tests of specification for panel data: Monte Carlo evidence and an application to employment equations. Review of Economic Studies 1991, 58(2), 277–297. [Google Scholar] [CrossRef]
- Asprilla, A.; Berman, N.; Cadot, O.; Jaud, M. Trade policy and market power: Firm-level evidence. International Economic Review 2019, 60(4), 1647–1673. [Google Scholar] [CrossRef]
- Athey, S.; Imbens, G. W. Machine learning methods that economists should know about. Annual Review of Economics 2019, 11, 685–725. [Google Scholar] [CrossRef]
- Baltagi, B. H.; Li, Q. A Lagrange multiplier test for the error components model with incomplete panels. Econometric Reviews 1990, 9(1), 103–107. [Google Scholar] [CrossRef]
- Bassi, F.; Dias, J. G. Sustainable development of small- and medium-sized enterprises in the European Union: A taxonomy of circular economy practices. Business Strategy and the Environment 2020, 29(6), 2528–2541. [Google Scholar] [CrossRef]
- Biancalani, F.; Czarnitzki, D.; Riccaboni, M. The Italian Start Up Act: A microeconometric program evaluation. Small Business Economics 2022, 58(3), 1699–1720. [Google Scholar] [CrossRef]
- Biga Diambeidou, M.; Gailly, B. A taxonomy of the early growth of Belgian start-ups. Journal of Small Business and Enterprise Development 2011, 18(2), 194–218. [Google Scholar] [CrossRef]
- Bond, S. Dynamic panel data models: A guide to micro data methods and practice. Portuguese Economic Journal 2002, 1(2), 141–162. [Google Scholar] [CrossRef]
- Bond, S.; Hashemi, A.; Kaplan, G.; Zoch, P. Some unpleasant markup arithmetic: Production function elasticities and their estimation from production data. Journal of Monetary Economics 2021, 121, 1–14. [Google Scholar] [CrossRef]
- Bracht, F.; Mahieu, J.; Vanhaverbeke, S. The signaling value of legal form in entrepreneurial debt financing. Journal of Business Venturing 2024, 39(3), 106380. [Google Scholar] [CrossRef]
- Breiman, L. Random forests. Machine Learning 2001, 45(1), 5–32. [Google Scholar] [CrossRef]
- Breusch, T. S.; Pagan, A. R. The Lagrange multiplier test and its applications to model specification in econometrics. Review of Economic Studies 1980, 47(1), 239–253. [Google Scholar] [CrossRef]
- Burstein, A. T.; Carvalho, V. M.; Grassi, B. Bottom-up markup fluctuations. Quarterly Journal of Economics 2025, 140(4), 2619–2684. [Google Scholar] [CrossRef]
- Caliendo, M.; Künn, S. Start-up subsidies for the unemployed: Long-term evidence and effect heterogeneity. Journal of Public Economics 2011, 95(3-4), 311–331. [Google Scholar] [CrossRef]
- Cantarella, M.; Fraccaroli, N.; Volpe, R. Does language prevent policy take-up? Evidence from the Italian Start-up Act. Research Policy 2024, 53(6), 105004. [Google Scholar] [CrossRef]
- Cavicchioli, M.; Kocollari, U. Learning from failure: Big data analysis for detecting the patterns of failure in innovative startups. Big Data 2021, 9(2), 79–88. [Google Scholar] [CrossRef]
- Centobelli, P.; Cerchione, R.; Esposito, E.; Passaro, R.; Quinto, I. The undigital behavior of innovative startups: Empirical evidence and taxonomy of digital innovation strategies. International Journal of Entrepreneurial Behaviour and Research 2022, 28(9), 219–241. [Google Scholar] [CrossRef]
- Chernozhukov, V.; Chetverikov, D.; Demirer, M.; Duflo, E.; Hansen, C.; Newey, W.; Robins, J. Double/debiased machine learning for treatment and structural parameters. The Econometrics Journal 2018, 21(1), C1–C68. [Google Scholar] [CrossRef]
- Chiavari, A. Customer accumulation, returns to scale, and secular trends. Journal of Monetary Economics 2026, 160, 103935. [Google Scholar] [CrossRef]
- Ciapanna, E.; Formai, S.; Linarello, A.; Rovigatti, G. Measuring market power: Macro- and micro-evidence from Italy. Empirical Economics 2024, 67(6), 2677–2717. [Google Scholar] [CrossRef]
- Cumming, D.; Johan, S. Phasing out an inefficient venture capital tax credit. Journal of Industry, Competition and Trade 2010, 10(3), 227–252. [Google Scholar] [CrossRef]
- Czarnitzki, D.; Delanote, J. R&D policies for young SMEs: Input and output effects. Small Business Economics 2015, 45(3), 465–485. [Google Scholar] [CrossRef]
- Dai, X.; Cheng, L. The impact of product innovation on firm-level markup and productivity: Evidence from China. Applied Economics 2018, 50(42), 4570–4581. [Google Scholar] [CrossRef]
- De Angelis, L. When too much is too little: Evaluating the Italian Startup Act. Journal of Private Equity 2018, 21(4), 29–39. [Google Scholar] [CrossRef]
- De Loecker, J.; Warzynski, F. Markups and firm-level export status. American Economic Review 2012, 102(6), 2437–2471. [Google Scholar] [CrossRef]
- De Loecker, J.; Eeckhout, J.; Unger, G. The rise of market power and the macroeconomic implications. Quarterly Journal of Economics 2020, 135(2), 561–644. [Google Scholar] [CrossRef]
- De Loecker, J.; Goldberg, P. K.; Khandelwal, A. K.; Pavcnik, N. Prices, markups, and trade reform. Econometrica 2016, 84(2), 445–510. [Google Scholar] [CrossRef]
- De Ridder, M.; Grassi, B.; Morzenti, G. The hitchhiker's guide to markup estimation: Assessing estimates from financial data. Econometrica 2026, 94(1), 137–168. [Google Scholar] [CrossRef]
- Díez, F. J.; Fan, J.; Villegas-Sánchez, C. Global declining competition? Journal of International Economics 2021, 132, 103492. [Google Scholar] [CrossRef]
- Dobbelaere, S.; Mairesse, J. Panel data estimates of the production function and product and labor market imperfections. Journal of Applied Econometrics 2013, 28(1), 1–46. [Google Scholar] [CrossRef]
- Drago, C.; Costantiello, A.; Savorgnan, M.; Leogrande, A. Macroeconomic and labor market drivers of AI adoption in Europe: A machine learning and panel data approach. Economies 2025, 13(8), 226. [Google Scholar] [CrossRef]
- Eslava, M.; Haltiwanger, J.; Urdaneta, N. The size and life-cycle growth of plants: The role of productivity, demand, and wedges. Review of Economic Studies 2024, 91(1), 259–300. [Google Scholar] [CrossRef]
- Ferrucci, E.; Guida, R.; Meliciani, V. Financial constraints and the growth and survival of innovative start-ups: An analysis of Italian firms. European Financial Management 2021, 27(2), 364–386. [Google Scholar] [CrossRef]
- Friedman, J. H. Greedy function approximation: A gradient boosting machine. Annals of Statistics 2001, 29(5), 1189–1232. [Google Scholar] [CrossRef]
- Galope, R. V. A different certification effect of the Small Business Innovation Research (SBIR) program: Evidence from the Kauffman Firm Survey. Economic Development Quarterly 2016, 30(4), 371–383. [Google Scholar] [CrossRef]
- Giraudo, E.; Giudici, G.; Grilli, L. Entrepreneurship policy and the financing of young innovative companies: Evidence from the Italian Startup Act. Research Policy 2019, 48(9), 103801. [Google Scholar] [CrossRef]
- Gourio, F.; Rudanko, L. Customer capital. Review of Economic Studies 2014, 81(3), 1102–1136. [Google Scholar] [CrossRef]
- Gradzewicz, M.; Mućk, J. Globalisation and the fall of markups. World Economy 2024, 47(3), 1089–1116. [Google Scholar] [CrossRef]
- Guo, Y.; Zhao, C.; Pang, M.; He, D. Market orientation and green innovation: Empirical evidence from double machine learning. Journal of Innovation and Knowledge 2026, 13, 100933. [Google Scholar] [CrossRef]
- Hashemi, A.; Kirov, I.; Traina, J. The production approach to markup estimation often measures input distortions. Economics Letters 2022, 217, 110673. [Google Scholar] [CrossRef]
- Hausman, J. A. Specification tests in econometrics. Econometrica 1978, 46(6), 1251–1271. [Google Scholar] [CrossRef]
- Hottenrott, H.; Richstein, R. Start-up subsidies: Does the policy instrument matter? Research Policy 2020, 49(1), 103888. [Google Scholar] [CrossRef]
- Houde, S. Bunching with the stars: How firms respond to environmental certification. Management Science 2022, 68(8), 5569–5590. [Google Scholar] [CrossRef]
- Howell, S. T. Financing innovation: Evidence from R&D grants. American Economic Review 2017, 107(4), 1136–1164. [Google Scholar] [CrossRef]
- Huang, J.-C.; Yang, X. Estimating production functions when output prices and quality are unobserved. Review of Economics 2025, 76(2), 179–205. [Google Scholar] [CrossRef]
- Kato, A.; Kodama, N. Markups, productivity and external market development of the service SMEs. Applied Economics 2014, 46(29), 3601–3608. [Google Scholar] [CrossRef]
- Kim, M.; Kristiansen, E. G.; Vale, B. Life-cycle patterns of interest-rate mark-ups in small-firm finance. Scandinavian Journal of Economics 2012, 114(2), 629–657. [Google Scholar] [CrossRef]
- Kirov, I.; Mengano, P.; Traina, J. Measuring markups with revenue data. International Journal of Industrial Organization 2026, 105, 103263. [Google Scholar] [CrossRef]
- Klette, T. J.; Griliches, Z. The inconsistency of common scale estimators when output prices are unobserved and endogenous. Journal of Applied Econometrics 1996, 11(4), 343–361. [Google Scholar] [CrossRef]
- Koppenberg, M.; Hirsch, S. Markup estimation: A comparison of contemporary methods at the example of European food retailers. Agribusiness 2022a, 38(1), 108–133. [Google Scholar] [CrossRef]
- Libaers, D.; Hicks, D.; Porter, A. L. A taxonomy of small firm technology commercialization. Industrial and Corporate Change 2016, 25(3), 371–405. [Google Scholar] [CrossRef]
- Manaresi, F.; Menon, C.; Santoleri, P. Supporting innovative entrepreneurship: An evaluation of the Italian "Start-up Act. Industrial and Corporate Change 2021, 30(6), 1591–1614. [Google Scholar] [CrossRef]
- Máñez, J. A.; Rochina Barrachina, M. E.; Sanchis, J. A. The effects of export and R&D strategies on firms’ markups in downturns: The Spanish case. Journal of Small Business Management 2022, 60(3), 634–667. [Google Scholar] [CrossRef]
- Matricano, D. Designing effective policies for innovative start-ups: Lessons learned in Italy. Journal of Business Venturing Insights 2024a, 22, e00486. [Google Scholar] [CrossRef]
- Morlacco, M.; Zeke, D. Monetary policy, customer capital, and market power. Journal of Monetary Economics 2021, 121, 116–134. [Google Scholar] [CrossRef]
- Mullainathan, S.; Spiess, J. Machine learning: An applied econometric approach. Journal of Economic Perspectives 2017, 31(2), 87–106. [Google Scholar] [CrossRef]
- Nickell, S. Biases in dynamic models with fixed effects. Econometrica 1981, 49(6), 1417–1426. [Google Scholar] [CrossRef]
- Peters, M. Heterogeneous markups, growth, and endogenous misallocation. Econometrica 2020, 88(5), 2037–2073. [Google Scholar] [CrossRef]
- Pyo, H.; Park, M. Who benefits from the governmental support policy for innovative firms and for how long? Evidence from the Korean venture certification program. International Economic Journal 2020, 34(4), 664–681. [Google Scholar] [CrossRef]
- Raval, D. Testing the production approach to markup estimation. Review of Economic Studies 2023b, 90(5), 2592–2620. [Google Scholar] [CrossRef]
- Rizzoni, A. Technological innovation and small firms: A taxonomy. International Small Business Journal 1991, 9(3), 31–42. [Google Scholar] [CrossRef]
- Roldan-Blanco, P.; Gilbukh, S. Firm dynamics and pricing under customer capital accumulation. Journal of Monetary Economics 2021, 118, 99–119. [Google Scholar] [CrossRef]
- Santoleri, P.; Russo, E. Spurring subsidy entrepreneurs. Research Policy 2025, 54(1), 105128. [Google Scholar] [CrossRef]
- Segarra-Blasco, A.; Teruel, M. Application and success of R&D subsidies: What is the role of firm age? Industry and Innovation 2016, 23(8), 713–733. [Google Scholar] [CrossRef]
- Song, F.; Huang, Y.; Liu, C. Extended application of double machine learning in corporate financial resilience research: Based on data factor marketization. Systems 2025, 13(4), 292. [Google Scholar] [CrossRef]
- Stiebale, J.; Vencappa, D. Acquisitions, markups, efficiency, and product quality: Evidence from India. Journal of International Economics 2018, 112, 70–87. [Google Scholar] [CrossRef]
- Sultana, N.; Zeya, F.; Islam, K. M. Z.; Rodriguez, A. J. The role of total assets in financial performance: Evaluating econometrics and machine learning approaches. Journal of Corporate Accounting and Finance 2026, 37(1), 204–215. [Google Scholar] [CrossRef]
- Sun, L.; Abraham, S. Estimating dynamic treatment effects in event studies with heterogeneous treatment effects. Journal of Econometrics 2021, 225(2), 175–199. [Google Scholar] [CrossRef]
- Weche, J. P.; Wambach, A. The fall and rise of market power in Europe. Jahrbucher fur Nationalokonomie und Statistik 2021, 241(5-6), 555–575. [Google Scholar] [CrossRef]
Figure 1.
Distribution of the log markup by population. Note. Kernel densities of ln μ on the estimation sample; dotted lines mark medians. Populations are defined by the register a firm belongs to in 2026, not by its status in the year.
Figure 1.
Distribution of the log markup by population. Note. Kernel densities of ln μ on the estimation sample; dotted lines mark medians. Populations are defined by the register a firm belongs to in 2026, not by its status in the year.
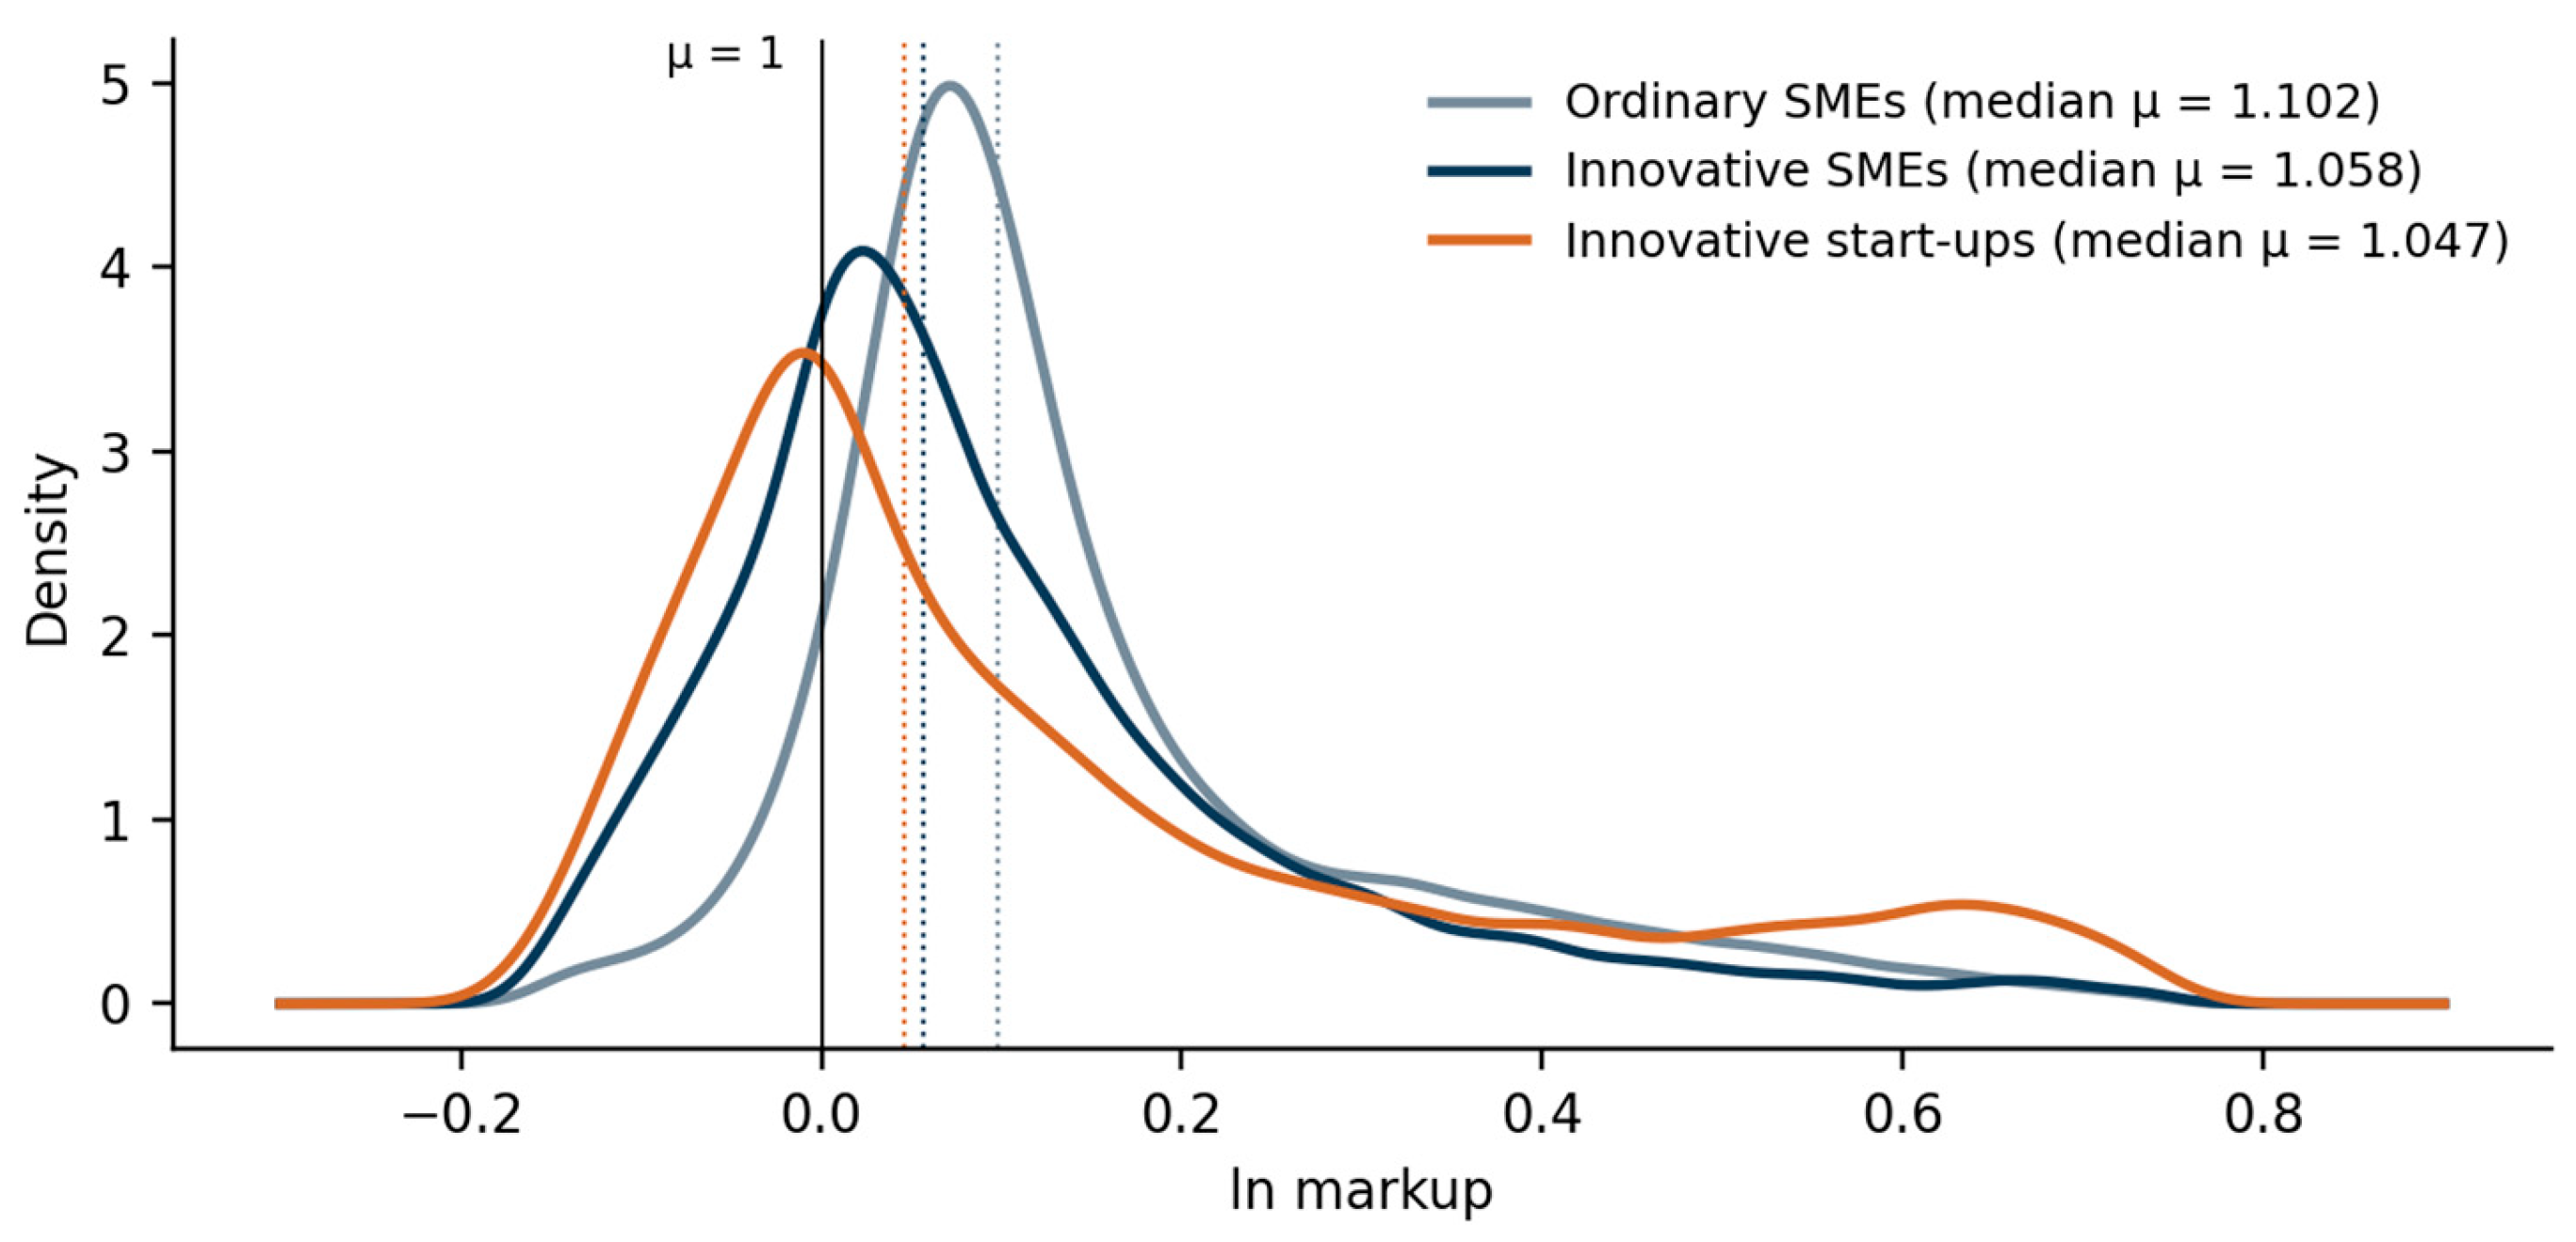
Figure 2.
The status coefficients across estimators. Note. Point estimates with 95 per cent confidence intervals from Table 3 and, for the dynamic specification, from Appendix Table C1. Grey: estimators using cross-firm variation; blue: within-firm estimators; orange: first-differenced dynamic model.
Figure 2.
The status coefficients across estimators. Note. Point estimates with 95 per cent confidence intervals from Table 3 and, for the dynamic specification, from Appendix Table C1. Grey: estimators using cross-firm variation; blue: within-firm estimators; orange: first-differenced dynamic model.
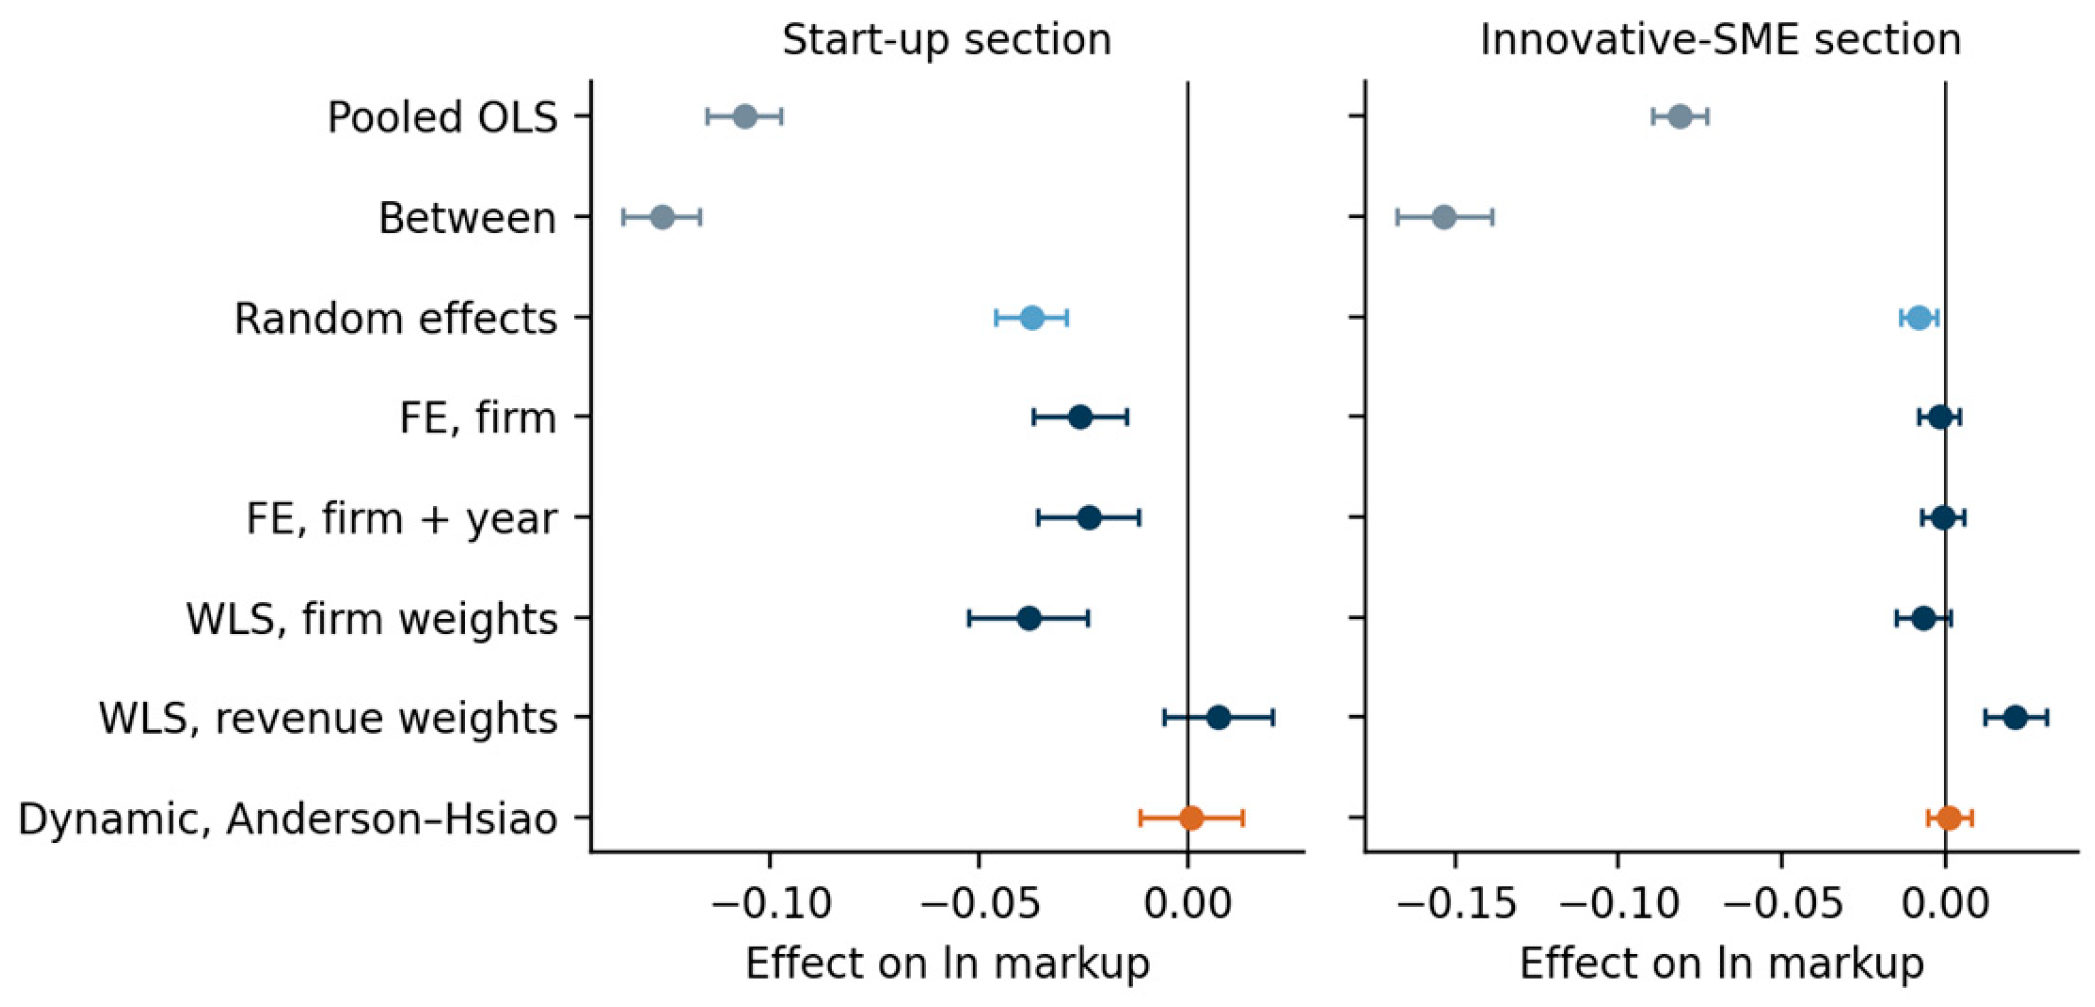
Figure 3.
The log markup around the loss of start-up status. Note. Interaction-weighted event-study coefficients with 95 per cent confidence intervals; year −1 is the reference, end points are binned. Controls: ordinary SMEs, start-ups still on the register and graduates whose expiry falls after 2024; firm and year effects, SIZE and AGE. Panel A: 1,097 graduates, event = year of transfer to the SME section; the 369 whose transfer falls after 2024 act as not-yet-treated controls. Panel B: 876 firms ever on the start-up register whose statutory term expired by 2024. Pre-trend tests: χ²(4) p = 0.045 (A) and 0.112 (B).
Figure 3.
The log markup around the loss of start-up status. Note. Interaction-weighted event-study coefficients with 95 per cent confidence intervals; year −1 is the reference, end points are binned. Controls: ordinary SMEs, start-ups still on the register and graduates whose expiry falls after 2024; firm and year effects, SIZE and AGE. Panel A: 1,097 graduates, event = year of transfer to the SME section; the 369 whose transfer falls after 2024 act as not-yet-treated controls. Panel B: 876 firms ever on the start-up register whose statutory term expired by 2024. Pre-trend tests: χ²(4) p = 0.045 (A) and 0.112 (B).
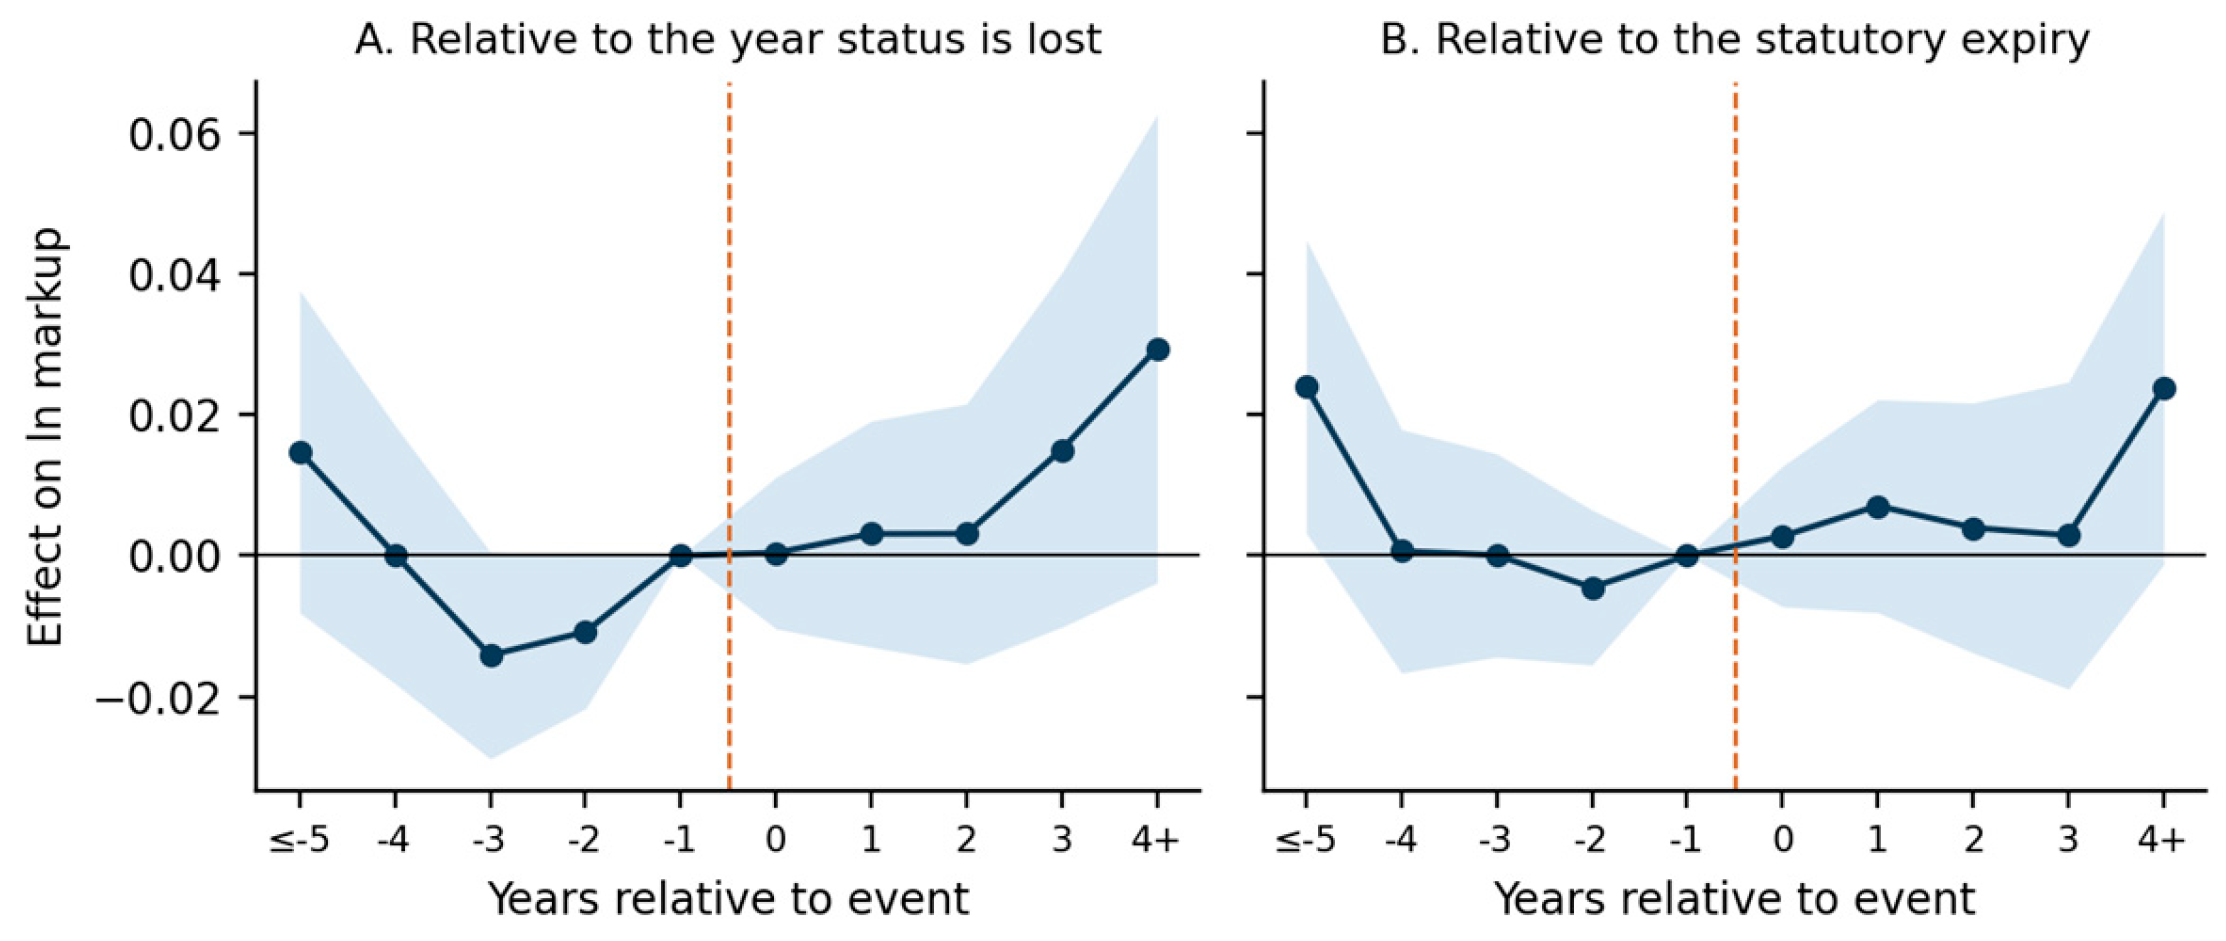
Figure 4.
Rank score of every admissible solution Note. Score = 1 − (mean rank − 1)/(N − 1) over eleven indices, N = 26 admissible solutions; higher is better. “Inadm.” marks solutions with a cluster below one per cent of observations or, for fuzzy C-means, fewer clusters than requested. The frame marks the selected solution.
Figure 4.
Rank score of every admissible solution Note. Score = 1 − (mean rank − 1)/(N − 1) over eleven indices, N = 26 admissible solutions; higher is better. “Inadm.” marks solutions with a cluster below one per cent of observations or, for fuzzy C-means, fewer clusters than requested. The frame marks the selected solution.
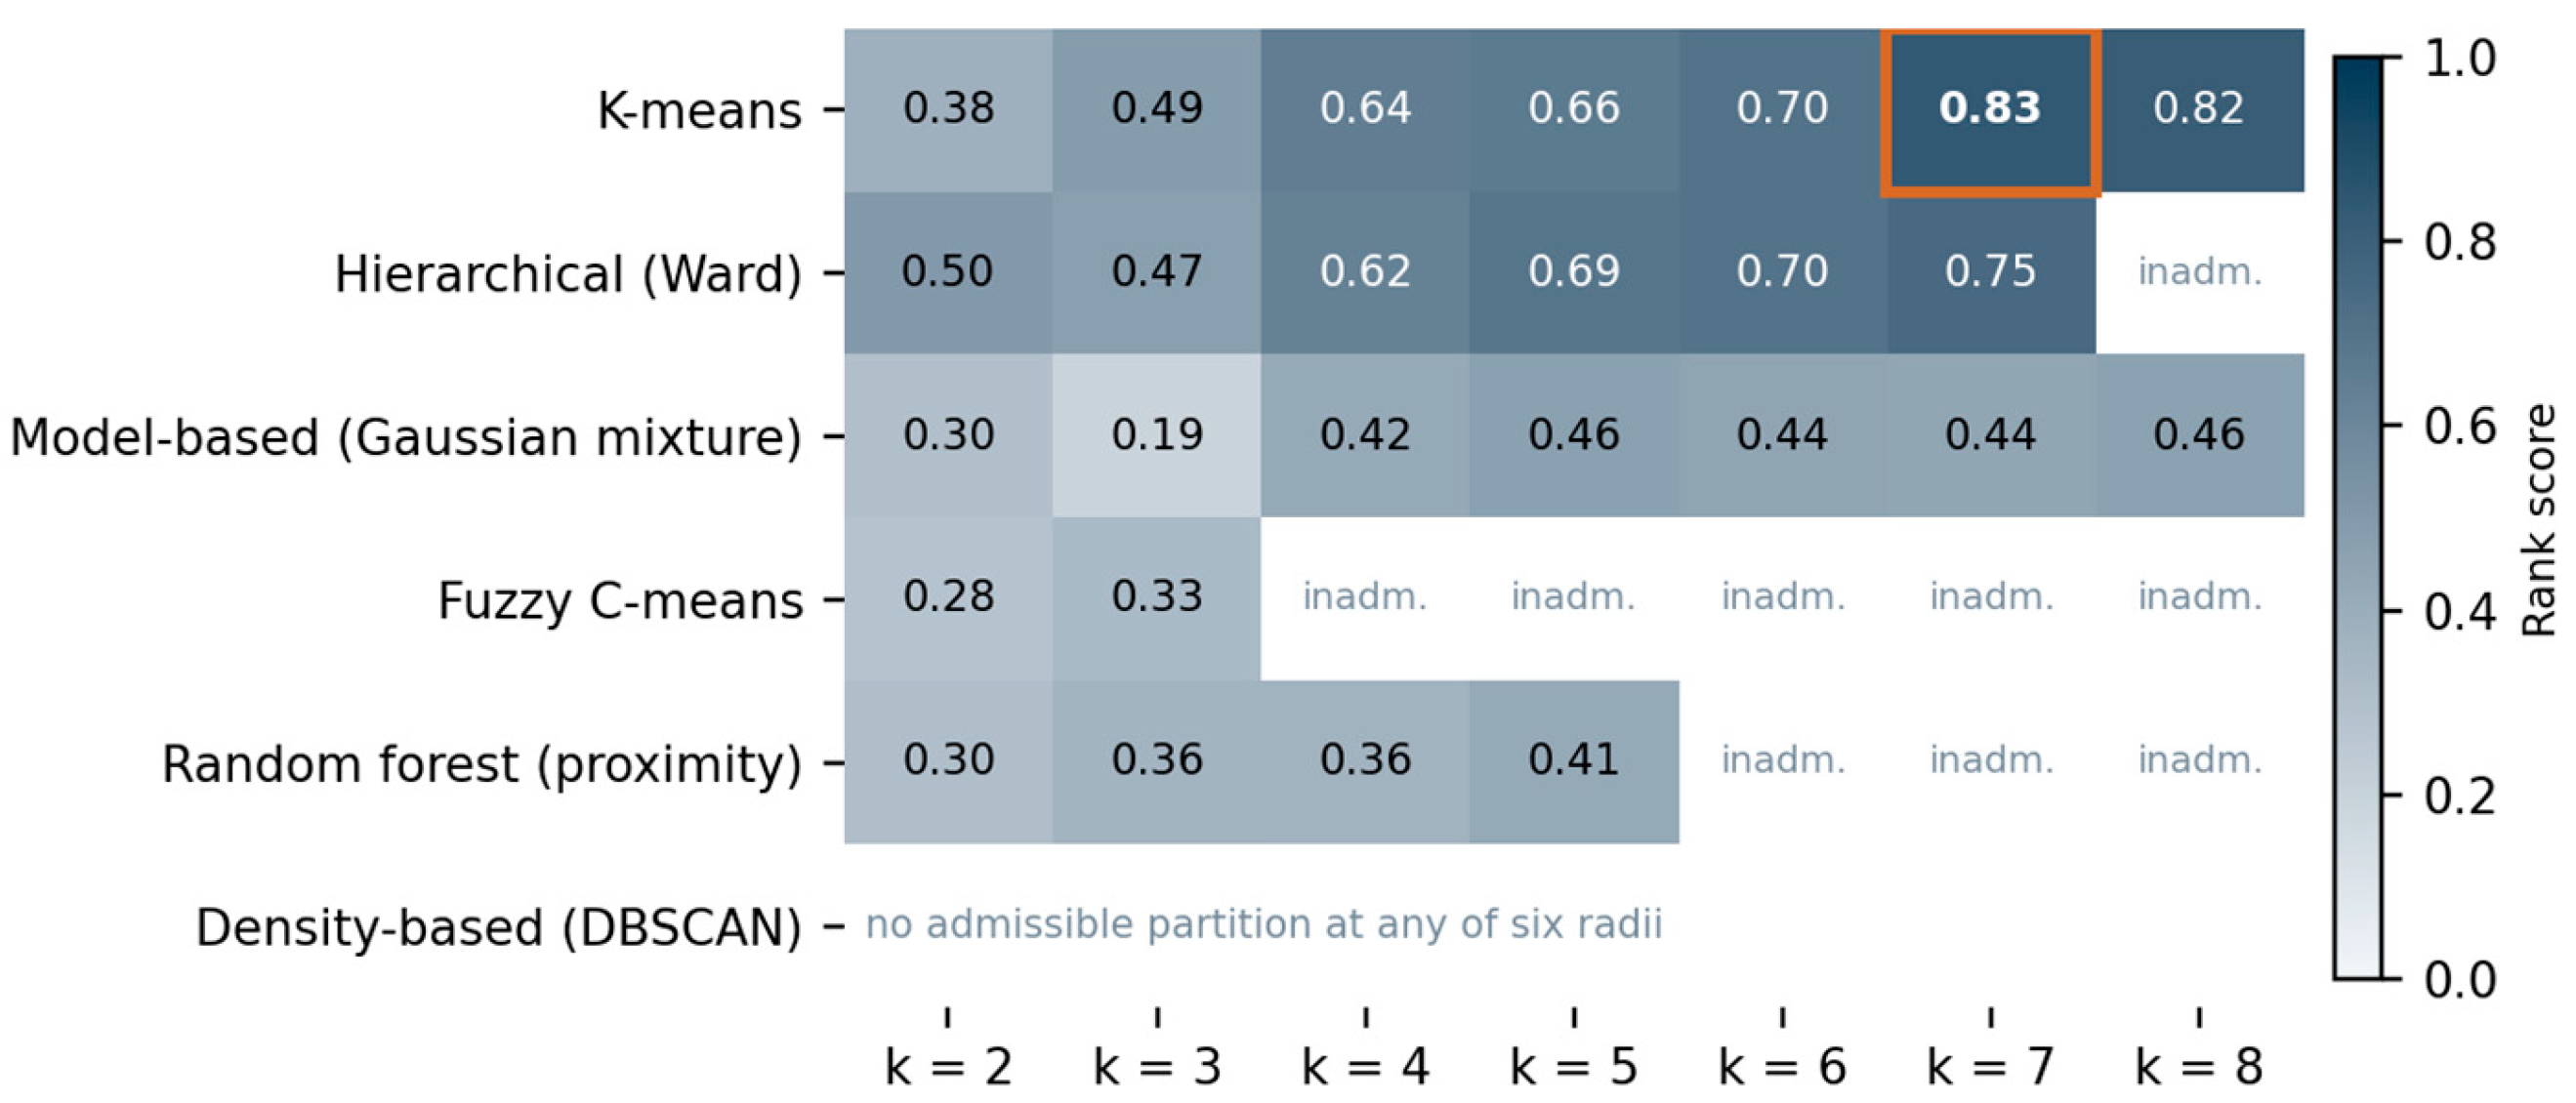
Figure 5.
Standardised centroids of the seven configurations. Note. Cluster means of the standardised variables of Table 5; cells above ±2 are coloured at the limit. Labels report the share of firm-years and the median markup. Clusters are ordered by median markup.
Figure 5.
Standardised centroids of the seven configurations. Note. Cluster means of the standardised variables of Table 5; cells above ±2 are coloured at the limit. Labels report the share of firm-years and the median markup. Clusters are ordered by median markup.
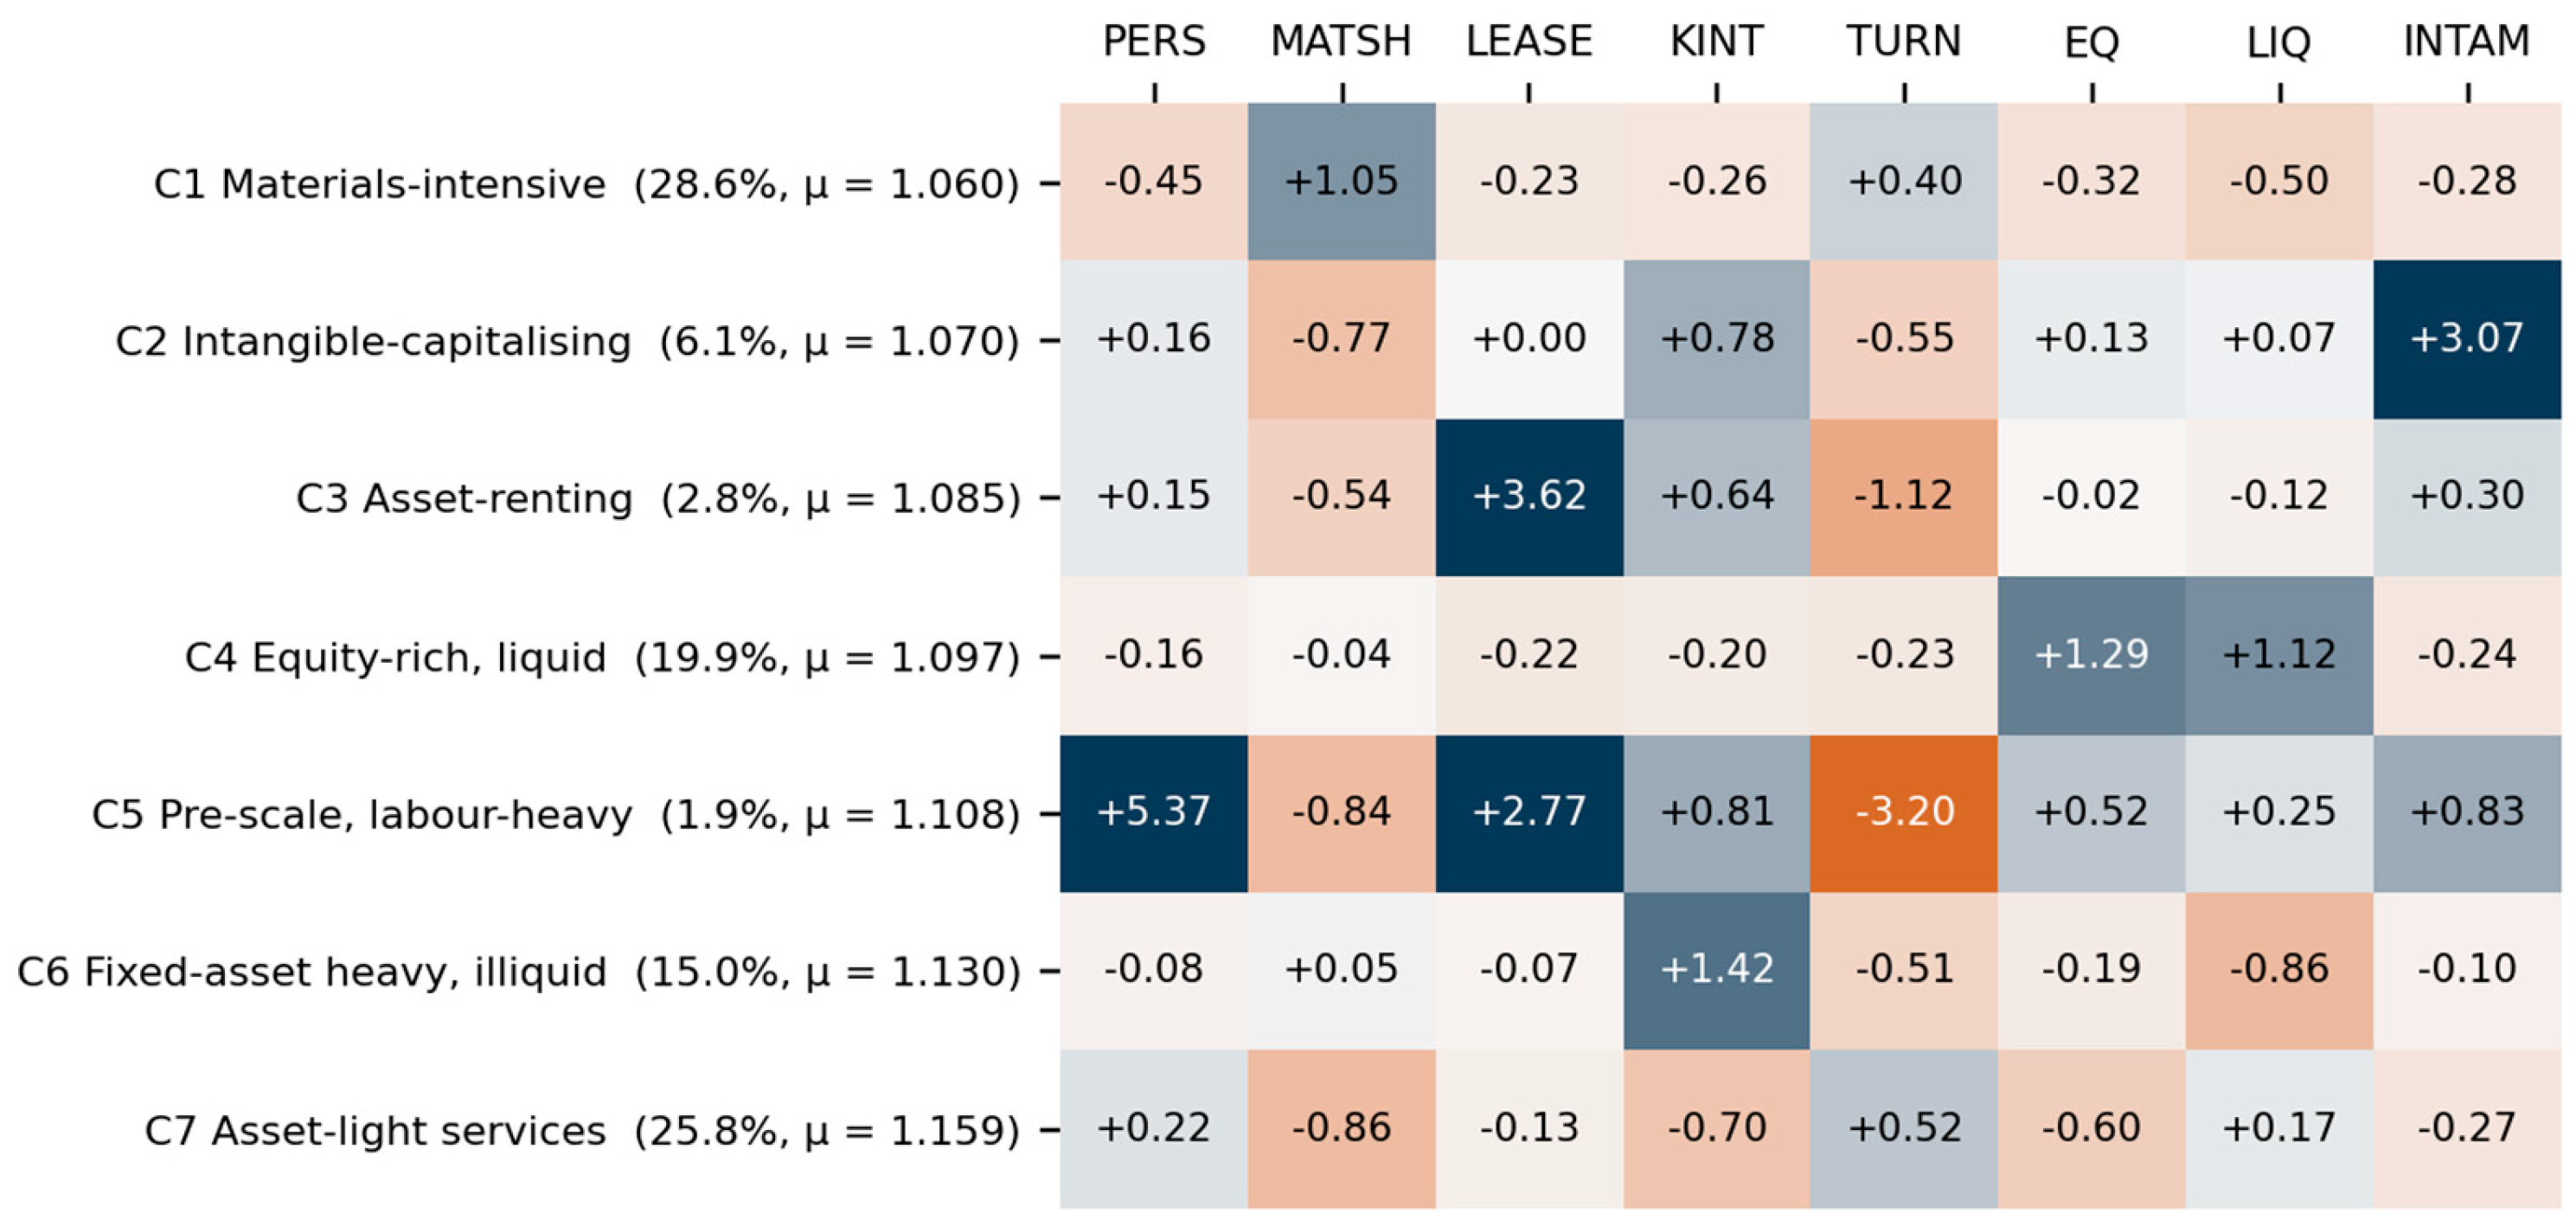
Figure 6.
Status effects by configuration. Note. Coefficients from Table 8 with 95 per cent confidence intervals; orange where p < 0.05. Dashed lines mark the pooled estimates of the econometric section: −0.024 for entry and −0.005 for the instrumented expiry.
Figure 6.
Status effects by configuration. Note. Coefficients from Table 8 with 95 per cent confidence intervals; orange where p < 0.05. Dashed lines mark the pooled estimates of the econometric section: −0.024 for entry and −0.005 for the instrumented expiry.
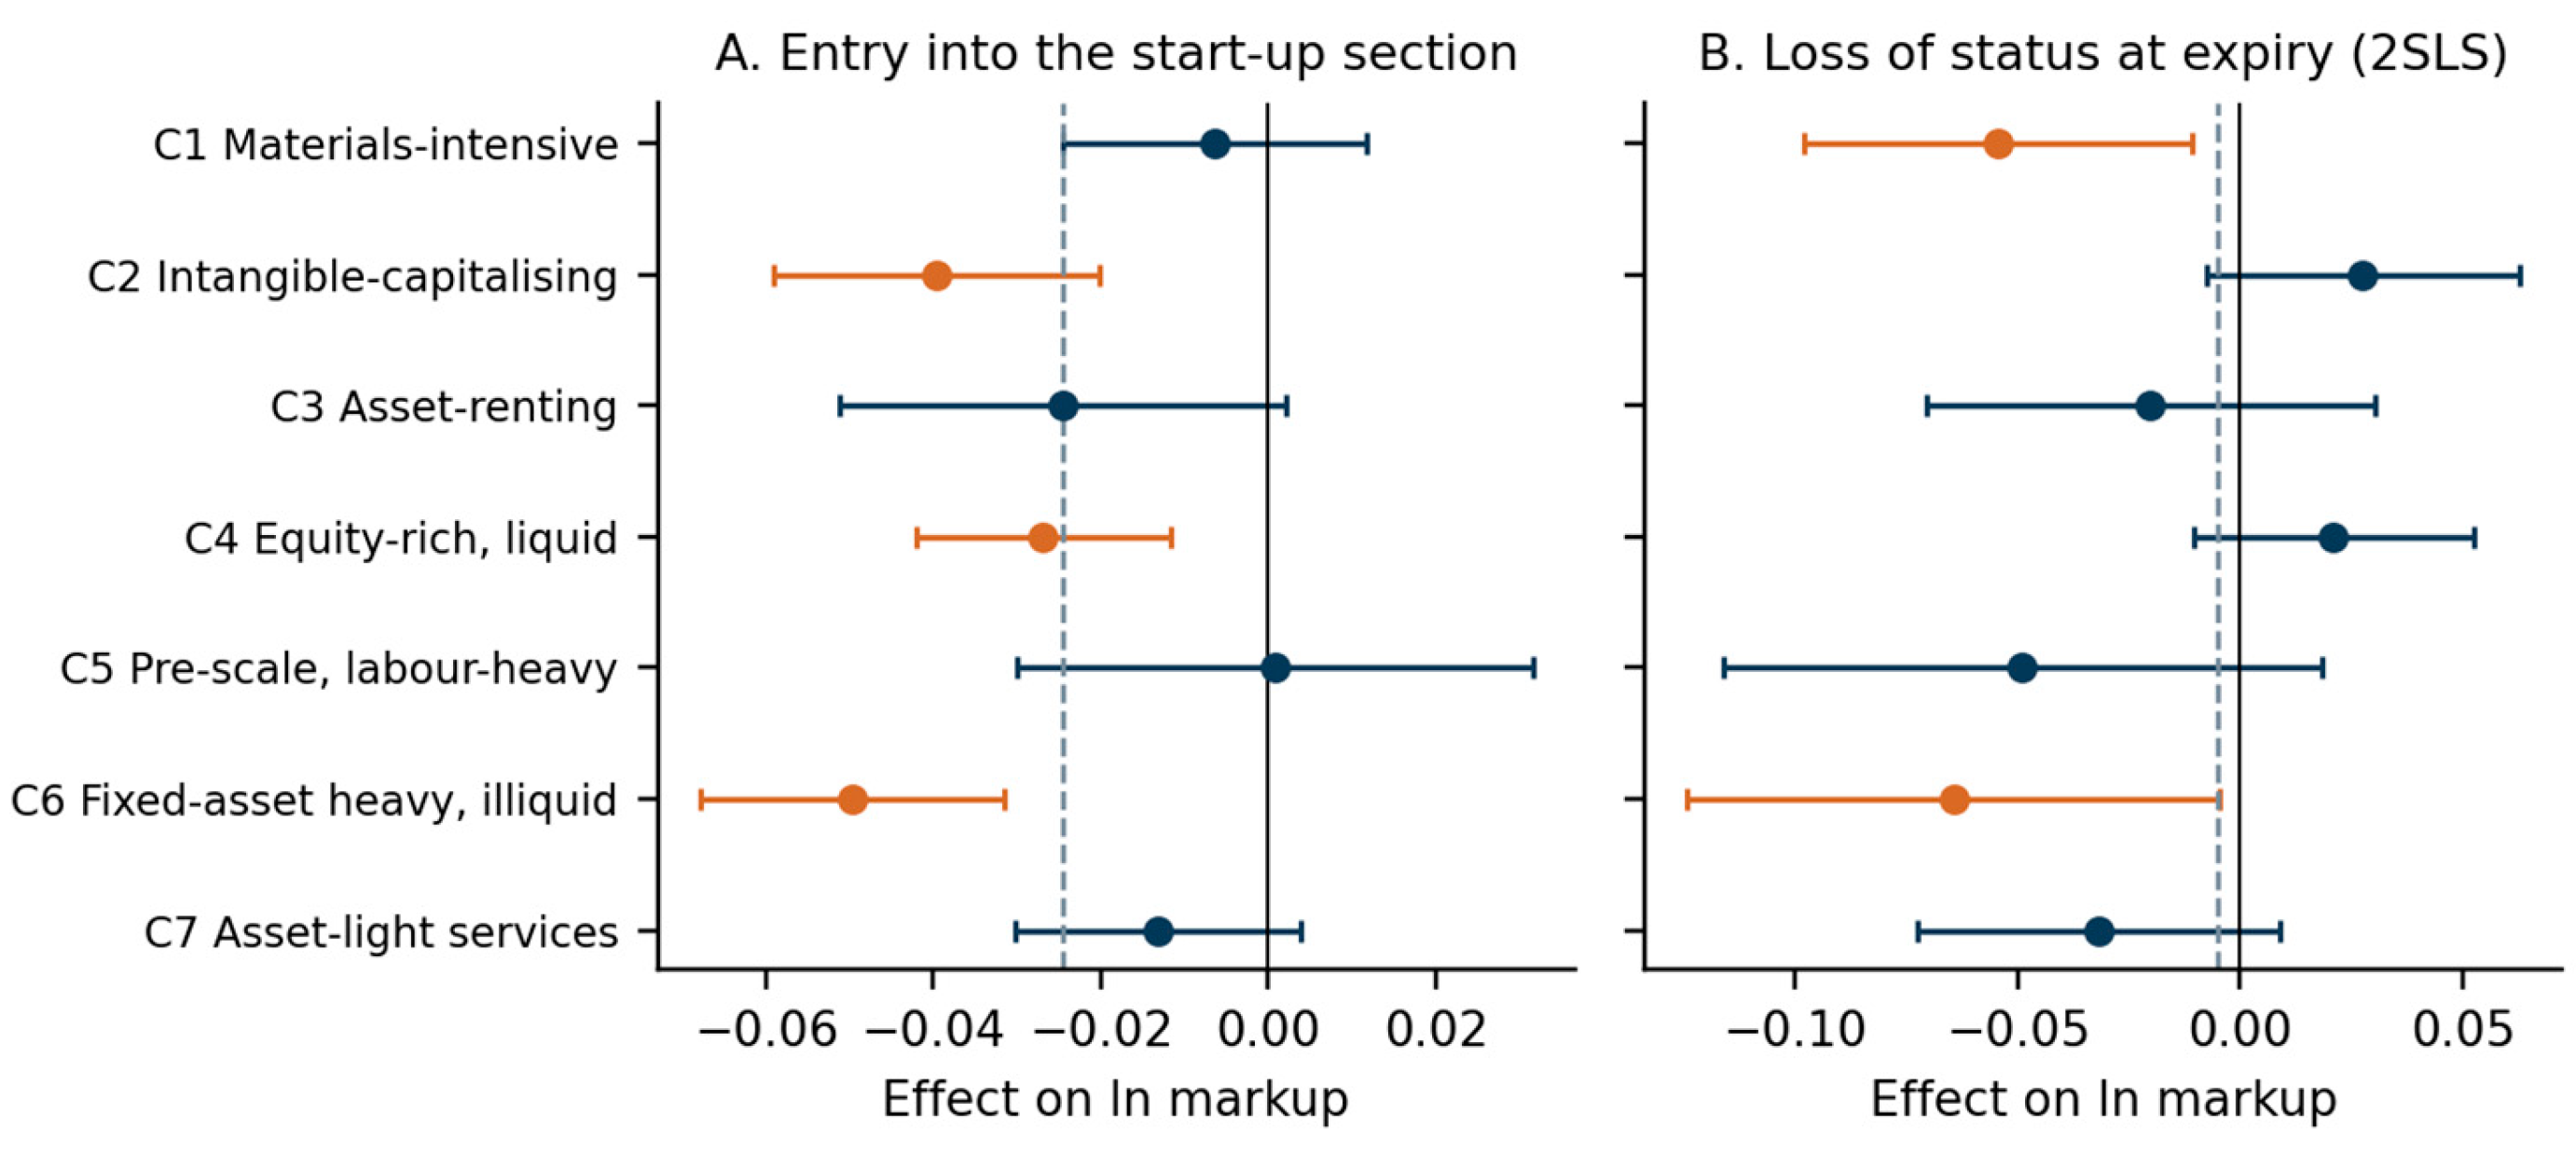
Figure 7.
Out-of-sample fit of six learners on within-firm variation. Note. R² of out-of-fold predictions pooled across five firm-grouped folds. Dashed line: linear regression. Panel A: equation set; panel B: augmented set.
Figure 7.
Out-of-sample fit of six learners on within-firm variation. Note. R² of out-of-fold predictions pooled across five firm-grouped folds. Dashed line: linear regression. Panel A: equation set; panel B: augmented set.
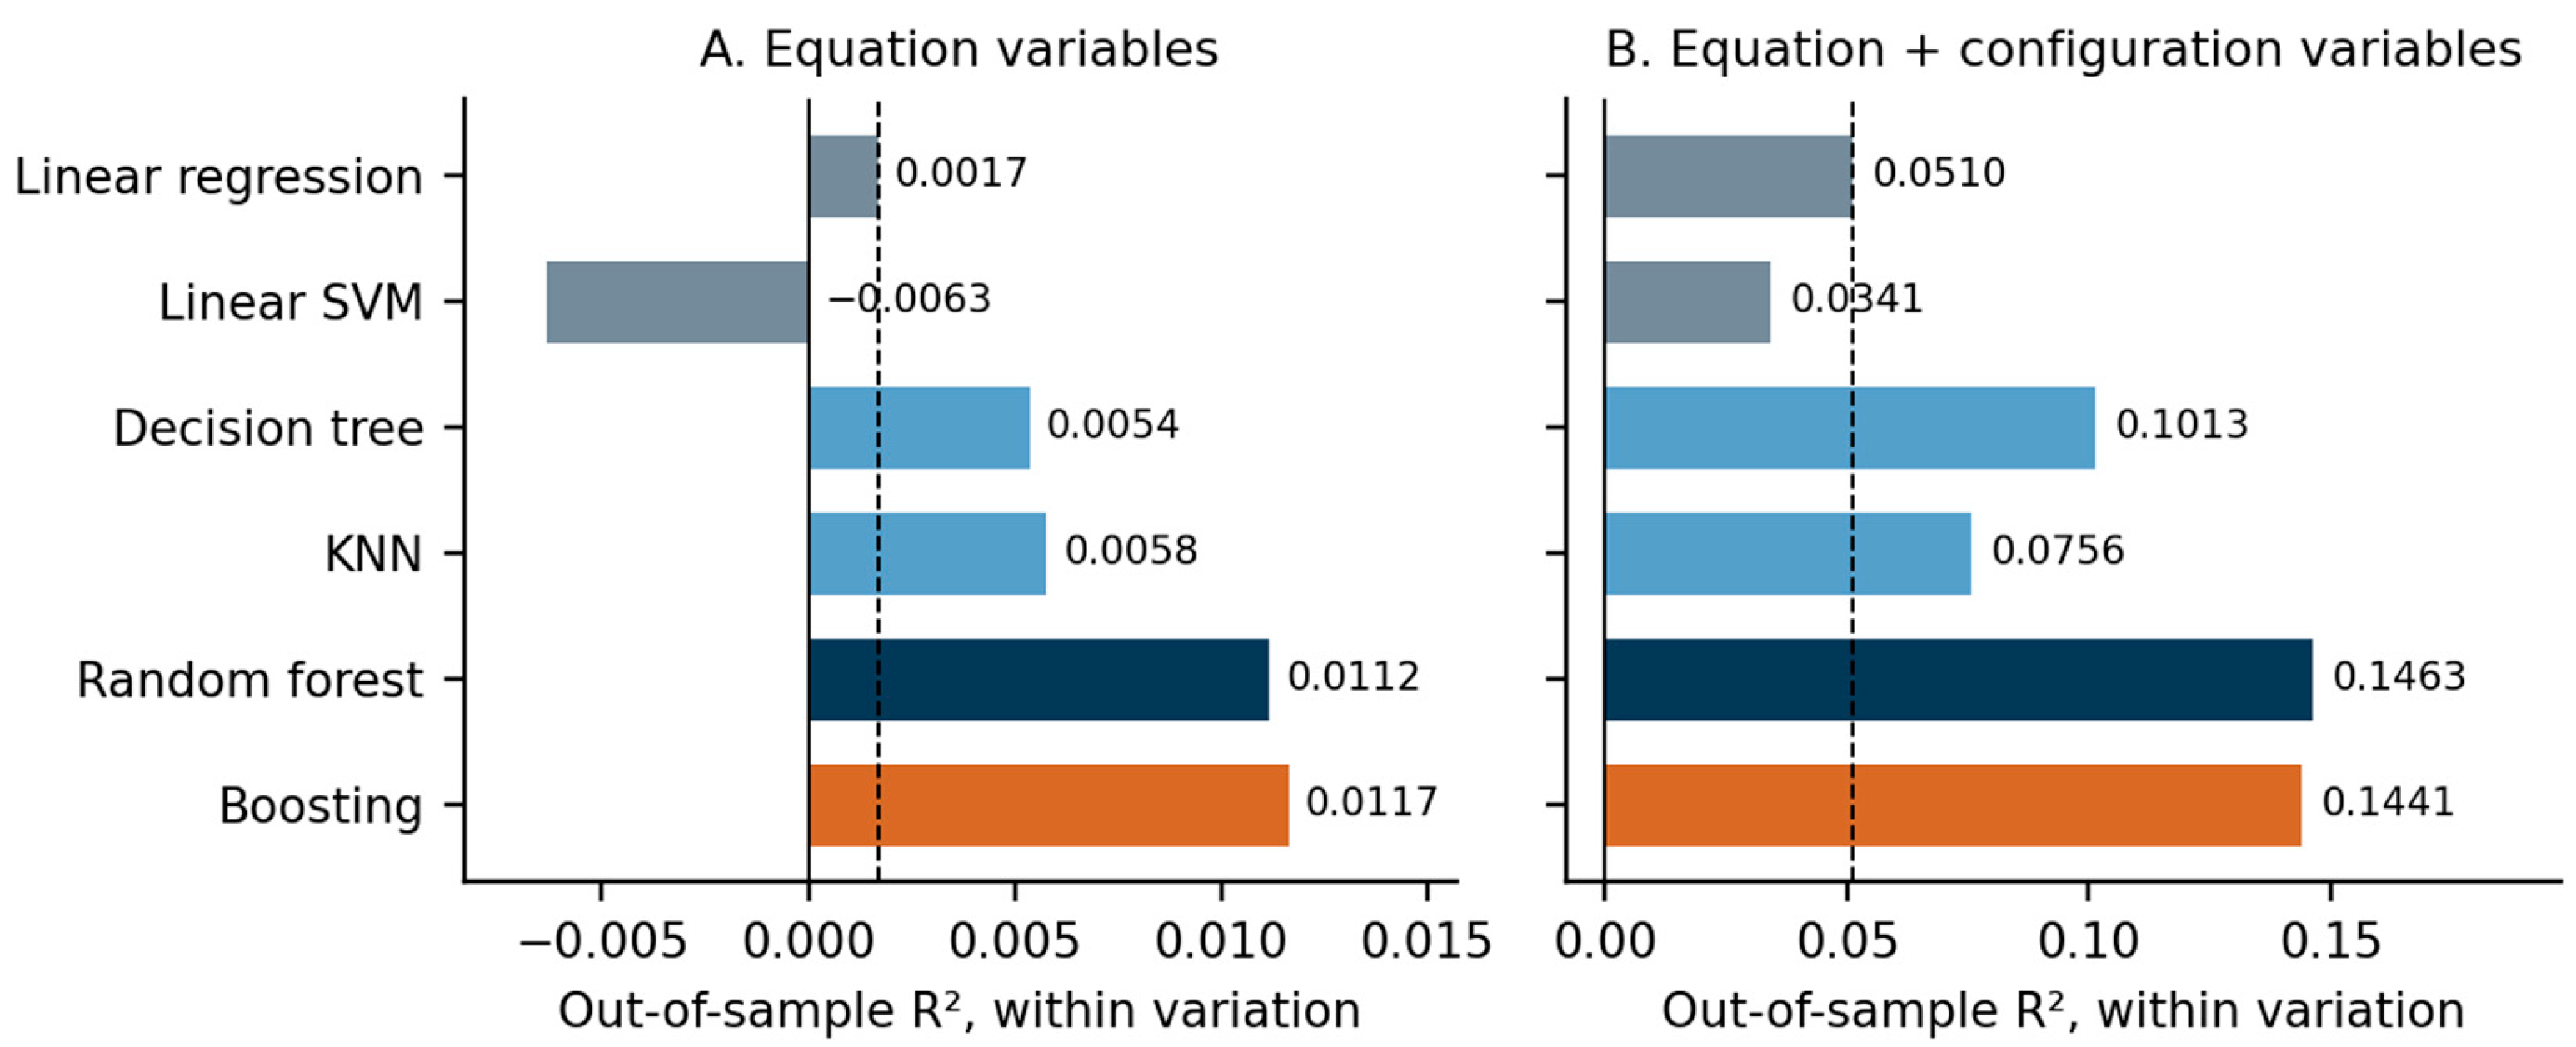
Figure 8.
Nonlinearity, interaction and variable importance Note. Panel A: out-of-sample R² of linear regression, a linear model in cubic splines of the continuous variables, boosting with interactions forbidden, and unrestricted boosting. Panel B: mean drop in held-out R² when each variable is permuted, unrestricted boosting on the augmented set, five folds × five repeats; bars show the standard deviation across folds; logarithmic scale above 0.01.
Figure 8.
Nonlinearity, interaction and variable importance Note. Panel A: out-of-sample R² of linear regression, a linear model in cubic splines of the continuous variables, boosting with interactions forbidden, and unrestricted boosting. Panel B: mean drop in held-out R² when each variable is permuted, unrestricted boosting on the augmented set, five folds × five repeats; bars show the standard deviation across folds; logarithmic scale above 0.01.
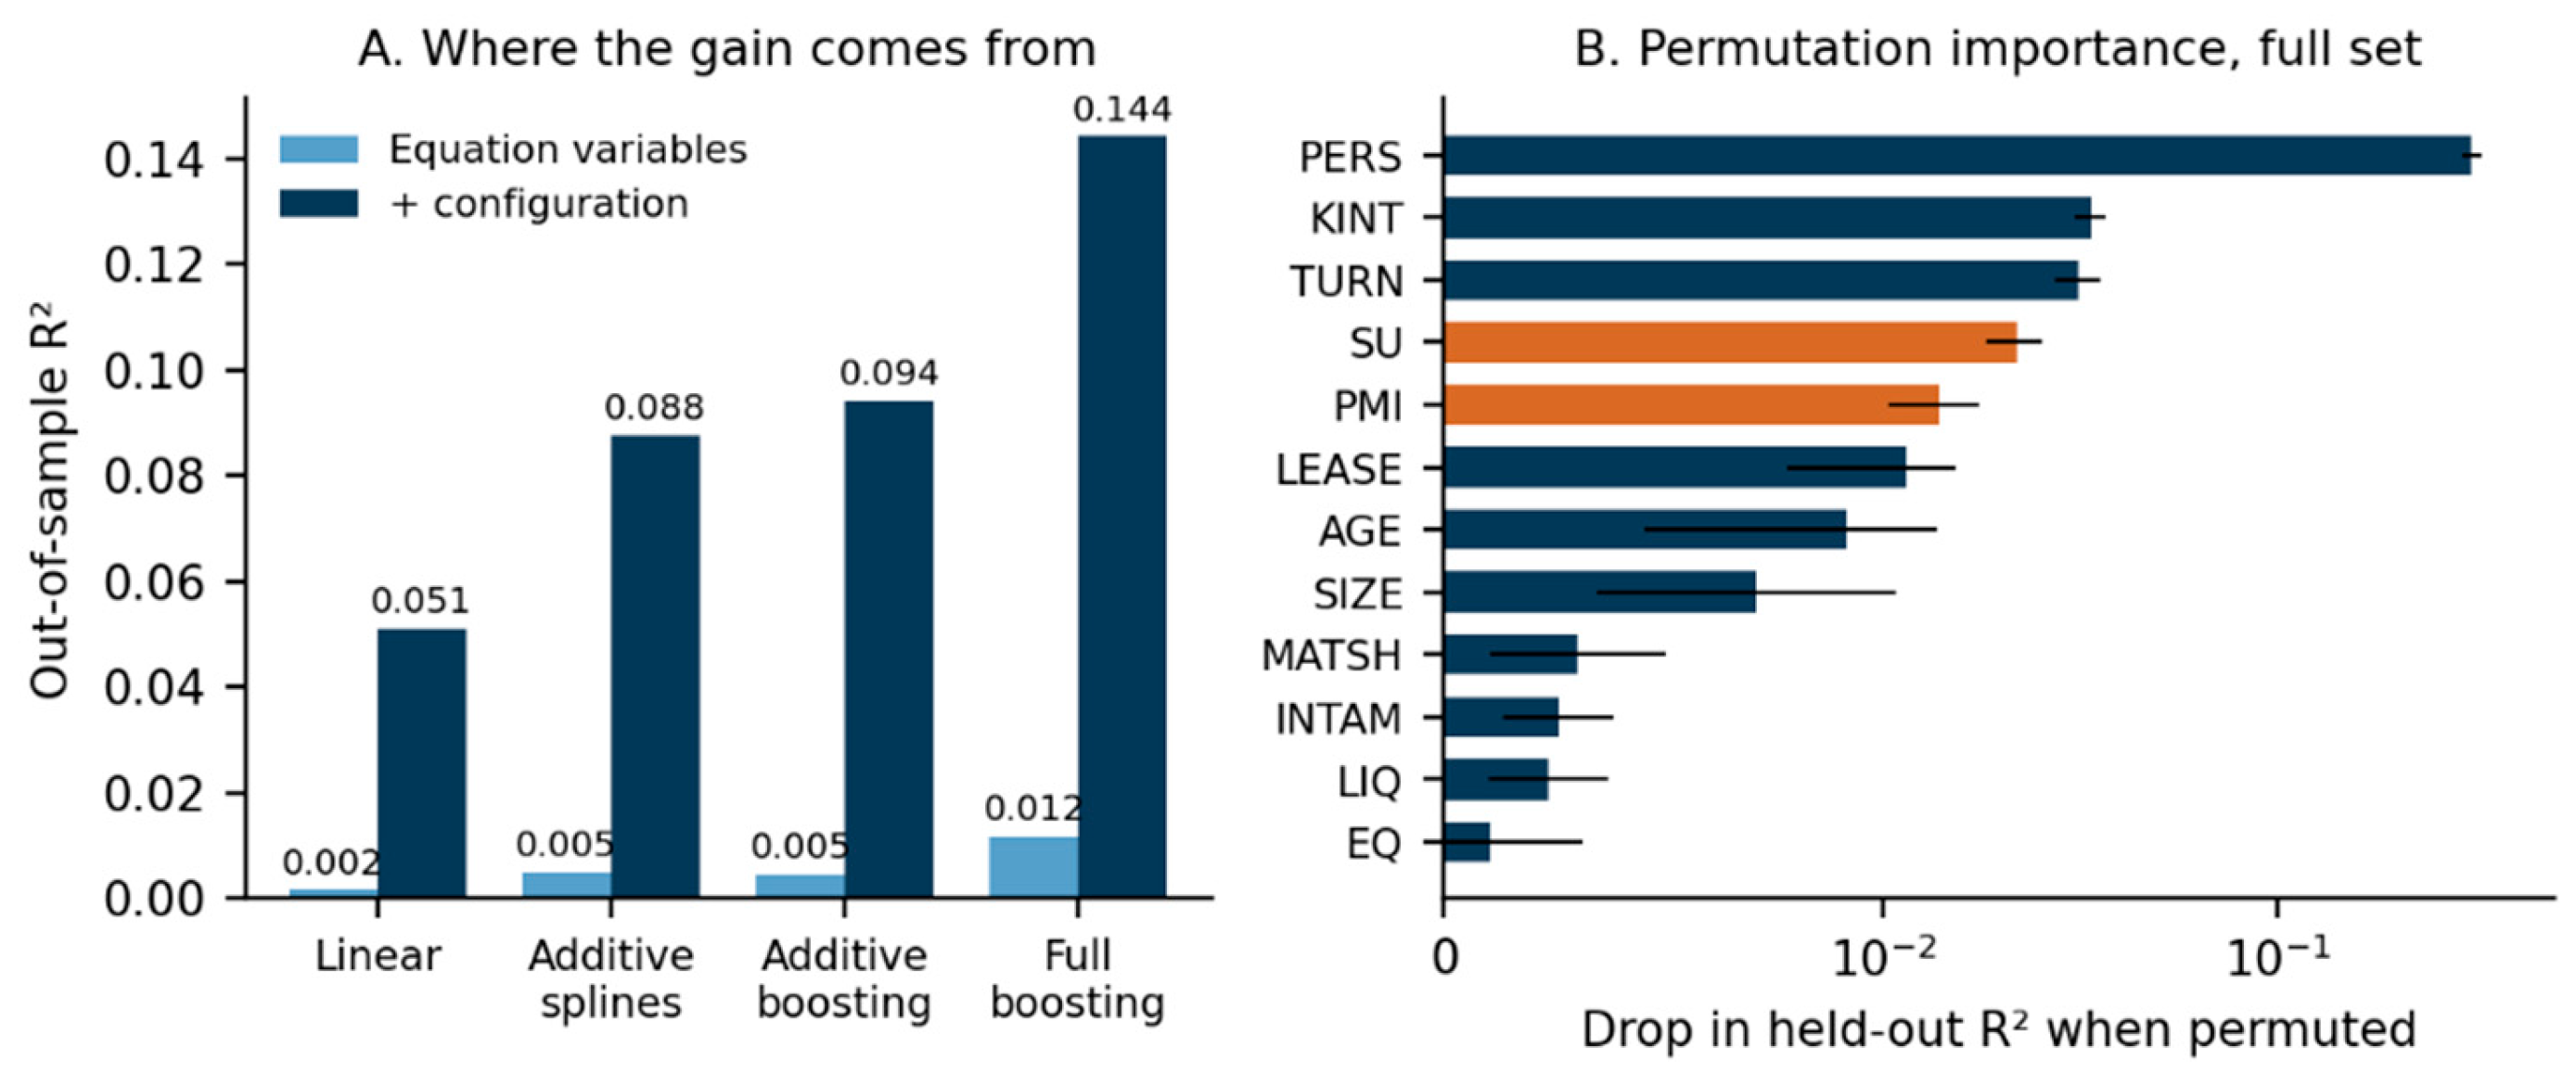
Figure 9.
Linear, boosted and double-machine-learning estimates of the status effects. Note. Estimates from Table 11 with 95 per cent confidence intervals; diamonds are boosting average marginal effects, reported without intervals.
Figure 9.
Linear, boosted and double-machine-learning estimates of the status effects. Note. Estimates from Table 11 with 95 per cent confidence intervals; diamonds are boosting average marginal effects, reported without intervals.
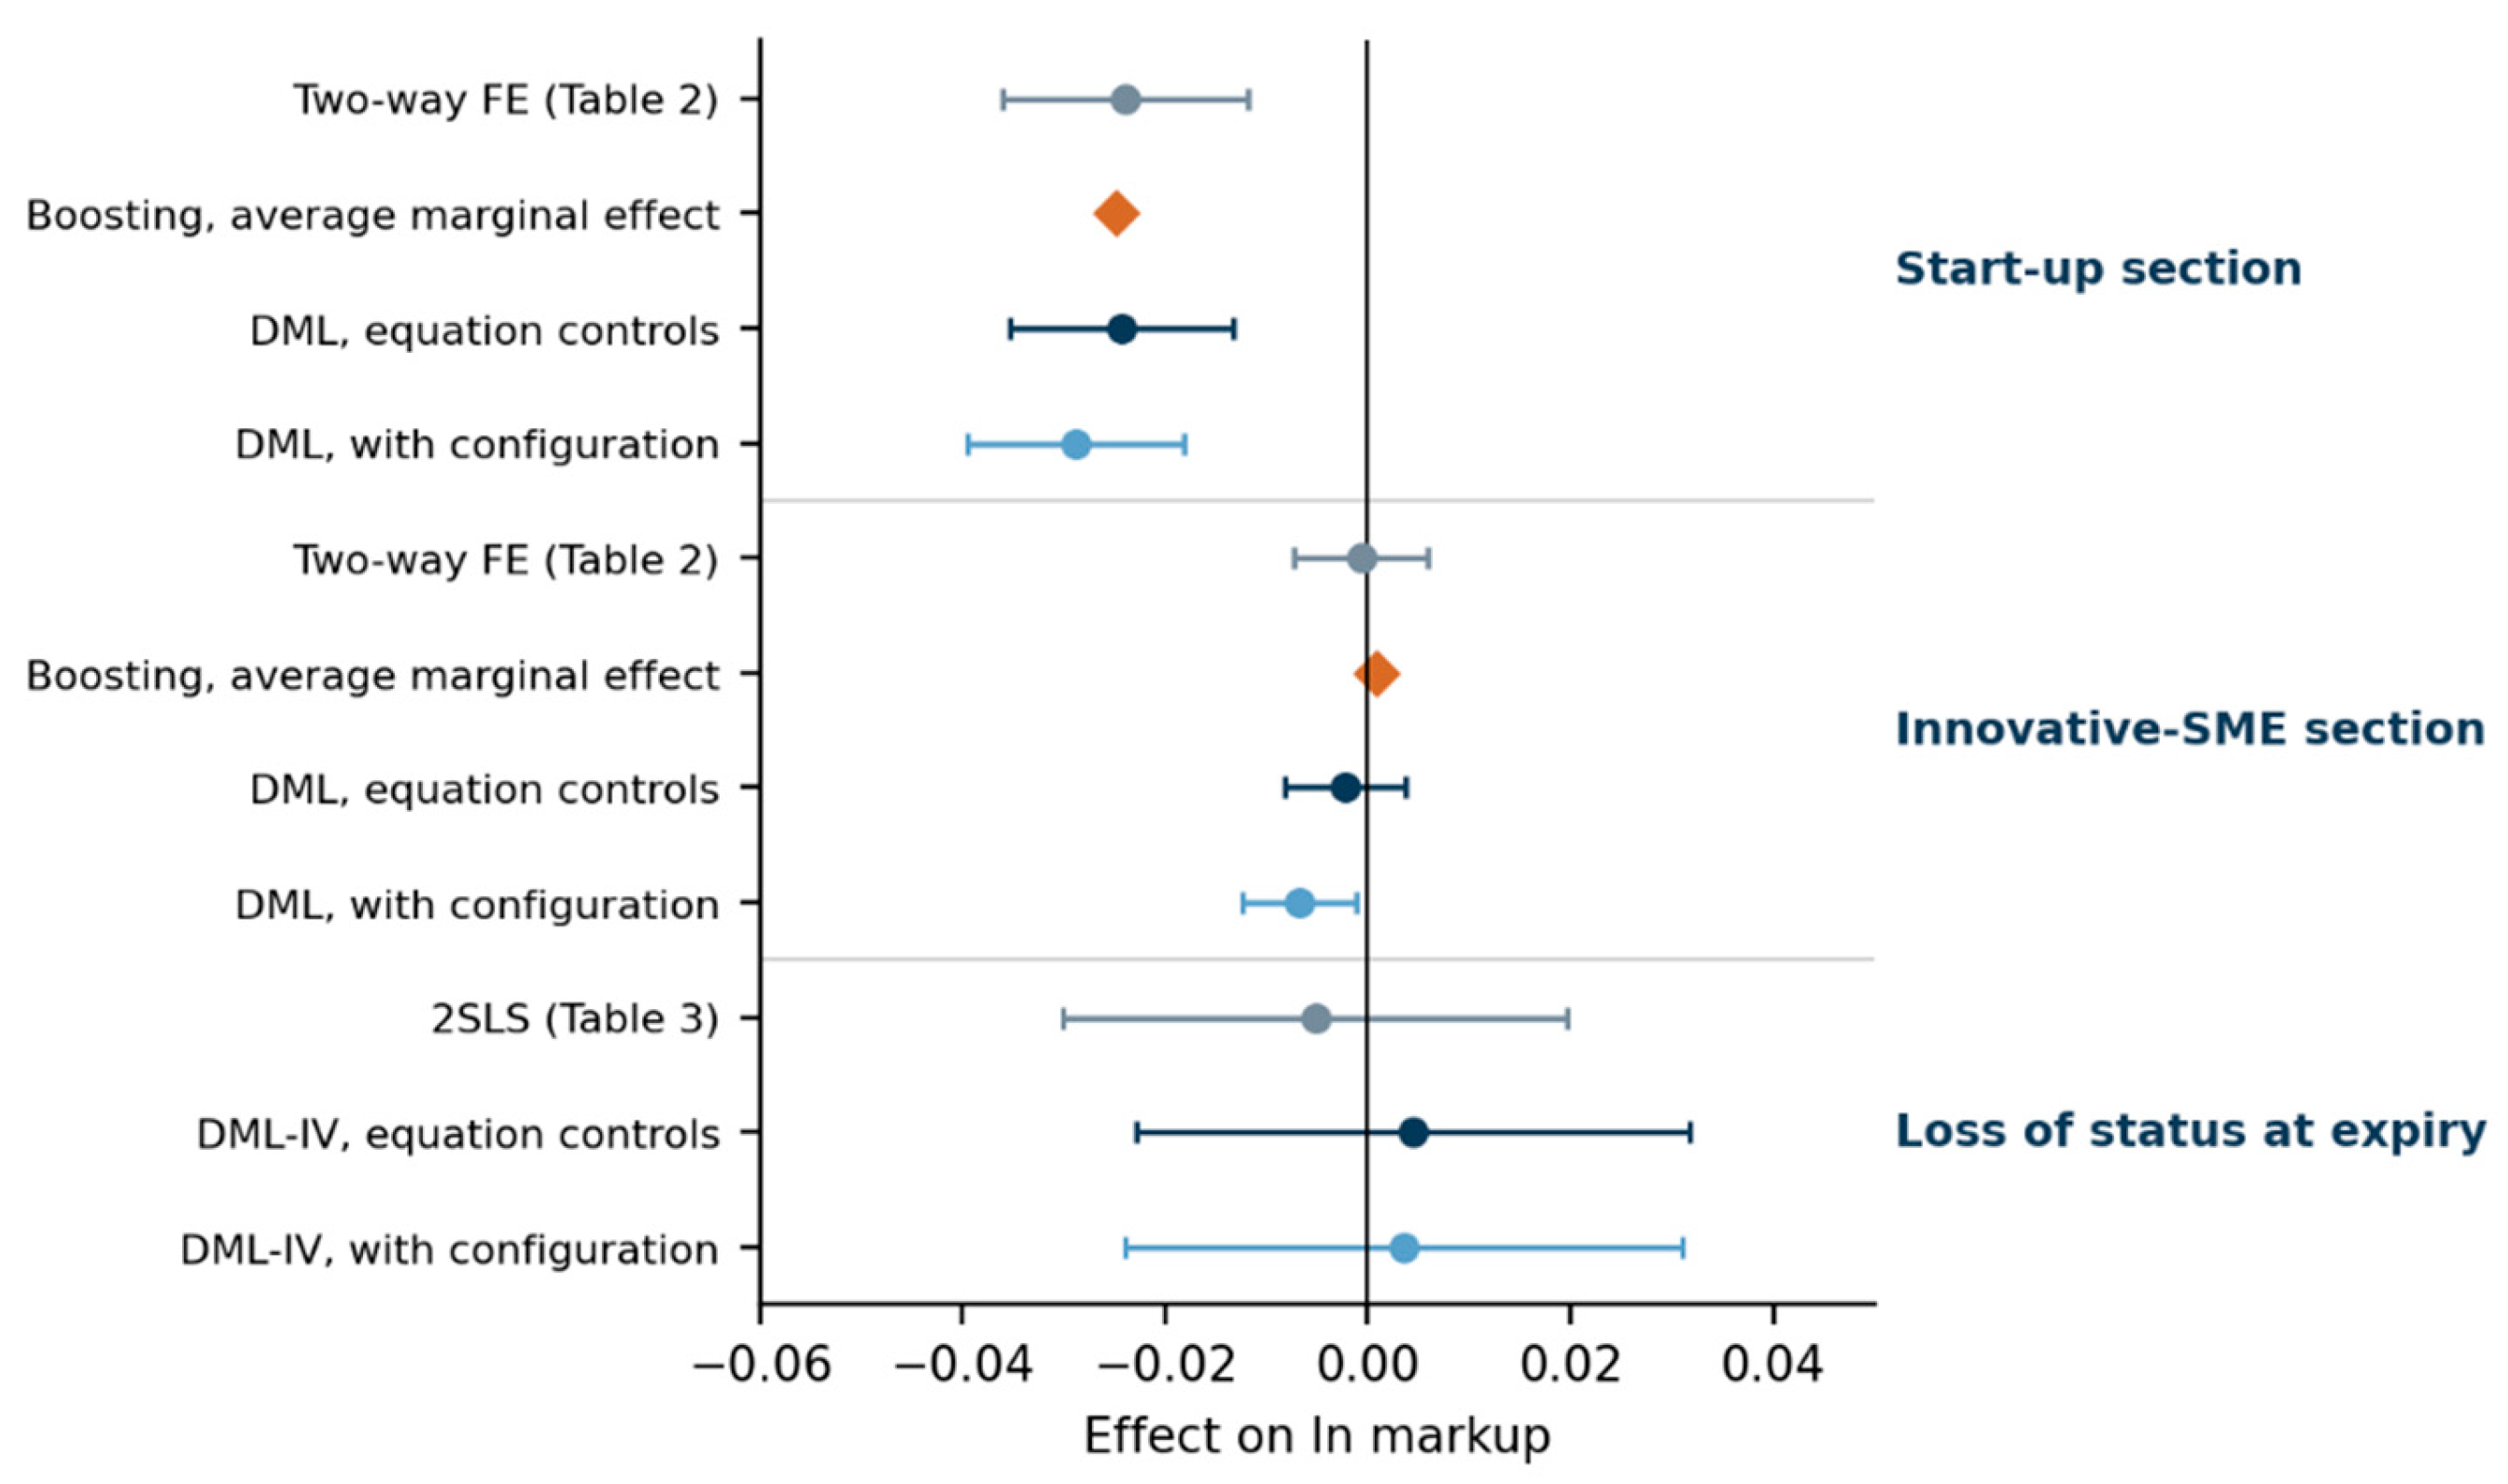
Table 1.
Where this study sits in the literature.
| Research theme | Representative studies | Main gap identified | Contribution of this study |
| Markups from production data | De Loecker & Warzynski (2012); Dobbelaere & Mairesse (2013); De Loecker et al. (2016); Bond et al. (2021); Hashemi et al. (2022); Koppenberg & Hirsch (2022a); Raval (2023b); Huang & Yang (2025); De Ridder et al. (2026); Kirov et al. (2026) | With revenue data the level of the markup is not identified, yet applications still report levels. Validation is conducted on manufacturing samples, often with prices, and almost never on small unlisted firms whose capital must be reconstructed. | Translog ACF elasticity on 76,466 firm-years, 2015–2024, with capital recovered from the structural margin. Shows the level is fragile (Cobb–Douglas median 0.890; sector elasticities above one) and rests every result on within-firm changes, stable across seven variants. |
| Market power: trends and determinants | Kato & Kodama (2014); Stiebale & Vencappa (2018); Dai & Cheng (2018); Asprilla et al. (2019); Peters (2020); Díez et al. (2021); Weche & Wambach (2021); Máñez et al. (2022); Ciapanna et al. (2024); Gradzewicz & Mućk (2024); Burstein et al. (2025) | Markups are related to trade, acquisitions, innovation and exporting, never to a regulatory status. Young certified firms are absent from the samples, and pass-through of policy-induced cost relief to prices is not examined. | First markups for certified start-ups, certified innovative SMEs and ordinary SMEs on identical items: medians 1.047, 1.058 and 1.102. Between-firm gaps of −0.126 and −0.153 in the log markup. |
| Age, customers and the life cycle of markups | Kim et al. (2012); Gourio & Rudanko (2014); Morlacco & Zeke (2021); Roldan-Blanco & Gilbukh (2021); Eslava et al. (2024); Chiavari (2026) | Theory predicts that pricing changes with age through customer accumulation. A regime that ends at a fixed age removes its benefits exactly when pricing moves for other reasons, and no evaluation separates the two. | Uses the twelve-month extension of Decree-law 34/2020, which moved the expiry from sixty to seventy-two months for adjacent cohorts, to separate status from age. Documents a markup trough between the fourth and seventh year. |
| Evaluations of the Italian Start-up Act and regional schemes | De Angelis (2018); Giraudo et al. (2019); Ferrucci et al. (2021); Manaresi et al. (2021); Accetturo (2022); Biancalani et al. (2022); Cantarella et al. (2024); Matricano (2024a); Anderloni & Harasheh (2025); Santoleri & Russo (2025); Albanese & Bronzini (2026) | Outcomes are finance, employment, entry, survival and patents; prices and margins never appear. Identification uses registration, matching or programme discontinuities, never the statutory end of status, the one date the firm does not choose. | Within-firm effect of entry −0.024, vanishing in the dynamic model (0.0005). Expiry instrumented by the statutory date: −0.005 (0.013), first-stage F = 750, on 1,097 firms that moved from the start-up to the SME section. |
| Start-up support and certification elsewhere | Cumming & Johan (2010); Caliendo & Künn (2011); Czarnitzki & Delanote (2015); Galope (2016); Segarra-Blasco & Teruel (2016); Howell (2017); Hottenrott & Richstein (2020); Pyo & Park (2020); Houde (2022, 2026); Bracht et al. (2024) | The value of a public label is tested on access to capital; its effect on prices is studied for certified products, not certified firms. The expiry or phase-out of firm-level benefits is almost unstudied. | Tests both the cost-side and the signalling prediction on the loss of a firm-level label. Neither holds on average: markups do not move when certification ends. |
| Heterogeneity and validation of linear specifications | Rizzoni (1991); Biga Diambeidou & Gailly (2011); Libaers et al. (2016); Bassi & Dias (2020); Cavicchioli & Kocollari (2021); Centobelli et al. (2022); Drago et al. (2025); Song et al. (2025); Guo et al. (2026); Sultana et al. (2026) | Taxonomies describe populations but are not used to test whether one coefficient vector fits them. Learners are used to predict or to estimate a single effect, not to test the specification that produced the estimate. | K-means with seven clusters, selected from 41 solutions on eleven indices: the null at expiry combines falls of 5–6 per cent in fixed-asset-heavy and materials-intensive firms with small rises elsewhere (joint p = 0.001). Boosting and double machine learning on demeaned data reproduce the start-up effect at −0.024 to −0.025. |
Note. Representative studies are drawn from the Scopus searches underlying the reference list and are listed chronologically within each theme. Figures in the last column refer to the estimation sample of 76,466 firm-years on 11,845 firms, 2015–2024.
Table 2.
Variables and construction.
| Variable | Construction | AIDA source |
| μ | Markup, θᵛ / αᵛ; estimated in logs | — |
| θᵛ | Output elasticity of materials and services, translog, ACF two-step | Estimated, Appendix A |
| αᵛ | Materials and services over revenue, revenue corrected by exp(ε̂) | Materie prime e consumo + Variazione materie + Servizi; Ricavi vendite e prestazioni |
| L | Personnel cost | Totale costi del personale |
| K | Fixed assets | Patrimonio Netto − Margine di struttura |
| SU | 1 if in the start-up section in the year | Register of innovative start-ups |
| PMI | 1 if in the innovative-SME section in the year | Register of innovative SMEs |
| EXIT | 1 from the year a graduate leaves the start-up section | Registers, Appendix B |
| Z | 1 from the year the statutory sixty-month (or seventy-two-month) term expires | Incorporation date; DL 179/2012; DL 34/2020 |
| SIZE, AGE | ln total assets; ln(1 + years since incorporation) | Totale Attività; registers, imputed for ordinary SMEs |
Note. Values in thousands of euro. A status counts from the year of entry if entry occurs by 30 June and from the following year otherwise. Log markups are trimmed at the first and ninety-ninth percentiles. Sample: 2,708 innovative start-ups, 2,711 innovative SMEs and 6,426 ordinary SMEs, 2015–2024.
Table 3.
Regulatory status and the log markup, seven estimators.
| Pooled OLS | Between | Random effects | FE firm | FE firm + year | WLS firm weights | WLS revenue weights | |
| SU | −0.1062*** (0.0045) |
−0.1260*** (0.0046) | −0.0376*** (0.0043) | −0.0259*** (0.0056) | −0.0240*** (0.0062) | −0.0383*** (0.0072) | 0.0070 (0.0066) |
| PMI | −0.0812*** (0.0042) |
−0.1533*** (0.0073) | −0.0080*** (0.0028) | −0.0018 (0.0031) | −0.0007 (0.0034) | −0.0068 (0.0042) | 0.0215*** (0.0048) |
| SIZE | −0.0298*** (0.0011) |
−0.0388*** (0.0011) | −0.0117*** (0.0011) | −0.0039** (0.0016) | −0.0017 (0.0019) | −0.0104*** (0.0022) | 0.0181*** (0.0037) |
| AGE | 0.0147*** (0.0016) |
0.0165*** (0.0018) | 0.0017 (0.0017) |
−0.0151*** (0.0022) | −0.0068** (0.0030) | −0.0075** (0.0036) | 0.0012 (0.0033) |
| R² | 0.078 | 0.120 | 0.015 | 0.008 | 0.006 | 0.012 | −0.046 |
| Observations | 76,466 | 11,845 | 76,466 | 76,466 | 76,466 | 76,466 | 76,466 |
| Year effects | Yes | — | Yes | — | Yes | Yes | Yes |
Note. Dependent variable: ln μ. Firm-clustered standard errors in parentheses; *** p < 0.01, ** p < 0.05, * p < 0.10. The between column is estimated on 11,845 firm means. WLS columns include firm and year effects. R² is within for fixed-effects columns and overall otherwise, and is not comparable across columns. Tests: F(firm effects = 0) = 18.78; Breusch–Pagan LM (unbalanced version of Baltagi & Li, 1990) = 108,248; Hausman FE against RE, χ²(4) = 1,073.5; all p < 0.001.
Table 4.
The sixty-month expiry as an instrument for the loss of start-up status.
| OLS | First stage | Reduced form | 2SLS | 2SLS, age dummies | |
| EXIT | 0.0078 (0.0065) |
−0. (0.0127) |
−0.0638 (0.0631) |
||
| Z (statutory term expired) | 0.4903*** (0.0179) |
−0.0025 (0.0062) |
|||
| First-stage F | 750.2 | 18.1 | |||
| Durbin–Wu–Hausman p | 0.234 | 0.188 | |||
| Age control | ln(1+age) | ln(1+age) | ln(1+age) | ln(1+age) | Dummies |
| Observations | 12,224 | 12,224 | 12,224 | 12,224 | 12,224 |
| Firms | 3,787 | 3,787 | 3,787 | 3,787 | 3,787 |
Note. Sample: firms ever on the start-up register with known incorporation date — graduates and start-ups still registered. Dependent variable ln μ except in the first stage, where it is EXIT. Firm and year effects partialled out; SIZE included; firm-clustered standard errors in parentheses. The first-stage F is the squared clustered t-statistic on Z. In the last column age enters as eleven one-year dummies, so the instrument is identified only by the one-year difference the 2020 extension introduced between adjacent cohorts.
Table 5.
Clustering variables.
| Code | Definition | AIDA items | Median |
| PERS | Personnel cost / revenue | Totale costi del personale; Ricavi vendite e prestazioni | 0.274 |
| MATSH | Materials / (materials + services) | Materie prime e consumo; Servizi | 0.384 |
| LEASE | Leased and hired assets / revenue | Godimento beni di terzi | 0.028 |
| KINT | Fixed assets / total assets | Patrimonio Netto − Margine di struttura; Totale Attività | 0.249 |
| TURN | ln(revenue / total assets) | Ricavi vendite e prestazioni; Totale Attività | 0.036 |
| EQ | Net worth / total assets | Patrimonio Netto; Totale Attività | 0.310 |
| LIQ | ln quick ratio | Indice di liquidità | 0.270 |
| INTAM | Intangible amortisation / total assets | Amm. Immob. Immat.; Totale Attività | 0.005 |
Note. Estimation sample of the econometric section: 76,466 firm-years on 11,845 firms, 2015–2024. The quick ratio is missing for 1.2 per cent of observations and intangible amortisation for 0.7 per cent; both are set to the median, so that no observation is lost. Variables winsorised at the 1st and 99th percentiles and standardised before clustering.
Table 6.
The best admissible solution of each algorithm on eleven indices.
| Algorithm | Best k | R² | AIC | BIC | Silh. | Max diam. | Min sep. | Pearson γ | Dunn | Entropy | CH | HHI | Mean rank |
| K-means | 7 | 0.521 | 8,139 | 8,514 | 0.197 | 10.86 | 0.237 | 0.403 | 0.022 | 1.655 | 1,088 | 0.215 | 5.14 |
| Hierarchical (Ward) | 7 | 0.452 | 8,946 | 9,322 | 0.155 | 12.74 | 0.289 | 0.372 | 0.023 | 1.696 | 825 | 0.214 | 7.32 |
| Gaussian mixture | 5 | 0.274 | 10,609 | 10,877 | 0.052 | 13.18 | 0.241 | 0.255 | 0.018 | 1.537 | 564 | 0.227 | 14.45 |
| Random-forest proximity | 5 | 0.245 | 10,843 | 11,111 | 0.078 | 13.52 | 0.295 | 0.223 | 0.022 | 1.310 | 486 | 0.297 | 15.64 |
| Fuzzy C-means | 3 | 0.208 | 11,097 | 11,257 | 0.169 | 13.32 | 0.155 | 0.303 | 0.012 | 0.989 | 787 | 0.397 | 17.82 |
| DBSCAN | — | — | — | — | — | — | — | — | — | — | — | — | no partition |
Note. Indices on the common subsample of 6,000 firm-years. AIC and BIC are computed from the within-cluster sum of squares under a spherical Gaussian approximation, identically for every algorithm. Lower is better for AIC, BIC, maximum diameter, HHI and mean rank; higher for the others. Mean rank over the eleven indices among the 26 admissible solutions; the full grid is in Supplementary Material S5.
Table 7.
Profiles of the seven configurations.
| C1 | C2 | C3 | C4 | C5 | C6 | C7 | |
| Label | Materials-intensive | Intangible-capitalising | Asset-renting | Equity-rich, liquid | Pre-scale, labour-heavy | Fixed-asset heavy, illiquid | Asset-light services |
| Share of firm-years | 28.6% | 6.1% | 2.8% | 19.9% | 1.9% | 15.0% | 25.8% |
| Median μ | 1.060 | 1.070 | 1.085 | 1.097 | 1.108 | 1.130 | 1.159 |
| Median θᵛ | 0.746 | 0.697 | 0.697 | 0.679 | 0.619 | 0.692 | 0.539 |
| Median αᵛ | 0.721 | 0.673 | 0.665 | 0.632 | 0.563 | 0.626 | 0.472 |
| PERS | 0.184 | 0.356 | 0.331 | 0.264 | 2.770 | 0.297 | 0.445 |
| MATSH | 0.737 | 0.031 | 0.133 | 0.389 | 0.040 | 0.430 | 0.053 |
| KINT | 0.225 | 0.442 | 0.426 | 0.220 | 0.479 | 0.587 | 0.100 |
| Revenue / assets | 1.234 | 0.617 | 0.403 | 0.840 | 0.055 | 0.680 | 1.446 |
| EQ | 0.265 | 0.345 | 0.278 | 0.633 | 0.458 | 0.281 | 0.192 |
| Median age | 17.1 | 5.0 | 4.0 | 15.6 | 3.4 | 14.2 | 8.7 |
| Innovative start-ups | 2.8% | 19.6% | 22.1% | 8.9% | 24.4% | 7.3% | 8.5% |
| Innovative SMEs | 10.5% | 66.9% | 35.6% | 29.3% | 64.9% | 22.8% | 22.9% |
| Ordinary SMEs | 86.7% | 13.6% | 42.3% | 61.8% | 10.7% | 69.9% | 68.6% |
Note. Medians within cluster, ratios in original units. Population shares are row compositions of each cluster. Association between cluster and population: χ²(12) = 13,092, Cramér’s V = 0.293. Year-on-year probability of remaining in the same cluster: 0.805.
Table 8.
Status coefficients by configuration.
| Configuration | SU, interacted FE | PMI, interacted FE | EXIT, 2SLS | First-stage F | Graduates |
| C1 Materials-intensive | −0.0065 (0.0093) | 0.0007 (0.0044) | −0.0543** (0.0223) | 232 | 94 |
| C2 Intangible-capitalising | −0.0396*** (0.0099) | 0.0016 (0.0073) | 0.0275 (0.0180) | 1,173 | 231 |
| C3 Asset-renting | −0.0246* (0.0136) | −0.0130 (0.0143) | −0.0201 (0.0258) | 306 | 74 |
| C4 Equity-rich, liquid | −0.0269*** (0.0077) | −0.0047 (0.0049) | 0.0210 (0.0160) | 698 | 234 |
| C5 Pre-scale, labour-heavy | 0.0008 (0.0157) | 0.0160 (0.0136) | −0.0489 (0.0343) | 308 | 98 |
| C6 Fixed-asset heavy, illiquid | −0.0497*** (0.0093) | −0.0118** (0.0053) | −0.0645** (0.0305) | 192 | 122 |
| C7 Asset-light services | −0.0132 (0.0087) | 0.0059 (0.0057) | −0.0317 (0.0208) | 475 | 197 |
| Equality across clusters, χ²(6) | 27.2 (p = 0.0001) | 10.7 (p = 0.099) | 24.0 (p = 0.0005) | ||
| All coefficients zero, χ²(7) | 24.1 (p = 0.0011) |
Note. Columns 1–2: one two-way fixed-effects regression of ln μ on SU and PMI interacted with the cluster of the firm-year, with cluster effects, SIZE and AGE; 76,466 observations. Columns 3–5: EXIT interacted with the firm’s modal cluster before its statutory expiry, instrumented by Z interacted with the same cluster, on the instrumental-variable sample of the econometric section (12,089 observations); the first-stage F is the squared clustered t-statistic of each own instrument. Firm-clustered standard errors in parentheses; *** p < 0.01, ** p < 0.05, * p < 0.10.
Table 9.
Learners and specifications.
| Learner | Specification | Scaling | Role |
| Linear regression | Ordinary least squares on demeaned data | None | Reproduces two-way FE exactly |
| Linear SVM | ε-insensitive loss, ε = 0, C = 0.01 | Standardised | Linear, robust to outliers |
| Decision tree | Depth 8, at least 100 observations per leaf | None | Single nonlinear partition |
| KNN | k = 100, Euclidean distance | Standardised | Local average, no functional form |
| Random forest | 150 trees, leaf ≥ 20, half of features and of rows per tree | None | Averaged nonlinear partitions |
| Boosting | Histogram gradient boosting, 31 leaves, leaf ≥ 50, learning rate 0.05, early stopping | None | Sequential nonlinear fit with interactions |
Note. Dependent variable: ln μ demeaned by firm and year. Equation set: SU, PMI, SIZE, AGE; augmented set: the same plus PERS, MATSH, LEASE, KINT, TURN, EQ, LIQ and INTAM from Table 5, all demeaned identically. Five folds grouped by firm; 76,466 firm-years on 11,845 firms. Sensitivity to hyperparameters in Supplementary Material S9.
Table 10.
Ten indicators of out-of-sample performance.
| Set | Learner | R² | MSE×10³ | RMSE | MAE | MedAE | Expl. var. | Max error | Pearson r | R² fold SD | R² fold min | Ratio to linear | Mean rank |
| Equation | Linear regression | 0.0017 | 5.402 | 0.0735 | 0.0436 | 0.0235 | 0.0017 | 0.671 | 0.041 | 0.0012 | 0.0001 | 1.00 | 4.6 |
| Equation | Linear SVM | −0.0063 | 5.446 | 0.0738 | 0.0433 | 0.0229 | −0.0063 | 0.670 | −0.000 | 0.0025 | −0.0092 | −3.77 | 4.3 |
| Equation | Decision tree | 0.0054 | 5.382 | 0.0734 | 0.0435 | 0.0232 | 0.0054 | 0.666 | 0.095 | 0.0036 | −0.0008 | 3.19 | 3.8 |
| Equation | KNN | 0.0058 | 5.380 | 0.0733 | 0.0436 | 0.0234 | 0.0058 | 0.672 | 0.092 | 0.0035 | 0.0004 | 3.43 | 3.8 |
| Equation | Random forest | 0.0112 | 5.351 | 0.0731 | 0.0435 | 0.0234 | 0.0112 | 0.682 | 0.115 | 0.0036 | 0.0078 | 6.64 | 2.8 |
| Equation | Boosting | 0.0117 | 5.348 | 0.0731 | 0.0433 | 0.0231 | 0.0117 | 0.666 | 0.108 | 0.0031 | 0.0077 | 6.92 | 1.7 |
| Augmented | Linear regression | 0.0510 | 5.135 | 0.0717 | 0.0415 | 0.0215 | 0.0510 | 0.782 | 0.226 | 0.0066 | 0.0395 | 1.00 | 4.9 |
| Augmented | Linear SVM | 0.0341 | 5.227 | 0.0723 | 0.0408 | 0.0200 | 0.0341 | 0.792 | 0.213 | 0.0097 | 0.0199 | 0.67 | 5.5 |
| Augmented | Decision tree | 0.1013 | 4.863 | 0.0697 | 0.0392 | 0.0194 | 0.1013 | 0.701 | 0.323 | 0.0144 | 0.0788 | 1.99 | 3.2 |
| Augmented | KNN | 0.0756 | 5.002 | 0.0707 | 0.0401 | 0.0195 | 0.0757 | 0.684 | 0.285 | 0.0061 | 0.0655 | 1.48 | 3.4 |
| Augmented | Random forest | 0.1463 | 4.619 | 0.0680 | 0.0373 | 0.0176 | 0.1463 | 0.704 | 0.384 | 0.0133 | 0.1317 | 2.87 | 1.6 |
| Augmented | Boosting | 0.1441 | 4.631 | 0.0681 | 0.0377 | 0.0180 | 0.1441 | 0.685 | 0.380 | 0.0185 | 0.1206 | 2.83 | 2.4 |
Note. Out-of-fold predictions from five firm-grouped folds. Mean rank across the ten indicators within each feature set, 1 = best; lower is better for MSE, RMSE, MAE, MedAE, maximum error and fold SD. Ratio = R² over that of linear regression on the same set; negative for the linear SVM on the equation set because its R² is negative. Averaged over both sets, mean ranks are: boosting 2.05, random forest 2.20, decision tree 3.50, KNN 3.60, linear regression 4.75, linear SVM 4.90.
Table 11.
The status coefficients under flexible estimation.
| Two-way FE | Boosting AME, equation set | Boosting AME, augmented set | DML, equation controls | DML, with configuration | |
| SU | −0.0240*** (0.0062) |
−0.0248 | −0.0309 | −0.0243*** (0.0057) |
−0.0289*** (0.0055) |
| PMI | −0.0007 (0.0034) |
0.0009 | −0.0016 | −0.0023 (0.0031) |
−0.0067** (0.0029) |
| SIZE | −0.0017 | 0.0027 | 0.0027 | — | — |
| AGE | −0.0068** | −0.0029 | −0.0072 | — | — |
| EXIT (instrumented by Z) | −0.0052 (0.0127) |
— | — | 0.0044 (0.0139) |
0.0036 (0.0140) |
| First-stage F, EXIT | 750 | 589 | 557 |
Note. All estimates on data demeaned by firm and year. Two-way FE: Table 3 and, for EXIT, Table 4. Boosting AME: average over held-out observations of the finite-difference derivative of the boosted prediction with respect to each variable (±0.5 for SU and PMI, ±0.2 for SIZE, ±0.1 for AGE); no sampling error is reported because the derivative of a tree ensemble is not a regular estimator. DML: partially linear model of Chernozhukov et al. (2018), outcome and treatments residualised on the controls by boosting with five-fold firm-grouped cross-fitting, standard errors clustered by firm. EXIT rows: partially linear IV on the 12,224 firm-years of the instrumental-variable sample, demeaned within that sample. *** p < 0.01, ** p < 0.05, * p < 0.10.
Table 12.
Summary of results and their relation to the literature.
| Result | Evidence | Relation to literature | Reference studies |
| Markup level close to 1.1 | Median μ = 1.091 (translog) | Consistent | Ciapanna et al. (2024); Díez et al. (2021) |
| Level not robust to functional form | Cobb–Douglas median 0.890; sector elasticities > 1; two-input markup doubles | Consistent | Bond et al. (2021); Hashemi et al. (2022); Raval (2023b); De Ridder et al. (2026) |
| Certified firms price below ordinary SMEs | Medians 1.047 / 1.058 / 1.102; between −0.126 and −0.153 | Original | No prior markup evidence for certified populations; Manaresi et al. (2021); Biancalani et al. (2022) |
| The discount reflects selection, not treatment | Within −0.024 and −0.001; between SD twice the within SD | Consistent | Cantarella et al. (2024); Anderloni & Harasheh (2025) |
| Entry into the register leaves no lasting mark on price | Anderson–Hsiao ρ = 0.366; start-up coefficient 0.0005; zero under revenue weights | Original; in contrast with financial effects | Manaresi et al. (2021); Biancalani et al. (2022); Giraudo et al. (2019) |
| Loss of status does not change markups on average | Event study flat; 2SLS −0.005 (0.013), F = 750; DWH p = 0.234 | Original design; in opposition to cost-side and signalling predictions | Galope (2016); Howell (2017); Houde (2022, 2026); Cumming & Johan (2010) |
| Firm-level label carries little pricing power | No price response when certification ends | In opposition | Houde (2022, 2026) on product certification |
| Markups follow a life cycle | Fall over first four years, recovery from the seventh | Consistent | Gourio & Rudanko (2014); Roldan-Blanco & Gilbukh (2021); Eslava et al. (2024) |
| Accounts form a continuum, not islands | DBSCAN no admissible partition; K-means k = 7, ARI 0.985 | Original in protocol | Biga Diambeidou & Gailly (2011); Centobelli et al. (2022); Libaers et al. (2016) |
| Services earn the highest markups | Asset-light services median 1.159 vs 1.060 for materials-intensive | Consistent | Díez et al. (2021) |
| Configuration does not explain the certified discount | Pooled SU −0.106 → −0.090 with cluster effects | Original | — |
| The null at expiry averages opposite responses | −6.4% (C6), −5.4% (C1), +2.8% (C2); joint p = 0.001 | Original; consistent with heterogeneity by firm type | Pyo & Park (2020); Máñez et al. (2022) |
| The linear equation is adequate for status | Boosting AME −0.025; DML −0.024 (0.006); DML-IV +0.004 (0.014) | Consistent with method; in opposition to the presumption that flexible learners dominate | Chernozhukov et al. (2018); Mullainathan & Spiess (2017); Athey & Imbens (2019) |
| Configuration explains within-firm variation the equation omits | Out-of-sample R² 0.051 → 0.146 with configuration ratios | Original | Bond et al. (2021) on construction of the markup |
| Learner compresses cluster heterogeneity | Boosted effect −0.019 to −0.034 vs −0.050 to 0.001 in regression | Original; qualifies the partition | — |
Note. “Consistent” means the result reproduces a finding of the cited studies; “in opposition” that it contradicts a finding or a prediction derived from them; “original” that the question, the population or the design has no counterpart in the cited literature. All estimates refer to the sample of 76,466 firm-years on 11,845 firms, 2015–2024.
Disclaimer/Publisher’s Note: The statements, opinions and data contained in all publications are solely those of the individual author(s) and contributor(s) and not of MDPI and/or the editor(s). MDPI and/or the editor(s) disclaim responsibility for any injury to people or property resulting from any ideas, methods, instructions or products referred to in the content. |
© 2026 by the authors. Licensee MDPI, Basel, Switzerland. This article is an open access article distributed under the terms and conditions of the Creative Commons Attribution (CC BY) license (http://creativecommons.org/licenses/by/4.0/).
Copyright: This open access article is published under a Creative Commons CC BY 4.0 license, which permit the free download, distribution, and reuse, provided that the author and preprint are cited in any reuse.