

Submitted:
15 September 2026
Posted:
16 September 2026
You are already at the latest version
Abstract
(1) Background. Established educational processes often fail to replicate the volatile workflow of the IT industry. A critical challenge lies in preparing students for uncertainty and volatility in labor market conditions. This study develops a gamified methodology designed to foster essential soft skills in future IT specialists. (2) Methods. This paper outlines the methodology and its quantitative performance metrics based on an experiment conducted from 2023 to 2026 at Moscow Polytechnic University. Conventional statistical tools, including Sheppard’s correction, Student's t-test, and Pearson's and Spearman's correlation coefficients, were applied to analyze group dynamics, ranking volatility, and network interaction structures. (3) Results. Game-based ranking pressure successfully disrupts linear academic patterns and activates latent behavioral strategies. This volatile approach completely eliminates the Gaussian normal distribution, creating a discrete, polymodal ranking structure that divides students into polar subclusters. Students resolve the didactic duality between personal gain and team synergy through network self-organization and local symbiotic alliances, while psychological pressure is balanced by voluntary participation and prompt debriefing. (4) Conclusions. The proposed mathematical framework enables continuous monitoring of role structures within student groups. Further development involves cross-institutional transfer of this methodology to regional universities to test the invariance of the identified behavioral patterns.
Keywords:
gamification of education
; soft skills
; knowledge sharing
; time management
; teamwork
; behavioral patterns
; social mechanics
; ranking systems
1. Introduction
Each student follows an individual educational pathway that allows them to determine the pace of learning and select of academic disciplines to achieve specific goals [1]. While this approach enables the development of an individual professional growth trajectory, it also entails a fundamental paradox.
Students may select disciplines exclusively from the elective component offered by the educational program, whereas the core component remains fixed. Although students are entitled to vary their learning pace, they must strictly adhere to the schedules established in governing documents. All parameters of the educational process—ranging from didactic units to assessment materials and logistical resources—are strictly regulated by the instructor and approved by the university's curriculum committee [2].
The conventional educational path therefore entails a rigid progression through fixed milestones with standardized and pre-established outcome requirements. Moreover, the assessment process itself eliminates the risk of an irreversible negative outcome. Receiving an unsatisfactory grade is not critical, as students always have the opportunity to resubmit their work under the original conditions to achieve the intended learning outcomes.
Students' academic performance within this model depends entirely and individually on the learners themselves. Students independently collect the necessary materials and complete their assignments [2,3]. Within this traditional educational process, the instructor acts as a mentor, providing necessary advice and recording the results achieved [4].
Consequently, the educational ecosystem established at the university completely eliminates uncertainty and the dependence of outcomes on external influences [5]. In contrast, actual work in the IT industry, particularly in team-based development, is characterized by highly volatile processes. The end product often lacks a fixed visual form, consisting of a dynamic set of requirements. Furthermore, a single task may be in various ways limited in terms of both completion time and resource availability. Another key disruptive factor is that, even when all scheduled tasks are successfully completed, the client or project manager might demand unforeseen revisions.
At the same time, in the corporate IT development environment, an individual employee's performance does not automatically guarantee rewards such as financial bonuses or promotions. This is explained by the synergistic nature of teamwork; specifically, the failure of an individual specialist to complete their specific tasks adversely affects the entire project outcome. Consequently, overall performance metrics suffer even if the employees successfully and timely fulfill their personal obligations.
The educational ecosystem created by the university for training IT specialists completely overlooks these disruptive factors inherent in the corporate environment. Modern educational programs focus primarily on developing a student's specific technical competencies or "hard skills" [4,6]. Over the course of four years, the student is completely absorbed by an artificial, so-called "hothouse" environment, which significantly distorts the realities of the future profession. As a result, upon graduation, students find themselves psychologically and methodologically unprepared for the harsh conditions of the real labor market [5,7].
Various formats, including sessions with industry partners, game mechanics, industrial internships, networked educational programs, and short-term intensive courses, are incorporated into the academic practice to serve as preventive measures [2,8]. These formats allow for the partial transformation of established programs, bringing them closer to real-world production processes. However, such measures still fail to fully simulate key uncertainty factors or create a comprehensive educational environment characterized by robust communication links among future specialists.
The primary objective of this study is to develop innovative didactic conditions that simulate a real-world corporate IT environment and integrate them into the traditional educational process. To achieve this goal, a key research task must be addressed, namely, the development of a comprehensive methodology for modeling social dynamics and uncertainty factors aimed at fostering soft skills in future IT specialists.
As part of the study, the following have been executed:
- establishment of an organizational framework for conducting the experiment (Subsection 2.1);
- selection and profiling of the participants (Subsection 2.2);
- definition of mathematical and technological tools for processing the obtained results (Subsections 2.3 and 2.4, respectively);
- registration and documentation of the results (Section 3);
- a comparative analysis of the obtained data against the results of contemporary studies (Subsection 4.1);
- definition of the study's limitations (Subsection 4.2).
The scientific novelty of the study lies in the theoretical modeling and experimental implementation of a didactic circuit that functions at the intersection of individual competition and forced group synergy. The mechanisms of this artificially created aggressive operating environment introduced into training practice are unprecedented. This approach balances personal achievements and teamwork by activating latent behavioral patterns, introducing volatile assessment criteria, and creating a time deficit, all while maintaining the openness of information sources.
The theoretical significance of the study consists in demonstrating that competencies developed within the conventional training model turn out to be ineffective when faced with real-world factors of the corporate IT environment. The developed methodology serves to identify hidden patterns of student behavior that are normally dormant under standard university conditions. The findings prove that the proposed approach ensures the disclosure of a student’s personal potential, regardless of their current academic performance and the subjective opinion of the instructor.
At the same time, the implementation of this model fully preserves the continuity of academic standards in full compliance with the provisions of governing documents regulating the educational process, guaranteeing each student the opportunity to receive a final grade regardless of the intermediate results of the experiment. In addition, the data obtained expand the theory of educational gamification by introducing controlled destructive factors and volatile game mechanics into the educational process.
The study is practically significant because it develops a methodology that establishes the organizational and pedagogical conditions for monitoring students' professional competencies. The proposed approach enables the instructor to continuously observe interpersonal communication processes, group dynamics, students' emerging mental strategies, and the specifics of both team and individual decisions. Drawing on empirical data, professional expertise, and pedagogical experience, the instructor can promptly adjust the instructional framework, adapting theoretical and practical material to the group's current level of knowledge acquisition.
Furthermore, observing small-group interactions and analyzing the resulting quantitative assessment data facilitate pedagogical management and the stratification of the group's role structure. This approach aids in distinguishing between dominant and dependent behavioral patterns, identifying potential project leaders, and proactively determining pathways to provide academic support to individual students.
To provide a theoretical basis for the developed methodology and verify the effectiveness of the established organizational and pedagogical conditions, the research design was structured to test the following hypotheses:
- Hypothesis 1. Integrating a model of extreme time management with the simulation of uncertainty factors during IT team operations facilitates the emergence and development of a student's latent competencies, where personal success depends on both baseline subject-matter knowledge and behavioral flexibility.
- Hypothesis 2. Shifting students' perceptions of academic fairness toward pragmatic knowledge sharing and the differentiation of role archetypes simulates real-world scenarios of team survival within the IT environment.
- Hypothesis 3. Implementing a learning model that incorporates disruptive uncertainty factors and volatile game mechanics maintains a statistically stable distribution of student results, thereby objectively differentiating their positions in academic rankings within the bounds of statistical norms.
2. Materials and Methods
The study focuses on the self-management and group dynamics of IT students as they navigate a blend of collaborative interaction and individual competition under conditions of extreme time pressure.
The subject of the study is behavioral agility as a determinant of individual performance in teamwork—a factor that defines personal success in contexts where a high level of technical expertise (hard skills) does not guarantee effectiveness without well-developed soft skills.
The experiment was conducted within the "Fundamentals of Testing" course of the "Applied Informatics" program. The study also encompassed a specific module within the "Software Quality Assurance, Testing, and Debugging" course of the "Informatics and Computer Engineering" program. Moscow Polytechnic University (Moscow, Russia) served as the research site.
The developed methodology aims to foster the following competencies:
- Management of IT projects based on established schedules while adhering to approved parameters.
- Integration of software modules and components, and verification of software product releases
- Execution and management of the development, modification, and maintenance of information systems that automate organizational administration and business operations.
- Execution of conceptual and logical system design, and provision of support for the developed design solutions.
3.1. Experiment Methodology
3.1.1. Regulatory Provisions
The reconstruction of conditions of real-world IT team operations while upholding the academic principles of the educational program, requires the development of a methodology for the systematic monitoring of knowledge.
As part of the course, students were offered the opportunity to participate in a voluntary "bonus marathon." This format simulated a business environment. The primary objective of the marathon was to assess theoretical knowledge as well as the students' social and managerial maturity in teamwork. The experiment involved completing 15 five-minute quizzes in total. Under standard conditions, each session functioned as a "regular five-minute session" or "Regular Task" (RT). Each five-minute quiz consisted of five questions requiring short answers ranging from one to four words.
During the experiment, participants wrote their answers by hand on a separate sheet of paper. Upon the expiration of the allotted time, the papers were handed in to the instructor. The sessions conducting observed the following organizational rules:
- Before they began, the instructor briefly outlined the procedural rules, the required format for answers, and the grading criteria. Time was also allotted for technical setup, during which students took their seats and prepared their workspaces.
- All questions were displayed on an interactive whiteboard as video clips. Each question was shown for one minute, which time was a fixed duration regardless of the task's difficulty or the participants' readiness. After the fifth question, the entire set was shown again, with each question displayed for 10 seconds. This time allowed students to verify or correct their answers. Once the repeat viewing concluded, the answer sheets were promptly handed in to the instructor.
- Every paper had to include the author's full name; papers lacking this information could not be attributed to a specific individual. The instructor made no attempt to identify students through indirect means, and such papers were simply designated as "Anonymous."
- Answers were discussed with the instructor immediately after the papers were collected. The schedule for similar five-minute sessions in other groups within the cohort did not affect this process.
- Students were permitted to group answers discussion, and the instructor did not intervene in these discussions or comment on the noise level in the classroom.
- Each five-minute quiz focused on a specific theme. The assignment invariably included at least three questions based on the most recent lecture, as well as material from the current practical session. Additionally, the instructor included questions covering previously studied topics.
- Students were allowed to use pre-reference materials, such as handwritten or printed notes and textbooks. The use of any electronic devices—including computers, tablets, smartphones, smartwatches, and headphones—was strictly prohibited. Exchanging any materials, including notes or rough drafts, between students was forbidden, as was the swapping of answer sheets.
- Students were permitted to move within the classroom only to approach the interactive whiteboard. The purpose of such movement was to examine details of the images on the displayed slide. While doing so, students were allowed to continue discussing the questions verbally with other participants.
- If a student violated rule 7 or 8, a one-point penalty (–1) was imposed on all members of the cluster. Upon noting a violation, the instructor would simply said the word "violation." The five-minute session was not interrupted by this announcement. A public review of the incident was deferred until all assignments had been submitted.When outlining the rules, the instructor emphasized that he would not intervene when violations occurred. The instructor merely recorded the fact that a violation had taken place; no assessment was made regarding the severity of the infraction or its impact on the final results. Actions classified as violations included a student moving to a colleague's workspace to view their notes, using a smartphone or laptop regardless of the purpose, and passing reference materials to another person.
- Only one five-minute session was conducted per class session. Holding multiple such activities during a single class period was permitted only in exceptional cases, such as schedule changes due to holidays or a shift to remote learning. In such instances, the instructor would inform students of the schedule for these activities in advance.
- The activity took place at a random time, chosen to maintain the coherence and logical flow of the lesson; it could occur at the beginning, in the middle, or ten minutes before the end of the class. A student’s late arrival was not grounds for exclusion from the activity; the student was permitted to begin the task at any point. However, no extra time was granted, and missed questions were not repeated.
- Depending on the course of the discussion, the instructor might intervene by providing various types of information to the participants, for instance, offering subtle hints pointing toward the correct answer or adjusting the discussion evolution. These actions could be either constructive or destructive in nature. Such information gave rise to new potential answers or raised doubts among the students. It also helped confirm the accuracy of the ongoing reasoning or drew attention to the behavior of individual participants.
- Answers on the worksheet could be written in ink or pencil of any color. The only requirement was that the text had to be clearly legible during grading.
- The five-minute session was not permitted to be retaken, regardless of the score achieved or the reason for a student's absence from class.
- An overall ranking of students in the respective cohort was compiled based on the results of each assignment. This ranking was available to students online.
- Of the 15 five-minute sessions, three held a special status and were graded according to modified rules; these were known as "lucky five-minute sessions" or "Bonus-bearing Tasks" (BT). Students were informed of the rules for these sessions during the first class, while notification regarding the change in status of a standard RT occurred immediately before the video containing the test questions began.
3.1.2. Content of Brief Sessions and Rules for Evaluating Responses
Figure 1 shows the structure of the five-minute sessions. Appendix A provides examples of questions used in the sessions for different cohorts.
The questions in the theoretical-productive section required students to possess a basic theoretical understanding of the subject matter. Students drew conclusions based on their knowledge to arrive at the correct answer. All tasks in this section were text-based.
Questions in the cognitive-visual section invariably incorporated audio and graphic content. Answering them required analysis and the formation of associations based on the material presented. This material included short interview clips featuring IT specialists, diagrams, thematic comics, and narrative video segments. Depending on the type of content, students were required to identify underlying relationships, define the scope of a problem area, or relate a visual scenario to the theoretical framework.
The sequence of questions during these five-minute sessions was determined by the group's current atmosphere and the instructor's pedagogical objectives. The following structural approaches were employed during the experiment:
- Placing complicated questions at the beginning of the task. This approach encouraged further discussion of the initial questions by freeing up more time. Time saved on easier questions could be devoted to intensive problem-solving and cross-checking answers.
- Alternating between complicated and simple questions. This structure ensured a smooth distribution of the time gained for group discussion.
- Placing simple questions at the beginning of the task. This option fostered a faster pace of decision-making when determining the line of reasoning and recording correct answers for the subsequent difficult tasks.
Each question, regardless of its type, is scored from 0 (incorrect answer) to 1 point (correct answer). Accordingly, each paper can score a maximum of 5 points. An answer that is written clearly, contains no errors, and aligns with the question is considered correct. To recognize an answer as correct, its inscription must be clearly identified and mapped to the question number.
The comprehensibility criterion was introduced because of the possibility of students correcting answers. Such corrections included crossing out, erasing text, or inserting missing words.
The requirements for the response form are divided into two groups:
- Standard requirements (applicable to all questions regardless of their type and five-minute session status):
- Use of the nominative case for nouns and the infinitive form for verbs.
- Total absence of abbreviations, except those that are generally known or studied as part of the training course.
- Agreement of numerals and adjectives with the defined noun.
- Exclusion of any explanations or comments accompanying the answer.
- Formulation of answers in Russian without using transliteration.
- Consistency in the design of lists for all answers within one paper, since individual characters may be part of the answer.
- Precise indication of the grammatical number for nouns (for example, the words "error" and "errors" are treated as two different answers).
- Submission of only a single answer unless the question allows for multiple choices, as the instructor does not choose which answer is to be graded.
- 2.
- Specific requirements (applicable to a specific question and indicated on the corresponding slide):
- Use of mandatory symbols. For example, if there are two semantic units, each must be separated by a semicolon.
- No extra symbols. For example, a numeric sequence must be written without any characters between the digits.
- Use of fixed phrases when a specific condition in the question is met (for example, if the answer involves multiple items, the placeholder word "many" may be used instead of a list; if no valid answer options exist, the word "none" is used).
Depending on the type of question and the structure of the answer, the score can be subdivided. This procedure is applied in the following cases:
- Provision of a generalized answer without specific details (for example, if a question requires the specific answer "test results report" but the participant writes simply "report," partial credit is awarded because while the core meaning is correct, the context remains ambiguous).
- Use of "part-to-whole" type answers (for example, if the question "type of testing that verifies application operation strictly within stated technical specifications and design limits" requires the answer "load testing" but a student answers "performance testing," partial credit is awarded because load testing is a subset of performance testing).
- Provision of an incomplete list of items relevant to the question.
- Application of association-based questions when presenting diagrams, comics, or video clips.
During the experiment, students were informed in advance that answers would be evaluated against more than just a pre-set answer key; the assessment also considered how well the answer aligned with the overall context of the question.
3.1.3. Specific Rules for Evaluating "Lucky" Five-Minute Sessions
Specific scoring rules applied only to "lucky" five-minute sessions. In this case, both a primary score and an additional score were calculated. The primary score was determined using the standard method employed for regular sessions. The additional score was calculated as follows:
- For each question, the total number of points missed by all cohort members who answered incorrectly or only partially correctly was calculated.
- This total was then distributed proportionally among all participants who answered the question completely correctly (receiving 1 point).
- This calculation was performed separately for each of the five questions.
A hypothetical calculation example for a cohort of 30 students is provided below. Division into study groups was irrelevant for determining additional scores. In this example, all students participated in the "lucky" session. The following results were obtained after the answers were scored:
- Question 1. All participants answered correctly. Consequently, each of them received only the base score of 1 point.
- Question 2. 15 out of 30 participants answered correctly. Each of them received the base score plus 1 bonus point, calculated as (30 – 15) / 15.
- Question 3. 1 out of 30 participants answered correctly. This participant received the base score and 29 bonus points from the 29 individuals who had answered incorrectly.
- Question 4. The correct answer was given by 10 participants who received 1 base point. Five participants answered partially correctly and received only 0.5 base points each. The 2.5 base points they had missed were added to the 15 points belonging to those who had answered the question completely incorrectly. Consequently, each of the 10 participants who had answered completely correctly received an additional 1.75 points, calculated as (15 + 2.5) / 10.
- Question 5. All participants answered correctly. The calculation was performed in the same way as for Question 1.
Thus, given this point distribution, a fully successful student received 5.0 base points (1.0 per question) and 31.75 additional points (0.0 + 1.0 + 29.0 + 1.75 + 0.0).
If no one answered a question correctly, no bonus points were awarded for it.
3.1.4. How the Ranking Is Calculated
The ranking of each student is determined by their average score across all 15 five-minute sessions. The student with the highest average score holds the top position. In the event of a tie, the "last assignment" rule is applied: if multiple students have the same average score, the one with the higher score on the 15th assignment ranks higher. If the scores for the 15th assignment are also identical, the results of the 14th assignment are compared; this process continues until a difference in scores emerges.
When calculating the average score, a student's absence from class is treated as a score of zero, and the designation "n/a" is recorded in the summary grade sheet. For ranking purposes, the "n/a" status is always ranked lower than a score of zero received when the student was actually present.
The ranking also takes negative points into account. These can arise from recorded rule violations if the number of correct answers is lower than the total penalties incurred. For instance, if three rule violations are recorded for a single cluster assignment, everyone involved receives a –3.0 point penalty. If a student had scores 2.0 out of 5.0 points, a value of –1.0 point is used to calculate their ranking.
If the status "Anonymous" appeared within a cohort, it was assigned all results from unidentified submissions. For this profile, the ranking position was determined according to standard rules.
The resulting student ranking is divided into quartiles. In the summary list, each quartile is designated by a specific color:
- Quartile I (green) includes the 10, 25, or 30 students (depending on the cohort size) who hold the top positions in the ranking.
- Quartile II (yellow) includes an equal number of students immediately following Quartile I in the ranking.
- Quartile III (white) includes an unlimited number of students ranked below Quartile II, down to a pre-established fixed average score (usually 1.00).
- Unquartiled (gray) includes an unlimited number of students occupying the lowest ranking positions below Quartile III (from the lowest score up to 1.00). No ranking position is determined for them, and the status "n/a" is assigned.
3.2. Dataset Parameters
The dataset is compiled from anonymized paper results. The collected data cover the period between 2023 and 2026. Quantitative clustering is based on university regulations, specifically orders establishing study group sizes. Further subdivision of students to achieve numerical balance was not feasible, as such a procedure would have violated the university's internal regulations.
Table B1 in Appendix B presents the samples of experiment participants, their characteristics, and their coding.
The change in the field of study for first-year students after 2023 was driven by the transformation of the educational program. As a result of this reform, the university established new specialization tracks–as listed in the table. Concurrently, student enrollment for the previously existing educational program was discontinued starting in 2024.
The frequency and number of classes for each cluster are determined based on the university's internal documentation, including the educational program, the curriculum, and the current teaching workload. Based on these documents, the following external factors capable of influencing performance outcomes are identified:
- Temporal arrangement of instructional sessions. Groups undergoing parallel instruction, received a reduced scope of material covered by assessment questions. For instance, when lectures on topics 1–2 were held concurrently with laboratory session 1, the assessment questions covered only the material from topics 1–2. In contrast, under a sequential instruction model (full theoretical course followed by practical work), the scope of material for assessment questions was expanded to include topics from the entire course.
- Availability of a live lecture course (delivered via webinar) and electronic reference materials. This arrangement enables students to study the theory and prepare for classes at their own pace and convenience.
The coding system is implemented as part of the process of anonymizing data for statistical analysis.
A text-based code masks the study group number. Each participant's personal data are also encoded using a specific format: the word "Student" followed by a random sequence number (e.g., Student146). Color coding is used exclusively for generating graphs.
During the experiment, the students' current rankings were publicly accessible. Each participant could view their own results and track the progress of others. The instructor also had access to the rankings to monitor and manage the state of the learning ecosystem.
3.3. Mathematical Framework for Statistical Data Processing
Standard methods of mathematical statistics were employed to process the research results. During the initial data processing stage, the mathematical expectation (Equation 1) and the standard deviation σ with Sheppard's correction (Equation 2) were calculated for each five-minute session.
where ni is the number of students who obtained the corresponding result, xi is the midpoint of the i-th interval, n is the sample size, and k is the number of intervals.
where h is the width of the grouping interval.
The raw data are characterized by small cluster sample sizes. Consequently, calculations are performed based on streams within each cohort. Despite aggregating the data, the sample size could still skew the final statistical metrics. To ensure calculation accuracy for samples of fewer than 50 individuals, special coefficients are applied; this allows for a more precise assessment of the actual homogeneity of the groups.
Quantization noise also arises during calculations. This issue stems from the discrete rating scale used for the assessment of five-minute sessions, which results in participants' scores clustering closely together, thereby minimizing the true variance between them. Sheppard's correction is employed to compensate for grouping errors and to obtain an unbiased estimate of empirical metrics within a small sample.
To relate actual scores to the boundaries of the statistical norm and areas of maximum data concentration, two metrics are calculated:
- Confidence interval for the cluster mean Xmean (Equation 3).
- 2.
- Confidence interval for individual cluster deviations Xind (Equation 4).
In these calculations, the parameter t(1 – α, n – 1) represents Student’s t-distribution quantum for a confidence level of 1 – α (95.0%, α = 0.05).
Each five-minute session is assigned a sequence number. In the calculations and corresponding graphs, the designation RT is used. "Lucky" five-minute sessions, those yielding bonus points, are designated as BT.
The quantile-quantile (Q-Q) plot method is used to assess whether the empirical data conform to a normal distribution. The coordinates of each point (xr, yr) on the plot are determined using Equation 5. Their positioning relative to the Q-Q reference line makes it possible to characterize the deviation of the empirical distribution from the theoretical one. Rank probabilities are calculated using Blom’s method.
where Φ–1 is inverse normal distribution function, m is ordinal number of the five-minute session, r is rank of the student's score in the array of results for the m-th five-minute session (r = 1, 2, …, nm), and X(r), m is the r-th score value in the sorted sample of the m-th five-minute session.
To assess the extent to which the empirical distribution of student results conforms to the Gaussian normal distribution, the skewness (As, Equation 6) and kurtosis (Ex, Equation 7) are calculated. The calculations account for the small sample size in order to correct for estimation bias.
Box-and-whisker plots are used to visualize the data structure and identify experimental anomalies. Unlike the classical Gaussian curve, this non-parametric method relies on calculation of sample median (Me), as well as the first (Q1) and third (Q3) quartiles. This eliminates the distortion of dispersion intervals caused by small sample sizes. The length of the "box" itself (the interquartile range, IQR = Q3 – Q1) serves as a measure of the concentration of results around the central tendency. The limits of the "whiskers" (Q ± 1.5IQR) establish a rigorous criterion for filtering out extreme values.
To obtain a measure of dispersion that is relative and independent of the measurement scale, the coefficient of variation (V) is calculated using Equation 8, which utilizes values adjusted to account for errors associated with small sample sizes and data quantization. This approach makes it possible to assess the degree of internal homogeneity within the cohorts under study.
To determine students' individual performance based on quartile variation, the following indicators are defined:
- Ranking position stability (PRRu, Equation 9), which ranges from 0% (constant shifts between quartiles) to 100% (the quartile remains unchanged).
- 2.
- Overall ranking progress level (UPSu, Equation 10), where a value of 0% corresponds to an absence of upward transitions between quartiles.
- 3.
- Overall ranking regression level (DPSu, Equation 11), where a value of 0% corresponds to the absence of any drop in the student's position that moves them to a lower quartile.
- 4.
- Quartile volatility level (IQVu, Equation 12), where higher values indicate more transitions between quartiles.
The following stability indicators are determined based on the students' absolute ranking positions:
- Ranking volatility level (CRVu, Equation 13). The higher the value, the more the student’s position shifted within the ranking.
- 2.
- Trend direction (RDTu, Equation 14). Negative values correspond to positive dynamics (rising in the ranking). Positive values indicate negative dynamics (dropping in the ranking).
For all students in the bottom quartile who lacked a numerical ranking, a virtual position was calculated. This corresponded to the lowest rank value from the third quartile plus one. Avoiding a fixed designation for the absence of a rank made it possible to identify actual fluctuations in raw scores.
The level of communication between students during the completion of tasks and its impact on the outcome were assessed through an analysis of the intercorrelation matrix. Pearson’s linear correlation coefficient (ruv was used to quantitatively measure the similarity of student achievements. This metric was calculated based on m-monitored parameters for each pair of students u and v (Equation 15):
where xum is the outcome of the u-th student for assignment m, xvm is the outcome of the v-th student for assignment m, xu is the average score of the u-th student across all m assignments, and xv is the average score of the v-th student across all m assignments.
The values obtained for the Student Network Interaction Index (SNII) using Equation 15 are interpreted according to the following rules:
- 0.70 to 1.00 (strong connection): a stable connection forms between the students, characterized by identical and consistent interaction patterns.
- 0.40 to 0.69 (moderate connection): an unstable yet adaptive communication channel between students is identified, where interaction occurs for the purpose of routing information but does not indicate the formation of a permanent working group.
- 0.10 to 0.39 (weak connection): interaction between students occurs locally within the scope of a specific five-minute session (situational communication), meaning that no stable connection exists.
- –0.10 to 0.10 (no connection): random interaction or students working in isolation.
- –0.11 to –1.00 (polarization): deliberate distancing between students, potentially caused by internal conflicts or a shift in roles within the "leader–executor" dynamic.
- N/A (Insufficient data): assigned in cases of systematic absence from the five-minute sessions.
- S/I (Self-interaction): the student is compared with themselves, and the corresponding value lies on the main diagonal.
To rigorously confirm the impact of “lucky” five-minute sessions on ranking shifts, Spearman's rank correlation coefficient (Equation 16) was calculated. This non-parametric metric assessed the statistical relationship between arrays of student rankings resulting from changes in the ranking formation strategies.
where ∆Ru is individual rating shift of the u-th student.
The obtained value of the coefficient ρ facilitates the objective determination of the level of stability of the academic hierarchy within the clusters and streams of the corresponding cohort.
To analyze the impact of missing five-minute sessions on the formation of students' final rankings, their potential academic performance was modeled. For this purpose, a procedure for imputing missing scores for uncompleted sessions was applied using Equation 17.
where Mu is the set of five-minute sessions completed by student u, |Mu| is the number of five-minute sessions graded for student u, is the cluster's average score for five-minute sessions m, xuk is student u’s average score for the five-minute sessions he completed, and is the cluster's average score for the five-minute sessions graded for student u.
The projected score for a missed five-minute session was determined based on the cluster's average result, adjusted for the student's individual performance index. This calculation was performed provided that at least three such sessions had been completed; otherwise, the average score was calculated using the standard method.
3.4. Software Tools and Artificial Intelligence Used
The following hardware-software system was used to organize and conduct the five-minute sessions:
- Google Slides (Google LLC, Mountain View, CA, USA) – for creating slides containing review questions, as well as for displaying or printing materials without interactive effects.
- iMovie (Apple Inc., Cupertino, CA, USA) – for editing a high-resolution demonstration video featuring fixed time intervals and automatic slide transitions.
- Google Sheets (Google LLC, Mountain View, CA, USA) – for maintaining and displaying rankings while restricting access for third-party users.
- Exceed Share (Guangzhou Shiyuan Electronics Co., Ltd., Guangzhou, GD, China) – for wirelessly connecting the instructor's laptop to the interactive whiteboard.
- QuickTime Player (Apple Inc., Cupertino, CA, USA) – for playing short video clips while the laptop is wirelessly connected to the interactive whiteboard.
- TB Finder (Triumph Board a.s., Prague, Czech Republic) – for an alternative method of playing the video from an external drive in the event of network synchronization failures.
- Interactive panel (Hangzhou Ingscreen Technology Co., Ltd., China) – for directly displaying audiovisual material in the classroom.
The following software was used for statistical data processing and visualization of the results:
- WPS Spreadsheets (Kingsoft Office Software Co., Ltd., Beijing, China) – for calculating statistical indicators and coefficients to test research hypotheses.
- Gemini Pro (Google LLC, Mountain View, CA, USA) – for generating Python code. This code was used to create multi-component graphs, cross-check mathematical calculations, and conduct a comprehensive audit of the article text.
- Google Colaboratory (Google LLC, Mountain View, CA, USA) – for writing, editing, and compiling code to perform data analysis and generate graphs.
- draw.io (JGraph Ltd, London, UK) – for creating flowcharts and performing final diagram editing.
In this study, generative artificial intelligence tools were not used to formulate goals, objectives, hypotheses, and review questions. Furthermore, neural networks were not employed to grade student assignments or process raw data.
4. Result
4.1. Statistical Analysis of Academic Performance
Academic performance is defined as the total raw score achieved by each student. Regardless of the cohort, the resulting data samples exhibit moderate heterogeneity and instability. This instability is characterized by the absence of a single dominant value; the data are dispersed ("diffuse") and lack a clearly defined center across the various five-minute sessions.
This is attributable to a discrete, low-resolution grading scale based on rigid "correct" or "incorrect" criteria. Only in rare instances is it possible to award partial credit for a partially correct answer. Such a scale lacks sensitivity to students' actual knowledge; for example, two students with differing levels of theoretical training might make the same random error and receive the same score. Furthermore, the grading system fails to account for varying levels of question complexity (or the effort required to solve them), treating the tasks as a linear, equivalent sequence.
On the one hand, this approach creates high pressure (an "all-or-nothing" principle). On the other hand, it ensures a simple and transparent grading system. Students are aware of the rules for all questions in advance. Any changes are quickly identified, eliminating subjectivity on the part of the marker or the person compiling the rankings. Furthermore, these rules allow each participant to predict their ranking trajectory at any stage of the marathon.
Regardless of the cohort, results are tightly clustered during the initial stage. This applies to both the overall ranking and the scores for individual assignments. Figure 2 illustrates the rate of change in the average ranking score and the scores for each assignment.
The rate of change in scores for each assignment is non-uniform and erratic. However, the analysis of aggregated intervals based on "lucky" five-minute sessions reveals that sharp fluctuations over the long term do not have a critical impact on overall performance. The adopted ranking system smoothes out such fluctuations within cohorts across both short-term and aggregated intervals.
In the initial stages, rankings are characterized by a high degree of clustering. Figure 3 illustrates the variation dynamics of the ranking lists across cohorts.
A sharp divergence in results is observed leading up to the first "lucky" five-minute session. Student behavior during this period is characterized by the pursuit of favorable alliances and the testing of various collaborative strategies:
- Selection of a convenient format for using reference materials;
- Optimal seating arrangement in the classroom;
- Launching the discussion;
- Assigning roles within the group (independent, team player, dividing up questions).
When using the cumulative grade point average, the decline in the level of result clustering is less apparent. The trend is characterized by long-term plateaus or minor fluctuations. Such deviations do not significantly impact the final result. Equations 1–4 were used to determine changes in statistical values for each cohort. Figure 4 illustrates the changes in the expected value and confidence intervals for third-year students in the 2026 cohort.
To analyze the results, the actual raw scores (excluding bonuses for "lucky" five-minute sessions) have been plotted on the graph. This makes it possible to assess how the scores fall within each interval. Corresponding results for other cohorts are presented in Appendix C (Figures C1–C5).
A high concentration of results within the target zone and a low number of outliers indicate that the process is stable and remains under control. When evaluating the work, the following qualitative groups can be identified:
- Stable – the majority of results cluster in the central band, with the remaining values distributed strictly equally between the upper and lower segments;
- Low – a sharp drop in results and a predominance of below-average figures;
- Truncated – data distributed exclusively between the center and the bottom;
- Progressive – a predominance of results in the upper zone.
The highlighted intervals distinguish clusters with untapped potential. The appearance of low scores indicates a systemic issue that the group can overcome using internal resources. At the same time, an increase in scores is observed for tasks offering bonus points. This suggests that the clusters' collective effort is aimed at stabilizing results following an uncontrolled shift in rankings.
Low scores are typical of submissions that violated the rules, as evidenced by negative point totals. A negative score occurs when the points earned on a five-minute session are fewer than the number of violations detected. This points to issues with the cluster's internal organization rather than task difficulty or a lack of knowledge.
Clusters of third-year students exhibit the highest degree of result clustering. The graphs show a high concentration of aggregated data points representing identical scores. In contrast, first-year student clusters show a wider variety of results, though groups of identical scores are still evident.
Sample analysis revealed that some submissions follow a normal distribution. However, when the entire marathon is evaluated, a normal distribution is not observed. Using Equation 5, Q-Q plots were generated by cohort for all 15 tasks, both at the individual cluster level and for the cohort as a whole. Figure 5 displays the results for third-year students from the 2026 cohort. Appendix C (Figures C6–C10) presents similar graphs for the other cohorts.
The empirical data are discrete in nature but closely follow the reference line. This indicates that, near the center of the distribution, the data approximate a normal distribution. Such a distribution demonstrates that the tasks are calibrated to the average level of the clusters (with a concentration of points in the mean range of –1 to +1).
The presence of outliers (points between +2 and +3) indicates that the tasks allow for the identification of top performers. A high level of theoretical knowledge or strong intra-team communication enables these individuals to complete tasks of any complexity. The graph’s pronounced stepped pattern reflects the group's homogeneity throughout the marathon. Negative values point to isolated disciplinary lapses that subsequently stabilize.
An analysis of similar graphs for first-year students revealed lower levels of theoretical training and discipline. The aggregate graphs for first-year students show a marked dip of points below the reference line (particularly for the 2025 cohort). This may indicate that students are unprepared for the demands of working in IT teams under conditions that simulate real-world environments. It also suggests a prolonged adaptation period during the transition from secondary school to the university ecosystem.
The introduction of bonus points for "BT-style" five-minute sessions does not drastically alter the cohort's overall results. While these incentives shift the median upward, they do not eliminate the multimodal nature of the results distribution. This trend is most pronounced among first-year academic clusters. The corresponding empirical distributions, calculated using Equations 6–7, are presented in Figure 6.
Bonus points enabled students to improve their current grades. However, this did not eliminate the marked stratification of students into subgroups. It can be hypothesized that this division stems from varying levels of core knowledge, the degree of internal communication, and the quality of reference materials.
The distribution for third-year students is peculiar with a single dominant peak and exhibits pronounced negative skewness. This indicates the formation of a stable "core" of academic performance; the majority of upper-level students successfully complete the assigned tasks.
Bonus points allowed underperforming third-year students to move closer to the central tendency. This effect is visualized as a smoothing of the distribution density near the zero mark.
Analysis of results from other cohorts confirms the similarity in distribution topology between first- and third-year students (Appendix C, Figures C11–C15).
Result instability is evident in the box plots and variation curves (calculated using Equation 8) for each of the 15 five-minute sessions. Figure 7 presents a combined plot for the third-year students of the 2026 cohort.
An analysis of the assignment-wise score distribution revealed differentiation within the group at various stages of the marathon, ranging from anomalous dispersion (elongated box-plot whiskers) to synchronization (short, symmetrical whiskers and an absence of outliers). While the graph indicates a wide range of scores, as evidenced by broad boxes and long whiskers, this does not signify student failure when viewed alongside the variation curve and a moderate coefficient of variation (CV). Instead, this pattern reflects healthy competition among high-performing students.
An analysis of student behavior during the “lucky” five-minute sessions confirmed a significant finding, and namely, a process of academic adaptation took place during these moments.
A comparison of first-year and third-year students revealed a stark contrast between the two groups. Figure 8 displays the corresponding graph showing the spread of scores and changes in the level of variation for the first-year cohort (Cohort of 2026).
The coefficient of variation for first-year students' work is characterized by high instability, with spikes reaching 238% against a standard range of 30–40%. Such disorganization is observed at the very beginning of the marathon. Students failed to achieve stable results within the respective clusters.
Sharp fluctuations in results are consistently recorded throughout the academic period. Although third-year clusters show low overall results, their distribution is smooth. In contrast, first-year students exhibit a "split." The polarity of results within a single assignment points to a significant issue: the isolation of first-year clusters from one another and internal communication problems, rather than the task itself being unfeasible.
By the end of the marathon, a leveling of the box plots was observed for each cluster, confirming that the students had established internal communication. However, the groups periodically experience a breakdown in team interaction, driven by the pursuit of personal ranking gains. Such "splits" prove unproductive, leading students to revert to their previous team strategies.
This process is identified by the appearance of isolated outliers above the upper quartile boundary and anomalies involving a sudden drop or stabilization of overall variation. Metrics return to normal levels by the next five-minute session. For the third-year cohort, such fluctuations are characteristic of stages RT7–RT8; for the first-year cohort, a similar effect is observed at stages RT9–RT11. Similar trends in result distribution are seen in other streams of the 2023–2025 cohorts (Appendix C, Figures C16–C19).
Individual performance data for students in the first- and third-year clusters are presented in Figure 9 and Figure 10. Data for the remaining clusters of the 2026 cohort are provided in Appendix C, Figures C20–C21. All indicators are calculated using Equations 9–14.
Analysis of the data revealed that third-year students exhibit high macro-position stability. The PRR for the corresponding cluster falls predominantly within the 71.43% to 100.00% range. The low IQV observed in the majority of students confirms infrequent quartile shifts. However, positional stability does not equate to high performance; for instance, a student might consistently lack a ranking, resulting in a PRR of 100.00%.
At the micro-level within the cluster, high volatility in rankings is observed. Student positions are subject to significant fluctuations (ranging from 6.15 to 19.60), indicating active competition for rankings among students within the cluster.
A moderate balance of local shifts was recorded within each cluster: changes in progress and regression over a single five-minute session did not exceed 21.43–28.57%. This implies that ranking changes occur gradually; despite sharp fluctuations in results during each five-minute session, the rotation proceeds without abrupt, instantaneous jumps.
A comparison between first- and third-year students revealed a stark contrast in results. The first-year cluster exhibits lower macro-position stability, indicating frequent quartile shifts, alongside erratic results for individual students.
Micro-level competition drives significant individual fluctuations in rankings. The first-year cohort displays a weakly positive trend, reflecting a sluggish pace of change. Furthermore, first-year students demonstrated higher vulnerability, showing a greater propensity to lose high-quality positions than to gain them.
4.2. Verification of Latent Behavioral Patterns
The results of statistical data processing to determine patterns of network cooperation were translated into heat maps.
In Figure 11 shows a heat map of a cluster of 3rd-year students from the 2026 cohort is shown. To compile it, Equation 15 and the corresponding legend were used to decipher the values. Its structure suggests that during the marathon a "core" of the group was formed. Indicators of 0.50–0.95 may indicate a consistently high level of communication between students. One explanation for this behavior may be stable social ties within the group. Probably as a result of this, the level of competition in it has decreased. This may have facilitated the pooling of cognitive and academic resources to complete tasks.
It seems likely that the harsh conditions of the five-minute sessions marathon and the established social ecosystem of the group led to the effect of "distributed intelligence."
Shall it be assumed that a cluster "core" exists, it is possible to identify several key behavioral patterns among the participants.
- Solution-providing students (information hubs). Students 134, 137, 147, and 153 exhibited the highest SNII scores, ranging from 0.76 to 0.82. This suggests a connection with the vast majority of cluster participants. Most likely, these individuals disseminated work-related information to the rest of the group. Such deep integration may have enabled them to steer the discussion and coordinate the search for reference material, while also facilitating the sharing of potential answers.
- Selective students. Analysis of the cluster "core" reveals a pattern of selectively seeking out successful communication pairs. Faced with strict time constraints, these participants appear to have eschewed chaotic group discussions in favor of consistent, pragmatic, one-on-one interactions. This phenomenon is observed in instances where, despite a generally high SNII level, "pulsing" segments emerge; this behavior is particularly characteristic of student 141.
- Isolated students. Students 160 and 161 saw their SNII scores drop into negative area (down to –0.03), effectively excluding them from group interaction. The reasons for this could be academic (lagging behind the general pace) or psychological (choosing an independent work trajectory). Additionally, a lack of regular class attendance cannot be ruled out. To the established "core," such participants likely represented a factor that slowed down the overall pace.
- Inconsistent students. The appearance of gray "pockets" may indicate a cessation of interaction between specific pairs during certain five-minute sessions. It seems likely that this reflects a natural process of micro-group redistribution as students adapt to changing conditions. Such conditions include the selective presence of specific individuals at a session and the specific topic of the current five-minute session.
Similar behavioral patterns are observed in clusters of first-year students. Figure 12 shows the corresponding matrix for one such cluster from the Cohort of 2026.
First-year students exhibit similar behavioral patterns. At the same time, a decline in the overall level of communication has been observed. It is likely that the short duration of study within such a cluster has not yet allowed for the development of a sufficient level of social cohesion and mutual trust.
Under these circumstances, participants may have attempted to find shared solutions. However, "every man for himself" attitudes and the focus on individual rankings appear to have stifled cooperation and communication skills.
Visual analysis of the matrices also points to an institutional communication crisis. Fluctuations in the lower numerical range and extensive gray areas clearly demonstrate the absence of stable, dynamic connections. The only stable element here is an "exclusive sub-cluster" visible in the top-left corner of the matrix. It is likely that the students within this group have confined their communication exclusively to one another, completely ignoring requests from classmates who are lagging behind.
Appendix C (Figures C22–C26) presents network cooperation matrices for isolated clusters from other independent cohorts. These display similar trends and behavioral patterns. However, the analysis of these isolated groups refutes the hypothesis that being in a higher year of study automatically guarantees a high level of group trust. One cannot claim that a developed communication system will automatically emerge in any student group by the third year.
Personal relationships within each autonomous cluster develop in unique ways due to a variety of factors. These factors may relate to the academic process and varying levels of competence, as well as to student interactions outside the university. For instance, Figure C24 shows third-year students from one cohort exhibiting a lower level of network interaction compared to the similar group shown in Figure 11. This difference confirms the distinct nature of processes within each group. At the same time, it is possible that stable behavioral patterns exist only within a few autonomous cores inside a single cluster.
It appears likely that a unified group "core" did not form during the collaborative learning process in this instance. Instead, faced with demanding conditions, students coalesced into autonomous symbiotic alliances of varying sizes. Such a structure serves as an effective alternative to a monolithic cluster core. At the same time, the situational transformation of these alliances at specific stages of the marathon—driven by the pursuit of academic gain—cannot be ruled out.
The network interaction within these alliances is strictly adaptive in nature. The SNII metric is dynamic, as students in each cluster modified their connections in response to specific checkpoints (CPs). In the educational process under study, these checkpoints were directly linked to “lucky” five-minute sessions, which triggered the restructuring of communication patterns.
The “lucky” five-minute session acts as an incentive for earning individual bonus points. This reward is granted only if other cluster members make errors in their responses. This condition creates a pragmatic dilemma for group leaders, who are forced to choose between two behavioral strategies:
- This involves the tasks to be openly discussed or answers shared. In this scenario, a successful outcome yields only a base score for group members, thereby negating any personal advantage for the leader and making such behavior inexpedient to their individual ranking.
- This entails the deliberate withholding or concealment of information. Such a move allows the leader to maximize personal gain in the short term at the expense of widespread errors by their peers. However, it creates a significant risk of subsequent social isolation during standard five-minute sessions.
Pedagogical observation revealed various ways of resolving this dilemma, depending on external factors:
- Communication drops distinctively during the final five-minute session when the gap between average ranking scores is minimal. Under these conditions, only specific alliances persist, meaning, those involving participants who do not threaten each other's standing within their respective quartiles.
- Interaction intensifies within clusters that trail others in the rankings. This phenomenon can be attributed to intergroup rivalry, where students in one cluster aim to capture the points their competitors failed to secure.
- Communication levels remain stable if participants deem the five-minute session pointless in the context of the overall ranking, that is, when the outcome will not alter the students' standing relative to their current quartile.
In addition, there are other patterns distinguished in student behavior. For instance, the second "lucky" five-minute session traditionally serves as a test of the strength of student alliances. This is a critical juncture where interim standings have already taken shape, allowing leaders to pull significantly ahead. Communication levels within the networks shift sharply during this specific session, before gradually returning to their previous baseline.
A different trend is observed during the first "lucky" five-minute session, which triggers a sharp spike in attendance. Students who had previously missed classes, and by doing so had low running scores, show up for this session. They aim to secure a large number of points in a single go, attempting to make up for a deficit or build a buffer for the future. Regardless of the outcome, attendance drops off after this session. This pattern is particularly characteristic of first-year student clusters.
The results of the statistical analysis are presented in Figure 13 and Figure 14. These figures display graphs showing changes in the SNII metric at the designated checkpoints, as well as the correlation between this metric and actual session performance (calculated using Equation 16).
An analysis of the results from upper-level students revealed that "lucky" five-minute sessions act as a powerful trigger for network self-organization. However, they can yield both positive and destructive outcomes. The presented graphs clearly illustrate these effects.
For instance, the 2025 cohort overcame individual competition. Network consolidation enabled students to maximize both collective and individual results through synergy. At the first two checkpoints, network density increased, yet performance remained minimal.
It appears likely that students were reluctant to participate in discussions and withheld solutions in an attempt to secure bonuses individually. Integration at the final stage boosted performance, resulting in a strong positive correlation.
The behavioral pattern shifted for the 2026 cohort. Students drove a surge in network density at the second checkpoint, converting it into peak performance, before subsequently slowing their pace. In another cluster, participants seeking to improve performance took the opposite approach, sharply curtailing network interaction. Consequently, the correlation with results dropped to a minimum; this deficit was only rectified during the final stage of the marathon.
Different trends emerged among first-year student clusters. Negative correlations are rarely observed among upper-level students; even when negative indicators appear, the correlation rises sharply by the end of the marathon. In contrast, the graphs characteristic of first-year students suggest the existence of "false" network connections.
In this instance, students within the cluster establish communication and even cooperate, yet they fail to do so pragmatically. The observed trends suggest that participants are exchanging incorrect solutions and sharing collective misconceptions. They may also waste time on pointless discussions or prove unable to articulate their point of view with reasoned arguments. Consequently, the higher their online activity, the poorer the final result.
An analysis of network interaction matrices reveals that first-year student groups lack a central network "core." Consequently, the volume of information generated during discussions fails to accumulate with, either be verified by, key leaders. This pattern fosters communication inconsistency during intermediate stages. It is also worth noting a marked decline in academic performance as the marathon progresses. This trend suggests that leaders who emerge early on tend to restrict the flow of information to a narrow circle of trusted associates. As the results demonstrate, such a closed model significantly undermines the cluster's overall effectiveness.
In summary, a key conclusion can be drawn from this analysis of network interaction, specifically, for upper-level students, communication serves as an effective tool for teamwork, whereas for first-year students, network activity functions merely as a means to showcase individuality and personal success.
4.3. Specifics of Ranking Rotation
The following ranking trends were observed during the experiment:
- As the five-minute sessions progressed, the cohort's overall average score gradually declined. During the third phase of the experiment (following the second session featuring bonus points), the score stabilized, with fluctuations remaining within a range of ±0.20.
- The score gap between adjacent positions in the rankings remained minimal, regardless of the quartile; in some instances, the difference was less than 0.10.
- Identical final results occurred in every cohort. There was only one instance where two students could not be differentiated in the rankings: they achieved identical results on every single session. This occurred among first-year students in the 2025 cohort. Pedagogical observation confirmed that, regardless of external circumstances, they worked collaboratively and consistently sat next to each other in the classroom. However, they did not refuse to participate in general discussions; the final decision regarding each answer was made solely within the pair. Consequently, both students ended up in Quartile I at the same ranking position. In all other cases where average scores coincided, it was possible to assign distinct rankings. This was because identical scores on the quizzes persisted for no more than two or three assignments.
- Each cohort saw isolated instances of participants experiencing a sharp rise in rankings due to a "lucky" quiz result. No single participant was observed receiving high scores on multiple occasions.
- Each cohort saw isolated instances of participants experiencing a sharp rise in rankings due to a session offering bonus scores. No single participant was observed receiving high scores on multiple occasions. No evidence of collusion (e.g., pre-arranging who would record the correct answer and who would record the incorrect one) was found in any of the cohorts.
Despite prevailing ranking trends, students from all clusters were represented in every quartile within each cohort. The analysis revealed the following distribution characteristics:
- Quartile I comprised participants with an average score exceeding 2.00.
- Quartile II contained results in the range of 1.50. Depending on the cohort, this median value could vary by ±0.30.
- Quartile III contained results clustered around 1.00.
- Results falling outside the quartiles were typically below 1.00 or close to 0.00.
It should be noted that the specific score thresholds varied by cohort. The 2024 cohort recorded the lowest values across the entire duration of the experiment; nevertheless, even within this group, performance indicators in each quartile aligned with the overall trend.
Pedagogical observation revealed an internal conflict among students in this cohort, which was an issue that had emerged prior to the experiment. It is likely that this circumstance hindered the establishment of effective interaction across the cluster as a whole. However, communication was observed between small symbiotic groups; these interactions were most likely rooted in pre-existing connections, such as friendships, shared academic projects, or living arrangements.
The results indicate that a successful strategy required participants to correctly complete two or three tasks during each five-minute session, assuming they did not rely on bonus points. Empirical data confirm that this strategy is entirely feasible. In some instances, deviations from this consistent performance were offset by achieving four or five correct answers in the five-minute session immediately following a temporary "dip" in performance.
Despite the factors determining ranking positions, participants from nearly every cluster were represented in all quartiles across every cohort. Figure 15 illustrates the percentage breakdown of students from different clusters in Quartile I, categorized by cohort. The distribution across the other quartiles is shown in Figures C27–C29 of Appendix C.
The adjustment to final scores, accounting for missed assignments, was calculated using Equation 17. This adjustment factored in the following parameters:
- The actual scores of students within the cluster who completed the specific five-minute session.
- The current individual performance of the student who missed the assignment.
If a student had completed fewer than five quizzes, the scores were normalized. This approach prevented significant distortions—such as assigning high scores for all other tasks based on a single successful performance.
Had all assignments been completed at the performance level demonstrated by the participating students, a redistribution of results could be expected. Such a scenario would likely have reduced the dominance of specific cluster representatives, fostering greater multi-cluster representation.
It is also worth noting that bonus points aided to the cause of addressing the issue of low multi-cluster representation across quartiles. These additional points not only enabled individual participants to improve their rankings but also redistributed the overall results. Figure 16 and Figure 17 present scatter plots showing rankings relative to the bonus points received.
The quota volume in each quartile for each cohort was justified as follows:
- A fixed number of slots was consistently used for Quartiles I and II. This number was adjusted based on the total number of students in the clusters at the start of the experiment (prior to the rules being announced). This approach fostered competition and created the perception that achieving a high ranking was a genuine possibility. Notably, the number of slots allocated was sufficient to accommodate the majority of participants within the cluster.
- No fixed limit was set for Quartile III, as this tier offered no bonus rewards. Nevertheless, students falling into this category were still assigned a rank. This was intended to create a sense of "proximity to a reward," with the aim of keeping these students engaged in the competitive process.
- No rankings were assigned to participants who did not fall into any quartile. This decision was based on the fact that their results were so low and closely clustered that there was virtually no competitive dynamic within this group, unlike in the other quartiles.
The overall trend in the distribution of results across all cohorts reveals a positive correlation between the ranking based on initial scores and the bonus points earned during "lucky" five-minute sessions.
Most students cluster along the "no-change" line; however, bonus points create a dense distribution of participants across the quartiles. Notably, the 2023 cohort exhibits the highest variance, featuring distinct "outliers", meaning the students who surged upward in the rankings. The 2024 cohort shows stability, with bonus points having a negligible impact on the final standings.
The 2025 and 2026 cohorts demonstrate divergent strategies based on the year of study. In the 2025 cohort, upper-level students utilized the bonus system to improve their positions (particularly within the first quartile). Conversely, in the 2026 cohort, third-year students shifted toward the lower quartiles. This indicates that upper-level students earned fewer bonuses, resulting in a lower final ranking relative to first-year students.
Analysis of the results revealed a tendency among third-year students of the 2026 cohort to cooperate during all five-minute sessions. This may have led to fewer bonus points for the cluster as a whole and a drop in their standing compared to the first-year students of the same cohort, whose communication was more chaotic. Nevertheless, the latter group consistently maintained positions on or near the "No-Change" line.
It should be noted that maintaining one's ranking position was a rare occurrence within the first three quartiles. Few instances of shifting from the "gray" zone to the "yellow" zone were recorded during the study period. In general, bonus points awarded to low-scoring participants did not alter their rankings. This can likely be attributed to these students' limited theoretical knowledge, which resulted in their exclusion from established symbiotic partnerships.
5. Discussion
5.1. Comparative Analysis of Research Results
The conducted research corresponds to modern trends in the training of engineers and IT specialists. Developers of application-oriented pedagogical technologies are actively researching approaches that go beyond conventional teaching methods, including design [9,10]. The focus of their research is on creating dynamic learning ecosystems that are able to adapt students to the high rate of change in the industry [6,11,12,13].
In pedagogical practice, an independent area of study has been formed dedicated to artificial time constraints when solving various problems [14,15]. Unlike long-term semester projects, where students can allocate resources, the mechanics of extreme time pressure create specific cognitive pressure [16]. Researchers are studying the effectiveness of conducting hackathons, rapid tests, sprints, etc. In their works, they note that such approaches awaken operational decision mechanisms in future specialists [17,18].
The regulations of the developed methodology within the framework of the study create conditions for fast semantic search. To do this, students can use individual knowledge, reference information, and also organize communication channels. All this forces us to abandon long theoretical discussions in favor of effective knowledge sharing. Similar approaches are noted in the studies of Oyetade [19], Rooholamini [20] and Evans [21]. Such techniques contribute to the instant updating of the personal mental basis, which is critically important in the conditions of real IT teams [22,23].
For a long time, classical pedagogy was dominated by the view of ranking as a linear tool of motivation [24]. However, modern authors pay attention to the nonlinear effects that arise by introducing elements of uncertainty when forming ranking positions [25,26,27]. The developed methodology supports this approach.
The five-minute session marathon creates conditions of outcome uncertainty following the completion of tasks. The local success or failure of individual participants, or even an entire cluster, can be offset by the results of other clusters participating in the ranking simultaneously. Incorporating opportunities to earn bonus points throughout the marathon ensures dynamic communication and tests the resilience of the symbiotic alliances that emerge. Crucially, the rules for task execution remain constant and are not made more complex while the marathon is underway.
Researchers note that fluctuations in a student's standing alter the dynamics of competition [24,28]. Academic literature documents that fierce competition for specific ranking positions, combined with the risk of a sudden drop in overall standing, compels participants to shift from individualistic strategies toward seeking latent strategic solutions [29,30]. The ranking ceases to be merely a measure of academic performance and transforms into a distinct operational track [31]. The ranking generated under this methodology is open and transparent, allowing students to forecast risks and devise survival strategies.
These conditions align with collaborative synergy and adaptive communication channels found in Scrum-oriented environments. Modern educational management places significant emphasis on mechanisms for distributing cognitive labor within student groups [32,33]. Research indicates that a communication crisis inevitably arises when individual competition is combined with forced collective responsibility within student teams [34,35].
The study established conditions characterized by intense pressure and a lack of instructor intervention during short, timed tasks. Consequently, students were compelled to independently form adaptive communication channels. Researchers elsewhere have documented similar organizational patterns, classifying them as forms of networked self-organization [36,37]. In this context, traditional team roles become blurred, giving way to flexible, symbiotic alliances. Within these alliances, knowledge exchange is strictly pragmatic; information is routed either through one-on-one interactions or via local information hubs. Studies indicate that such mechanisms minimize time lost to interpersonal friction while maximizing the speed at which teams generate responses during crises [38,39,40].
Simulating extreme time constraints creates a dualistic didactic environment. It sets the stage for either the self-serving display of knowledge to boost individual rankings or forced teamwork aimed at rapidly finding correct solutions. On one hand, expanding the communication network increases the number of students involved in processing information and generating ideas. On the other, this inevitably overloads communication channels, complicating the process of agreeing on a final answer. Under strict time limits, this duality is resolved through the formation of small-scale symbiotic alliances. Contemporary research suggests that gamification fosters the creation of small alliances centered around a specific leader [41,42,43]. This leader may be either a student with strong theoretical knowledge or an individual capable of coordinating the group to find solutions.
5.2. Verification of Research Hypotheses
The results of the statistical analysis make it possible to determine the status of the research hypotheses stated in the Introduction.
The volatility of individual rankings at the cluster level, regardless of stable overall positions, combined with the presence of outliers on the Q-Q plot, demonstrates that the five-minute session ecosystem revealed hidden leaders. This confirms Hypothesis 1 regarding the emergence of latent competencies under conditions of extreme time pressure.
Similar effects, such as those manifesting as sporadic surges in latent leadership qualities under severe time constraints, have been described in studies by Vaithianathan [10], Hanham [16], and Yuan [46]. Specifically, researchers have shown that stress deactivates habitual academic behavioral patterns, compelling students to mobilize behavioral flexibility [36,40].
Encouraging the active use of reference materials and collaborative discussion during checkpoints transformed the school-based prohibition of cheating into a "distributed intelligence" effect. Statistical data on SNII changes identified student role archetypes and fostered dynamic, selective communication dyads. These results confirm Hypothesis 2, which posits a shift from traditional notions of academic fairness and integrity toward pragmatic knowledge sharing.
This outcome aligns with findings from research on classical group dynamics in IT teams [44,45]. These studies emphasize that, under resource constraints, teams survive not through the individual efforts of high-performing members, but through the pragmatic and rigorous distribution of cognitive labor. Similar dynamics were replicated during the five-minute sessions.
Empirical data and the subsequent analysis demonstrate that a normal distribution across the entire duration of the marathon is entirely ruled out. A fine-grained grading scale, competition, and strict constraints have blurred the Gaussian statistical center. The resulting ecosystem has given rise to polymodality and strong negative skewness. Consequently, Hypothesis 3, which considers the preservation of a statistically stable normal distribution, is not supported. The findings reveal varying degrees of deviation from the statistical norm, as well as instances where the requirements for a normal distribution are met over short, five-minute sessions.
The refutation of this hypothesis aligns with the findings of major studies on the gamification of education [32,42]. Researchers, at home and abroad, have demonstrated that the introduction of competitive tracks, disruptive factors, and game mechanics inevitably disrupts the classic normal distribution. The sample splits into polar sub-clusters, concentrating opinion leaders on the one hand and non-team-oriented students on the other. Thus, the refutation of Hypothesis 3 does not constitute an experimental error; rather, it serves as empirical evidence supporting the international theory regarding the non-linear nature of how student groups adapt to volatile game mechanics.
5.3. Limitations
5.3.1. Boundaries of Experimental Design and the Specifics of Statistical Samples
In the context of verifying the developed didactic framework, the experimental design and the structure of the empirical data were subject to specific limitations. These were dictated by the study's phased nature and the requirements of the hypotheses being tested:
- Absence of a division into control and experimental groups. The current results focus specifically on initiating the competency-building process under defined conditions – namely, the course was taught by the same instructor, and all participants had equal access to information and educational resources. Completing the didactic cycle and qualitatively assessing the level of competency acquisition requires a specially designed supplementary tool. Implementing this tool necessitates a separate experiment involving a split into control and experimental groups, the resulting findings are presented in a separate, planned publication.
Furthermore, limiting the timeframe to a single semester made it impossible to assess the long-term sustainability of the skills acquired within the scope of this article. A subsequent controlled experiment involving experimental and control subgroups aims, among other things, to overcome this limitation by serving as a longitudinal tracking mechanism to verify the stability of students' behavioral strategies and their readiness to adapt to specific conditions.
- 2.
- Limitations regarding small cluster sizes. The objective constraint posed by the small size of individual clusters was mitigated during the mathematical data processing stage. Statistical analysis of distributions was conducted using aggregated clusters based on the study streams of the relevant cohort, ensuring a representative sample size of at least 30 students.
At the same time, the division into small-sized clusters was retained and utilized as an independent research tool. This was essential for mapping student network interactions—tracking micro-communications—and measuring their effectiveness.
- 3.
- Institutional and geographical boundaries of the sample and the heterogeneity of educational backgrounds. In the context of the macrosociological analysis, the study's empirical scope is limited to Moscow Polytechnic University. Formally, this classifies the work as a single-center study. However, this limitation is offset by the high internal heterogeneity of the established clusters, resulting from geographical diversity and varied competency backgrounds.
To ensure the findings are fully generalizable and to eliminate the influence of any specific university's institutional culture, the research track includes a plan to transfer the developed methodology across institutions. Piloting the methodology at several regional universities will enable the use of multivariate statistical analysis and allow for the testing of hypotheses regarding the invariance of self-organization and ranking rotation patterns, independent of the specific educational environment.
A significant proportion of students in these clusters come from various regions across Russia and neighboring countries. This minimizes the risk of sample bias stemming from a specific local sociocultural context. Furthermore, the students possess widely varying levels of prior preparation and diverse educational backgrounds. The clusters comprise graduates from general education schools, specialized lyceums, and colleges, as well as individuals with experience in project work, hackathons, and professional competitions. Additionally, some students have limited work experience, including in the IT sector.
All of this ensures sample heterogeneity that mirrors the actual structure of commercial IT teams, where specialists with diverse experience, qualifications, and cognitive approaches work together.
- 4.
- Differentiation of the sample by gender. The procedure for coding and anonymizing empirical data involved recording the students' gender for each cluster. However, for the purposes of this publication, this parameter was intentionally excluded from the analysis. This limitation stems from the fact that the hypotheses being tested are invariant in nature and not determined by gender factors.
Furthermore, the gender diversity of the experiment is of independent research interest within the context of educational psychology in the IT sector. The dataset, collected and annotated by gender, can be utilized as part of an additional research track.
5.3.2. Adherence to the Principles of Academic Integrity and Rightfulness
It could be assumed that the proposed assessment system might violate traditional principles of academic fairness. This issue arises from the introduction of a "collective responsibility" concept regarding student compliance with established protocols for the five-minute session. Each instance of non-compliance directly and negatively impacts the measured outcome.
Under this paradigm, an academically high-achieving student, demonstrating strong theoretical knowledge and strict discipline, may unfairly incur penalty points due to the disruptive actions of other students within their cluster. Consequently, the aggregated quantitative result may not fully reflect the specific student's objective level of individual competence.
Such an approach is typically within established educational systems, as classical standards dictate that a student's academic results must be strictly individualized and independent of the performance of their peers. However, to ensure alignment with regulatory frameworks, the developed methodology is positioned not as a summative assessment tool, but as a supplementary means of intensively developing professional competencies. Student participation in this "marathon" is entirely voluntary and has no adverse effect on the final grade for the course.
It is worth noting that the developed methodology aligns with the study's objective of simulating real-world conditions for team-based software development. In this context, the identified issue is entirely consistent with industry workflows. Regardless of an IT specialist's individual skill level, within a team development paradigm, their output is directly determined by the synergy and discipline of the entire project group. If a single team member violates protocols, sanctions and penalties affect the entire team. Such violations may include failure to meet contractual obligations or stakeholder requirements, or the disruption of workplace discipline.
Concurrently, the specific conditions under which these brief sessions are conducted serve as a trigger for revealing students' latent leadership qualities. Key determinants of leadership in this context include not only the ability to verify correct solutions to the questions posed but also well-developed soft skills, which encompass the ability to manage group dynamics and discipline within the cluster, as well as the capacity to devise effective tactical strategies under strict time constraints.
5.3.3. Resilience to Destructive Behavioral Patterns
The configuration of the developed methodology reveals a vulnerability to certain destructive behavioral patterns among students. Within the scope of the study, the following patterns can be classified:
- "Troll" type – a student who repeatedly and persistently violates the rules during a single five-minute session. Under the mathematical scoring model, a cluster can theoretically incur an unlimited number of negative points for a single assignment. To trigger this process, the deviant student needs only to perform prohibited actions—such as using a mobile device or walking over to another student—with minimal time intervals between them. Within five minutes, such a student can completely devalue their cluster's ranking. Their motivation may be to artificially boost the rankings of absent members of their own cluster or to benefit competing clusters (a phenomenon of artificial self-sacrifice).
- "Altruistic" type – a student who broadcasts answers to all other members of the cluster. This strategy artificially eliminates variance in results within the cluster, thereby leveling out the individual scores of the cluster's members relative to the overall group.
- "Spy" type – a student who exports questions and verified answers from the current five-minute session to other clusters.
Implementing the "spy" pattern is organizationally complicated and requires a high level of coordination from the host cluster. Within the brief timeframe of the five-minute session, they must cross-reference the information obtained via the leak with their own assignments, promptly and accurately record the response, and relay it further through symbiotic communication channels. It broadcasts the session's questions and answers to other clusters.
The emergence of a "spy" type is possible, though it requires a high level of organization within the receiving cluster. Within a short timeframe, the student must match the question with the "leaked" information, accurately transcribe the answer, and—if possible—relay it to their symbiotic group.
Under the traditional pedagogical model, such patterns are classified as unacceptable. It is expected that the instructor will curb these deviations through pedagogical techniques and personal authority.
However, given modern conditions and the way student communities are organized, these issues often prove intractable. Instructors are limited by regulatory constraints and lack the ability to continuously monitor micro-communications or prevent data exchange between clusters.
Nevertheless, from the perspective of the developed methodology, these verified disruptive scenarios are highly representative of and relevant to actual practice in the IT industry:
- No IT team is completely immune to the emergence of a malicious insider. Such a threat can lead to confidential data leaks, the disabling of hardware infrastructure, or the disruption of project deadlines.
- Consistent performance of tasks on behalf of other team members leads to professional burnout, which implicitly results in missed release deadlines or a decline in code quality.
- Commercial software development faces a persistent risk of industrial espionage. Competitors engage in the misappropriation of intellectual property, including algorithms, architectural designs, and datasets, to gain an unfair advantage in the technology market.
Thus, the student must proactively develop the psychological and professional readiness to handle such crisis situations. They must learn to engage in reflection, respond appropriately to disruptive events, minimize their consequences, and establish effective communication tailored to the specific situation. Navigating these patterns within an educational setting represents a safer pedagogical approach than encountering them for the first time in a real-world IT production environment.
The receiving cluster also gains specific insights from the unauthorized information transfer scenario. This context makes it possible to identify students who demonstrate high adaptability, quick thinking, strong communication skills, and the ability to facilitate processes during crises. These competencies are critical for Scrum teams. Under a traditional educational model, verifying these latent qualities is virtually impossible.
Empirical data gathered throughout the study confirm that the destructive behavioral patterns described did not manifest widely among the students. The sample showed neither anomalously uniform high cluster results nor critically negative indicators. Based on pedagogical observation, the following reasons for this phenomenon were identified:
- The social approbation factor. Despite the inter-cluster competitive nature of the marathon, the level of social approval within their own cluster is of paramount importance to students. External competition, in turn, is driven not only by rankings but also by the desire to gain recognition from the instructor, who acts as an authoritative mentor. At a subconscious level, the student associates the activation of a "troll" behavioral pattern with inevitable disapproval from the instructor, whether overt or latent. Furthermore, this entails immediate stigmatization and ostracism by the cluster. Students may perceive such a destructive experience as carrying a high risk of long-term exclusion from successful intra-cluster collaborations throughout their studies, as well as a trigger for instructor bias.
Moreover, the system’s gamified scoring structure offers no individual advantages to the "troll." Additionally, amidst the uncertainty, they cannot predict the performance of other clusters during the current five-minute session. By resetting their own cluster’s rating, they risk finding themselves in a situation where other clusters make errors. All of this negates the "artificial self-sacrifice effect."
- 2.
- The individualistic model momentum. Prior academic experience, spanning secondary school and the initial semesters of university, has instilled in students a persistent drive toward purely individual success. The sharing of knowledge and intellectual altruism are not dominant patterns within the established culture. Students have developed ingrained mental triggers such as "copying is unacceptable" and "rely solely on your own resources." Sharp fluctuations in the performance variation curves during the early stages of the "marathon" empirically confirm this thesis: students are initially psychologically unprepared for the rapid facilitation of answers or the collaborative use of intellectual resources.
- 3.
- Poor operational organization. Pedagogical monitoring revealed that certain clusters occasionally gained access to the wording of five-minute session questions and the corresponding answer pools used by other clusters in the same cohort. However, access to this prior information did not correlate with improved results. Dynamic changes in question sequencing, variations in slide visuals, and the use of synonymous phrasing completely nullified the effectiveness of such unauthorized information transfers. Furthermore, the students' use of reference materials was haphazard. These sources were unstructured and overloaded in information; given the tight time constraints, this prevented students from navigating quickly, performing semantic searches, or processing information rapidly.
5.3.4. Exclusion of the Use of IT Tools
The architecture of the developed methodology strictly mandates the complete prohibition of students using any IT tools or gadgets during the five-minute sessions.
This methodological approach stands in clear contradiction to the concept of mirroring the environment found in real-world commercial IT development. In the industry, any specialist has unrestricted access to a suite of software tools, IDEs, and repositories, as well as external information resources (such as technical documentation and Stack Overflow) and search engines.
On the other hand, this isolation-based approach aligns perfectly with the classical educational model. According to its fundamental concept, the level of acquired competencies must be verified at specific checkpoints. It is precisely this didactic function that the proposed methodology fulfills.
At the same time, isolation from IT tools makes it possible to develop and verify the fundamental competitive advantages of an IT specialist capable of generating solutions based on their own mental framework:
- Information security assurance. When working on sensitive projects (government systems, the banking sector, the defense industry), the corporate work environment is, as a matter of fact, physically isolated from the global network. An engineer lacking a solid knowledge base becomes completely ineffective in such conditions. Furthermore, the persistent use of outsourced code or the processing of proprietary code via public generative AI models creates significant risks regarding trade secret leaks, copyright infringement, or data compromise.
- Development continuity. Possessing fundamental knowledge enables the effective filtering of information noise. For instance, it minimizes the time spent reading forums, verifying outdated answers, and adapting third-party code.
- Minimization of technical debt. Indiscriminate copying of ready-made solutions and libraries without understanding their internal logic maximizes the risk of introducing hidden vulnerabilities and bugs. This entails additional time and financial costs for subsequent refactoring and testing.
5.3.5. Psychological Pressure of Game Factors and Ethical Support of the Experiment
The specific nature of the developed didactic framework inevitably entailed a latent risk of heightened psychological pressure, emotional strain, and anxiety. It is impossible to completely eliminate this factor from the established operational environment, as it serves as an isomorphic reflection of both the classical educational paradigm and real-world scenarios in commercial IT development. To uphold ethical standards and minimize the risk of undue pressure, preventive mechanisms were incorporated into the study's architecture:
- Principle of absolute voluntariness and track choice. The five-minute session marathon was positioned solely as a supplementary tool for competency development. Students unable or unwilling to handle the additional workload could opt out at any time without negative consequences for their final course grade. For these students, the traditional academic track remained fully available: independent study of materials, attendance at classes and lab consultations, and observer participation in the five-minute sessions.
- Didactic facilitation and debriefing. Immediately after each five-minute session concluded and the worksheets were collected, the instructor initiated an open review of the situations that had arisen. These discussions involved a detailed analysis of behavioral scenarios, and students were offered options psychologically healthy, constructive responses to the situations encountered.
5.3.6. Limitations on the Use of Generative Artificial Intelligence
The use of the Gemini Pro LLM within the study was strictly limited to high-level Python code generation for creating multi-component graphs and to the technical audit of textual content.
Given the known risks of "hallucinations" and the stochastic nature of generative models, AI tools had been not employed for initial mathematical data processing, the calculation of statistical coefficients, or the formulation of conceptual conclusions. To eliminate systematic errors and verify calculations, an independent manual cross-check of all empirical data was performed using WPS Spreadsheets.
6. Conclusions
The developed methodology aims to train IT specialists by fostering competencies applicable in conditions of uncertainty and time constraints. A comprehensive statistical assessment was conducted following the methodology's implementation, utilizing Sheppard's correction alongside Student’s, Pearson’s, and Spearman’s coefficients to evaluate group dynamics, rating volatility, and the structure of network interactions.
Analysis of the empirical data yielded significant results. The pressure inherent in the game-based format disrupts conventional academic patterns and successfully activates students' latent behavioral strategies. The volatile mechanics of the marathon format override the Gaussian normal distribution, resulting in a discrete, polymodal structure of assessment scores and the division of the sample into polar sub-clusters.
The resulting didactic dualism is resolved through network-based self-organization, where students form local symbiotic alliances around leaders. The study’s architecture fully mitigates the risks associated with psychological pressure by adhering to the principle of absolute voluntariness and conducting immediate debriefing sessions following brief, intensive work intervals.
Future development focuses on the cross-institutional transfer of the methodology, with planned pilot implementations at regional universities. This will allow for the verification of the invariance of ranking rotation patterns. The accumulated dataset will support new research avenues, enabling a qualitative verification of competencies using control groups, as well as a detailed analysis of how gender influences students' role-based strategies.
Supplementary Materials
The following supporting information can be downloaded at the website of this paper posted on Preprints.org, Appendix A: A partial list of questions used in five-minute sessions; https://www.mdpi.com/article/doi/s2, Appendix B: Distribution of Experiment Participants; https://www.mdpi.com/article/doi/s3, Appendix C: Graphical results of the statistical study.
Funding
This research received no external funding.
Data Availability Statement
The primary dataset is not available in open public repositories due to confidentiality requirements and the internal regulations of Moscow Polytechnic University. Summary aggregated data, network interaction matrices, and distribution plots are provided in full within the text of the article and its appendices. Primary depersonalized numerical data can be made available to interested researchers upon reasonable request to the author.
Conflicts of Interest
The author declares no conflict of interest. Industrial partners or third-party sponsors had no role in the design of the study; in the collection, analyses, or interpretation of empirical data; in the writing of the manuscript; or in the decision to publish the results. The development and implementation of the methodology were carried out solely within the framework of the author's routine academic and pedagogical activities within the university ecosystem.
Institutional Review Board Statement
The study was conducted in accordance with the principles of the Declaration of Helsinki. It was approved by the Dean of the Faculty of Information Technology and endorsed by the Head of the Department of Infocognitive Technologies at Moscow Polytechnic University on February 16, 2023. The developed methodology is an integral part of the core educational program and the curriculum for the "Fundamentals of Testing" course (Field of Study 09.03.03 "Applied Informatics"). Participation in the experiment was voluntary, and fully depersonalized and anonymized data were used for statistical analysis. Consequently, the collection and processing of the obtained samples within the framework of the standard educational process did not require formal review by a medical or clinical ethics committee. This approach complies with the university’s internal regulations and current national legislation.
Informed Consent Statement
Informed consent was obtained from all participants involved in the study. The consent procedure was conducted after announcing the regulations of the bonus marathon, directly through the voluntary submission of completed written assignments. No individual personalized academic performance tracks were published for statistical analysis. Student group numbers and names were fully coded and anonymized at the initial data processing stage. It is physically impossible to identify specific participants from the aggregated empirical data, heatmaps, and distribution plots presented in the article.
Abbreviations
The following abbreviations are used in this manuscript:
| IT | Information Technology |
| Q-Q | Quantile-quantile |
| CP | Checkting Point |
| BT | Bonus-bearing task |
| RT | Regular Task |
| PRR | Position retention rate |
| UPS | Upward position shift |
| DPS | Downward position shift |
| RDT | Ranking directional trend |
| CRV | Continuous rank volatility |
| IQV | Inter quartile volatility |
| LLM | Large Language Model |
| IDE | Integrated Development Environment |
| AI | Artificial Intelligence |
References
- Sagitov, E.B. Universal competencies of students: labour market vs higher education. J. Univ. Manag. Pract. Anal. 2024, 28(3), 56–67. [Google Scholar] [CrossRef]
- Rogoz, N. The Academic Curriculum in Higher Education. Transformative Competencies' Relevance for the Labour Market. Rev. Românească Pentru Educ. Multidimens. 2024, 16(4), 542–559. [Google Scholar] [CrossRef]
- Bhardwaj, V.; Zhang, S.; Tan, Y.Q.; Pandey, V. Redefining learning: student-centered strategies for academic and personal growth. Front. Educ. 2025, 10, 1518602. [Google Scholar] [CrossRef]
- Desjardins, S.; Hovdhaugen, E. Ensuring professional higher education meets the needs of students and society. Tert. Educ. Manag. 2023, 29(1), 1–4. [Google Scholar] [CrossRef]
- Babich, N.S.; Ivashchenkova, N.V. Competencies in higher education and the labor market: a sociocognitive analysis of the problem of integration. Integr. Educ. 2024, 1(114), 68–80. [Google Scholar] [CrossRef]
- Štimac, H.; Bilandžić Tanasić, K. Competencies and skills: gap between higher education and labour market. Econ. Thought Pract. 2023, 32(2), 615–628. [Google Scholar] [CrossRef]
- Anggraeni, D.M.; Prahani, B.K.; Suprapto, N.; Shofiyah, N.; Jatmiko, B. Systematic review of problem based learning research in fostering critical thinking skills. Think. Ski. Creat. 2023, 49, 101334. [Google Scholar] [CrossRef]
- Jääskä, E.; Aaltonen, K. Teachers’ experiences of using game-based learning methods in project management higher education. Proj. Leadersh. Soc. 2022, 3, 100041. [Google Scholar] [CrossRef]
- Kaputa, V.; Loučanová, E.; Tejerina-Gaite, F.A. Digital transformation in higher education institutions as a driver of social oriented innovations. In Social innovation in higher education. Landscape, Practices, and Opportunities; Păunescu, C., Lepik, K.-L., Spencer, N., Eds.; Springer: Cham, Switzerland, 2022; pp. 61–85. [Google Scholar] [CrossRef]
- Vaithianathan, V.; Subbulakshmi, N.; Boopathi, S.; Mohanraj, M. Integrating project-based and skills-based learning for enhanced student engagement and success: Transforming higher education. In Adaptive Learning Technologies for Higher Education; Tran, M.T., Ed.; IGI Global: Hershey, PA, USA, 2024; pp. 345–372. [Google Scholar] [CrossRef]
- Malinovsky, M.A.; Ershov, A.V. Application of project-oriented training in the field of bim technologies. Vestn. SSUGT 2021, 26(3), 181–188. [Google Scholar] [CrossRef]
- Nurjanah, I.; Ana, A.; Masek, A. Systematic literature review: Work readiness of vocational high school graduates in facing the industrial 4.0 era. J. Pendidik. Teknol. Dan Kejuru. 2022, 28(2), 139–153. [Google Scholar] [CrossRef]
- Poláková, M.; Suleimanová, J.H.; Madzík, P.; Copuš, L.; Molnárová, I.; Polednová, J. Soft skills and their importance in the labour market under the conditions of Industry 5.0. Heliyon 2023, 9(8), e18670. [Google Scholar] [CrossRef]
- Silberman, D.; Aguinis, H.; Carpenter, R.E. Using extreme pedagogy to enhance entrepreneurship education. Entrep. Educ. Pedagog. 2023, 6(3), 546–560. [Google Scholar] [CrossRef]
- Varas-Díaz, N.; Venkatesh, V. The Ethics of Extremity: On Hearing, Seeing, and Feeling Each Other; Bloomsbury Academic: New York, NA, USA, 2026. [Google Scholar]
- Hanham, J.; Castro-Alonso, J.C.; Chen, O. Integrating cognitive load theory with other theories, within and beyond educational psychology. Br. J. Educ. Psychol. 2023, 93, 239–250. [Google Scholar] [CrossRef]
- Leonova, E.A.; Borovskaja, E.V.; Dmitrieva, O.A. Pedagogical hackathon as a method of joint project-based training of future teachers and IT students. Inform. Educ. Inform. Educ. 2022, 37(1), 16–26. [Google Scholar] [CrossRef]
- Miličević, A.; Despotović-Zrakić, M.; Stojanović, D.; Suvajžić, M.; Labus, A. Academic performance indicators for the hackathon learning approach–The case of the blockchain hackathon. J. Innov. Knowl. 2024, 9(3), 100501. [Google Scholar] [CrossRef]
- Oyetade, K.; Zuva, T.; Harmse, A. Evaluation of the impact of hackathons in education. Cogent Educ. 2024, 11(1), 2392420. [Google Scholar] [CrossRef]
- Rooholamini, A.; Salajegheh, M. Health profession education hackathons: a scoping review of current trends and best practices. BMC Med. Educ. 2024, 24(1), 554. [Google Scholar] [CrossRef]
- Evans, P.; Vansteenkiste, M.; Parker; Kingsford-Smith, P.A.; Zhou, A. S. Cognitive Load Theory and Its Relationships with Motivation: a Self-Determination Theory Perspective. Educ. Psychol. Rev. 2024, 36, 7. [Google Scholar] [CrossRef]
- Satria, A.N.; Dwiputra, R.C.; Sensuse, D.I.; Lusa, S.; Elisabeth, D. Exploring Knowledge Sharing in Software Development Industry: A Systematic Review on Influencing Factors and Practical Implementations. Indones. J. Comput. Sci. 2024, 13(4), 4600–4615. [Google Scholar] [CrossRef]
- Zamiri, M.; Esmaeili, A. Methods and technologies for supporting knowledge sharing within learning communities: A systematic literature review. Adm. Sci. 2024, 14(1), 17. [Google Scholar] [CrossRef]
- Roxå, T.; Ahmad, A.; Barrington, J.; Van Maaren, J.; Cassidy, R. Reconceptualizing student ratings of teaching to support quality discourse on student learning: a systems perspective. High. Educ. 2022, 83(1), 35–55. [Google Scholar] [CrossRef]
- Roy, K.; Farid, D.M. An adaptive feature selection algorithm for student performance prediction. IEEE Access 2024, 12, 75577–75598. [Google Scholar] [CrossRef]
- Siniakova, E.A.; Mirzoyan, A.G. Students’ Fallacies in Predicting Test Outcomes. LEJ 2025, 60(2), 309–331. [Google Scholar] [CrossRef]
- Liksonova, D.I.; Danichev, A.A.; Shestakov, V.N.; Yakunin, Yu.Yu. Increasing the Accuracy of the Model for Predicting the Performance of University Students. IT 2025, 31(4), 215–224. [Google Scholar] [CrossRef]
- Koriťáková, E.; Jivram, T.; Gîlcă-Blanariu, G.E.; Churová, V.; Poulton, E.; Ciureanu, A.I.; et al. Comparison of problem-based and team-based learning strategies: a multi-institutional investigation. Front. Educ. 2023, 8, 1301269. [Google Scholar] [CrossRef]
- Ibrahim, W.; Ibrahim, W.; Zoubeidi, T.; Marzouk, S.; Sweedan, A.; Amer, H. An Online Management System for Streamlining and Enhancing the Quality of Learning Outcomes Assessment. Educ. Inf. Technol. 2022, 27, 11325–11353. [Google Scholar] [CrossRef]
- Okuneva, G.L.; Starchenko, D.N.; Stativko, R.U. Evaluation of a student's rating based on a fuzzy model. Inf. Syst. Technol. 2024, 4(144), 72–82. [Google Scholar]
- Xie, Z. B.; Cheng, X.Y.; Li, X.Y.; Zhang, Y.F. Team based learning pedagogy enhances the education quality: a systematic review and meta-analysis. BMC Med. Educ. 2025, 25(1), 580. [Google Scholar] [CrossRef]
- Michaelsen, L.K.; Knight, A.B.; Fink, L.D. (Eds.) Team-based learning: A transformative use of small groups in college teaching; Taylor & Francis: New York, NY, USA, 2023. [Google Scholar] [CrossRef]
- Kulikova, S.S.; Yakovleva, O.V. Pedagogical management in the digital educational environment: Theoretical aspect. Educ. Sci. J. 2022, 24(2), 48–83. [Google Scholar] [CrossRef]
- Fonsén, E.; Lahtero, T.; Ahtiainen, R.; Hanhimäki, E.; Leinonen, J.; Risku, M.; Smeds-Nylund, A.S. The theory of pedagogical leadership: Enhancing high-quality education. In Leadership in Educational Contexts in Finland; Ahtiainen, R., Leinonen, J., Smeds-Nylund, A.-S., Hanhimäki, E., Risku, M., Eds.; Springer: Cham, Switzerland, 2024; pp. 159–175. [Google Scholar] [CrossRef]
- Grankina, V.; Krasnikova, I.; Smirnova, Y.; Kulibaba, I.; Barinov, V. Digital transformation of the educational process in schools of Kazakhstan: the concept of intelligent assistant in school physics curriculum. Front. Educ. 2026, 11, 1766616. [Google Scholar] [CrossRef]
- Jin, F.; Wang, Y. The emergence of Community Knowledge in a Complex network-based Folksonomy Self-organization mode. In Proceedings of the 11th International Conference on Software and Information Engineering; ACM: Beijing, China, 2022; pp. 62–65. [Google Scholar] [CrossRef]
- Isaikina, M.; Nedogreeva, G.; Pikulik, O. The issue of network interaction in the educational process. Russ. J. Educ. Psychol. 2022, 13(5), 7–19. [Google Scholar] [CrossRef]
- Sahito, Z.H.; Khoso, F.J.; Phulpoto, J. The effectiveness of active learning strategies in enhancing student engagement and academic performance. J. Soc. Sci. Rev. 2025, 5(1), 110–127. [Google Scholar] [CrossRef]
- Saqr, M.; López-Pernas, S.; Helske, S.; Hrastinski, S. The longitudinal association between engagement and achievement varies by time, students’ profiles, and achievement state: A full program study. Comput. Educ. 2023, 199, 104787. [Google Scholar] [CrossRef]
- Chen, C.H.; Chang, C.L. Effectiveness of AI-assisted game-based learning on science learning outcomes, intrinsic motivation, cognitive load, and learning behavior. Educ. Inf. Technol. 2024, 29(14), 18621–18642. [Google Scholar] [CrossRef]
- Chapman, J.R.; Kohler, T.B.; Gedeborg, S. So, why do students perform better in gamified courses? Understanding motivational styles in educational gamification. J. Educ. Comput. Res. 2023, 61(5), 927–950. [Google Scholar] [CrossRef]
- Sousa-Vieira, M.E.; López-Ardao, J.C.; Fernández-Veiga, M.; Rodríguez-Rubio, R.F. Study of the impact of social learning and gamification methodologies on learning results in higher education. Comput. Appl. Eng. Educ. 2023, 31(1), 131–153. [Google Scholar] [CrossRef]
- Oliveira, W.; Hamari, J.; Joaquim, S.; Toda, A.M.; Palomino, P.T.; Vassileva, J.; Isotani, S. The effects of personalized gamification on students’ flow experience, motivation, and enjoyment. Smart Learn. Environ. 2022, 9(1), 16. [Google Scholar] [CrossRef]
- Mitchell, A.; Vaughan, A.G. Implementing team-based learning: Findings from a database class. J. Inf. Technol. Educ. Innov. Pract. 2022, 21, 1. [Google Scholar] [CrossRef]
- Ramos-Rodriguez, R.; Calle, M.; Coronell, G.; Becerra, J.E.C. Transdisciplinarity and team-based learning: Strategies for an introductory programming course. IEEE Trans. Educ. 2024, 67(2), 317–326. [Google Scholar] [CrossRef]
- Yuan, X.; Zheng, Q. Analysis of interactive impact and student behavior of teaching online courses based on gamified learning. Entertain. Comput. 2024, 50, 100672. [Google Scholar] [CrossRef]
Figure 1.
Five-minute quizzes structure.
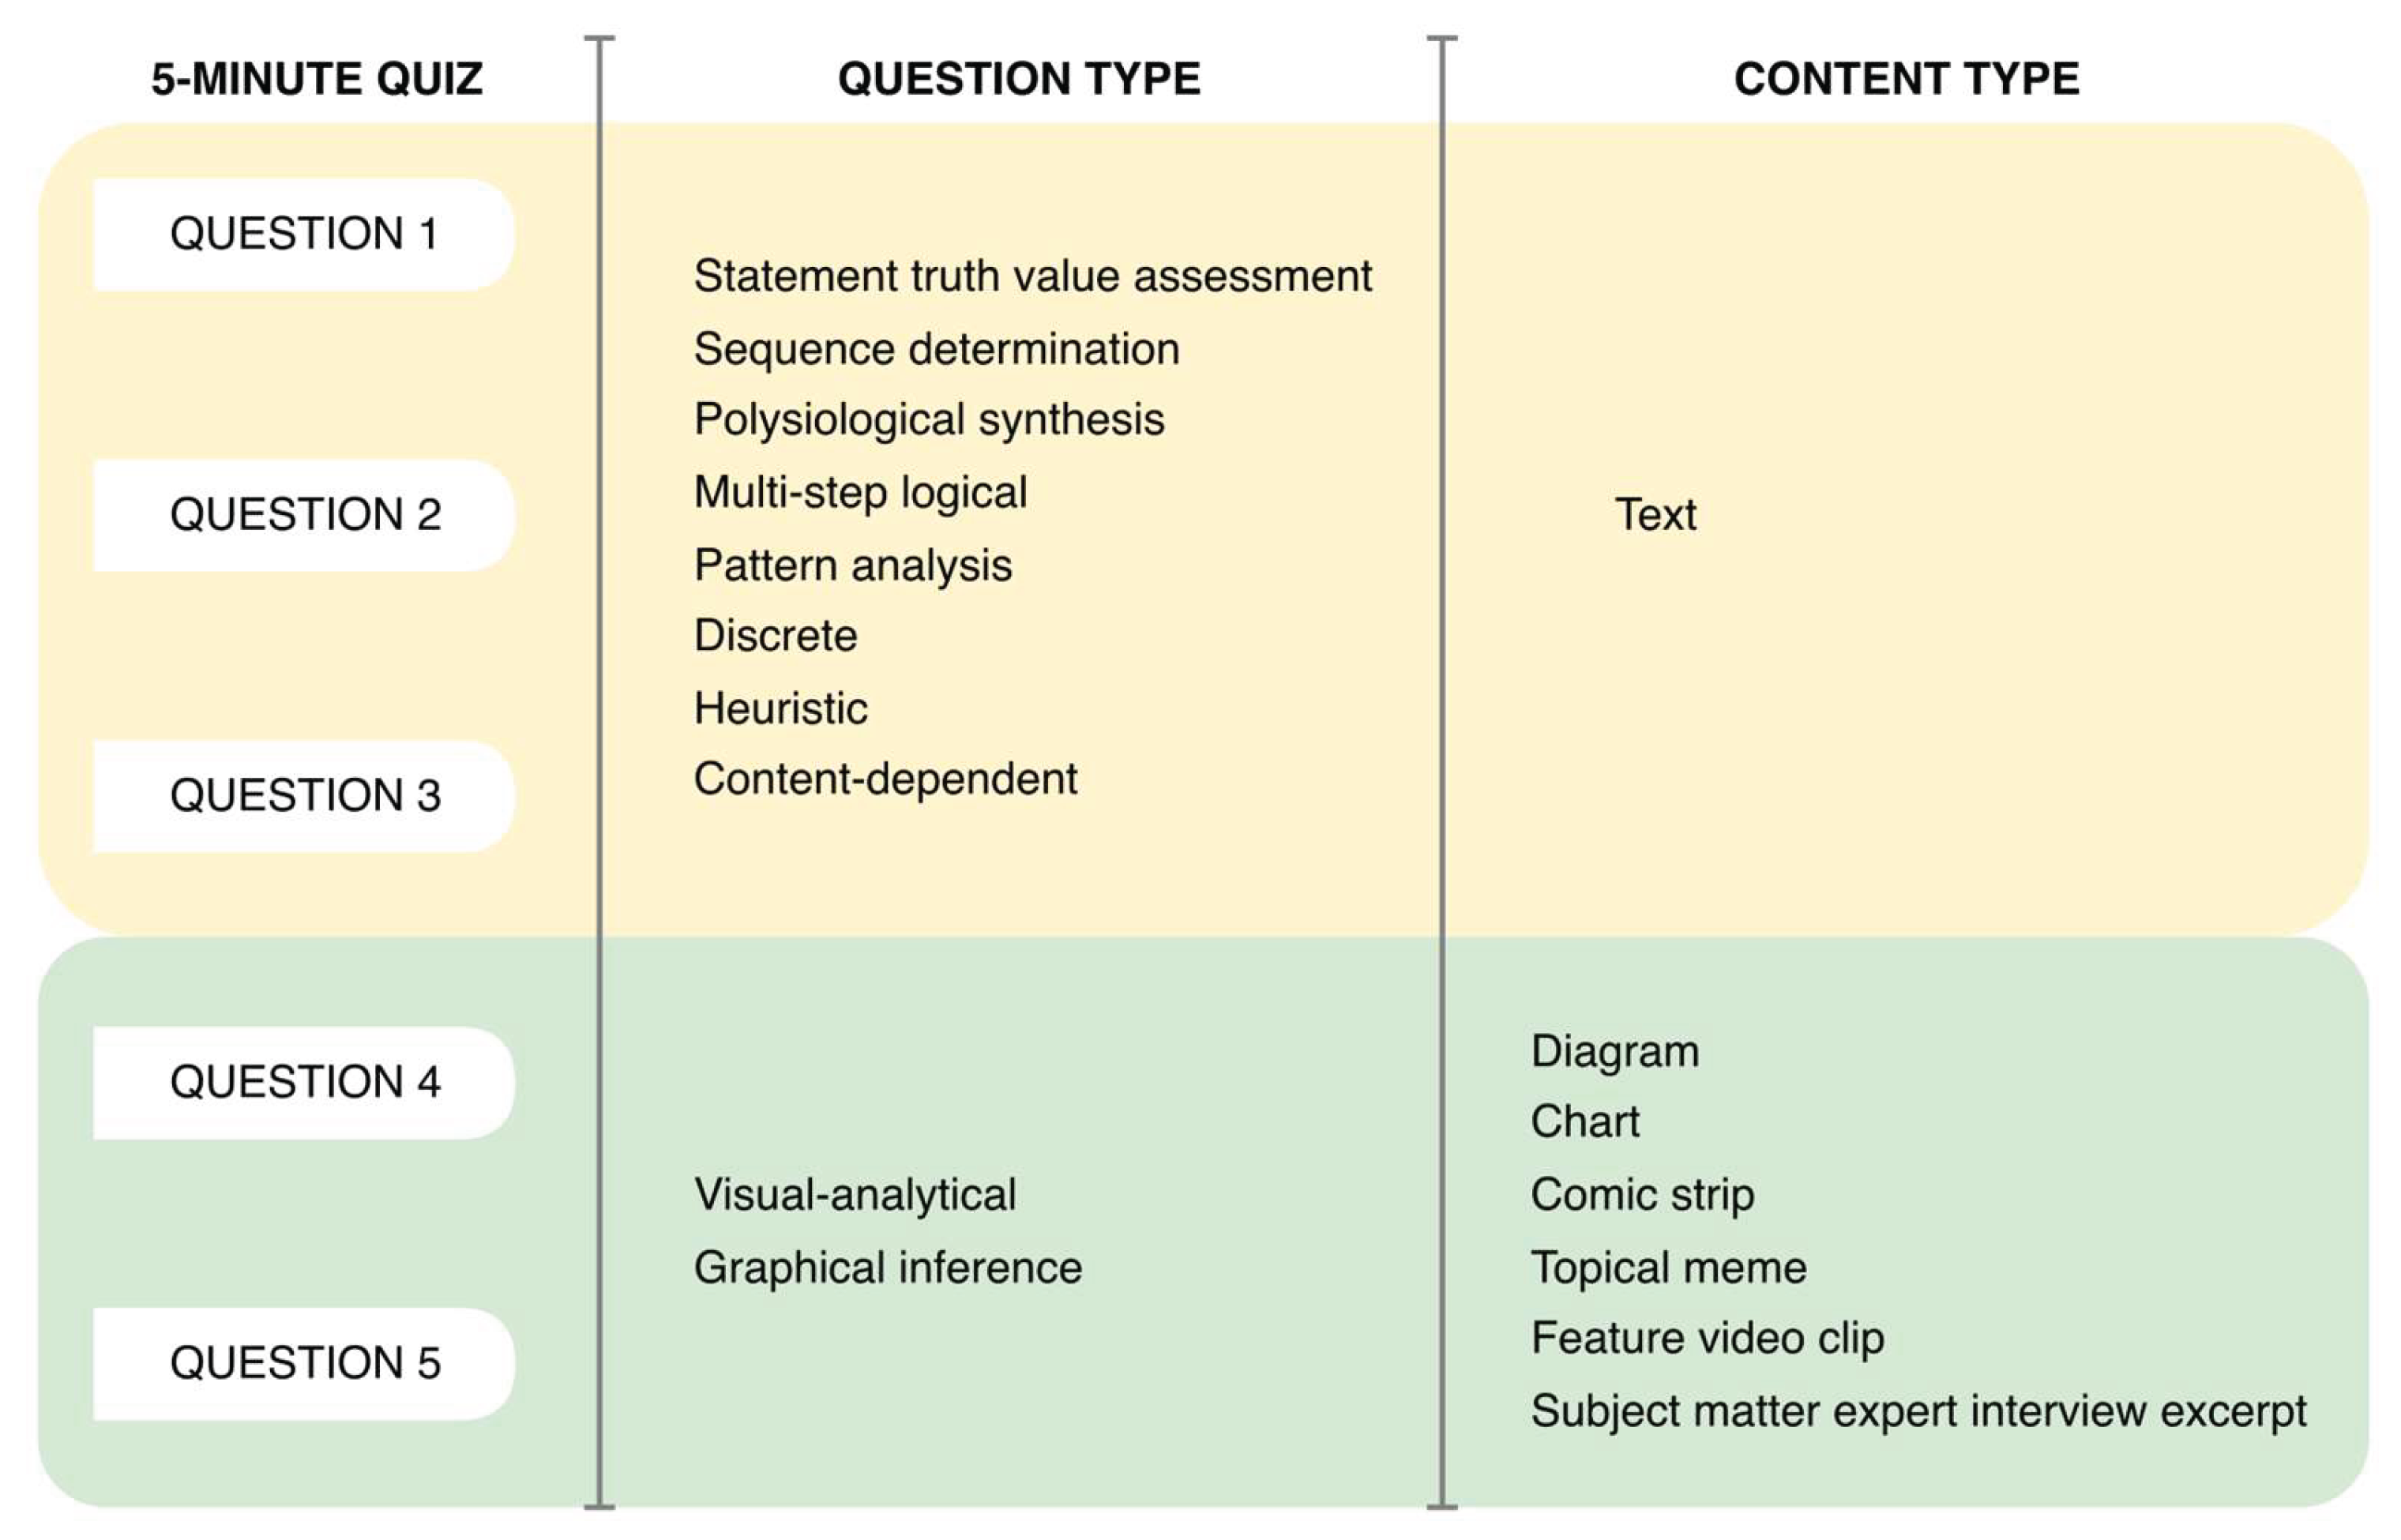
Figure 2.
Rate of change of the average score.
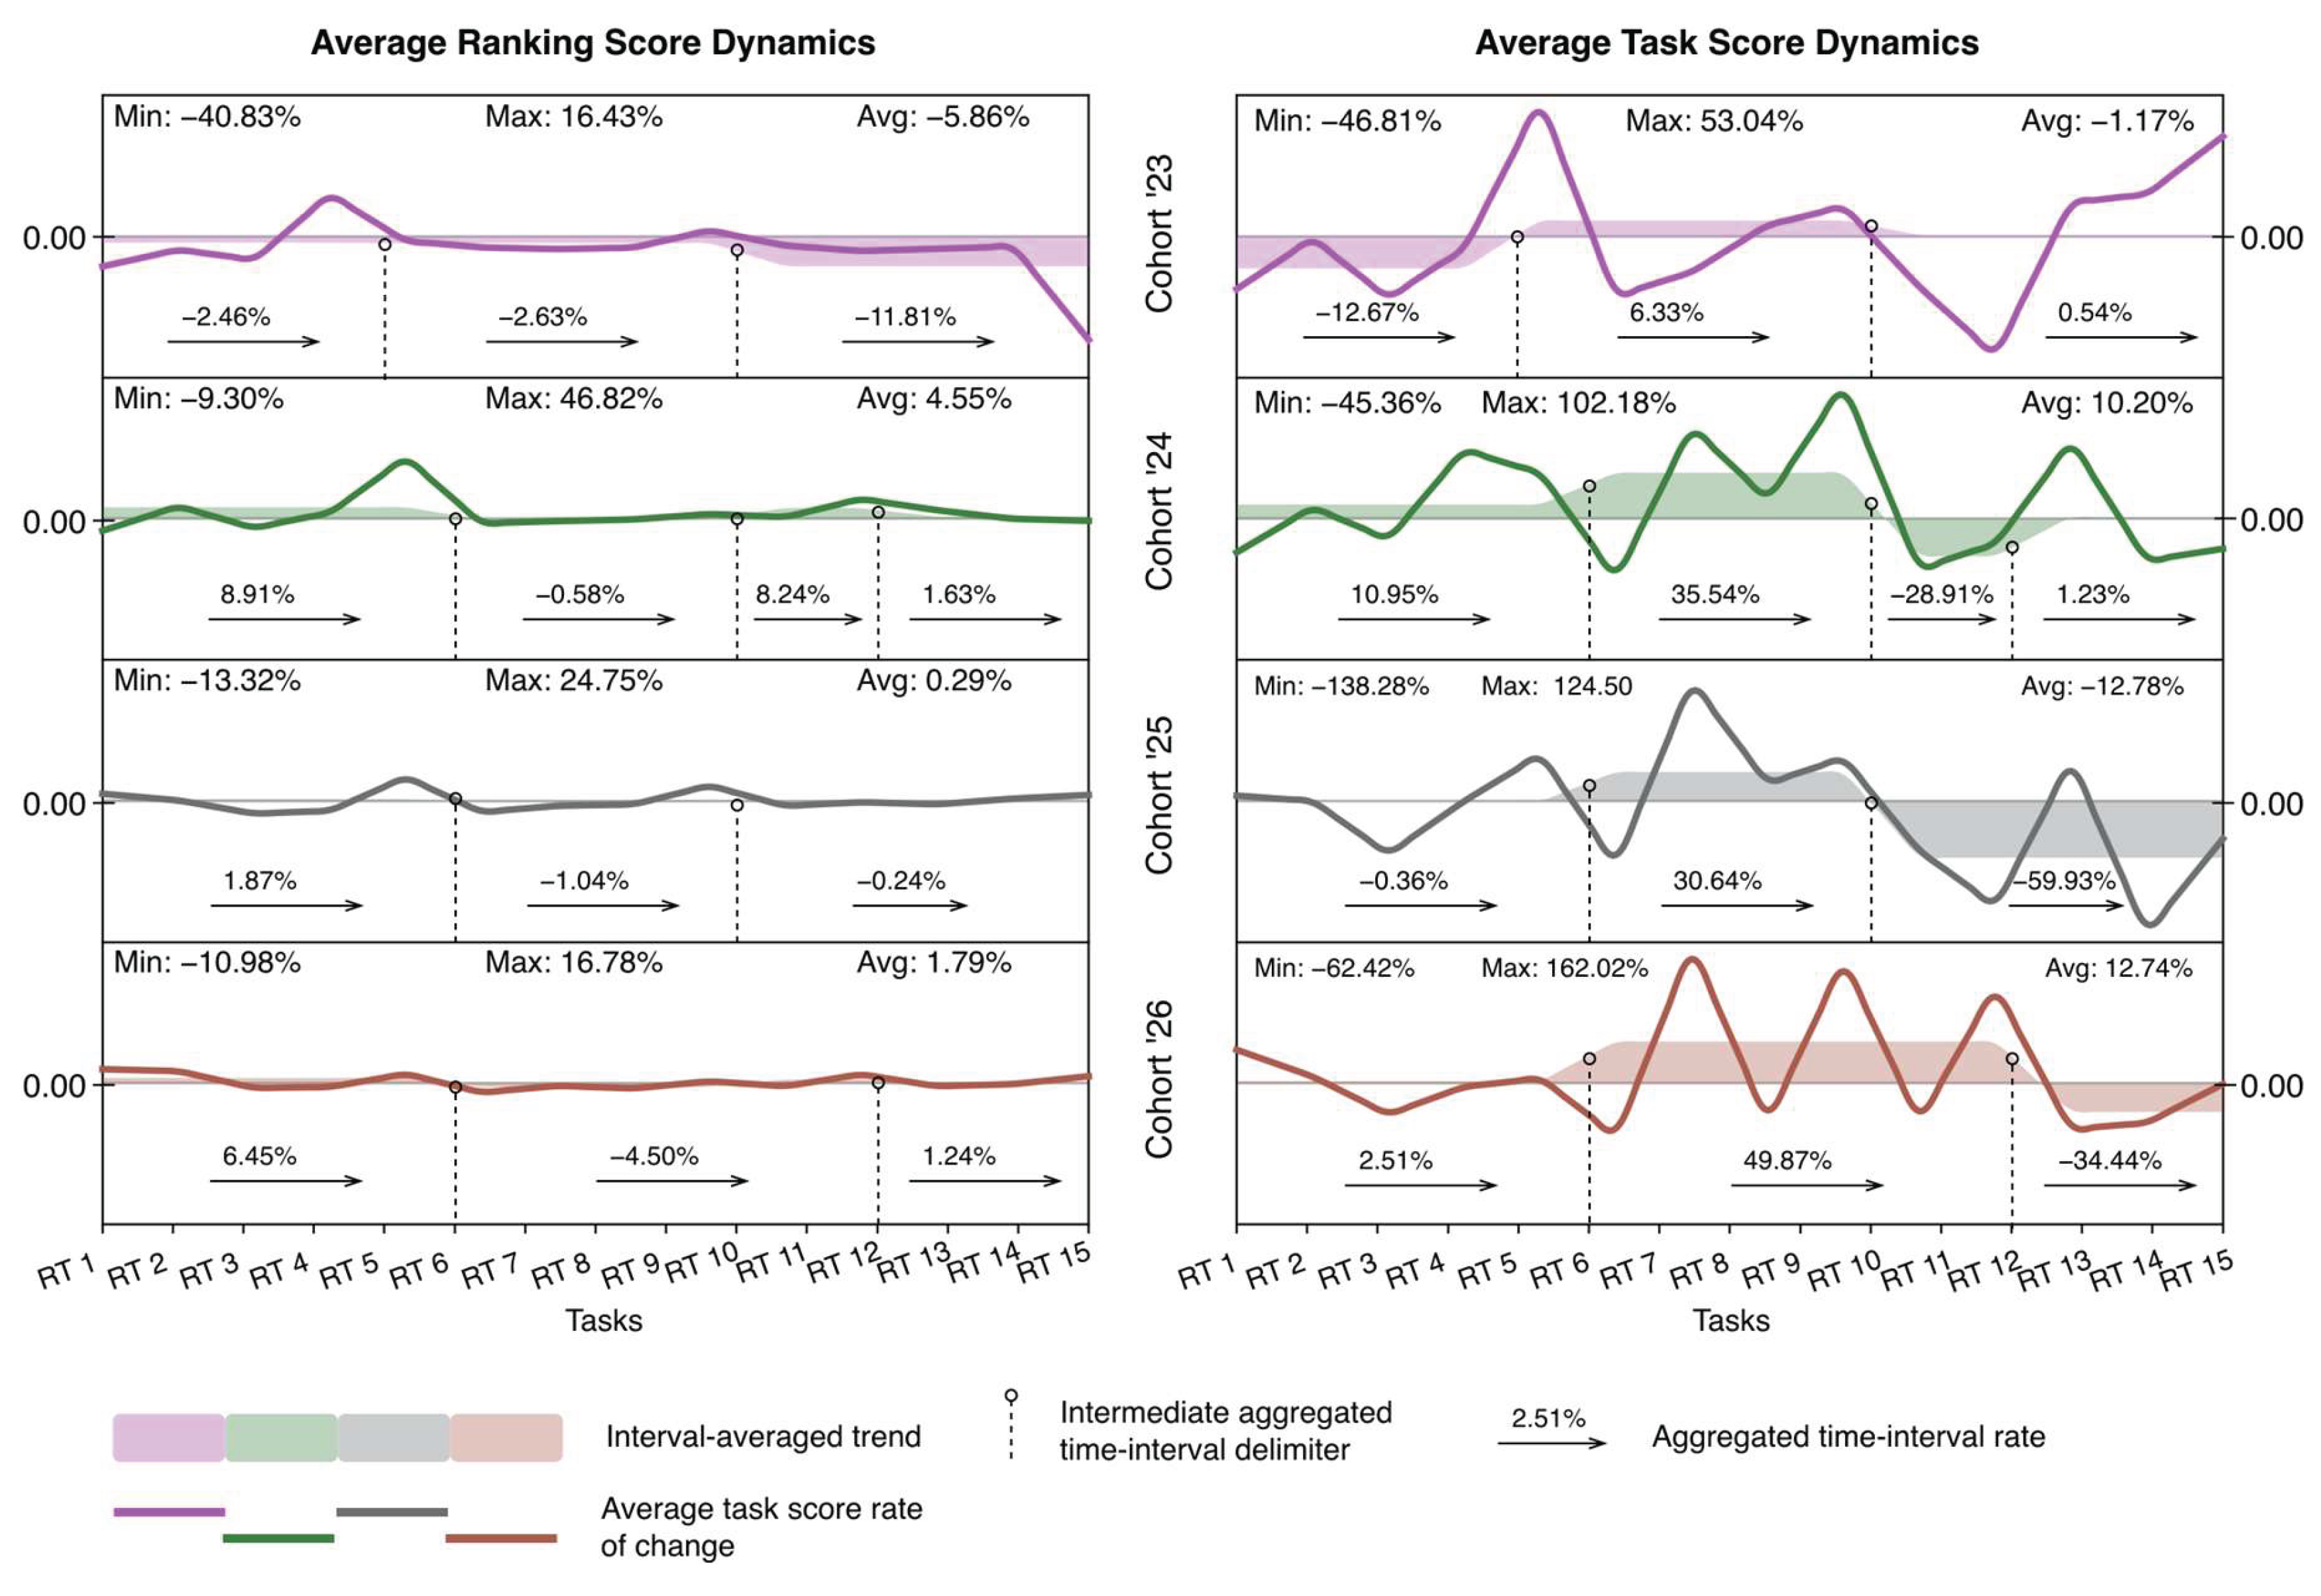
Figure 3.
Variation of ranking lists across cohorts.
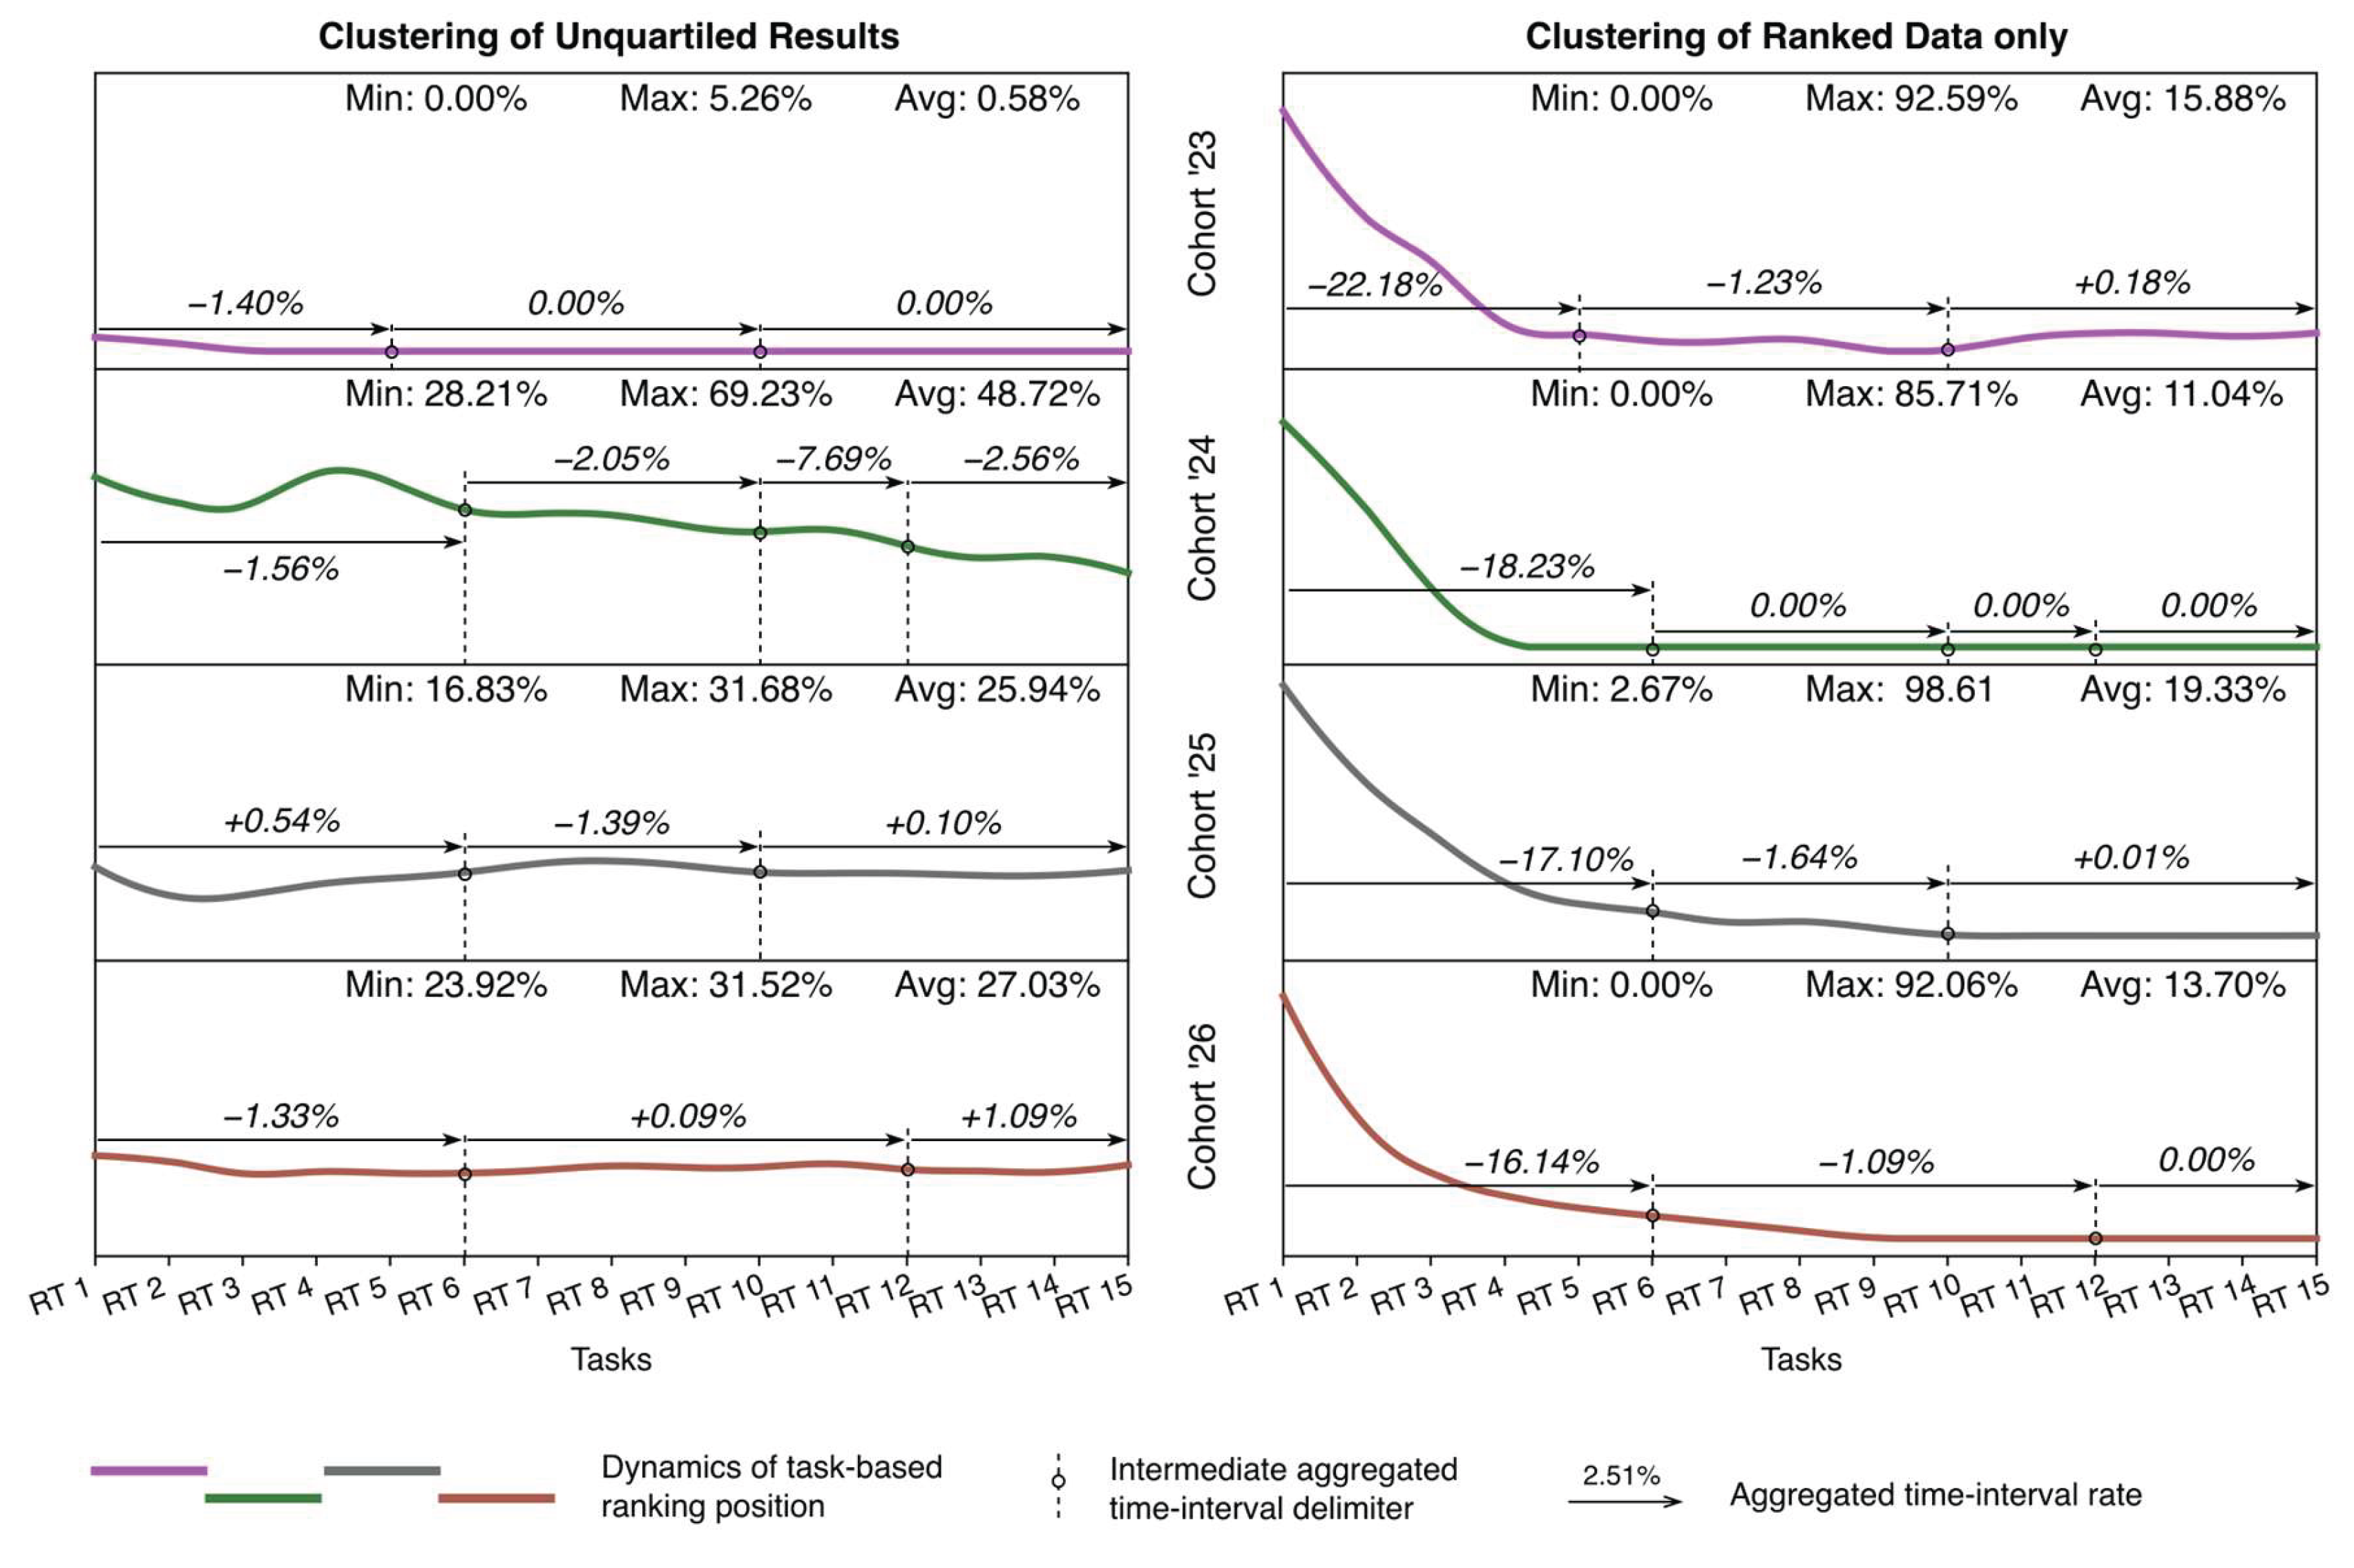
Figure 4.
Distribution across confidence corridors for 3rd-year students from the 2026 cohort.
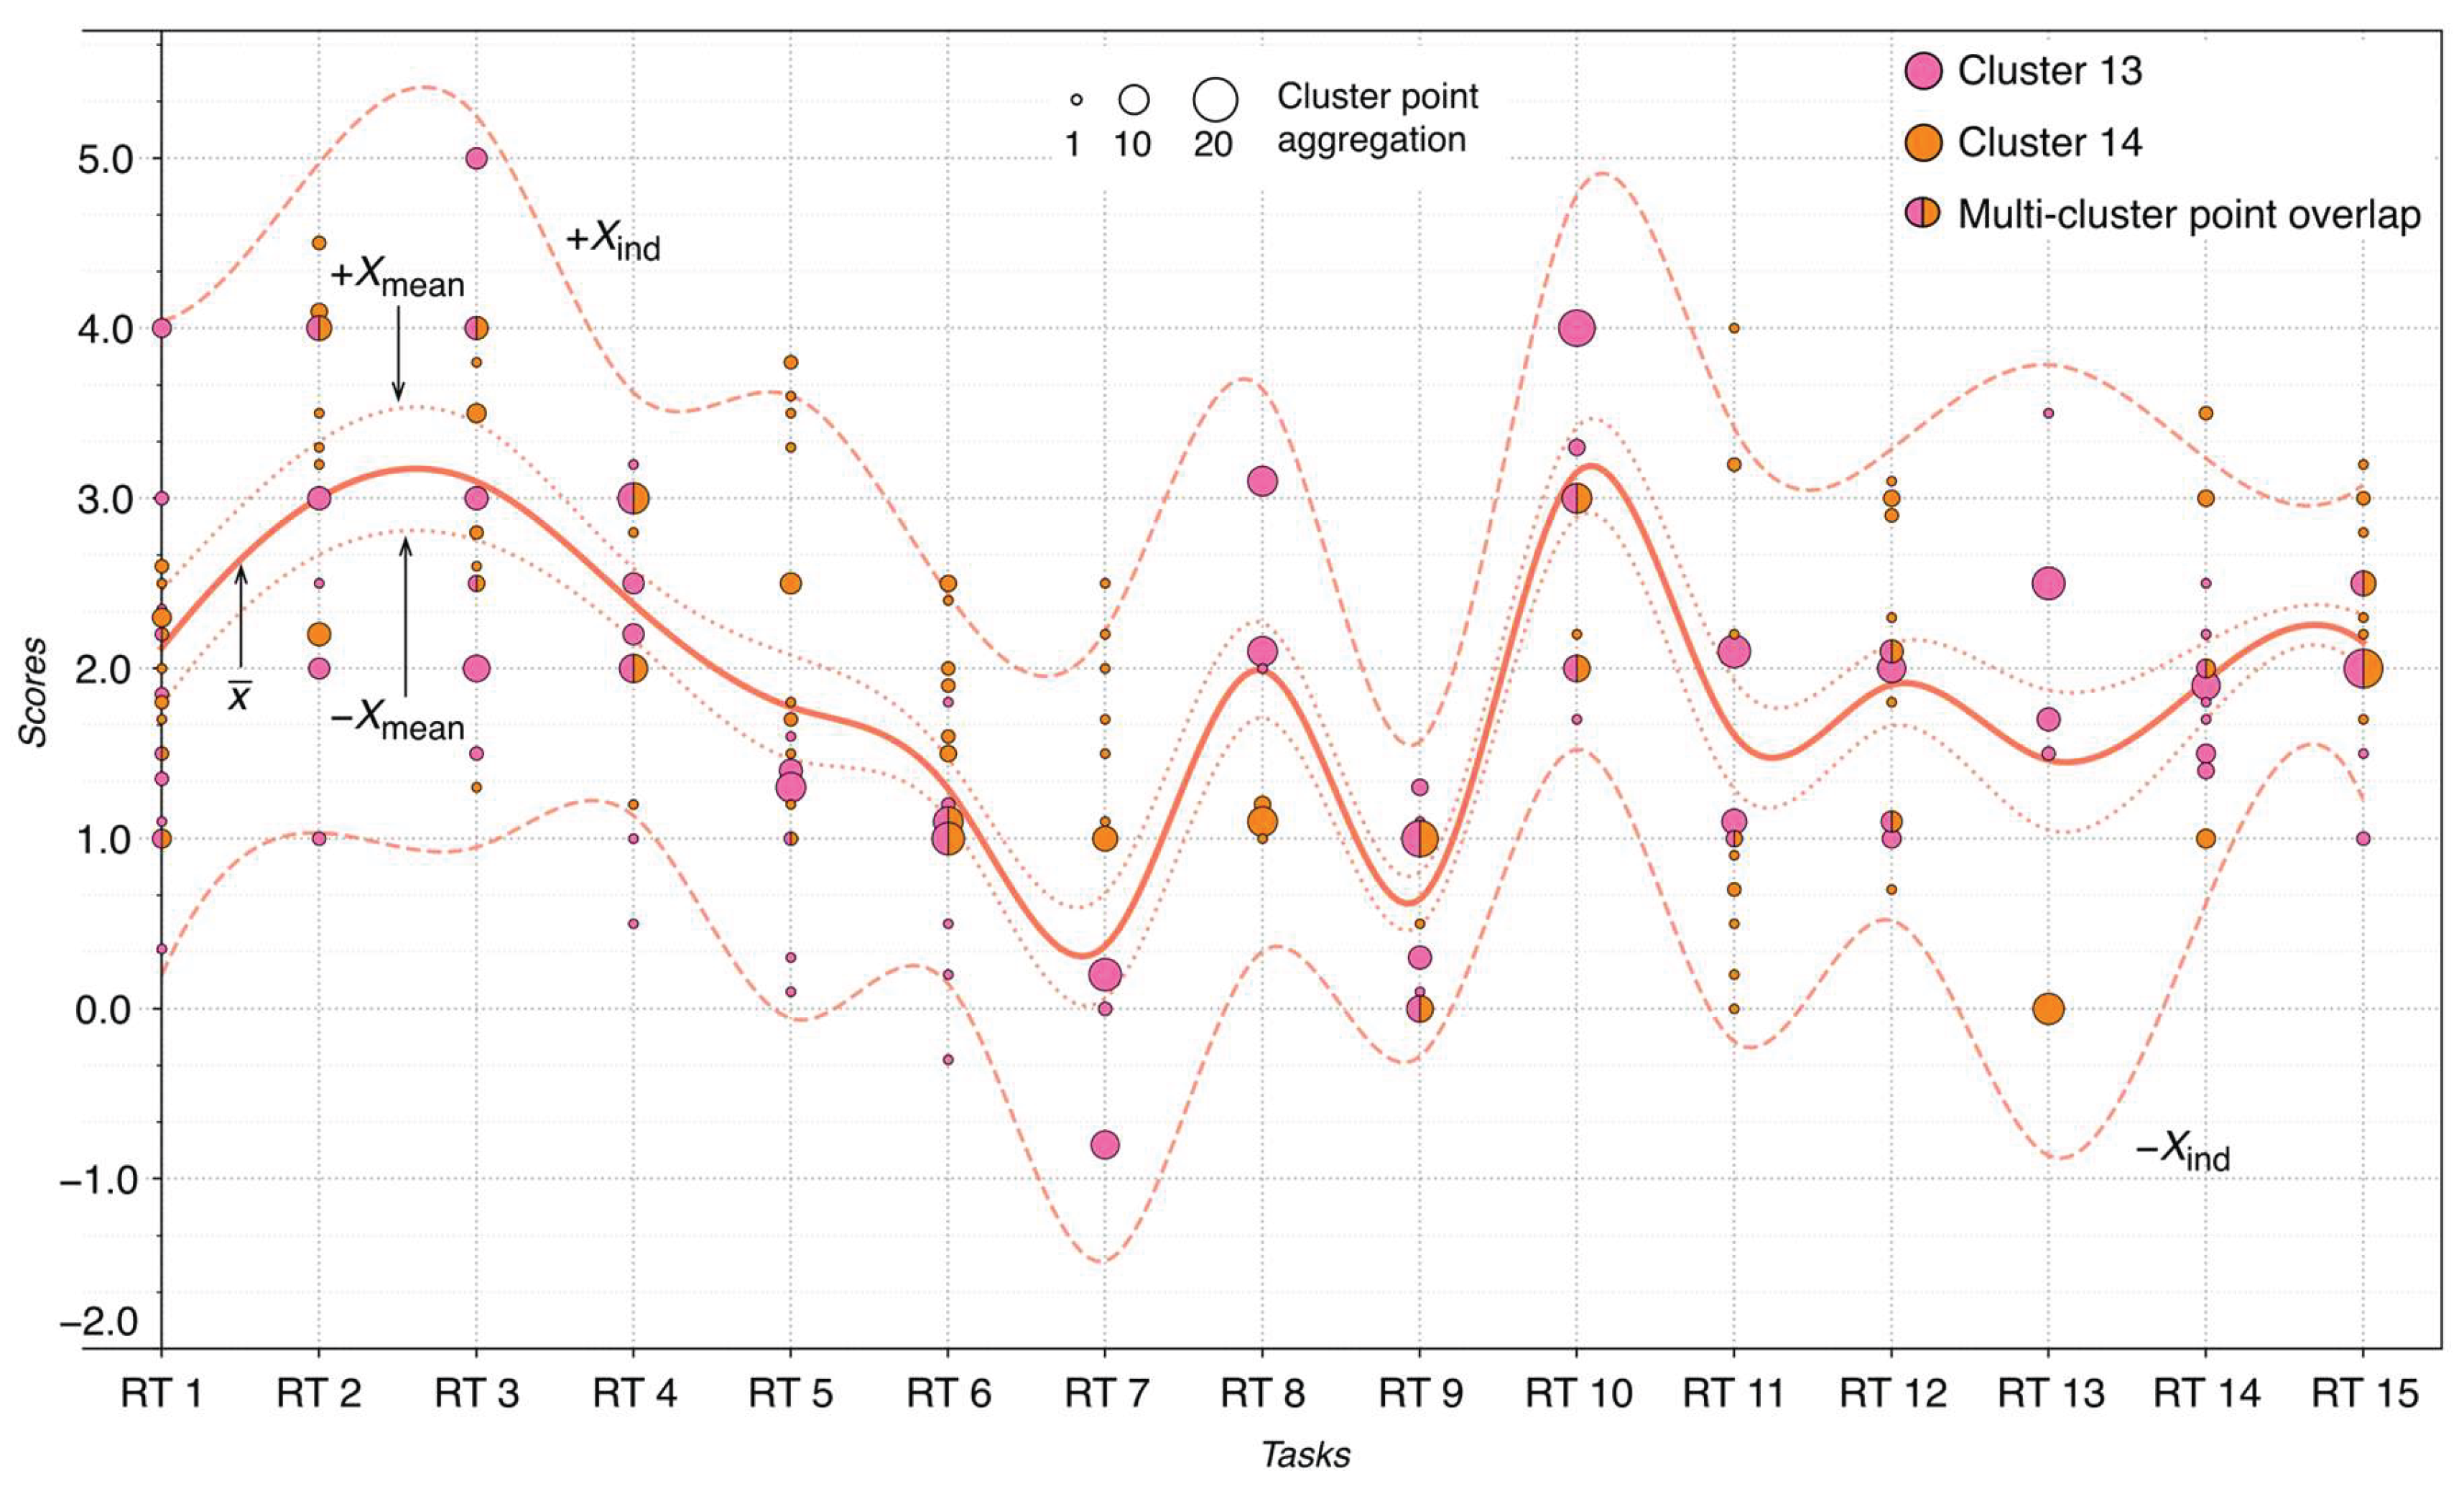
Figure 5.
Q-Q distribution across all marathon assignments for third-year students from the 2026 cohort.
Figure 5.
Q-Q distribution across all marathon assignments for third-year students from the 2026 cohort.
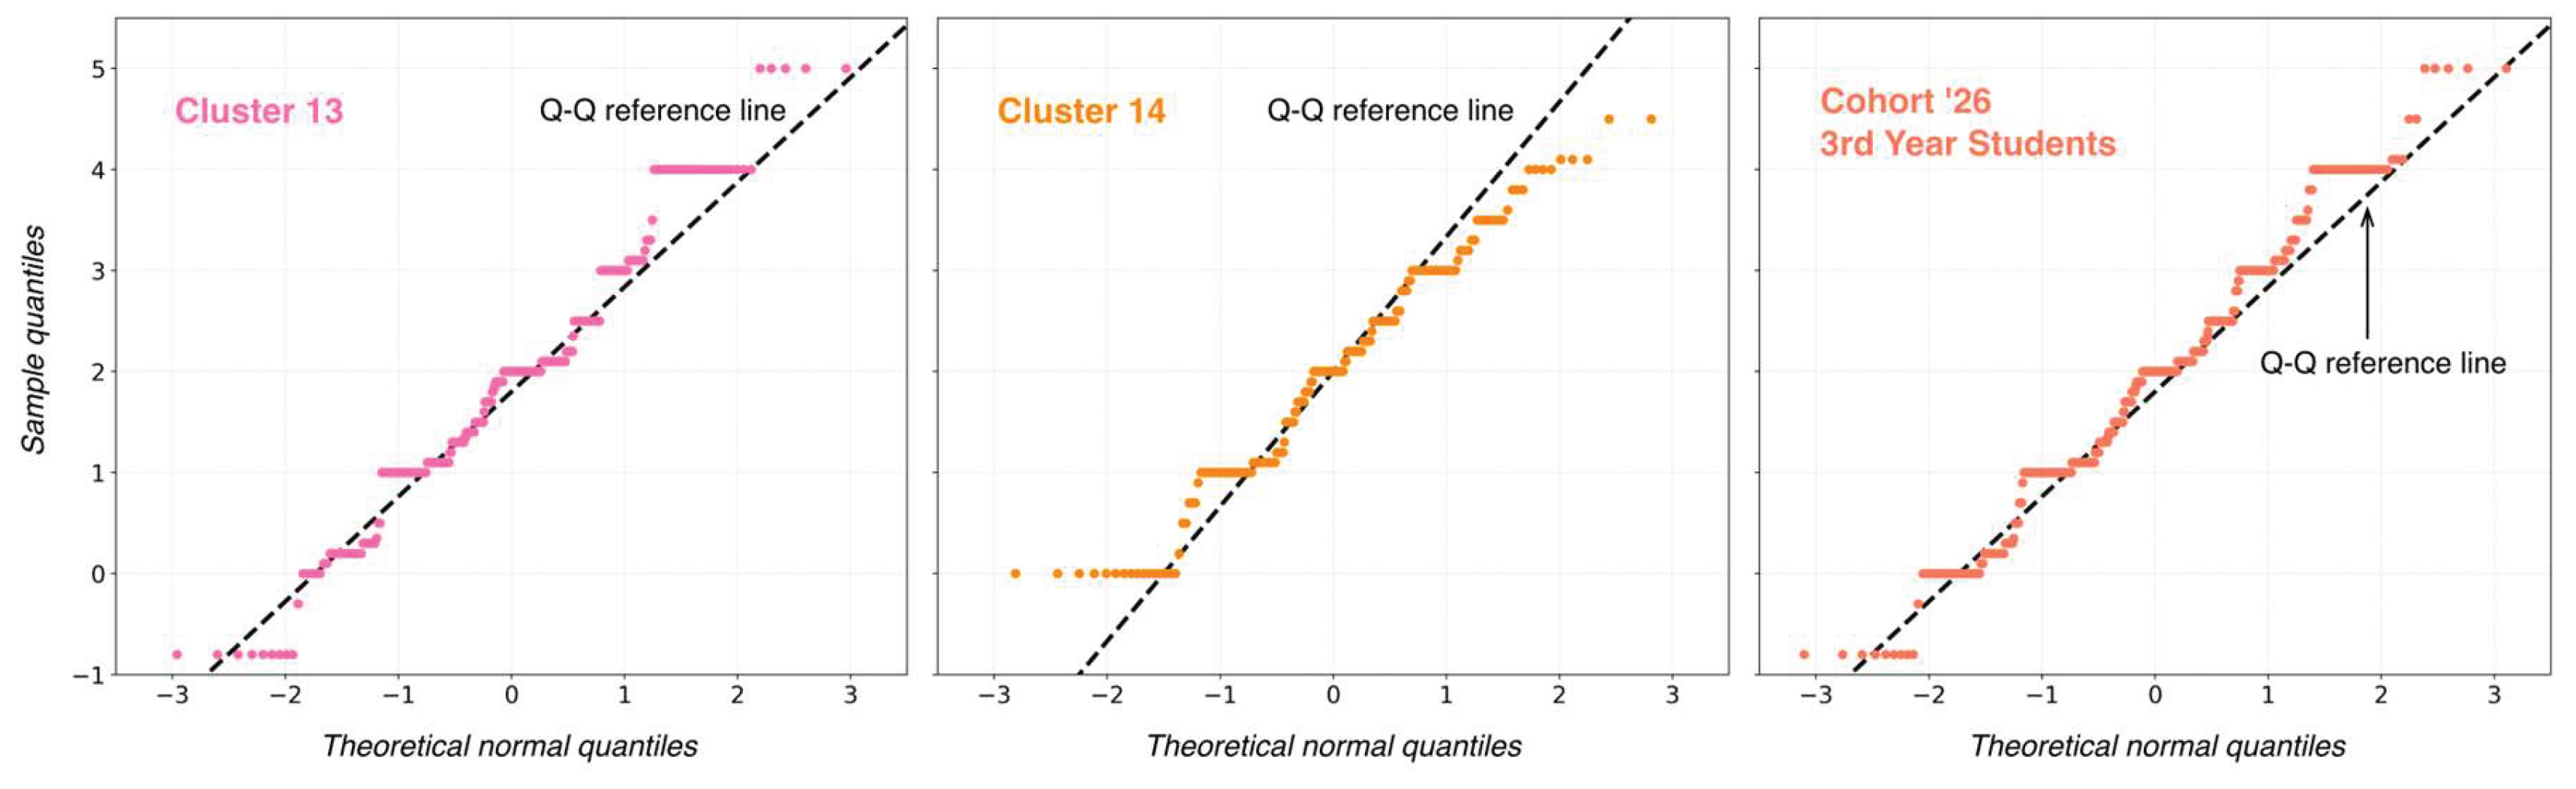
Figure 6.
Distribution of primary and bonus marathon results for the 2026 cohort.
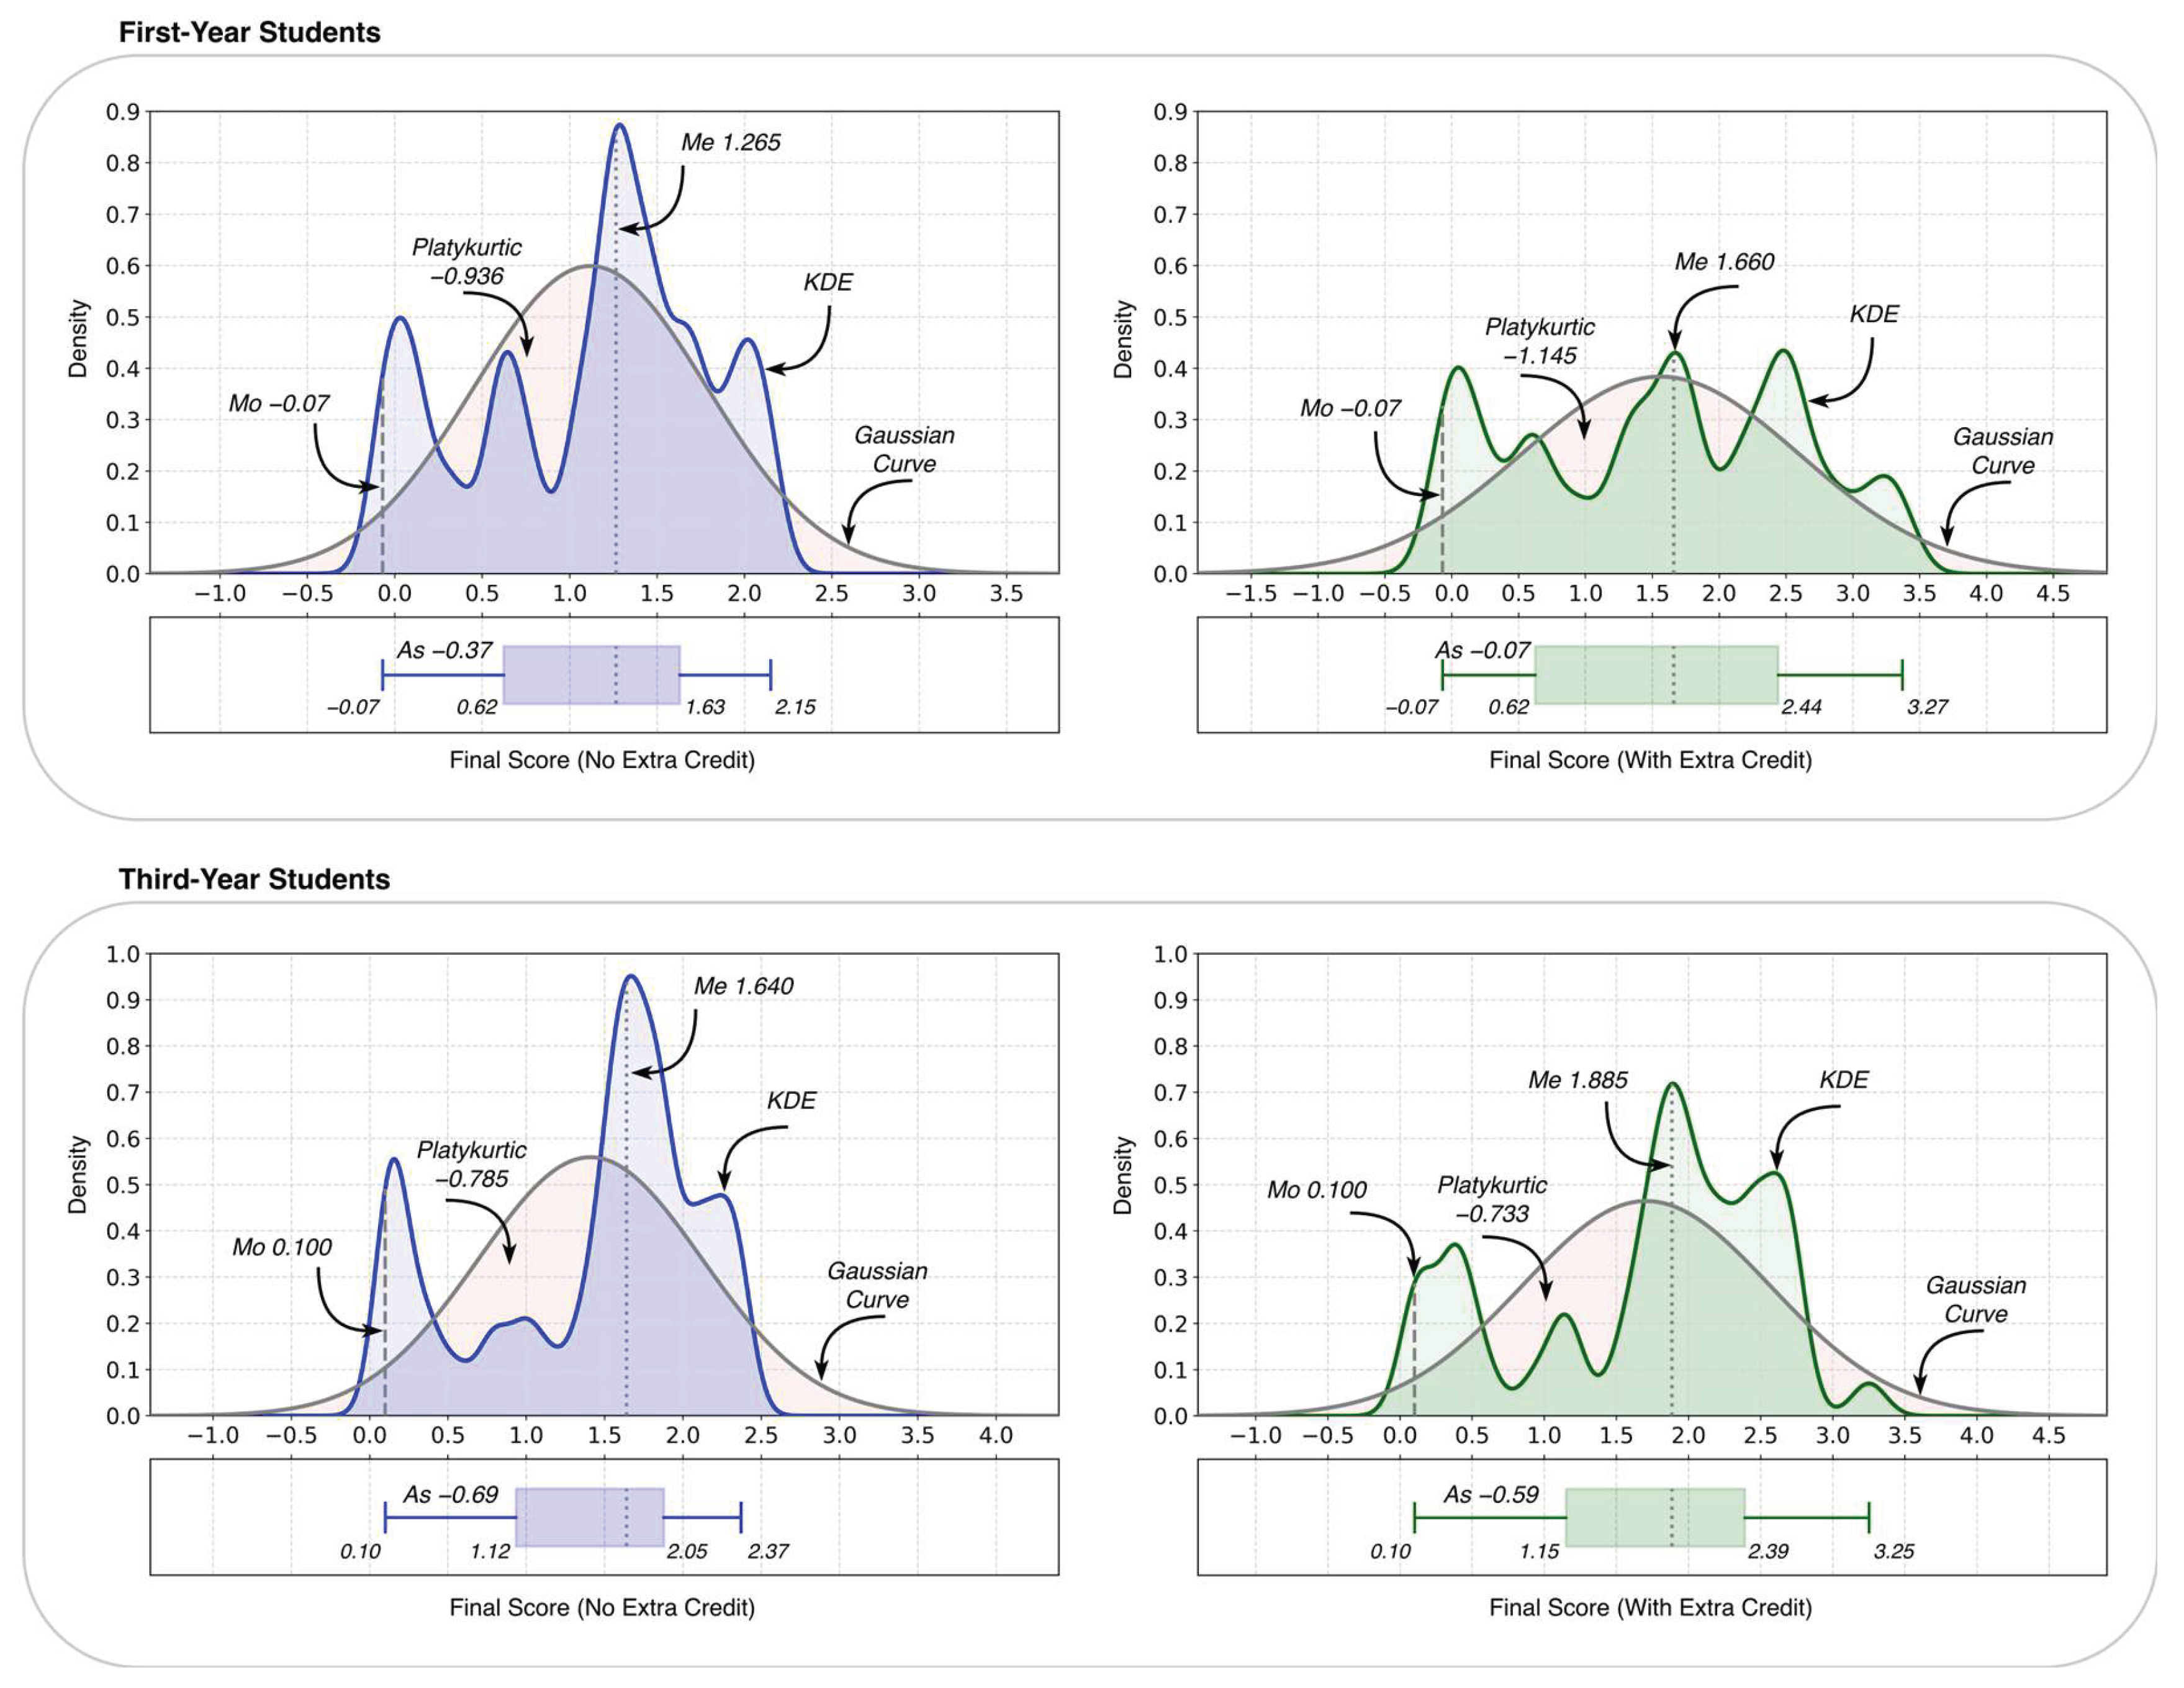
Figure 7.
Distribution of work results and variation levels for 3rd-year students of the 2026 cohort.
Figure 7.
Distribution of work results and variation levels for 3rd-year students of the 2026 cohort.
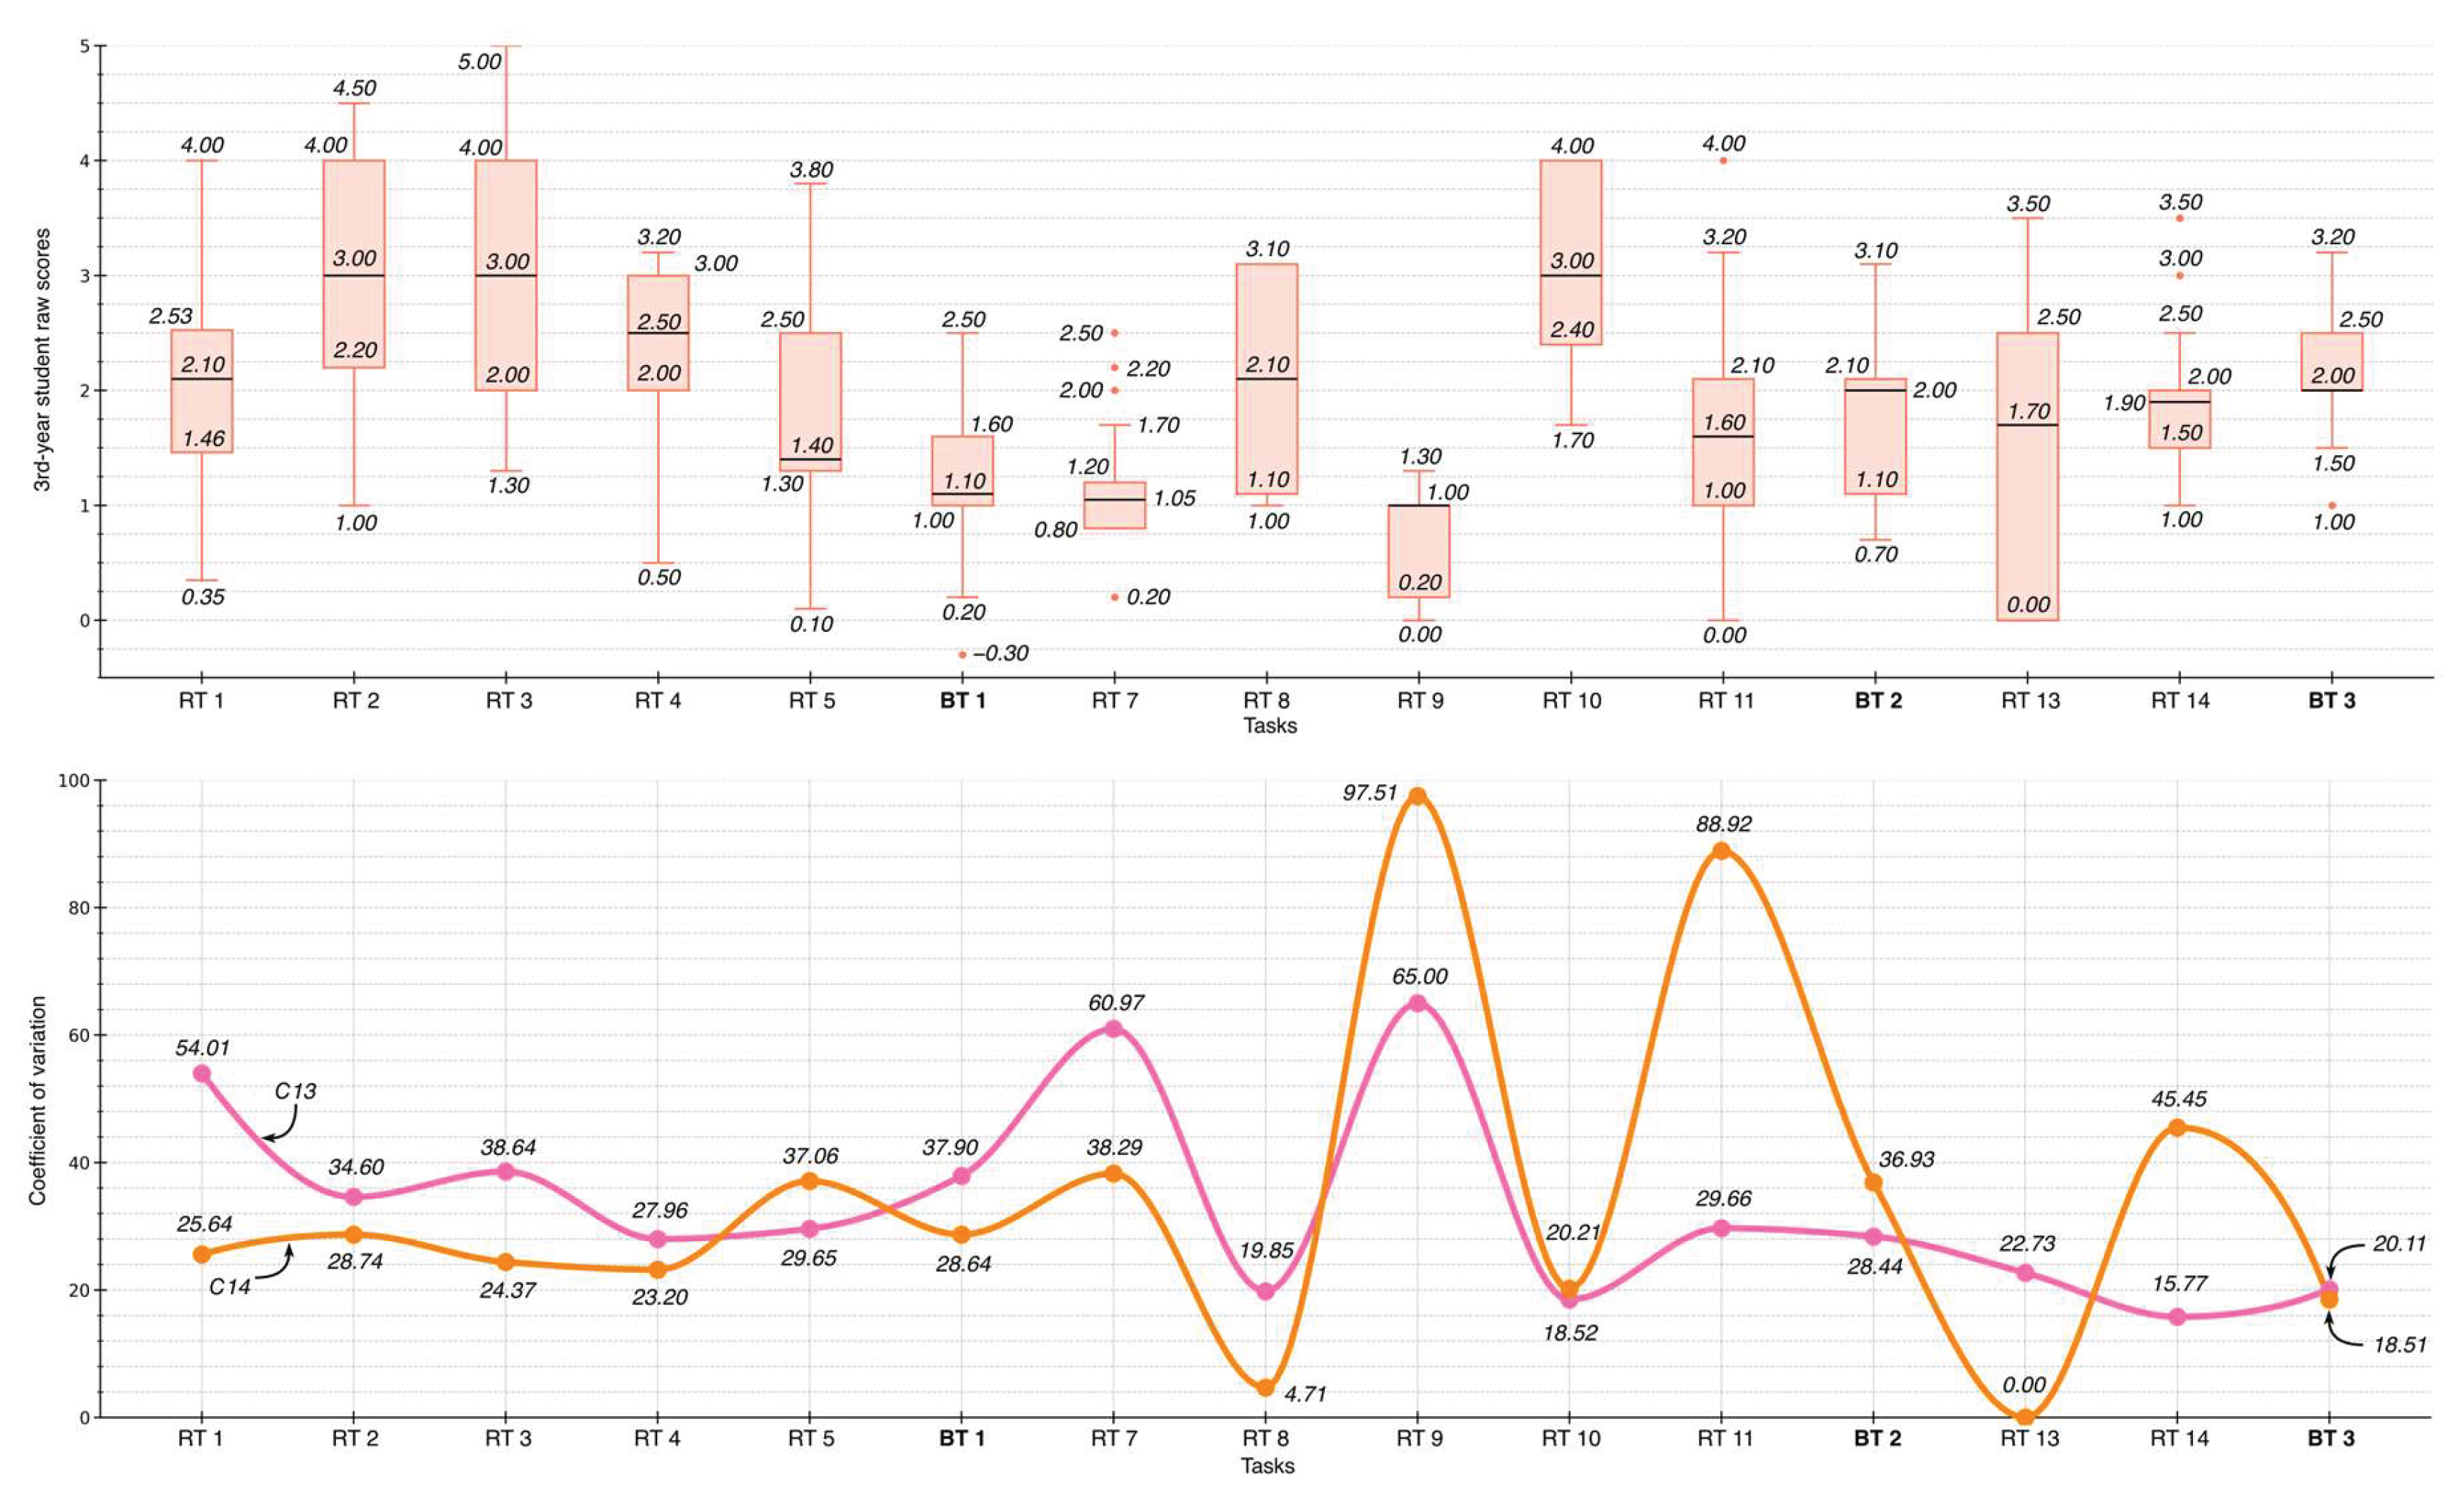
Figure 8.
Distribution of work results and level of variation for first-year students of the 2026 cohort.
Figure 8.
Distribution of work results and level of variation for first-year students of the 2026 cohort.
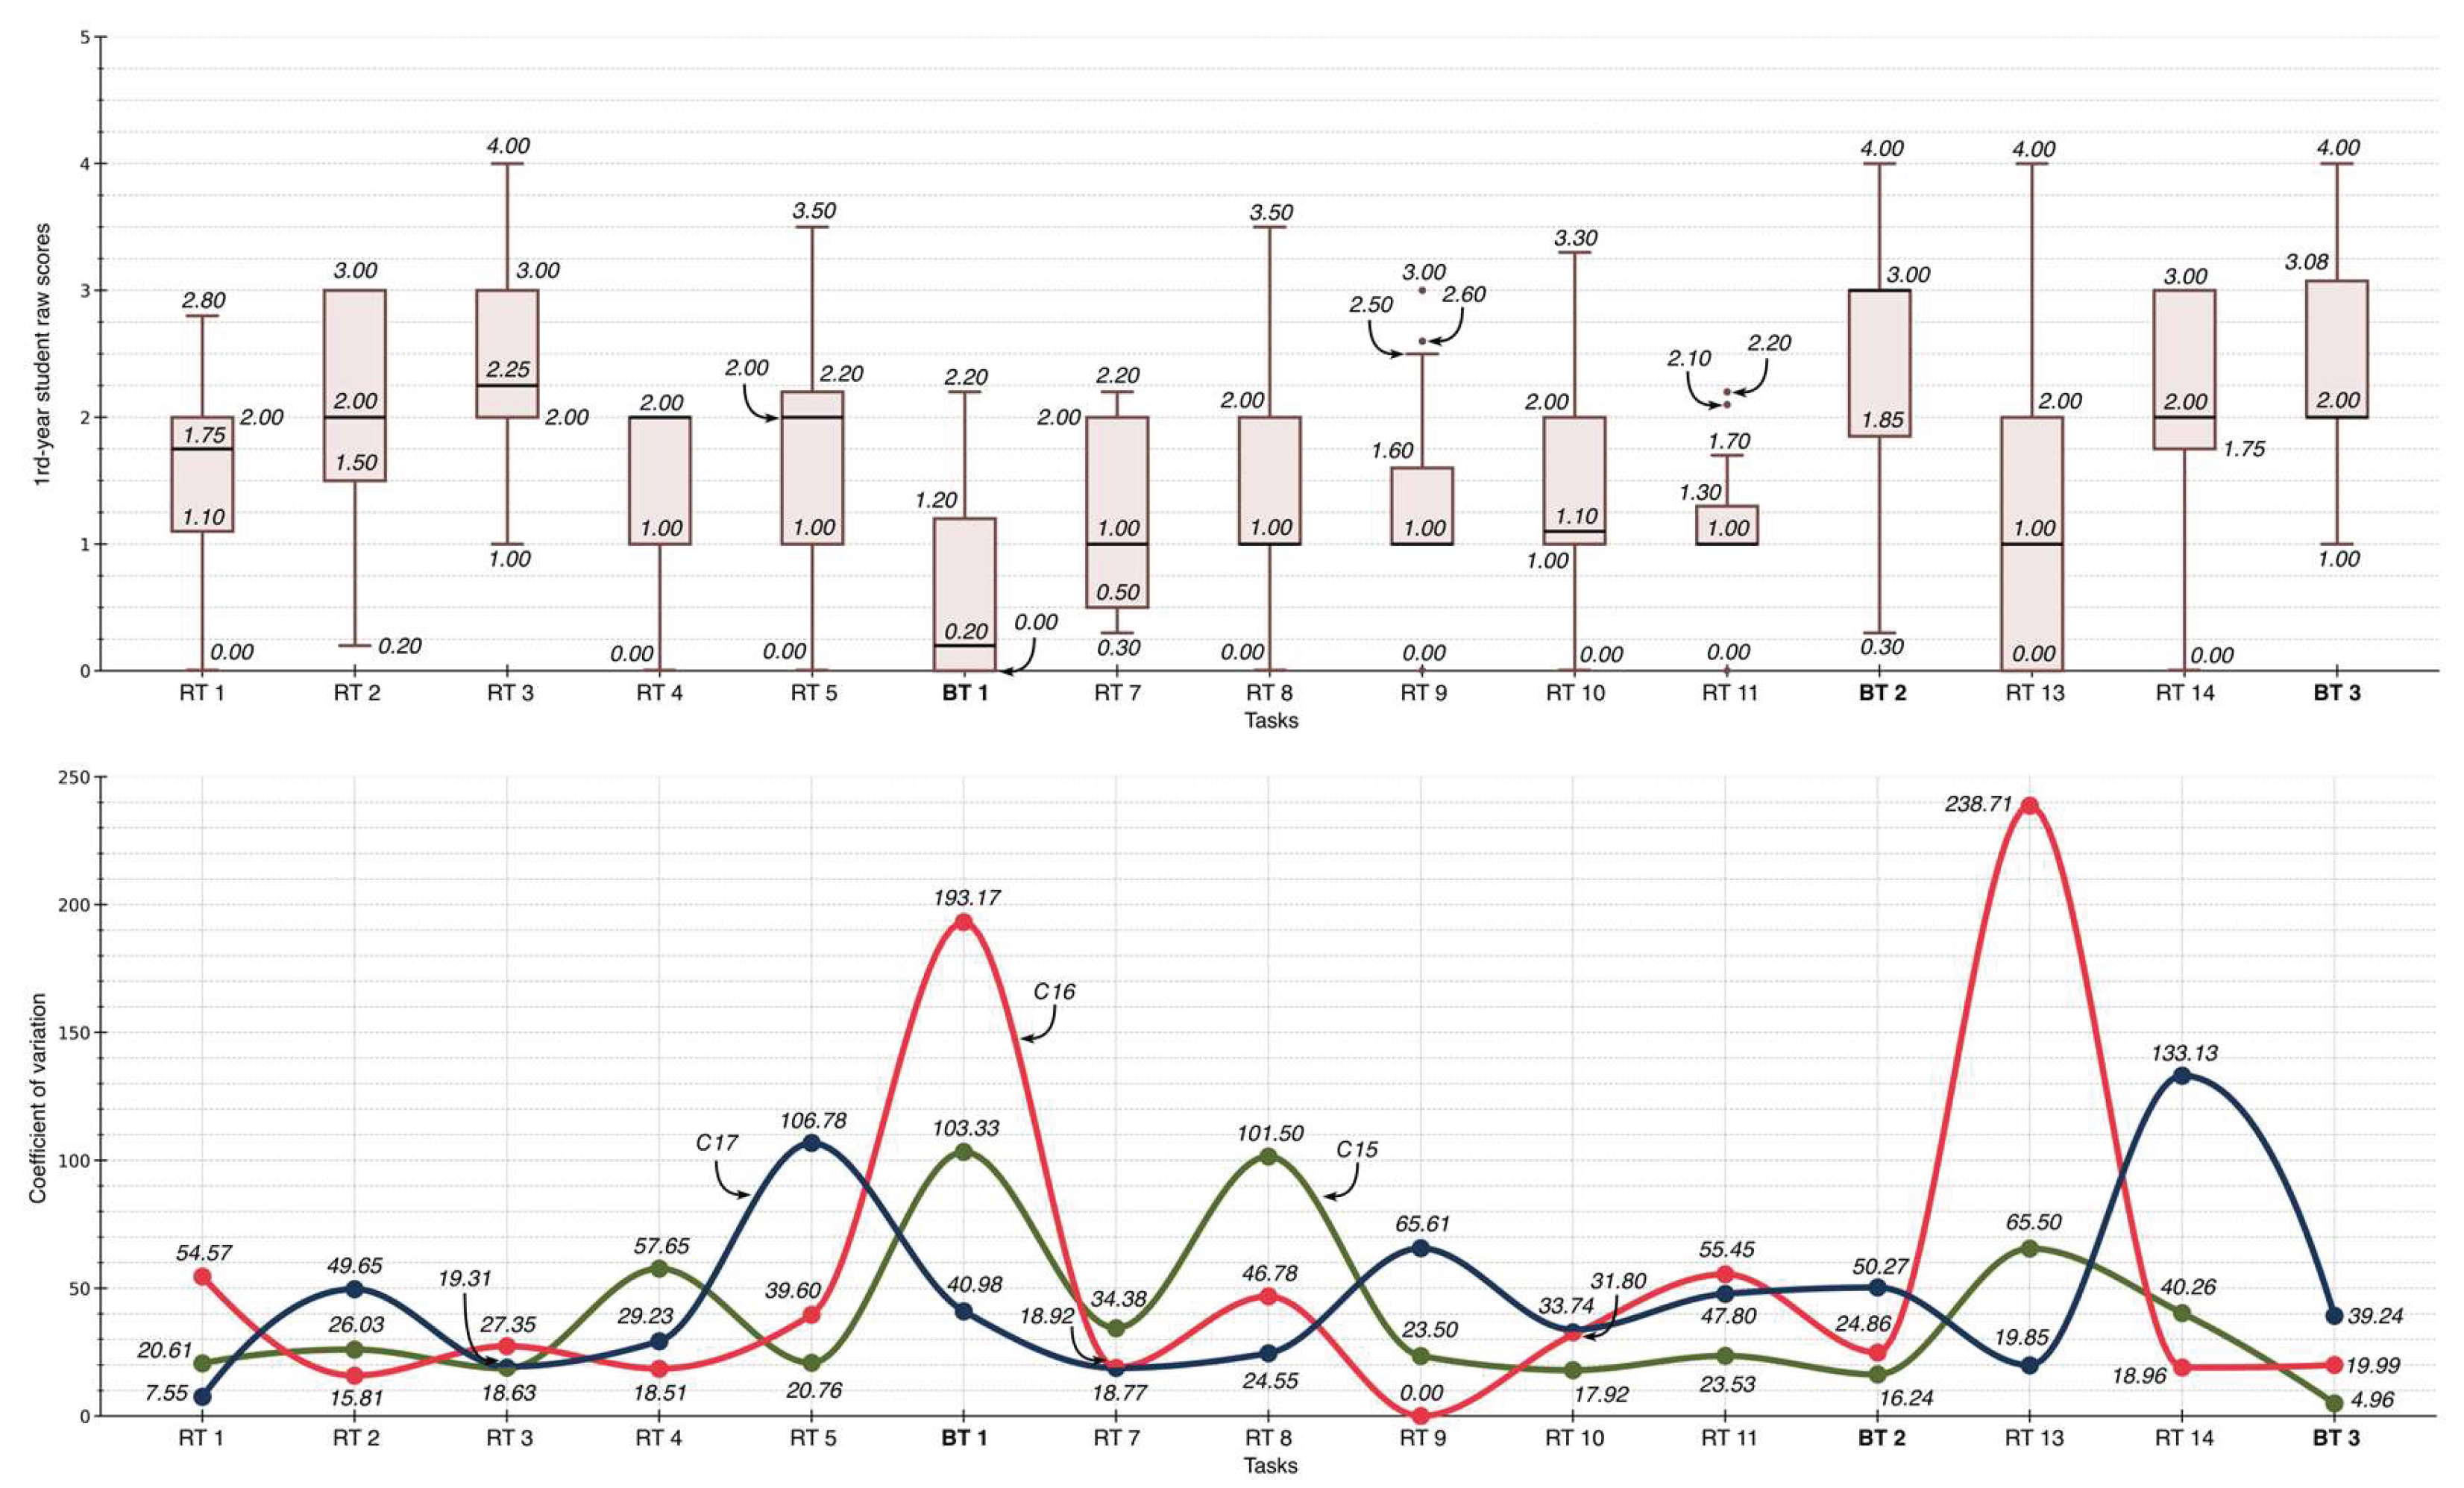
Figure 9.
Dynamics of individual results in the cluster of 3rd-year students from the 2026 cohort.
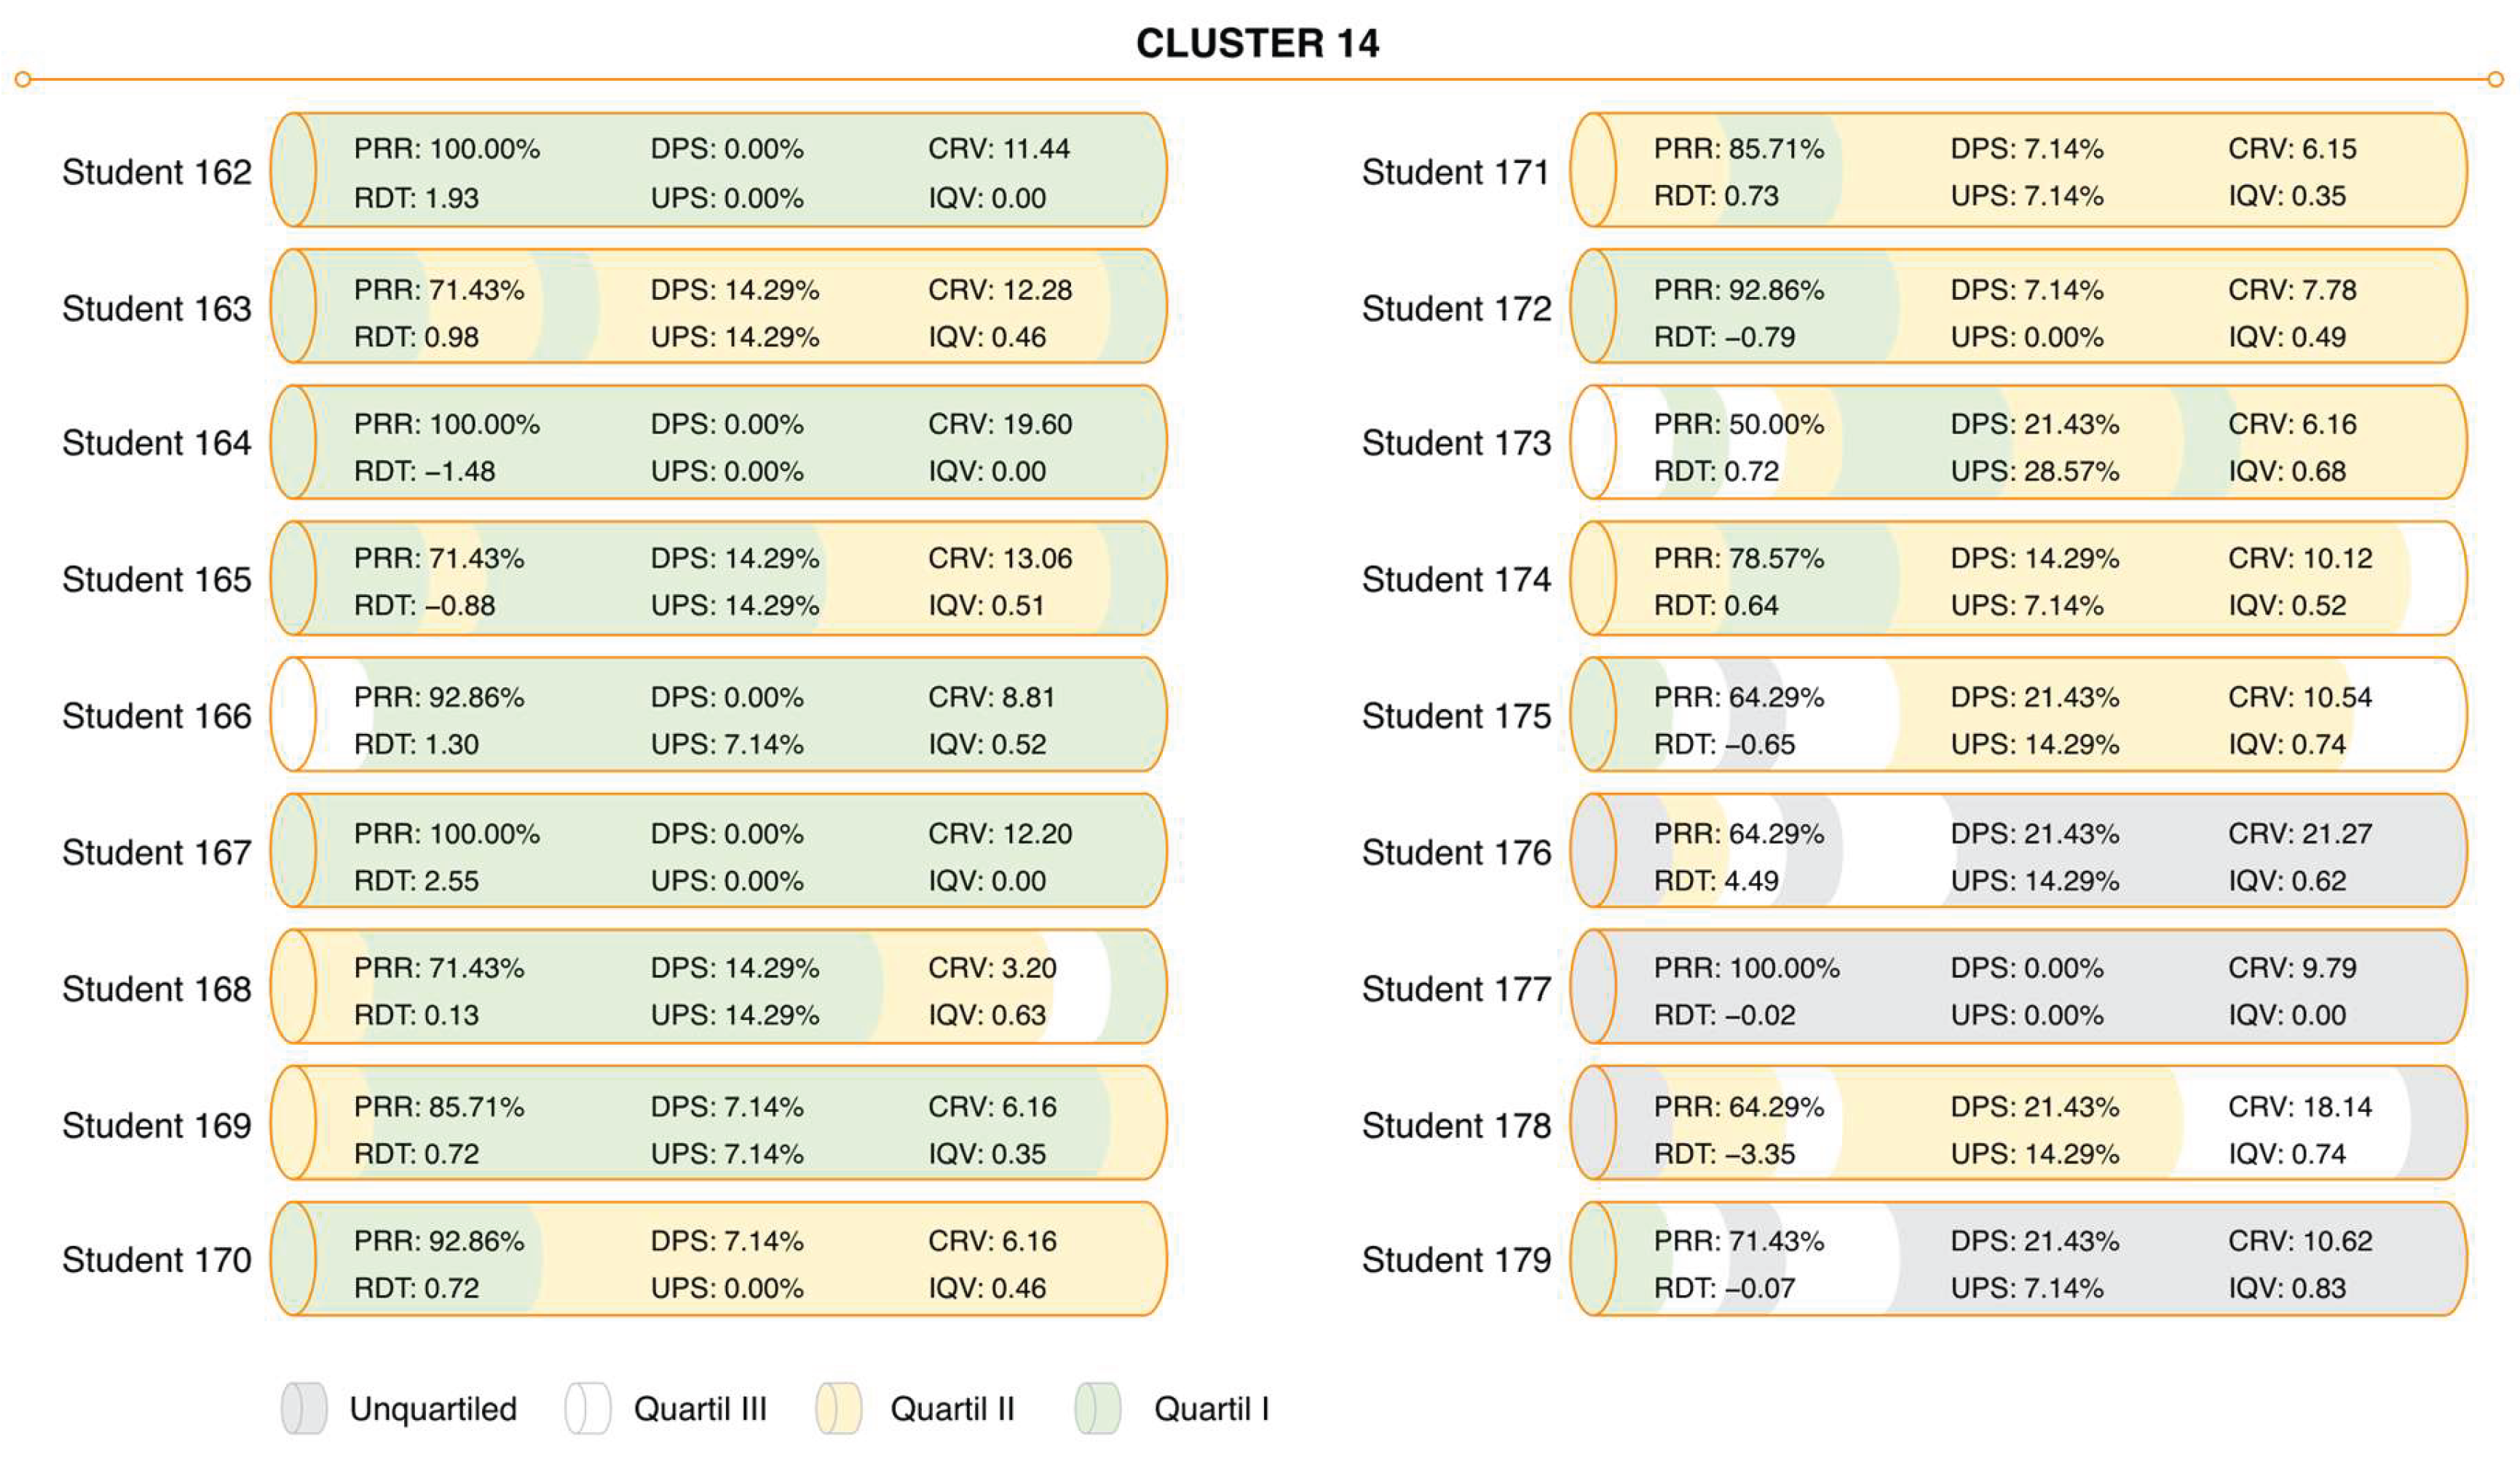
Figure 10.
Dynamics of individual results in the cluster of 1st year students from the 2026 cohort.
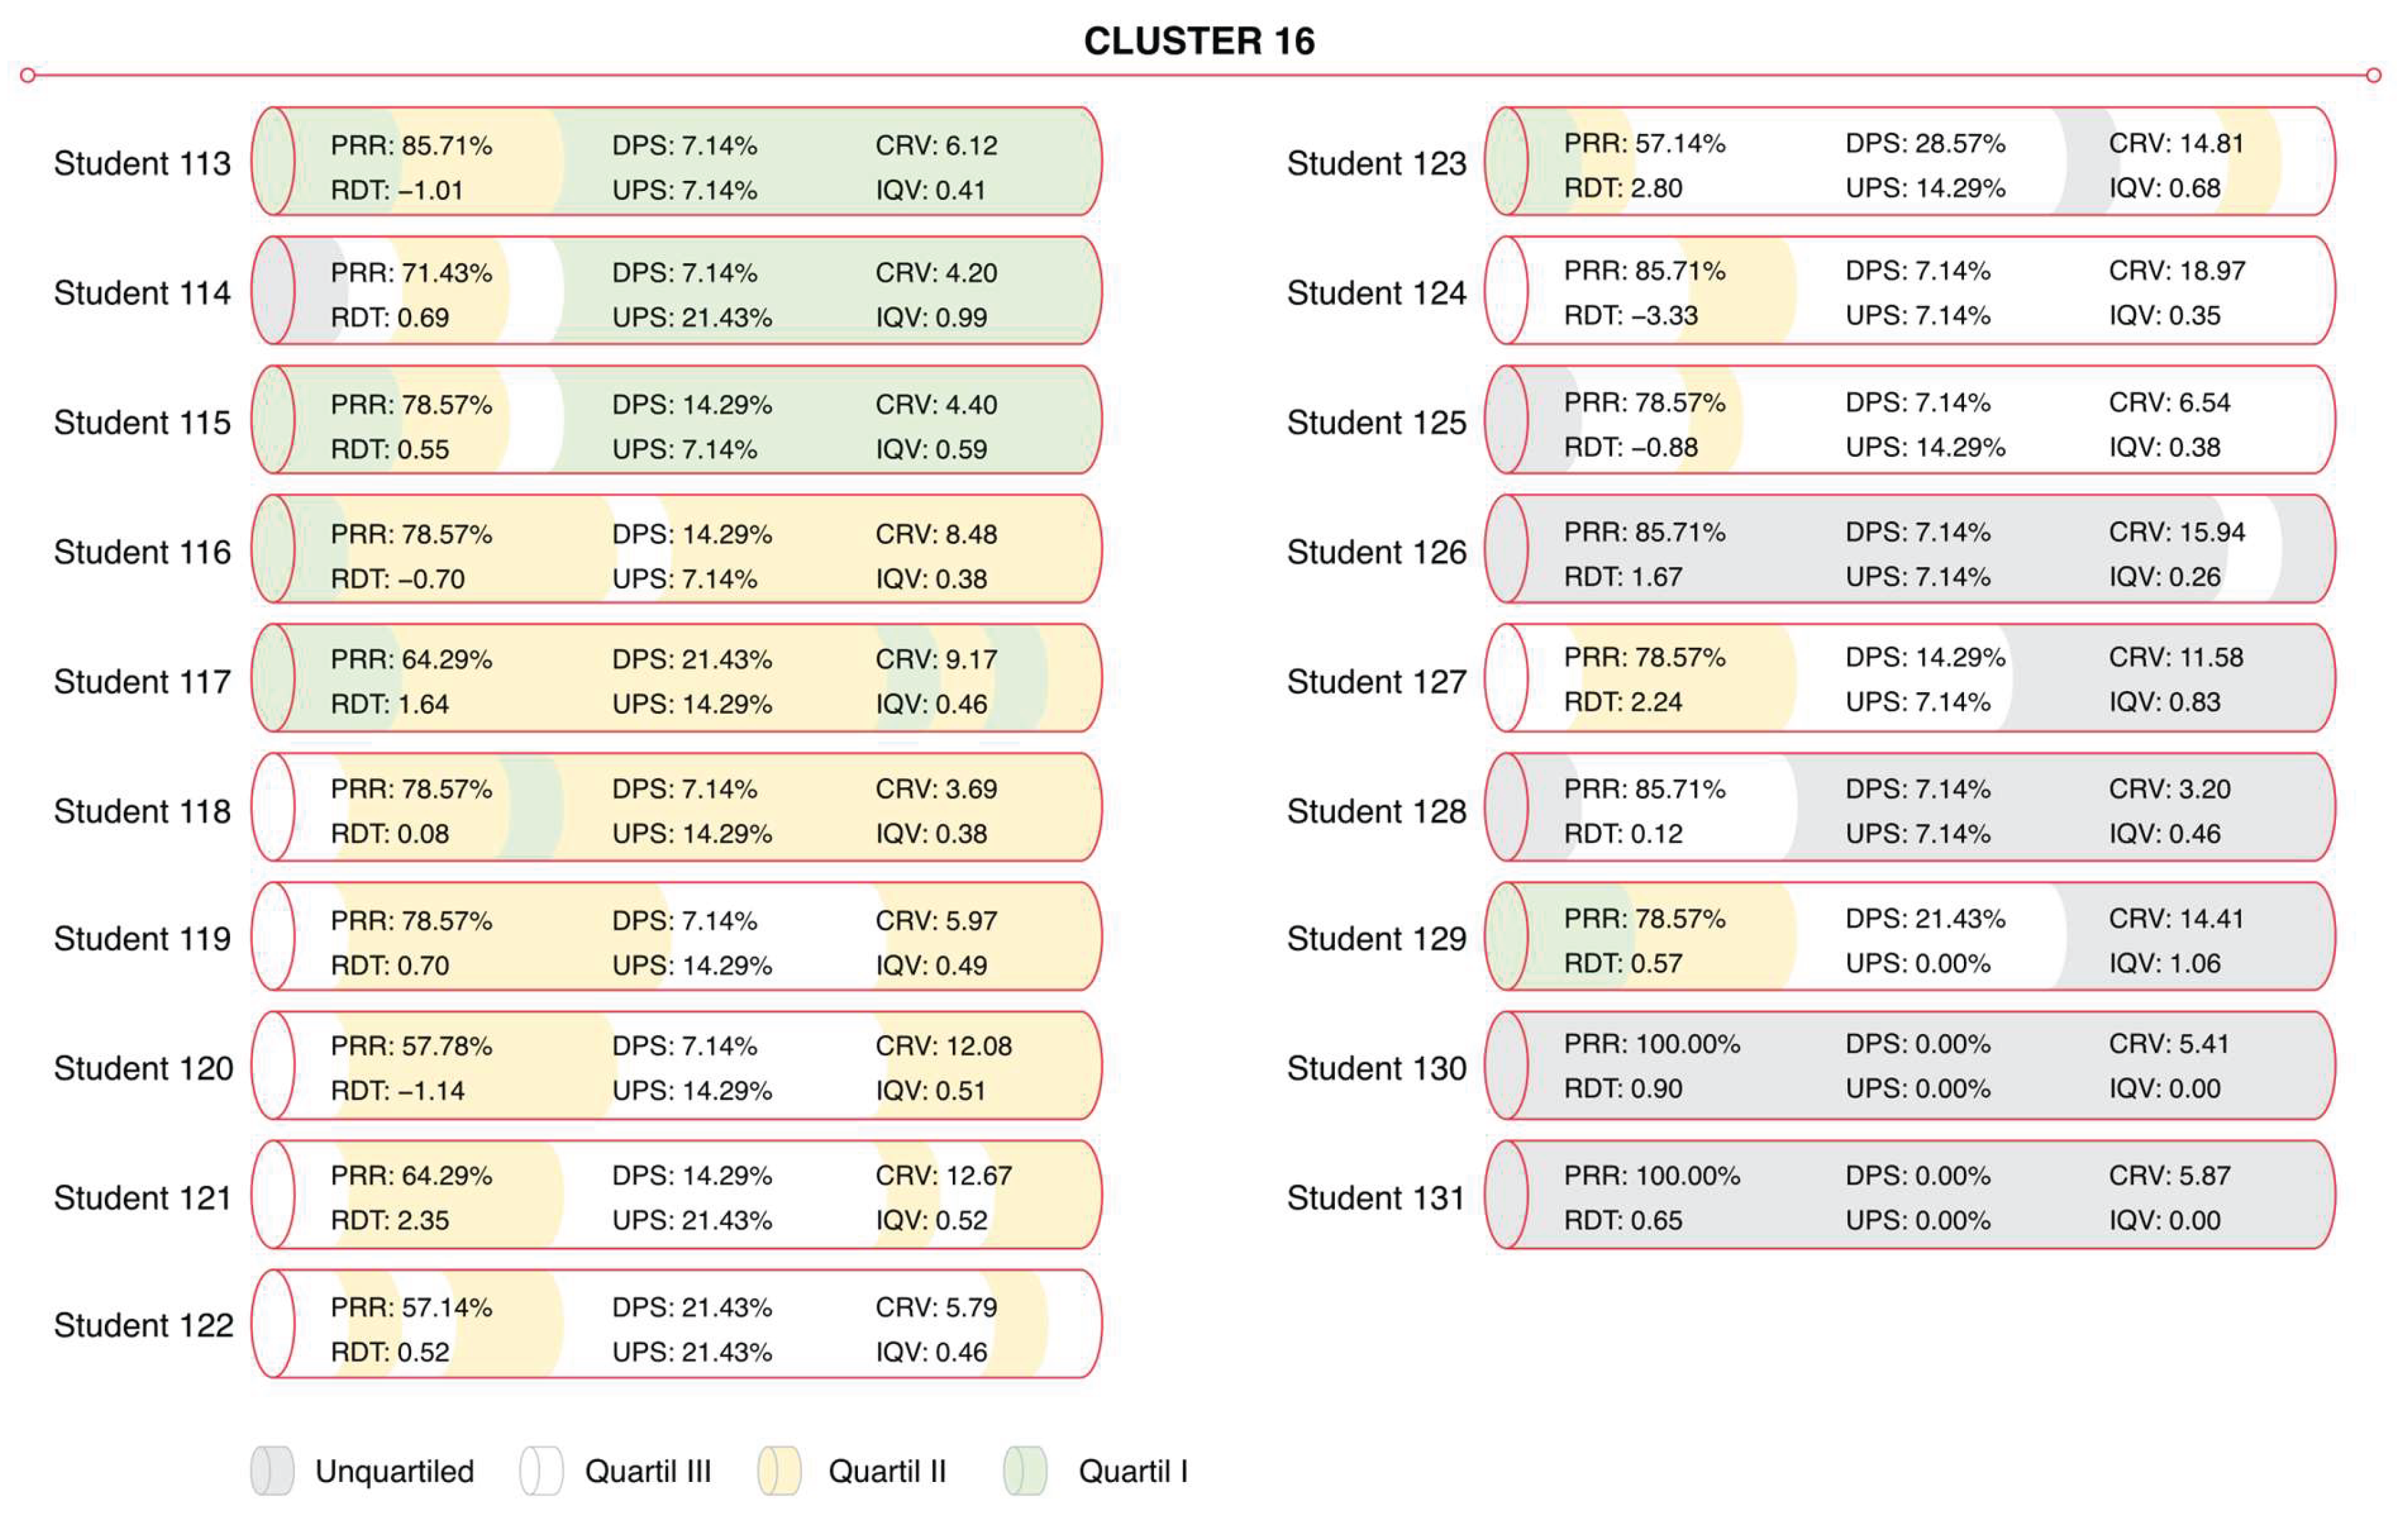
Figure 11.
Network Cooperation Matrix for 3rd-Year Students (Cluster 13) – Cohort of 2026.
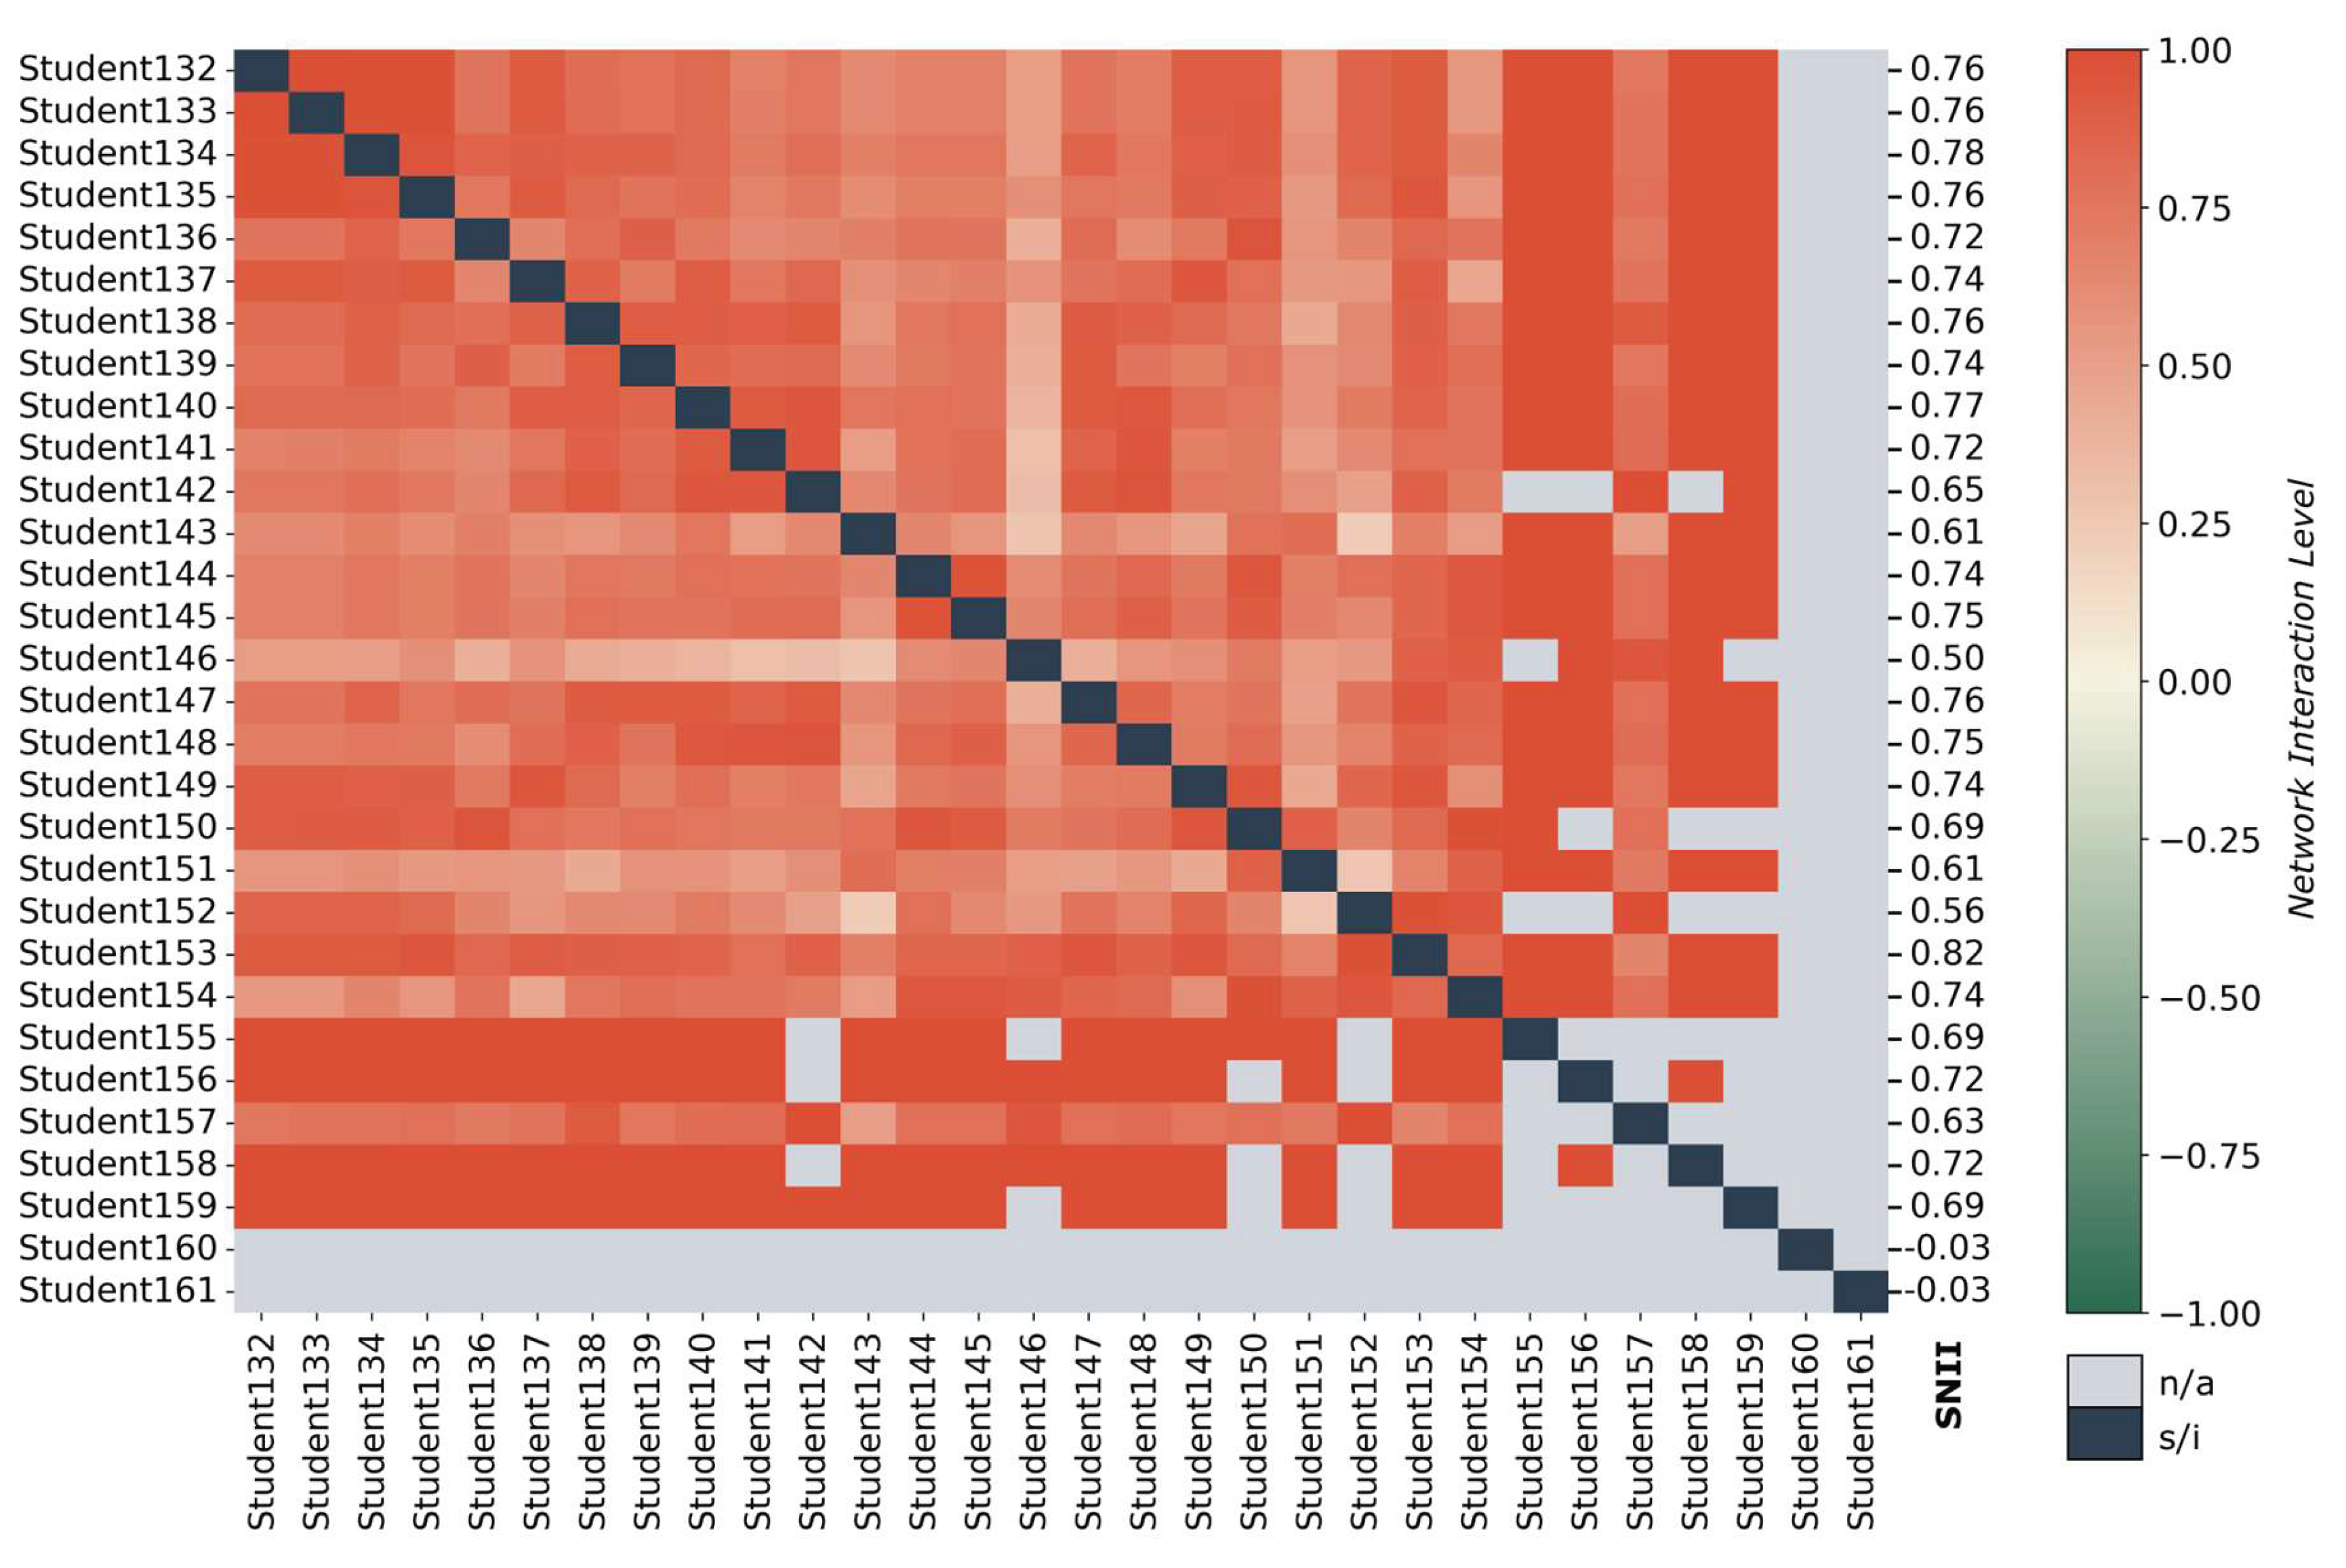
Figure 12.
General Network Interaction Matrix for First-Year Students (Cluster 15) from the Cohort of 2026.
Figure 12.
General Network Interaction Matrix for First-Year Students (Cluster 15) from the Cohort of 2026.
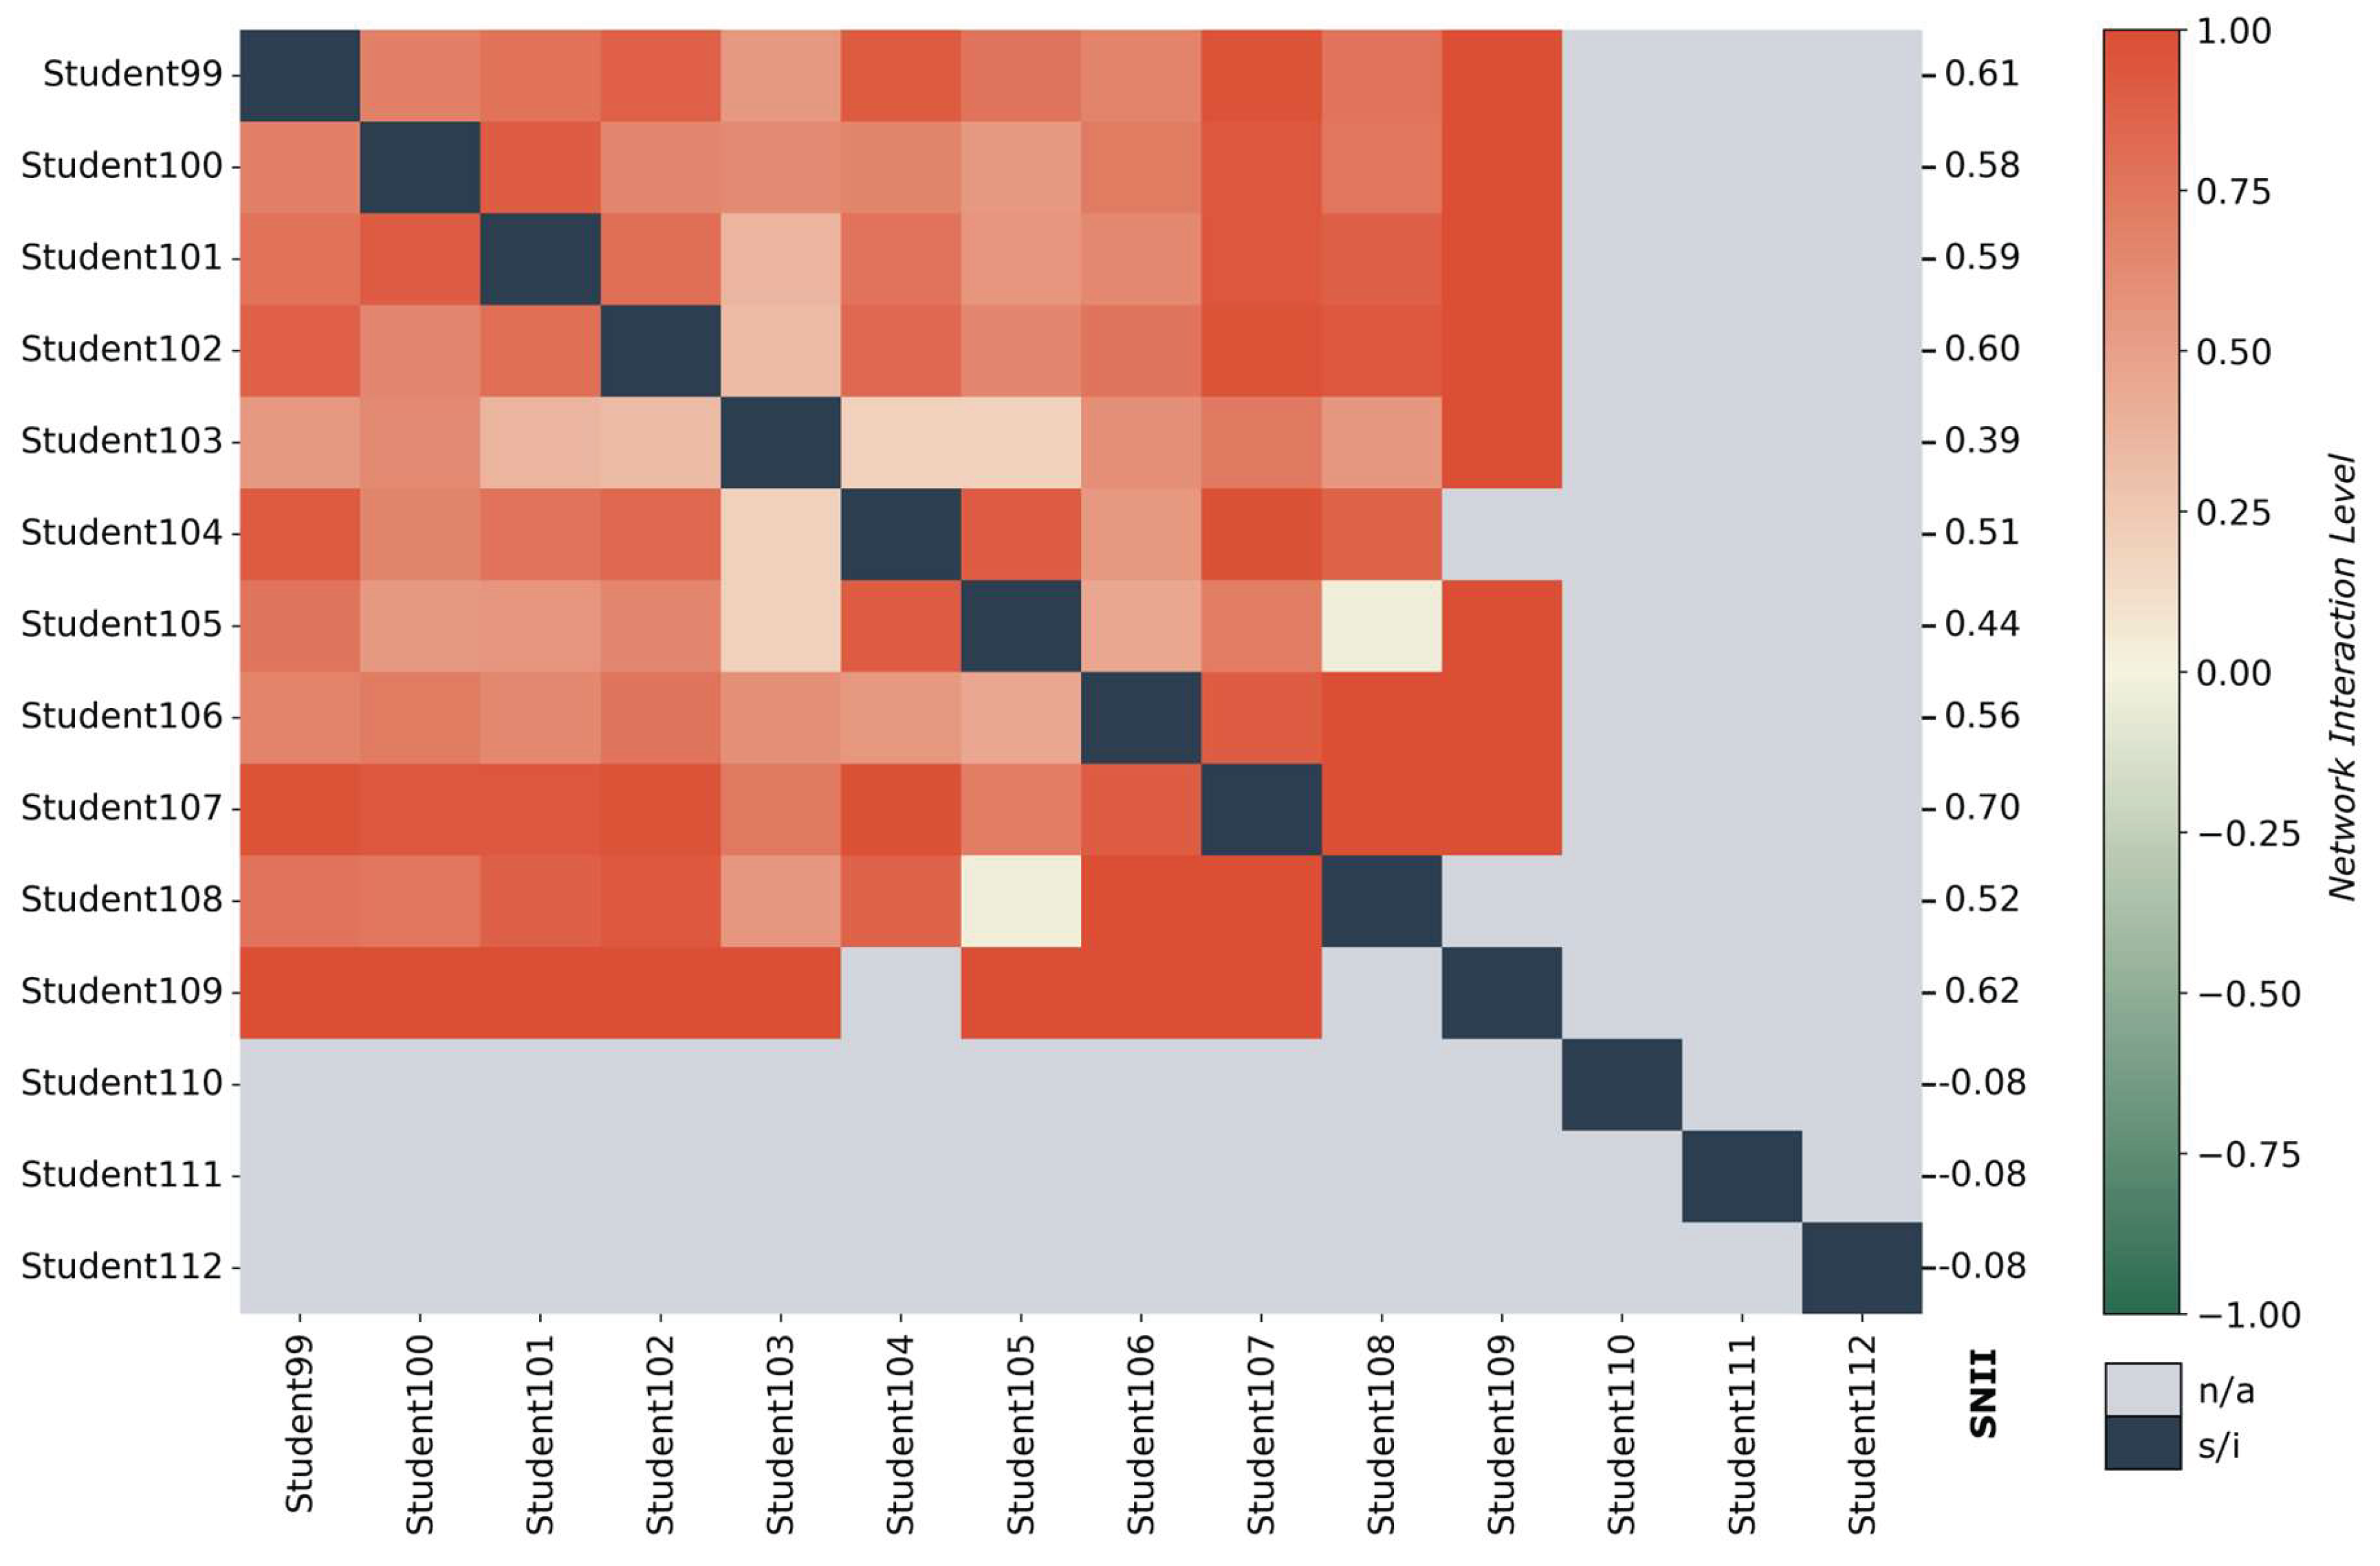
Figure 13.
Changes in SNII and its correlation with actual five-minute session results in third-year student clusters.
Figure 13.
Changes in SNII and its correlation with actual five-minute session results in third-year student clusters.
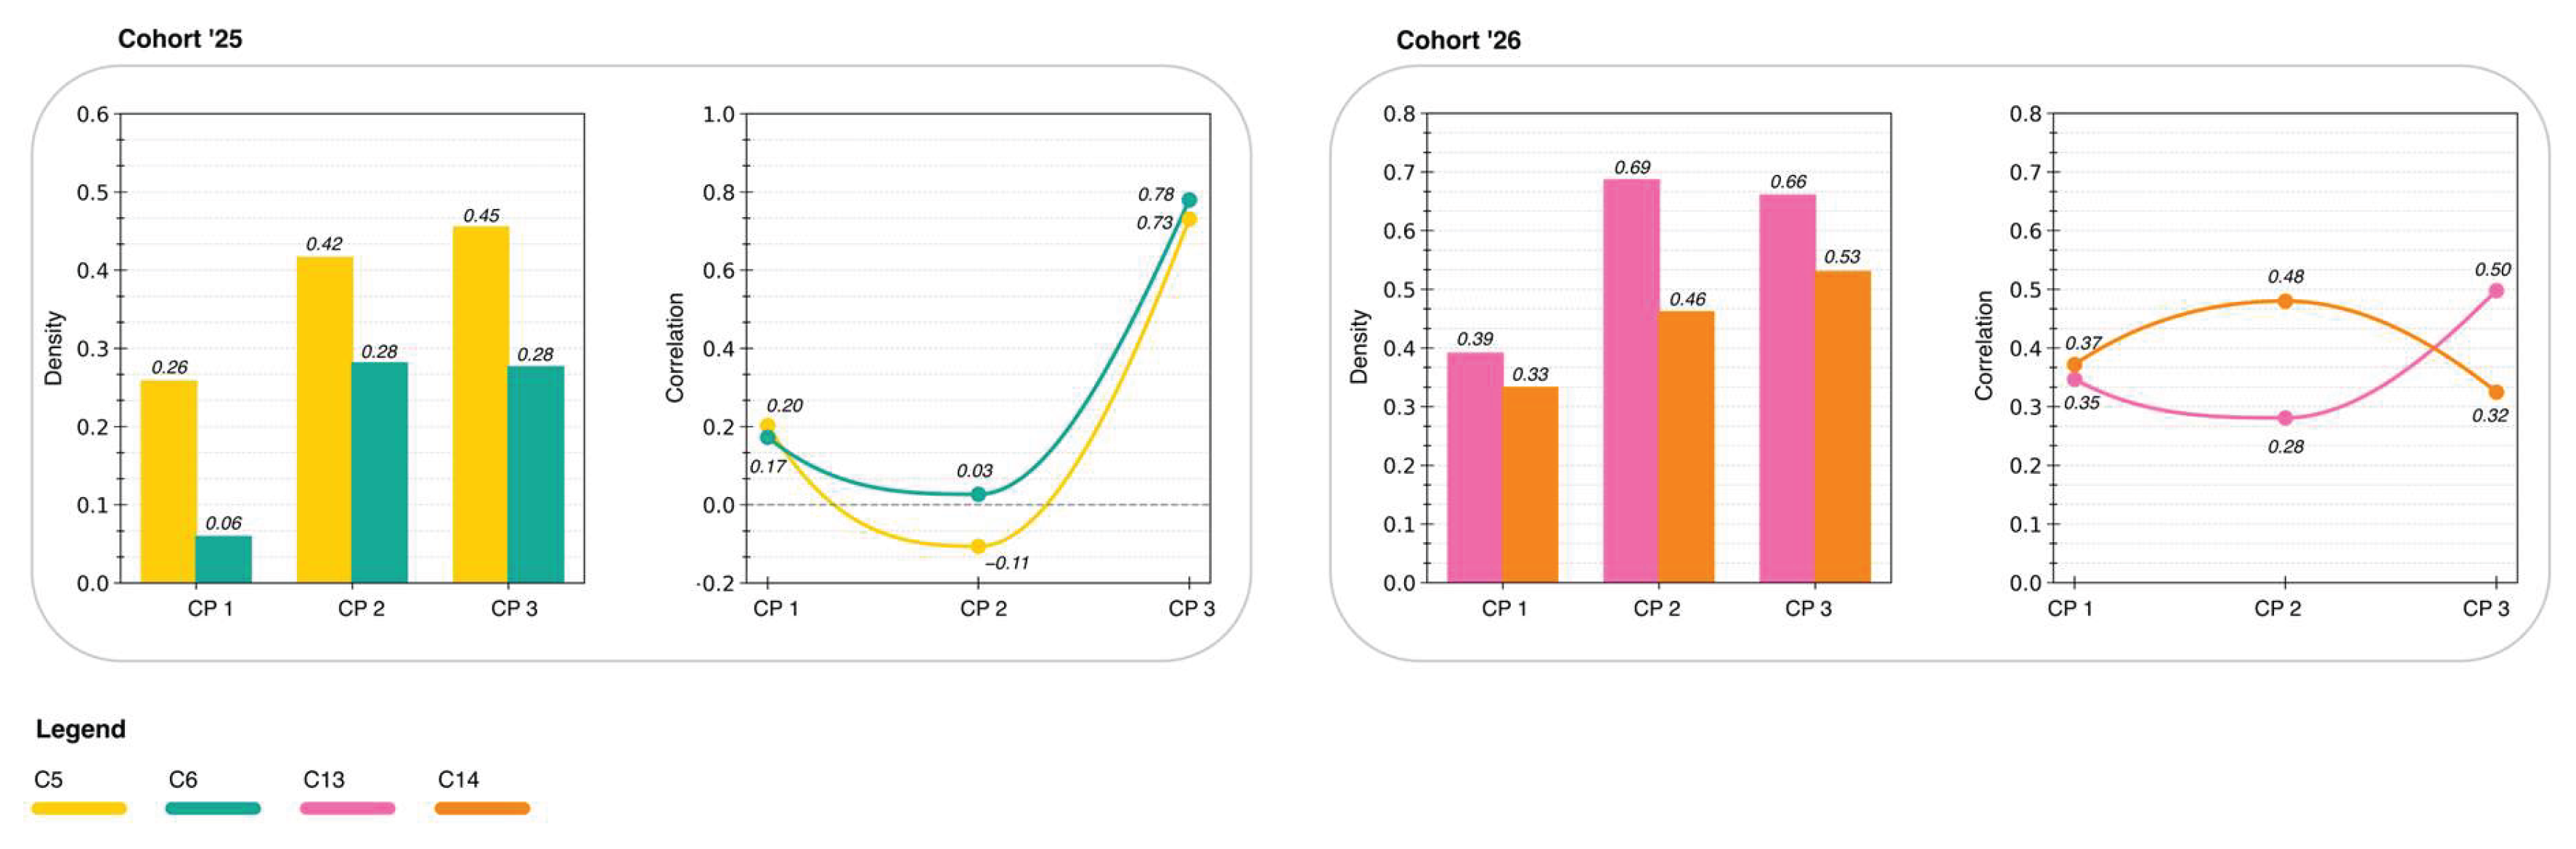
Figure 14.
Changes in SNII and its correlation with actual five-minute session results in first-year student clusters.
Figure 14.
Changes in SNII and its correlation with actual five-minute session results in first-year student clusters.
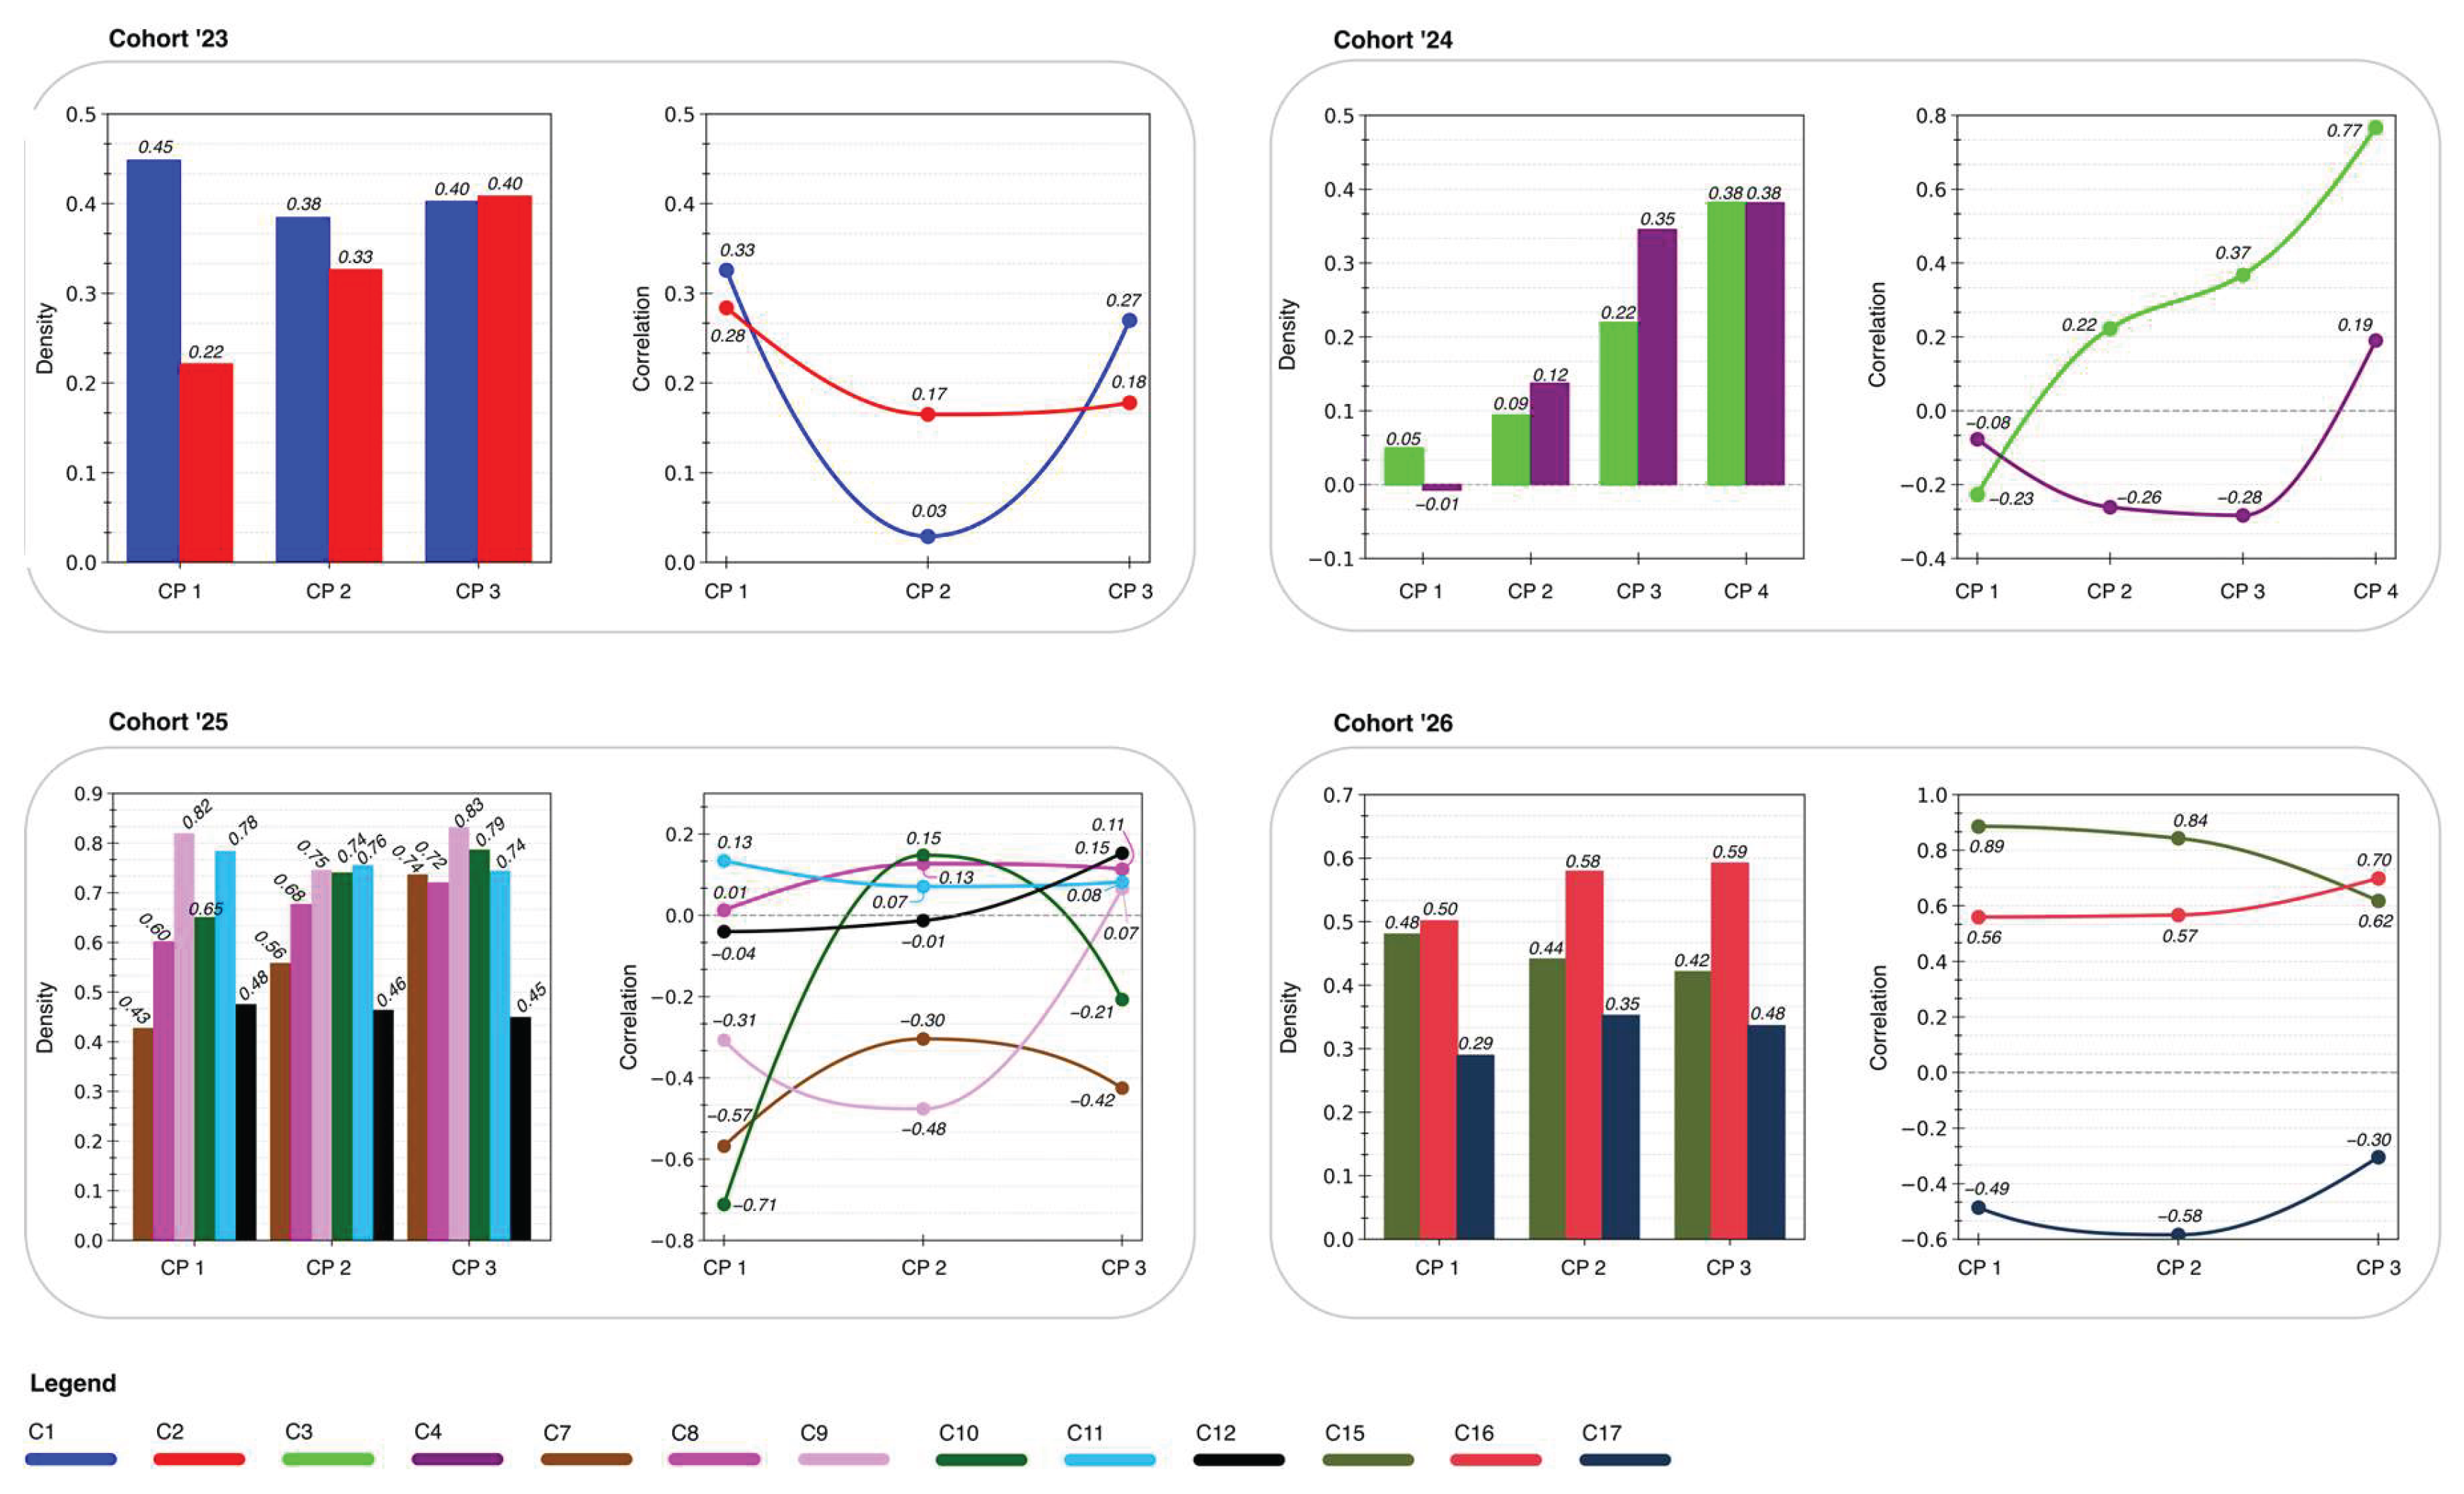
Figure 15.
Quartile I structure for the cohorts under study (2023–2026).
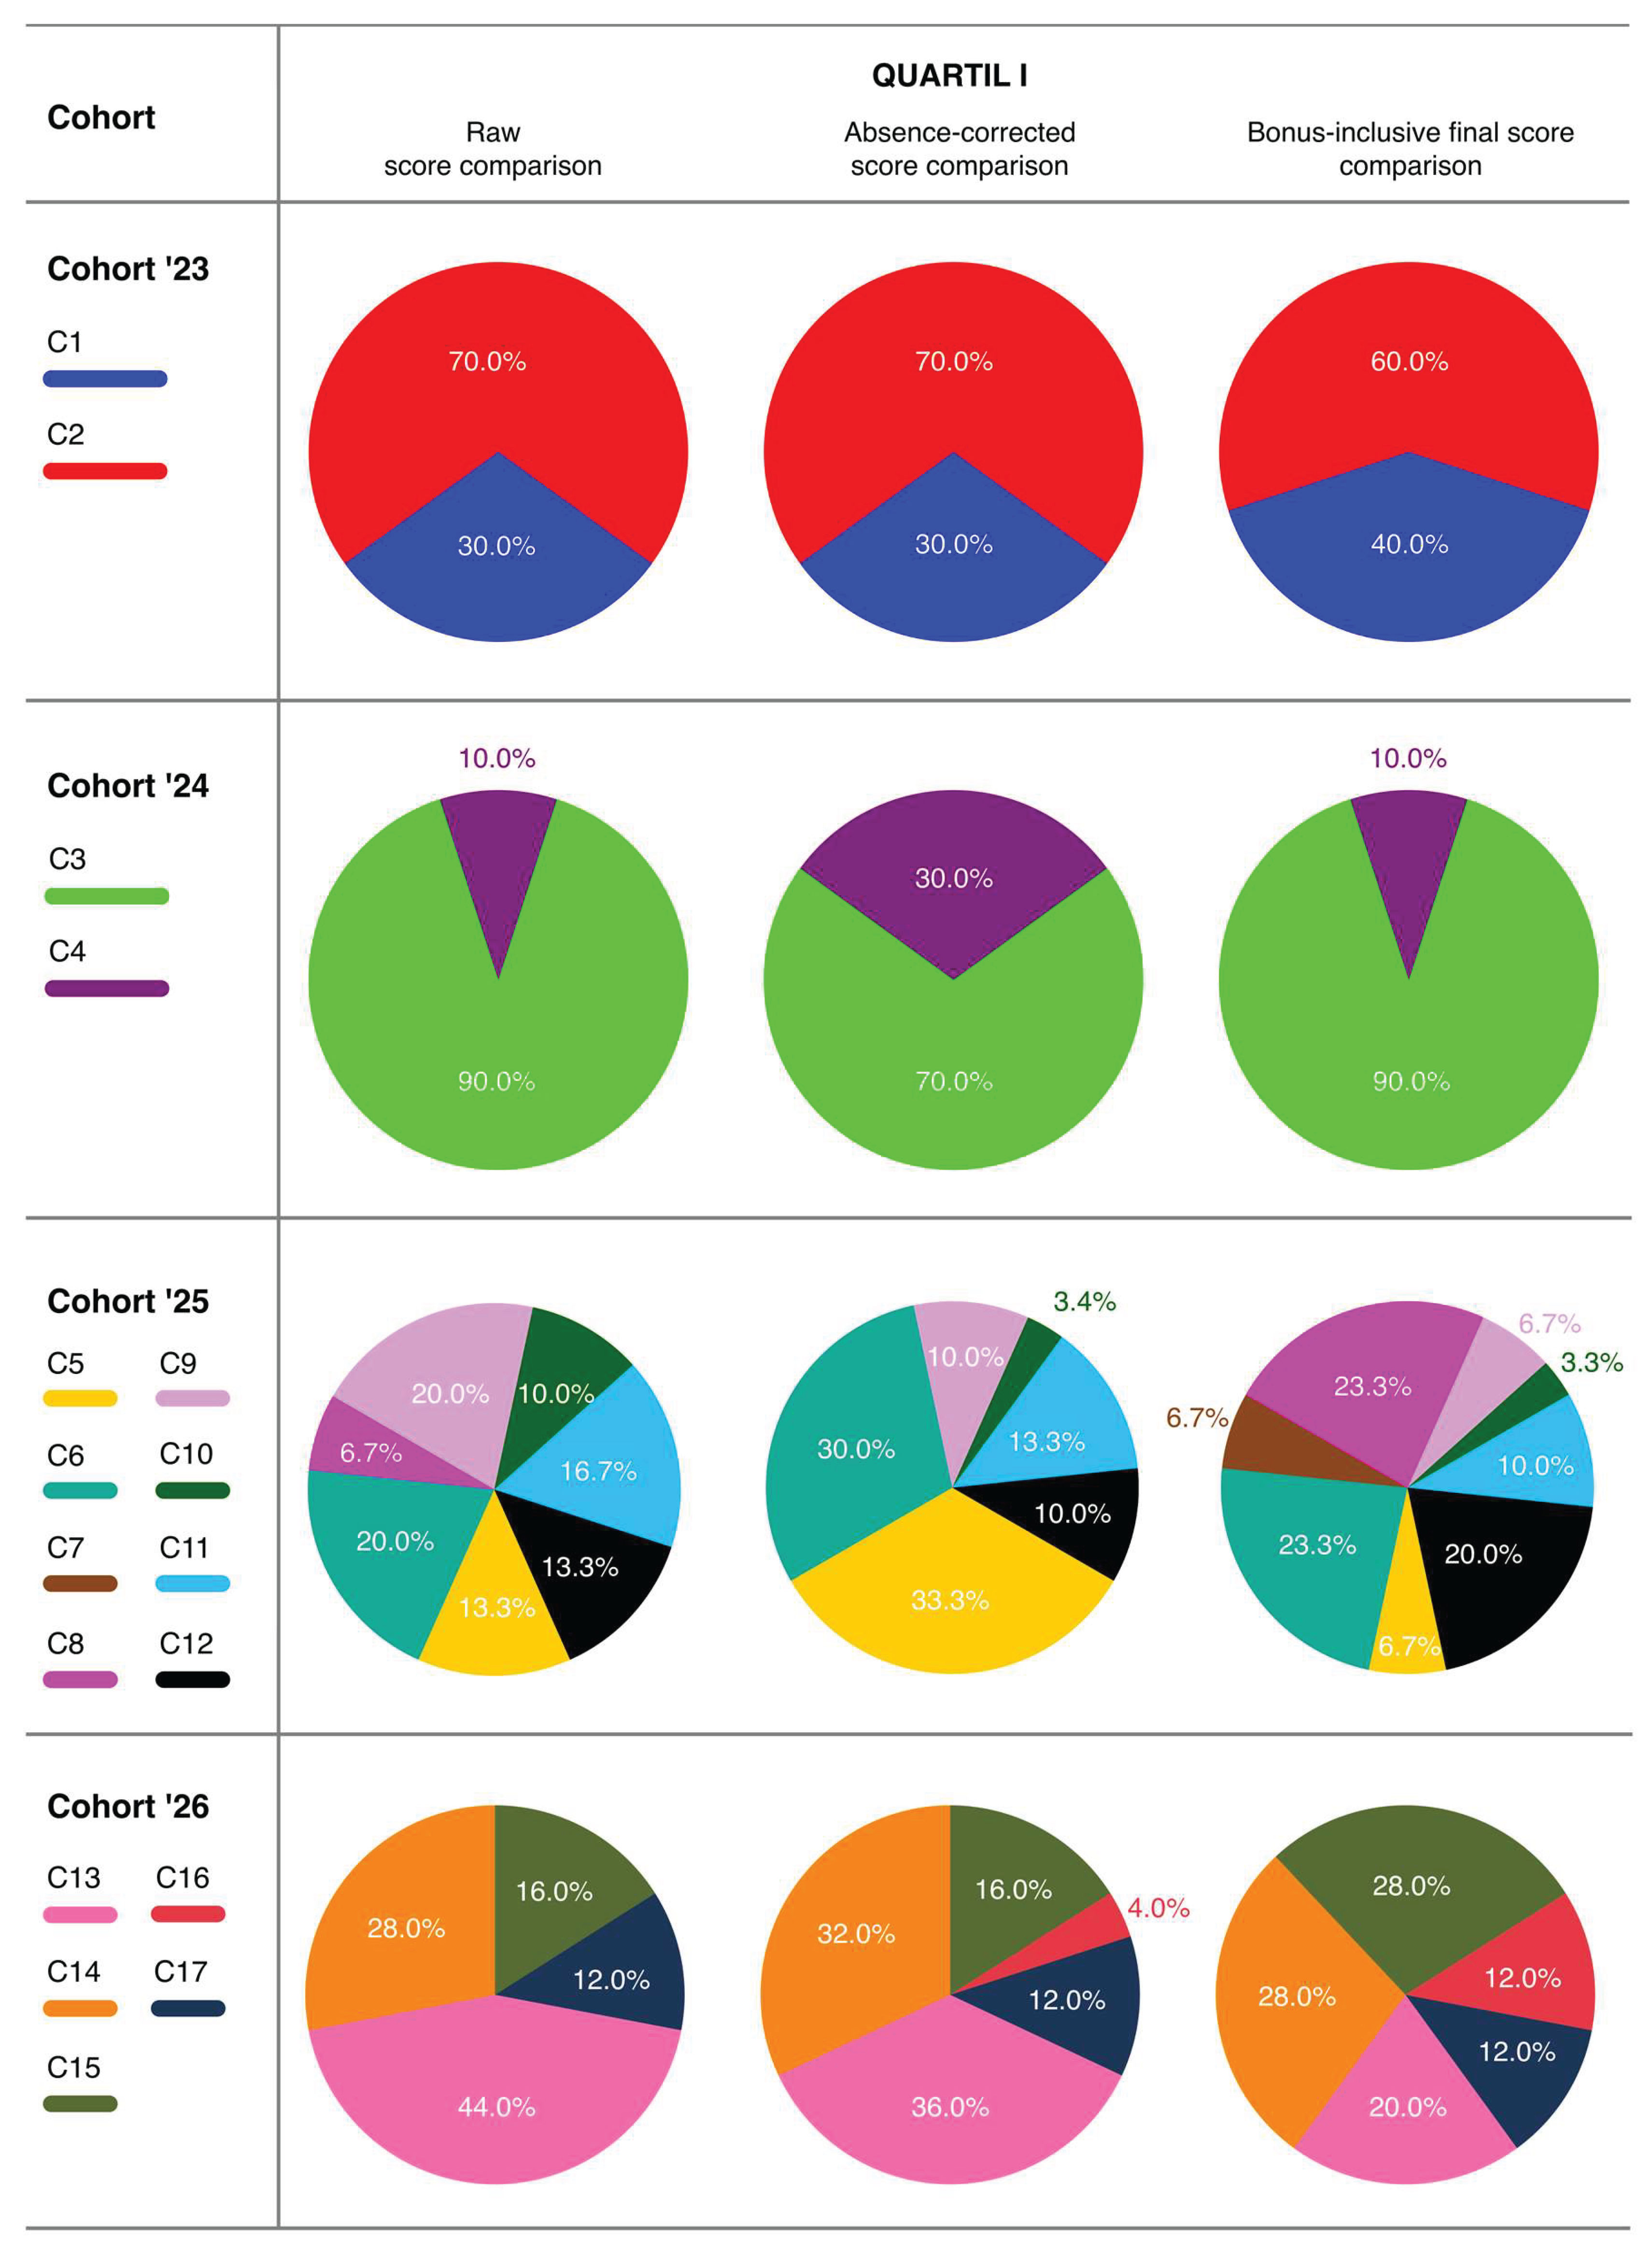
Figure 16.
Scatter plots of ranking positions versus bonus points earned for first-year students (2023–2024 cohorts).
Figure 16.
Scatter plots of ranking positions versus bonus points earned for first-year students (2023–2024 cohorts).
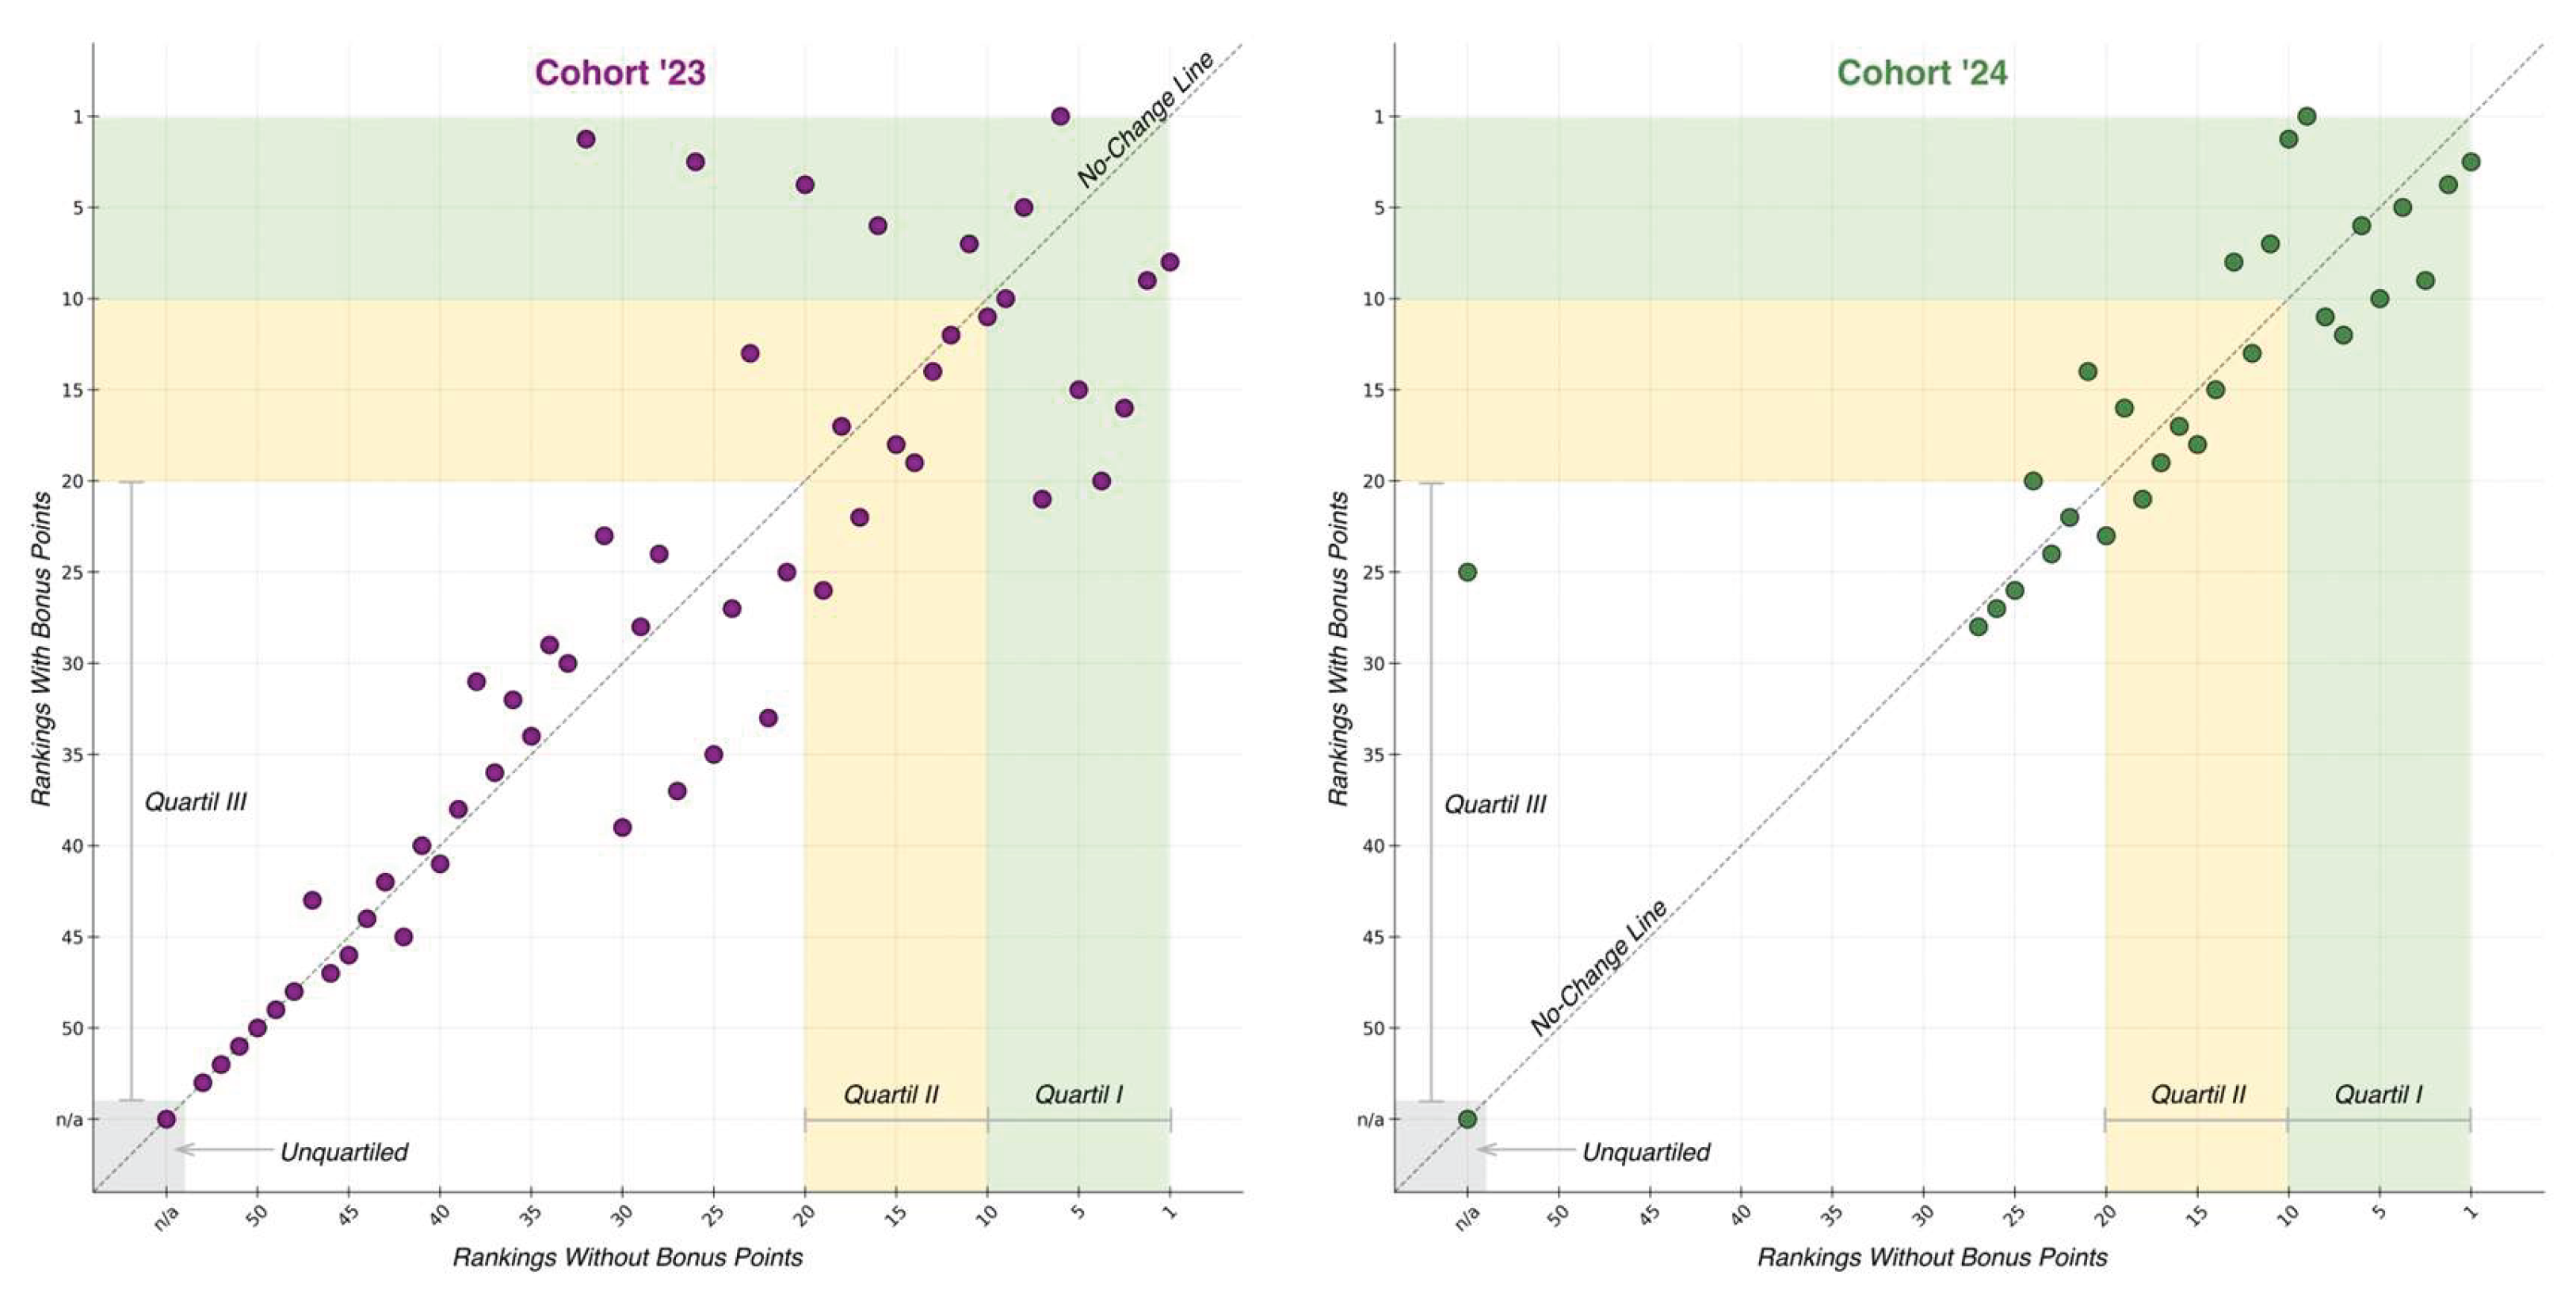
Figure 17.
Scatter plots of ranking positions versus bonus points earned for students in the 2025–2026 cohorts.
Figure 17.
Scatter plots of ranking positions versus bonus points earned for students in the 2025–2026 cohorts.
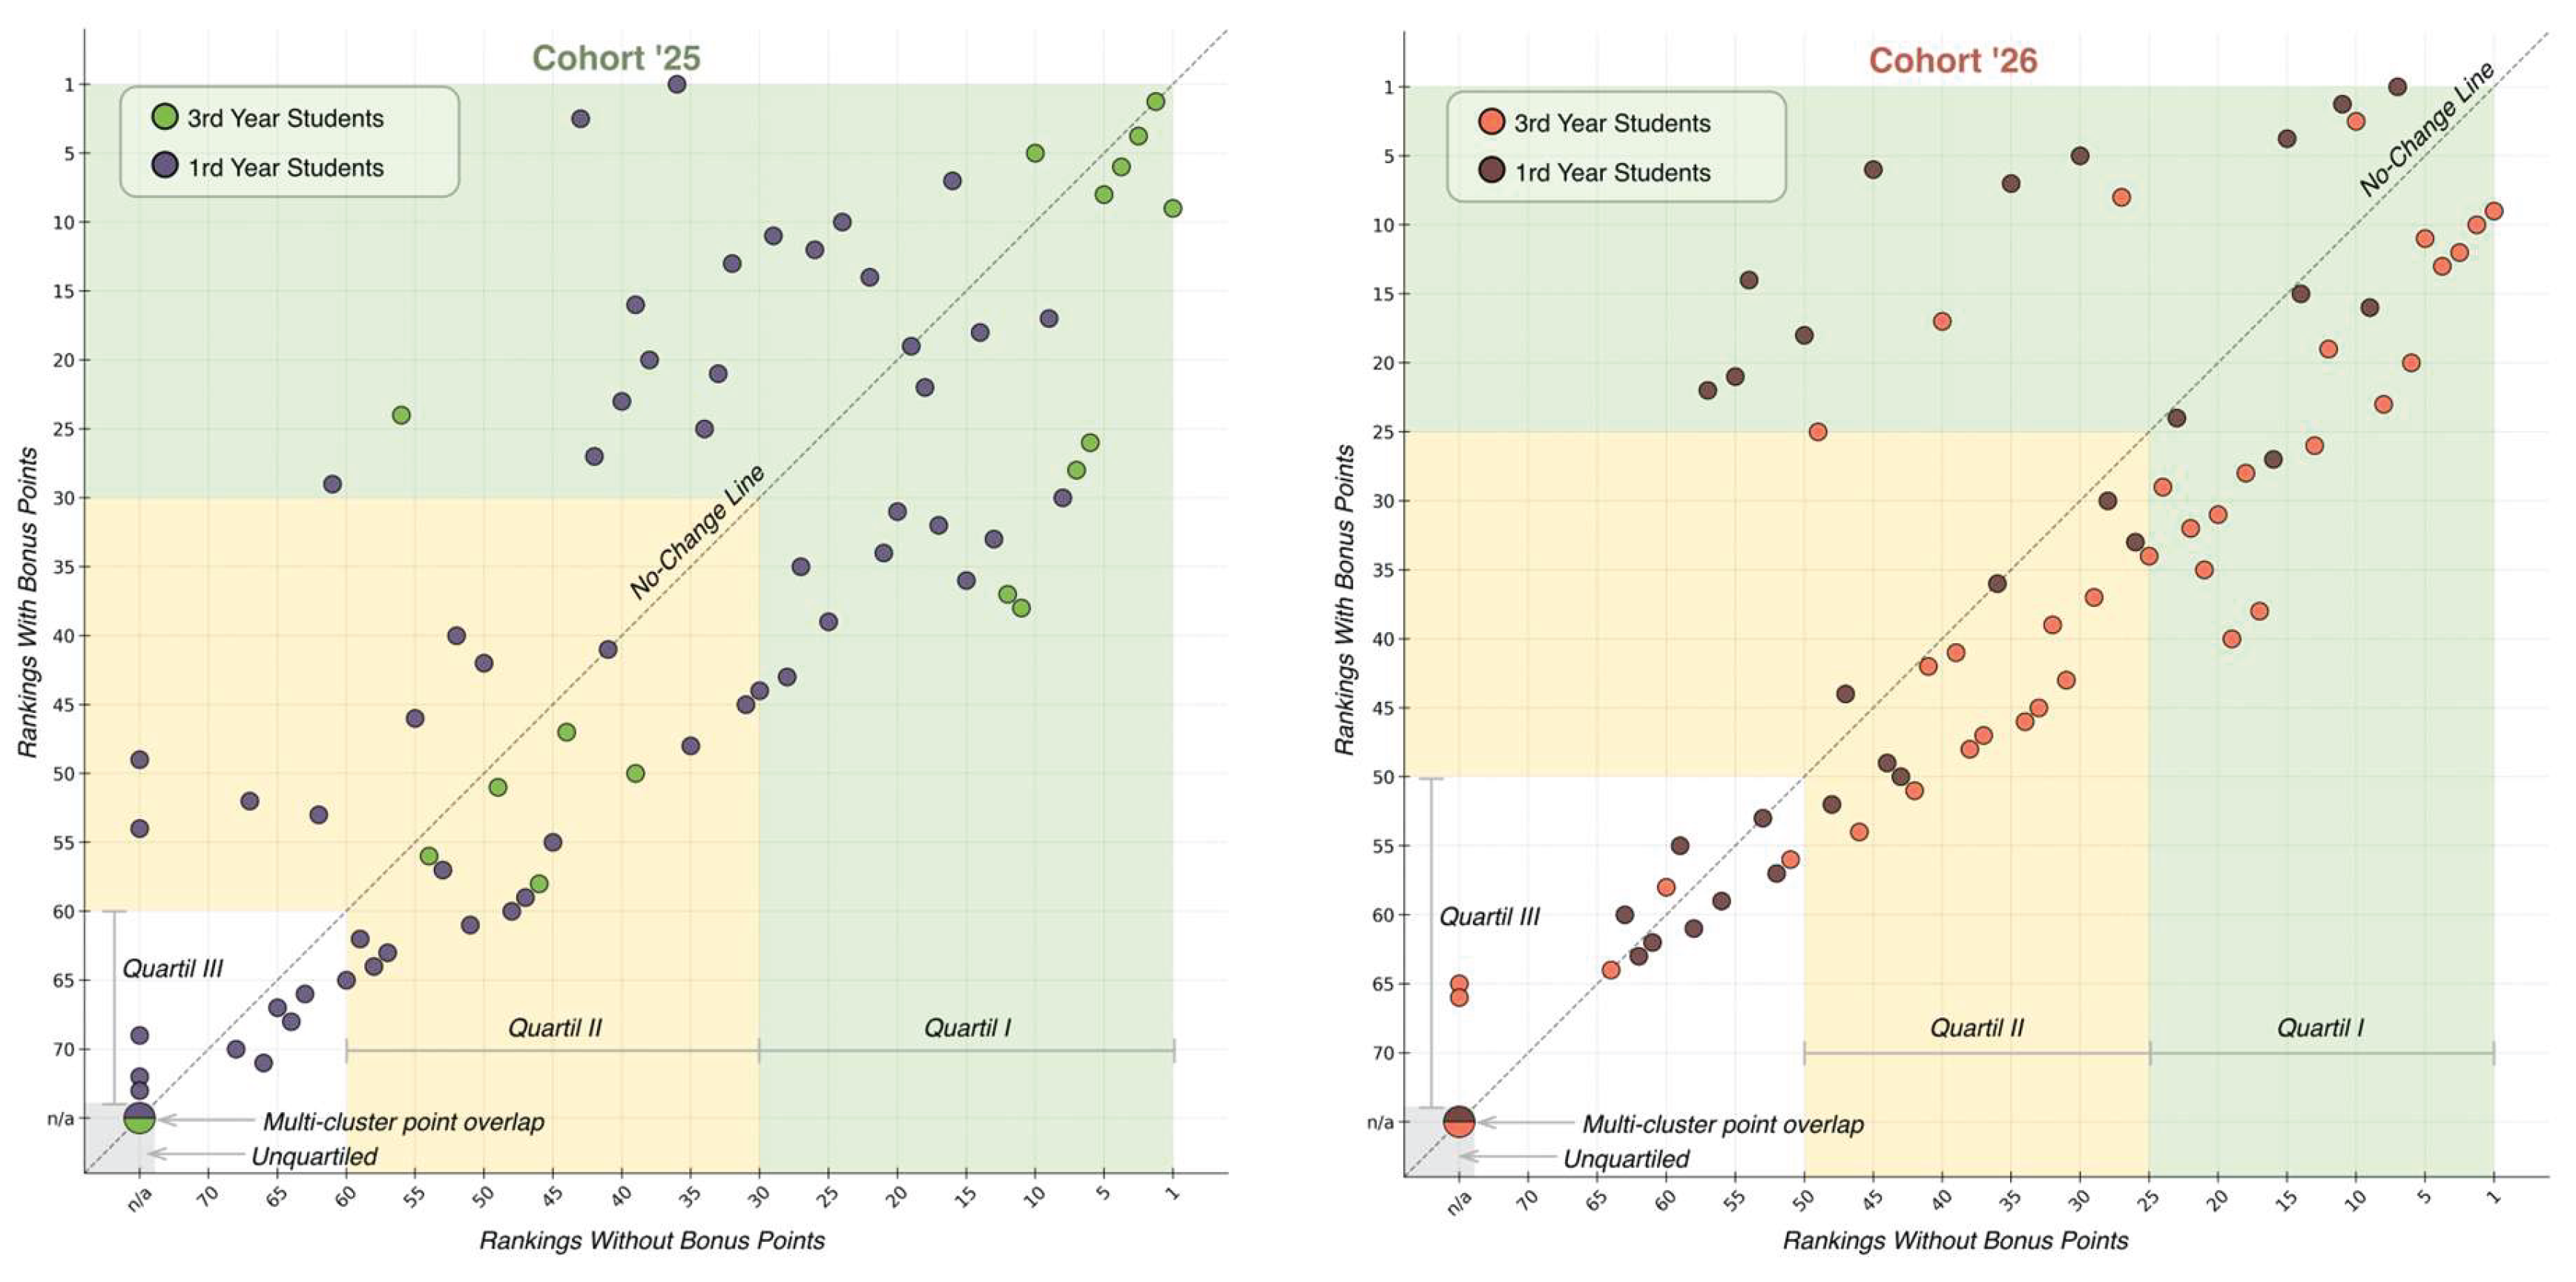
Disclaimer/Publisher’s Note: The statements, opinions and data contained in all publications are solely those of the individual author(s) and contributor(s) and not of MDPI and/or the editor(s). MDPI and/or the editor(s) disclaim responsibility for any injury to people or property resulting from any ideas, methods, instructions or products referred to in the content. |
© 2026 by the authors. Licensee MDPI, Basel, Switzerland. This article is an open access article distributed under the terms and conditions of the Creative Commons Attribution (CC BY) license (http://creativecommons.org/licenses/by/4.0/).
Copyright: This open access article is published under a Creative Commons CC BY 4.0 license, which permit the free download, distribution, and reuse, provided that the author and preprint are cited in any reuse.