

Submitted:
13 September 2026
Posted:
15 September 2026
You are already at the latest version
Abstract
Background/Objectives: Degenerative lumbar spondylolisthesis is first assessed on standing lateral radiographs, yet the slip is still measured in millimeters or graded semi-quantitatively, both dependent on magnification, calibration and reader experience. We introduce quadrilateral segmental analysis (QSA), a calibration-free geometric method for detecting anterolisthesis. Methods: In 50 patients from the PROGRES cohort, a blinded observer drew the L1–S1 superior endplate lines on standing radiographs; an automated pipeline computed the diagonal ratio K for each quadrilateral formed by adjacent lines. The reference standard was adjudicated two-radiologist classification (κ = 0.916). After excluding 90 retrolisthetic segments, 160 segments were analyzed by receiver operating characteristic analysis with patient-cluster bootstrap, a 61-threshold sweep of K and cross-validated logistic models. Results: Anterolisthesis was present in 54 segments (33.8%). K discriminated well (area under the curve [AUC] 0.892, 95% CI 0.841–0.937): K ≤ 0.85 confirmed a slip (specificity 99.1%, positive predictive value [PPV] 96.0%) and K > 0.95 excluded it (sensitivity 100%, negative predictive value [NPV] 100%). Rounded to one decimal, K defined three tiers that classified 46.9% of segments without error (K < 0.9: PPV 100%; K = 1.0: NPV 100%). Conclusions: Quadrilateral segmental analysis (QSA) converts vertebral translation into an angular signature readable from a single standing lateral radiograph without calibration. K (the diagonal ratio) translates the radiologist's assessment of anterolisthesis into a single number. QSA is simple enough for routine reporting and fully automatable. Reliability testing, external validation and extension to dynamic image pairs are the next steps.
Keywords:
quadrilateral segmental analysis (QSA)
; degenerative spondylolisthesis
; anterolisthesis
; segmental instability
; standing radiography
; diagnostic accuracy
; quantitative imaging
; lumbar spine
1. Introduction
Degenerative lumbar spondylolisthesis is common in adults over 50 years of age and is associated with low back pain and neurogenic claudication [1,2,3,4]. The choice between conservative care, decompression alone and decompression with fusion is guided in part by whether — and how confidently — the slip is detected [5,6,7,8].
In routine practice, however, the slip is still judged visually or against millimeter thresholds — typically ≥3 mm [4,9] — whose validity depends on image scaling: lumbar radiographic magnification varies widely between patients and rises with body mass index [10], measurements scaled with default Digital Imaging and Communications in Medicine (DICOM) factors deviate substantially from marker-calibrated values [11] and inconsistent handling of magnification and landmarks contributes to the wide spread of published prevalence estimates [1].
Instability judgements built on these readings remain largely subjective and depend on the imaging protocol [12,13], and in secondary analyses of the NORDSTEN-DS trial neither established instability criteria nor surgeons' individual recommendations identified patients who benefited from additional fusion [14,15]. Objective classification requires reproducible metrics anchored in normative reference data [16]. Slip percentage is independent of scale, but it reduces each segment to a single ratio of translation to endplate depth and, when graded by Meyerding, to 25% steps [3].
We therefore propose quadrilateral segmental analysis (QSA): a single straight line is drawn along the superior endplate of each vertebra, and every motion segment is represented by the quadrilateral formed by two adjacent endplate lines and the connections of their anterior and posterior endpoints (Figure 1). Anterior translation skews this quadrilateral — the upper posterior interior angle M opens, the lower posterior angle N closes, and the diagonals become unequal (ratio K) — so translation is expressed by angles and dimensionless ratios that are inherently independent of calibration.
The aim of this study was to define the QSA parameters, to estimate their diagnostic accuracy against an independent two-reader reference standard, and to derive purpose-specific decision thresholds, establishing the static component of a quantitative instability work-up.
2. Materials and Methods
2.1. Design and Participants
This was a retrospective diagnostic accuracy analysis of prospectively collected data from the PROGRES cohort (Evaluation of the natural course of lumbar degenerative spine disease and factors influencing its progression, with an analysis of the impact of surgical intervention as a modifying factor in the long-term course of the disease), an ongoing prospective observational cohort study conducted at the Neurosurgical Department of the 4th Military Clinical Hospital in Wrocław, Poland. The study was approved by the Bioethics Committee of the Lower Silesian Medical Chamber in Wrocław, Poland (approval no. 09/DOBD/2025, dated 9 April 2025) and conducted in accordance with the Declaration of Helsinki. Every human participant provided written consent prior to enrolment. The study protocol was developed in accordance with the Strengthening the Reporting of Observational Studies in Epidemiology (STROBE) guidelines for cohort studies (Supplementary Checklist S1).
The present analysis uses preoperative assessment data collected between May 2025 and May 2026. Fifty consecutive adult patients with degenerative lumbar spondylolisthesis were included. Exclusion criteria included isthmic spondylolisthesis, deformity, previous spinal surgery, spinal neoplasms, neurological or muscular diseases causing motor impairment (e.g. amyotrophic lateral sclerosis, multiple sclerosis, myopathies). Demographic and radiographic characteristics of the cohort are summarized in Table 1.
2.2. Radiographs and Reference Standard
Each patient underwent standing lateral radiography of the lumbar spine in a standardized free-standing position. No distance calibration was required because every index parameter is an angle or a dimensionless ratio.
The reference standard was constructed as follows. Two experienced radiologists, blinded to the QSA output and to each other's ratings, independently reviewed every radiograph and classified each of the five motion segments from L1–L2 to L5–S1 as showing anterolisthesis or not, in accordance with recommendations for the construction and reporting of the reference standard in diagnostic accuracy studies [18,19]. Rather than relying on global impression, both readers applied the same predefined set of eight radiographic criteria: anterior translation ≥3 mm / ≥5% [20]; anterior vertebral translation graded according to Meyerding, in which a slip of 0–25% is Grade I, 25–50% Grade II, 50–75% Grade III, 75–100% Grade IV and >100% (spondyloptosis) Grade V [21]; discontinuity of the posterior vertebral body line (George's line); discontinuity of the posterior vertebral body line (Ullmann line); anterior–posterior disc height asymmetry [22]; vacuum disc phenomenon [23,24]; disc space narrowing [25]; traction spur [26]; spinous process step-off sign [27]; and Baastrup sign [28,29]. The first two are direct signs of translation, while the remaining six are indirect markers of segmental degeneration and instability that support the diagnosis when translation is borderline [30,31]. Each segment received a binary verdict (anterolisthesis present or absent). Segments on which the two readers disagreed were referred to a third, senior radiologist, who reviewed the same radiograph blinded to the index test and to the identity of the disagreeing readers, and whose verdict became final; adjudicated panel diagnosis is an accepted strategy when a single, error-free reference test is unavailable [32,33]. The adjudicated segment-level classification constituted the reference standard for all subsequent analyses.
2.3. Index Test: Quadrilateral Segmental Analysis
A single experienced spine surgeon, blinded to the radiologists’ ratings, drew one straight line along the superior endplate of L1, L2, L3, L4, L5 and S1 — six lines per patient. Annotated images were processed by a custom automated Python pipeline that detected the lines by color segmentation and fitted them by principal component analysis.
For each motion segment the quadrilateral Asup–Psup–Pinf–Ainf was constructed from the anterior (A) and posterior (P) endpoints of the cranial and caudal endplate lines (Figure 2). QSA parameters were: M, the interior angle at the upper posterior vertex; N, the interior angle at the lower posterior vertex; M − N, the posterior angular asymmetry; K, the ratio of the shorter to the longer diagonal (0 < K ≤ 1, with K = 1 denoting a translationally symmetric segment); and L, the angle between the diagonals at their intersection. Conventional descriptors computed from the same two lines served as comparators: segmental rotation α (the dihedral angle between the endplate lines), total rotation, wedging, tilt, and the two translation measures shear (D) and shift (F), expressed as a percentage of endplate length with anterior translation of the cranial vertebra defined as positive. For the comparison of predictors, translation measures were used as absolute values (|D|, |F|) and the upper posterior angle as its deviation from the neutral value, |M − 95°|.
Geometric consistency of every segment was verified automatically through the closure identity M + N = 180° + α, which follows from the construction and serves as built-in quality control of the annotation and computation chain.
For cohort description only, the same pipeline additionally computed the global spinopelvic parameters from the endplate lines together with a single mark on the femoral heads: lumbar lordosis (LL, L1–S1) with its proximal (PLL, L1–L4) and distal (DLL, L4–S1) arcs, sacral slope (SS), pelvic tilt (PT), pelvic incidence (PI), and the lordosis distribution index (LDI = DLL/LL × 100) [17]. These parameters were not used in any diagnostic analysis; their internal consistency was verified through the identity PI = SS + PT.
2.4. Segment Selection
Because anterolisthesis and retrolisthesis are directionally opposite deformities, segments with retrolisthesis (negative shear) were excluded a priori (n = 90 of 250; Figure 3), leaving 160 segments contributed by all 50 patients. All analyses therefore concern anterior translation only.
2.5. Statistical Analysis
Agreement between the two independent readers was quantified before adjudication and reported in accordance with the Guidelines for Reporting Reliability and Agreement Studies (GRRAS) [34]. The unit of the agreement analysis was the motion segment, and all 250 segments were analyzed together. Because a single κ can be misleading when one category dominates, complementary statistics are reported: raw observed agreement with Wilson confidence intervals (CIs); Cohen’s κ [35] with bootstrap confidence intervals (5,000 resamples) and the Landis and Koch interpretation [36]; the prevalence-adjusted bias-adjusted κ (PABAK) together with the prevalence and bias indices [37]; Gwet’s first-order agreement coefficient AC1, which is robust to the high-prevalence paradox [34]; positive and negative specific agreement; and the exact McNemar test for directional disagreement between readers.
The motion segment was the unit of analysis; within-patient clustering (up to five segments per patient) was addressed by patient-level cluster bootstrap (2,000 resamples, percentile 95% CIs [38]) for all area under the curve (AUC) estimates and AUC differences. Continuous parameters are summarized as median (interquartile range, IQR) and compared with the Mann–Whitney U test, interpreted descriptively. For the classical single-threshold analysis of K, the full receiver operating characteristic (ROC) curve was computed and operating characteristics were evaluated for 61 candidate thresholds spanning [0.70, 1.00] in steps of 0.005; sensitivity, specificity, positive and negative predictive values (PPV, NPV), likelihood ratios (LR+, LR−), accuracy and the Youden index (J) were tabulated for every candidate, and the optimum was reported both on the full grid and restricted to one-decimal thresholds. Predictive performance of K was compared with |D|, |F| and |M − 95°| by paired ΔAUC with cluster-bootstrap CIs. Multivariable logistic models were fitted on standardized predictors and validated by leave-one-out cross-validation (LOO-CV), with the AUC computed on pooled out-of-fold predictions; leave-one-patient-out cross-validation is reported alongside as the more conservative estimate under clustering. Proportions carry Wilson 95% CIs; balanced thresholds were selected by the Youden index [39]. Reporting follows the Standards for Reporting of Diagnostic Accuracy Studies (STARD) 2015 [18]. No a priori sample-size calculation was performed. Analyses used Python 3.12.3 (NumPy 2.4.4, pandas 3.0.2, SciPy 1.17.1, scikit-learn 1.8.0, statsmodels 0.14.6 [40]); α = 0.05, two-sided.
3. Results
3.1. Segments and Prevalence
Fifty patients contributed 250 segments; 90 retrolisthetic segments were excluded, leaving 160 for analysis (Figure 3, Table 2). Anterolisthesis was present in 54 segments (33.8%), located at L4–L5 in 45 cases (83.3%), L3–L4 in 5 (9.3%) and L5–S1 in 4 (7.4%). Every patient contributed at least one positive and at least one negative segment, so each patient served as their own control. The closure identity held within 1.0° in all segments (mean absolute deviation 0.3°, r = 0.996).
Global sagittal alignment in the cohort was that of a degenerative, largely compensated lumbar spine. Lumbar lordosis averaged 52.5 ± 9.7° and pelvic incidence 50.6 ± 9.9°, so that the PI–LL mismatch was minimal (median −2.5°, IQR −10.8 to 3.8) and fell within ±10° in 30 patients (60%), while pelvic tilt averaged 18.0 ± 7.0° and exceeded 20° in 22 patients (44%). Lordosis was nevertheless apportioned unevenly between its two arcs — proximal 22.0 ± 7.5° and distal 30.6 ± 7.4° — giving a lordosis distribution index (LDI, lower-arc L4–S1 lordosis as a percentage of total L1–S1 lordosis [17]) of 58.5 ± 11.6% (median 57.7%, range 40.5–84.8). By the established categories, 37 patients (74%) were within the aligned range of 50–80%, 10 (20%) showed moderate hypolordotic maldistribution (40–49%) and 3 (6%) hyperlordotic maldistribution (> 80%), with none below 40%. The cohort thus combined preserved global balance with a loss of lordosis from the lower arc in one fifth of patients, the alignment pattern expected in degenerative rather than deformity-driven disease.
3.2. Reference Standard: Inter-Reader Agreement
Before adjudication, the two readers agreed on 243 of the 250 segments (97.2%, 95% CI 94.3–98.6), with 49 concordant positive and 194 concordant negative verdicts (Table 3). Cohen’s κ was 0.916 (95% CI 0.848–0.974), corresponding to almost perfect agreement [36]. Because negative verdicts predominated (prevalence index 0.580), the prevalence-robust coefficients are reported alongside κ: PABAK 0.944 and Gwet’s AC1 0.958 (0.923–0.988). Specific agreement was 93.3% (86.9–96.7) for positive and 98.2% (96.4–99.1) for negative verdicts.
Reader 1 classified 55 segments as positive and reader 2 classified 50, with no evidence of systematic directional disagreement (bias index 0.020; exact McNemar p = 0.125). The seven discordant segments (2.8%) were adjudicated by the third radiologist, who sided with reader 1 in six and with reader 2 in one; the final reference identified 54 positive segments.
3.3. Parameter Distributions
All translation-encoding parameters separated the two groups strongly (Table 4, Figure 4). K was lower in anterolisthesis (median 0.861 vs 0.948), N smaller (87° vs 98°), M larger (103.5° vs 94°) and M − N reversed in sign (+16° vs −5°); |D|, |F| and |M − 95°| were correspondingly increased (all p < 0.001). Neither L (p = 0.085) nor the rotational and shape descriptors (rotation p = 0.091, total rotation p = 0.151, wedging p = 0.223, tilt p = 0.179) differed between groups.
3.4. Single-Threshold Discrimination of K
K discriminated anterolisthesis with an AUC of 0.892 (95% CI 0.841–0.937). Across the 61 candidate thresholds in [0.70, 1.00], sensitivity rose from 1.9% at K ≤ 0.70 to 100% at K ≤ 0.95, while specificity fell from 100% to 47.2%; the Youden index peaked at K ≤ 0.905 (J = 0.590, sensitivity 74.1%, specificity 84.9%) and displayed a broad plateau between 0.88 and 0.91, so nearby thresholds perform almost identically (Figure 5). When thresholds are restricted to one decimal — the resolution most likely to be used in routine reporting — the Youden optimum is K ≤ 0.9 (J = 0.516, sensitivity 64.8%, specificity 86.8%, accuracy 79.4%).
Because a single operating point cannot serve every purpose, seven representative thresholds are given in Table 5. The trade-off is monotone and steep at both ends: K ≤ 0.85 confirms a slip (specificity 99.1%, PPV 96.0%, LR+ 47.1) at the cost of missing more than half of them, whereas K ≤ 0.95 excludes a slip entirely (sensitivity 100%, NPV 100%, LR− 0.00) but calls positive more than half of the normal segments.
3.5. K versus Other Geometric Predictors
K was a good but not the strongest single predictor (Table 6, Figure 6). The direct translation measures |D| (AUC 0.943) and |F| (0.941) and the posterior angles N (0.948) and M − N (0.966) all exceeded it, with cluster-bootstrap ΔAUC excluding zero; the deviation of the upper posterior angle from neutral, |M − 95°| (0.851), was statistically indistinguishable from K (ΔAUC −0.041, 95% CI −0.106 to 0.021). L and the rotational descriptors carried essentially no information (AUC 0.56–0.58), confirming that the detectable deformity is translational rather than angular. K correlated only moderately with the translation measures (Spearman ρ = −0.51 with |F|, −0.53 with |D|, −0.56 with |M − 95°|) and weakly with N (−0.35), indicating that it encodes partly independent information — the direction-blind magnitude of translational asymmetry.
3.6. Multivariable Models with Leave-One-Out Validation
Combining K with a posterior angle produced a marked, cross-validated gain (Table 7). K alone reached a LOO-CV AUC of 0.886 (0.833–0.934); adding N raised it to 0.972 (0.951–0.990) and adding shift as well to 0.977 (0.960–0.992), with leave-one-patient-out estimates virtually identical (0.972 and 0.978), indicating that the improvement is not an artefact of within-patient correlation. At a probability cut-off of 0.5, the K + N model classified segments with 85.2% sensitivity, 95.3% specificity and 91.9% accuracy. Since the increment from the two- to the three-parameter model was small (ΔAUC 0.005), K + N is the parsimonious choice for routine use.
3.7. Three-Tier Reading Rule
Rounding K to one decimal, as it would be reported in practice, yields three tiers: both extreme tiers were error-free in this cohort (Table 8). K < 0.9 contained 24 segments, all with anterolisthesis (PPV 100%, 95% CI 86.2–100), and K = 1.0 contained 51 segments, none with anterolisthesis (NPV 100%, 93.0–100), together classifying 46.9% of segments without error. The intermediate tier (K = 0.9) held 85 segments (53.1%) with a 35.3% slip rate, within which N retained full discriminative power (AUC 0.931). Applying N ≤ 93° in that tier gave a two-step rule with 94.4% sensitivity, 95.3% specificity and 95.0% accuracy (leave-one-patient-out 95.6%), improving on N alone by 5.0 percentage points of accuracy (cluster bootstrap 1.9–8.6; McNemar p = 0.008, 8 errors corrected, none introduced). All eight residual errors fell inside the intermediate tier.
Reporting K to one decimal is what makes this tiered reading possible, and it is the reason the rule is built on K rather than on the stronger single predictors N or M − N. A ratio bounded by 1 collapses onto three values a reader can assign at a glance — 0.9 or below, 0.9, and 1.0 — whereas the posterior angles are read on a continuous degree scale on which no comparable rounding exists: 93° and 94° are one degree apart but sit on opposite sides of the decision boundary. The three tiers of Table 8 therefore carry an explicit action, and the error-free extremes are reached without any measurement finer than the first decimal place.
4. Discussion
4.1. Principal Findings
QSA turns a translation problem into an angular one. Anterior displacement skews the segmental quadrilateral, so the posterior angles and the diagonal ratio encode the slip without distance measurement. These calibration-free descriptors discriminated as well as percentage translation computed from the same lines. L and all rotational and wedging descriptors were uninformative. This contrast is partly built into the design, because the reference standard defines anterolisthesis by translation. It is consistent, however, with flexion–extension data in which translation, rather than angulation, was related to symptoms [41]. The standing film records the position of the segment under axial load, and QSA quantifies it. Unlike flexion–extension imaging, it requires no effort from the patient; in one series, detected instability rose from 6% to 38% after analgesia [42].
4.2. Decision Thresholds
The threshold sweep argues against a single cut-off for K. The Youden optimum (0.905) is a compromise; the clinically useful thresholds lie at the extremes, 0.85 for confirmation and 0.95 for exclusion. Rounded to one decimal, the same parameter yields a three-tier rule that resolved 75 of 160 segments (47%) without error (Table 8). All 24 segments in the positive tier were reference-positive (PPV 100%; 95% CI 86.2–100), and all 51 in the negative tier were reference-negative (NPV 100%; 95% CI 93.0–100). Zero observed errors remain compatible with a true error rate of up to 4.8% [43]. The 85 intermediate segments were passed to a second step (N ≤ 93°). Reporting them in a 3 × 2 classification, rather than discarding them, preserves this information [44]. The cross-validated K + N model (AUC 0.972) shows that the two descriptors are complementary: K measures translational asymmetry regardless of direction, whereas N is signed. That N and M − N discriminate better as continuous variables (Table 6) does not make them better reading rules: they are read in degrees and carry no natural rounding, whereas one decimal of K defines the three tiers of Table 8 directly.
4.3. Comparison with Existing Methods
QSA avoids the scaling dependence of millimeter thresholds. It shares scale independence with slip percentage and with endplate-normalized motion metrics [11]. It differs from both by reading the slip from angles alone and by returning a tiered decision with an internal geometric check. Deep-learning detectors reach a pooled sensitivity of 94.7% and specificity of 97.1%, with substantial heterogeneity [45]. A segmentation pipeline published in this journal reported accuracies of 96.1% and 94.4% on internal and external data [46]. QSA reaches comparable discrimination without a trained network, although cross-study comparisons are indirect. Because it uses the endplates and corners that such networks already extract, QSA can serve as an interpretable decision layer on top of automated landmarking.
4.4. Clinical Implications
QSA is intended as an add-on to the routine standing radiograph. The positive tier supports anterolisthesis, the negative tier argues against it, and intermediate segments warrant a second parameter or dynamic imaging. Slip thresholds drive several decisions. Appropriate use criteria separate static from dynamic spondylolisthesis when choosing between decompression and fusion [6]. Trials of basivertebral nerve ablation excluded slips greater than 2 mm [47]. Given lumbar magnification of 1.09–1.63 [10], an uncorrected true 2-mm slip may measure 2.2–3.3 mm. QSA could also provide an objective static input to instability classifications [12,48]. It requires six lines per patient, no calibration and no landmark other than the endplate. The closure identity M + N = 180° + α provides internal quality control.
On flexion–extension or standing–supine pairs, ΔN and ΔK would quantify the dynamic component of instability. This extension requires standardized acquisition, because instability classification varies with imaging protocol and pain control [13,42]. It also requires validation against outcomes. In NORDSTEN-DS, neither established instability criteria nor surgeons' recommendations identified patients who benefited from fusion [14,15].
4.5. Limitations
The study has several strengths: a prospectively enrolled cohort, a predefined criterion-based reference standard with blinded double reading and adjudication, and an index test that is calibration-free by construction and transparent at every step.
This is a single-center analysis with a case-mix typical of degenerative spondylolisthesis, in which 90% of L4–L5 segments were reference-positive; level-specific estimates at that level are therefore imprecise, overall accuracy partly reflects between-level contrasts, and predictive values will be lower where prevalence is lower. Segments are nested within patients, and intervals that ignore this clustering overstate precision [49]; likewise, leave-one-out cross-validation at the segment level allows segments from the same patient to inform both training and testing, and a patient-level scheme would better approximate prospective use [50].
The reference standard was expert visual judgement: criterion-based, double-read (κ 0.916) and adjudicated, it was not verified against dynamic imaging or computed tomography, so part of the residual disagreement — four of the five false positives showed geometric translation above 15% — may reflect the limits of the reference rather than of the index test. Because the reference and the index test read the same radiograph, and the reference includes direct translation criteria, some shared information is unavoidable and may favour translational descriptors.
Above all, a single film captures only the static component of instability: QSA quantifies the loaded position, not motion, and its dynamic extension remains untested. Scale independence also does not imply projection independence: axial rotation, beam obliquity and double endplate contours, as well as irregular endplates, transitional anatomy and pelvic overlap at L5–S1, can affect line placement.
The endplate lines were drawn by a single observer, and a reliability study following GRRAS recommendations [34] with intraclass correlation coefficient (ICC) analysis [51] is required before clinical use; that study must also show that the measurement error of K is small relative to the 0.1-wide intermediate band on which tier assignment depends. Thresholds derived here, including the three-tier boundaries, are data-driven, an approach known to inflate accuracy estimates, particularly in small samples [52], and need external validation. Finally, the analysis was restricted by design to anterior translation (retrolisthesis excluded). The restriction removed no symptomatic segment, as all 54 symptomatic segments lay in the M > 90° domain, but performance in retrolisthesis remains to be established.
5. Conclusions
Quadrilateral segmental analysis detects degenerative lumbar spondylolisthesis — the static hallmark of segmental instability — on a single standing lateral radiograph without any distance calibration.
The diagonal ratio K translates the radiologist's assessment of anterolisthesis into a single number: it discriminates well (AUC 0.892) with purpose-dependent thresholds — 0.85 to confirm, 0.9 for balanced reading, 0.95 to exclude — and, rounded to one decimal, classifies nearly half of all segments without error. The intermediate tier is resolved by the lower posterior angle N, which combined with K reaches a cross-validated AUC of 0.972. QSA is simple enough for routine reporting and fully automatable. Reliability testing, external validation and extension to dynamic image pairs for complete instability assessment are the next steps.
Supplementary Materials
The following supporting information can be downloaded at: Preprints.org, Checklist S1: STROBE checklist for cohort studies; Checklist S2: STARD 2015 checklist.
Author Contributions
Conceptualization, T.S.; methodology, T.S.; software, T.S.; formal analysis, T.S.; investigation, T.S., M.J., M.K.-G., J.W., P.S. and J.B.; resources, B.C., J.B.; data curation, T.S., M.K.-G. and J.W.; writing—original draft preparation, T.S.; writing—review and editing, M.J., M.K.-G., J.W., P.S., J.B. and B.C.; visualization, T.S.; supervision, B.C.; project administration, T.S. All authors have read and agreed to the published version of the manuscript.
Funding
This research received no external funding.
Institutional Review Board Statement
The study was conducted in accordance with the Declaration of Helsinki and approved by the Bioethics Committee of the Lower Silesian Medical Chamber in Wrocław, Poland (approval no. 09/DOBD/2025, 9 April 2025).
Informed Consent Statement
Written informed consent was obtained from all subjects involved in the study.
Data Availability Statement
The de-identified segment-level data and the analysis code presented in this study are available on request from the corresponding author. The data are not publicly available due to privacy restrictions and because the PROGRES cohort study is ongoing.
Acknowledgments
During the preparation of this manuscript, the authors used Claude (Anthropic; Opus 5) for code development for the image-analysis pipeline, statistical analysis support, figure preparation and language editing. The authors have reviewed and edited the output and take full responsibility for the content of this publication.
Conflicts of Interest
The authors declare no conflicts of interest.
Abbreviations
The following abbreviations are used in this manuscript:
| AC1 | Gwet’s first-order agreement coefficient |
| AUC | area under the curve |
| CI | confidence interval |
| DICOM | Digital Imaging and Communications in Medicine |
| DLL | distal lumbar lordosis |
| GRRAS | Guidelines for Reporting Reliability and Agreement Studies |
| ICC | intraclass correlation coefficient |
| IQR | interquartile range |
| LDI | lordosis distribution index |
| LL | lumbar lordosis |
| LOO-CV | leave-one-out cross-validation |
| LOPO-CV | leave-one-patient-out cross-validation |
| LR | likelihood ratio |
| NPV | negative predictive value |
| PABAK | prevalence-adjusted bias-adjusted kappa |
| PI | pelvic incidence |
| PLL | proximal lumbar lordosis |
| PPV | positive predictive value |
| PT | pelvic tilt |
| QSA | quadrilateral segmental analysis |
| ROC | receiver operating characteristic |
| SD | standard deviation |
| SS | sacral slope |
| STARD | Standards for Reporting of Diagnostic Accuracy Studies |
| STROBE | Strengthening the Reporting of Observational Studies in Epidemiology |
References
- Wang, Y.X.J.; Káplár, Z.; Deng, M.; Leung, J.C.S. Lumbar degenerative spondylolisthesis epidemiology: A systematic review with a focus on gender-specific and age-specific prevalence. J. Orthop. Transl. 2017, 11, 39–52. [Google Scholar] [CrossRef] [PubMed]
- Katz, J.N.; Zimmerman, Z.E.; Mass, H.; Makhni, M.C. Diagnosis and Management of Lumbar Spinal Stenosis: A Review. JAMA 2022, 327, 1688. [Google Scholar] [CrossRef] [PubMed]
- Saremi, A.; Goyal, K.K.; Benzel, E.C.; Orr, R.D. Evolution of lumbar degenerative spondylolisthesis with key radiographic features. Spine J. 2024, 24, 989–1000. [Google Scholar] [CrossRef] [PubMed]
- Arita, S.; Ishimoto, Y.; Hashizume, H.; Nagata, K.; Teraguchi, M.; Muraki, S.; Oka, H.; Takami, M.; Tsutsui, S.; Iwasaki, H.; et al. Age-related prevalence of radiographic lumbar spondylolisthesis and its associations with low back pain, walking speed, and muscle index: findings from the second survey of the ROAD study. Eur. Spine J. 2025, 34, 1359–1365. [Google Scholar] [CrossRef] [PubMed]
- Weinstein, J.N.; Lurie, J.D.; Tosteson, T.D.; Hanscom, B.; Tosteson, A.N.A.; Blood, E.A.; Birkmeyer, N.J.O.; Hilibrand, A.S.; Herkowitz, H.; Cammisa, F.P.; et al. Surgical versus Nonsurgical Treatment for Lumbar Degenerative Spondylolisthesis. N. Engl. J. Med. 2007, 356, 2257–2270. [Google Scholar] [CrossRef] [PubMed]
- Reitman, C.A.; Cho, C.H.; Bono, C.M.; Ghogawala, Z.; Glaser, J.; Kauffman, C.; Mazanec, D.; O'Brien, D.; O'Toole, J.; Prather, H.; et al. Management of degenerative spondylolisthesis: development of appropriate use criteria. Spine J. 2021, 21, 1256–1267. [Google Scholar] [CrossRef] [PubMed]
- Morse, K.W.; Steinhaus, M.; Bovonratwet, P.; Kazarian, G.; Gang, C.H.; Vaishnav, A.S.; Lafage, V.; Lafage, R.; Iyer, S.; Qureshi, S. Current treatment and decision-making factors leading to fusion vs decompression for one-level degenerative spondylolisthesis: survey results from members of the Lumbar Spine Research Society and Society of Minimally Invasive Spine Surgery. Spine J. 2022, 22, 1778–1787. [Google Scholar] [CrossRef] [PubMed]
- Abdu, W.A.; Sacks, O.A.; Tosteson, A.N.A.; Zhao, W.; Tosteson, T.D.; Morgan, T.S.; Pearson, A.; Weinstein, J.N.; Lurie, J.D. Long-Term Results of Surgery Compared With Nonoperative Treatment for Lumbar Degenerative Spondylolisthesis in the Spine Patient Outcomes Research Trial (SPORT). Spine 2018, 43, 1619–1630. [Google Scholar] [CrossRef] [PubMed]
- Kgomotso, E.L.; Hellum, C.; Fagerland, M.W.; Solberg, T.; Brox, J.I.; Storheim, K.; Hermansen, E.; Franssen, E.; Weber, C.; Brisby, H.; et al. Decompression alone or with fusion for degenerative lumbar spondylolisthesis (Nordsten-DS): five year follow-up of a randomised, multicentre, non-inferiority trial. BMJ 2024, 386, e079771. [Google Scholar] [CrossRef] [PubMed]
- Ravi, B.; Rampersaud, R. Clinical Magnification Error in Lateral Spinal Digital Radiographs. Spine 2008, 33, E311–E316. [Google Scholar] [CrossRef] [PubMed]
- Coomer, S.C.; Merkle, A.N.; Patel, V.V.; Nunley, P.D.; Hipp, J.A.; Grieco, T.F. Investigating the Effects of Image Scaling Techniques in Radiographic Measurements of Spinal Alignment and Motion: A Comparative Analysis. J. Imaging Inform. Med. 2025, 39, 2427–2439. [Google Scholar] [CrossRef] [PubMed]
- MacLean, M.A.; Bailey, C.; Fisher, C.; Rampersaud, Y.R.; Greene, R.; Abraham, E.; Dea, N.; Hall, H.; Manson, N.; Glennie, R.A. Evaluating Instability in Degenerative Lumbar Spondylolisthesis: Objective Variables Versus Surgeon Impressions. JBJS Open Access 2022, 7, e22.00052. [Google Scholar] [CrossRef] [PubMed]
- Pedrazzini, A.; Schmid, M.; Farshad, M.; Jentzsch, T. Standing-to-horizontal imaging reveals greater translation than flexion-extension radiographs for assessing lumbar instability in lumbar degenerative spondylolisthesis. N. Am. Spine Soc. J. 2026, 27, 100910. [Google Scholar] [CrossRef] [PubMed]
- Hellum, C.; Rekeland, F.; Småstuen, M.C.; Solberg, T.; Hermansen, E.; Storheim, K.; Brox, J.I.; Furunes, H.; Franssen, E.; Weber, C.; et al. Surgery in degenerative spondylolisthesis: does fusion improve outcome in subgroups? A secondary analysis from a randomized trial (NORDSTEN trial). Spine J. 2023, 23, 1613–1622. [Google Scholar] [CrossRef] [PubMed]
- Seip, A.; Hellum, C.; Fagerland, M.W.; Solberg, T.; Brox, J.I.; Storheim, K.; Hermansen, E.; Weber, C.; Brisby, H.; Banitalebi, H.; et al. Surgeon Recommendation and Outcomes of Decompression With vs Without Fusion in Patients With Degenerative Spondylolisthesis. JAMA Netw. Open 2025, 8, e2453466. [Google Scholar] [CrossRef] [PubMed]
- Hipp, J.; Grieco, T.; Newman, P.; Patel, V.; Reitman, C. Reference Data for Diagnosis of Spondylolisthesis and Disc Space Narrowing Based on NHANES-II X-rays. Bioengineering 2024, 11, 360. [Google Scholar] [CrossRef] [PubMed]
- Yilgor, C.; Sogunmez, N.; Yavuz, Y.; Abul, K.; Boissiére, L.; Haddad, S.; Obeid, I.; Kleinstück, F.; Sánchez Pérez-Grueso, F.J.; Acaroğlu, E.; et al. Relative lumbar lordosis and lordosis distribution index: individualized pelvic incidence–based proportional parameters that quantify lumbar lordosis more precisely than the concept of pelvic incidence minus lumbar lordosis. Neurosurg. Focus 2017, 43, E5. [Google Scholar] [CrossRef] [PubMed]
- Bossuyt, P.M.; Reitsma, J.B.; Bruns, D.E.; Gatsonis, C.A.; Glasziou, P.P.; Irwig, L.; Lijmer, J.G.; Moher, D.; Rennie, D.; de Vet, H.C.W.; et al. STARD 2015: an updated list of essential items for reporting diagnostic accuracy studies. BMJ 2015, 351, h5527. [Google Scholar] [CrossRef] [PubMed]
- Whiting, P.F.; Rutjes, A.W.S.; Westwood, M.E.; Mallett, S.; Deeks, J.J.; Reitsma, J.B.; Leeflang, M.M.G.; Sterne, J.A.C.; Bossuyt, P.M.M.; QUADAS-2 Group. QUADAS-2: A Revised Tool for the Quality Assessment of Diagnostic Accuracy Studies. Ann. Intern. Med. 2011, 155, 529–536. [Google Scholar] [CrossRef] [PubMed]
- Kalichman, L.; Hunter, D.J. Diagnosis and conservative management of degenerative lumbar spondylolisthesis. Eur. Spine J. 2008, 17, 327–335. [Google Scholar] [CrossRef] [PubMed]
- Koslosky, E.; Gendelberg, D. Classification in brief: the Meyerding classification system of spondylolisthesis. Clin. Orthop. Relat. Res. 2020, 478, 1125–1130. [Google Scholar] [CrossRef] [PubMed]
- Frobin, W.; Brinckmann, P.; Biggemann, M.; Tillotson, M.; Burton, K. Precision measurement of disc height, vertebral height and sagittal plane displacement from lateral radiographic views of the lumbar spine. Clin. Biomech. 1997, 12, S1–S63. [Google Scholar] [CrossRef] [PubMed]
- Knutsson, F. The Vacuum Phenomenon in the Intervertebral Discs. Acta Radiol. 1942, 23, 173–179. [Google Scholar] [CrossRef]
- Resnick, D.; Niwayama, G.; Guerra, J.; Vint, V.; Usselman, J. Spinal vacuum phenomena: anatomical study and review. Radiology 1981, 139, 341–348. [Google Scholar] [CrossRef] [PubMed]
- Wilke, H.-J.; Rohlmann, F.; Neidlinger-Wilke, C.; Werner, K.; Claes, L.; Kettler, A. Validity and interobserver agreement of a new radiographic grading system for intervertebral disc degeneration: Part I. Lumbar spine. Eur. Spine J. 2006, 15, 720–730. [Google Scholar] [CrossRef] [PubMed]
- Macnab, I. The traction spur. An indicator of segmental instability. J. Bone Jt. Surg. Am. 1971, 53, 663–670. [Google Scholar]
- Ahn, K.; Jhun, H.-J. New physical examination tests for lumbar spondylolisthesis and instability: low midline sill sign and interspinous gap change during lumbar flexion-extension motion. BMC Musculoskelet. Disord. 2015, 16, 97. [Google Scholar] [CrossRef] [PubMed]
- Baastrup, C.I. On the Spinous Processes of the Lumbar Vertebrae and the Soft Tissues Between them, and on Pathological Changes in that Region. Acta Radiol. 1933, 14, 52–55. [Google Scholar] [CrossRef]
- Filippiadis, D.K.; Mazioti, A.; Argentos, S.; Anselmetti, G.; Papakonstantinou, O.; Kelekis, N.; Kelekis, A. Baastrup’s disease (kissing spines syndrome): a pictorial review. Insights Imaging 2015, 6, 123–128. [Google Scholar] [CrossRef] [PubMed]
- Dupuis, P.R.; Yong-Hing, K.; Cassidy, J.D.; Kirkaldy-Willis, W.H. Radiologic Diagnosis of Degenerative Lumbar Spinal Instability. Spine 1985, 10, 262–276. [Google Scholar] [CrossRef] [PubMed]
- Leone, A.; Guglielmi, G.; Cassar-Pullicino, V.N.; Bonomo, L. Lumbar intervertebral instability: a review. Radiology 2007, 245, 62–77. [Google Scholar] [CrossRef] [PubMed]
- Bertens, L.C.M.; Broekhuizen, B.D.L.; Naaktgeboren, C.A.; Rutten, F.H.; Hoes, A.W.; van Mourik, Y.; Moons, K.G.M.; Reitsma, J.B. Use of Expert Panels to Define the Reference Standard in Diagnostic Research: A Systematic Review of Published Methods and Reporting. PLoS Med. 2013, 10, e1001531. [Google Scholar] [CrossRef] [PubMed]
- Naaktgeboren, C.A.; Bertens, L.C.M.; van Smeden, M.; de Groot, J.A.H.; Moons, K.G.M.; Reitsma, J.B. Value of composite reference standards in diagnostic research. BMJ 2013, 347, f5605. [Google Scholar] [CrossRef] [PubMed]
- Kottner, J.; Audigé, L.; Brorson, S.; Donner, A.; Gajewski, B.J.; Hróbjartsson, A.; Roberts, C.; Shoukri, M.; Streiner, D.L. Guidelines for Reporting Reliability and Agreement Studies (GRRAS) were proposed. J. Clin. Epidemiol. 2011, 64, 96–106. [Google Scholar] [CrossRef] [PubMed]
- Cohen, J. A Coefficient of Agreement for Nominal Scales. Educ. Psychol. Meas. 1960, 20, 37–46. [Google Scholar] [CrossRef]
- Landis, J.R.; Koch, G.G. The measurement of observer agreement for categorical data. Biometrics 1977, 33, 159–174. [Google Scholar] [CrossRef]
- Byrt, T.; Bishop, J.; Carlin, J.B. Bias, prevalence and kappa. J. Clin. Epidemiol. 1993, 46, 423–429. [Google Scholar] [CrossRef] [PubMed]
- Efron, B.; Tibshirani, R.J. An Introduction to the Bootstrap; Chapman and Hall/CRC: New York, NY, USA, 1994. [Google Scholar] [CrossRef]
- Youden, W.J. Index for rating diagnostic tests. Cancer 1950, 3, 32–35. [Google Scholar]
- Seabold, S.; Perktold, J. Statsmodels: Econometric and Statistical Modeling with Python. In Proceedings of the 9th Python in Science Conference (SciPy 2010), Austin, TX, USA, 28 June–3 July 2010; pp. 92–96. [Google Scholar] [CrossRef]
- Iguchi, T.; Kanemura, A.; Kasahara, K.; Sato, K.; Kurihara, A.; Yoshiya, S.; Nishida, K.; Miyamoto, H.; Doita, M. Lumbar Instability and Clinical Symptoms: Which Is the More Critical Factor for Symptoms: Sagittal Translation or Segment Angulation? J. Spinal Disord. Tech. 2004, 17, 284–290. [Google Scholar] [CrossRef] [PubMed]
- Chou, S.-H.; Lin, S.-Y.; Shen, P.-C.; Tu, H.-P.; Huang, H.-T.; Shih, C.-L.; Lu, C.-C. Pain Control Affects the Radiographic Diagnosis of Segmental Instability in Patients with Degenerative Lumbar Spondylolisthesis. J. Clin. Med. 2021, 10, 3984. [Google Scholar] [CrossRef] [PubMed]
- Hanley, J.A.; Lippman-Hand, A. If Nothing Goes Wrong, Is Everything All Right? Interpreting Zero Numerators. JAMA 1983, 249, 1743–1745. [Google Scholar] [CrossRef]
- Shinkins, B.; Thompson, M.; Mallett, S.; Perera, R. Diagnostic accuracy studies: how to report and analyse inconclusive test results. BMJ 2013, 346, f2778. [Google Scholar] [CrossRef] [PubMed]
- Pahlevan-Fallahy, M.-T.; Asgari, A.-M.; Soltani Khaboushan, A.; Chalian, M.; Shaker, F.; Yari, P.; Haseli, S. Evaluating the Diagnostic Accuracy of Artificial Intelligence in Spondylolisthesis Detection: A Systematic Review and Meta-analysis. Acad. Radiol. 2026, 33, 1034–1048. [Google Scholar] [CrossRef] [PubMed]
- Xu, C.; Wu, Y.; Bao, B.; Liu, X.; Zhang, Y.; Li, R.; Yang, T.; Tang, J. Deep Learning-Based Diagnosis of Lumbar Spondylolisthesis Using X-Ray Imaging. Diagnostics 2025, 15, 2015. [Google Scholar] [CrossRef] [PubMed]
- Khalil, J.G.; Smuck, M.; Koreckij, T.; Keel, J.; Beall, D.; Goodman, B.; Kalapos, P.; Nguyen, D.; Garfin, S. A prospective, randomized, multicenter study of intraosseous basivertebral nerve ablation for the treatment of chronic low back pain. Spine J. 2019, 19, 1620–1632. [Google Scholar] [CrossRef] [PubMed]
- Rangwalla, K.; Filley, A.; El Naga, A.; Gendelberg, D.; Baldwin, A.; Maziad, A.; Arora, A.; Wague, A.; O’Donnell, J.; Chryssikos, T.; et al. Degenerative lumbar spondylolisthesis: review of current classifications and proposal of a novel classification system. Eur. Spine J. 2024, 33, 1762–1772. [Google Scholar] [CrossRef] [PubMed]
- Genders, T.S.S.; Spronk, S.; Stijnen, T.; Steyerberg, E.W.; Lesaffre, E.; Hunink, M.G.M. Methods for Calculating Sensitivity and Specificity of Clustered Data: A Tutorial. Radiology 2012, 265, 910–916. [Google Scholar] [CrossRef] [PubMed]
- Saeb, S.; Lonini, L.; Jayaraman, A.; Mohr, D.C.; Kording, K.P. The need to approximate the use-case in clinical machine learning. GigaScience 2017, 6, gix019. [Google Scholar] [CrossRef] [PubMed]
- Koo, T.K.; Li, M.Y. A guideline of selecting and reporting intraclass correlation coefficients for reliability research. J. Chiropr. Med. 2016, 15, 155–163. [Google Scholar] [CrossRef] [PubMed]
- Leeflang, M.M.G.; Moons, K.G.M.; Reitsma, J.B.; Zwinderman, A.H. Bias in Sensitivity and Specificity Caused by Data-Driven Selection of Optimal Cutoff Values: Mechanisms, Magnitude, and Solutions. Clin. Chem. 2008, 54, 729–737. [Google Scholar] [CrossRef] [PubMed]
Figure 1.
Principle of quadrilateral segmental analysis (QSA) on a lumbar motion segment. A straight line is drawn along the superior endplate of the cranial (line A) and caudal (line B) vertebrae; the lines joining their anterior and posterior endpoints (dotted) close the segmental quadrilateral, whose diagonals (dashed) define the diagonal ratio K.
Figure 1.
Principle of quadrilateral segmental analysis (QSA) on a lumbar motion segment. A straight line is drawn along the superior endplate of the cranial (line A) and caudal (line B) vertebrae; the lines joining their anterior and posterior endpoints (dotted) close the segmental quadrilateral, whose diagonals (dashed) define the diagonal ratio K.
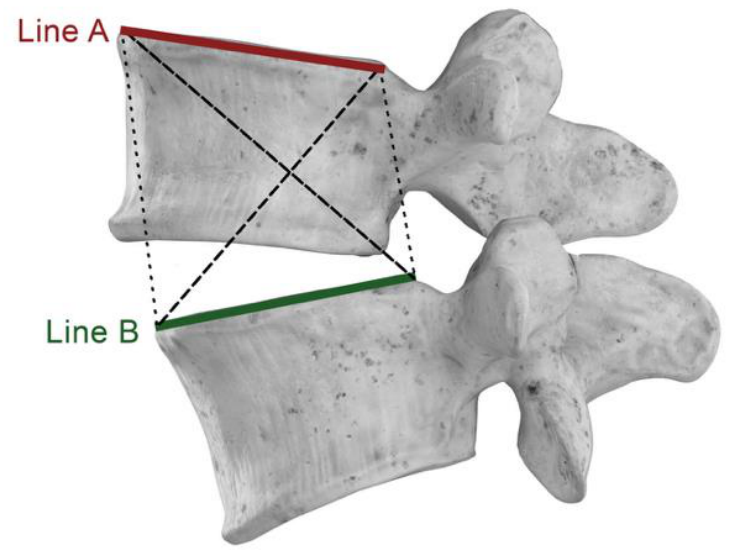
Figure 2.
QSA construction. (a) Neutral segment: the posterior interior angles are nearly equal (M ≈ N) and the diagonals are of equal length (K = d1/d2 = 1). (b) Anterolisthesis: anterior translation of the cranial vertebra opens M, closes N and makes the diagonals unequal (K < 1). In both configurations M + N = 180° + segmental rotation.
Figure 2.
QSA construction. (a) Neutral segment: the posterior interior angles are nearly equal (M ≈ N) and the diagonals are of equal length (K = d1/d2 = 1). (b) Anterolisthesis: anterior translation of the cranial vertebra opens M, closes N and makes the diagonals unequal (K < 1). In both configurations M + N = 180° + segmental rotation.
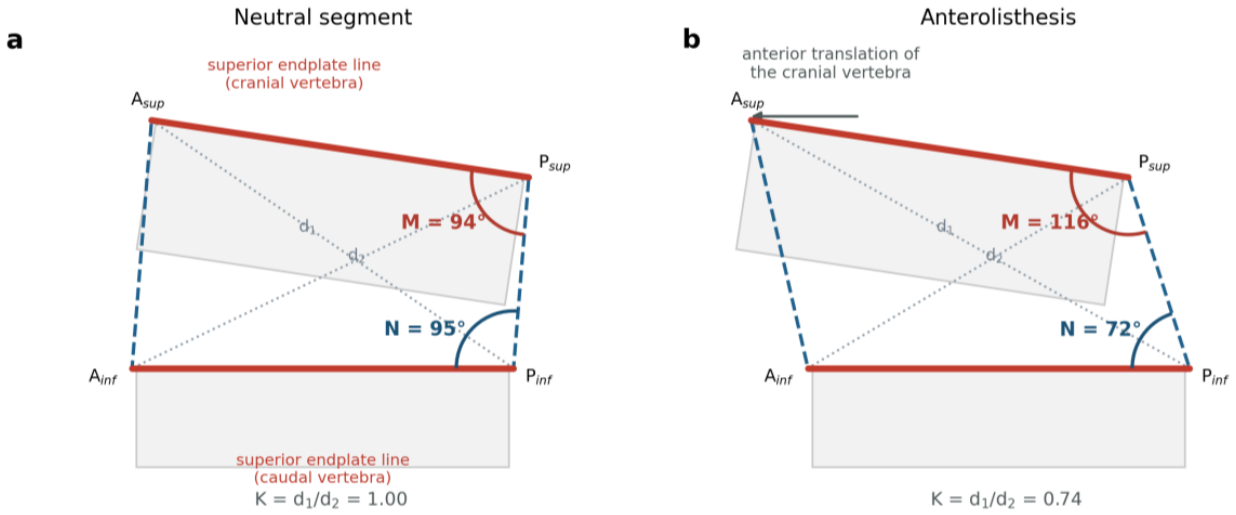
Figure 3.
Flow of patients and motion segments (STARD diagram).
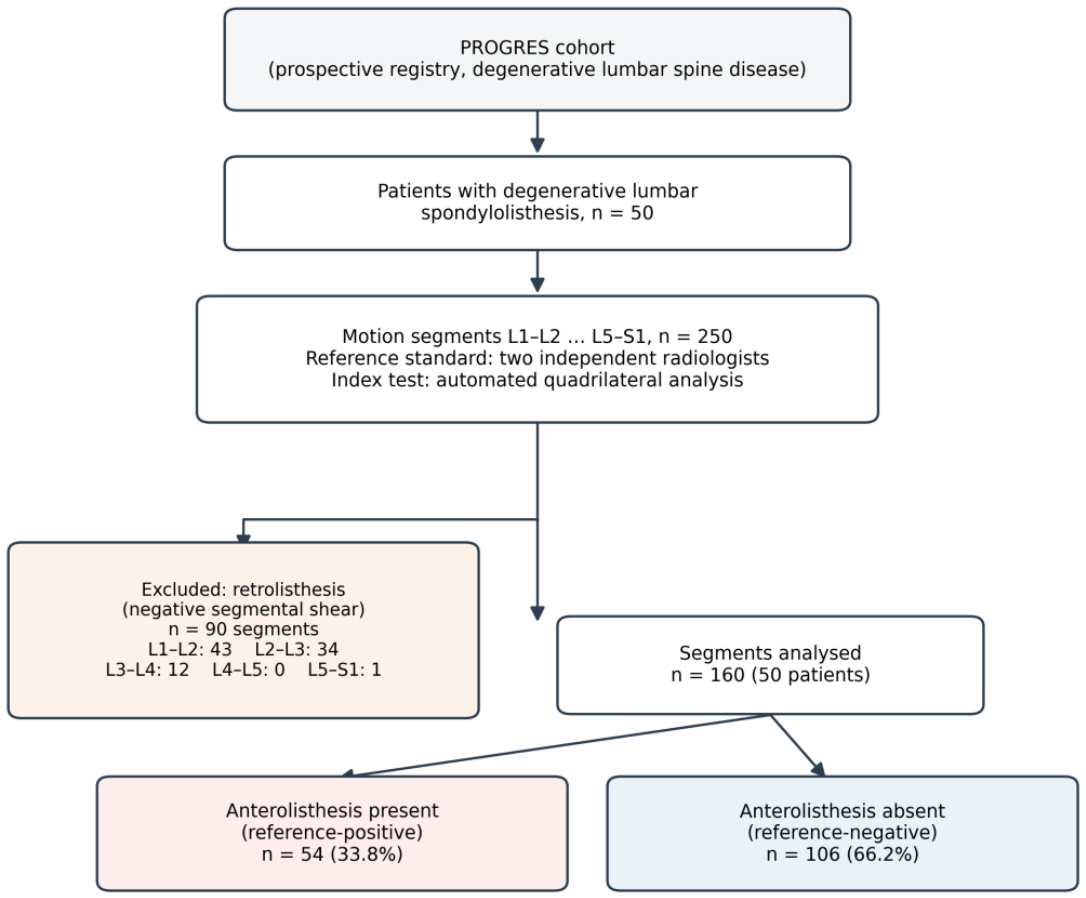
Figure 4.
Distributions of the QSA parameters and of segmental shear in reference-negative (grey circles) and reference-positive (red triangles) segments; boxes show median and interquartile range.
Figure 4.
Distributions of the QSA parameters and of segmental shear in reference-negative (grey circles) and reference-positive (red triangles) segments; boxes show median and interquartile range.
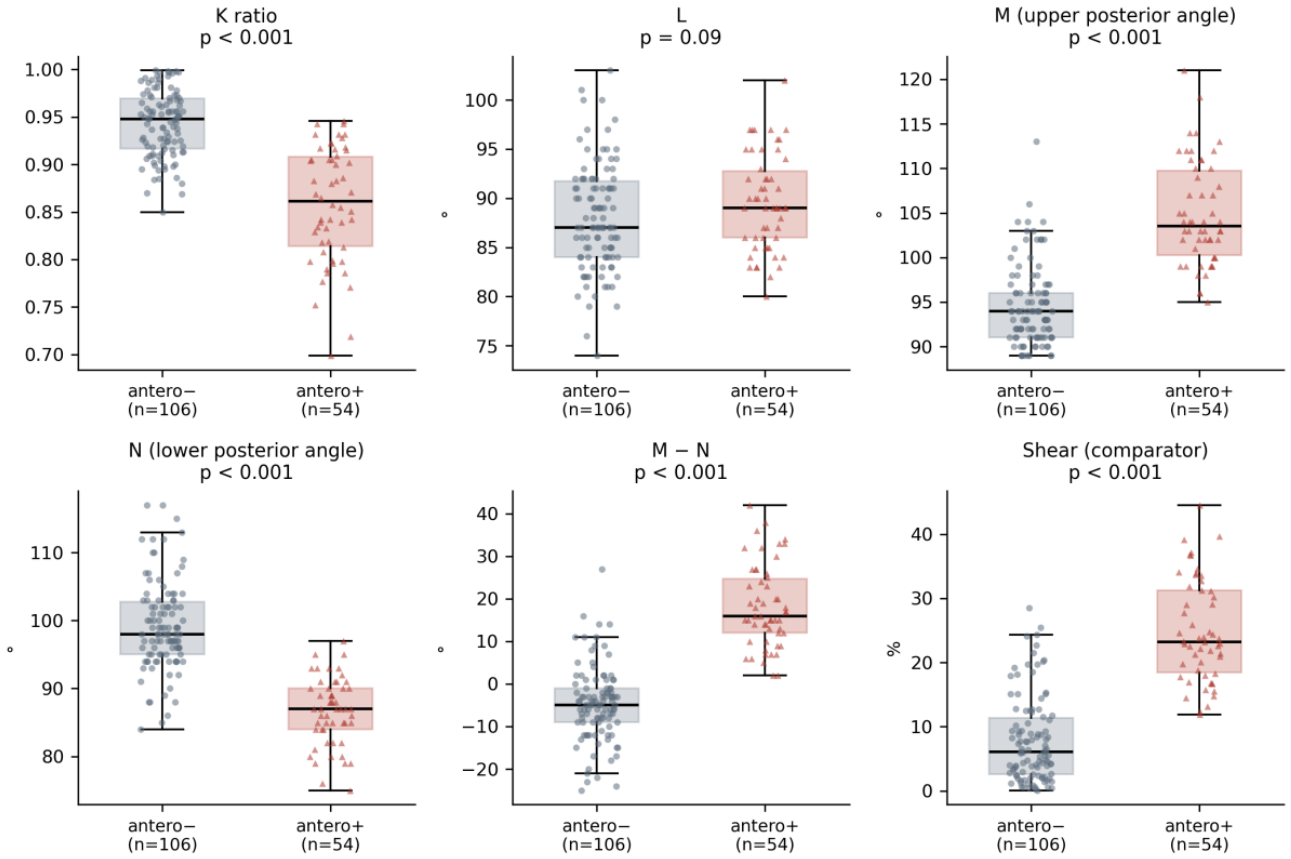
Figure 5.
Operating characteristics across the 61 candidate K thresholds. (a) Sensitivity, specificity and the Youden index, with the overall optimum (K ≤ 0.905) and the one-decimal optimum (K ≤ 0.9) marked. (b) Predictive values and accuracy; circles mark the seven thresholds of Table 5.
Figure 5.
Operating characteristics across the 61 candidate K thresholds. (a) Sensitivity, specificity and the Youden index, with the overall optimum (K ≤ 0.905) and the one-decimal optimum (K ≤ 0.9) marked. (b) Predictive values and accuracy; circles mark the seven thresholds of Table 5.
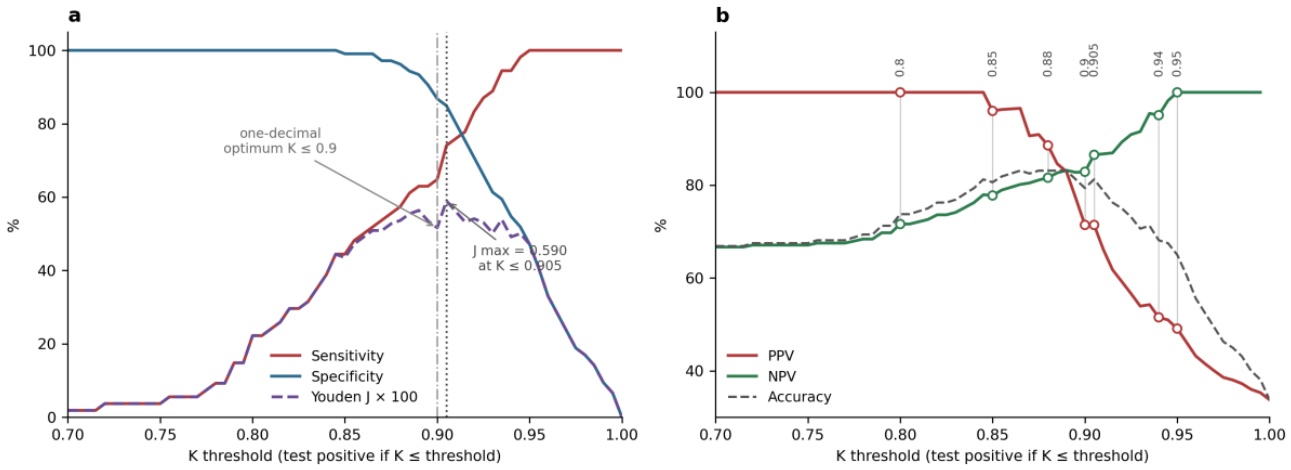
Figure 6.
Receiver operating characteristic (ROC) curves. (a) QSA parameters. (b) K compared with the absolute translation measures |D| and |F|, with |M − 95°|, and with the cross-validated three-parameter model.
Figure 6.
Receiver operating characteristic (ROC) curves. (a) QSA parameters. (b) K compared with the absolute translation measures |D| and |F|, with |M − 95°|, and with the cross-validated three-parameter model.
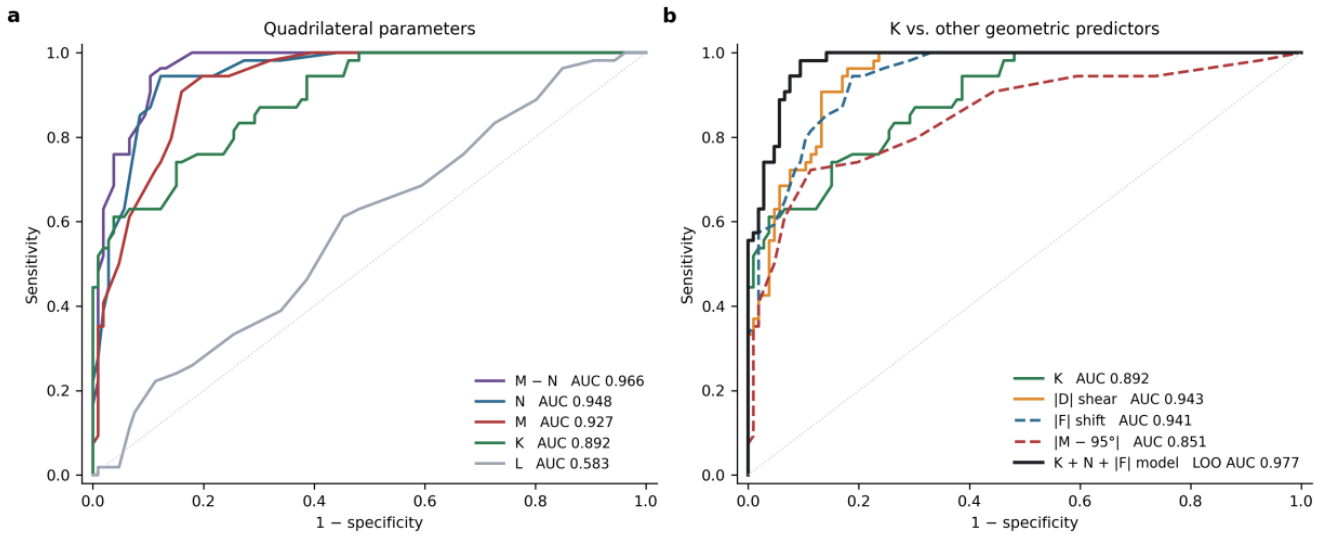

Table 1.
Demographic and radiographic characteristics of the study cohort (50 patients, 250 motion segments).
Table 1.
Demographic and radiographic characteristics of the study cohort (50 patients, 250 motion segments).
| Characteristic | Value |
|---|---|
| Patients (n = 50) | |
| Age, years | 68.4 ± 8.0 (46 to 81) |
| Female sex, n (%) | 34 (68.0) |
| Sagittal alignment, standing lateral radiograph | |
| Lumbar lordosis (LL, L1–S1), ° | 52.5 ± 9.7 (24 to 69) |
| Proximal lumbar lordosis (PLL, L1–L4), ° | 22.0 ± 7.5 (5 to 38) |
| Distal lumbar lordosis (DLL, L4–S1), ° | 30.6 ± 7.4 (10 to 44) |
| Lordosis distribution index (LDI), %a | 58.5 ± 11.6 (40.5 to 84.8) |
| <50% (hypolordotic maldistribution), n (%) | 10 (20.0) |
| 50–80% (aligned), n (%) | 37 (74.0) |
| >80% (hyperlordotic maldistribution), n (%) | 3 (6.0) |
| Pelvic incidence (PI), ° | 50.6 ± 9.9 (32 to 69) |
| Pelvic tilt (PT), °b | 18.0 ± 7.0 (−1 to 30) |
| Sacral slope (SS), ° | 32.6 ± 7.1 (21 to 49) |
| PI − LL mismatch, ° | −1.9 ± 10.4 (−27 to 23) |
| PI − LL > 10°, n (%) | 7 (14.0) |
| Motion segments, reference standard classification | |
| Segments assessed (L1–L2 to L5–S1), nd | 250 |
| Excluded by design (retrolisthesis geometry), n | 90 |
| Included in the accuracy analysis, n | 160 |
| Reference-positive (anterolisthesis), n/N (%) | 54/160 (33.8) |
| L1–L2 | 0/7 (0.0) |
| L2–L3 | 0/16 (0.0) |
| L3–L4 | 5/38 (13.2) |
| L4–L5 | 45/50 (90.0) |
| L5–S1 | 4/49 (8.2) |
| Patients by number of reference-positive levels, n (%) | |
| One level | 46 (92.0) |
| Two adjacent levelse | 4 (8.0) |
| Shift (F) in reference-positive segments, %f | 23 (17–30) [9–43] |
Values are mean ± SD (range) or n (%) unless otherwise indicated. a LDI = DLL/LL × 100; categories according to Yilgor et al. [17]. b Mildly non-normal distribution (Shapiro–Wilk p = 0.04); median 18.5° (IQR 15.0–23.0°). c Motion segment with the largest segmental lordotic angle. d Segment-level classification by the adjudicated two-reader reference standard; segments with retrolisthesis geometry were excluded from the accuracy analysis by design, and none of them was reference-positive. e L3–L4 with L4–L5 (n = 2) and L4–L5 with L5–S1 (n = 2). f Median (interquartile range) [range]; F as defined in Section 2.3. Abbreviations: DLL, distal lumbar lordosis; IQR, interquartile range; LDI, lordosis distribution index; LL, lumbar lordosis; PI, pelvic incidence; PLL, proximal lumbar lordosis; PT, pelvic tilt; SD, standard deviation; SS, sacral slope.
Table 2.
Segment flow and prevalence of anterolisthesis by level.
| Level | Segments assessed | Excluded (retrolisthesis) | Segments analysed | Anterolisthesis, n (%) |
|---|---|---|---|---|
| L1–L2 | 50 | 43 | 7 | 0 (0.0) |
| L2–L3 | 50 | 34 | 16 | 0 (0.0) |
| L3–L4 | 50 | 12 | 38 | 5 (13.2) |
| L4–L5 | 50 | 0 | 50 | 45 (90.0) |
| L5–S1 | 50 | 1 | 49 | 4 (8.2) |
| Total | 250 | 90 | 160 | 54 (33.8) |
Retrolisthesis was identified by a negative segmental shear value.
Table 3.
Agreement between the two independent radiologists before adjudication (250 motion segments).
Table 3.
Agreement between the two independent radiologists before adjudication (250 motion segments).
| Statistic | Value (95% CI) | Interpretation |
|---|---|---|
| Concordant verdicts, positive / negative | 49 / 194 | 243 of 250 segments |
| Discordant verdicts, reader 1+ / reader 2+ | 6 / 1 | 7 segments (2.8%) adjudicated |
| Observed agreement | 97.2% (94.3–98.6) | — |
| Cohen’s κ | 0.916 (0.848–0.974) | Almost perfect |
| PABAK | 0.944 | Prevalence-adjusted |
| Gwet’s AC1 | 0.958 (0.923–0.988) | Robust to prevalence |
| Positive specific agreement | 93.3% (86.9–96.7) | — |
| Negative specific agreement | 98.2% (96.4–99.1) | — |
| Prevalence index / bias index | 0.580 / 0.020 | Low bias |
| McNemar test (exact) | p = 0.125 | No systematic bias |
Wilson confidence intervals for proportions; bootstrap (5,000 resamples) for κ and AC1. PABAK — prevalence-adjusted bias-adjusted kappa.
Table 4.
QSA parameters and comparators by reference standard, median (IQR).
| Parameter | Anterolisthesis (n = 54) | No anterolisthesis (n = 106) | p * |
|---|---|---|---|
| K — diagonal ratio | 0.861 (0.814–0.908) | 0.948 (0.917–0.970) | < 0.001 |
| M — upper posterior angle (°) | 103.5 (100.3–109.8) | 94 (91–96) | < 0.001 |
| N — lower posterior angle (°) | 87 (84–90) | 98 (95–102.8) | < 0.001 |
| M − N (°) | +16 (12–24.8) | −5 (−9 to −1) | < 0.001 |
| |M − 95°| (°) | 8.5 (5.3–14.8) | 3 (1–5) | < 0.001 |
| L — inter-diagonal angle (°) | 89 (86–92.8) | 87 (84–91.8) | 0.085 |
| |D| — shear (%) | 23.3 (18.4–31.2) | 6.1 (2.6–11.4) | < 0.001 |
| |F| — shift (%) | 23 (17.3–30) | 5.5 (2–10) | < 0.001 |
| Segmental rotation α (°) | 11 (9–15) | 12 (9–19) | 0.091 |
| Wedging (%) | 21 (15–27) | 23 (15.3–35.5) | 0.223 |
| Tilt (°) | −1.5 (−7.8 to 3) | 0 (−10 to 12) | 0.179 |
* Mann–Whitney U test, unadjusted for within-patient clustering (descriptive).
Table 5.
Operating characteristics of seven candidate K thresholds (test positive if K ≤ threshold; Wilson 95% CIs).
Table 5.
Operating characteristics of seven candidate K thresholds (test positive if K ≤ threshold; Wilson 95% CIs).
| Threshold | Intended use | Se, % (95% CI) | Sp, % (95% CI) | PPV, % | NPV, % | J | LR+ / LR− | Acc, % |
|---|---|---|---|---|---|---|---|---|
| K ≤ 0.80 | Maximum specificity | 22.2 (13.2–34.9) | 100 (96.5–100) | 100 | 71.6 | 0.222 | ∞ / 0.78 | 73.8 |
| K ≤ 0.85 | Confirmation (rule-in) | 44.4 (32.0–57.6) | 99.1 (94.8–99.8) | 96.0 | 77.8 | 0.435 | 47.1 / 0.56 | 80.6 |
| K ≤ 0.88 | Rule-in, higher yield | 57.4 (44.2–69.7) | 96.2 (90.7–98.5) | 88.6 | 81.6 | 0.536 | 15.2 / 0.44 | 83.1 |
| K ≤ 0.90 | One-decimal optimum | 64.8 (51.5–76.2) | 86.8 (79.0–92.0) | 71.4 | 82.9 | 0.516 | 4.91 / 0.41 | 79.4 |
| K ≤ 0.905 | Youden optimum | 74.1 (61.1–83.9) | 84.9 (76.9–90.5) | 71.4 | 86.5 | 0.590 | 4.91 / 0.31 | 81.2 |
| K ≤ 0.94 | Screening (rule-out) | 94.4 (84.9–98.1) | 54.7 (45.2–63.9) | 51.5 | 95.1 | 0.492 | 2.09 / 0.10 | 68.1 |
| K ≤ 0.95 | Maximum sensitivity | 100 (93.4–100) | 47.2 (37.9–56.6) | 49.1 | 100 | 0.472 | 1.89 / 0.00 | 65.0 |
Se — sensitivity; Sp — specificity; PPV/NPV — predictive values at the observed prevalence (33.8%); J — Youden index; LR — likelihood ratio; Acc — accuracy.
Table 6.
Discrimination of single geometric predictors, with paired comparison against K.
| Predictor | AUC (95% CI) | ΔAUC vs. K (95% CI) | Interpretation |
|---|---|---|---|
| M − N (°) | 0.966 (0.944–0.985) | +0.074 (+0.030 to +0.126) | Superior to K |
| N (°) | 0.948 (0.919–0.975) | +0.056 (+0.016 to +0.107) | Superior to K |
| |D| — shear (%) | 0.943 (0.909–0.968) | +0.050 (+0.003 to +0.105) | Superior to K |
| |F| — shift (%) | 0.941 (0.910–0.966) | +0.049 (+0.001 to +0.105) | Superior to K |
| M (°) | 0.927 (0.892–0.956) | +0.035 (−0.018 to +0.095) | Comparable |
| K — diagonal ratio | 0.892 (0.841–0.937) | reference | — |
| |M − 95°| (°) | 0.851 (0.787–0.905) | −0.041 (−0.106 to +0.021) | Comparable |
| L (°) | 0.583 (0.506–0.661) | −0.309 (−0.401 to −0.210) | Non-discriminative |
| Rotational descriptors † | 0.56–0.58 | −0.45 to −0.47 | Non-discriminative |
† Segmental rotation, total rotation, wedging and tilt; AUCs are reported with the orientation that maximizes discrimination. ΔAUC from 2,000 patient-cluster bootstrap resamples.
Table 7.
Multivariable logistic models of anterolisthesis with internal validation.
| Model | Apparent AUC | LOO-CV AUC (95% CI) | LOPO-CV AUC | Se / Sp at p = 0.5, % | Accuracy, % |
|---|---|---|---|---|---|
| K | 0.892 | 0.886 (0.833–0.934) | 0.888 | 63.0 / 93.4 | 83.1 |
| K + |M − 95°| | 0.909 | 0.898 (0.849–0.940) | 0.901 | 64.8 / 92.5 | 83.1 |
| K + |F| | 0.965 | 0.959 (0.933–0.980) | 0.961 | 74.1 / 95.3 | 88.1 |
| K + N | 0.977 | 0.972 (0.951–0.990) | 0.972 | 85.2 / 95.3 | 91.9 |
| K + N + |M − 95°| | 0.977 | 0.971 (0.950–0.989) | 0.972 | 85.2 / 94.3 | 91.2 |
| K + N + |F| | 0.981 | 0.977 (0.960–0.992) | 0.978 | 85.2 / 94.3 | 91.2 |
Predictors standardized before fitting. LOO-CV — leave-one-out cross-validation (segment level); LOPO-CV — leave-one-patient-out cross-validation; CIs from patient-cluster bootstrap of out-of-fold predictions.
Table 8.
Three-tier rule based on K rounded to one decimal.
| Tier | Raw K | n (%) | Anterolisthesis | Post-test probability (95% CI) | Action |
|---|---|---|---|---|---|
| K < 0.9 | < 0.85 | 24 (15.0) | 24 / 24 | 100% (86.2–100) | Rule in |
| K = 0.9 | 0.85–0.949 | 85 (53.1) | 30 / 85 | 35.3% (26.0–45.9) | Apply N ≤ 93° |
| K = 1.0 | ≥ 0.95 | 51 (31.9) | 0 / 51 | 0% (0–7.0) | Rule out |
Two-step rule (K tiers, then N ≤ 93° in the intermediate tier): sensitivity 94.4%, specificity 95.3%, PPV 91.1%, NPV 97.1%, accuracy 95.0%.
Disclaimer/Publisher’s Note: The statements, opinions and data contained in all publications are solely those of the individual author(s) and contributor(s) and not of MDPI and/or the editor(s). MDPI and/or the editor(s) disclaim responsibility for any injury to people or property resulting from any ideas, methods, instructions or products referred to in the content. |
© 2026 by the authors. Licensee MDPI, Basel, Switzerland. This article is an open access article distributed under the terms and conditions of the Creative Commons Attribution (CC BY) license (http://creativecommons.org/licenses/by/4.0/).
Copyright: This open access article is published under a Creative Commons CC BY 4.0 license, which permit the free download, distribution, and reuse, provided that the author and preprint are cited in any reuse.