
Submitted:
14 September 2026
Posted:
15 September 2026
You are already at the latest version
Abstract
This study examines accounting connectivity between FY2024 sustainability statements prepared under the European Sustainability Reporting Standards (ESRS) and corresponding IFRS financial statements. Using the full eligible population of 22 Portuguese companies listed on the Euronext Lisbon regulated market, it develops and applies a 26-item Accounting Connectivity Index (ACI) across four dimensions: Referential, Quantitative, Methodological, and Accounting Consequence Connectivity. The analysis combines structured content analysis with qualitative assessment of sustainability-to-accounting pathways. ACI scores range from 17.1 to 94.8, with a population mean of 57.1. Quantitative Connectivity is the strongest and most widespread dimension, largely reflecting traceable relationships between EU Taxonomy metrics and financial-statement amounts. Accounting Consequence Connectivity, by contrast, is concentrated in seven companies. The results show that quantitative traceability does not necessarily imply substantive accounting connectivity and support a distinction between disclosure connectivity and integration into accounting assumptions, estimates, measurement, and financial-statement outcomes. Connectivity pathways also differ across business models. The findings remain stable under alternative population definitions, item specifications, and weighting approaches. The study contributes a replicable, sector-neutral framework for evaluating the nature and depth of connectivity between sustainability and financial reporting.
Keywords:
ESRS
; CSRD
; accounting connectivity
; sustainability reporting
; financial reporting
; double materiality
; IFRS
; accounting connectivity index
; EU taxonomy
1. Introduction
Sustainability reporting in the European Union has entered a new stage with the Corporate Sustainability Reporting Directive (CSRD) and the European Sustainability Reporting Standards (ESRS) (European Parliament and Council of the European Union, 2022; European Commission, 2023). The first set of ESRS substantially expands the scope and structure of sustainability information within corporate reporting and places double materiality at the centre of the reporting process. Undertakings are required to identify material impacts, risks, and opportunities (IROs) and, where relevant, disclose their current and anticipated financial effects. Sustainability reporting is therefore increasingly positioned not as an isolated reporting exercise, but as part of a broader corporate reporting architecture that interacts with strategy, risk management, financial planning, and financial reporting.
This interaction is explicitly embedded in the ESRS applicable to the FY2024 reporting cycle. ESRS 1 requires undertakings to explain relevant connections between sustainability information and other information presented in corporate reporting, including relationships with the financial statements. Monetary or quantitative datapoints included in both reporting domains should be appropriately referenced, relationships between sustainability datapoints and financial-statement amounts should be explained where relevant, and significant data and assumptions used across sustainability and financial reporting should be consistent, or any material differences explained (European Commission, 2023).
These requirements make connectivity an increasingly important characteristic of corporate reporting. Connectivity, however, extends beyond the existence of cross-references between different sections of an annual report. The European Financial Reporting Advisory Group (EFRAG) emphasises the importance of enabling users to understand relationships between sustainability and financial information while respecting the distinct objectives and boundaries of the two reporting domains (EFRAG, 2024, 2025). This raises a more demanding question than whether sustainability information and financial statements simply refer to one another: whether material sustainability-related information is coherently reflected in the accounting processes and financial-reporting outcomes to which it may be relevant.
This question is particularly important because sustainability-related financial materiality and accounting consequences are not equivalent concepts. Under double materiality, a sustainability matter may be financially material because it is expected to affect an undertaking’s financial position, financial performance, cash flows, access to finance, or cost of capital. This does not imply that the same matter automatically satisfies the recognition or measurement requirements of IFRS Accounting Standards. A financially material sustainability-related risk may produce no recognised provision, impairment loss, or other immediate adjustment to financial-statement amounts, while nevertheless being relevant to accounting assumptions, estimates, cash-flow projections, asset lives, fair-value measurement, expected credit losses, or disclosures.
This distinction creates both a conceptual and an empirical challenge. If connectivity is evaluated only through cross-references or matching numerical amounts, a company may appear highly connected because sustainability metrics can be reconciled with financial-statement figures. However, numerical traceability does not demonstrate that the underlying sustainability-related risks or opportunities have entered accounting recognition, measurement, estimates, or judgements. Conversely, the absence of a recognised accounting adjustment should not necessarily be interpreted as a lack of connectivity where a sustainability-related matter has been demonstrably considered, and a standards-consistent conclusion of non-recognition or no adjustment has been reached.
Recent research provides increasing support for this distinction. Oruç Erdoğan et al. (2026) develop a judgement-based framework linking climate-related sustainability disclosures to recognition, measurement, and disclosure outcomes under IFRS Accounting Standards. Their analysis shows that financially significant sustainability-related exposures need not translate directly into recognised amounts and that connectivity may instead operate through accounting judgements, estimates, and assumption-setting processes. Their illustrative application, however, concerns a single listed manufacturing entity and focuses specifically on climate-related disclosures.
At the same time, the emerging ESRS literature has predominantly examined sustainability-disclosure practices, double materiality assessments, and preparedness for European sustainability-reporting requirements. Dragomir et al. (2025) examine the emerging implementation of double materiality and the identification of impacts, risks, and opportunities. Morganho et al. (2025) analyse materiality-assessment disclosures among Iberian listed companies, while Azevedo et al. (2025) provide evidence on the sustainability-disclosure preparedness of Portuguese listed companies before the FY2024 ESRS reporting cycle. These studies provide important evidence on materiality and sustainability-reporting practices but do not systematically trace material sustainability-related information into the corresponding financial statements and accounting mechanisms across companies.
An important research gap therefore remains between the identification and disclosure of financially relevant sustainability matters and their observable connection with financial reporting. Empirical evidence remains limited on whether and how sustainability-related information can be traced to financial-statement amounts, assumptions, estimates, judgements, and accounting consequences. Existing approaches also provide limited means of distinguishing relatively mechanical forms of connectivity, such as cross-referencing and numerical reconciliation, from more substantive integration into accounting processes.
This study addresses this gap by examining FY2024 reporting by Portuguese companies with equity securities admitted to trading on the Euronext Lisbon regulated market that published an ESRS or explicitly ESRS-based sustainability statement together with corresponding IFRS financial statements. Following predefined eligibility criteria, the study examines the full eligible population of 22 companies.
Portugal provides a useful setting for this analysis because its regulated-market population is sufficiently bounded to permit a census while remaining heterogeneous in business models, including banking, energy, utilities, forestry, retail, construction, telecommunications, media, and technology. The included issuers operate within the same European sustainability-reporting architecture and prepare IFRS financial statements, allowing first-cycle connectivity to be examined under a shared institutional framework. The findings are not intended to be statistically generalised beyond Portugal; rather, they provide a transparent benchmark for subsequent comparisons across other European capital markets.
To operationalise connectivity, the study develops an Accounting Connectivity Index (ACI). The ACI conceptualises connectivity as a multidimensional construct comprising four dimensions: Referential Connectivity, Quantitative Connectivity, Methodological Connectivity, and Accounting Consequence Connectivity. Together, these dimensions distinguish observable references and numerical relationships from consistency in reporting methodologies and more substantive links with accounting processes and outcomes. The framework is designed around accounting mechanisms rather than specific accounting standards, allowing connectivity to be assessed across different business models.
Against this background, the study addresses the following research questions:
RQ1. To what extent do first-time ESRS sustainability statements of Portuguese listed companies demonstrate connectivity with financial reporting?
RQ2. Which mechanisms are used to establish connectivity between sustainability statements and financial statements?
RQ3. Which areas of financial reporting exhibit the strongest and weakest connectivity with sustainability-related information?
RQ4. How does accounting connectivity vary across companies and business models?
The study makes three principal contributions. First, it provides systematic empirical evidence on accounting connectivity during the first ESRS reporting cycle across the full eligible population of Portuguese listed companies, extending existing research beyond sustainability-disclosure compliance and double materiality assessment. Second, it develops a multidimensional and replicable framework for measuring connectivity that distinguishes referential and quantitative relationships from methodological integration and substantive accounting consequences. Third, it contributes to the conceptual understanding of connectivity by distinguishing disclosure connectivity from accounting connectivity and by recognising that financially material sustainability matters need not result in accounting recognition or measurement adjustments to demonstrate meaningful connectivity.
The empirical evidence reinforces the relevance of this distinction. Quantitative links between sustainability and financial reporting are widespread, whereas observable accounting consequences are concentrated in a substantially smaller group of companies. The findings therefore suggest that numerical traceability between reporting domains does not necessarily imply substantive accounting connectivity.
The remainder of the paper is organised as follows. Section 2 develops the literature review and conceptual framework. Section 3 describes the research design, population, development and application of the ACI, and reliability procedures. Section 4 presents the results, Section 5 discusses their implications, and Section 6 concludes.
2. Literature Review and Conceptual Framework
2.1. From Financial Materiality to Double Materiality
Materiality has traditionally played a central role in financial reporting by determining whether information is sufficiently relevant to influence users’ economic decisions. Within conventional financial reporting, materiality is therefore primarily assessed from the perspective of financial-statement users and the potential influence of information on their decisions.
The expansion of corporate reporting beyond conventional financial information has progressively challenged this predominantly investor-oriented perspective. Christensen et al. (2021) show that mandatory sustainability reporting differs from traditional financial reporting not only in the information disclosed but also in its potential effects on stakeholders and corporate behaviour. The underlying concept of materiality is therefore central to determining both the scope and consequences of sustainability-reporting regimes.
In the European context, this development has culminated in the transition from non-financial reporting towards sustainability reporting. Baumüller and Sopp (2022) argue that this transition represents more than a change in terminology: it reflects an expansion of the objectives, scope, and materiality boundaries of corporate reporting. Under the European sustainability-reporting framework, materiality is no longer limited to sustainability matters that may affect the undertaking financially. It also encompasses the undertaking’s impacts on people and the environment.
This dual perspective is formalised through double materiality. A sustainability matter may be material from an impact perspective, a financial perspective, or both. Impact materiality concerns an undertaking’s actual or potential positive or negative impacts on people or the environment. Financial materiality concerns sustainability-related risks and opportunities that may reasonably be expected to affect the undertaking’s financial position, financial performance, cash flows, access to finance, or cost of capital.
Empirical evidence nevertheless indicates that the operationalisation of double materiality remains heterogeneous. Correa-Mejía et al. (2024), examining European companies that reported applying double materiality before its widespread implementation, identify differences between companies’ stated commitment to the concept and its practical application. Dragomir et al. (2025) similarly document substantial variation in how companies explain materiality-assessment processes and identify impacts, risks, and opportunities.
This heterogeneity is relevant to the relationship between sustainability and financial reporting. The identification of a financially material sustainability matter represents a potential starting point for financial-reporting consequences, but it does not determine those consequences. Nobes (2026) highlights the conceptual differences between materiality in financial and sustainability reporting and the additional complexity introduced by double materiality. A matter that is financially material under the ESRS does not, merely by virtue of that classification, satisfy the recognition or measurement criteria of IFRS Accounting Standards.
Accordingly, financial materiality and accounting recognition should remain analytically distinct. A financially material sustainability-related matter may influence financial effects, accounting assumptions, estimates, judgements, or disclosures without necessarily producing an immediately recognised asset, liability, income, or expense. This distinction provides the conceptual basis for examining the relationship between double materiality and accounting connectivity.
2.2. Early ESRS Implementation and Portuguese Evidence
The Corporate Sustainability Reporting Directive (CSRD) and the European Sustainability Reporting Standards (ESRS) represent a substantial development in the European corporate-reporting environment. The ESRS introduce a detailed sustainability-reporting architecture centred on double materiality and the identification of material impacts, risks, and opportunities.
The FY2024 reporting cycle provides an important empirical setting because it permits observation of how companies translated the new reporting architecture into actual corporate-reporting practices. Existing research suggests that companies entered this reporting environment with substantially different levels of preparedness and prior sustainability-reporting experience.
Evidence from Portugal illustrates this variation. Azevedo et al. (2025) analysed the 2022 reports of companies included in the Portuguese Stock Index and assessed the extent to which their disclosures anticipated requirements subsequently incorporated into ESRS 2. Their findings showed heterogeneous levels of disclosure and incomplete alignment with information later required under the European sustainability-reporting framework. This evidence provides a useful pre-FY2024 baseline for assessing the subsequent development of ESRS-related reporting practices.
Ferreira-da-Silva et al. (2025) similarly examined sustainability disclosures by Portuguese PSI companies using a framework informed by the Global Reporting Initiative, Sustainability Accounting Standards Board, and Integrated Reporting Framework. Their findings document the development of sustainability-reporting practices among Portuguese listed companies but do not specifically examine their relationship with the corresponding financial statements.
At the Iberian level, Morganho et al. (2025) analysed materiality-assessment disclosures among Portuguese and Spanish listed companies and identified substantial differences in the completeness of materiality reporting. Their use of a structured disclosure index also demonstrates the value of systematic content-analysis approaches for comparing sustainability-reporting practices across companies.
Taken together, this literature has predominantly focused on the extent of sustainability disclosure, preparedness for ESRS requirements, double materiality processes, and the identification and disclosure of material sustainability matters. These are important components of the emerging reporting system, but they do not establish whether sustainability information is coherently connected with financial reporting.
Once material sustainability matters have been identified and disclosed, particularly where they are financially material, a further analytical question arises: whether and how those matters relate to current or anticipated financial effects and to the recognition, measurement, estimates, judgements, presentation, and disclosures reflected in the financial statements.
2.3. Connectivity Between Sustainability and Financial Reporting
The concept of connectivity responds to the risk that sustainability and financial reporting may develop as parallel information systems rather than as coherent components of corporate reporting. Broadly, connectivity concerns the relationships between information presented in different reporting domains that enable users to understand how sustainability-related matters interact with an undertaking’s strategy, business model, financial effects, and financial statements.
Connectivity is explicitly embedded in the ESRS. The standards require undertakings to enable users to understand relevant relationships between sustainability information and other information in corporate reporting, including direct and indirect relationships with the financial statements and the consistency of significant data and assumptions used across reporting domains.
Direct connectivity may arise when monetary or other quantitative information presented in the sustainability statement is also identifiable in the financial statements. Indirect connectivity may arise when sustainability information represents a component or aggregation of financial-statement amounts. Connectivity can also extend beyond numerical relationships to the consistency of assumptions, methodologies, reporting boundaries, time horizons, estimates, and other inputs used in sustainability and financial reporting.
EFRAG (2025) has treated connectivity as a distinct corporate-reporting issue. Its Discussion Paper Connectivity of Financial and Sustainability Reporting emphasises that connectivity extends beyond simple cross-referencing and can arise through different mechanisms depending on the sustainability matter, financial-reporting issue, and reporting context. This perspective supports an understanding of connectivity as multidimensional rather than binary.
Early regulatory evidence suggests, however, that meaningful connectivity remains difficult to achieve. ESMA (2026) identified substantial variation in the relationship between sustainability and financial information during the first ESRS reporting cycle. Its enforcement evidence highlighted incomplete or generic cross-references and weaknesses in the links between sustainability-related capital expenditure, operating expenditure, financial effects, and corresponding financial-statement information.
Professional and technical evidence points in a similar direction. Forvis Mazars (2026), analysing approximately 100 European sets of financial statements for FY2024, documented considerable diversity in how sustainability matters were reflected in financial reporting. Sustainability matters did not necessarily produce immediate direct effects on recognised financial-statement amounts, even where they were relevant to business models, risks, and expected financial performance. Related technical analysis likewise highlights the practical difficulty of tracing sustainability information into financial statements in a consistent manner (van der Tas & Roozen, 2026).
A particularly challenging component of connectivity concerns current and anticipated financial effects. The DRSC (2026), based on an analysis of 100 sustainability reports across five jurisdictions, found substantial heterogeneity in anticipated financial-effects reporting. Quantitative information remained relatively limited, illustrating the difficulty of translating sustainability-related developments into sufficiently robust financial estimates.
Financial effects therefore represent an important pathway between sustainability and financial reporting but should not be equated with connectivity itself. Connectivity may also arise through cross-references, quantitative reconciliation, shared assumptions, accounting estimates, judgements, measurement processes, or financial-statement disclosures. A comprehensive assessment consequently requires consideration of multiple reporting mechanisms.
2.4. From Disclosure Connectivity to Accounting Connectivity
The distinction between observable reporting links and substantive accounting integration is central to the present study.
Recent work by Oruç Erdoğan et al. (2026) provides an important conceptual development in this area. The authors develop a judgement-based framework linking climate-related sustainability disclosures to recognition, measurement, and disclosure requirements under IFRS Accounting Standards. Their analysis challenges the assumption that a material sustainability-related exposure must necessarily result in an immediately quantifiable or recognised financial-statement amount.
Instead, sustainability-related information may affect the accounting process through mechanisms such as impairment testing, useful-life assessments, cash-flow projections, estimates, measurement assumptions, and financial-statement disclosures. The ultimate accounting conclusion may be an adjustment to a recognised amount, additional disclosure, or a documented determination that no adjustment is required. This is consistent with IFRS material showing that climate-related matters are considered through existing recognition, measurement, estimate, and disclosure requirements rather than through a separate sustainability accounting model (IFRS Foundation, 2023; IFRS Interpretations Committee, 2024).
This perspective suggests that at least two analytically distinct forms of connectivity should be recognised.
Disclosure connectivity concerns observable relationships between sustainability and financial reporting, including cross-references, common monetary or quantitative information, reconciliations, and identifiable financial-statement locations.
Accounting connectivity concerns the deeper relationship between material sustainability-related information and the accounting processes underlying the financial statements, including assumptions, estimates, judgements, recognition, measurement, and disclosures.
The distinction is important because strong disclosure connectivity does not necessarily imply strong accounting connectivity. A sustainability metric may be fully reconcilable with a financial-statement amount without providing evidence that the sustainability-related risk or opportunity underlying that metric influenced accounting estimates or measurement.
Conversely, accounting connectivity does not require that every financially material sustainability matter result in a recognised accounting adjustment. Where a matter has been demonstrably considered under the relevant accounting requirements, a supported conclusion that no impairment, provision, measurement adjustment, or other accounting change is required may itself provide evidence of connectivity.
The analytical question is therefore not whether every financially material sustainability matter produces an accounting consequence, but whether the relationship between the sustainability matter and the relevant financial-reporting process is observable and coherent.
Accounting connectivity may consequently manifest through different mechanisms depending on the undertaking’s business model and the nature of the relevant sustainability matter. Potential pathways include recognition and derecognition, measurement, accounting estimates and assumptions, impairment and loss allowances, provisions, useful lives, fair-value measurement, cash-flow projections, and financial-statement presentation and disclosure.
This mechanism-based perspective avoids assuming that a single accounting standard or reporting outcome is relevant across all companies and provides the basis for a sector-neutral empirical assessment of accounting connectivity.
2.5. Conceptual Framework
Building on the preceding literature, the conceptual framework adopted in this study distinguishes the identification of sustainability-related matters from their potential transmission into financial reporting. Rather than treating connectivity as a binary characteristic, the framework conceptualises it as a multidimensional construct that may arise through different reporting and accounting mechanisms.
As illustrated in Figure 1, the relationship between sustainability reporting and financial reporting should not be interpreted as automatic or deterministic. An impact-material sustainability matter does not necessarily generate a financial effect, while financial materiality does not automatically imply accounting recognition or measurement.
Similarly, the absence of a recognised accounting amount does not necessarily indicate an absence of connectivity. A sustainability-related matter may instead influence financial reporting through assumptions, estimates, judgements, measurement processes, or disclosures, including cases in which the accounting assessment ultimately results in no adjustment to recognised amounts.
Accounting connectivity is therefore conceptualised as an intermediate construct between the identification of material sustainability-related information and its potential reflection in the financial statements and notes. The relevant empirical question is not whether every material sustainability matter produces an accounting consequence, but whether the relationships between sustainability information and financial reporting are sufficiently observable, coherent, and verifiable.
The framework distinguishes four complementary dimensions of accounting connectivity.
Referential Connectivity captures explicit cross-references and identifiable relationships between sustainability disclosures and corresponding financial-statement information.
Quantitative Connectivity captures common monetary or quantitative amounts, reconciliations, component or aggregation relationships, and other verifiable numerical links between sustainability and financial reporting.
Methodological Connectivity captures consistency across the two reporting domains in significant assumptions, estimates, scenarios, methodologies, time horizons, and reporting boundaries, including explanations of material differences where applicable.
Accounting Consequence Connectivity captures observable evidence that material sustainability-related information has been considered in relevant accounting processes, including recognition, measurement, accounting estimates and assumptions, impairment, provisions, useful lives, fair value, cash-flow projections, and financial-statement presentation or disclosure.
These four dimensions are conceptually distinct. Strong connectivity in one dimension does not necessarily imply strong connectivity in another. For example, a sustainability metric may be fully reconciled with a financial-statement amount while providing no observable evidence that the underlying sustainability-related risk or opportunity influenced accounting measurement or estimates. Conversely, substantive accounting connectivity may exist even where the ultimate accounting conclusion is that no recognition or measurement adjustment is required.
The four dimensions form the conceptual basis for the Accounting Connectivity Index (ACI) developed in Section 3. By separating referential and quantitative relationships from methodological consistency and accounting consequences, the framework is designed to distinguish relatively visible or mechanical reporting links from deeper forms of accounting integration.
The framework also adopts a mechanism-based rather than standard-specific approach. This is important because the accounting consequences of sustainability-related matters depend on the nature of the matter and the undertaking’s business model. The same broad sustainability risk may therefore connect to financial reporting through different accounting mechanisms across companies.
Accordingly, the framework does not assume that a greater volume of sustainability disclosure necessarily represents greater accounting connectivity. Instead, it focuses on the nature, strength, and depth of the observable relationship between sustainability-related information and financial reporting.
3. Materials and Methods
3.1. Research Design
This study adopts an exploratory cross-sectional content-analysis design to examine accounting connectivity between FY2024 ESRS sustainability statements and the corresponding financial statements of Portuguese listed companies.
The unit of analysis is the company–financial year. Sustainability statements and corresponding IFRS financial statements and notes were analysed jointly, rather than as independent reporting documents, because the object of the study is the relationship between the two reporting domains.
The study combines structured quantitative content analysis with qualitative documentary analysis. Quantitative analysis is conducted through the Accounting Connectivity Index (ACI), developed for this study, while qualitative analysis is used to identify the specific pathways through which sustainability-related matters interact with financial reporting.
The ACI does not measure general ESRS compliance, sustainability-reporting quality, or the volume of sustainability information disclosed. It measures the observable nature and strength of connectivity between sustainability-related information and financial reporting. Consequently, extensive sustainability disclosure does not necessarily imply high accounting connectivity. Similarly, the absence of a recognised accounting adjustment does not necessarily imply an absence of connectivity where the underlying sustainability-related matter was demonstrably considered in the relevant accounting assessment.
The empirical analysis focuses on the original ESRS framework applicable to FY2024. Subsequent amendments, simplifications, or revised ESRS requirements were not applied retrospectively when assessing the FY2024 reports.
3.2. Population and Eligibility Criteria
The initial screening frame comprised 37 equity issuers admitted to trading on the Euronext Lisbon regulated market during 2024.
To ensure temporal and reporting comparability, an issuer was included in the analytical population when all of the following conditions were satisfied:
1. The issuer was incorporated in Portugal;
2. Its equity securities were admitted to trading on the Euronext Lisbon regulated market during 2024;
3. Its financial year ended on 31 December 2024;
4. A FY2024 annual report or equivalent reporting package was publicly available;
5. The undertaking published a FY2024 sustainability statement prepared in accordance with, or explicitly based on or aligned with, the first set of ESRS; and
6. Corresponding IFRS financial statements and notes were publicly available in sufficient detail to apply the coding framework.
Foreign issuers, companies with non-calendar financial years, undertakings for which no FY2024 ESRS or explicitly ESRS-based sustainability statement could be identified, companies whose relevant sustainability reporting was available only through a consolidated parent, and issuers without sufficient FY2024 documentation were excluded.
Application of these criteria resulted in a final analytical population of 22 companies. Given the limited size of the eligible population, the study adopts a census approach rather than selecting a statistical sample.
Greenvolt – Energias Renováveis, S.A. was retained because its shares were admitted to trading during part of FY2024, although the company was delisted before year-end. The potential effect of this classification was assessed through a sensitivity analysis excluding Greenvolt.
Semapa – Sociedade de Investimento e Gestão, SGPS, S.A. and The Navigator Company, S.A. were both retained because they were separately listed issuers and each published a distinct reporting package. Given their parent–subsidiary relationship, additional sensitivity analyses were conducted by excluding either Semapa or Navigator.
The complete screening process, including the initial issuer frame, inclusion or exclusion decision, reason for exclusion, and documents analysed, is reported in Supplementary Data S1, worksheet Population_Screening (Table S1).
3.3. Data Sources and Documentary Evidence
The study relies exclusively on publicly available corporate reporting information.
For each company, the principal sources comprised:
- The FY2024 annual or integrated report;
- The FY2024 sustainability statement or sustainability report;
- The corresponding IFRS financial statements;
- Notes to the financial statements;
- EU Taxonomy disclosures;
- Sustainability assurance reports, where available; and
- Supplementary corporate reporting documents where necessary to establish a specific documentary connection.
Priority was given to documents published through official company investor-relations or sustainability channels and, where relevant, regulated-market filings.
The sustainability statement and financial statements were reviewed jointly at item level. For each coding decision, the evidence log recorded, where relevant, the sustainability matter or impact, risk or opportunity (IRO), sustainability-reporting location, corresponding financial-statement location, supporting documentary evidence, applicable accounting-standard metadata, coding rationale, and source reference.
Accounting standards were recorded as metadata rather than treated as ACI items. This distinction allows the index to capture accounting mechanisms consistently across sectors without structurally favouring industries in which IFRS Accounting Standards are more frequently applicable.
The complete item-level evidence log is provided in Supplementary Data S1, worksheet Evidence_Log (Table S2).
3.4. Development of the Accounting Connectivity Index
The Accounting Connectivity Index was developed to operationalise the multidimensional concept of accounting connectivity established in Section 2.
The instrument comprises 26 items distributed across four dimensions:
1. Referential Connectivity (R);
2. Quantitative Connectivity (Q);
3. Methodological Connectivity (M); and
4. Accounting Consequence Connectivity (A).
The framework was informed by the connectivity principles embedded in the original ESRS applicable to FY2024, including the relationships between sustainability information and financial statements, quantitative relationships between reporting domains, consistency of significant data and assumptions, and the potential relationship between sustainability-related financial effects and accounting estimates or financial-statement information.
The initial coding framework was pilot-tested on three companies—EDP, Millennium BCP, and Jerónimo Martins—chosen to represent substantially different business models: energy and utilities, banking, and retail. The purpose of the pilot was not to estimate population results but to test whether the instrument could be applied consistently across fundamentally different accounting environments.
The pilot led to refinement of item definitions, applicability rules, and the final sector-neutral structure of the Accounting Consequence dimension.
3.4.1. Referential Connectivity
Referential Connectivity assesses whether relationships between sustainability information and financial reporting are explicitly identifiable.
It comprises four items:
R1: Sustainability statement → financial statements cross-reference;
R2: Financial statements → sustainability statement cross-reference;
R3: Identifiable accounting location; and
R4: Linkage of current or anticipated financial effects to financial reporting.
R1 and R3 are conceptually distinct. R1 captures the existence and strength of an explicit reference from sustainability reporting to the financial statements, whereas R3 assesses whether the specific accounting location associated with the sustainability information can be identified.
3.4.2. Quantitative Connectivity
Quantitative Connectivity assesses observable numerical relationships between sustainability and financial reporting.
It comprises six items:
Q1: Matching monetary or quantitative amounts;
Q2: Quantitative reconciliation;
Q3: Component or aggregation relationship;
Q4: CapEx connectivity;
Q5: OpEx connectivity; and
Q6: Quantified current or anticipated financial effects.
Q1, Q2, and Q3 capture different levels of numerical connection. Q1 identifies matching amounts across reporting domains; Q2 requires a quantitative bridge or reconciliation; and Q3 captures situations in which a sustainability datapoint represents a component or aggregation of an accounting amount.
3.4.3. Methodological Connectivity
Methodological Connectivity assesses consistency in the methodological foundations of sustainability and financial reporting.
It comprises six items:
M1: Consistency of significant assumptions;
M2: Consistency of estimates;
M3: Time-horizon consistency;
M4: Scenario and strategic assumption consistency;
M5: Explanation of methodological differences; and
M6: Reporting-boundary consistency.
M1 and M2 are retained as distinct constructs. M1 concerns consistency in the underlying assumptions applied across reporting domains, whereas M2 concerns consistency in accounting or financial estimates derived using those assumptions.
M5 is applicable only where a material methodological difference between the two reporting domains can be identified. The absence of such a difference is therefore classified as non-applicable rather than automatically receiving a positive score.
3.4.4. Accounting Consequence Connectivity
Accounting Consequence Connectivity assesses whether material sustainability-related information is observably reflected in substantive accounting mechanisms.
The final sector-neutral structure comprises ten items:
A1: Recognition and derecognition;
A2: Measurement;
A3: Accounting estimates and assumptions;
A4: Impairment and loss allowances;
A5: Provisions and contingent liabilities;
A6: Useful lives and residual values;
A7: Fair value;
A8: Cash-flow projections;
A9: Financial-statement presentation and disclosure; and
A10: Other accounting consequences.
The use of accounting mechanisms rather than individual accounting standards is intentional. The same sustainability-related matter may affect different accounting processes depending on the company’s business model. A climate-related matter may, for example, interact with impairment testing in an industrial company but with expected credit loss measurement in a financial institution.
A10 operates as a residual category. Any repeated use of this item would indicate a potential need to revise the taxonomy in subsequent applications of the ACI.
Importantly, Accounting Consequence Connectivity does not require that a sustainability-related matter produce an accounting adjustment. A documented conclusion that no impairment, provision, recognition, measurement adjustment, or other accounting change is required may represent strong connectivity where the available reporting demonstrates that the sustainability matter was incorporated into the relevant accounting assessment.
The complete item definitions and item-specific scoring criteria are provided in the Accounting Connectivity Index Coding Manual (Supplementary File S1).
3.5. Applicability Assessment and Coding Procedure
Each item was assessed in two stages: applicability classification followed, where applicable, by connectivity scoring.
To constrain coder discretion, the coding manual used predefined decision rules, item-specific scoring anchors, and a requirement that each decision be supported by identifiable documentary evidence and a short rationale. The manual was refined during the pilot and then applied consistently across the population, with subsequent corrections made only through the full-sample consistency audit described in Section 3.8.
Four applicability statuses were used:
A — Applicable: The mechanism is relevant to the company and the sustainability matter under consideration;
NM — Not materially/applicably related: No material or plausible relationship with the mechanism was identified;
TR — Transitional relief: The relevant information was legitimately omitted under an applicable first-year ESRS transitional provision; and
UD — Undetermined: The available public reporting did not permit applicability to be determined reliably.
Applicability was assessed hierarchically.
First, the analysis considered whether the company had identified a material sustainability matter or IRO relevant to the potential connectivity mechanism.
Second, the analysis assessed whether a plausible pathway existed between that matter and the relevant reporting or accounting mechanism.
Third, where relevant, the availability of transitional relief was considered.
Finally, the available reporting evidence was evaluated.
Where no material sustainability matter or plausible pathway existed, the item was classified as NM. Where a legitimate first-year reporting relief applied, it was classified as TR. Where applicability could not be determined from the public evidence, it was classified as UD.
Only items classified as A received a numerical score.
The general scoring scale was:
0: Applicable, but no observable evidence of connectivity;
1: Generic or narrative evidence of connectivity;
2: Explicit, specific, and identifiable evidence of connectivity; and
3: Quantitative, verifiable, reconciled, or demonstrable accounting connectivity, according to the item-specific criteria.
The distinction between A = 0 and NM is fundamental to the methodology. A score of zero indicates that a reporting or accounting mechanism is plausibly relevant but that no observable evidence demonstrates incorporation of the sustainability-related information. NM indicates that the mechanism itself is not materially or plausibly relevant.
For example, where a material climate-related risk created a plausible pathway to impairment testing and the financial statements disclosed discounted cash-flow models, measurement, estimate, impairment, and cash-flow items could be classified as applicable. If the reporting provided no evidence that sustainability-related information had entered those accounting inputs, the corresponding items received a score of zero rather than being classified as NM.
This approach prevents the index from mechanically rewarding companies merely because potentially relevant accounting mechanisms are omitted from the denominator.
3.6. Evidence Clustering and Accounting Metadata
Multiple ACI items can reflect different conceptual aspects of the same underlying accounting pathway. To avoid interpreting such observations as independent documentary evidence, an Evidence Cluster ID was assigned when several item-level scores relied on the same underlying sustainability-to-accounting relationship.
For example, a climate-related input incorporated into an impairment model may simultaneously provide evidence relevant to measurement, accounting estimates, impairment, and cash-flow projections. These items remain separately scored because they represent conceptually distinct mechanisms, but the Evidence Cluster ID identifies their common evidential origin.
Applicable accounting standards, including IAS 36, IAS 37, IAS 16, IAS 41, IFRS 9, IFRS 13, and others where relevant, were also recorded as metadata. They do not contribute directly to the ACI score.
3.7. Calculation of Dimension Scores and the ACI
For each company, each dimension score was calculated using only items classified as applicable:
Dimension Score = [Σ applicable item scores / (3 × number of applicable items)] × 100
Items classified as NM, TR, or UD were excluded from the denominator.
The primary Accounting Connectivity Index was then calculated as the equally weighted mean of the four-dimension scores:
ACI = (R + Q + M + A) / 4
Accordingly, Referential, Quantitative, Methodological, and Accounting Consequence Connectivity each contribute 25% to the overall ACI.
Equal dimensional weighting was adopted because no established theoretical or empirical basis existed for assigning different weights to the four dimensions. It also prevents dimensions containing more individual items from mechanically dominating the overall measure and avoids making the effective contribution of a dimension depend on the number of applicable items, which can vary with the undertaking’s business model.
Two additional measures were retained for the Accounting Consequence dimension.
A-Intensity is the normalised Accounting Consequence dimension score and represents the strength of observable accounting connectivity across mechanisms classified as applicable. A-Intensity is incorporated into the overall ACI as the Accounting Consequence dimension.
A-Breadth is the number of Accounting Consequence mechanisms classified as applicable. It is reported descriptively and does not enter the ACI calculation.
The distinction is intended to differentiate companies exhibiting strong connectivity through a limited number of highly relevant accounting mechanisms from companies for which sustainability matters interact with a broader range of accounting processes.
No ex post qualitative categories such as “low”, “moderate”, or “high” connectivity were imposed. Company and dimension scores are therefore interpreted comparatively and continuously.
3.8. Pilot Testing and Consistency Audit
The three-company pilot identified several issues that were resolved before full-population coding.
First, the initial Accounting Consequence structure, which was organised around specific accounting areas, was replaced by the final mechanism-based structure described above to improve sector neutrality.
Second, transitional relief was separated from non-applicability to avoid treating legitimately unavailable first-year disclosures as evidence of weak connectivity.
Third, Evidence Cluster IDs were introduced to identify situations in which several item-level scores depended on the same underlying accounting pathway.
Following the first-pass coding of the full 22-company population, a consistency audit was performed across the entire dataset.
A principal focus of the audit was the distinction between NM and A = 0. Where a material sustainability matter had a plausible pathway to an accounting mechanism, that mechanism was classified as applicable even when no sustainability-related accounting input was observable. In such cases, a zero score was assigned.
The audit also reassessed potential conceptual overlap between R1 and R3, significant assumptions and accounting estimates (M1 and M2), and related Accounting Consequence items.
The final company scores reported in this study are based on the audited dataset.
3.9. Reliability Assessment
The stability of the coding framework was assessed using an intra-coder test–retest procedure applied to a stratified subset of six companies, corresponding to 27.3% of the analytical population.
The subset comprised Millennium BCP, Galp, CTT, Impresa, Novabase, and Semapa. The cases were selected to provide variation in business model, sector, and initial ACI level.
Across 156 applicability-status decisions, exact agreement between the original and repeated coding was 96.79%. Cohen’s kappa for applicability status was 0.932.
For the 102 items for which numerical scores were comparable across both coding rounds, exact score agreement was 97.06%. Linear weighted kappa was 0.975, and quadratic weighted kappa was 0.988. The mean absolute score difference was 0.029 points, with no individual item differing by more than one point.
These results indicate a high degree of coding stability.
To complement the formal test–retest assessment, a second researcher (R.C.) independently reviewed a smaller subset of item-level decisions, with particular attention to borderline applicability classifications and scoring judgements. This secondary review was intentionally narrower than the primary coding exercise and was used as a validation and challenge procedure rather than as a full duplicate coding round. Differences were resolved by reference to the Coding Manual and the underlying documentary evidence. Because the second-coder review did not reproduce the entire test–retest sample, the formal reliability statistics reported above remain intra-coder measures.
The reported kappa statistics therefore assess intra-coder/test–retest reliability. The second-coder review provided additional validation but was not designed to support a separate inter-coder kappa estimate. Broader independent duplicate coding remains a useful objective for future applications of the ACI. The test–retest procedure was conducted independently from the initial coding round, without reference to the original item-level scores during recoding.
3.10. Data Analysis and Sensitivity Tests
The empirical analysis is primarily descriptive and comparative, consistent with the exploratory objective of the study and the size of the analytical population.
For each company, the analysis calculates:
- ▪ Referential Connectivity;
- ▪ Quantitative Connectivity;
- ▪ Methodological Connectivity;
- ▪ A-Intensity;
- ▪ Overall ACI; and
- ▪ A-Breadth.
Population-level analysis includes means, medians, standard deviations, quartiles, ranges, item-level applicability frequencies, score distributions, and the prevalence of stronger connectivity evidence.
Accounting Consequence items are analysed separately to identify which accounting mechanisms most frequently provide observable pathways between sustainability-related matters and financial reporting.
Qualitative documentary analysis complements the numerical scores by identifying the dominant sustainability-to-accounting pathways observed across companies and business models.
Predefined population-definition sensitivity analyses were conducted by:
1. Excluding Greenvolt because it was delisted before the end of FY2024;
2. Excluding Semapa to assess the effect of simultaneously including Semapa and its listed subsidiary, The Navigator Company;
3. Excluding Navigator instead of Semapa; and
4. Excluding both Greenvolt and Semapa.
These analyses were used to assess whether the main population-level conclusions depended materially on the treatment of these observations.
No inferential regression analysis was performed on the dataset. The study examines a small census population during an early ESRS reporting cycle and is intended primarily to document, measure, and characterise an emerging reporting phenomenon rather than to estimate causal relationships or population parameters beyond the defined analytical population.
Additional robustness analyses were conducted to assess whether the results were sensitive to potential empirical overlap between individual ACI items and to the choice of dimensional weighting. First, the ACI was recalculated after separately excluding R3 (identifiable accounting location) and M2 (consistency of estimates), and after excluding both items simultaneously. These tests address the fact that R1/R3 and M1/M2, while conceptually distinct, produced identical item-level classifications in the FY2024 population. Second, an alternative item-weighted specification was calculated by dividing the sum of all applicable item scores by the maximum possible score across all applicable items, rather than assigning equal weights to the four ACI dimensions. The item-weighted specification was also recalculated excluding R3 and M2 simultaneously. Company rankings and population-level results under each alternative specification were compared with the primary ACI.
3.11. Use of Generative Artificial Intelligence
OpenAI’s ChatGPT (GPT-5.6 Sol) was used to support refinement of the conceptual and coding framework, preliminary documentary organisation, spreadsheet preparation and consistency checks, preparation of the conceptual diagram, and linguistic drafting. Generative AI output was not treated as empirical evidence or as an independent coder. All coding decisions were anchored to identifiable evidence in the underlying corporate reports and reviewed by the authors.
The authors remain responsible for the research design, source selection, applicability classifications, scoring decisions, calculations, interpretation of the results, and final manuscript.
4. Results
4.1. Overall Accounting Connectivity
Table 1 presents the company-level Accounting Connectivity Index (ACI) scores for the 22 companies included in the final analytical population, while Table 2 reports descriptive statistics for the overall index and its four dimensions.
The overall ACI ranged from 17.1 to 94.8, with a mean of 57.1, a median of 51.6, and a standard deviation of 23.4, indicating substantial cross-company heterogeneity (Table 2).
Galp recorded the highest ACI (94.8), followed by The Navigator Company (92.7), EDP (91.2), Jerónimo Martins (90.2), and Millennium BCP (85.6). At the lower end of the distribution, Glintt Global and Novabase recorded ACI scores of 19.6 and 17.1, respectively.
The four dimensions displayed markedly different population-level profiles. Quantitative Connectivity was the strongest dimension, with a mean score of 80.8 and a median of 86.7. Referential Connectivity recorded a mean of 64.0, while Methodological Connectivity averaged 54.7.
Accounting Consequence Connectivity showed the greatest concentration and dispersion. Mean A-Intensity was 28.8, while the median was zero. Eighteen of the 22 companies (81.8%) achieved a Quantitative Connectivity score of at least 80, whereas only seven companies (31.8%) recorded positive A-Intensity.
The population-level evidence therefore reveals a clear distinction between the visibility of quantitative relationships across reporting domains and the observable incorporation of sustainability-related matters into accounting processes.
4.2. Referential and Quantitative Connectivity
Table 3 reports item-level results for Referential, Quantitative, and Methodological Connectivity.
Referential Connectivity was strongest where sustainability disclosures pointed towards corresponding financial-statement information. For R1, which captures sustainability-statement-to-financial-statement cross-references, 20 of the 22 companies achieved a score of at least 2, including ten maximum scores.
R3, which assesses whether the corresponding accounting location can be identified, produced the same empirical distribution in the FY2024 population: 20 companies achieved a score of at least 2 and ten received the maximum score. Although R1 and R3 represent conceptually distinct mechanisms, their identical FY2024 classifications are addressed through additional robustness analyses in Section 4.6.
Reverse connectivity was considerably weaker. Only seven companies achieved a score of at least 2 for R2, which captures references from the financial statements back to sustainability reporting, and six companies received a score of zero.
Connectivity involving current or anticipated financial effects was also less developed. R4 was applicable to nine companies, while 13 companies were covered by the relevant first-year transitional relief. Of the nine applicable observations, only three achieved a score of at least 2.
Quantitative Connectivity showed a substantially stronger pattern.
Q1, capturing matching monetary or quantitative amounts across sustainability and financial reporting, was substantive in 21 of the 22 companies, with 19 receiving the maximum score.
Quantitative reconciliation (Q2) was also widespread, with 19 companies achieving scores of at least 2. Component or aggregation relationships (Q3) were observable in 20 companies at this level.
CapEx connectivity was applicable to 20 companies, of which 19 achieved a score of at least 2 and 17 received the maximum score. OpEx connectivity was applicable to 17 companies, and all 17 displayed substantive connectivity, including ten maximum scores.
These results were largely associated with EU Taxonomy disclosures, where turnover, CapEx, and OpEx denominators could frequently be traced to financial-statement amounts or identifiable accounting components.
By contrast, quantified current or anticipated financial effects remained comparatively limited. Q6 was applicable to nine companies and subject to transitional relief in 13. Only two of the nine applicable companies achieved a score of at least 2, and none achieved the maximum score.
Accordingly, the Quantitative dimension reveals an important internal distinction. Traceability and reconciliation of existing accounting amounts were widespread, whereas the quantification of sustainability-related current or anticipated financial effects remained considerably less developed.
4.3. Methodological Connectivity
Methodological Connectivity was more heterogeneous than Quantitative Connectivity.
Reporting-boundary consistency (M6) was the strongest methodological mechanism. All 22 companies achieved a score of at least 2, including 12 maximum scores. This indicates that the relationship between the sustainability-reporting perimeter and the financial-statement consolidation perimeter was generally identifiable and frequently explicit.
Time-horizon consistency (M3) was also relatively strong, with 19 companies achieving scores of at least 2.
By contrast, observable consistency in significant assumptions and estimates was considerably weaker. For both M1 and M2, only seven of the 22 companies achieved a score of at least 2, five received the maximum score, and eight received a score of zero.
Although M1 and M2 are conceptually distinct—M1 relating to significant assumptions and M2 to estimates derived using relevant assumptions—they produced identical classifications across the FY2024 population. The effect of this empirical overlap is tested in Section 4.6.
Scenario and strategic assumption consistency (M4) showed an intermediate pattern. Nine companies achieved a score of at least 2, while five received a score of zero.
M5, concerning explanations of methodological differences, was applicable in only two observations. Both companies achieved substantive connectivity, while the item was classified as non-applicable in the remaining 20 companies.
Overall, methodological connectivity was stronger for structural reporting characteristics, particularly reporting boundaries and time horizons, than for the observable incorporation of sustainability-related assumptions, estimates, and scenarios into financial-reporting methodologies.
4.4. Accounting Consequence Connectivity
Table 4 reports that Accounting Consequence Connectivity produced the clearest distinction between companies.
Only seven of the 22 companies demonstrated positive A-Intensity: Galp, The Navigator Company, EDP, Jerónimo Martins, Millennium BCP, Semapa, and Greenvolt. The remaining 15 companies recorded an A-Intensity of zero.
Importantly, a zero score does not indicate that the corresponding accounting mechanism was irrelevant. Under the applicability framework, an item was classified as applicable when a material sustainability-related matter had a plausible pathway to the relevant accounting mechanism. Where no observable evidence demonstrated that the sustainability-related matter had entered that mechanism, the applicable item received a score of zero.
This distinction is particularly visible in measurement-related mechanisms.
Measurement (A2) applied to 16 companies, but only six displayed positive connectivity, while ten received a score of zero.
Accounting estimates and assumptions (A3) applied to 15 companies. Six displayed positive connectivity, whereas nine received zero.
Impairment and loss allowances (A4) were also applicable to 15 companies. Only five demonstrated observable sustainability-related incorporation, while ten had a plausible impairment pathway but received a score of zero.
Cash-flow projections (A8) applied to 13 companies. Four displayed positive connectivity, all achieving the maximum score, while nine received zero.
Financial-statement presentation and disclosure (A9) applied to the entire population. Seven companies displayed positive substantive accounting disclosure, including six maximum scores, whereas 15 received zero.
Other accounting mechanisms were less widely applicable but generally showed stronger connectivity when present.
Recognition and derecognition (A1) was applicable to four companies and positive in all four, including three maximum scores.
Useful lives and residual values (A6) were applicable to four companies and positive in all four. None received the maximum score, reflecting evidence of consideration rather than a quantitatively identifiable change in useful life or residual value.
Fair value (A7) was applicable to three companies and positive in all three, including two maximum scores.
Provisions and contingent liabilities (A5) were applicable to three companies, of which two displayed positive connectivity.
The residual category A10 was not required for any company. All observed accounting-consequence pathways could therefore be classified within the nine substantive mechanisms defined in A1–A9.
Taken together, these results show that potentially relevant accounting pathways were considerably more widespread than observable evidence that sustainability-related information had substantively entered those accounting processes.
4.5. Cross-Company and Business-Model Variation in Accounting Connectivity
The seven companies with positive A-Intensity exhibited distinct sustainability-to-accounting pathways, reflecting differences in business model and accounting exposure, as shown in Table 5.
Among asset-intensive energy companies, Galp and EDP displayed broad accounting connectivity.
In Galp, transition and physical climate risks were linked to price and recoverability assumptions, impairment assessments, abandonment provisions, and asset divestment. The company recorded an A-Intensity of 95.8 and the highest overall ACI in the population.
EDP also displayed broad accounting connectivity. Transition-related matters were connected to impairment testing, useful-life assessments, provisions, investment decisions, and sustainable financing. Its A-Intensity was 95.8, with eight accounting mechanisms classified as applicable.
Forestry-related business models exhibited a different pathway. The Navigator Company connected climate- and forestry-related matters with cash-flow assumptions, biological-asset valuation, impairment, fair value, and useful-life considerations, resulting in an A-Intensity of 95.2. Semapa displayed a narrower pathway, principally associated with biological-asset valuation and related estimates and disclosures at group level.
Millennium BCP demonstrated a concentrated financial-instrument pathway. Climate-related information entered the forward-looking scenario framework used in IFRS 9 expected credit loss measurement. Although only four Accounting Consequence mechanisms were classified as applicable, all displayed maximum-strength connectivity, resulting in an A-Intensity of 100.
Jerónimo Martins exhibited a broader retail-related accounting pathway. Climate-related matters were connected to accounting assumptions, cash-flow projections, impairment, useful-life assessments, and fair-value considerations. In addition, its renewable-energy VPPA provided an identifiable sustainability-related derivative-accounting pathway. The company recorded an A-Intensity of 95.8.
Greenvolt displayed the narrowest positive Accounting Consequence profile among the seven companies. Its principal connectivity pathway concerned sustainable financing and the financial-statement treatment and disclosure of green debt instruments.
These cases illustrate the complementary roles of A-Intensity and A-Breadth. Millennium BCP displayed very strong accounting connectivity concentrated in four applicable mechanisms, whereas Galp, EDP, and Jerónimo Martins exhibited strong connectivity across a broader range of mechanisms.
Conversely, several companies displayed strong quantitative connectivity without observable Accounting Consequence Connectivity. CTT, Mota-Engil, and Sonae each recorded a Quantitative Connectivity score of 100 while receiving an A-Intensity of zero. Similar, although less pronounced, profiles were observed in several other companies.
The cross-company evidence therefore shows that numerical traceability and accounting connectivity do not necessarily develop in parallel. It also indicates that observable accounting connectivity may arise through materially different pathways depending on the undertaking’s business model.
4.6. Sensitivity and Robustness Analyses
The principal findings were stable across alternative population definitions and alternative specifications of the ACI.
Population-definition sensitivity analyses first assessed the treatment of Greenvolt and the simultaneous inclusion of Semapa and The Navigator Company.
Excluding Greenvolt reduced the population mean ACI from 57.1 to 56.3. Excluding Semapa resulted in a mean of 56.0, while excluding Navigator instead produced a mean ACI of 55.4. When both Greenvolt and Semapa were excluded, the mean ACI was 55.1.
None of these alternative population definitions altered the central dimensional pattern or the identity of the companies exhibiting the strongest Accounting Consequence Connectivity.
Additional robustness analyses assessed potential empirical overlap between individual ACI items.
R1 and R3, although conceptually distinguishing explicit cross-referencing from identification of the corresponding accounting location, produced identical classifications across the FY2024 population. Excluding R3 reduced the population mean ACI from 57.1 to 55.5. The alternative measure remained almost perfectly correlated with the primary ACI (Pearson r = 0.9991; Spearman ρ = 0.9992), and the maximum change in company ranking was one position.
M1 and M2 likewise produced identical FY2024 classifications despite representing distinct conceptual mechanisms. Excluding M2 resulted in a mean ACI of 58.0. The correlation with the primary ACI remained extremely high (Pearson r = 0.9996; Spearman ρ = 0.9935).
When R3 and M2 were excluded simultaneously, the population mean ACI was 56.4. The resulting specification remained almost perfectly associated with the primary index (Pearson r = 0.9994; Spearman ρ = 0.9932). The seven highest-scoring companies remained unchanged.
A further robustness analysis assessed the equal-dimension weighting used in the primary ACI.
Under the primary specification, Referential, Quantitative, Methodological, and Accounting Consequence Connectivity each contribute 25% to the overall score. An alternative item-weighted ACI was therefore calculated in which every applicable item contributed equally irrespective of dimension.
The item-weighted specification produced a population mean ACI of 58.9. It remained strongly associated with the primary measure (Pearson r = 0.9862; Spearman ρ = 0.9598). The seven highest-scoring companies and the two lowest-scoring companies remained unchanged.
The larger company-level differences observed under item weighting primarily reflected variation in A-Breadth. Where relatively few Accounting Consequence mechanisms were applicable, item weighting reduced the effective contribution of the Accounting Consequence dimension relative to Referential, Quantitative, and Methodological Connectivity.
This feature is illustrated by companies with relatively narrow A-Breadth and no observable Accounting Consequence Connectivity, whose overall scores increased under the item-weighted specification. Equal dimensional weighting was therefore retained as the primary specification because it preserves Referential, Quantitative, Methodological, and Accounting Consequence Connectivity as equally represented conceptual components of the ACI.
Finally, a conservative alternative specification combining item weighting with the simultaneous exclusion of R3 and M2 produced a population mean ACI of 59.0. The measure remained strongly correlated with the primary ACI (Pearson r = 0.9791; Spearman ρ = 0.9412), and the principal ranking pattern remained stable.
Full sensitivity and robustness results are reported in Supplementary Table S4.
Overall, neither alternative population definitions, potential empirical overlap between individual items, nor alternative weighting materially altered the substantive findings. Across specifications, Quantitative Connectivity remained the strongest and most widespread dimension, whereas Accounting Consequence Connectivity remained concentrated in a minority of companies.
5. Discussion
5.1. From Connected Disclosure to Connected Accounting
The central finding of this study is that connectivity between sustainability and financial reporting was already visible in the FY2024 ESRS reporting cycle, but its depth varied substantially across reporting mechanisms. Quantitative relationships were widespread, while observable Accounting Consequence Connectivity remained concentrated in a relatively small group of companies.
This distinction is more informative than characterising companies simply as “connected” or “disconnected”. The results suggest that connectivity can exist at different levels. At one level, sustainability information can be linked to identifiable financial-statement amounts through references, reconciliations, or common reporting boundaries. At a deeper level, sustainability-related information may also be incorporated into assumptions, estimates, scenarios, recognition, measurement, impairment testing, or other accounting processes.
The strong performance of the Quantitative dimension illustrates the first form particularly clearly. EU Taxonomy disclosures frequently created traceable relationships between turnover, CapEx, and OpEx measures and corresponding financial-statement information. Such relationships are meaningful because they improve users’ ability to understand how sustainability metrics relate to accounting amounts. However, they do not necessarily demonstrate that the sustainability-related risks or opportunities underlying those metrics influenced the accounting processes through which the financial statements were prepared.
This interpretation is consistent with emerging European evidence. EFRAG (2025) conceptualises connectivity as extending beyond cross-referencing and numerical alignment and emphasises the need for coherent relationships across different components of corporate reporting. ESMA’s first enforcement evidence similarly indicates that connectivity remains uneven, with relatively clear reconciliations often occurring in EU Taxonomy disclosures while links elsewhere in sustainability reporting are frequently incomplete or insufficiently specific (ESMA, 2026).
The present results extend this evidence by distinguishing the visibility of reporting connections from their depth within accounting processes. Several companies combined very strong Quantitative Connectivity with an A-Intensity of zero. CTT, Mota-Engil, and Sonae provide particularly clear examples: each achieved maximum Quantitative Connectivity while no observable evidence was identified that applicable sustainability-related matters had substantively entered the Accounting Consequence mechanisms assessed.
Accordingly, the findings support a distinction between disclosure connectivity and accounting connectivity. Disclosure connectivity concerns the ability to trace relationships between sustainability and financial information. Accounting connectivity concerns whether material sustainability-related information is observably incorporated into the accounting judgements, assumptions, estimates, measurement processes, or disclosures underlying the financial statements.
The two concepts are related, but they are not interchangeable. The results indicate that connected disclosure can develop considerably further than connected accounting.
5.2. Financial Materiality Does Not Automatically Produce Accounting Consequences
The findings also contribute to the conceptual relationship between double materiality and financial reporting.
Under the ESRS, financial materiality identifies sustainability-related risks and opportunities that may reasonably be expected to affect an undertaking’s financial position, financial performance, cash flows, access to finance, or cost of capital. However, the identification of a financially material sustainability matter does not determine its accounting treatment.
This distinction is visible in the Accounting Consequence results. In several companies, material sustainability-related risks created plausible pathways to accounting mechanisms such as measurement, impairment testing, accounting estimates, and cash-flow projections. Nevertheless, no observable evidence demonstrated that the sustainability-related matter had entered the relevant accounting inputs or judgements. Under the applicability framework, these observations were therefore classified as applicable and scored zero rather than being treated as non-applicable.
The distinction between A = 0 and NM is important. A zero score does not establish that management failed to consider the sustainability-related matter internally, nor does it indicate that the financial statements are necessarily deficient. It means that, based on publicly available reporting, a plausible accounting pathway existed but the incorporation of the sustainability-related matter into that pathway was not observable.
This interpretation is consistent with Oruç Erdoğan et al. (2026), who argue that climate-related sustainability information should not be expected to translate automatically into recognised accounting amounts. Their judgement-based framework demonstrates that connectivity may instead operate through existing accounting mechanisms, including impairment models, useful-life assessments, accounting assumptions, and disclosure requirements. A standards-consistent conclusion that no recognition or measurement adjustment is required may therefore represent appropriate accounting discipline rather than an absence of connectivity. The IASB’s illustrative examples on uncertainties in financial statements similarly emphasise entity-specific consideration and disclosure of relevant uncertainties within existing IFRS requirements (International Accounting Standards Board, 2025).
The evidence from the present study extends this reasoning beyond a single illustrative company and beyond climate reporting under IFRS S2. Across the Portuguese FY2024 population, the relevant pathway can be expressed conceptually as:
Double Materiality → Material IRO → Financial Effect → Accounting Assessment → Financial-Reporting Outcome
Crucially, progression along this pathway is not automatic. A material IRO may produce no current accounting consequence; a financial effect may arise outside the current reporting period; and an accounting assessment may appropriately conclude that no adjustment is required.
The contribution of accounting connectivity is therefore not to impose sustainability-based recognition rules on IFRS Accounting Standards. Rather, it concerns whether the interaction between sustainability-related information and existing accounting requirements is sufficiently coherent and observable.
5.3. Accounting Connectivity Varies Across Business Models
The results also show that substantive accounting connectivity does not arise through a common set of accounting outcomes across companies. Instead, the dominant pathways vary with the underlying business model and the nature of the sustainability-related exposures.
Among energy companies, Galp and EDP displayed broad pathways linking transition and physical climate matters with long-lived assets, recoverability assumptions, impairment, useful lives, provisions, investment decisions, and related financial-statement disclosures. These mechanisms are consistent with business models characterised by substantial physical assets, long investment horizons, and significant exposure to the energy transition.
The Navigator Company and Semapa exhibited a different configuration. Their connectivity involved forestry-related matters, biological-asset valuation, cash-flow assumptions, impairment, fair value, and useful-life considerations. The relevant accounting pathways therefore reflected both industrial assets and biological resources.
Millennium BCP provides an important contrast. Its accounting connectivity was narrower in breadth but particularly strong in intensity. Climate-related information entered financial reporting principally through forward-looking scenario analysis used in IFRS 9 expected credit loss measurement. The accounting transmission mechanism was therefore not based on physical-asset impairment or useful lives but on financial-instrument measurement and credit-risk modelling.
Jerónimo Martins displayed another configuration, combining climate-related assumptions and impairment pathways with useful-life, cash-flow, and fair-value considerations. Its renewable-energy VPPA additionally provided an identifiable pathway to derivative accounting.
These differences support the decision to construct the Accounting Consequence dimension around accounting mechanisms rather than individual accounting standards. An index based on the presence of particular IFRS standards would risk structurally favouring specific industries. The mechanism-based approach instead allows companies to demonstrate connectivity through accounting pathways appropriate to their business models.
The distinction between A-Intensity and A-Breadth is also relevant in this context. A company can display strong accounting connectivity through a relatively narrow number of highly relevant mechanisms, as illustrated by Millennium BCP, while another may exhibit similarly strong connectivity across a much broader range of accounting processes, as observed in Galp, EDP, and Jerónimo Martins.
Accordingly, greater A-Breadth should not automatically be interpreted as superior accounting connectivity. Breadth reflects the number of plausible accounting pathways, which is partly determined by the business model. A-Intensity instead captures the strength of observable connectivity within those mechanisms that are applicable.
The findings therefore suggest that comparisons of accounting connectivity should account for differences in business-model exposure rather than assume that every company should display the same accounting consequences.
5.4. Anticipated Financial Effects Remain a Weak Link
Current and anticipated financial effects represent one of the clearest areas in which first-cycle connectivity remained underdeveloped.
A substantial proportion of companies relied on the relevant first-year transitional relief, and among companies for which the related items were applicable, strong connectivity was uncommon. This contrasts sharply with the much stronger results observed for the reconciliation of existing turnover, CapEx, and OpEx amounts.
The contrast is understandable. Reconciling an existing accounting amount with a sustainability datapoint is fundamentally different from estimating the anticipated financial consequences of sustainability-related risks and opportunities. The latter requires assumptions about timing, probability, scenarios, future cash flows, strategic responses, and potentially long reporting horizons.
The Portuguese evidence is consistent with the broader implementation challenges documented by the DRSC (2026). In its study of 100 sustainability reports across five jurisdictions, fewer than half of the companies analysed reported anticipated financial effects, and approximately one quarter provided both quantitative and qualitative information. The study also identified substantial heterogeneity and difficulties in distinguishing anticipated from current financial effects.
The weak performance of anticipated financial-effects mechanisms should therefore be interpreted partly as a feature of an immature reporting area rather than simply as evidence of weak overall connectivity.
This also reinforces the distinction between the ACI and an ESRS compliance index. A company can exhibit substantive accounting connectivity through existing accounting processes while using available transitional relief for anticipated financial-effects disclosures. Conversely, a company may provide sustainability-related financial-effect information without demonstrating that the corresponding assumptions have entered financial reporting.
Future reporting cycles will provide an important test of whether this gap narrows. As transitional relief becomes less relevant and reporting practices mature, R4 and Q6 may become increasingly important indicators of the relationship between sustainability risks, expected financial consequences, and financial reporting.
5.5. Implications for the Measurement of Connectivity
The results provide several insights into the measurement of connectivity itself.
First, connectivity appears to be multidimensional rather than binary. The substantially different profiles of Referential, Quantitative, Methodological, and Accounting Consequence Connectivity indicate that these dimensions capture distinct characteristics of the reporting relationship.
A company may therefore display strong connectivity in one dimension while remaining weak in another. In particular, the results reject the implicit assumption that numerical reconciliation represents the endpoint of connectivity. Quantitative relationships were the most developed feature of first-cycle reporting, whereas incorporation into accounting estimates, assumptions, and consequences was far less widespread.
Second, the results suggest an increasing depth of connectivity from relatively visible reporting relationships towards substantive accounting integration:
Reference → Quantitative Relationship → Methodological Consistency → Accounting Consequence
This sequence should not be interpreted as a mandatory maturity model. A company need not achieve maximum Referential or Quantitative Connectivity before accounting connectivity can exist. Nevertheless, it provides a useful conceptual distinction between more mechanical reporting connections and deeper integration into accounting processes.
Third, the FY2024 coding revealed empirical overlap between some conceptually distinct items. R1 and R3 produced identical classifications across the population, as did M1 and M2. This may indicate that, during the first reporting cycle, companies that provided explicit sustainability-to-financial-statement references generally also enabled identification of the relevant accounting location, while reporting practices did not consistently distinguish between sustainability-related assumptions and the estimates derived from them.
Importantly, the robustness analyses indicate that the main findings are not driven by these overlaps. Excluding R3 and M2, individually or simultaneously, produced almost identical company-level results and rankings.
Fourth, the results support equal dimensional weighting as the primary ACI specification. Under an alternative item-weighted measure, the principal population pattern and leading companies remained stable. However, the effective influence of Accounting Consequence Connectivity became dependent on the number of applicable A items. Companies with narrow A-Breadth could therefore receive relatively little weight on the Accounting Consequence dimension even when no substantive accounting connectivity was observable.
Equal dimensional weighting avoids this effect by preserving Referential, Quantitative, Methodological, and Accounting Consequence Connectivity as four equally represented conceptual components of the construct.
The strong correlations between the primary ACI and the alternative specifications provide preliminary evidence that the main empirical conclusions are robust to reasonable changes in item composition and weighting. They should not, however, be interpreted as complete validation of a newly developed instrument. Further applications across jurisdictions and reporting periods remain necessary to assess the external validity and stability of the ACI.
Finally, the fact that the residual A10 category was not required in any of the 22 companies provides preliminary support for the coverage of the mechanism-based Accounting Consequence taxonomy. All observed pathways could be accommodated within recognition, measurement, estimates, impairment, provisions, useful lives, fair value, cash-flow projections, and financial-statement presentation or disclosure.
5.6. Implications for Preparers, Auditors, Standard Setters, and Enforcers
The findings have practical implications for the development of connected corporate reporting.
For preparers, the principal implication is that connectivity should not be approached primarily as a cross-referencing exercise. Cross-references and reconciliations improve traceability, but substantive accounting connectivity requires material sustainability-related risks and opportunities to be considered, where relevant, within existing accounting processes.
This may require closer interaction between sustainability, finance, risk-management, strategy, and accounting functions. Material IROs identified through the double materiality assessment should be assessed for potential relevance to impairment models, accounting estimates, useful lives, provisions, fair values, expected credit losses, cash-flow projections, and other financial-reporting judgements.
At the same time, preparers should not infer that every financially material sustainability matter must generate an accounting adjustment. Where the relevant accounting assessment results in no change to recognition or measurement, transparent disclosure of the relationship and the underlying judgement may itself strengthen connectivity.
For auditors and assurance providers, the results highlight the importance of consistency across reporting domains. Sustainability statements and financial statements may be subject to different reporting and assurance requirements, but inconsistencies in material assumptions, reporting boundaries, scenarios, or financial effects may nevertheless undermine the coherence of the annual reporting package.
For standard setters, the findings suggest that further implementation support could usefully focus on the mechanisms linking sustainability information with existing accounting judgements rather than solely on additional disclosure requirements. EFRAG’s connectivity project is particularly relevant in this respect because it frames connectivity as a corporate-reporting issue extending beyond simple cross-referencing (EFRAG, 2025).
Anticipated financial effects warrant particular attention. The evidence from both the present study and DRSC (2026) suggests that preparers continue to face difficulties in identifying, quantifying, and comparably explaining these effects.
For enforcers, the results reinforce the importance of distinguishing meaningful connections from generic references. ESMA’s 2026 enforcement evidence similarly shows that broad references to financial-statement notes or the presence of isolated financial information do not necessarily allow users to understand the relationship between sustainability and financial reporting.
More broadly, the study suggests that the next phase of ESRS implementation should not be evaluated solely by the quantity of sustainability information disclosed. As reporting practices mature, an increasingly relevant question will be whether sustainability-related information is coherently integrated with the assumptions, estimates, judgements, and financial consequences reflected elsewhere in corporate reporting.
The FY2024 evidence indicates that the infrastructure for connected reporting is already comparatively developed in areas such as quantitative reconciliation, reporting boundaries, and sustainability-to-financial-statement references. The more demanding transition from connected disclosure to connected accounting, however, remains incomplete.
6. Conclusions
This study examined accounting connectivity between FY2024 ESRS sustainability statements and the corresponding IFRS financial statements of Portuguese listed companies. Using the full eligible population of 22 companies, the study developed and applied a multidimensional Accounting Connectivity Index (ACI) comprising Referential, Quantitative, Methodological, and Accounting Consequence Connectivity.
The findings show that connectivity was already visible during the first ESRS reporting cycle, but its depth varied substantially across reporting mechanisms and companies. Quantitative Connectivity was the strongest and most widespread dimension, reflecting extensive traceability between sustainability metrics and financial-statement amounts, particularly through EU Taxonomy disclosures. By contrast, observable Accounting Consequence Connectivity was concentrated in only seven companies. In many other cases, sustainability-related matters had plausible pathways to accounting mechanisms such as measurement, impairment, accounting estimates, and cash-flow projections, but no public evidence demonstrated that those matters had substantively entered the relevant accounting processes.
The central conclusion is therefore that quantitative connectivity does not necessarily imply accounting connectivity. A sustainability datapoint may be fully traceable to a financial-statement amount without demonstrating that the underlying sustainability-related risk or opportunity influenced accounting recognition, measurement, assumptions, estimates, or judgements. Conversely, the absence of a recognised accounting adjustment does not necessarily indicate an absence of connectivity where the sustainability-related matter has been demonstrably considered within the relevant accounting assessment.
The study also shows that accounting-connectivity pathways vary substantially across business models. Energy companies exhibited pathways involving long-lived assets, impairment, useful lives, provisions, and transition-related investment; forestry-related businesses displayed links through biological-asset valuation and related estimates; banking connectivity emerged principally through climate-related scenario analysis and expected credit loss measurement; and other business models exhibited distinct combinations of accounting mechanisms. These differences support the use of a sector-neutral, mechanism-based framework rather than an approach centred on accounting standards or predetermined financial-statement areas.
The study makes three principal contributions. First, it extends the emerging ESRS literature beyond sustainability-disclosure practices and double materiality assessments by examining the observable relationship between sustainability information and financial reporting. Second, it introduces the ACI as a replicable framework that distinguishes relatively visible forms of disclosure connectivity from methodological consistency and substantive accounting consequences. Third, it contributes to the conceptualisation of connectivity by separating disclosure connectivity from accounting connectivity and by recognising that financially material sustainability matters need not result in accounting recognition or measurement adjustments to be meaningfully connected with financial reporting.
The robustness analyses provide additional support for these conclusions. The main results remained stable under alternative population definitions, after excluding potentially overlapping ACI items, and under an alternative item-weighted specification. Although further validation is required before the ACI can be regarded as a general measurement instrument, these results suggest that the principal findings are not driven by specific sample-definition, item-selection, or weighting decisions.
Several limitations should nevertheless be recognised. First, the study examines only the FY2024 reporting cycle and therefore captures an early stage of ESRS implementation in which reporting practices were still developing and transitional provisions remained relevant. Second, the analysis is based exclusively on publicly available reporting. A score of zero indicates that observable evidence of accounting connectivity was not identified; it does not establish that sustainability-related matters were not considered internally by management. Third, applicability assessment necessarily involves judgement, notwithstanding the use of a detailed coding manual, pilot testing, consistency auditing, and test–retest reliability procedures. Fourth, the analytical population is limited to 22 Portuguese listed companies, which constrains the generalisability of the findings beyond the defined population. Finally, the ACI is a newly developed instrument and requires further application and validation across jurisdictions, sectors, and reporting periods.
These limitations also identify several directions for future research. Longitudinal analysis could determine whether accounting connectivity increases as ESRS reporting practices mature and transitional relief becomes less relevant. Cross-country applications of the ACI could assess whether connectivity differs across regulatory, enforcement, assurance, and institutional environments; a natural next step would be a FY2025 comparison with other Southern European markets, such as Spain or Italy. Future studies could also examine potential determinants of accounting connectivity, including company size, business model, sustainability exposure, auditor or assurance provider, governance characteristics, and reporting experience. Independent replication and broader inter-coder validation would further strengthen the measurement framework. Larger and multi-period datasets could ultimately enable examination of whether stronger accounting connectivity is associated with financial-reporting quality, investor understanding, information asymmetry, or capital-market outcomes.
Overall, the first ESRS reporting cycle suggests that companies have made considerable progress in establishing visible links between sustainability and financial reporting, particularly through quantitative reconciliation and common reporting structures. The more demanding transition from connected disclosure to connected accounting, however, remains incomplete. As ESRS implementation matures, the extent to which material sustainability-related information becomes coherently reflected in accounting assumptions, estimates, judgements, measurement, and disclosures is likely to become an increasingly important indicator of genuine corporate-reporting connectivity.
Supplementary Materials
The following supporting information can be downloaded at the website of this paper posted on Preprints.org: Supplementary Data S1 (Excel workbook), containing Table S1: Population screening and documents analysed (worksheet Population_Screening); Table S2: Full item-level Accounting Connectivity Index coding matrix (worksheet Evidence_Log); Table S3: Consistency and reliability audit (worksheets Reliability, Consistency_Checks, and Audit_Summary, with the supporting Audit_Changes audit trail); and Table S4: Sensitivity and robustness analyses of the Accounting Connectivity Index (worksheet Robustness_Checks), together with supporting company summaries, audited rankings, and results tables. Supplementary File S1 contains the Accounting Connectivity Index Coding Manual.
Author Contributions
Conceptualization, F.A.; Methodology, F.A.; Validation, F.A. and R.C.; Formal Analysis, F.A.; Investigation, F.A. and R.C.; Data Curation, F.A.; Writing—Original Draft Preparation, F.A.; Writing—Review and Editing, F.A. and R.C.; Visualization, F.A.; Project Administration, F.A. All authors have read and agreed to the published version of the manuscript.
Funding
This research received no external funding.
Institutional Review Board Statement
Not applicable. This study relied exclusively on publicly available corporate reporting documents and did not involve human participants, personal data, or experimental interventions.
Informed Consent Statement
Not applicable. This study did not involve human participants.
Data Availability Statement
The source documents analysed in this study consist of publicly available FY2024 corporate reports, sustainability statements, financial statements, and related corporate reporting documents issued by the companies included in the analytical population. The documents analysed and their corresponding public sources are identified in Supplementary Data S1, worksheet Population_Screening (Table S1). The complete derived dataset underlying the results of the study is provided as Supplementary Data S1. It includes the population screening, item-level applicability classifications, ACI scores, documentary evidence references, evidence-cluster identifiers, accounting-standard metadata, coding rationales, company-level calculations, consistency and reliability audit, and sensitivity and robustness analyses. The Accounting Connectivity Index Coding Manual is provided as Supplementary File S1.
Acknowledgments
During the preparation of this manuscript and study, the authors used OpenAI’s ChatGPT (GPT-5.6 Sol) for research-structure support, documentary organisation, spreadsheet and analytical checks, preparation of the conceptual diagram, and language refinement. The authors reviewed and edited the output and take full responsibility for the content of this publication.
Conflicts of Interest
The authors declare no conflicts of interest.
References
- Azevedo, G.; Oliveira, J.; Sousa, I.; Borges, M. F.; Tavares, M. C.; Vale, J. Disclosure of sustainability information under the Corporate Social Responsibility Directive: The degree of compliance of Portuguese Stock Index companies. Int. J. Financ. Stud. 2025, 13(1), 13. [Google Scholar] [CrossRef]
- Baumüller, J.; Sopp, K. Double materiality and the shift from non-financial to European sustainability reporting: Review, outlook and implications. J. Appl. Account. Res. 2022, 23(1), 8–28. [Google Scholar] [CrossRef]
- Christensen, H. B.; Hail, L.; Leuz, C. Mandatory CSR and sustainability reporting: Economic analysis and literature review. Rev. Account. Stud. 2021, 26(3), 1176–1248. [Google Scholar] [CrossRef]
- Correa-Mejía, D. A.; Correa-García, J. A.; García-Benau, M. A. Analysis of double materiality in early adopters: Are companies walking the talk? Sustain. Account. Manag. Policy J. 2024, 15(2), 299–329. [Google Scholar] [CrossRef]
- Deutsches Rechnungslegungs Standards Committee. Reporting on anticipated financial effects. 2026. Available online: https://www.drsc.de/en/news/drsc-studie-reporting-on-anticipated-financial-effects/.
- Dragomir, V. D.; Dumitru, M.; Chersan, I. C.; Gorgan, C.; Păunescu, M. Double materiality disclosure as an emerging practice: The assessment process, impacts, risks, and opportunities. Account. Eur. 2025, 22(1), 103–140. [Google Scholar] [CrossRef]
- European Commission. Commission Delegated Regulation (EU) 2023/2772 of 31 July 2023 supplementing Directive 2013/34/EU of the European Parliament and of the Council as regards sustainability reporting standards. Official Journal of the European Union. 2023. Available online: https://eur-lex.europa.eu/eli/reg_del/2023/2772/oj/eng.
- European Financial Reporting Advisory Group. Connectivity considerations and boundaries of different annual report sections: Initial paper. 2024. Available online: https://www.efrag.org/en/media/27477.
- European Financial Reporting Advisory Group. Connectivity of financial and sustainability reporting: Discussion paper. 2025. Available online: https://www.efrag.org/en/financial-reporting/about-connectivity.
- European Parliament and Council of the European Union. Directive (EU) 2022/2464 of the European Parliament and of the Council of 14 December 2022 amending Regulation (EU) No 537/2014, Directive 2004/109/EC, Directive 2006/43/EC and Directive 2013/34/EU, as regards corporate sustainability reporting. Off. J. Eur. Union 2022, L 322, 15–80. Available online: https://eur-lex.europa.eu/eli/dir/2022/2464/oj/eng.
- European Securities and Markets Authority. Report on 2025 corporate reporting enforcement and regulatory activities (ESMA32-2064178921-9413). 2026. Available online: https://www.esma.europa.eu/document/report-2025-corporate-reporting-enforcement-and-regulatory-activities.
- Ferreira-da-Silva, A. C.; Maldonado, I.; Pinho, C.; Silva, L. P. Assessing the sustainability disclosure practices of Portuguese PSI companies. Rev. De Adm. Contemp. 2025, 29(5), e240307. [Google Scholar] [CrossRef]
- Mazars, Forvis. Financial reporting of European companies on sustainability issues. 2026. Available online: https://www.forvismazars.com/es/en/insights/our-publications-and-reports/financial-reporting-on-sustainability-issues.
- IFRS Foundation. Effects of climate-related matters on financial statements. 2023. Available online: https://www.ifrs.org/content/dam/ifrs/supporting-implementation/documents/effects-of-climate-related-matters-on-financial-statements.pdf.
- IFRS Interpretations Committee. Climate-related commitments (IAS 37 Provisions, Contingent Liabilities and Contingent Assets): Agenda decision. IFRS Foundation, 2024. Available online: https://www.ifrs.org/projects/completed-projects/2024/climate-related-commitments-ias-37/.
- International Accounting Standards Board. Disclosures about uncertainties in the financial statements—Illustrative examples. IFRS Foundation. 2025. Available online: https://www.ifrs.org/news-and-events/news/2025/11/iasb-issues-illustrative-examples-reporting-uncertainties-financial-statements/.
- Morganho, C.; Milánes-Montero, P.; Pérez-Calderón, E. The determinants of materiality assessment disclosures in the sustainability statements of Iberian-listed companies. Corp. Soc. Responsib. Environ. Manag. 2025, 32(3), 3659–3673. [Google Scholar] [CrossRef]
- Nobes, C. From no materiality to double materiality: A long-run conceptual analysis of corporate reporting regulation. Account. Bus. Res. 2026, 56(1), 41–68. [Google Scholar] [CrossRef]
- Oruç Erdoğan, E.; Erdoğan, M.; Acar, D.; Kıymetli Şen, İ. A judgement-based connectivity framework linking IFRS S2 climate-related disclosures to IFRS recognition, measurement, and disclosure outcomes: An illustrative application. J. Risk Financ. Manag. 2026, 19(6), 406. [Google Scholar] [CrossRef]
- van der Tas, L.; Roozen, K. Connectiviteit tussen het duurzaamheidsverslag en de jaarrekening [Connectivity between sustainability report and financial statements]. Tijdschr. Voor Jaarrekeningenrecht 2026, 21(2), 44–52. [Google Scholar]
Figure 1.
Conceptual framework linking double materiality, financial effects, accounting connectivity, and financial reporting.
Figure 1.
Conceptual framework linking double materiality, financial effects, accounting connectivity, and financial reporting.
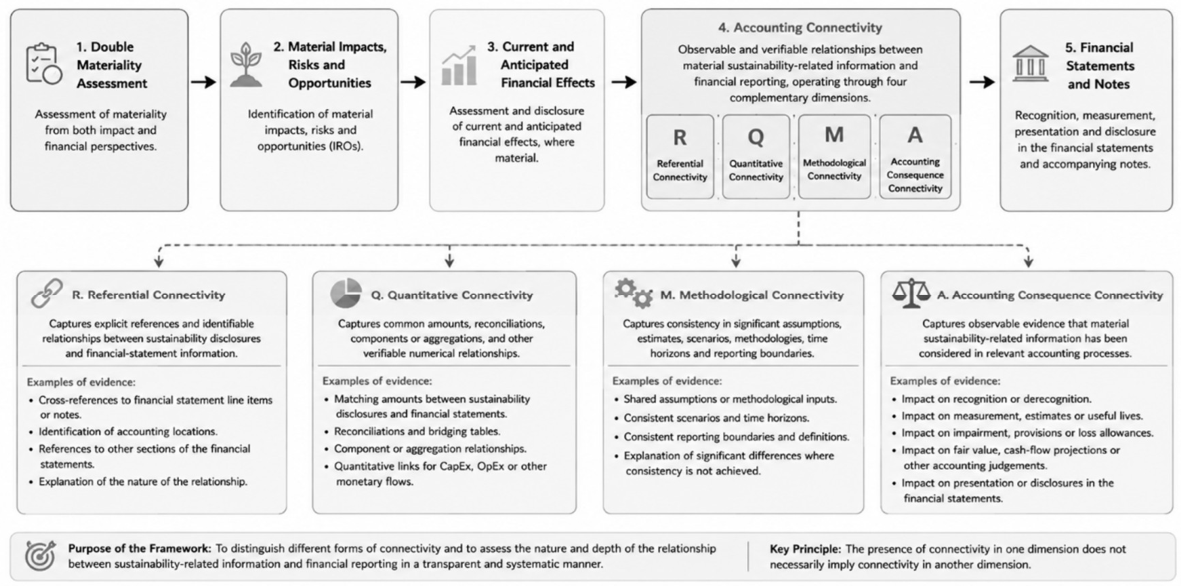

Table 1.
Company-level audited Accounting Connectivity Index scores.
| Rank | Company | Sector | R | Q | M | A-Intensity | ACI | A-Breadth |
|---|---|---|---|---|---|---|---|---|
| 1 | Galp Energia, SGPS, S.A. | Energy | 100.0 | 88.9 | 94.4 | 95.8 | 94.8 | 8 |
| 2 | The Navigator Company, S.A. | Pulp / Paper | 88.9 | 100.0 | 86.7 | 95.2 | 92.7 | 7 |
| 3 | EDP, S.A. | Energy / Utilities | 88.9 | 86.7 | 93.3 | 95.8 | 91.2 | 8 |
| 4 | Jerónimo Martins, SGPS, S.A. | Retail / Consumer | 91.7 | 86.7 | 86.7 | 95.8 | 90.2 | 8 |
| 5 | Banco Comercial Português, S.A. (Millennium BCP) | Banking | 66.7 | 88.9 | 86.7 | 100.0 | 85.6 | 4 |
| 6 | Semapa – Sociedade de Investimento e Gestão, SGPS, S.A. | Diversified holding | 77.8 | 100.0 | 73.3 | 66.7 | 79.4 | 4 |
| 7 | Greenvolt – Energias Renováveis, S.A. | Renewable energy | 66.7 | 80.0 | 66.7 | 83.3 | 74.2 | 2 |
| 8 | Mota-Engil, SGPS, S.A. | Construction / Engineering | 77.8 | 100.0 | 53.3 | 0.0 | 57.8 | 5 |
| 9 | Sonae, SGPS, S.A. | Retail / Diversified group | 77.8 | 100.0 | 50.0 | 0.0 | 56.9 | 5 |
| 10 | Altri, SGPS, S.A. | Pulp / Forest products | 77.8 | 80.0 | 53.3 | 0.0 | 52.8 | 5 |
| 11 | CTT – Correios de Portugal, S.A. | Postal / Logistics | 77.8 | 100.0 | 33.3 | 0.0 | 52.8 | 3 |
| 12 | REN – Redes Energéticas Nacionais, SGPS, S.A. | Energy infrastructure / Utilities | 58.3 | 83.3 | 60.0 | 0.0 | 50.4 | 5 |
| 13 | Corticeira Amorim, S.G.P.S., S.A. | Cork / Industrials | 66.7 | 88.9 | 40.0 | 0.0 | 48.9 | 5 |
| 14 | NOS, SGPS, S.A. | Telecommunications | 55.6 | 80.0 | 60.0 | 0.0 | 48.9 | 5 |
| 15 | Teixeira Duarte, S.A. | Construction / Diversified | 55.6 | 86.7 | 53.3 | 0.0 | 48.9 | 1 |
| 16 | Toyota Caetano Portugal, S.A. | Automotive / Mobility | 58.3 | 55.6 | 46.7 | 0.0 | 40.1 | 2 |
| 17 | Martifer, SGPS, S.A. | Engineering / Renewable energy | 44.4 | 80.0 | 33.3 | 0.0 | 39.4 | 5 |
| 18 | Grupo Media Capital, SGPS, S.A. | Media | 44.4 | 86.7 | 26.7 | 0.0 | 39.4 | 1 |
| 19 | Ibersol, SGPS, S.A. | Restaurants / Consumer services | 41.7 | 72.2 | 40.0 | 0.0 | 38.5 | 5 |
| 20 | Impresa – SGPS, S.A. | Media | 41.7 | 83.3 | 20.0 | 0.0 | 36.3 | 5 |
| 21 | Glintt Global, S.A. | Technology / Healthcare IT | 25.0 | 33.3 | 20.0 | 0.0 | 19.6 | 1 |
| 22 | Novabase, SGPS, S.A. | Technology / IT services | 25.0 | 16.7 | 26.7 | 0.0 | 17.1 | 1 |
Table 2.
Descriptive statistics for the ACI and its dimensions (N = 22).
| Measure | Mean | Median | SD | Minimum | Q1 | Q3 | Maximum |
|---|---|---|---|---|---|---|---|
| R | 64.0 | 66.7 | 21.0 | 25.0 | 47.2 | 77.8 | 100.0 |
| Q | 80.8 | 86.7 | 21.0 | 16.7 | 80.0 | 88.9 | 100.0 |
| M | 54.7 | 53.3 | 24.0 | 20.0 | 35.0 | 71.7 | 94.4 |
| A-Intensity | 28.8 | 0.0 | 43.5 | 0.0 | 0.0 | 79.2 | 100.0 |
| ACI | 57.1 | 51.6 | 23.4 | 17.1 | 39.6 | 78.1 | 94.8 |
| A-Breadth | 4.3 | 5.0 | 2.3 | 1.0 | 2.3 | 5.0 | 8.0 |
Table 3.
Item-level evidence for referential, quantitative and methodological connectivity.
| Item | Mechanism | Applicable n | Mean score | Score ≥2 n | Score ≥2 (% app.) | Score 3 n | TR/NM |
|---|---|---|---|---|---|---|---|
| R1 | Sustainability statement → financial statements | 22 | 2.36 | 20 | 90.9 | 10 | 0/0 |
| R2 | Financial statements → sustainability statement | 22 | 1.14 | 7 | 31.8 | 2 | 0/0 |
| R3 | Identifiable accounting location | 22 | 2.36 | 20 | 90.9 | 10 | 0/0 |
| R4 | Financial-effects linkage | 9 | 1.44 | 3 | 33.3 | 1 | 13/0 |
| Q1 | Matching monetary/quantitative amounts | 22 | 2.82 | 21 | 95.5 | 19 | 0/0 |
| Q2 | Quantitative reconciliation | 22 | 2.14 | 19 | 86.4 | 8 | 0/0 |
| Q3 | Component/aggregation relationship | 22 | 2.36 | 20 | 90.9 | 11 | 0/0 |
| Q4 | CapEx connectivity | 20 | 2.80 | 19 | 95.0 | 17 | 0/2 |
| Q5 | OpEx connectivity | 17 | 2.59 | 17 | 100.0 | 10 | 0/5 |
| Q6 | Quantified financial effects | 9 | 1.22 | 2 | 22.2 | 0 | 13/0 |
| M1 | Consistency of significant assumptions | 22 | 1.18 | 7 | 31.8 | 5 | 0/0 |
| M2 | Consistency of estimates | 22 | 1.18 | 7 | 31.8 | 5 | 0/0 |
| M3 | Time-horizon consistency | 22 | 1.95 | 19 | 86.4 | 2 | 0/0 |
| M4 | Scenario and strategic assumption consistency | 22 | 1.32 | 9 | 40.9 | 3 | 0/0 |
| M5 | Explanation of methodological differences | 2 | 2.50 | 2 | 100.0 | 1 | 0/20 |
| M6 | Reporting-boundary consistency | 22 | 2.55 | 22 | 100.0 | 12 | 0/0 |
Note. Mean score is calculated only across applicable observations (Status = A). TR/NM reports transitional-relief and not-material/not-applicable counts.
Table 4.
Accounting-consequence mechanisms across the 22 companies.
| Item | Mechanism | Applicable n | Positive n | Positive (% app.) | Score 3 n | Score 0 n | NM | UD |
|---|---|---|---|---|---|---|---|---|
| A1 | Recognition and derecognition | 4 | 4 | 100.0 | 3 | 0 | 18 | 0 |
| A2 | Measurement | 16 | 6 | 37.5 | 5 | 10 | 6 | 0 |
| A3 | Accounting estimates and assumptions | 15 | 6 | 40.0 | 5 | 9 | 7 | 0 |
| A4 | Impairment and loss allowances | 15 | 5 | 33.3 | 5 | 10 | 7 | 0 |
| A5 | Provisions and contingent liabilities | 3 | 2 | 66.7 | 2 | 1 | 19 | 0 |
| A6 | Useful lives and residual values | 4 | 4 | 100.0 | 0 | 0 | 18 | 0 |
| A7 | Fair value | 3 | 3 | 100.0 | 2 | 0 | 18 | 1 |
| A8 | Cash-flow projections | 13 | 4 | 30.8 | 4 | 9 | 9 | 0 |
| A9 | Financial-statement presentation and disclosure | 22 | 7 | 31.8 | 6 | 15 | 0 | 0 |
| A10 | Other accounting consequences | 0 | 0 | — | 0 | 0 | 22 | 0 |
Note. Positive = score > 0 among applicable observations. A10 was not used in FY2024 coding.
Table 5.
Dominant accounting-connectivity pathways among companies with A-Intensity > 0.
| Company | Sector | Dominant sustainability → accounting pathway | Main accounting areas | A-Intensity | ACI | A-Breadth |
|---|---|---|---|---|---|---|
| Galp Energia, SGPS, S.A. | Energy | Transition/physical risks → price and recoverability assumptions → impairment, abandonment provisions and divestment | IAS 36; IAS 37; disposal accounting | 95.8 | 94.8 | 8 |
| The Navigator Company, S.A. | Pulp / Paper | Climate/forestry risks → cash-flow assumptions and biological-asset valuation → impairment, fair value and useful lives | IAS 36; IAS 41; IAS 16 | 95.2 | 92.7 | 7 |
| EDP, S.A. | Energy / Utilities | Transition strategy → physical assets and financing → impairment, useful lives, provisions, CapEx and sustainable debt | IAS 36; IAS 16; IAS 37; IFRS 9 | 95.8 | 91.2 | 8 |
| Jerónimo Martins, SGPS, S.A. | Retail / Consumer | Climate risk → assumptions/cash flows → impairment, useful lives and fair value; renewable VPPA → derivative accounting | IAS 36; IAS 16; IFRS 13; IFRS 9 | 95.8 | 90.2 | 8 |
| Banco Comercial Português, S.A. (Millennium BCP) | Banking | Climate risk → forward-looking scenario weighting → IFRS 9 expected credit loss measurement | IFRS 9; IFRS 7 | 100.0 | 85.6 | 4 |
| Semapa – Sociedade de Investimento e Gestão, SGPS, S.A. | Diversified holding | Climate/forestry matters → biological-asset valuation and group estimates/disclosures | IAS 41; IAS 1 | 66.7 | 79.4 | 4 |
| Greenvolt – Energias Renováveis, S.A. | Renewable energy | Sustainable-finance strategy → green debt instruments and related financial-statement disclosure | IFRS 9; IFRS 7 | 83.3 | 74.2 | 2 |
Disclaimer/Publisher’s Note: The statements, opinions and data contained in all publications are solely those of the individual author(s) and contributor(s) and not of MDPI and/or the editor(s). MDPI and/or the editor(s) disclaim responsibility for any injury to people or property resulting from any ideas, methods, instructions or products referred to in the content. |
© 2026 by the authors. Licensee MDPI, Basel, Switzerland. This article is an open access article distributed under the terms and conditions of the Creative Commons Attribution (CC BY) license (http://creativecommons.org/licenses/by/4.0/).
Copyright: This open access article is published under a Creative Commons CC BY 4.0 license, which permit the free download, distribution, and reuse, provided that the author and preprint are cited in any reuse.