

Submitted:
13 September 2026
Posted:
15 September 2026
You are already at the latest version
Abstract
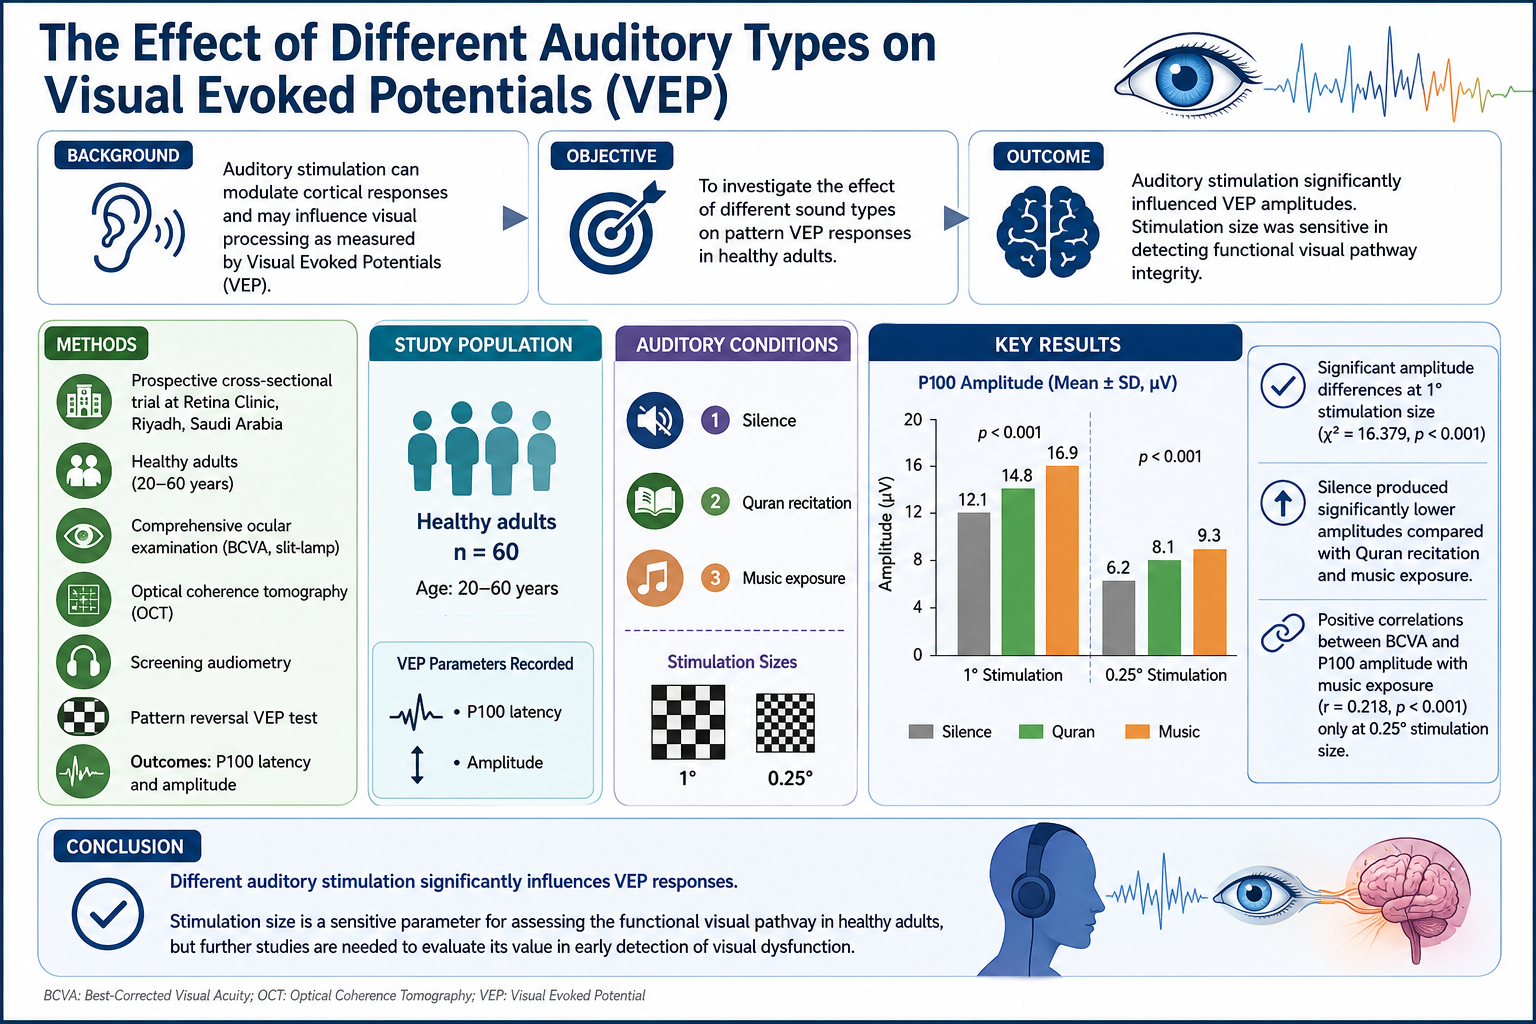
Background/Objectives: To investigate the effect of different sound types on pattern visual evoked potential (VEP) responses among healthy adults. Methods: This prospective cross-sectional trial was conducted at the Retina Clinic, Ophthalmology Department, tertiary Hospital in Riyadh, Saudi Arabia. Healthy adults with no systemic or ocular diseases aged 20-60 years were included. All participants underwent comprehensive visual and ocular assessment including best-corrected visual acuity (BCVA), slit-lamp examination, optical coherence tomography (OCT), screening audiometry, and pattern-reversal visual evoked potential (VEP) test conducted under three auditory conditions: silence, Quran recitation, and music exposure. P100 latency and amplitude were recorded using 1° and 0.25° stimulation sizes. Statistical analysis was performed using non-parametric statistical tests including the Friedman test and Bonferroni-corrected post-hoc comparisons. Results: Significant differences in VEP amplitude responses were observed across auditory conditions, particularly at the 1° stimulation size indicated 95% confidence intervals and exact P value for effects. The Friedman test demonstrated significant amplitude differences at the 1° stimulation size (χ²(2)=16.379, p<0.001), with silence producing significantly higher amplitudes compared with Quran recitation and music exposure (p=0.001). Significant positive correlations were identified between BCVA and P100 amplitude at music exposure (r=0.218, p<0.001) only at the 0.25° stimulation size. Conclusion: Different auditory stimulation significantly influenced VEP responses. Stimulation size could be sensitive in detecting the functional visual pathway in healthy adults, but it could be great sensitive for detecting abnormalities in ocular conditions. Further studies are required to assess the potential value of VEP as a non-invasive test for early neural dysfunction.
Keywords:
visual evoked potential (VEP)
; auditory stimulations
; amplitude and latency
; human and health
1. Introduction
The Visual Evoked Potential (VEP) is a sensitive non-invasive electrophysiological measure of visual pathway function from the retina through the optic nerve to the occipital cortex in the brain, elicited by visual stimulation recorded from scalp electrodes placed over the occipital cortex.[1,2] These signals are transmitted through bipolar and ganglion cells, where axons converge to form the optic nerve.[3]
The gold standard and most widely used type in clinical and research settings for evaluating optic nerve function is the pattern-reversal VEP.[4] It produces a specific waveform consisting of three major components: an initial negative deflection at approximately 75 ms (N75), a prominent positive peak at approximately 100 ms (P100), and a subsequent negativity at approximately 145 ms (N145). The P100 component serves as the primary clinical indication of visual pathway stimulation because of its relative stability for many individuals.[4] The component of P100 displays corresponding neural activity across the primary visual cortex (V1) and early extrastriate areas. The latency of P100 is affected by signal transmission speed along the visual pathway, whereas the amplitude depends on the synchrony and degree of the cortical response. Normative P100 latencies in healthy adults usually range from 95 to 115 ms, and amplitudes from 5 to 15 µV.5 The normal values for P100 latency and amplitude, with a range of physiological and environmental variables such as age, gender, visual acuity, electrode placement, and stimulus parameters, can influence these parameters.[5]
Research interest concerns the influence of simultaneous auditory input on VEP characteristics. The type of sound present with different rhythm, complexity or emotional tone during VEP recording or visual task performance can influence VEP amplitude and latency parameters.[6,7] Multisensory combination between vision and auditory is a fundamental feature of cortical arrangement of the brain, as it does not process sensory modalities in strict isolation.[8] Auditory signals can reach the visual cortex via corticocortical networks and can transform the neural activity applied to incoming visual information.[9] This modulation depends on the type of auditory stimulus presented, whether it is silence, speech, music, noise or emotionally valanced sound.[10,11] Thus, understanding the relationships between vision and auditory has consequences for multisensory neuroscience and the VEP records, which can serve in the development of auditory-assisted visual rehabilitation strategies. Manjarrez et al.[12] reported an inverted U-shaped relationship between mechanical noise affecting the P100 VEP amplitude, in which noise from one sensory modality enhances the evoked response.[12] A study showed that classical music had no significant effect on VEP amplitude or latency compared to silence, indicating that classical auditory input may not interfere with visual cortical processing.[13] These findings suggested that background music can be used during VEP recording without compromising signal quality. Another study investigated the effect of auditory stimuli consisting of simple tones and visual stimulation during object recognition in healthy subjects. It found that visual cortical activation was increased within 40-90 ms in early event-related potentials, with increased P100 and reduced amplitudes observed when visual stimuli were paired with congruent sound, indicating early cross-modal integration and facilitated visual processing.[14]
Moreover, there were general amplitude-changing effects of noise; the semantic and the characteristics of sound exert distinct influences on early visual cortical processing. Cross-modal congruency, represented by the degree of matching between auditory and visual stimuli in meaning or context, is a key determining factor of how auditory input changes visual responses. Molholm et al.[8] examined cross-modal combination using event-related potentials (ERPs) elicited by auditory (noise bursts), visual (flashes), and simultaneous audiovisual stimuli. They identified early neural interactions within the first 200 ms post-stimulus onset, consistent with rapid audiovisual convergence near primary sensory cortices. It was reported that bimodal stimuli facilitated faster and more accurate responses than unimodal stimuli, and the neural response to combined stimulation exceeded the sum of the individual modality responses earlier, demonstrating good multisensory enhancement.[8]
Speech can also be associated with audiovisual integration at the cortical level. Research on auditory-visual speech combination highlighted that even speech sounds can reduce the amplitude of visual event-related potential when presented in close temporal near to visual stimuli.[15] The N100 auditory evoked component is significantly shorter in latency when matching audiovisual speech stimuli are presented compared to either unimodal auditory speech or different audiovisual combinations. This suggests that the semantic and phonological content of speech shapes early neural synchronization across auditory and visual cortices.[16]
The effect of sound type on VEP is under investigation through mechanisms including multisensory stochastic resonance, cross-modal audiovisual combination, different categories of sound ranging from music to noise, and speech, which exert differential effects on VEP amplitude and latency. This study aimed to investigate the effect of different sound types (Quran recitation and classical music) on pattern visual evoked potential (VEP) responses among healthy adults by exploring the interaction of visual neurophysiology and auditory stimulation and highlighted the potential role of auditory stimuli, particularly Quran recitation, in modulating visual cortical responses and revealing early functional alterations before clinical signs appear. and demonstrated cross-modal integration between sensory systems.[7] This study investigated the effect of different sound types on pattern visual evoked potential (VEP) responses among healthy adults. The study provided novel insight into how auditory input interacts with visual neurophysiology, offering an objective, non- pharmacological and supportive approach-especially in populations with limited communication abilities.
2. Materials and Methods
This prospective cross-sectional clinical trial was conducted at the retina clinic at the Ophthalmology Department at King Abdulaziz University Hospital, Riyadh, Saudi Arabia. Ethics approval was obtained from the institutional review board (IRB) and the ethics scientific research committee at King Saud University. (Approval No. E-25-10435; approval date: 1 June 2026). Healthy Subjects with no ocular or systemic diseases aged between 20 to 60 years were included in this study. Subjects with best corrected visual acuity (BCVA) 0.40 LogMAR or better and with normal hearing were included in this study. Subjects aged less than 20 or more than 60 years were excluded to minimize the influence of age-related variability in VEP latency and amplitude. Subjects with ocular disorders or any neurodegenerative disorders, hearing impairment, patient with best visual acuity less than 0.40 LogMAR were excluded from this study due to their impact on visual stimulation.[17] patients taking neurotoxic drugs were also excluded because these conditions can independently affect neural transmission, cortical responses or the accuracy of visual and auditory evoked potential recording.
A total of 30 participants (59 eyes) were included in this study. Based on previous VEP studies, it was reported that patients had significantly prolonged P100 latency and amplitude. Statistical analysis of a previous study indicated that detecting latency differences would require only 9 subjects, while amplitude differences would require about 24 subjects (48 eyes) after calculating α=0.05, power=0.80.[18] To cover both outcomes and allow for potential data loss due to artifact, this study recruited about 50 eyes.
Measurements including best corrected Visual Acuity, slit lamp examination, VEP test to measure (P100 latency and amplitude) with two stimulation check sizes (1° and 0.25° visual angle), OCT test and screening audiometry were performed. Visual acuity was assessed using a LogMAR chart. Slit-lamp examination was performed to evaluate ocular health, particularly retinal status. OCT examination using Heidelberg OCT was performed to detect ocular conditions and measure central macular thickness (CMT) and ganglion cell layer (GCL) thickness. Hearing assessment was performed using pure tone audiometry at the audiology clinic to evaluate hearing status.
Procedure
All participants read the study information and signed the consent form. After obtaining the BCVA using the Early Treatment Diabetic Retinopathy Study (ETDRS) chart at 4m and checking ocular health, a macular OCT test using the Spectralis SD-OCT (Heidelberg Engineering, Inc., Heidelberg, Germany) was performed to assess macular thickness and ganglion cell thickness. Then, a hearing assessment was performed to confirm the inclusion criteria of subjects. Participants were seated at a fixed distance of 1 m from the stimulus monitor under light-adapted conditions. All recordings were conducted monocular with BCVA to ensure optimal visual performance. Scalp electrodes were positioned according to the international 10-10 system. The active electrode was placed on the occipital scalp (Oz), the reference electrode at the mid-frontal position (Fz) and the ground electrode at the forehead (Cz). The impedance of passive skin electrodes measured between 10 and 100 Hz should normally be 5 kΩ or less to ensure high signal quality and reduce electrical noise.
The contrast ratio of the black and white checkerboard reversal pattern VEP stimulus was 1:1500 (100%), and the luminance of the stimulus monitor at 100cd/ m² in accordance with the International Society for Clinical Electrophysiology of Vision (ISCEV) standard.[4] For each eye, two consecutive recordings were obtained using two stimulation check sizes (1° and 0.25° visual angle): Pattern-reversal checkerboard stimulation with a check size of 16x16 minutes of arc, and Continuous acquisition for approximately 15 minutes, incorporating real-time artifact rejection and signal averaging to enhance waveform stability.
Each auditory condition required approximately 20 minutes and 5 minutes break, resulting in a total experimental duration of about 75 minutes per participant. This protocol was repeated under three auditory conditions delivered via calibrated speakers at a moderate sound intensity of 65 dB SPL and volume level.19 The test was conducted under three conditions: baseline (silence), then Quran recitation and classical music randomly. The primary outcomes included P100 latency (ms) and P100 amplitude (µV) recorded for both stimulation check sizes (1° and 0.25°) and averaged per condition and eye.[13]
Data were analyzed using the Statistical Package for the Social Sciences (SPSS) version 22. Descriptive statistics were used to summarize demographic and clinical characteristics of the participants and were presented as mean ± standard deviation (SD) for continuous variables and frequencies with percentages for categorical variables. The normality of data distribution was assessed using the Shapiro–Wilk test. Since the VEP data were not normally distributed, non-parametric statistical methods were applied. The Friedman test was used to compare VEP. amplitude and latency across the three auditory conditions (silence, Quran recitation, and music) Bonferroni-corrected post-hoc pairwise comparisons were subsequently performed to identify significant differences between auditory conditions. Comparisons between the two stimulation check sizes (1° and 0.25°) were also evaluated. The effects of different auditory conditions on VEP responses were evaluated, and comparisons were performed for both P100 amplitude and latency using 1° and 0.25° stimulation check sizes. The order of auditory conditions was randomized to minimize potential order effects during testing. A p-value of less than 0.05 was considered statistically significant, and all statistical analyses were performed using a 95% confidence interval (CI).
3. Results
A total of 30 participants (59 eyes) completed the study across three auditory conditions. One eye was excluded due to poor image and VEP outcomes. The age of participants (mean± standard deviation) was 25.02 ± 3.467 years. Table 1 shows the demographic and clinical characteristics of the study participants.
3.1. Comparison of P100 Amplitude Across Auditory Conditions
1° Stimulus vs 0.25° Stimulation Conditions: Both the 1° and 0.25° stimulation sizes demonstrated a statistically significant difference across auditory conditions (χ²(2) = 16.379, p < 0.001) and (χ²(2) = 20.068, p < 0.001), respectively (Table 2). However, at the 1° and 0.25° stimulation sizes, the latency responses remained relatively stable across silence, Quran recitation, and music exposure, with only mild variations observed between auditory conditions. At the 0.25° stimulation size, only slight variations in P100 latency responses were observed across auditory conditions. The highest latency response was recorded during Quran recitation, followed by music exposure, whereas the lowest latency value was observed during the silence condition. Overall, latency responses remained relatively stable between auditory conditions (Table 2).
Post-hoc pairwise comparisons with Bonferroni correction at 1° and 0.25° stimulation sizes. At 1°, it revealed that the silence condition produced significantly higher amplitude responses compared with both the Quran recitation and the music exposure condition. Significant differences were found between the silence condition and both the Quran recitation and music exposure conditions. No statistically significant difference was observed between the Quran recitation and music exposure conditions (Table 3). At 0.25°, it revealed that the silence condition produced significantly higher amplitude responses compared with both the Quran recitation and the music exposure condition (Table 3). No statistically significant difference was observed between the Quran recitation and music exposure conditions (p = 1.000). These findings suggest that auditory stimulation, regardless of stimulus type, was associated with reduced P100 amplitude responses compared with the silence condition (Figure 1).
3.2. Correlation Between P100 Amplitude at 1° and 0.25°Stimulations Size and the Clinical Measurements
At 1° stimulation, amplitude showed a weak but significant negative correlation with screening auditory threshold across all listening conditions, including silence (r = −0.23, p < 0.05), Quran (r = −0.24, p < 0.05), and music (r = −0.345, p < 0.01). No significant correlations were observed with age, gender, BCVA, CMT, or GCL thickness under any auditory condition. At 0.25° stimulation, gender demonstrated a moderate negative correlation with VEP amplitude in all auditory conditions, including silence (r = −0.40, p < 0.01), Quran (r = −0.43, p < 0.01), and music (r = −0.35, p < 0.01), where females were more sensitive in comparison to males. BCVA showed a weak positive correlation with amplitude during the Quran condition only (r = 0.218, p < 0.05), whereas no significant association was observed during silence or music. Age, auditory threshold, CMT, and GCL thickness were not significantly correlated with amplitude at 0.25° stimulation under any listening condition (Table 4).
4. Discussion
The study investigated the effect of three auditory conditions silence, Quran recitation and music on pattern visual evoked potential (VEP) responses among healthy adults. Overall, the findings demonstrated that VEP responses differed across auditory conditions, with the most consistent changes observed in P100 amplitude rather than latency. More pronounced auditory-related electrophysiological changes were observed at the 1° stimulation size compared with the 0.25° stimulation size, indicating that a larger size of stimulation could be sensitive for detecting visual pathway changes in normal subjects. Mild correlation was found between P100 amplitude at 0.25° stimulation size and the best corrected visual acuity (BCVA); however, no significant correlations were identified between retinal thickness and P100 amplitude responses across different auditory conditions.
Previous studies reported that background classical music did not significantly improve VEP recording quality or reduce recording variability.[13] Another study suggested that auditory stimulation and background music may influence cortical processing and attention-related neural activity.[19] In contrast, the present study demonstrated that music exposure was associated with reduced P100 amplitude responses at the 1° stimulation size. The differences between the findings may be attributed to variations in study design and outcome measures, as the previous studies mainly evaluated recording quality and cognitive processing, whereas the present study investigated the influence of auditory stimulation on visual cortical electrophysiological responses.
Previous studies have reported abnormal VEP responses in patients with abnormal conditions. For instance, in diabetic retinopathy, there was a particularly prolonged P100 latency and reduced amplitude responses, which significantly prolonged P100 latency compared with healthy controls.[18] Similarly, another study reported delayed P100 latency and amplitude in patients with diabetes without retinopathy, suggesting that neural dysfunction may occur before clinically detectable retinal changes.[17] This suggests conducting a study using the same current protocol on diabetic subjects to confirm these findings.
The stimulation check size appeared to influence the sensitivity of VEP responses in the present study. More pronounced electrophysiological changes were observed at the 1° stimulation size compared with the 0.25° stimulation size. This finding is consistent with the International Society for Clinical Electrophysiology of Vision (ISCEV) standards for clinical VEP recording, which recommend the use of both large and small check sizes during pattern-reversal stimulation.[4] Previous studies have also demonstrated that stimulation check size can significantly influence P100 latency and amplitude responses.[20] Although smaller check sizes may provide a more specific assessment of central visual function, they may therefore be more sensitive in detecting subtle central retinal dysfunction. However, the stronger electrophysiological changes observed at the 1° stimulation size in the present study may reflect a wider area of retinal changes in normal adults.
The correlation analysis in the present study demonstrated a slightly significant association between BCVA and P100 amplitude at 0.25° during the Quran auditory condition. Previous studies suggested that greater ganglion cell layer thickness was associated with stronger visual cortical amplitude responses. They have reported that retinal ganglion cell structure and visual pathway function can be affected before advanced retinal changes become clinically evident.[17] In addition, studies investigating the relationship between OCT structural measures and electrophysiological responses have shown that reduced ganglion cell or inner retinal thickness is associated with abnormal VEP responses, including reduced amplitude and delayed latency.[21] Therefore, the positive correlation observed in the present study supports the relationship between stimulus size and functional visual pathway responses in some macular changes, such as in age-related macular degeneration (AMD) and diabetic retinopathy (DR). Gender correlation to P100 amplitude at 0.25° during all auditory conditions could be related to hormones and their influence on auditory sensitivity, especially in premenopausal women.[22]
Several neurophysiological mechanisms have been proposed to explain the influence of sound type on VEP parameters in normal subjects. Corticocortical and thalamocortical pathways connecting auditory and visual processing regions allow rapid bidirectional communication between sensory areas.[23] Anatomical evidence in humans and non-human primates has demonstrated projections from auditory association cortex to visual areas V1 and V2, providing a substrate for direct auditory modulation of early visual responses. In addition, the reticular activating system and thalamocortical arousal networks modulate cortical excitability globally. Engaging or emotionally salient sounds increase arousal and thereby raise the gain applied to incoming sensory input across modalities.[24] This is consistent with findings that high-arousal sounds produce larger early visual ERP components than low-arousal neutral sounds. Stochastic resonance as a mechanism requires a nonlinear neural system in which an optimal level of background noise lowers the effective threshold for signal detection or response. Neurons in the visual cortex, operating at or near threshold, may be pushed into a response range by concurrent auditory noise, producing enhanced VEP amplitudes at moderate auditory noise levels.[25] The dependence of this effect on noise intensity, and its reduction at high noise levels, is characteristic of the SR phenomenon and has been demonstrated empirically in auditory-visual paradigms. In our study, the mild correlation between screening auditory threshold and VEP responses at 1° stimulation size might emphasise the general correlation between VEP and auditory sensory regions.
The present findings may have important clinical implications for the early detection and monitoring of visual pathway dysfunction in many ocular conditions such as retinopathies, glaucoma and other retinal dystrophies in adults. Therefore, VEP testing may contribute to the early identification of visual pathway dysfunction and aid in monitoring disease progression before severe visual impairment develops. The test could be applied as an objective tool that does not rely on subjective reporting, with potential applications in populations with limited communication, such as children, individuals with autism spectrum disorder and patients with Down syndrome. The findings of this study also highlighted the importance of standardization in clinical VEP practice and open new possibilities for multisensory approaches to visual rehabilitation.
Several limitations should be considered in the present study. Individual attentional and emotional responses to auditory stimulation could not be controlled during VEP recording. Despite these limitations, the study provides valuable insights into the effects of auditory stimulation on visual cortical responses in normal subjects. Future studies may explore the potential application of auditory-modulated VEP assessment in special populations, such as patients with autism spectrum disorder or non-verbal individuals, where objective electrophysiological evaluation may provide valuable clinical information.
5. Conclusions
Auditory conditions influence VEP responses. In comparison to silence which generally produces the highest amplitudes, music exposure showed the greatest reduction. Quran recitation appeared less disruptive than music in several comparisons, although it did not consistently exceed the silence condition. The stimulus size can be sensitive in revealing auditory-related changes at different retinal areas of functional visual pathway alterations in some systemic or ocular conditions such as Autism or diabetes, which reveals cross-modal interactions between auditory stimulation and visual cortical processing.
Author Contributions
All authors contributed to the study conception, design, material preparation and data collection. Data analysis was performed by KB, HJ and HM. Ocular heath test conducted by AA. VEP test performed by WA, FA, Ma.A, Auditory test performed by Mu.A. The first draft of the manuscript was written by KB. All authors have critically reviewed and approved the final draft.
Funding
The Ongoing Research Funding program (ORF-2026-2060) at King Saud University, Riyadh, Saudi Arabia.
Institutional Review Board Statement
Ethics approval was obtained from the institutional review board (IRB) and the ethics scientific research committee at King Saud University. The study was conducted in accordance with the Declaration of Helsinki, and approved by the Institutional Review Board and the ethics scientific research committee at King Saud University (Approval No. E-25-10435; approval date: 1 June 2026).
Informed Consent Statement
Informed consent was obtained from all subjects involved in the study. Written informed consent has been obtained from the patient(s) to publish this paper.
Data Availability Statement
The datasets generated during and/or analyzed during the current study are available from the corresponding author on reasonable request.
Acknowledgments
The author extends her appreciation to the Ongoing Research Funding program (ORF-2026-2060) at King Saud University, Riyadh, Saudi Arabia, for funding of this research. The funders had no role in study design, data collection and analysis, decision to publish, or preparation of the manuscript.
Conflicts of Interest
Authors declare no competing financial interests in relation to the work described.
Abbreviations
The following abbreviations are used in this manuscript:
| VEP | Visual Evoked Potentials |
| BCVA | Best-corrected visual acuity |
| OCT | Optical coherence tomography |
| V1 | Primary visual cortex |
References
- Baiano, C., & Zeppieri, M. Visual Evoked Potential. 2023, StatPearls Publishing. https://www.ncbi.nlm.nih.gov/books/NBK582128/.
- Creel DJ. Visually evoked potentials. Handb Clin Neurol. 2019;160:501-522. [CrossRef]
- Mahroo OA. Visual electrophysiology and “the potential of the potentials”. Eye. 2023;37(12):2399-408. [CrossRef]
- Šuštar Habjan, M., Bach, M., van Genderen, M.M. et al. ISCEV standard for clinical visual evoked potentials (2025 update). Doc Ophthalmol 151, 2025; 97–112. [CrossRef]
- Ekayanti MS, Mahama CN, Ngantung DJ. Normative values of visual evoked potential in adults. Indian J Ophthalmol 2021;1;69:2328-32. [CrossRef]
- Gupta A, Wakode S, Thakare A, Alvi A, Arya V, Wakode N. Effect of Music Tempo on Pattern Reversal Visual Evoked Potential in Young Adults-Multisensory Stochastic Resonance: A Pilot Study. Mymensingh Med J. 2023; 1;1:221-7.
- Che Wan Mohd Rozali, W. N. A., Ishak, I., Mat Ludin, A. F., Ibrahim, F. W., Abd Warif, N. M., & Che Roos, N. A. The Impact of Listening to, Reciting, or Memorizing the Quran on Physical and Mental Health of Muslims: Evidence From Systematic Review. Int J public health, 2022;67, 1604998. [CrossRef]
- Molholm, S., Ritter, W., Murray, M. M., Javitt, D. C., Schroeder, C. E., & Foxe, J. J. Multisensory auditory–visual interactions during early sensory processing: A high-density electrical mapping study. Cogn Brain Res, 2002; 14, 115–128. [CrossRef]
- Pennartz, C.M., Oude Lohuis, M.N. and Olcese, U. How ‘visual’is the visual cortex? The interactions between the visual cortex and other sensory, motivational and motor systems as enabling factors for visual perception. Philos. Trans. R. Soc. Lond. B Biol. Sci, 378(1886), 2023; p.20220336. [CrossRef]
- Gerdes AB, Wieser MJ, Bublatzky F, Kusay A, Plichta MM, Alpers GW. Emotional sounds modulate early neural processing of emotional pictures. Front Psychol. 2013; 18;4:741. [CrossRef]
- Mégevand P, Mercier MR, Groppe DM, Zion Golumbic E, Mesgarani N, Beauchamp MS, et al. Crossmodal phase reset and evoked responses provide complementary mechanisms for the influence of visual speech in auditory cortex. J Neurosci. 2020,;40:8530-42. [CrossRef]
- Manjarrez E, Mendez I, Martinez L, Flores A, Mirasso CR. Effects of auditory noise on the psychophysical detection of visual signals: cross-modal stochastic resonance. Neurosci lett. 2007;415:231-6. [CrossRef]
- Karanjia R, Brunet DG, ten Hove MW. Optimization of visual evoked potential (VEP) recording systems. Can J Neurol sci. 2009;1:89-92. https://pubmed.ncbi.nlm.nih.gov/19294895/.
- Giard, M. H., & Peronnet, F. Auditory–visual integration during multimodal object recognition in humans: A behavioral and electrophysiological study. J Cogn Neurosci,1999;11, 473–490. [CrossRef]
- Knowland VC, Mercure E, Karmiloff-Smith A, Dick F, Thomas MS. Audio-visual speech perception: A developmental ERP investigation. Dev Sci. 2014;17:110-24. [CrossRef]
- Besle J, Fort A, Delpuech C, Giard MH. Bimodal speech: early suppressive visual effects in human auditory cortex. Eur J Neurosci. 2004;20:2225-34. [CrossRef]
- Ashok, K., Ankit, P., Nitin, P. K., & Sanjeev, K. Utility of Visual Evoked Potentials (VEPs) study in the evaluation of visual pathway dysfunction in diabetics without retinopathy: correlations with diabetic peripheral neuropathy and other clinical findings. Rom J Ophthalmol, 2024; 68, 114–121. [CrossRef]
- Daniel, R., Ayyavoo, S., & Dass, B. Study of visual evoked potentials in patients with type 2 diabetes mellitus and diabetic retinopathy. Natl J Physiol Pharm Pharmacol, 2017;7, 159–164. [CrossRef]
- Gao, S., Zhou, K., Zhang, J., Cheng, Y., & Mao, S. Effects of Background Music on Mental Fatigue in Steady-State Visually Evoked Potential-Based BCIs. Healthcare,2023; 11, 1014. [CrossRef]
- Nakamura M, Kakigi R, Okusa T, Hoshiyama M, Watanabe K. Effects of check size on pattern reversal visual evoked magnetic field and potential. Brain Res. 2000;872:77-86.
- Sriram, P., Wang, C., Yiannikas, C., Garrick, R., Barnett, M., Parratt, J., et al. Relationship between optical coherence tomography and electrophysiology of the visual pathway in non-optic neuritis eyes of multiple sclerosis patients. PLoS ONE,2014; 9, e102546. [CrossRef]
- Aloufi N, Heinrich A, Marshall K, Kluk K. Sex differences and the effect of female sex hormones on auditory function: a systematic review. Front Hum Neurosci. 2023;17:1077409. [CrossRef]
- Cappe, C., Rouiller, E.M., Barone, P. Cortical and thalamic pathways for multisensory and sensorimotor interplay. In: Murray, M.M., Wallace, M.T. (Eds.), The Neural Bases of Multisensory Processes, FrontNeurosci. 2012; CRC Press/ Taylor & Francis, Boca Raton (FL).
- Gerdes AB, Wieser MJ, Alpers GW. Emotional pictures and sounds: a review of multimodal interactions of emotion cues in multiple domains. Front psychol. 2014; 5:1351. [CrossRef]
- Sanders PJ, Thompson B, Corballis PM, Maslin M, Searchfield GD. A review of plasticity induced by auditory and visual tetanic stimulation in humans. Eur J Neurosci. 2018;48:2084-97. [CrossRef]
Figure 1.
Mean amplitude (µV ± 1 SD) under Silent, Quran, and Music conditions. Left panel: 1° stimulus; Right panel: 0.25° stimulus. Brackets indicate statistically significant pairwise differences (Bonferroni-corrected; *p < .05, **p < .01, ***p < .001).
Figure 1.
Mean amplitude (µV ± 1 SD) under Silent, Quran, and Music conditions. Left panel: 1° stimulus; Right panel: 0.25° stimulus. Brackets indicate statistically significant pairwise differences (Bonferroni-corrected; *p < .05, **p < .01, ***p < .001).
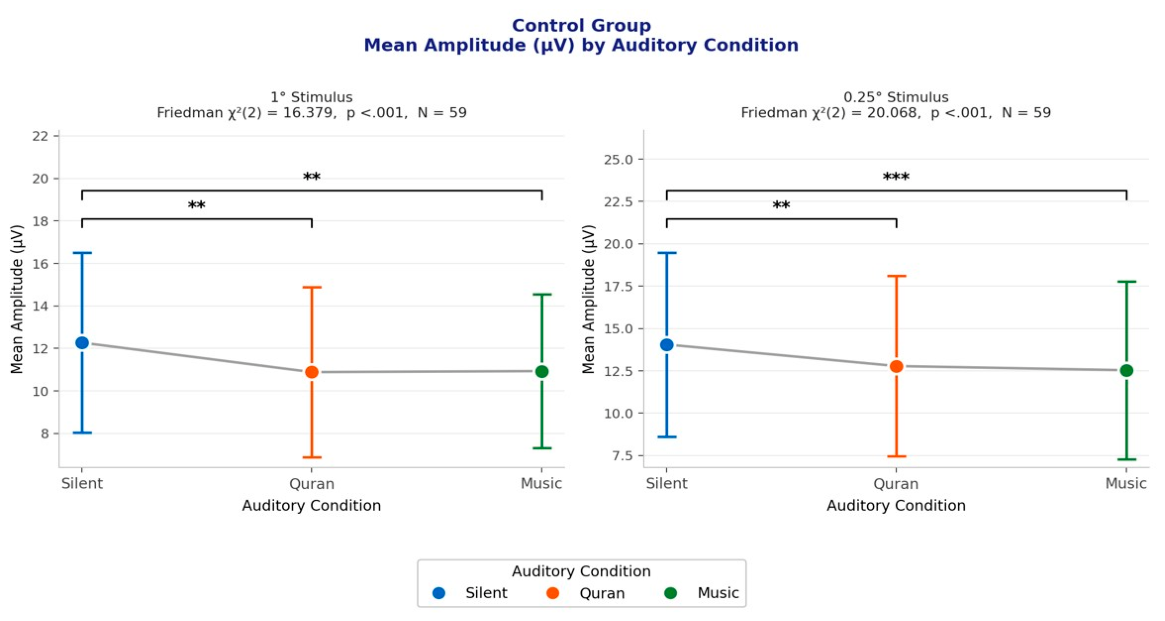

Table 1.
Summary of the demographic and clinical characteristics of the study participants.
| Mean± Std. Deviation | ||
|---|---|---|
| N | 30 Subject (59 eyes) | |
| Age | 25.02±3.4 | |
| Gender (Female %) | 34±0.4 (57.6) | |
| BCVA (LogMAR) | 0.019± 0.0 | |
| CMT (µm) | 267.39±7.5 | |
| GCL (µm) | 52.89±2.6 | |
| Pure Tone Audiometry (dB) | 4.56±2.5 | |
| P100 Amplitude (µV) | at 1° Stimulation size | at 0.25° 1° Stimulation size |
| Silence | 12.35±4.2 | 14.05±5.4 |
| Music | 10.93±3.6 | 12.53±5.2 |
| Quran | 10.93±3.9 | 12.78±5.3 |
| 100 latency (ms) | ||
| Silence | 91.85±4.8 | 91.85±4.2 |
| Music | 92.20±4.9 | 98.30±5.0 |
| Quran | 91.60±4.0 | 98.38±5.1 |
Abbreviations: BCVA: visual acuity; LogMAR: logarithm of the minimum angle of resolution; dB: decibel; CMT: central macular thickness; GCL: ganglion cell layer.
Table 2.
Analysis of P100 amplitude and latency across auditory conditions at the 1° and 0.25° stimulations size.
Table 2.
Analysis of P100 amplitude and latency across auditory conditions at the 1° and 0.25° stimulations size.
| P100 Amplitude (n=59 eyes) | ||||||||||||
|---|---|---|---|---|---|---|---|---|---|---|---|---|
| 1° stimulation size | 0.25° stimulation size | |||||||||||
| Mean | Std. D | Min | Max | Chi-Square | Sig | Mean | Std.D | Min | Max | Chi- | Sig | |
| Square | ||||||||||||
| Silent (A_S) | 12.26 | 4.23 | 3.2 | 21.6 | 16.37 | <.001 | 14.05 | 5.42 | 1.6 | 27.8 | 20.06 | <.001 |
| Quran(A_Q) | 10.88 | 3.99 | 1.7 | 18.7 | 12.78 | 5.32 | 2.6 | 24.8 | ||||
| Music (A_M) | 10.93 | 3.6 | 2.4 | 17.6 | 12.53 | 5.24 | 1.8 | 24.8 | ||||
| P100 Latency (n-59 eyes) | ||||||||||||
| 1° stimulation size | 0.25° stimulation size | |||||||||||
| Silent (L_S) | 91.85 | 4.8 | 82 | 101 | 0.442 | 0.802 | 98.15 | 4.24 | 95 | 115 | 0.542 | 0.77 |
| Quran (L_Q) | 91.6 | 4.04 | 85 | 95 | 98.38 | 5.11 | 95 | 115 | ||||
| Music (L_M) | 92.2 | 4.93 | 85 | 110 | 98.3 | 5.04 | 95 | 115 | ||||
Abbreviations: S = Silence, Q = Quran recitation, M = Music exposure, Min =minimum; Max= Maximum, Std. Dev= Standard Deviation. Values are presented as mean latency (ms). Values are presented as mean P100 amplitude (µV).
Table 3.
Bonferroni-corrected post-hoc pairwise comparisons of P100 amplitude across auditory conditions at the 1° and 0.25° stimulation sizes.
Table 3.
Bonferroni-corrected post-hoc pairwise comparisons of P100 amplitude across auditory conditions at the 1° and 0.25° stimulation sizes.
| 1° stimulation size | 0.25° stimulation size | |||||||
|---|---|---|---|---|---|---|---|---|
| Auditory Conditions Comparisons | Mean
difference |
Std. Error | Std. Test Statistic | Sig. | Mean
difference |
Std. Error | Std. Test Statistic | Sig. |
| Quran – Music | −0.086 | 0.186 | −0.464 | .642 | 0.068 | 0.184 | 0.368 | .713 |
| Quran – Silent | 0.690 | 0.186 | 3.714 | <.001 | 0.746 | 0.184 | 4.051 | <.001 |
| Music – Silent | 0.603 | 0.186 | 3.250 | 0.001 | 0.678 | 0.184 | 3.682 | <.001 |
Table 4.
Correlations between different stimulus sizes of VEP amplitude and participant characteristics under three auditory conditions.
Table 4.
Correlations between different stimulus sizes of VEP amplitude and participant characteristics under three auditory conditions.
| Amplitude at 1° stimulation Correlation coefficient (r) |
Amplitude at 0.25° stimulation Correlation coefficient (r) |
|||||
|---|---|---|---|---|---|---|
| Auditory conditions | Silence | Quran | Music | Silence | Quran | Music |
| Age | 0.069 | -0.11 | -0.04 | 0.05 | -0.04 | 0.075 |
| Gender | 0.02 | -0.05 | 0.11 | -0.40** | -0.43** | -0.35** |
| BCVA (LogMar) | 0.021 | -0.027 | 0.042 | 0.121 | 0.218* | 0.141 |
| Auditory (dB) | -0.23* | -0.24* | -0.345** | -0.08 | -0.05 | -0.11 |
| CMT (µm) | 0.072 | 0.048 | 0.029 | 0.00 | 0.00 | -0.03 |
| GCL (µm) | 0.14 | 0.14 | 0.19 | 0.00 | -0.07 | 0.03 |
(r): Pearson's correlation coefficient; BCVA: visual acuity; LogMAR: logarithm of the minimum angle of resolution; dB: decibel; CMT: central macular thickness; GCL: ganglion cell layer. P < 0.05 (*), P < 0.01 (**).
Disclaimer/Publisher’s Note: The statements, opinions and data contained in all publications are solely those of the individual author(s) and contributor(s) and not of MDPI and/or the editor(s). MDPI and/or the editor(s) disclaim responsibility for any injury to people or property resulting from any ideas, methods, instructions or products referred to in the content. |
© 2026 by the authors. Licensee MDPI, Basel, Switzerland. This article is an open access article distributed under the terms and conditions of the Creative Commons Attribution (CC BY) license (http://creativecommons.org/licenses/by/4.0/).
Copyright: This open access article is published under a Creative Commons CC BY 4.0 license, which permit the free download, distribution, and reuse, provided that the author and preprint are cited in any reuse.